Environmental Taxes and Corporate Green Transition: Evidence from Chinese Manufacturing Firms


Abstract
1. Introduction
2. Institutional Background, Theoretical Analysis, and Research Hypotheses
2.1. Institutional Background
- The first phase (1979–2002) featured the pollution-discharge fee system, which was initially proposed in 1979 and formally piloted in 1982. During this stage, fees were levied mainly on industrial pollution sources.
- During the second phase (2003–2017), the Regulations on the Collection and Use of Pollution Discharge Fees further refined the scope and standards of levy, establishing pollution discharge fees as a substantial revenue stream for local governments.
- Since 2018, the environmental protection tax has been implemented following the enactment of the Environmental Protection Tax Law on 1 January 2018, which replaced the prior fee system. The detailed policy development process is presented in Table 1.
2.2. Theoretical Analysis and Research Hypotheses
2.2.1. Theoretical Elaboration and Hypotheses
2.2.2. Mechanisms Driving Green Transformation and Hypotheses
3. Materials and Methods
3.1. Model Specifications and Variable Declaration
3.2. Data Sources and Processing
4. Empirical Findings and Analysis
4.1. Benchmark Result Analysis
4.2. Robustness Test
4.2.1. Parallel Trend Test
4.2.2. Placebo Test
- (1)
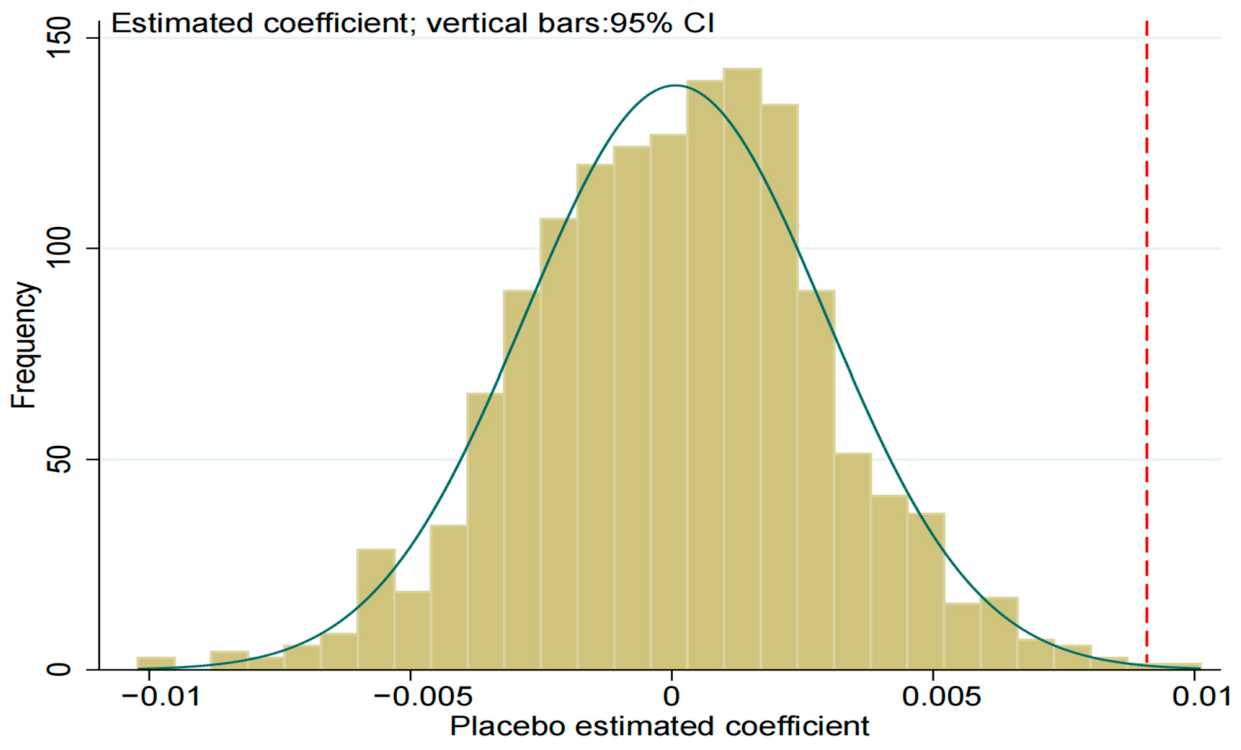
- Random assignment test. This test randomly assigns a treatment status to the tax policy. The Treat variable was randomly allocated, and the model was re-estimated for 1000 simulations. Figure 2 shows the distribution of the estimated coefficients, with the dashed red line representing the baseline regression coefficient for the actual policy effect. After 1000 iterations, the placebo coefficients were concentrated around zero and approximately followed a normal distribution. By contrast, the true policy coefficient lay in the extreme tail of the placebo distribution, outside the 95% confidence interval. This indicates that the effect under random assignment differed significantly from the baseline result, thereby passing the placebo test. Additionally, the p-value of the true policy coefficient within the placebo distribution was reported. With a p-value of 0.001, merely 0.1% of permuted coefficients exceed the baseline policy effect in absolute value, much lower than the 0.05 significance level. This further confirms that the policy effect identified by the baseline regression was not due to chance and that the core conclusion is relatively robust.
- (2)
- Changing the reform’s implementation time. The 2018 policy year was artificially advanced to 2016. Specifically, the Post dummy was set to 0 for years before 2016 and 1 for 2016 and subsequent years. A new DID interaction term was then constructed and re-estimated (Column (1) of Table 4). The DID term’s coefficient was positive but statistically insignificant within the confidence interval. This indicates that, in the absence of the reform, China’s manufacturing industry’s green development would not have improved significantly, thereby supporting the baseline regression findings.
4.2.3. Additional Robustness Checks
- (1)
- To validate our core findings, we conducted a series of complementary robustness checks. First, we excluded competing hypotheses. Environmental inspections were implemented in batches across China’s regions in accordance with the Environmental Protection Inspection Plan (Trial) adopted at the 14th meeting of the Central Leading Group for Deepening Overall Reform in 2015. The interaction term between the environmental inspection dummy and firm fixed effects was added to the regression model to control for the impact of environmental inspections on manufacturing enterprises’ green development. The dummy variable was assigned a value of 1 for regions where environmental inspections were implemented in period t and 0 otherwise (The central environmental protection inspection pilot was launched in Hebei in 2015. The regions inspected in 2016 included the Inner Mongolia Autonomous Region, Heilongjiang Province, Jiangsu Province, Jiangxi Province, Henan Province, Guangxi Zhuang Autonomous Region, Yunnan Province, Ningxia Hui Autonomous Region, Beijing, Shanghai, Hubei Province, Guangdong Province, Chongqing, Shaanxi Province, and Gansu Province. The remaining regions were examined in 2017). The corresponding results are reported in Column (2) of Table 4.
- (2)
- To mitigate the potential interference of other concurrent policies on the green development of the manufacturing sector, the regression was re-estimated after excluding pilot regions of the carbon emissions trading market (The first batch of carbon emission trading pilots in 2011 included Beijing, Tianjin, Shanghai, Chongqing, Guangdong Province, Hubei Province, and Shenzhen. The second batch in 2016 included Sichuan and Fujian provinces. The national carbon emissions trading market was established in 2021), thereby reducing potential biases in the baseline results. The results (Column (3) of Table 4) showed that the coefficient of the core policy variable remained significantly positive. These findings indicate that neither the environmental inspection policy nor the carbon emissions trading policy had a material effect on the baseline results, thereby further supporting the robustness of the baseline model.
- (3)
- To rule out the interference of the COVID-19 pandemic shock on corporate green transformation, this paper further conducts two robustness tests. On the one hand, a pandemic dummy variable is introduced into the baseline model, taking the value 1 for 2020 and thereafter, and 0 otherwise. The pandemic dummy variable and its interaction term with the DID estimator are incorporated into the model. The regression results are shown in Column (4) of Table 4. The core policy coefficient remains significantly positive, showing that the overall positive policy effect remains robust after accounting for pandemic-wide macro shocks. On the other hand, we exclude observations from the pandemic period 2020 to 2022 and re-run the regression, reporting the results in Column (5) of Table 4. The core coefficient remains significantly positive in this subsample, and the model’s statistical power improves accordingly. The results indicate that the coefficient remains significant in the full-sample model with the pandemic dummy variable (Column 4), providing robustness to the policy effect after directly controlling for COVID-19 shocks.
- (4)
- We replaced the dependent variable and re-estimated the regression model. On the one hand, green total factor productivity was calculated using the non-radial, slack-based Malmquist-Leuenberger index. The input factors primarily included the number of employees, net fixed assets, and industrial electricity consumption in the city where each enterprise was located. Desirable output was measured by corporate operating revenue, whereas undesirable outputs were measured by the proportion of corporate employees and by emissions of industrial wastewater, waste gas, and smoke dust. The regression results presented in Column (6) of Table 4 indicate that the environmental tax policy continued to significantly positively affect the green development of manufacturing enterprises, regardless of whether control variables were included, thereby supporting the baseline regression findings. In addition, we extend the sample period of this alternative dependent variable to 2024 for the robustness test. The extended panel spans a substantial number of years, both before and after the 2018 policy shock, eliminating potential perfect collinearity with the DID interaction term. The regression results are consistent with those of the baseline regression, indicating that our core conclusions are not sensitive to adjustments in the sample period. On the other hand, we adopt the equal-weighted variable derived from sensitivity analysis as the dependent variable for robustness testing, and the corresponding results are presented in Column (8) in Table 4. That the core explanatory variable retains a significantly positive coefficient of similar magnitude to that in the baseline model further demonstrates the robustness of the empirical conclusions to alternative indicator-weighting structures.
- (5)
- To control for dynamic changes in industry structure and to mitigate estimation biases arising from manufacturing industry restructuring and industry policy changes during the sample period, this paper further adopts industry-year interactive fixed effects. The regression results are shown in Column (9) of Table 4. The core coefficient remains significantly positive, reinforcing the reliability of the empirical results. Controlling for industry-year fixed effects eliminates interference from structural shifts in industry and periodic sector policies, thereby strengthening the causal link between tax reform and green transformation.
4.3. Pathways to Green Transformation
4.3.1. Cost Internalization
4.3.2. Investment Structure Adjustment
4.3.3. Strategic Cognitive Upgrading
4.4. Heterogeneity Analysis
4.4.1. Firm Heterogeneity
- (1)
- Corporate Profitability. All sample observations were grouped by firms’ operating profit margins to examine the heterogeneous effects of corporate profitability. Specifically, firms with operating profit margins above the industry-year mean were classified as high-profitability firms, whereas those below the mean were classified as low-profitability firms. Separate regressions were conducted for each group to estimate the impact of the environmental protection tax reform on green development in the manufacturing sector. The results show that, after the environmental fee-to-tax reform, low-profitability firms in regions with higher tax burdens achieved better green development performance. For these firms, higher environmental tax costs directly erode profit margins. Under substantial survival pressure, such enterprises face stronger incentives to curb pollution and reduce costs by pursuing green transformation.
- (2)
- Corporate Ownership. For the regression analysis, all sample firms were categorized as state-owned or non-state-owned based on corporate property rights. Columns (3) and (4) of Table 6 present these results. The comparison of policy-effect coefficients reveals that the reform exerted a stronger effect on the green transformation of non-state-owned enterprises. Whereas state-owned enterprises enjoy flexible enforcement discretion and implicit policy support, non-state-owned enterprises operate under stricter budget constraints, rendering them more responsive to environmental regulation.
- (3)
- Green Patent Applications. To account for potential heterogeneity in the policy’s effects on manufacturing firms with varying levels of technological innovation during the green transformation, the full sample was divided into patent and non-patent groups based on whether each firm filed green patent applications in a given year, and separate regressions were estimated for each group. A comparison of the coefficients in Columns (5) and (6) of Table 6 shows that the policy effect variable was positively associated with both groups. This indicates that the environmental protection tax policy promoted green development in the manufacturing sector, with the effect especially pronounced among non-patent firms in regions with higher tax burdens. Unable to rely on innovation-related preferential policies to offset tax pressure due to the absence of green patents, these firms are more dependent on basic green renovations to manage rising environmental costs.
4.4.2. Industry Heterogeneity
- (1)
- Industry Competition. The Herfindahl–Hirschman Index was employed to classify manufacturing industries into high- and low-competition groups. Industries with an index value exceeding the industry-year average were categorized as the low-competition group, whereas those with values below the average were classified as the high-competition group. A higher index value indicated lower industry competition and greater potential for tax burden shifting. The heterogeneity results are presented in Columns (1) and (2) of Table 7. The low-competition group contained relatively few firms; meanwhile, local governments may provide fiscal support or exercise flexible tax enforcement to ensure the stable operation of these firms. Additionally, firms in less-competitive industries can more easily shift the tax burden to consumers, thereby making their profit margins less sensitive to tax pressure and enabling more effective in-house green transformation.
- (2)
- Factor Intensity. Manufacturing industries were categorized into labor-, capital-, and technology-intensive sectors to examine the impact of environmental tax policies on green development. Columns (3)–(5) of Table 7 reveal that the reform’s positive effect on green development was most pronounced in labor-intensive industries, moderately so in capital-intensive industries, and least evident in technology-intensive industries. Labor-intensive industries encounter relatively low technical barriers to green retrofitting. By optimizing production processes and raw material inputs, these industries can achieve rapid reductions in emissions; consequently, the policy’s effect is more evident in the short run.
4.5. Multi-Dimensional Effects of Green Transformation
4.5.1. Long-Term Dynamic Effects
4.5.2. Industry Pollution Attributes
4.5.3. Economic Consequence Tests
5. Discussion
5.1. Main Findings and Underlying Causes
5.2. Critical Comparison with International Research
6. Conclusions and Limitations
6.1. Practical Contributions
6.1.1. Optimize the Environmental Tax Framework
6.1.2. Refine Differentiated Tax Relief Mechanisms
6.1.3. Heterogeneous Regulatory Policies
6.2. Limitations and Future Research
6.2.1. Extrapolation Limitations of Research Results
6.2.2. Future Research
Author Contributions
Funding
Institutional Review Board Statement
Data Availability Statement
Acknowledgments
Conflicts of Interest
Abbreviations
| Abbreviations | Full name |
| DID | Difference-in-Differences |
| R&D | research and development |
| CSMAR | China Stock Market & Accounting Research |
| CI | Confidence Interval |
| DDD | Triple Differences |
| TFP | Total Factor Productivity |
| OP | Olley-Pakes |
| LP | Levinsohn-Petrin |
| SBM | Slacks-Based Measure |
| ML | Malmquist-Leuenberger |
| ROE | Return on Net Assets |
| ESG | Environmental, Social, and Governance |
| CEO | Chief Executive Officer |
| Lev | Asset-Liability Ratio |
| ST | Special Treatment |
Appendix A. Mathematical Model: Formal Derivation Under the Baseline Effect
Appendix B. Differentiated Environmental Tax Burden Rules and Regional Sample Classification

| Group | Type | Region | Tax Burden Standard | |
|---|---|---|---|---|
| Pollution Equivalent of Air Pollutants (Yuan) | Pollution Equivalent of Water Pollutants (Yuan) | |||
| Control Group | Tax Burden Neutrality (Type 1) | Hubei | SO2 and NOx at 2.4 yuan; other air pollutants at 1.2 yuan | COD, ammonia nitrogen, total phosphorus, and five heavy metals at 2.8 yuan; other water pollutants at 1.4 yuan |
| Zhejiang | Four heavy metal pollutants at 1.8 yuan, other pollutants at 1.2 yuan | Five heavy metal pollutants at 1.8 yuan, other pollutants at 1.4 yuan | ||
| Fujian | 1.2 yuan | five heavy metals, COD, and ammonia nitrogen at 1.5 yuan, and other pollutants at 1.4 yuan | ||
| Jilin, Anhui, Jiangxi, Shaanxi, Gansu, Xinjiang, Xizang, Ningxia, Qinghai, Inner Mongolia, Heilongjiang | 1.2 yuan | 1.4 yuan | ||
| Tax Burden Neutrality (Type 2) | Yunnan | 1.2 yuan in 2018; 2.8 yuan from 2019 onwards | 1.4 yuan in 2018; 3.5 yuan from 2019 onwards | |
| Liaoning | SO2 and NOx at 2.4 yuan; other air pollutants at 1.2 yuan | COD and ammonia nitrogen at 2.8 yuan; other water pollutants at 1.4 yuan | ||
| Tax Burden Neutrality (Type 3) | Tianjin | NOx at 8 yuan; SO2, smoke dust and general dust at 6 yuan; other air pollutants at 1.2 yuan | COD and ammonia nitrogen at 7.5 yuan; other water pollutants at 1.4 yuan | |
| Shanghai | In 2018: SO2 at 6.65 yuan, NOx at 7.6 yuan, other air pollutants at 1.2 yuan; In 2019: SO2 at 7.6 yuan, NOx at 8.55 yuan, other air pollutants at 1.2 yuan | COD at 5 yuan, ammonia nitrogen at 4.8 yuan, and other water pollutants at 1.4 yuan | ||
| Guangdong | 1.8 yuan | 2.8 yuan | ||
| Treatment Group | Increased Tax Burden (Type 1) | Hebei | Graded by region: Tier 1: Key pollutants at 9.6 yuan, other pollutants at 4.8 yuan; Tier 2: Key pollutants at 6 yuan, other pollutants at 4.8 yuan; Tier 3: 4.8 yuan | Graded by region: Tier 1: Key pollutants at 11.2 yuan, other pollutants at 5.6 yuan; Tier 2: Key pollutants at 7 yuan, other pollutants at 5.6 yuan; Tier 3: 5.6 yuan |
| Jiangsu | Nanjing: 8.4 yuan; Wuxi, Changzhou, Suzhou, Zhenjiang: 6 yuan; other cities: 4.8 yuan | Nanjing: 8.4 yuan; Wuxi, Changzhou, Suzhou, Zhenjiang: 7 yuan; other cities: 5.6 yuan | ||
| Shandong | SO2 and NOx at 6 yuan, other air pollutants at 1.2 yuan | COD, ammonia nitrogen, and five heavy metals at 3 yuan, other water pollutants at 1.4 yuan | ||
| Increased Tax Burden (Type 2) | Henan, Hunan | 4.8 yuan | 5.6 yuan | |
| Sichuan | 3.9 yuan | 2.8 yuan | ||
| Chongqing | 3.5 yuan | 3 yuan | ||
| Guizhou, Hainan | 2.4 yuan | 2.8 yuan | ||
| Guangxi | 1.8 yuan | 2.8 yuan | ||
| Shanxi | 1.8 yuan | 2.1 yuan | ||
| Increased Tax Burden (Type 3) | Beijing | 12 yuan | 12 yuan | |
Appendix C. Variable Definitions and Variable Calculation
Appendix C.1. Variable Definitions
| Variable Name | Symbol | Definition | |
|---|---|---|---|
| Green Transformation | M_green | Economic Performance | Return on Net Assets (ROE) of the Firm |
| Social Performance | Mean ESG Score of the Firm | ||
| Green Production | Implementation of Cleaner Production by the Firm | ||
| Green Emission | Disclosure of Wastewater, Waste Gas, and Solid Waste | ||
| Green Governance | Treatment of Wastewater, Waste Gas, and Solid Waste | ||
| Green Management | Environmental Information, Environmental Management System, Environmental Emergency Mechanism, “Three Simultaneities” System, etc., are disclosed in the annual reports of listed firms | ||
| Green Culture | Corporate Environmental Philosophy, Environmental Guidelines, and Green Development Orientation | ||
| Policy Dummy Variable | Post | Taking 2018 as the cutoff year: 0 for years before 2018, 1 for 2018 and thereafter | |
| Firm Dummy Variable | Treat | Treated group with increased tax burden = 1; control group with unchanged tax burden = 0 | |
| Firm Size | Size | Natural logarithm of total assets | |
| Firm Age | Age | Natural logarithm of (statistical year minus firm establishment year plus 1) | |
| Financial Leverage | Lev | Asset-liability ratio | |
| CEO Duality | Dual | Dummy variable: 1 if the chairman and CEO are the same person, 0 otherwise | |
| Ownership Type | Central | Dummy variable: 1 for state-owned enterprises, 0 otherwise | |
Appendix C.2. Detailed Calculation of the Green Transformation Composite Index
- Normalize the data to eliminate dimensional effects
- 2.
- Stepwise Entropy Weight Calculation
- (1)
- Calculate the proportion of each standardized indicator
- (2)
- Compute information entropy for indicator j
- (3)
- Calculate the differentiation coefficient
- (4)
- Derive the normalized weight for each sub-indicator
- (5)
- Final composite index synthesis
| Variable | Definition | Indicator Attribute | |||
|---|---|---|---|---|---|
| Economic Performance | Return on Net Assets (ROE) of the Firm | Positive | 0.9744136 | 0.0255864 | 0.0507116 |
| Social Performance | Mean ESG Score of the Firm | Positive | 0.9906396 | 0.0093604 | 0.0185522 |
| Green Production | Implementation of Cleaner Production by the Firm | Positive | 0.8497077 | 0.1502923 | 0.2978757 |
| Green Emission | Disclosure of Wastewater, Waste Gas, and Solid Waste | Negative | 0.9184679 | 0.0815321 | 0.1615947 |
| Green Governance | Treatment of Wastewater, Waste Gas, and Solid Waste | Positive | 0.9300403 | 0.0699597 | 0.1386584 |
| Green Management | Environmental Information, Environmental Management System, Environmental Emergency Mechanism, “Three Simultaneities” System, etc., are disclosed in the annual reports of listed firms | Positive | 0.9260854 | 0.0739146 | 0.1464971 |
| Green Culture | Corporate Environmental Philosophy, Environmental Guidelines, and Green Development Orientation | Positive | 0.9060985 | 0.0939015 | 0.1861104 |
Appendix C.3. Sensitivity Test with Equal-Weight Scheme
| Index | M_Green | M_GreenEqual |
|---|---|---|
| M_green | 1.0000 | - |
| M_greenequal | 0.9556 | 1.0000 |
| Note: N = 19,686 | ||
Appendix D. Measurement of Executive Green Cognition
Appendix D.1. Text Source and Screening Criteria
- Exclude ST, *ST, delisted, and operationally abnormal enterprises.
- Remove annual reports that have incomplete, garbled, or blank MD&A content.
- Only retain full official Chinese annual reports disclosed by stock exchanges.
Appendix D.2. Three-Dimensional Keyword Dictionary
- Green competitive advantage cognition
- 2.
- Corporate social responsibility cognition
- 3.
- External environmental pressure perception
Appendix D.3. Index Calculation Steps
- Use the Python Jieba tool (version 0.42.1) to perform word segmentation and stop-word filtering on MD&A texts.
- Sum the occurrence frequency of all keywords across three dimensions for each firm-year.
- Take the natural logarithm of total word frequency to obtain the final green cognition proxy and eliminate heteroscedasticity.
Appendix D.4. Representativeness & Reliability Verification
| Variable | Environmental Investment |
|---|---|
| Did (Dummy: 0/1) | −0.0006 *** (0.0002) |
| Xit (controls, metrics in Table 2) | Yes |
| Fixed effects | Yes |
| N_obs | 18,580 |
| R2 | 0.0130 |
| _cons | −0.0098 (0.0085) |
References
- Nielsen, H.Ø.; Konrad, M.T.H.; Pedersen, A.B.; Gyldenkærne, S. Ex-post evaluation of the Danish pesticide tax: A novel and effective tax design. Land Use Policy 2023, 126, 106549. [Google Scholar] [CrossRef]
- Runst, P.; Höhle, D. The German eco tax and its impact on CO2 emissions. Energy Policy 2022, 160, 112655. [Google Scholar] [CrossRef]
- Halkos, G.E.; Papageorgiou, G.J. Pollution, environmental taxes and public debt: A game theory setup. Econ. Anal. Policy 2018, 58, 111–120. [Google Scholar] [CrossRef]
- Ekins, P.; Pollitt, H.; Barton, J.; Blobel, D. The implications for households of environmental tax reform (ETR) in Europe. Ecol. Econ. 2011, 70, 2472–2485. [Google Scholar] [CrossRef]
- Sharif, A.; Kartal, M.T.; Bekun, F.V.; Pata, U.K.; Foon, C.L.; Depren, S.K. Role of green technology, environmental taxes, and green energy towards sustainable environment: Insights from sovereign Nordic countries by CS-ARDL approach. Gondwana Res. 2023, 117, 194–206. [Google Scholar] [CrossRef]
- Ekins, P.; Pollitt, H.; Summerton, P.; Chewpreecha, U. Increasing carbon and material productivity through environmental tax reform. Energy Policy 2012, 42, 365–376. [Google Scholar] [CrossRef]
- Gramkow, C.; Anger-Kraavi, A. Could fiscal policies induce green innovation in developing countries? The case of Brazilian manufacturing sectors. Clim. Policy 2018, 18, 246–257. [Google Scholar] [CrossRef]
- Tolstov, D.; Bilan, T. Determination of the Optimal “Green” Tariff Rate for Removing Solar Power Plants from the Balancing Group of “Guaranteed Buyer” State Enterprise. Syst. Res. Energy 2024, 4, 143–155. [Google Scholar] [CrossRef]
- Maistrenko, N. Taking Into Account Environmental Constraints on Emissions in Economic Models Long-Term Forecasting of Energy Consumption (Review of Publications). Syst. Res. Energy 2023, 3, 85–94. [Google Scholar] [CrossRef]
- Liu, G.; Yang, Z.; Zhang, F.; Zhang, N. Environmental tax reform and environmental investment: A quasi-natural experiment based on China’s Environmental Protection Tax Law. Energy Econ. 2022, 109, 106000. [Google Scholar] [CrossRef]
- Wang, L.; Ma, P.; Song, Y.; Zhang, M. How does environmental tax affect enterprises’ total factor productivity? Evidence from the reform of environmental fee-to-tax in China. J. Clean. Prod. 2023, 413, 137441. [Google Scholar] [CrossRef]
- He, X.; Jing, Q.; Chen, H. The impact of environmental tax laws on heavy-polluting enterprise ESG performance: A stakeholder behavior perspective. J. Environ. Manag. 2023, 344, 118578. [Google Scholar] [CrossRef] [PubMed]
- Xie, Y.; Sun, H.; Wu, J.; Li, L.; Zhang, Y. China’s environmental fee-to-tax policy and green innovation in advanced manufacturing: Evidence from a quasi-natural experiment. J. Environ. Manag. 2025, 390, 126320. [Google Scholar] [CrossRef] [PubMed]
- Niu, F.; Luo, Z.; Mu, Y. How do enterprises deal with environmental protection" fee-to-tax" reform? Evidence from ESG in-formation greenwashing in China. Int. Rev. Econ. Financ. 2025, 104, 104657. [Google Scholar] [CrossRef]
- Gao, X.; Liu, N.; Hua, Y. Environmental Protection Tax Law on the synergy of pollution reduction and carbon reduction in China: Evidence from a panel data of 107 cities. Sustain. Prod. Consum. 2022, 33, 425–437. [Google Scholar] [CrossRef]
- Kong, L.; Li, Z.; Liu, B.; Xu, K. The impact of environmental protection tax reform on low-carbon total factor productivity: Evi-dence from China’s fee-to-tax reform. Energy 2024, 290, 130216. [Google Scholar] [CrossRef]
- Levinson, A. Technology International Trade Pollution from, U.S. Manufacturing. Am. Econ. Rev. 2009, 99, 2177–2192. [Google Scholar] [CrossRef]
- Chen, W.Y.; Zhang, L.G.; Jiang, P.Y.; Meng, F.; Sun, Q. Can Digital Transformation Improve the Information Environment of the Capital Market? Evidence from the Analysts’ Prediction Behaviour. Account. Financ. 2022, 62, 2543–2578. [Google Scholar] [CrossRef]
- Chen, Z.; Kahn, M.E.; Liu, Y.; Wang, Z. The consequences of spatially differentiated water pollution regulation in China. J. Environ. Econ. Manag. 2018, 88, 468–485. [Google Scholar] [CrossRef]
- Xu, Y.; Wen, S.; Tao, C.Q. Impact of environmental tax on pollution control: A sustainable development perspective. Econ. Anal. Policy 2023, 79, 89–106. [Google Scholar] [CrossRef]
- Pigou, A.C. The Economics of Welfare; Macmillan & Co., Ltd.: London, UK, 1920. [Google Scholar]
- Porter, M.E.; Linde, C.V.D. Toward a new conception of the environment-competitiveness relationship. J. Econ. Perspect. 1995, 9, 97–118. [Google Scholar] [CrossRef]
- Wang, Y.; Yu, L. Can the current environmental tax rate promote green technology innovation?-Evidence from China’s re-source-based industries. J. Clean. Prod. 2021, 278, 123443. [Google Scholar] [CrossRef]
- Yu, Y.; Liu, J.; Wang, Q. Has environmental protection tax reform promoted green transformation of enterprises? Evidence from China. Environ. Sci. Pollut. Res. 2024, 31, 29472–29496. [Google Scholar] [CrossRef] [PubMed]
- Hakam, S.L.; Rahayu, A.; Wibowo, L.A.; Hakam, L.I.; Nugroho, M.A.; Fuadi, S.S. Compliance Behavior in Environmental Tax Policy. J. Risk Financ. Manag. 2024, 17, 542. [Google Scholar] [CrossRef]
- Cheng, B.; Qiu, B.; Chan, K.C.; Zhang, H.; Phillips, A. Does a green tax impact a heavy-polluting firm’s green investments? Appl. Econ. 2022, 54, 189–205. [Google Scholar] [CrossRef]
- Zhang, Y.; Xia, F.; Zhang, B. Can raising environmental tax reduce industrial water pollution? Firm-level evidence from China. Environ. Impact Assess. Rev. 2023, 101, 107155. [Google Scholar] [CrossRef]
- Ding, X.; Xu, Z.; Petrovskaya, M.V.; Wu, K.; Ye, L.; Sun, Y.; Makarov, V.M. Exploring the impact mechanism of executives’ environmental attention on corporate green transformation: Evidence from the textual analysis of Chinese companies’ management discussion and analysis. Environ. Sci. Pollut. Res. 2023, 30, 76640–76659. [Google Scholar] [CrossRef] [PubMed]
- Zhou, J.; Jin, S. Corporate environmental protection behavior and sustainable development: The moderating role of green investors and green executive cognition. Int. J. Environ. Res. Public Health 2023, 20, 4179. [Google Scholar] [CrossRef] [PubMed]
- Peng, M.; Wei, C.; Jin, Y.; Ran, H. Does the Environmental Tax Reform Positively Impact Corporate Environmental Performance? Sustainability 2023, 15, 8023. [Google Scholar] [CrossRef]
- Ji, L.; Mou, J.; Dong, Y. Environmental regulation, heterogeneous environmental investment strategies and audit fees. Collect. Essays Financ. Econ. 2022, 38, 56. (In Chinese) [Google Scholar]
- Angrist, J.D.; Pischke, J.-S. Mostly Harmless Econometrics: An Empiricist’s Companion; Princeton University Press: Princeton, NJ, USA, 2009. [Google Scholar]
- Hering, L.; Poncet, S. Environment Policy and Exports: Evidence from Chinese Cities. J. Environ. Econ. Manag. 2014, 68, 296–318. [Google Scholar] [CrossRef]
- Cai, X.; Lu, Y.; Wu, M.; Yu, L. Does Environmental Regulation Drive away Inbound Foreign Direct Investment? Evidence from a Quasi-natural Experiment in China. J. Dev. Econ. 2016, 123, 73–85. [Google Scholar] [CrossRef]
- Deschenes, O.; Greenstone, M.; Shapiro, J.S. Defensive Investments and the Demand for Air Quality: Evidence from the Nox Budget Program. Am. Econ. Rev. 2017, 107, 2958–2989. [Google Scholar] [CrossRef]
- He, X.; Jing, Q.-L. The impact of environmental tax reform on total factor productivity of heavy-polluting firms based on a dual perspective of technological innovation and capital allocation. Sustainability 2022, 14, 14946. [Google Scholar] [CrossRef]
- Chen, H.; Guo, W.; Feng, X.; Wei, W.; Liu, H.; Feng, Y.; Gong, W. The impact of low-carbon city pilot policy on the total factor productivity of listed enterprises in China. Resour. Conserve Recycl. 2021, 169, 105457. [Google Scholar] [CrossRef]
- Long, F.; Lin, F.; Ge, C. Impact of China’s environmental protection tax on corporate performance: Empirical data from heavily polluting industries. Environ. Impact Assess. Rev. 2022, 97, 106892. [Google Scholar] [CrossRef]
- Tchapchet-Tchouto, J.E.; Koné, N.; Njoya, L. Investigating the effects of environmental taxes on economic growth: Evidence from empirical analysis in European countries. Environ. Econ. 2022, 13, 1. [Google Scholar] [CrossRef] [PubMed]
- Tchórzewska, K.B.; Garcia-Quevedo, J.; Martinez-Ros, E. The heterogeneous effects of environmental taxation on green technologies. Res. Policy 2022, 51, 104541. [Google Scholar] [CrossRef]
- Silajdzic, S.; Mehic, E. The Impact of Environmental Taxes on Competitive Performance of Pollution-Intensive Industries Among Transition Economies: Evidence from Panel Analysis. Financ. Environ. Bus. Dev. 2017, 4, 155–169. [Google Scholar] [CrossRef]

| Time | Environmental Protection Tax Policy |
|---|---|
| 1979 | The pollution discharge fee system was first proposed |
| 1982 | Interim Measures for the Collection of Pollution Discharge Fees |
| 2003 | Regulations on the Collection and Use of Pollution Discharge Fees, which further standardized the collection and use of pollution discharge fees, expanded the collection scope, raised the charging standards, and introduced the concept of green taxation |
| 2007 | Comprehensive Work Plan for Energy Conservation and Emission Reduction, which clearly proposed to study and impose an environmental tax |
| 2010 | The official proposal to impose an environmental protection tax was put forward; a draft was formulated in 2014, and the draft was solicited for opinions from all sectors of society in 2015 |
| 2016 | The Environmental Protection Tax Law was legislated and adopted, marking that China’s environmental tax officially entered the legislative stage |
| 2018 | The Environmental Protection Tax Law was officially implemented |
| Variable | Symbol | Observed Value | Mean | Standard Deviation | Minimum | Maximum |
|---|---|---|---|---|---|---|
| Green Transformation (index, dimensionless, range: 0–1) | M_green | 19,686 | 0.1453 | 0.1405 | 0.00009 | 0.7561 |
| Policy Dummy Variable (Dummy: 0/1) | Post | 19,686 | 0.5464 | 0.4979 | 0 | 1 |
| Firm Dummy Variable (Dummy: 0/1) | Treat | 19,686 | 0.4072 | 0.4913 | 0 | 1 |
| Firm Size (Natural logarithm of total assets, unit: RMB) | Size | 19,686 | 22.0171 | 1.1796 | 17.3882 | 27.6211 |
| Firm Age (Natural logarithm of operating years, unit: year) | Age | 19,686 | 2.8859 | 0.3399 | 1.0986 | 4.1744 |
| Financial Leverage (Asset-liability ratio, Dimensionless 0–1) | Lev | 19,686 | 0.3662 | 0.1834 | 0.0071 | 0.9853 |
| CEO Duality (Dummy: 0/1) | Dual | 19,686 | 0.3425 | 0.4746 | 0 | 1 |
| Ownership Type (Dummy: 0/1) | Central | 19,686 | 0.2469 | 0.4312 | 0 | 1 |
| Variable | M_Green (1) | M_Green (2) | M_Green (3) | M_Green (4) | M_Green (5) | M_Green (6) |
|---|---|---|---|---|---|---|
| Did (Dummy: 0/1) | 0.0084 * (0.0048) | 0.0089 ** (0.0043) | 0.0086 ** (0.0043) | 0.0094 ** (0.0045) | 0.0084 ** (0.0043) | 0.0088 ** (0.0043) |
| Post (Dummy: 0/1) | 0.1470 *** (0.0280) | 0.0591 *** (0.0029) | 0.0547 *** (0.0029) | 0.1028 *** (0.0243) | 0.0210 *** (0.0030) | 0.0217 *** (0.0031) |
| Treat (Dummy: 0/1) | −0.0158 *** (0.0056) | 0.0054 (0.0313) | 0.0017 (0.0312) | −0.0176 *** (0.0050) | 0.0104 (0.0274) | 0.0124 (0.0285) |
| Xit (controls, metrics in Table 2) | No | No | No | Yes | Yes | Yes |
| Year | Yes | Yes | Yes | Yes | Yes | Yes |
| Industry | Yes | No | Yes | Yes | No | Yes |
| Stkcd | No | Yes | Yes | No | Yes | Yes |
| N_obs | 19,686 | 19,686 | 19,686 | 19,686 | 19,686 | 19,686 |
| R2 | 0.1471 | 0.0971 | 0.1237 | 0.2678 | 0.1297 | 0.1488 |
| _cons | 0.0928 *** (0.0437) | 0.1110 *** (0.0125) | 0.0306 (0.0413) | −0.8552 *** (0.0788) | −0.6873 *** (0.0550) | −0.7378 *** (0.0725) |
| Variable | (1) Placebo Test | (2) Excluding Environmental Inspections | (3) Excluding Carbon Emission Trading Markets | (4) | (5) | (6) | (7) | (8) | (9) Controlling for Time-Varying Industrial Dynamics |
|---|---|---|---|---|---|---|---|---|---|
| Excluding the COVID-19 Pandemic Shock | SBM-ML | Equal | |||||||
| Did (Dummy: 0/1) | 0.0064 (0.0047) | 0.0081 * (0.0043) | 0.0105 ** (0.0054) | 0.0162 *** (0.0037) | 0.0230 *** (0.0038) | 0.0009 * (0.0005) | 0.0031 ** (0.0015) | 0.0084 ** (0.0043) | 0.0104 * (0.0044) |
| Xit (controls, metrics in Table 2) | Yes | Yes | Yes | Yes | Yes | Yes | Yes | Yes | Yes |
| Fixed effects | Yes | Yes | Yes | Yes | Yes | Yes | Yes | Yes | Industry * Year interactive FE |
| N_obs | 19,686 | 19,686 | 10,677 | 19,686 | 12,584 | 16,650 | 24,302 | 19,686 | 19,686 |
| R2 | 0.1427 | 0.1488 | 0.1400 | 0.1456 | 0.1216 | 0.9086 | 0.1641 | 0.1663 | 0.1758 |
| _cons | −0.9077 *** (0.0736) | −0.7351 *** (0.0733) | −0.4826 *** (0.1022) | −0.8316 *** (0.0725) | −0.5589 *** (0.0819) | 0.8540 *** (0.0082) | 0.1357 (0.0346) | −0.5779 *** (0.0748) | −0.502 *** (0.0908) |
| Variable | (1) Pollution Discharge Cost | (2) Corporate Investment | (3) Green Cognition of Executives |
|---|---|---|---|
| Did (Dummy: 0/1) | 0.0185 *** (0.0051) | 0.0028 * (0.0014) | 0.0901 *** (0.0242) |
| Xit (controls, metrics in Table 2) | Yes | Yes | Yes |
| Fixed effects | Yes | Yes | Yes |
| N_obs | 14,421 | 18,580 | 18,580 |
| R2 | 0.1135 | 0.1076 | 0.0226 |
| _cons | −0.8161 *** (0.0994) | 0.1599 *** (0.0051) | −0.2312 (0.3775) |
| Firm Level | Corporate Profitability | Corporate Ownership | Green Patent Applications | |||
|---|---|---|---|---|---|---|
| (1) High Profitability | (2) Low Profitability | (3) State-Owned | (4) Non-State-Owned | (5) With Patents | (6) Without Patents | |
| Did (Dummy: 0/1) | 0.0089 (0.0063) | 0.0107 * (0.0060) | 0.0102 (0.0092) | 0.0081 * (0.0049) | 0.0005 (0.0085) | 0.0139 *** (0.0049) |
| Xit (controls, metrics in Table 2) | Yes | Yes | Yes | Yes | Yes | Yes |
| Fixed effects | Yes | Yes | Yes | Yes | Yes | Yes |
| N_obs | 9843 | 9843 | 4861 | 14,825 | 6133 | 13,553 |
| R2 | 0.1581 | 0.1495 | 0.1515 | 0.1576 | 0.1428 | 0.1561 |
| _cons | −0.6717 *** (0.0784) | −0.7085 *** (0.0849) | −0.5690 *** (0.1568) | −0.6701 *** (0.0811) | −0.9166 *** (0.0647) | −0.6526 *** (0.0795) |
| Industry Level | Industry Competition | Factor Intensity | |||
|---|---|---|---|---|---|
| (1) High-Competition Group | (2) Low-Competition Group | (3) Labor-Intensive | (4) Capital-Intensive | (5) Technology-Intensive | |
| Did (Dummy: 0/1) | 0.0087 (0.0055) | 0.0112 ** (0.0057) | 0.0199 * (0.0106) | 0.0092 (0.0068) | 0.0083 (0.0068) |
| Post (Dummy: 0/1) | 0.0177 *** (0.0042) | 0.0242 *** (0.0045) | 0.1821 *** (0.0184) | 0.0857 *** (0.0264) | 0.1385 *** (0.0161) |
| Treat (Dummy: 0/1) | −0.0131 (0.0249) | 0.0011 (0.0459) | −0.0249 ** (0.0117) | −0.0208 *** (0.0080) | −0.0119 ** (0.0060) |
| Xit (controls, metrics in Table 2) | Yes | Yes | Yes | Yes | Yes |
| Fixed effects | Yes | Yes | Yes | Yes | Yes |
| N_obs | 10,090 | 9473 | 3174 | 9202 | 7310 |
| R2 | 0.1526 | 0.1537 | 0.2089 | 0.2370 | 0.2933 |
| _cons | −0.8045 *** (0.0884) | −0.6650 *** (0.1013) | −0.8731 *** (0.1265) | −0.6710 *** (0.0774) | −0.9575 *** (0.0921) |
| Variable | Long-Term Dynamic Effects | Industry Pollution Attributes | Economic Consequences | |||
|---|---|---|---|---|---|---|
| (1) 2018–2019 | (2) 2020–2022 | (3) 2011–2022 | (4) | (5) TFP_OP | (6) TFP_LP | |
| Short-Term Adaptation Stage | Medium-Term Deepening Stage | Full Sample | ||||
| Did (Dummy: 0/1) | 0.0016 (-) 1 | −0.0703 (0.0768) | 0.0088 ** (0.0043) | |||
| Did * pollution (Dummy: 0/1) | 0.0123 ** (0.0056) | |||||
| Did * M_green (index. dimensionless, range: 0–1) | 0.2320 *** (0.0473) | 0.1941 *** (0.0477) | ||||
| Xit (controls, metrics in Table 2) | Yes | Yes | Yes | Yes | Yes | Yes |
| Fixed effects | Yes | Yes | Yes | Yes | Yes | Yes |
| N_obs | 3655 | 7102 | 19,686 | 19,686 | 17,087 | 17,087 |
| R2 | 0.0248 | 0.0837 | 0.1488 | 0.1430 | 0.5459 | 0.6663 |
| _cons | −0.9251 (-) | −1.8927 *** (0.1544) | −0.7378 *** (0.0725) | −0.8795 *** (0.0724) | −1.6861 *** (0.5628) | −3.2719 *** (0.5038) |
Disclaimer/Publisher’s Note: The statements, opinions and data contained in all publications are solely those of the individual author(s) and contributor(s) and not of MDPI and/or the editor(s). MDPI and/or the editor(s) disclaim responsibility for any injury to people or property resulting from any ideas, methods, instructions or products referred to in the content. |
© 2026 by the authors. Licensee MDPI, Basel, Switzerland. This article is an open access article distributed under the terms and conditions of the Creative Commons Attribution (CC BY) license.
Share and Cite
Wang, X.; Zhao, D.; Wei, Z. Environmental Taxes and Corporate Green Transition: Evidence from Chinese Manufacturing Firms. Sustainability 2026, 18, 6898. https://doi.org/10.3390/su18136898
Wang X, Zhao D, Wei Z. Environmental Taxes and Corporate Green Transition: Evidence from Chinese Manufacturing Firms. Sustainability. 2026; 18(13):6898. https://doi.org/10.3390/su18136898
Chicago/Turabian StyleWang, Xi, Dan Zhao, and Zicheng Wei. 2026. "Environmental Taxes and Corporate Green Transition: Evidence from Chinese Manufacturing Firms" Sustainability 18, no. 13: 6898. https://doi.org/10.3390/su18136898
APA StyleWang, X., Zhao, D., & Wei, Z. (2026). Environmental Taxes and Corporate Green Transition: Evidence from Chinese Manufacturing Firms. Sustainability, 18(13), 6898. https://doi.org/10.3390/su18136898