Article

A Lightweight Replicable Local Digital Twin Workflow for Small Cities Using Open Data and Web-Based 3D Visualization


ABC Department, Politecnico di Milano, Piazza Leonardo da Vinci 32, 20133 Milan, Italy
*
Author to whom correspondence should be addressed.
Sustainability 2026, 18(13), 6717; https://doi.org/10.3390/su18136717
Submission received: 11 June 2026 / Revised: 27 June 2026 / Accepted: 29 June 2026 / Published: 2 July 2026
(This article belongs to the Section Sustainable Urban and Rural Development)

Abstract

Small municipalities often lack the resources and infrastructure necessary to implement advanced digital twin solutions commonly adopted in larger cities or industries. This study addresses the challenge of designing a replicable and interoperable local digital twin architecture specifically suited for low-infrastructure environments. A gap in the current literature and practice is identified: most digital twin implementations are domain-specific, resource-intensive, or proprietary, which limits their applicability in low-infrastructure contexts such as small rural areas. To address this issue, a requirement-driven architecture based on open standards and minimal-footprint, edge-based technologies is proposed. The approach is validated through real-world implementation in Codogno, Italy, with subsequent replication in Varna, Bulgaria, and Lausanne, Switzerland. The findings indicate that the proposed architecture can be deployed with minimal local infrastructure while maintaining interoperability with existing systems and enabling scalability to larger contexts. Interoperability is achieved through standardized data models and APIs, while replicability is ensured by a modular design utilizing open-source components. These contributions offer a practical blueprint for small municipalities to develop local digital twins, thereby supporting digital transformation at the community level.

1. Introduction

With global urbanization accelerating parallelly to the increase of the adoption of novel technologies across the AEC (Architecture, Engineering and Construction) sector, the urgent need for innovative methods and approaches to urban planning, resource optimization and sustainability is more and more present. Smart Cities initiatives have emerged across countries as data-enriched virtual ecosystems, centered around the use of Information and Communication Technology (ICT) and mainly the Internet of Things (IoT) to sense, integrate and analyze core city relations and processes, aiming at more efficient management.
At the forefront of this agenda stands the concept of the digital twin (DT) and its branches in urban management (namely urban, city or local DTs), often described as a virtual replica of a physical system, process, or entity, updated continuously through a bidirectional flow of data, which enables decision-making and “what-if” scenarios [1].
The concept of digital twinning originated in production management and manufacturing in the early 2000s, first conceptualized by Grieves and subsequently formalized together with Vickers [2], when it was used for the optimization of production lines, from where it slowly started paving its way to other areas of research, urban management being one of them, once its potential for simulative scenarios for mobility, energy and the environment were discovered.
The concept of a city digital twin (CDT) or urban digital twin (UDT) is defined in urban contexts as a “live virtual model” of urban systems, which is enriched by continuous data flows to provide deeper understanding [3] and higher efficiency for the management of urban functions. Early visionary work, such as that of Batty [4], introduced the concept of UDTs to the scientific community in city science, envisioning a “city’s cognitive layer” capable of mirroring and analyzing the city in real time. This evolution from aspiration to pilot has unfolded rapidly to date; however, significant hurdles still persist, including complex technical challenges, data integration issues and model validity, along with governance issues surrounding data sharing and data access, to mention just a few [5].
A concrete challenge is data and system heterogeneity. Small municipalities typically have a heterogenous collection of old legacy systems and new IoT deployments, with the same systems often coming from different vendors, resulting in the so-called information silos where each information system “speaks a different language” [6]. Without adoption of common shared data models and APIs for the applications using them, it is easy for small municipalities to find themselves locked in with one vendor, unable to extend and replicate their solutions.
Resource constraints present a further challenge. To this extent, unlike major industrial corporations, a small town may not have access to expansive cloud computing resources and dedicated IT teams. That means that the architecture demands a smaller footprint in terms of cost and complexity [7].
Thus, there exists a pressing need for a local digital twin (LDT) approach that is low-cost, easily deployable and replicable in different locations. This would entail the utilization of open-source tools, standardization of data models and simplification of the ICT stack. In light of the following challenges, our motivation was to design an LDT architecture suitable for small municipalities, intended to be interoperable by design with diverse systems, achieved through open standards and common data models, easily replicable and requiring minimal customization, achieved through generic modular design that can be adopted by different contexts, scalable in terms of the ability to grow in devices or data, and minimalistic in terms of the required infrastructure.
This paper presents our approach to this problem, in the form of a “blueprint-like” architecture. In the next sections, we review related work on interoperability and replicability, highlighting the research gap. We then describe our approach, which is requirement-driven and uses minimal-footprint-enabling technologies. We detail the different layers of the LDT architecture, components, data flows and control mechanisms. We then move on to describe the implementation of such architecture in Codogno, a small municipality that served as a pilot use case, including the tools and techniques used to realize it with limited resources. We continue in the Results section by providing evidence for its interoperability, replicability (by summarizing how it was transplanted to Varna and Lausanne with little change) and scalability (by discussing its performance and adaptations in these very different contexts).

2. Related Works and State of the Art

Research in DT architectures is rich and evolving, with particular focus on achieving interoperability, replicability and scalability. To provide a rigorous foundation for the proposed LDT workflow, this synthesized literature review examines the evolving landscape of DT architectures, focusing on the transition from centralized monolithic systems to decentralized, modifiable and standards-compliant frameworks.
Table 1 presents the systematic categorization of the representative studies examined in this review, grouping each based on its architectural strategy, key contributions, and the limitations identified. Synthesizing the literature was guided by a systematic but deliberately non-exhaustive narrative review as opposed to a formal systematic review approach. Candidate studies were identified using Scopus, Web of Science, and IEEE Xplore, in combination with backward and forward citation chasing of the most pertinent works using a mix of *digital twin*, *reference architecture*, *edge/fog computing*, *interoperability*, *FIWARE/NGSI-LD*, *Asset Administration Shell*, and *urban/local digital twin*. Studies were included if they proposed or analyzed a digital twin architecture with relevance to interoperability, replicability, or edge deployment, and were peer-reviewed in official venues, with a focus on recent works (2018–2026). Studies that were purely conceptual position papers with no substantive contribution at the architectural level were excluded. As the goal was to discern architectural patterns and recurring shortcomings in research rather than synthesize quantitative evidence, formal systematic-review appraisal frameworks were not implemented. Instead, explicit and reproducible inclusion criteria were embraced, recognizing that the generated corpus is representative rather than exhaustive. As assembled in Table 1, the recurring limitations from these selected studies, encompassing a dependence on single-view representations, lack of generalizability, and insufficient empirical validation, justify the lightweight, localized, and open data-driven implementation workflow that is suggested in this paper for small-scale digital twin deployments.

2.1. Key Themes Driving the Literature Analysis

To help locate the above table in this literature, three critical themes have been identified as follows:
  • First, there have been several important and well-documented contributions to the field related to decentralization, in the form of LDTs. For example, the work of Kondo et al. [12] and Knebel et al. [7] indicate that processing closer to the network edge has led to a more than 50% improvement in response time. Indeed, response times are often a paramount concern in the design of real-time monitoring systems for cities where cloud latency can be too slow.
  • Second, the selection of the NGSDI-LD standard and FIWARE ecosystem as a best practice for building replicable (https://www.fiware.org/, accessed on 26 June 2026) and portable smart solutions [22] is another theme that appears often in the literature. In conjunction with the AAS meta model [23], it is clear that its use as a “single source of truth” of asset-based data over their entire asset lifecycle has proven extremely useful in this area.
  • Third, from our analysis, a significant gap was the use of informal “box-and-arrow” diagrams along with the conflation between the structural and behavioral aspects of DTs in much of the current documentation. This lack of multi-view documentation according to ISO42010 [24] makes it difficult for practitioners to replicate successful approaches with new and (perhaps) unique use cases, such as those of the small cities studied in this review.
By capturing the contributions and gaps of these selected papers, we identify what the necessary building blocks are needed to provide a flexible, domain-independent reference architecture based on the use of open-source tools and 3D visualization to make digital twins truly accessible to small municipalities.

2.2. Main Findings: Trends in Architecture and Deployment

  • Shift from Cloud-Only to Edge/Fog Architectures: A central observation across the recent literature is that centralized cloud architectures do not adequately meet the requirements of strict timing constraints of real-time industrial and urban systems due to network latency and bandwidth costs. The key is to distribute the DT’s components to the network edge or to adopt a cloud–fog hybrid approach to reduce the time response by over 50 percent.
  • Adoption of Standardized Ecosystems: The main research direction focuses on the use of standardized APIs and data models to address interoperability challenges. Specifically, the FIWARE ecosystem, defined by the NGSI-LD standard, is a predominant reference for building containerized, scalable and domain agnostic solutions. Similarly, the Asset Administration Shell (AAS) has emerged as the preferred implementation technology for DTs in the Industry 4.0 context.
  • Emergence of Local and Modular Intelligence instead of Global Digital Twins: The current approach is less focused on building monolithic “Global Digital Twins” and more towards LDTs that act as intelligent, decentralized subsystems. Key findings show that, by combining Multi-Agent Systems (MASs) and EdgeAI, researchers can build modular, re-usable AI techniques that can be orchestrated in real-time based on semantic context.
  • Requirement-Driven Engineering: Recently emerging frameworks have transitioned towards traceable, requirement-driven designs. Architectures are now being mapped directly to core DT functionalities, such as synchronization, bi-directional communication and optimization. This is to ensure they qualify as “twins” rather than digital shadows [25].
  • Interoperability and Standards: Interoperability in DT systems requires both syntactic compatibility (shared APIs and data formats) and semantic consistency (shared meaning of entities and properties). Two families of standards address these needs at different levels:
    ISO 23247 (manufacturing): This defines a layered reference architecture separating physical, data, and functional concerns, including Observable Manufacturing Elements, data collection/control, analysis, and user interfaces. Its structured terminology reduces ad hoc integration and has influenced DT design beyond manufacturing, including general data-processing center frameworks [26].
    OASC Minimal Interoperability Mechanisms (MIMs): Rather than mandating a single standard, MIMs define lightweight common mechanisms (data models, APIs, and dashboards) that cities adopt to achieve baseline compatibility. This enables local twins to later interconnect for regional planning, crisis management, and benchmarking [27].
    NGSI-LD/FIWARE: The FIWARE context broker implementing NGSI-LD provides a unified API for querying the entity state, discovering related entities, and subscribing to changes via publish/subscribe. It supports temporal queries and rich filtering: well-suited to dynamic urban environments. The FIWARE Smart Data Models library (covering air quality, traffic, weather and more) further promotes portability across cities by standardizing data schemas [22].
A key gap in the literature remains the lack of documented blueprints for small-town digital twins: holistic, low-budget, and deployable by local government IT teams. Most documented urban DT cases focus on a single domain (traffic or energy) or assume metropolitan-scale resources. This work addresses this gap by synthesizing the above principles into a practical, standards-compliant architecture validated across multiple small-city contexts.

2.3. Lightweight Urban Digital Twin Pilots and Positioning of This Work

While the studies in Table 1 define the architectural building blocks, there is relatively little literature reporting a deployed, lightweight urban pilot, and even less of it focusing specifically on small municipalities. It is thus worthwhile to summarize relevant pilot-grade efforts and position the proposed work on their basis. Teutscher et al. [3] showcase a city-scale digital urban twin for interactive pollution prediction, but tying it to computational-fluid-dynamics (lattice-Boltzmann) simulation assumes the availability of high-performance computing infrastructure well out of a small-town budget. The FI-WARE-based urban twins of Bauer et al. [19] and Conde et al. [20,21] convincingly address how NGSI-LD and the Smart Data Models break down information silos, yet they assume a server-side context broker and the associated operation and maintenance efforts. Similarly, edge- and fog-oriented solutions like those by Knebel et al. [7], Picone et al. [14] and Alanezi and Mishra [15] reduce latency by shifting the computation closer to the network edge, but are mostly validated in industrial or generic scenarios rather than resource-constrained municipal governance, and still presuppose dedicated edge infrastructure. While advocacy for small-scale twins is strong at the policy level, the European Commission’s Local Digital Twins Toolbox [28] remains at this moment unimplementable as a reproducible, technical blueprint for low-infrastructure contexts.
Against this, we find the novelty of the proposed workflow in three dimensions. First, our solution moves the bulk of context management, time-series forecasting and persistence into the browser, at the network edge, thus making the conditions of a working twin—no dedicated server, no license, and no specialist operations team—an explicit response to the resource limitations of small municipalities, not a down-sampled, smaller-scale version of a metropolitan system. Second, it is open-data-driven and standards-based end-to-end (open GeoJSON, open meteorological and traffic APIs, and web-based 3D visualization), ensuring low costs for procurement and maintenance but not compromising interoperability. Third, and in contrast to single-city demonstrations, replicability is treated as a first-class requirement and is empirically tested by transplanting the same platform to two further cities (Varna and Lausanne) with only configuration-level changes. To our knowledge, no prior pilot involved these three simultaneous properties, zero-backend, browser-edge architecture, open data and demonstrated cross-city replication for small- and medium-sized towns, which is the gap the paper aims to fill.

3. Approach and Methodology

The Codogno digital twin is implemented as a browser-based geospatial analytics platform that provides a seamless integration of three-dimensional visualization, environmental sensing proxies and prediction modeling within a single-page web architecture. The system is based on a layered architectural approach, with the heterogeneous data streams gradually transformed into analytical results through a sequence of functional modules: a data source layer, ingestion and normalization processes, contextual state management, modeling to computational services, rendering to visualization pipelines, interface orchestration, persistence and synchronization mechanisms and operational reliability components. Instead of relying on a robust backend architecture, the application adopts an edge-oriented architecture with most of the computation and data integration occurring directly within the context of the client environment. This allows the DT to operate with minimal server dependencies, while still supporting optional services in the cloud. The methodology can be summarized as follows: (1) requirements and scope defined, (2) architecture design, (3) incremental prototype development and (4) cross-city validation. Each phase is described in the following subsections, with the rationale behind key decisions.

3.1. Use Case

Codogno is a municipality in the Lombardy region in Italy with a population of approximately 15,000 people. Despite its relatively modest size, the town experiences several typical issues common in urban areas such as localized air pollution, especially along the main traffic corridors; periodic congestion during peak times and for special events, as is always the case in this area; and the impacts of summer heat waves compounded by the urban heat island effect. This section describes how the Codogno LDT was applied to this context and the motivations behind the decision to focus on a certain set of features and conditions seen when deploying the system. We also point out why some characteristics of a small town such as limited sensor networks and the requirement for cost-effective solutions influenced the design process.
In terms of local infrastructure, Codogno does not have an extensive network of IoT sensors. There is just one regional ARPA air quality measurement unit.
The concept of the local digital twin was pitched as a way to “do more with less”, in other words, how to leverage data science and integration to compensate for limited measurement instruments. Specifically:
  • For the air quality, it was based on the desire to gain localized insights. The nearest official station might have information about average levels for the region but getting that heads-up ability from forecasts can help understand when pollution might build up.
  • For traffic and mobility, Codogno does not have a public traffic control center, like big cities. The twin provides a real-time map of traffic conditions, which the city never had in the past. This visualization (even if relatively coarse) helps to notice some patterns.
  • For the urban heat islands, the analysis reveals which parts in the town stay hottest at night (as the UHI effect represents the stored heat).
Another aspect, which we found important, had to do with autonomy and resilience: being a relatively small community, the city would benefit from a solution that could keep working while keeping some work locally. A locally hosted DT that the staff of the city can handle directly and in-person fits this particular ethos, as opposed to relying on external dashboards that might not consider, let alone prioritize, a small town’s needs.
In terms of the implementation and running the twin, we met several constraints due to small town constraints, like data sparsity and limited sensors. It is clear that the twin, in regard of unsensed locations, produces estimates or hypotheses as opposed to measured facts.
By adapting the twin to the particular context of Codogno (a small town, a limited number of sensors, and specific problem areas), we were able to deliver a tool that can already contribute to their urban managers and strategic planning activities. The key in this case was the adaptation of the twin to the specific location, as well as to the needs of the community.

3.2. Requirements and Scope Definition

The first step was to engage with local stakeholders in Codogno. This was a dual process that involved both identifying the most urgent issues and identifying any practical constraints. This was very important to ensure that the DT solution we built was about solving concrete problems, rather than being a high-tech demonstration. Three focus areas emerged: air quality management, analysis of traffic flows and monitoring of urban heath. These were chosen because they are issues which have a direct and measurable impact on the well-being of citizens in the city, and addressing them through improved data could help to make better decisions. We went on to formalize these problems as three ‘use cases’ in greater detail: Pollution Forecasting, Traffic state Monitoring and LST (Land Surface Temperature). For each use case, we outlined the required capabilities. The Pollution Forecasting use-case requires ingestion of meteorological forecasts of temperature, precipitation and wind, running a predictive model, and visualizing the forecast pollutant concentrations over the 3D city model. Similarly, the LST requires combining temperature data (from open-source weather stations) with administrative boundary information to identify areas of anomalously high heat retention. Finally, we captured the interoperability requirement as the need for the system to be able to integrate new data sourced or link to other systems as far as possible with minimum custom coding: this led to identifying standard APIs and data formats. We also emphasized the requirement for real-time operation: not every part of the system needs to be able to run with sub-second response times, but the system as a whole needed to be able to update frequently enough to provide a live representation, rather than static snapshots.

3.3. Architecture Design

In order to meet the aforementioned requirements, we then designed the architecture in a layered, modular approach, as shown in Figure 1, which was motivated by reference models such as ISO23247 [24] and the 5C CPS architecture [29], adapting them to a more urban context and in line with our use cases. It is conceptually divided into the following layers:

3.3.1. Physical Layer (Data Sources)

The data source layer is the backbone of the system, consolidating both static geospatial data and live, dynamic environmental observations. The static spatial data in the system mainly constitute the open-source GeoJSON dataset (https://overpass-turbo.eu/, accessed on 26 June 2026) representing the building footprints and related metadata for the city of Codogno.
Each feature consists of polygon geometry describing the building footprint, as well as attribute information such as the building height, that enables the generation of the extruded 3D structures within the CesiumJS environment.
In addition to this static dataset, the system consumes several live data streams through external APIs. Meteorological observations are obtained through the OpenWeatherMap API, which provides real-time atmospheric conditions. The application retrieves these parameters at two locations: an urban reference point (within Codogno) and a rural reference point. This dual acquisition method enables the estimation of the UHI (urban heat island) conditions of Codogno, by comparing the urban and rural atmospheric context. Complementary meteorological forecasts are obtained through the OpenMeteo API, which provides multi-day forecasts for temperature, precipitation and wind parameters. These forecasts serve both as contextual information for users and as inputs for predictive environmental modeling.
The traffic information in the system is brought in in two separate ways: two local JSON datasets comprising traffic intensity (points) for different times of day, and live traffic imagery layers retrieved from Tom Tom’s traffic tile service.

3.3.2. Data Collection and Ingestion Layer

Upon identification of these heterogeneous datasets, the ingestion layer then proceeds to retrieve, validate and transform the raw data into internal representations suitable for processing. Building data are ingested through Cesium’s GeoJSON data source loader, which executes the parsing of the input dataset and subsequently creates a representative entity within the three-dimensional scene. During this data processing, the system assigns a stable identifier for each building entity, derived from the dataset’s attributes. These identifiers ensure a uniform and secure referencing across various components of the application, including interface controls, simulation modules and visualization routines. Further processing steps assign geometric and visual properties to the building entities, including height, positioning on the ground relative to the terrain and shadow casting behavior, as well the base material color.
Environmental data ingestion is supported by a periodic and asynchronous workflow, wherein a scheduled routine repeatedly queries the meteorologic APIs at configured intervals to retrieve the latest atmospheric parameters and normalizes them into structured objects representing the environmental state. These values are appended to historical arrays that store time-stamped environmental observations. Traffic is also processed during data ingestion; during this process, TomTom data is transformed into Cesium tile entities representing the congestion intensities that display real-time traffic conditions. Through these processes, the ingestion layer establishes a structure for standardizing the heterogeneous external datasets into coherent internal structures that are consumed by the modeling and visualization modules.

3.3.3. Context Management Layer

Central to the architecture is the context and state management layer that maintains the internal representation of the digital twin during runtime. This layer serves to coordinate the different data streams and ensure that the environmental values, predictions and visual states remain synchronized across the system. Core runtime variables include the CesiumJS viewer’s instance responsible for rendering the 3D scene, the collection of buildings entities representing the urban environment, and the arrays containing environmental time-series data such as temperature and pollutant concentration data. A dedicated object keeps a record of the most recent meteorological observation, which is used as contextual input to the environmental modeling functions.
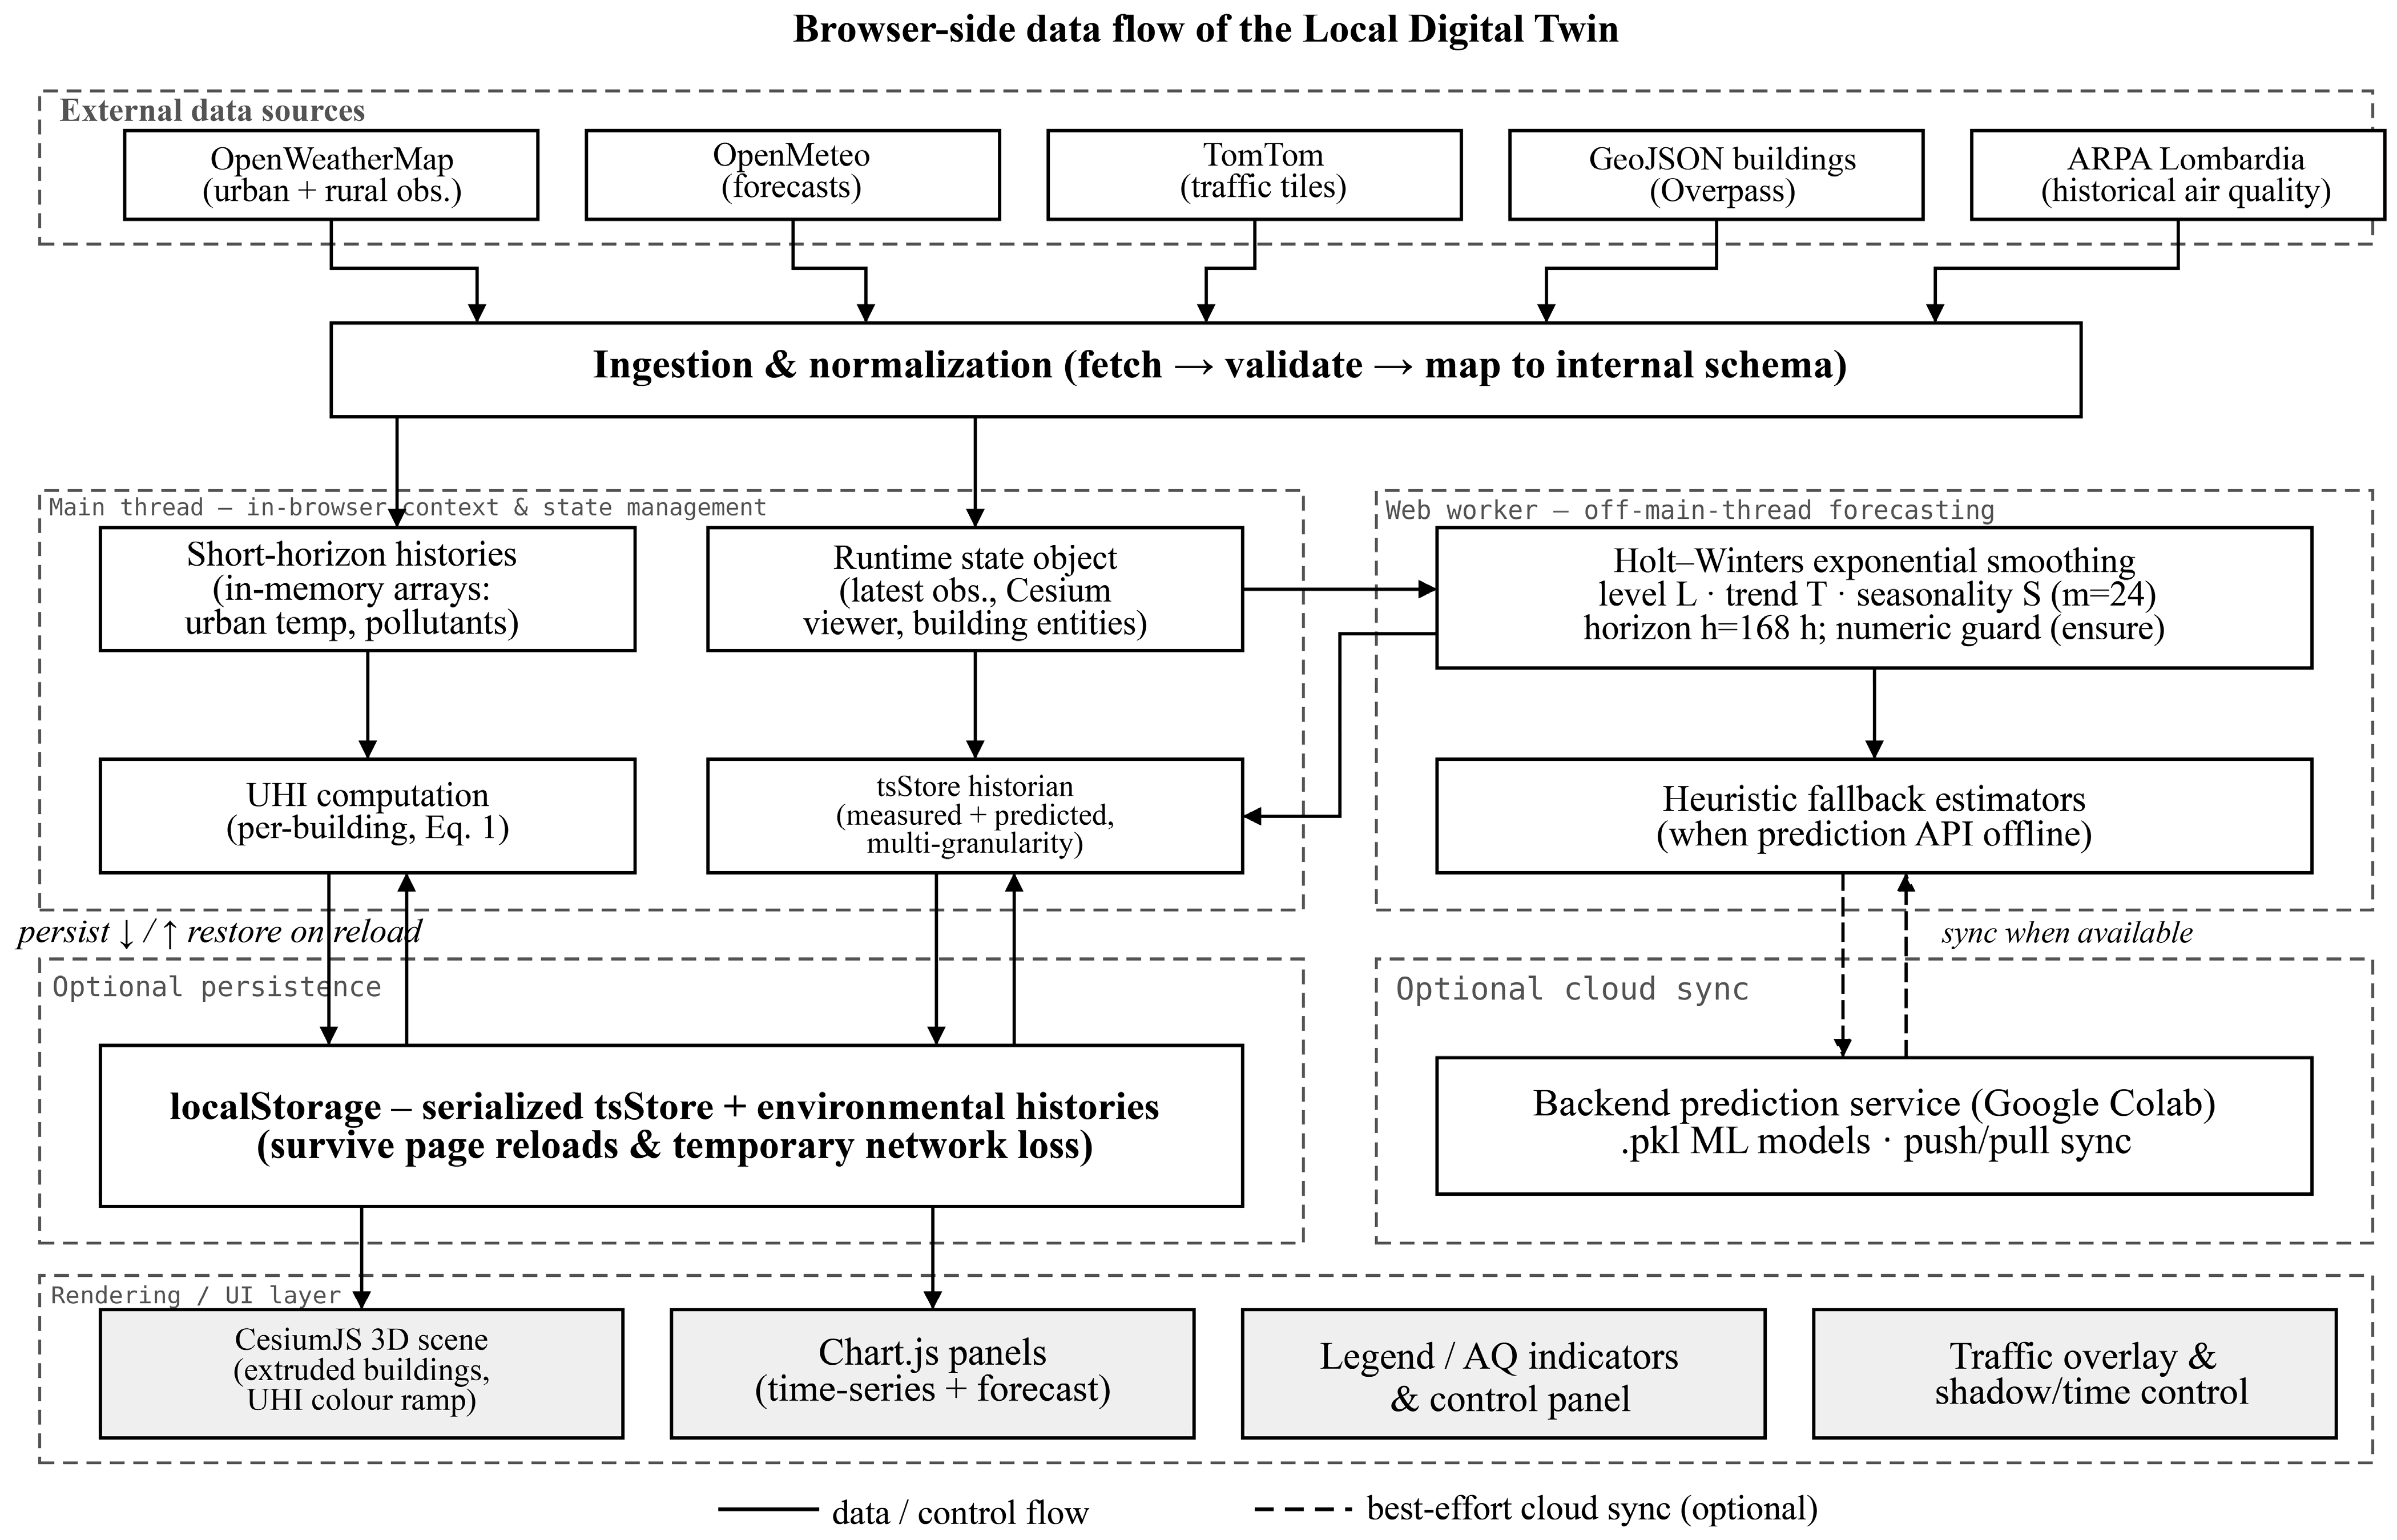
Instead of a server-side context broker, this system implements context management structured in-browser and in a localStorage state (illustrated in Figure 2). There are two complementary stores. Short-horizon “histories” hold recent raw values (urban temperature and pollutants) and are mainly used for short-term forecasting in the worker and for an immediate UI update (“now” indicators). The code handles bounded history by shifting elements when the maximum length is reached. The persistent time-series (tsStore) is the local historian for measured and predicted pollutant time. It provides chart aggregation at configurable granularities and is the primary source of data for the Chart.js rendering pipeline. These in-memory structures represent the authoritative state of the application during an active session. Environmental observations and associated derived indicators are written out to a local time-series store, allowing environmental histories to persist across page reloads and temporary network interruptions. When a backend prediction service is available, the application executes synchronization operations to transmit locally collected environmental records to the server while retrieving historical datasets. This hybrid approach allows the DT to operate in both offline-first and cloud-synchronization mode.

3.3.4. Environmental Modeling and Computational Simulation Layer

The modeling layer facilitates the translation of contextual environmental data into higher-level indicators of urban environmental conditions. One key computation performed in this layer is to estimate building-level urban heat island intensities. Taking the latest urban temperature observation as its basis, the system computes a thermal adjustment for each building through the influence of both morphological and atmospheric factors. Using numerical models, the system calculates how building height along with a combination of atmospheric wind speed and cloud coverage influence UHI intensities. An increased building height or decreased ventilation in the atmosphere may result in stronger localized heat accretion, and higher levels of atmospheric wind speed and cloud cover may mitigate urban thermal intensity. The output from this function are simulated UHI intensity values that correspond to the building entities in the system.
UHIb = Turban + 0.03 hb − 0.2 w − 0.02 c
where UHIb is the simulated urban heat island intensity of building b (°C); Turban is the latest measured urban air temperature (°C); hb is the building height (m); w is the atmospheric wind speed (m/s); and c is the cloud-cover fraction (%). The coefficients (0.03, −0.2 and −0.02 per unit) are empirically calibrated weights expressing, respectively, the intensification of localized heat retention with building height and its attenuation by stronger ventilation and higher cloud cover. The linear additive form was deliberately chosen so that the computation remains transparent and inexpensive enough to run client-side for every building entity at interactive frame rates.
Together with real-time simulation through previously generated .pkl files stored in-cloud, the system performs predictive modeling using time-series forecasting techniques. To generate the forecasts, a Holt–Winters exponential smoothing algorithm is implemented as a Web Worker. By conducting the forecasting operation in a worker thread, the application avoids blocking the principal user interface as it performs computation. The forecasting function processes a series of historical environmental observations stored in the system’s time-series arrays and generates hourly forecasts spanning several days into the future. These predicted temperature values are stored as time-sampled properties associated with building entities, so the visualization may dynamically depict the future environmental conditions.
In addition to the Holt–Winters prediction, the computational layer also generates pollutant concentration estimations. With an external prediction API being available, the application sends the current meteorological state to the backend service (Google Colab) which outputs the predicted concentrations for pollutants including ozone (O3), nitrogen dioxide (NO2), carbon monoxide (CO), nitric oxide (NO) and NH3. These predictions are generated using machine-learning models built from historical environmental datasets (ARPA Lombardia). In case the backend service is unavailable, the system resorts to a set of heuristic estimation functions which approximate pollutant concentrations from meteorological variables in combination with contextual indicators such as the time of the day and traffic activity. In the worker, the Holt–Winters logic can be defined through its three main components, level L, trend T and seasonality S, with a daily seasonality m = 24, and a typical horizon h 168 (7 × 24). The worker also contains a guard (ensure) that seeds short lines to avoid numerical collapse when the history is short. The predicted values are then mapped back onto the city entities as time-dependent properties.
In the same way, noise is also estimated by contextual models that combine traffic intensity with atmospheric conditions. All of the pollutant estimations are added on top of the environmental time-series dataset and allow both historical visualization and future estimation through the forecasting module.

3.3.5. Rendering and Visualization Pipeline and UI

The rendering layer generates visual representations of the computed environmental indicators within the digital twin environment. The primary visualization framework is CesiumJS, rendering the urban environments as a 3D scene populated by extruded building geometries. The system calculates statistical ranges for the current distribution of UHI values and maps them to a smooth color gradient or quantile-based color classes depending on the chosen visualization mode.
Traffic conditions are visualized using a combination of point entities representing congestion intensity and imagery overlays representing real-time traffic density. Temporal environmental indicators like pollutant concentrations are visualized using Chart.JS time-series graphs displaying both historical measurements and forecasted values. This enables users to analyze environmental trends over time.
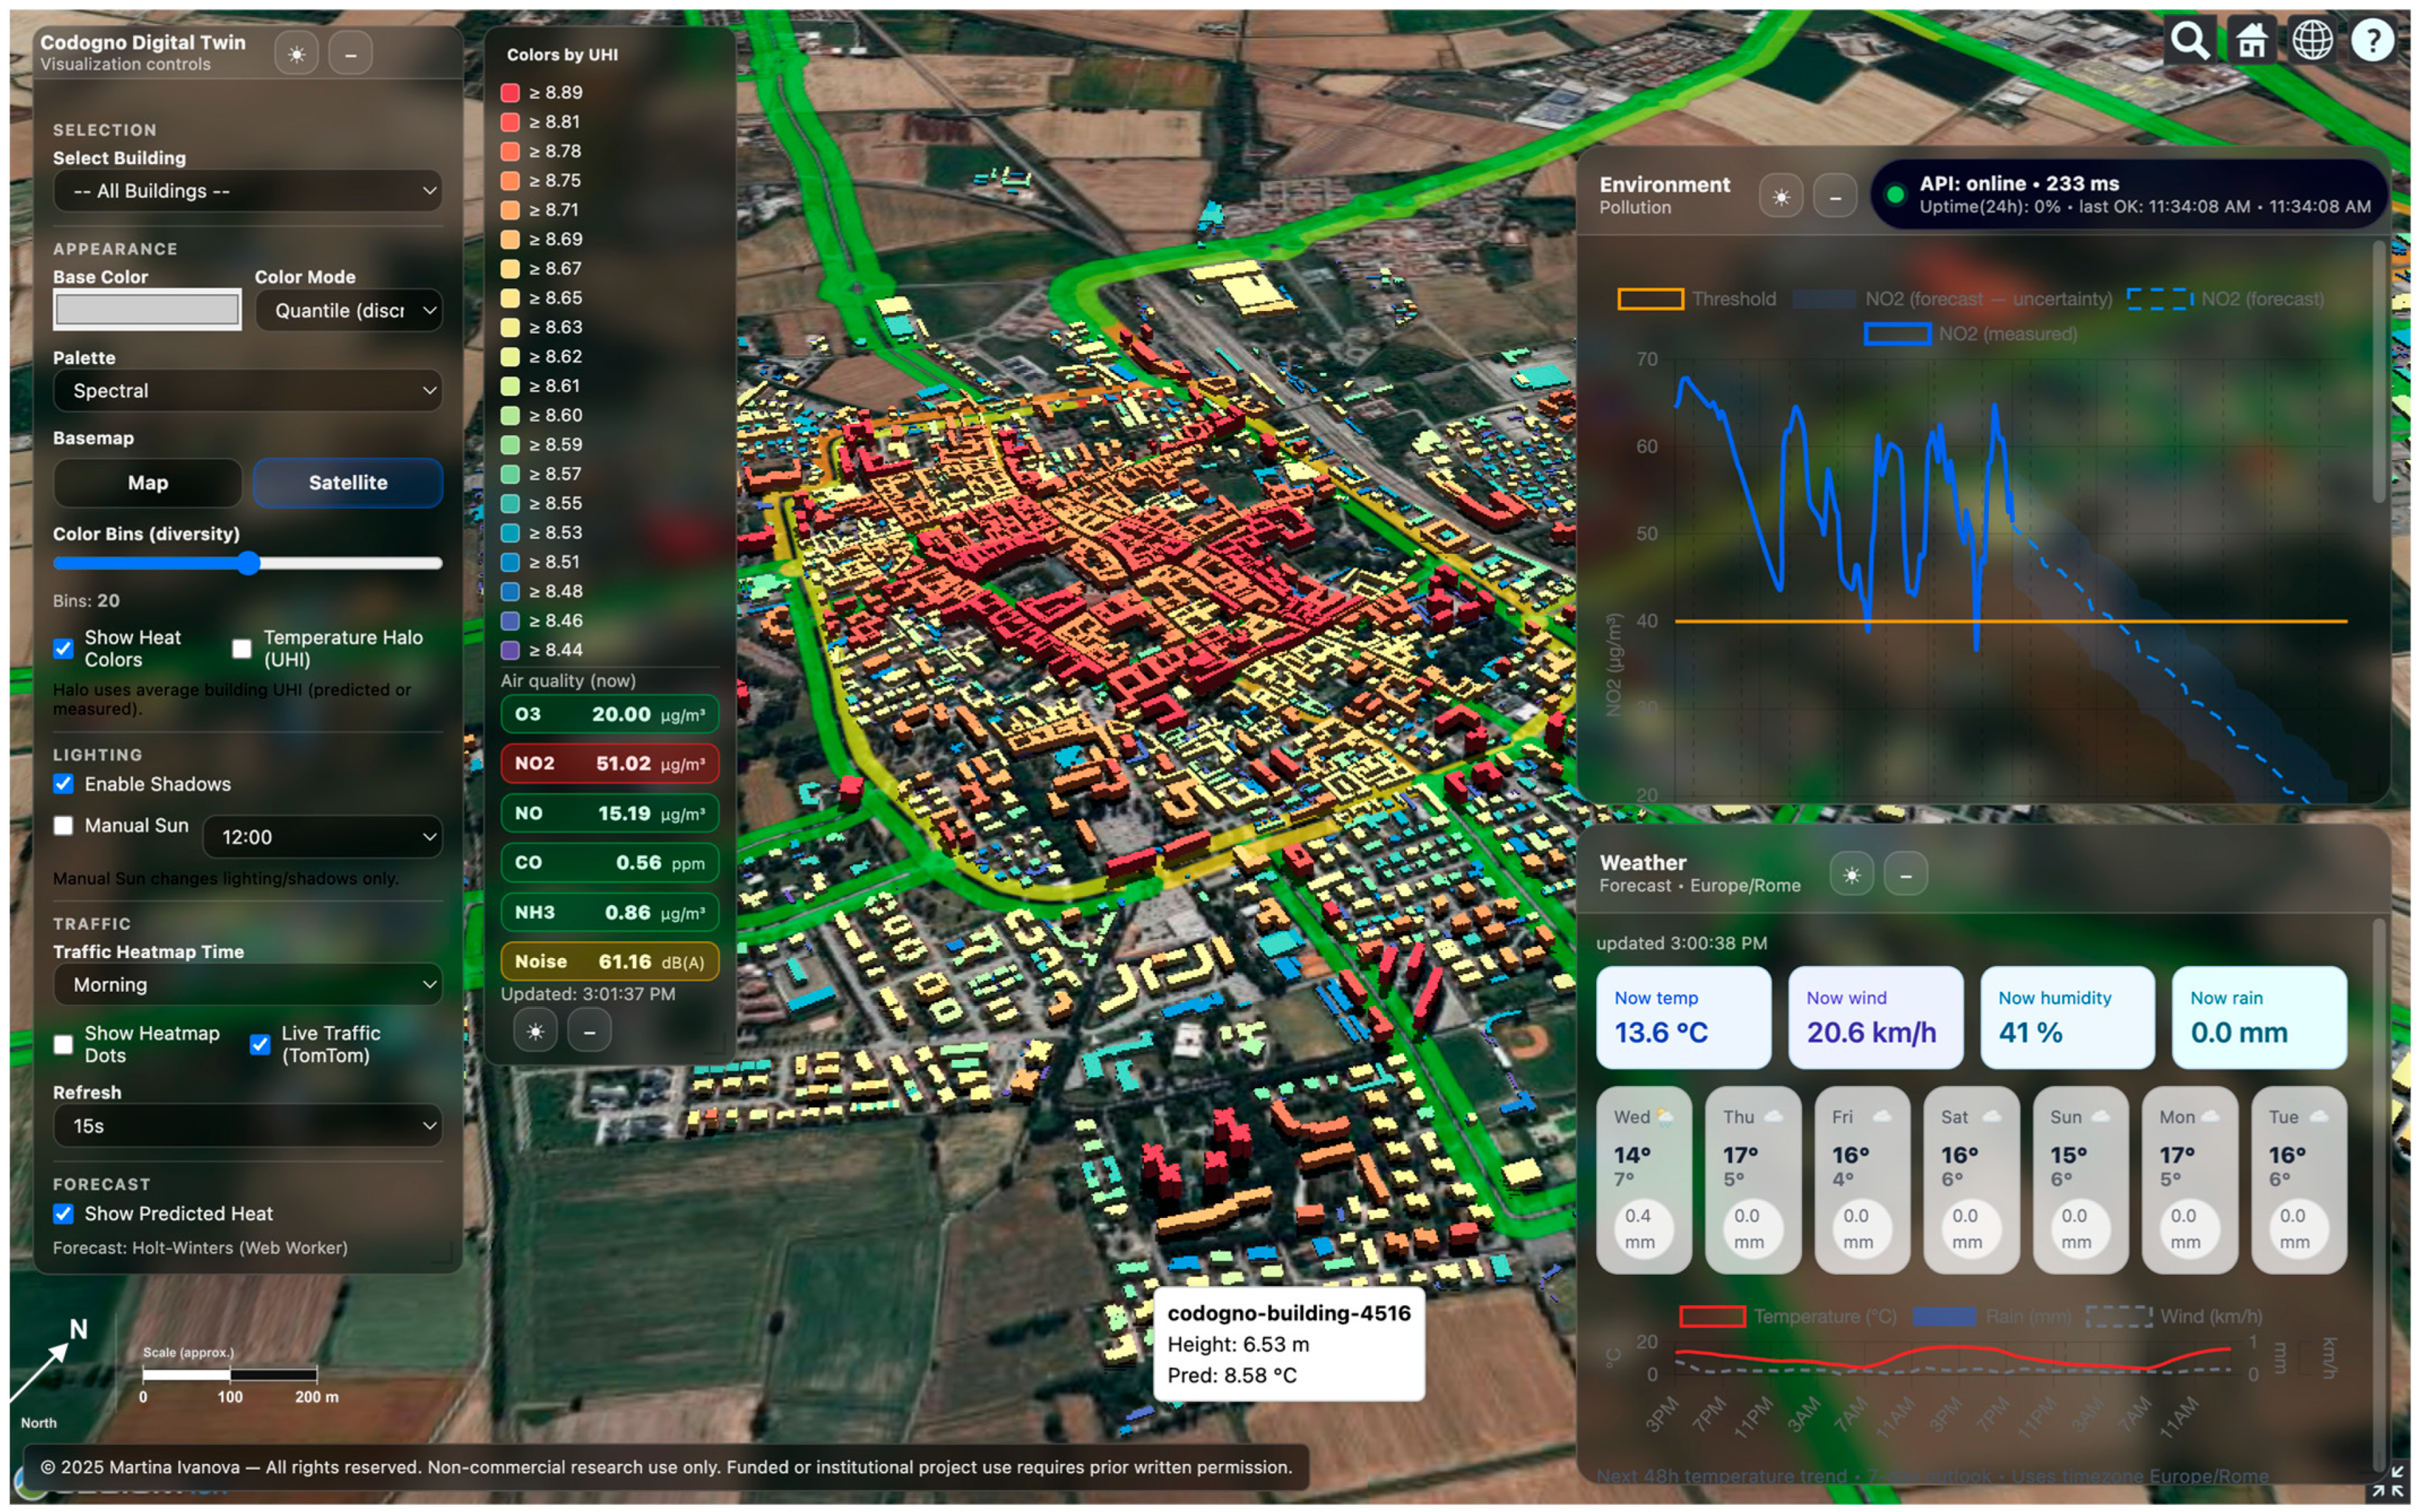
The user interface organization of the visualization components is a set of interactive panels allowing users to explore and analyze the DT environment (Figure 3). A control panel provides interface elements for adjusting visualization parameters. Users can also select individual buildings for more detailed analysis and toggle visual elements such as shadows. A legend panel displays the mapping between color classes and thermal values while also displaying real-time air quality indicators for major pollutants.
Additionally, the application includes a shadow/sunset control mechanism that sets the Cesium time to real-time or user-defined time (a specific hour of a day), to provide the user with a tool for controlled visual experiments. This also illustrates a methodological commitment to exploratory analysis: environment indicators are displayed in a spatial context that can be manipulated to aid in interpretation.
Besides the visualization interface, other interface panels allow access to environmental charts and multi-day weather forecasts. This creates a dense user interface compact enough to form a sort of analytical dashboard that is natively bound to the visualization interface.
Taken together, these components embody a lightweight but complete methodology for an LDT: a repeatable pipeline to bind public data feeds and city morphology and to output interactive and environmental intelligence at the building scale.

3.4. Cross-City Validation

The final part of our methodology was to validate replicability using the same architecture across other contexts. The methodology here was to take the exact same core platform (the context broker, generic ingestion code, analytics and UI), and try to use it with those cites’ data, tweaking the minimum components needed for the system to work in a different context. If Codogno’s twinning was built with a certain entityType (air-quality stations, traffic counters, etc.), we tried to find data from Varna and Lausanne to be used for populating that type in that places. This process was a good insight to test the interoperability of our approach: in an ideal scenario, it would just be a matter of plugging new data sources in the ingestion layer and seeing the outputs on the same UI structure.
The cross-city test was also a good opportunity to test scalability (Lausanne is much bigger than Codogno, so the data volumes—the number of buildings, traffic points, etc.—would be bigger). We avoided unnecessary and excessive use of complex middleware or enterprise systems: the methodology favored a lightweight approach for integration. In summary, we tried to combine best practices and a practical engineering process. By doing so, we are sure to have a well-grounded system: not only is it theoretically sound, but our decisions were informed by on-the-field requirements and usability.

4. Results and Evaluation

4.1. Quantitative Evaluation

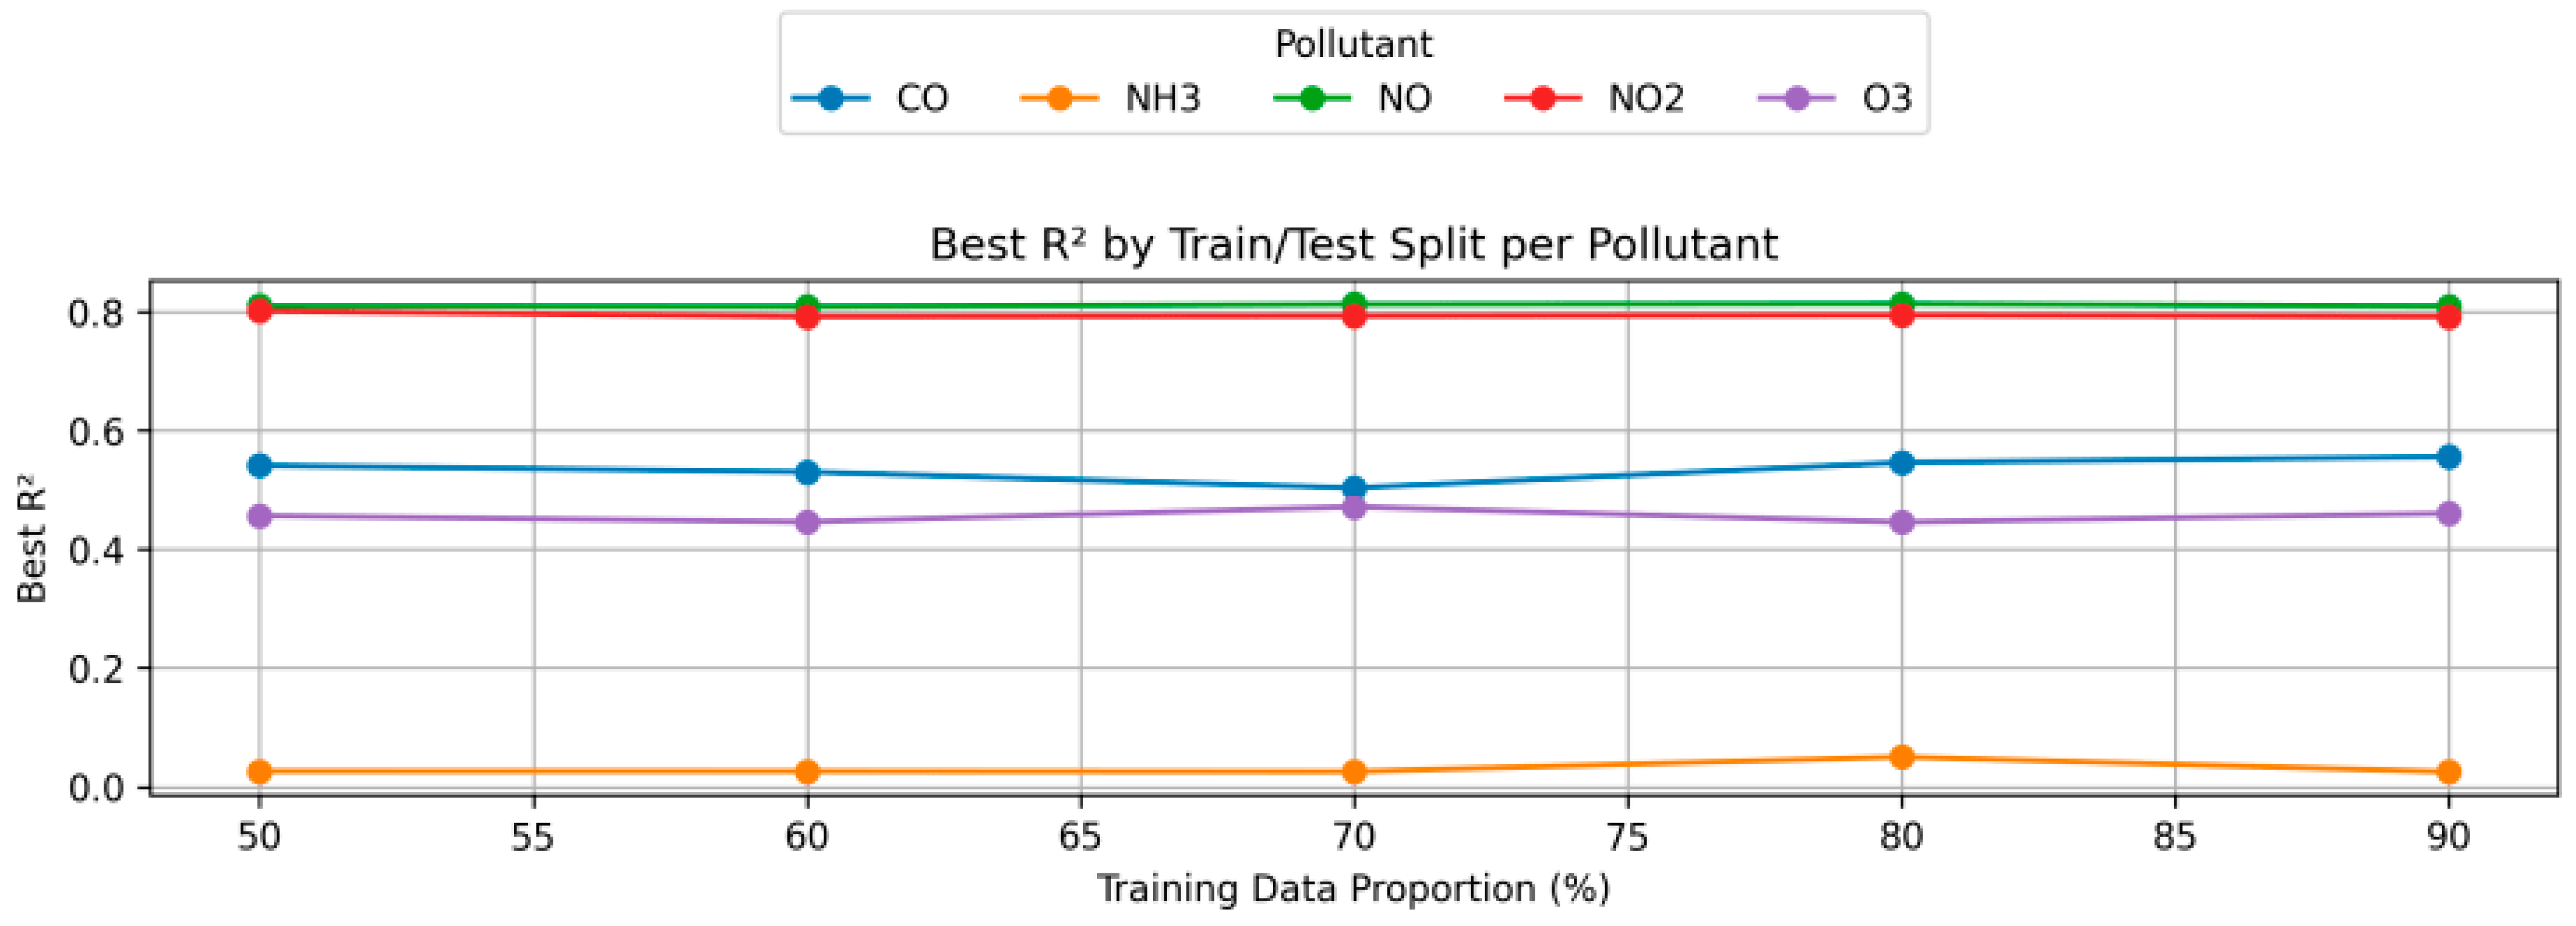
This section presents the validation results of the predictive models using standard performance metrics (R2, RMSE, MAE, and accuracy). The evaluation focuses primarily on the air quality module, as it relies heavily on exogenous predictors. The results in Figure 4 highlight a clear disparity in model performance, where NO and NO2 are consistently well-predicted, while NH3 remains poorly captured across all train/test splits, while Table 2 shows the best-performing algorithms, demonstrating that Random Forest and LightGBM provide consistently strong performance, particularly for NO and NO2, while NH3 is challenging to model regardless of algorithm choice.
Low variability and the relatively constant diurnally averaged CO concentration hampered the performance of several predictive algorithms to outperform the naive prediction. XGBoost with a 90% train–split configuration obtained the overall best results on CO forecasting. The second best performance was achieved by LightGBM.
Another good performance was shown by Random Forest and Extra Trees, while AdaBoost struggled with the worst results. Overall, boosted tree-based models were shown to be the most robust for CO forecasting.
NO concentrations featured some strong peaks in their temporal development while having relatively homogeneous concentrations. Owing to this, no obvious patterns based on time were available. Ensemble approaches had a better performance on this variable. The best results were achieved by Random Forest, explaining about 81% of the variance, which was closely followed by ExtraTrees and LightGBM. Gradient Boosting and KNN maintained a decent performance as well. Linear models, SVR and AdaBoost showed substantially poorer performance.
NH3 forecasting proved to be a more difficult exercise. The complex dynamics and heterogeneous sources of NH3 emissions, e.g., agricultural activities, resulted in an irregular temporal evolution of the concentration and made it hard to establish significant temporal trends, which can be employed as the input features for the predictive algorithms. We found that the best performance was achieved by LightGBM-based ensemble methods, like Gradient Boosting and LightGBM. However, the explanatory power of these methods remained relatively low. Several models obtained negative R2 values, indicating poor generalization.
The consistently low R2 of the ammonia (NH3) models needs a more in-depth diagnosis, as the breakdown lies more in the nature of the pollutant, rather than an unsuitable choice of algorithm. We identify some compounding factors. First, as far as emission sources are concerned, the relative importance of diffuse agricultural activity (livestock housing, slurry storage and fertilization application) compared to traffic and combustion operations (that drive NO, NO2 and CO) dominates the Codogno area NH3 emissions. These are episodic and weather-gated: the peaks in emissions follow the agricultural calendar and are modulated by soil moisture and wind transport from upwind farm-land, none of which are captured by the meteorological predictors currently used. Thus, the exogenous features responsible for carrying information on traffic-related pollutants carry little information about NH3. Second, as far as time-series characteristics are concerned, the measured signal of NH3 is highly skewed and intermittent, exhibiting short, irregular peaks on top of a low background. It demonstrates weak diurnal and seasonal autocorrelation; therefore, the lagged and calendar features that make NO and NO2 predictable carry almost no learnability, and the low signal-to-noise pushes squared-error learners onto the conditional mean, where they are easily beaten by the naive predictor (hence the negative R2 values). Several optimization strategies follow directly from this diagnosis, and are proposed for future iterations of the air-quality module. (i) Source-aware feature engineering: Introduce sectors based on wind direction to flag the transport from upwind agricultural land, an agricultural-activity calendar (fertilizer and manure-spreading time periods) and temperature–humidity interaction terms to control volatilization, so that the episodic emission regime is learnable. (ii) Introduce lagged and rolling temporal descriptors coupled with pollutant-specific hyperparameter tuning (instead of the common configuration used for all pollutants). (iii) Enrichment with external observations: Assimilate satellite NH3 column retrievals and use any additional low-cost sensors to counter the single-station sparsity, and extend the training record to capture further high concentration episodes. (iv) Honest uncertainty reporting: As point forecasts are unreliable for this pollutant, the platform ought to provide NH3 as prediction intervals (e.g., from quantile regression or conformal prediction), and flag low-confidence outputs, so that the decision-makers are not misled by a single deterministic value.
O3 prediction was another complex case. LightGBM achieved the best performance, and Extra Trees and XGBoost were next in line. Several models in this case also showed poor performance in terms of percentage error, especially KNN, Support Vector Regression, Random Forest and Gradient Boosting. Despite these drawbacks, the overall performance of the predictive algorithms on O3 forecasting proved to be satisfactory.
NO2 forecasting also showed good performance using ensemble methods. LightGBM proved to be the best model, with approximate 79% variance explained, followed closely by ExtraTrees, XGBoost and Random Forest, and achieved above average predictive accuracy, between 84 and 81%. Linear models performed at moderate levels in this case, while AdaBoost was one of the worst-performing models.
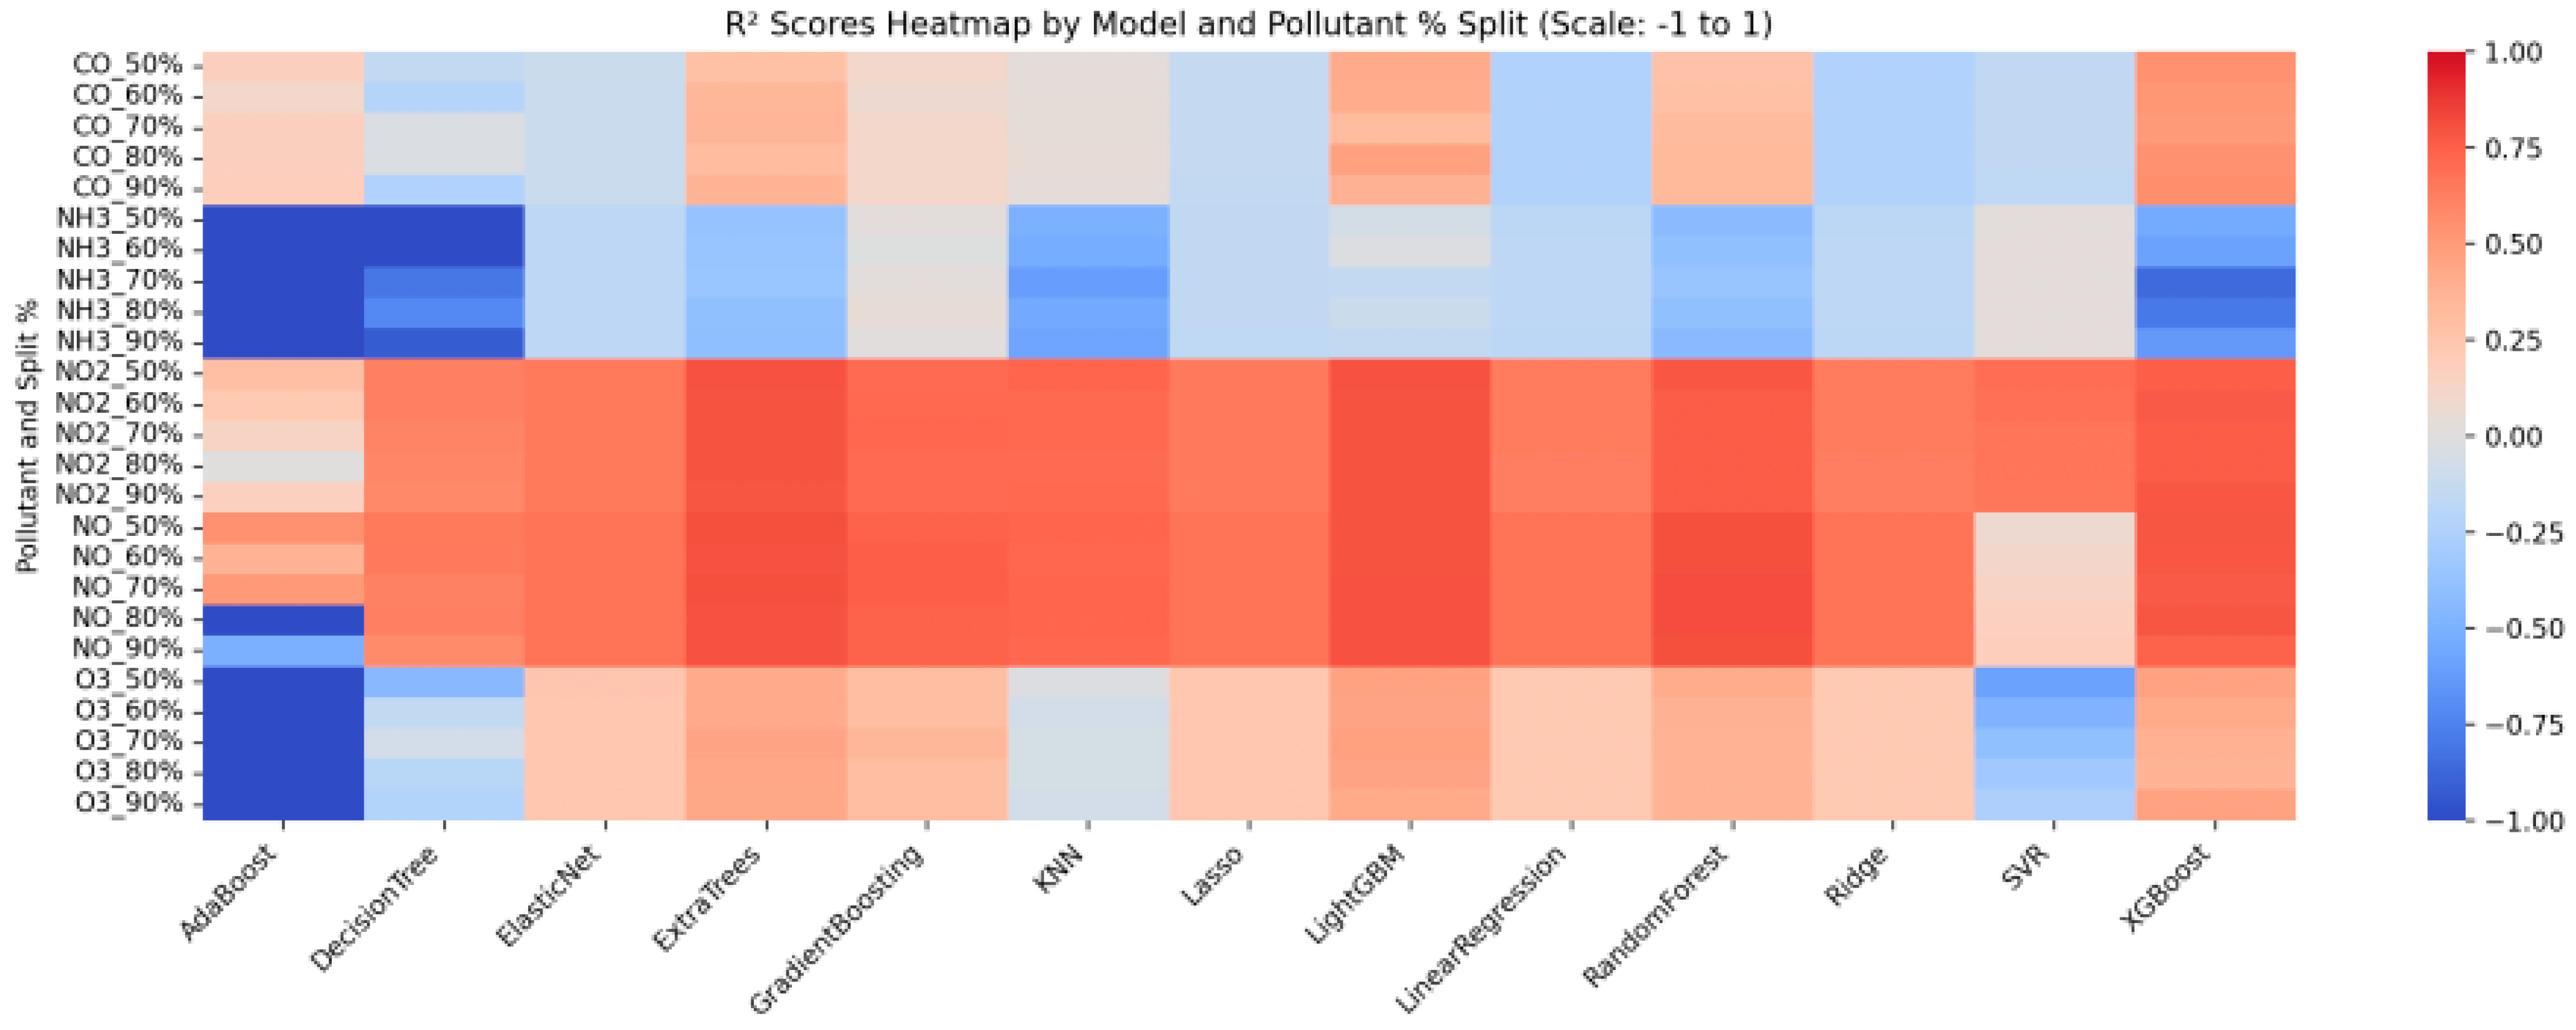
Overall, ensemble group tree algorithms, particularly LightGBM, XGBoost, Random forest, and Extra Trees, consistently outperformed other algorithms across pollutants, reflecting their effectiveness in modeling non-linear relationships in air-quality time-series. The heatmap at Figure 5 highlights this statement, especially for NO and NO2.

4.2. Qualitative Evaluation. Replicability, Scalability and Modularity

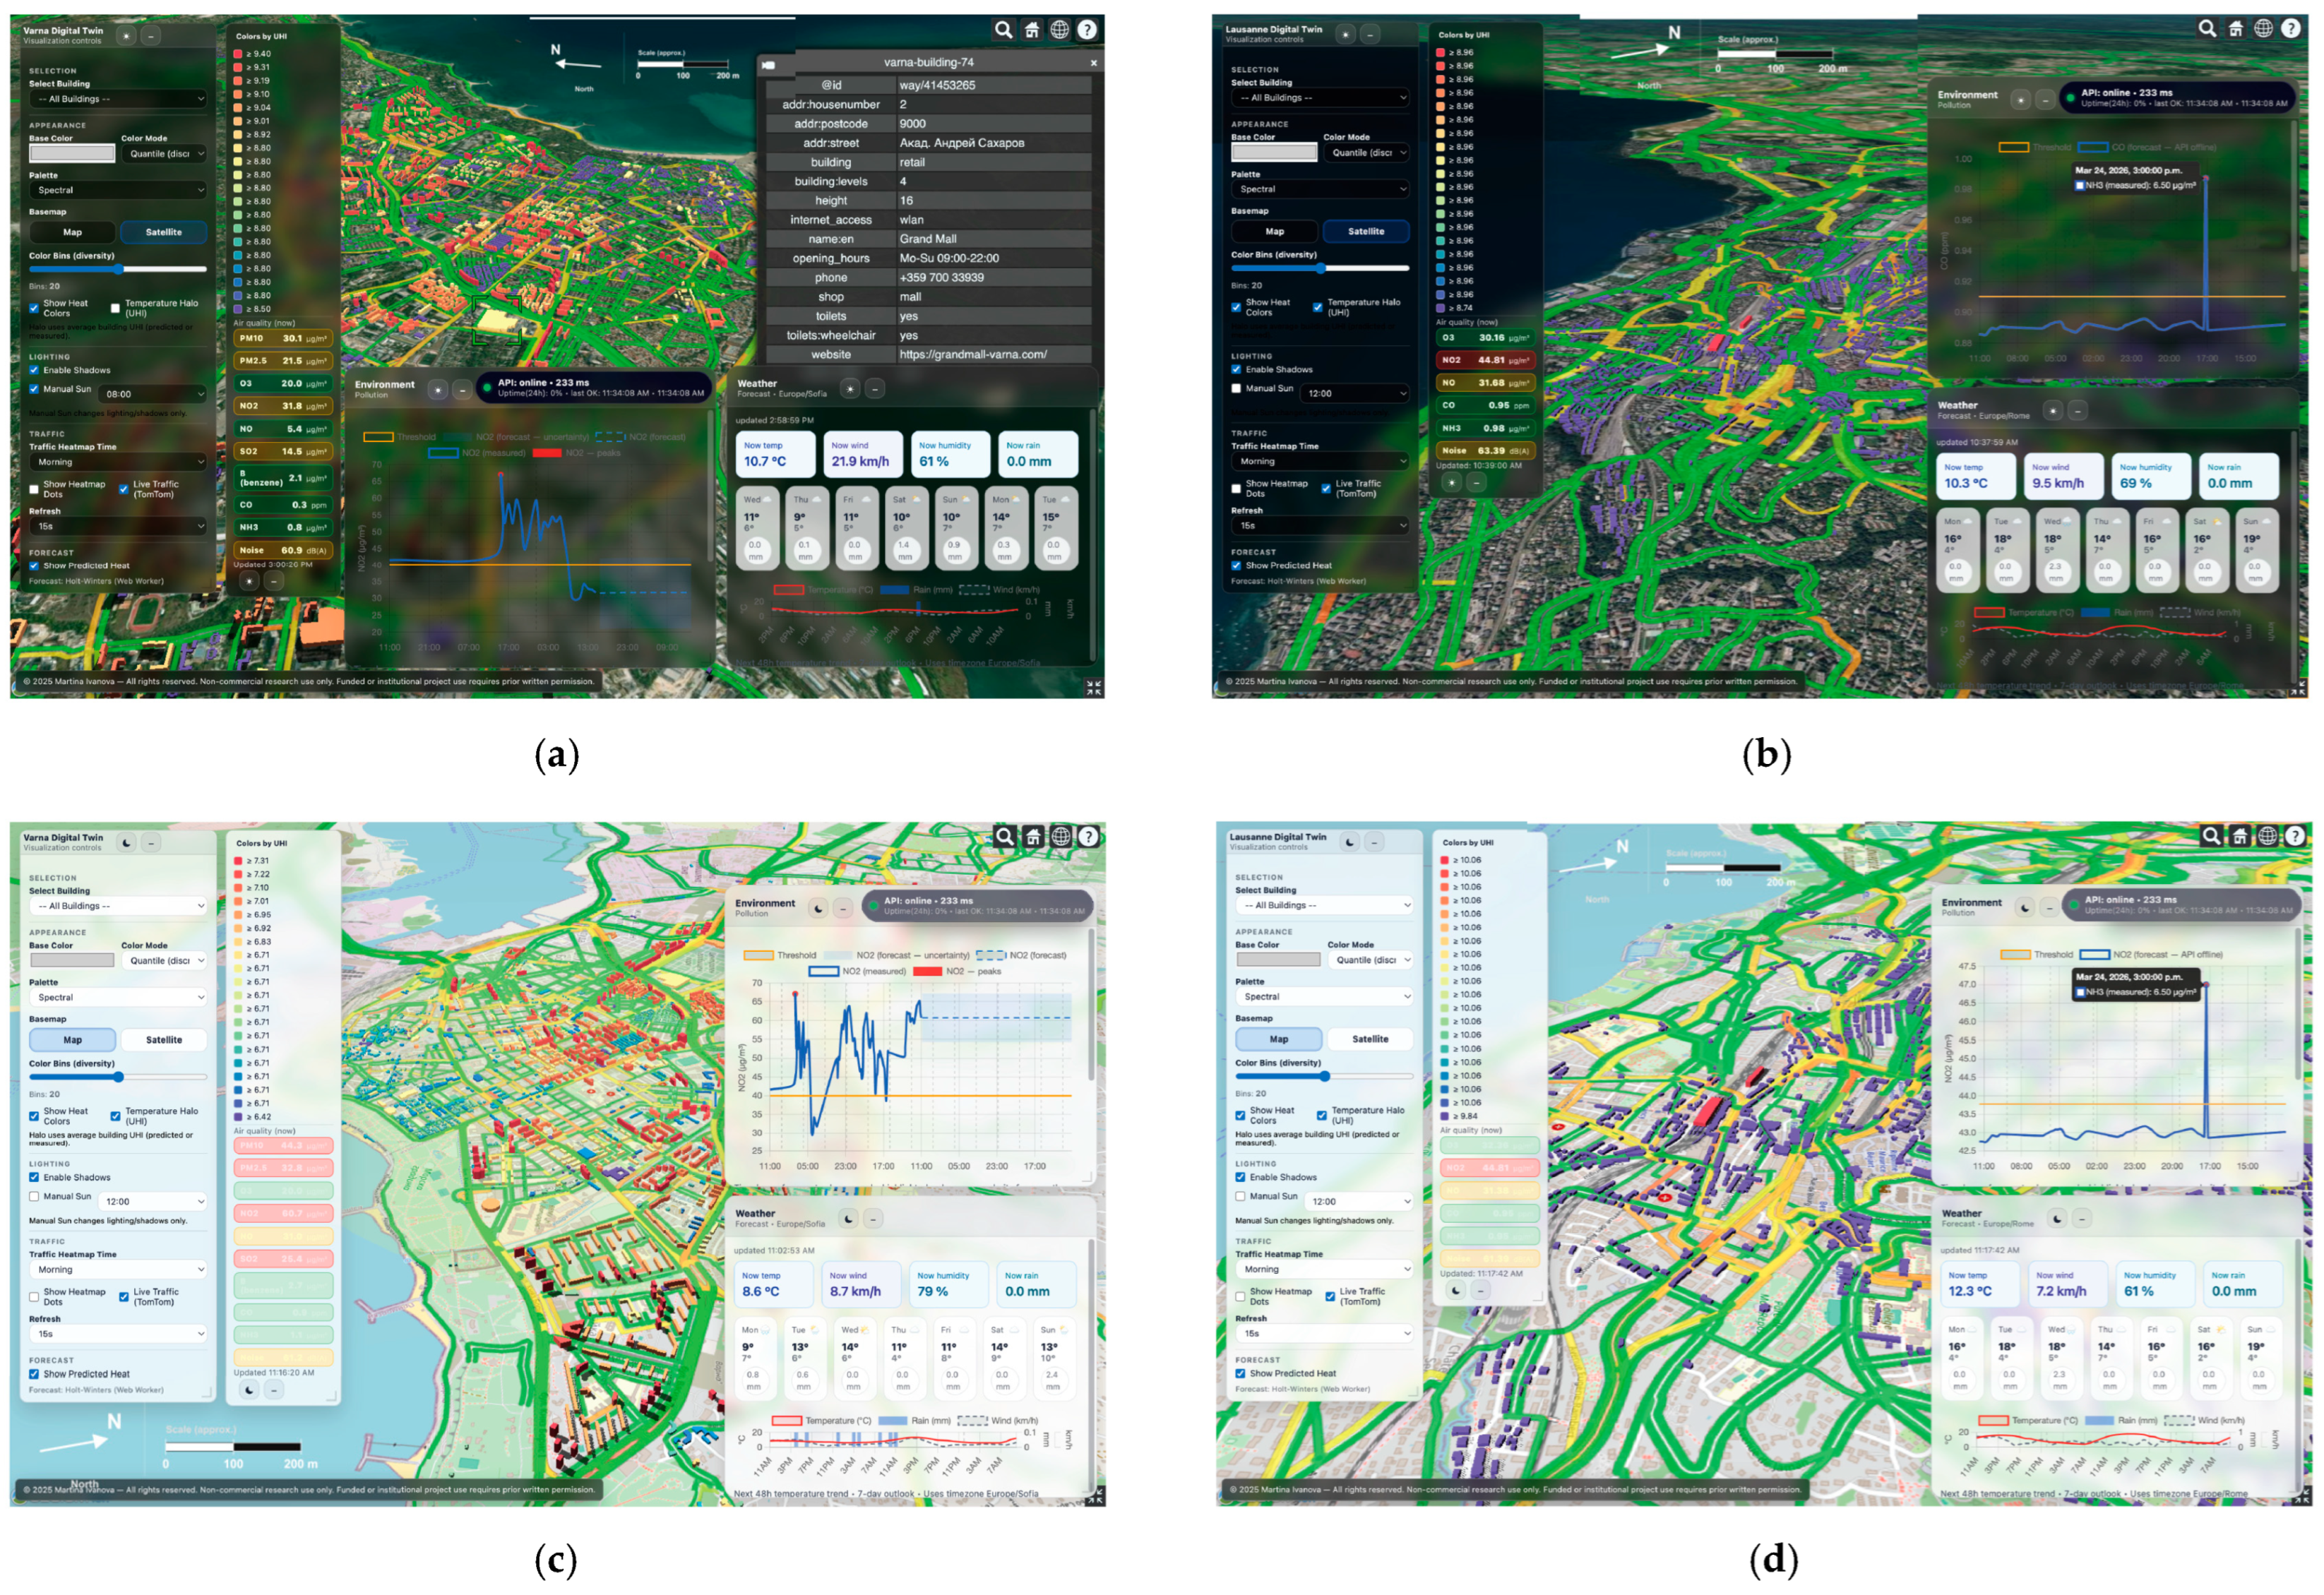
On the semantic side, using the standard definition, the data is self-descriptive. Every entity has a reference to the context. If one takes Codogno’s data in another environment, those contexts ensure the attribute meaning (units and relationships) is known. We see this phenomenon when porting to Varna and Lausanne (Figure 6). We did not rewrite the front-end and the analytics because we were able to use the same data schemas. They just worked out of the box after the data was ingested in the right way. This is semantic consistency, which is a hallmark of good interoperability.
The evaluation was, at its core, is our approach replicable: can someone else adopt it with relative ease and see a similar benefit? Thus, we have chosen two other cities:
Varna is a coastal city (~335,000 people), bigger than Codogno and a mix of urban and port-industrial environments. We chose Varna to test the scalability in a bigger context and also to see how the twin adapts to another city with a different climate (maritime). We worked with them to ingest Varna-specific data. Using our ingestion templates, we mapped the data sources of Varna and trained the existing algorithms to create the predictive pickle files to be injected subsequently. This process was a smooth one: it mostly involved changing the configuration (API endpoints, entity IDs, etc.) and minimal code changes. In a few minutes the Varna twin was running. The front-end UI simply pointed to the Varna context broker. Immediately, the UI was populated with Varna’s map, buildings and live data. This validated that our design is city-agnostic: all city-specific logic is in the data and not in the application. Performance-wise, Varna had more data streams.
Lausanne is a medium-sized city (~144,000 population). We worked to build up the twin based on the same architecture as the previous case studies. The goal was to see if the twin could be self-sufficient without having to train a machine-learning model; the twin was able to generate its analytics on its own using Holt–Winters. Based on our approach, within a short period of time, we were able, in a few minutes, to ingest the APIs. Lausanne‘s use case validated the scalability in complexity. This shows a cascading effect: the act of having this twin to replicate could be one of the pushing points to standardize in new directions, as recommended by FIWARE’s vision.
The key to replicability was the strict use of open standards and a generic design. The Varna and Lausanne deployments both established that we did this to not hard code assumptions into our system. Everything was data-driven: both these cities were able to deploy the same open-source broker with no licensing problems or delay in procurement. The analytical models, like the pollution forecast, had to be “adjusted/trained” to the location’s data, and that was what replicability meant in our case—providing the actual training process pipeline, not the exact model.
We demonstrated that multiple local twins could potentially each be nodes feeding into a higher-level system. The key here was to have the standard data models all relevant to the brokers respond in the same way to queries. That indicates this architecture is capable of scaling up in terms of breadth of use cases (add these types of analytics) without reworking the core architecture.

4.3. Limitations and Challenges

The evaluation would not be complete without noting a few caveats on limitations we have experienced.

4.3.1. Data Quality Sensory Uncertainty

Small, cheap sensors can drift and change over time. Our twin is not yet capable of robustly quantifying uncertainty. For academia, it should, in its next-generation versions, include confidence intervals (pollution value readings with ± error), although we did the calibration to reference values at the start of the evaluation. Nonetheless, ongoing calibration is complex, so we note this is a limitation: for academic rigorousness, we recommend avoiding making decisions solely on fine differences between the values, especially when the margins could be within sensor errors.

4.3.2. Sustainability of Maintenance

Although we maintain the LDT has low maintainability requirements, it does still require an individual to ensure the backend is kept up with and the data feeds are all still connected (as APIs do change over time). However, because it is all standard technology, getting anyone to know how to replace them should be feasible.

4.3.3. Scaling to High-Fidelity Simulation

Our twin has relatively simple models (the ML and the heuristics) but for high-accuracy and high-detail simulations, they typically require computational resources beyond a small edge device. However, that is a cost, as it does mean some level of detail you would expect in these simulations is lost. If needed, though, the architecture of the twin can be easily enhanced by plugging in some high-fidelity simulations on-demand, although that then introduces a cost/complexity which most small cities probably would not have the means for. Hence, our evaluation is that for small towns, the current approach is appropriate, whereas a large city could combine our approach with periodic high-fidelity analyses on some critical areas.
Moreover, replicability in a city that has neither interest in nor minimal IoT infrastructure might be possible, although it could end up being generalized. In essence, the largest barrier to replicability is not technical but organizational: convincing the right decision-makers in the city to adopt the solution.

4.3.4. Decision-Making Risk Under Computational Constraints

The reduction of heavy computation to make the twin cost-effective also provides specific risks to the decision-making process, which warrant explicit consideration in a small-town governance context. Because the bulk of the analytics involves lightweight estimation, many outputs are proxies and not measured facts: the pollutant fields at unmeasured locations are interpolated, heuristic estimators are used instead of the machine-learning models when the prediction backend is down, and—as described above—some species like NH3 are predicted with less confidence. In a municipality where one officer without specific data-science expertise might be the only person consulting the dashboard within the operation that must analyze it, the clear danger is automation bias, giving weight to a single deterministic value or to differences within sensor and model errors. The limited on-device budget also precludes high-fidelity “what-if” scenarios from being run in real time, so decisions that legitimately require such a fidelity (like regulatory enforcement or investment in infrastructure) might be exercised in light of evidence that is not fully resolved due to misunderstanding of the tool’s reach. We propose a set of adjustments proportionate to these limitations: visibly marking measured versus estimated quantities within the interface, providing indicators of uncertainty or confidence for predictions (see the NH3 prediction interval strategy above), keeping the human in the loop for any consequential action, noting the model provenance, update dates, and holding off the twin for screening, and situational awareness and prioritization for legally compelling decisions. In this framing, the computational limitations become an explicit design constraint instead of a latent risk originator.

5. Discussion

The results obtained for Codogno and its two replicas can now be read against the wider body of digital twin research. With respect to the predictive performance, the pattern we observe—strong skill for the traffic- and combustion-linked pollutants NO and NO2 (R2 ≈ 0.8), moderate skill for CO and O3, and weak skill for NH3—is consistent with the air-quality and urban twin literature, in which secondary and agriculturally driven species such as ammonia are routinely the hardest to model. Teutscher et al. [3] achieve physically grounded pollution fields by coupling their urban twin to lattice-Boltzmann computational fluid dynamics; our approach trades that physical fidelity for a purely data-driven ensemble that runs without high-performance computing, an acceptable compromise for the monitoring-and-screening purpose of a small municipality. The dominance of boosted and bagged tree ensembles (LightGBM, XGBoost, Random Forest, and Extra Trees) in our experiments also mirrors the consensus in recent environmental machine-learning studies, which supports the external validity of the modeling choices rather than suggesting an idiosyncratic result.
With respect to architecture and robustness, our edge-oriented design echoes the central finding of the cloud–fog and edge digital twin literature—Knebel et al. [7], Picone et al. [14] and Alanezi and Mishra [15]—that relocating computation toward the edge materially reduces latency and dependence on the cloud (with reported response-time reductions exceeding 50%). The novelty here is that we reach comparable responsiveness without provisioning any dedicated edge or server hardware, by executing forecasting in a Web Worker and persisting state in the browser; robustness is obtained through graceful degradation (heuristic fallback estimators and offline localStorage persistence) rather than through redundant infrastructure. On the interoperability side, the fact that the Varna and Lausanne front-ends and analytics functioned unchanged on standardized data schemas reproduces, at a small-town scale, the benefits that Bauer et al. [19] and Conde et al. [20,21] report for FIWARE/NGSI-LD in larger cities, and provides the empirical, multi-city validation that several of those works identify as missing.
Taken together, these comparisons indicate that the contribution of this work is less a gain in raw predictive accuracy—where it is on par with comparable data-driven twins—and more a demonstration that an interoperable, replicable twin can be delivered under severe resource constraints. The principal trade-off, discussed further in the limitations, is reduced simulation fidelity; the principal advantage is a transparent, low-cost and portable workflow whose robustness has been tested across three heterogeneous urban contexts.

6. Conclusions and Future Work

6.1. Conclusions

The deployment of the Codogno local digital twin, and its replication in Varna and Lausanne, informs on several aspects of how the DT technology can be harnessed in the built environment at the city scale (with a focus on smaller areas). We reflect on the implications of our approach, including how it aligns or strays from the paradigms we are familiar with, as well as how this relates to the larger movement for smart, data-driven cities.
One of the main messages of our work is that city digital twins are not only large, tech-driven and domain-focused. We showed that a city with limited resources can benefit from the sophisticated integration of data and modeling to inform decisions. The key enabler here was the use of open, interoperable solutions and a low-infrastructure approach. By leveraging the open-source nature of our software components, as well as using standard APIs, we were able to lower the technical barriers. By operating on local hardware and using edge processing, we minimized the amount of cloud resources needed and made the twin more robust. This is an important contribution since much of the DT literature is focused on high-end implementations, which require large budgets. Therefore, our work fills the gap by focusing on the replicability and scalability downwards (i.e., to smaller contexts), which, in practice, are equally as important as the scalability upwards. Given the number of small and medium towns in Europe and worldwide which could benefit from such technology, if we are able to make this technology more accessible, our work would provide a blueprint for them.
Within an urban planning perspective, it provides a form of city-scale observation which was previously lacking. Planners typically depend on periodic surveys or static models when making decisions. A live twin could complement this with continuous, up-to-date insight and the capacity to virtually test scenarios in the near future.
Our twin enabled cross-departmental discussions, which is a positive result beyond the technical metrics. The decision to align with reference standards paid a dividend in regard to replicability and integration. This not only saves resources, but it also opens the door for a communitive advancement: cities can share not just data, but also applications. Our results hint at future networks of local digital twins combined to form larger, federated systems [28]. Each local twin fulfils a mission of its immediate community’s needs, but also feeds into a greater one. This could add significant value to region-based planning related to emerging European data spaces, a concept that places data sovereignty at the local level of cities, but also contributing to shared pools of data for the benefit of the community.

6.2. Future Work

As they stand now in their current state, the city digital twins of today are still largely based on monitoring and prediction. To expand the digital twin into a cyber-logical system of the future, the development of actuation and control mechanisms are required. This may involve automatic or semi-automatic triggering for warnings that will be displayed on the urban information systems, controlling the timings of responses to predicted conditions. These features, however, need to be implemented with care and consideration. There should be robust governance frameworks and safeguards in place to deal with the risks of such automated decision-making in a public environment. Concretely, such a control and early-warning module would be instantiated as a top-level additional sandboxed layer over the pre-existing event stream: forecast-derived values generated by the Web Worker (or the cloud model) would be scored against configurable thresholds in a lightweight rules engine, and a typed alert would be emitted each time the threshold is reached, to which the municipal channels would react—e.g., variable message signs, a public web banner or an operator e-mail/SMS gateway. Real closed-loop actuation, such as traffic-signal timing adjustments or the issuing of air-quality advisories, could in addition require a bidirectional bridge to the governing control system and a staged rollout: shadow mode (recommendations only) followed by actuation confirmed by a human agent, and far later, any supervised automation. The key practical restrictions are on the limited reliability of some underlying forecasts (this favors conservative thresholds and hysteresis to avoid false alarms), the legal accountability attached to automated public acts, and the cyber-security of the actuation channel and failsafe defaults ensuring that a worker crash or network outage puts the city networks back onto their (manual) default setting.
Adding socio-economic aspects into the scope of the project for future versions is another promising line of research. Since the present development of the LDT focuses on data that affects the environment and infrastructure, this could be expanded to include data on population, energy usage and urban activity. Technically, this integration would be achieved by introducing new entity types and FIWARE Smart Data Model schemas (e.g., for the population, building energy performance, mobility demand and socio-economic indicators), ingested from open municipal and national statistical portals—such as ISTAT, Eurostat census grids and open energy–cadastre datasets (which is why open and accessible data spaces are essential)—through the matching templated ingestion layers currently used for the environmental feeds. These would be combined with current building and administrative-boundary geometries via shared identifiers to produce composite indicators such as the per-capita pollutant exposure and energy-poverty hotspots and accessibility scores; this data would then be computed and visualized in-line with the 3D model. The key limitations are the rougher spatial and temporal resolution of socio-economic data (often available only annually and at the census tract rather than building level), privacy and aggregation requirements which prevent individual-level records and reconciling disparate update cycles; analogous to the environmental layers, explicit documentation on provenance and uncertainty would be a pre-requisite for such indicators to feed into decisions.

Author Contributions

Conceptualization, M.I.; Methodology, M.I. and A.C.; Software, M.I.; Validation, M.I. and A.C.; Formal analysis, M.I. and A.C.; Investigation, M.I. and A.C.; Resources, M.I.; Data curation, M.I.; Writing—original draft, M.I.; Writing—review and editing, A.C.; Visualization, M.I.; Supervision, A.C.; Project administration, A.C. All authors have read and agreed to the published version of the manuscript.

Funding

This research received no external funding.

Institutional Review Board Statement

Not applicable.

Informed Consent Statement

Not applicable.

Data Availability Statement

The original contributions presented in this study are included in the article. Further inquiries can be directed to the corresponding author.

Conflicts of Interest

The authors declare no conflicts of interest.

References

  1. Bettencourt, L.M. Recent Achievements and Conceptual Challenges for Urban Digital Twins. Nat. Comput. Sci. 2024, 4, 150–153. [Google Scholar] [CrossRef] [PubMed]
  2. Grieves, M.; Vickers, J. Digital Twin: Mitigating Unpredictable, Undesirable Emergent Behavior in Complex Systems. In Transdisciplinary Perspectives on Complex Systems; Springer: Cham, Switzerland, 2017. [Google Scholar]
  3. Teutscher, D.; Bukreev, F.; Kummerländer, A.; Simonis, S.; Bächler, P.; Rezaee, A.; Hermansdorfer, M.; Krause, M.J. A Digital Urban Twin Enabling Interactive Pollution Predictions and Enhanced Planning. Build. Environ. 2025, 281, 113093. [Google Scholar] [CrossRef]
  4. Batty, M. Digital Twins. Environ. Plan. B Urban Anal. City Sci. 2018, 45, 817–820. [Google Scholar]
  5. Lu, Q.; Xie, X.; Parlikad, A.K.; Schooling, J.M. Digital Twin-Enabled Anomaly Detection for Built Asset Monitoring in Operation and Maintenance. Autom. Constr. 2020, 118, 103277. [Google Scholar] [CrossRef]
  6. Raghavan, S.; Simon, B.Y.; Lee, Y.L.; Tan, W.L.; Kee, K.K. Data Integration for Smart Cities: Opportunities and Challenges. In Computational Science and Technology; Springer: Singapore, 2020; pp. 393–403. [Google Scholar]
  7. Knebel, F.P.; Wickboldt, J.A.; Freitas, E.P. A Cloud-Fog Computing Architecture for Real-Time Digital Twins. arXiv 2021, arXiv:2012.06118. [Google Scholar]
  8. Somma, A.; Amalfitano, D.; Benedictis, A.D.; Pelliccione, P. TwinArch: A Digital Twin Reference Architecture. J. Syst. Softw. 2026, 231, 112613. [Google Scholar]
  9. Juarez, M.G.; Giret, A.; Botti, V. Semantic and Modular Orchestration of AI-Driven Digital Twins for Industrial Interoperability and Optimization. J. Ind. Inf. Integr. 2025, 48, 100959. [Google Scholar] [CrossRef]
  10. Kang, M.-S.; Lee, D.-H.; Bajestani, M.S.; Kim, D.B.; Noh, S.D. Edge Computing-Based Digital Twin Framework Based on ISO 23247 for Enhancing Data Processing Capabilities. Machines 2025, 13, 19. [Google Scholar]
  11. Zhang, J.; Ellwein, C.; Heithoff, M.; Michael, J.; Wortmann, A. Digital Twin and the Asset Administration Shell: An Analysis of the Three Types of AASs and Their Feasibility for Digital Twin Engineering. Softw. Syst. Model. 2025, 24, 771–793. [Google Scholar]
  12. Kondo, R.E.; Andrade, W.J.; de Mello Henequim, C.; Lazzaretti, A.E.; Junior, A.D.; Loures, E.D.; Santos, E.A.; Reynoso-Meza, G. An Industrial Edge Computing Architecture for Local Digital Twin. Comput. Ind. Eng. 2024, 193, 110257. [Google Scholar] [CrossRef]
  13. Hildebrandta, J.; Leibla, L.M.; Habicha, D.; Lehnera, W. Development and Evaluation of a FIWARE-Based Digital Twin Prototype for Road Systems. In CEUR Workshop Proceedings; CEUR: Aachen, Germany, 2024. [Google Scholar]
  14. Picone, M.; Mamei, M.; Zambonelli, F. A Flexible and Modular Architecture for Edge Digital Twin: Implementation and Evaluation. ACM Trans. Internet Things 2023, 4, 1–32. [Google Scholar] [CrossRef]
  15. Alanezi, K.; Mishra, S. Towards a Scalable Architecture for Building Digital Twins at the Edge. In ACM/IEEE Symposium on Edge Computing; Association for Computing Machinery (ACM): Wilmington, DE, USA, 2023; pp. 639–644. [Google Scholar]
  16. Nwogu, C.; Lugaresi, G.; Anagnostou, A.; Matta, A.; Taylor, S.J. Towards a Requirement-Driven Digital Twin Architecture. In 55th CIRP Conference on Manufacturing Systems; Elsevier: Amsterdam, The Netherlands, 2022; pp. 758–763. [Google Scholar]
  17. Abdel-Aty, T.A.; Negri, E.; Galparoli, S. Asset Administration Shell in Manufacturing: Applications and Relationship with Digital Twin. IFAC-PapersOnLine 2022, 55, 2533–2538. [Google Scholar] [CrossRef]
  18. Yallıç, F.; Albayrak, Ö.; Ünal, P. Asset Administration Shell Generation and Usage for Digital Twins: A Case Study for Non-Destructive Testing. In Proceedings of the 3rd International Conference on Innovative Intelligent Industrial Production and Logistics (ETCIIM); SciTePress: Setúbal, Portugal, 2022; pp. 299–306. [Google Scholar] [CrossRef]
  19. Bauer, M.; Cirillo, F.; Fürst, J.; Solmaz, G.; Kovacs, E. Urban Digital Twins—A FIWARE-Based Model. Automatisierungstechnik 2021, 69, 1106–1115. [Google Scholar]
  20. Conde, J.; Munoz-Arcentales, A.; Alonso, Á.; Huecas, G.; Salvachúa, J. Collaboration of Digital Twins through Linked Open Data: Architecture with FIWARE as Enabling Technology. IT Prof. 2022, 24, 41–46. [Google Scholar] [CrossRef]
  21. Conde, J.; Munoz-Arcentales, A.; Alonso, Á.; López-Pernas, S.; Salvachúa, J. Modeling Digital Twin Data and Architecture: A Building Guide with FIWARE as Enabling. IEEE Internet Comput. 2022, 26, 7–14. [Google Scholar]
  22. FIWARE Foundation. FIWARE for Smart Cities and Territories: A Digital Future for Cities and Communities; FIWARE Foundation: Berlin, Germany, 2021; Available online: https://www.fiware.org/wp-content/directories/marketing-toolbox/material/FIWAREBrochure_SmartCities.pdf (accessed on 27 June 2026).
  23. Industrial Digital Twin Association (IDTA). Specification of the Asset Administration Shell: Part 1—Metamodel; Industrial Digital Twin Association: Frankfurt, Germany, 2023. [Google Scholar]
  24. ISO 23247-1:2021; Automation Systems and Integration—Digital Twin Framework for Manufacturing—Part 1: Overview and General Principles. International Organization for Standardization (ISO): Geneva, Switzerland, 2021.
  25. Moyne, J.; Qamsane, Y.; Balta, E.C.; Kovalenko, I.; Faris, J.; Barton, K.; Tilbury, D.M. A Requirements Driven Digital Twin Framework: Specification and Opportunities. IEEE Access 2020, 8, 107781–107801. [Google Scholar] [CrossRef]
  26. Wang, Z.; Gupta, R.; Han, K.; Wang, H.; Ganlath, A.; Ammar, N.; Tiwari, P. Mobility Digital Twin: Concept, Architecture, Case Study, and Future Challenges. IEEE Internet Things J. 2022, 9, 17452–17467. [Google Scholar] [CrossRef]
  27. Open & Agile Smart Cities (OASC). MIMs Plus Technical Specifications Final Version 4 Released; OASC: Brussels, Belgium, 2021; Available online: https://oascities.org/mims-plus-technical-specifications-final-version-4-released/ (accessed on 27 June 2025).
  28. European Commission. Local Digital Twins Toolbox; European Commission: Brussels, Belgium, 2024. Available online: https://interoperable-europe.ec.europa.eu/collection/ldttoolbox (accessed on 27 June 2026).
  29. Lee, J.; Bagheri, B.; Kao, H.-A. A Cyber-Physical Systems Architecture for Industry 4.0-Based Manufacturing Systems. Manuf. Lett. 2015, 3, 18–23. [Google Scholar] [CrossRef]
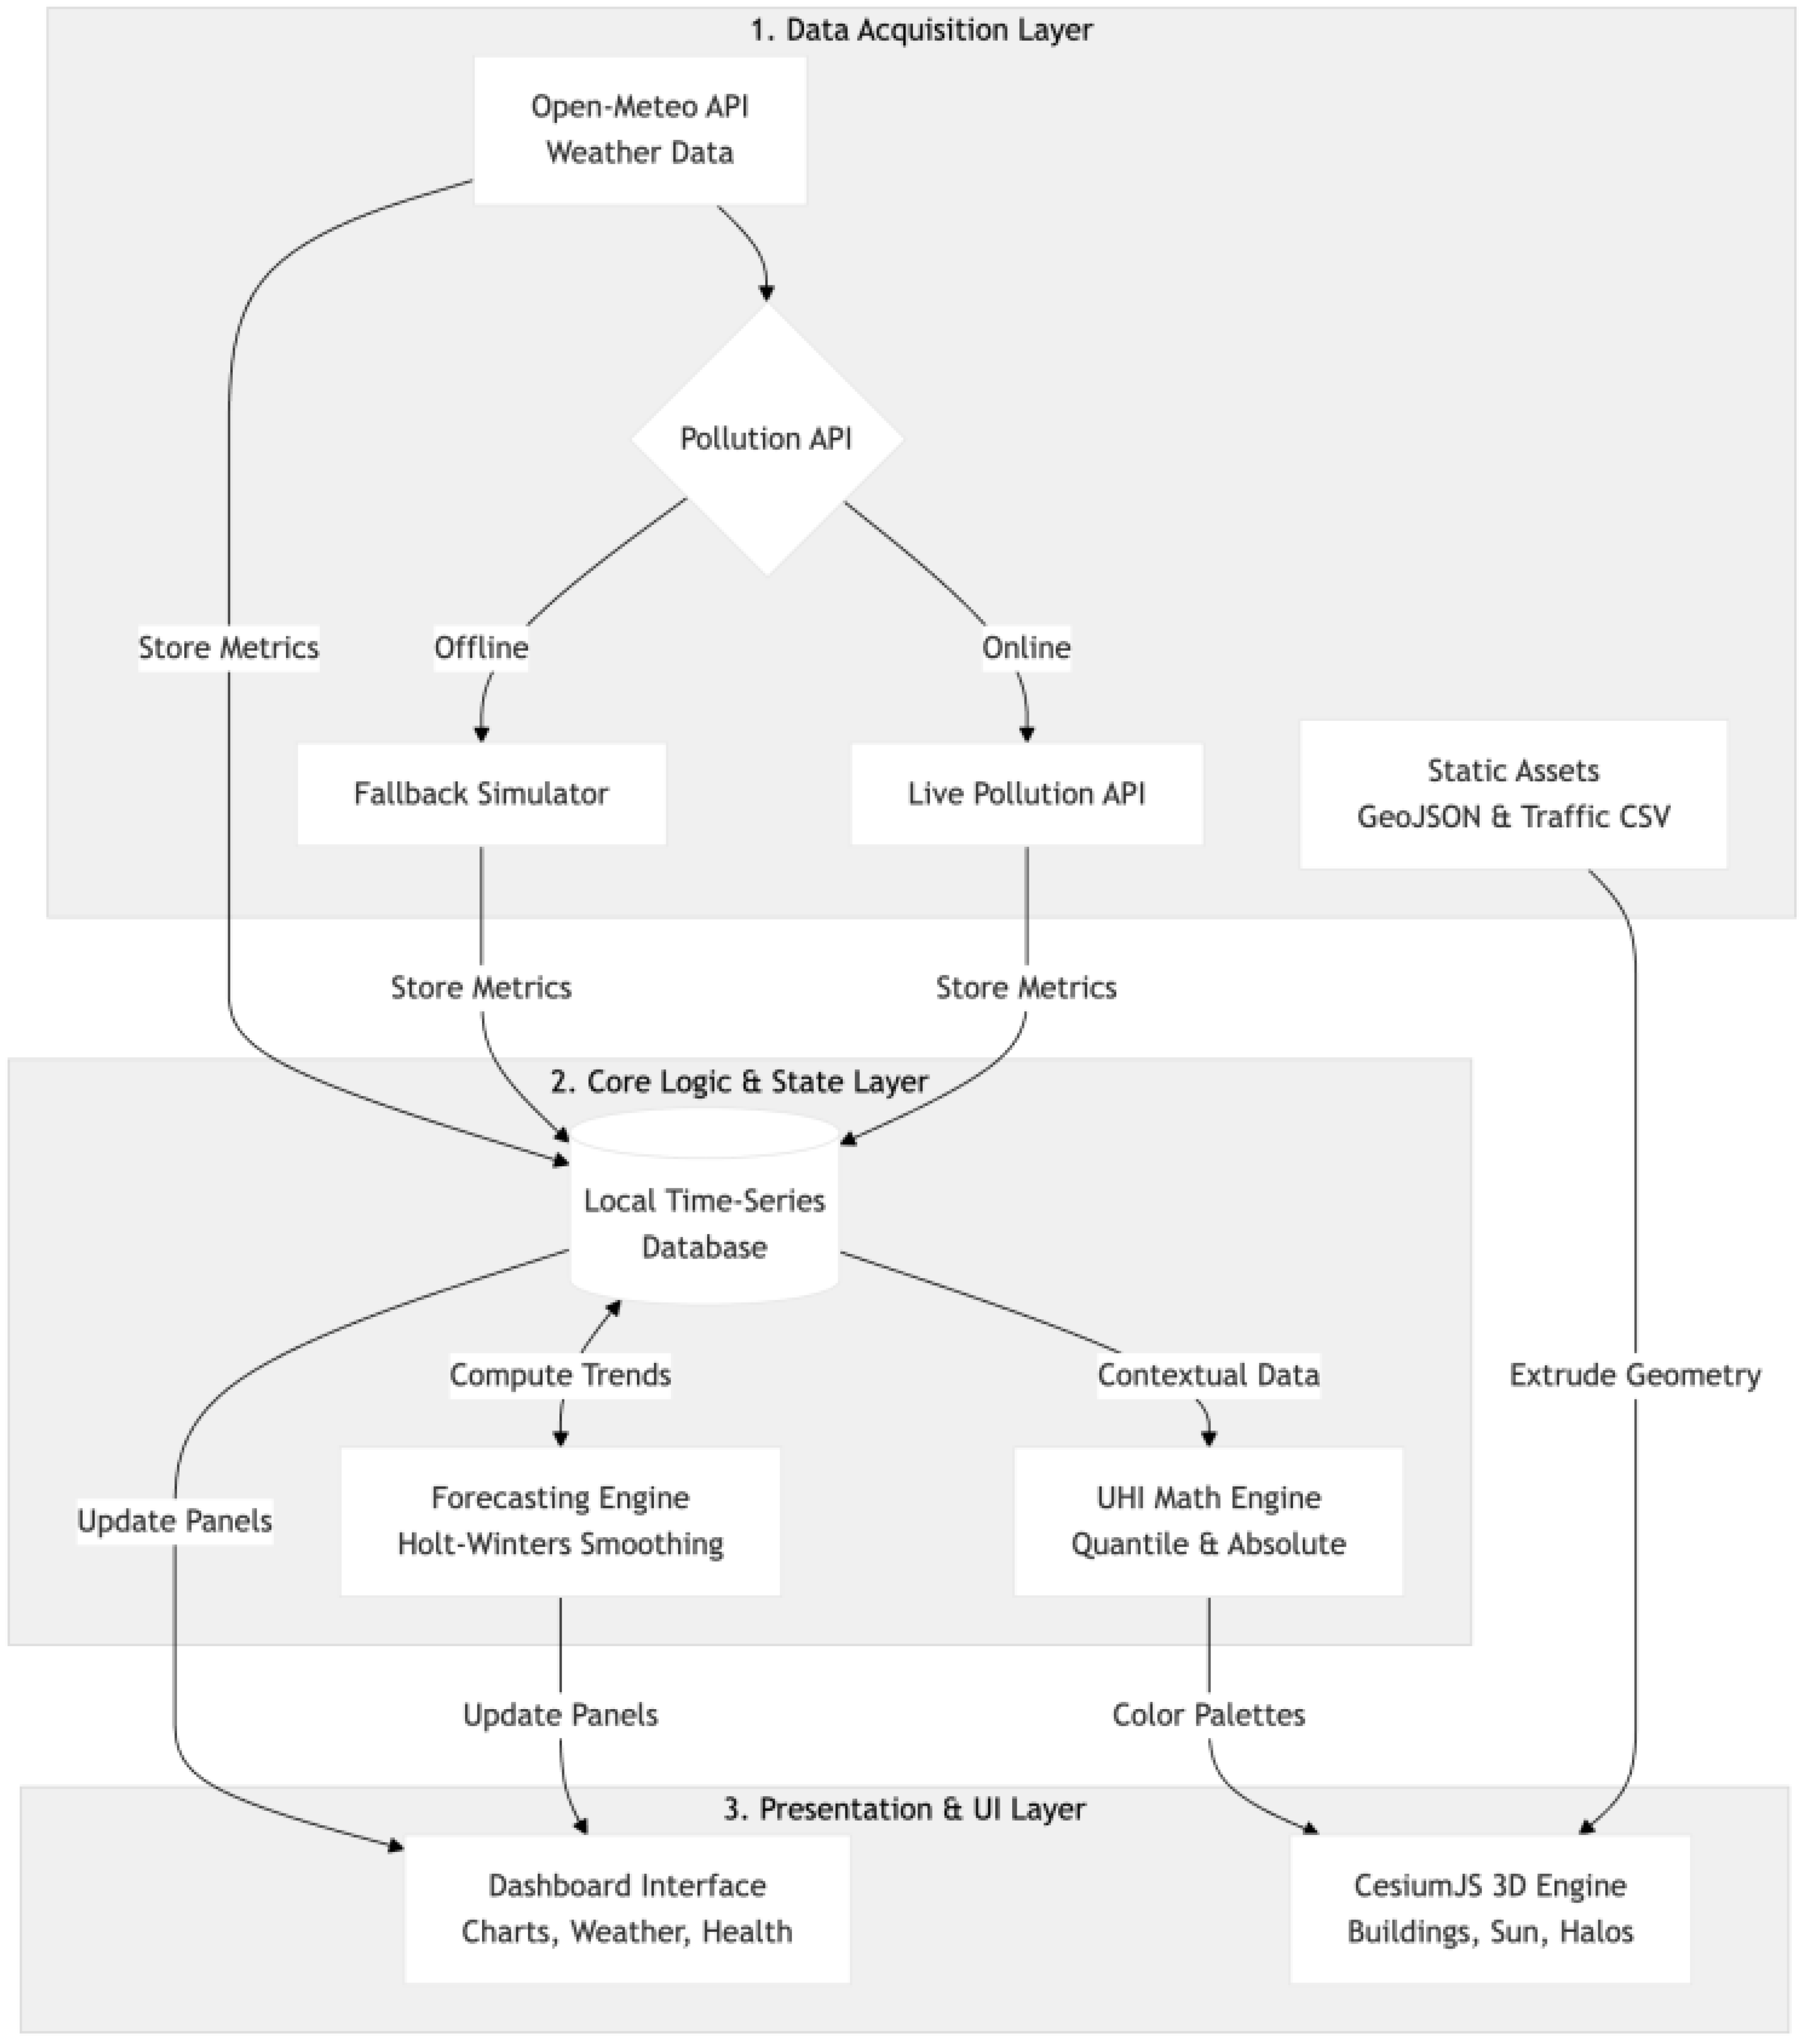
Figure 1. The local digital twin system architecture showing a three-layer pipeline with integrated data acquisition, fallback mechanisms for API unavailability, centralized state management, and real-time visualization through an interactive dashboard and 3D engine. The three layers correspond to (i) data acquisition from open APIs and static geospatial sources, (ii) edge processing with centralized in-browser context and state management, and (iii) rendering. Solid arrows denote the nominal data path, while dashed branches indicate the heuristic fallback estimators and the optional cloud synchronization that are triggered only when the external prediction service is unreachable. Source: Author’s own elaboration.
Sustainability 18 06717 g001
Figure 2. Data-flow chart of the browser-side lightweight mechanisms. External open-data APIs and static geospatial sources are fetched and normalized into an internal schema, and processed on the main thread via the in-browser context and state manager: short-horizon in-memory histories drive the per-building UHI calculation (Equation (1)) and tsStore historian. Time-series forecasting (Holt–Winters, daily seasonality m = 24, horizon h = 168 h) executes in a Web Worker off the main thread so the interface can never block, employing heuristic estimators as a fallback. Both the measured and predicted series are serialized to localStorage for persistent offline storage to ensure the twin survives page reloads and transient network interruptions, while best-effort synchronizing with an optional cloud backend (dashed) is done only when the prediction service is at hand. Solid arrows indicate nominal data and control flows; dashed arrows indicate optional cloud synchronizations. Source: Author’s own elaboration.
Sustainability 18 06717 g002
Figure 3. Codogno local digital twin interface showcasing integrated 3D urban visualization and environmental analytics. Within a single browser view, the interface combines the interactive 3D city model (extruded buildings colored by the simulated UHI intensity), a control panel for adjusting visualization parameters and selecting individual buildings, a legend reporting live air-quality indicators, environmental time-series and forecast charts, and a multi-day weather panel. Source: Author’s own elaboration.
Sustainability 18 06717 g003
Figure 4. Model performance (best R2) across different train/test splits (50–90%) for the five pollutants (CO, NH3, NO, NO2, and O3). Results show consistently high predictive accuracy for NO and NO2 (R2 ≈ 0.8), moderate performance for CO and O3 (R2 ≈ 0.45–0.55), and low predictive capability for NH3, indicating limited model reliability for this pollutant. Source: Author’s own elaboration.
Sustainability 18 06717 g004
Figure 5. Heatmap of R2 scores (−1 to 1) for multiple machine-learning models across pollutants (CO, NH3, NO, NO2, and O3) and train/test splits (50–90%). Cells range from red (R2 ≤ 0, performance no better than the naive mean) through white to green (R2 approaching 1, high explanatory power); the consistently green rows for NO and NO2 and the persistently pale-to-red row for NH3 give an at-a-glance confirmation of the pollutant-dependent predictability analyzed above, and show that this ranking is stable across all train/test splits. Source: Author’s own elaboration.
Sustainability 18 06717 g005
Figure 6. The platform interfaces for the two additional case studies: Varna and Lausanne. (a) Varna—3D Cesium-based visualization with building-level attributes, environmental indicators, and integrated dashboards. (b) Lausanne—3D visualization highlighting traffic intensity and pollutant distribution. (c) Varna—2D analytical view combining spatial mapping with pollutant time-series and forecasting panels. (d) Lausanne—2D monitoring interface integrating environmental metrics, weather data, and spatial visualization. Source: Author’s own elaboration.
Sustainability 18 06717 g006
Table 1. Summary of selected literature on digital twin architectures, including approaches, key contributions and identified research gaps across recent studies.
AuthorsApproachContributionIdentified Gaps
[8]Design science using the SEI “Views and Beyond” methodology.TwinArch: A domain-independent, multi-view reference architecture providing reusable UML models.Lack of structured documentation (L1), misused elements (L2), limited generalizability (L3) and imbalanced focus on simulation over data (L6).
[9]Multi-Agent Systems (MASs) combined with a semantic API aligned with NGSI-LD.A semantic and modular architecture for orchestrating AI-driven DTs; integrates sustainability KPIs into the decision loop.Monolithic designs that limit scalability and AI reuse; syntactic rather than semantic integration; absence of real-time orchestration.
[10]Edge computing-based DT (E-DT) framework grounded in ISO 23247.A framework utilizing a data fusion module to reduce network load and improve data consistency.Challenges in processing large datasets; lack of systematic reference architectures specifically for edge-integrated DTs.
[11]Qualitative analysis of the three Asset Administration Shell (AAS) types.Feasibility study identifying how different AAS types meet specific DT requirements.No systematic approach for engineering DT software; lack of built-in reuse mechanisms and low-code configuration options.
[12]LDT architecture bringing processing to the network edge.Extension of the 5D-DT model to a GDT/LDTs model; improved manufacturing First Pass Yield by up to 2.5%.Lack of real-world assessments for edge layer suitability in industrial plants; tendency toward protocol-specific solutions.
[13]FIWARE-based prototype utilizing the Scorpio context broker and FogFlow.Evaluation of FIWARE for large-scale road infrastructure; demonstrated that load balancing is critical for scalability.No consensus on technical implementation for road systems; challenges involving highly distributed environments and data heterogeneity.
[14]Edge Digital Twin (EDT) architecture using a modular Core Engine.Architecture for one-to-one digitalization; supports augmentation and composition of assets at the edge.Existing systems are mainly cloud-driven, incurring high latency; underexplored interoperability potential in fragmented domain-specific solutions.
[15]Context Aware Communication Component (CACC) and a service registry.A scalable architecture for building DTs at the edge that integrates EdgeAI in an application-agnostic manner.Cloud-based DTs suffer from high latency and bandwidth costs; insufficient research on building DTs at the network edge.
[16]Requirement-driven, technology-agnostic DT architecture.A framework consisting of standard components traceable to core DT functionalities (Sync, Bi-dir, etc.).Lack of standard terminologies; dominance of application-specific architectures with differently named connectors and components.
[17]Systematic Literature Review (SLR) on AAS metamodels and industrial tools.Detailed investigation of the convergence between AAS and DT; provided a tool reference for practitioners.Relationship between AAS and DT not clearly defined; gap in AAS support for simulation and bi-directional exchange.
[18]Integration of AAS tools (Eclipse BaSyx) and International Data Spaces (IDSs).Validation of AAS usage in a real Non-destructive Testing (NDT) environment.Implementation of AAS in real industrial scenarios remains uncommon; need for easier-to-use management interfaces.
[19]FIWARE-based model for urban digital twins (UDTws).Application of the NGSI-LD standard to break down information silos in cities.Tight coupling of applications and low-level representations make reuse difficult in heterogeneous city structures.
[20]Use of Linked Open Data (LOD) and Open Data Portals (ODPs).Extension of FIWARE reference architecture to enable collaboration between DTs via ODPs.Difficulty of DT collaboration due to lack of standardization; vulnerability of DTs to external changes in data formats.
[21]FIWARE Ecosystem and the Smart Data Models initiative.A complete solution for building DTs that handles real-time context data via the Orion context broker.Architectures and technologies are typically strongly bounded to the specific domain where they are applied.
[7]Cloud–fog computing distribution of DT software components.Proven reduction in response times by 54–64% compared to cloud-only setups.Literature is often limited to abstract/conceptual proposals; lack of practical demonstrations under shared network resource competition.
Table 2. Best-performing machine-learning models and corresponding R2 values for each pollutant across different train/test splits (50–90%).
Pollutant/R250% Split60% Split70% Split80% Split90% Split
COXGBoost (0.541)XGBoost (0.531)XGBoost (0.504)XGBoost (0.546)XGBoost (0.556)
NH3SVR (0.027)SVR (0.026)SVR (0.026)GradientBoosting (0.050)SVR (0.025)
NORandomForest (0.810)RandomForest (0.809)RandomForest (0.813)RandomForest (0.814)RandomForest (0.809)
NO2LightGBM (0.802)LightGBM (0.792)ExtraTrees (0.793)LightGBM (0.794)LightGBM (0.792)
O3LightGBM (0.457)LightGBM (0.446)LightGBM (0.472)LightGBM (0.446)XGBoost (0.461)
Disclaimer/Publisher’s Note: The statements, opinions and data contained in all publications are solely those of the individual author(s) and contributor(s) and not of MDPI and/or the editor(s). MDPI and/or the editor(s) disclaim responsibility for any injury to people or property resulting from any ideas, methods, instructions or products referred to in the content.