1. Introduction
In the contemporary global landscape, the development of new quality productive forces (NQPF)—characterized by innovation-driven growth, high-tech integration, and efficient resource allocation—has emerged as a cornerstone of modern economic transformation and national competitiveness. A growing body of policy frameworks and academic studies highlights that new quality productive forces are inherently green: productivity upgrading must align with ecological sustainability and low-carbon development. This green dimension is not a supplementary attribute but a core feature of NQPF, reflecting the imperative to reconcile technological progress with environmental stewardship.
Meanwhile, the skill formation system plays an indispensable role in cultivating the skilled workforce required to support and sustain such productivity upgrading. The synergy between these two domains is widely recognized as critical for aligning human capital development with the evolving demands of advanced industries and technological systems. Defined by high technological content, high efficiency, and high-quality output, NQPF serve as an endogenous driver and core focus of high-quality and sustainable economic development. Furthermore, the development of NQPF relies on the integrated advancement and coordinated functioning of science and technology, education, and human resources.
Accordingly, skill formation institutions are tasked not only with imparting technical competencies but also with adapting curricula to match the shifting demands of emerging sectors. This includes fostering capabilities in digital literacy, advanced manufacturing, data analytics, and other fields central to NQPF. The effective alignment of educational output with industrial needs ensures a stable supply of talent capable of driving innovation, operational efficiency, and green transformation across diverse economic sectors.
Despite growing theoretical attention to this linkage, empirical research on the coupling coordination between NQPF and the skill formation system remains limited. Existing studies mostly rely on aggregated national data or short-panel samples, thus neglecting significant regional heterogeneity and spatial spillover effects. Existing studies mostly rely on aggregated national data or short-panel samples, thus neglecting significant regional heterogeneity and spatial spillover effects. In large transitional economies, regional endowments, industrial foundations, and institutional environments differ greatly across subnational units, resulting in unbalanced developmental progress. Economically advanced regions tend to possess complete industrial chains and superior technological conditions, enabling them to prioritize innovative and green industrial transformation, while less developed regions face greater constraints in infrastructure improvement, resource aggregation, and high-end talent accumulation.
Moreover, the specific driving factors of coupling coordination at the subnational level remain underexplored, especially in large developing economies undergoing rapid structural transformation [
1]. Over the past decade, China has made substantial investments in both NQPF development and skill formation, providing a rich empirical setting for investigating how these two systems interact across heterogeneous regional contexts. However, uneven development trajectories have led to divergent outcomes in terms of productivity growth, skill cultivation, and institutional alignment. This study conducts a systematic empirical analysis of the coupling coordination between NQPF and the skill formation system, using panel data from 31 provincial-level administrative regions in the Chinese mainland over the period 2010–2022. We measure the level of coupling coordination and identify its key influencing factors, with a particular focus on spatial patterns and regional disparities. The analysis accounts for local economic structures, technological endowments, institutional capacities, and green development priorities [
2]. This study contributes to a deeper understanding of the co-evolution mechanisms between education and productivity systems in complex, multi-regional economies.
2. Literature Review
On the relationship between new quality productivity and Skill Formation education, existing research has primarily focused on conceptual connotations, development characteristics, and the coupling logic between the two.
New quality productivity is regarded as an extension of Marxist productivity theory in contemporary China, driven by disruptive technologies and embodied in computational power, digital technologies, and green technologies, characterized by high technology, high efficiency, and high quality [
3]. Its qualitative leap distinguishes it from the linear evolution of traditional productivity [
4]. From an international theoretical perspective, new quality productivity intersects with concepts such as “skill-biased technological change” and “green productivity,” yet its institutional context is more distinctively Chinese [
5]. Empirically, Shao et al. (2024) [
6] constructed a provincial-level new quality productivity index for China, finding that eastern regions lead and regional imbalances exist. Li et al. (2024) [
7] assessed the impact of new quality productivity and green innovation on corporate ESG performance, highlighting the critical role of efficient innovation in sustainability. Ma (2024) [
8] explored the mediating role of new quality productivity in the relationship between entrepreneurs’ spirit and corporate green development, finding a partial mediation effect. Xu et al. (2024) [
9] investigated how green finance and digital inclusive finance promote sustainable economic development through new quality productivity. These studies all treat new quality productivity as an outcome or mediating variable, focusing on its consequences (e.g., ESG performance, green development) or antecedents such as finance and entrepreneurship, but rarely address the role of human capital or vocational education systems.
Skill Formation education spans four major fields: education, occupation, technology, and society. Internationally, the U.S. community college movement [
10,
11] and the German dual system [
12] have established basic paradigms linking vocational education to labor markets. Domestically, research focuses on policy evolution and institutional reform [
13], and introduces quantitative tools such as value-added assessment [
14]. Turning to research on vocational education and skill formation systems, this field originates in comparative political economy and social policy. Durazzi and Geyer (2022) [
15] surveyed foundational literature, documenting the traditionally inclusive nature of collective skill formation systems and the new challenges posed by deindustrialization, the platform economy, and the twin digital and green transitions in post-industrial societies. Bonoli and Emmenegger (2021) [
16] developed a two-level game model showing that firms’ structural power often resists government pressure for greater inclusiveness; thus most pro-inclusiveness policies either avoid firm-specific involvement or are co-designed by employer associations. Emmenegger et al. (2020) [
17] distinguished between social and liberal collective skill formation systems, showing that German trade unions play a strong parity role in training governance, while Swiss unions hold a considerably weaker position, with these differences rooted in institutional environments and union power resources after the First World War. Carstensen et al. (2026) [
18] argued that for the twin transitions, the central question is no longer whether governments should intervene but how to govern skill formation under profound uncertainty, requiring institutions flexible enough to adapt to technological and ecological shifts while stable enough to sustain political coalitions and social inclusion. However, these studies focus primarily on the internal institutional design and political dynamics of vocational education systems, without systematically exploring their connection to productivity upgrading, especially new quality productivity.
So, is there empirical evidence linking vocational education and new quality productivity? Existing education–productivity research provides some clues. Edvardsen, Forsund and Kittelsen (2017) [
19] used a Malmquist index to evaluate productivity growth in Norwegian skill formation institutions (i.e., vocational education institutions), finding positive growth in most institutions but significant heterogeneity when labor input growth was accounted for, suggesting that vocational education expansion alone does not necessarily translate into net productivity gains. Li et al. (2018) [
20] revealed a U-shaped relationship between China’s skill formation system and total factor productivity, indicating that the system positively affects productivity only after surpassing a certain threshold—this directly links vocational education to the productivity dimension of new quality productivity. Benos and Karagiannis (2016) [
21] found for Greece that upper secondary and tertiary education (including vocational education) have strong positive associations with labor productivity, while primary education shows a negative relationship. Wirajing et al. (2024) [
22] examined Sub-Saharan African countries and found that inclusive education (including vocational education) boosts labor productivity across all income groups, with upper secondary and tertiary education having stronger effects. Together, these studies show that the productivity effect of vocational education exhibits significant regional and stage heterogeneity, yet none of them directly couple vocational education with new quality productivity—especially its innovation and green dimensions.
In summary, the existing literature exhibits three gaps at the level of theoretical integration. First, there is no coherent logical chain connecting vocational education, productivity, innovation, and green transitions—the new quality productivity literature ignores vocational education as an antecedent, the vocational education literature ignores new quality productivity as an outcome, and the education–productivity studies, while addressing vocational education, do not incorporate innovation and green dimensions. Second, theoretical disputes are underexplored: for example, the direction and magnitude of the relationship between vocational education and productivity vary significantly across countries, likely due to differences in institutional environments or stages of development, yet existing studies lack cross-theoretical comparative analysis. Third, international theoretical dialogue is limited: although the literature covers regions such as Norway, Greece, China, Sub-Saharan Africa, Switzerland, and Germany, it remains largely at the empirical level and fails to engage meaningfully with general theoretical concepts such as institutional complementarity or technology–skill co-evolution.
To address the aforementioned research gaps, this study constructs a coupling coordination analysis framework and adopts panel data from provincial-level administrative regions in the Chinese mainland to quantify the coordination level between new quality productive forces and the vocational skill training system. The results reveal an overall upward trend alongside prominent regional disparities, and the driving factors also vary across different areas. Additionally, the spatial agglomeration degree of this coupling relationship presents an inverted U-shaped pattern. By linking research on vocational education with studies concerning new quality productive forces, this paper lays a solid empirical basis for future theoretical exploration in this field.
3. Coupling Mechanism Between New-Quality Productivity and Vocational Education
A two-way synergistic coupling relationship exists between vocational education and new-quality productivity (NQP). On the one hand, vocational education empowers NQP through talent supply, skill updating, and technology transformation. On the other hand, NQP guides the reform of vocational education by raising talent capability standards, promoting the renewal of teaching content, and accelerating the marketisation of technological outcomes.
First, vocational education meets the technological demands of NQP through customised talent cultivation. For emerging fields such as artificial intelligence and intelligent manufacturing, vocational education designs specialised courses and training programmes, enabling students to acquire cutting-edge technologies and hands-on abilities, thereby directly supporting the innovation and development of related industries [
23]. Second, vocational education enhances skill upgrading and knowledge renewal. As NQP entails rapid technological iteration, vocational education dynamically adjusts its curriculum and introduces the latest industry standards to ensure that students are equipped to operate new equipment and apply new processes, thus maintaining synchronisation between workforce skills and technological progress. Third, vocational education promotes innovation and technology application. By integrating innovative thinking training, project-based practice, and school–enterprise collaborative R&D, vocational education not only cultivates students’ ability to apply existing technologies but also encourages their participation in technological improvement and product development, thereby facilitating the transformation of innovation outcomes into productive forces.
NQP imposes higher demands on talent, driving vocational education to shift from single-skill training to comprehensive capability development. Interdisciplinary knowledge, practical ability, innovative thinking, and an international perspective become the focal points of cultivation, prompting reforms in educational models. At the same time, NQP forces the updating of vocational education teaching content. Cutting-edge technologies such as artificial intelligence, big data, and the Internet of Things are incorporated into curricula, and new pedagogical methods such as project-driven learning and blended learning are promoted. Teacher professional development and school–enterprise cooperation further ensure that curricula remain cutting-edge and practical. In addition, NQP accelerates the marketisation of technological outcomes. Through platforms such as technology transfer centres and incubators, it promotes the linkage between R&D and industry, which in turn provides vocational education with realistic technology transformation scenarios and teaching cases, forming a virtuous cycle of “education–technology–market”.
In summary, a closed-loop coupling mechanism of “talent supply–technology upgrading–education feedback” exists between vocational education and NQP. However, existing research has largely remained at the level of normative mechanism description, lacking quantitative testing based on panel data. This is precisely the gap that this paper aims to fill by employing a coupling coordination model and empirical analysis.
4. Research Results
4.1. Entropy Method
Entropy Method is a multi-criteria decision-making tool that evaluates alternatives by measuring the importance of different criteria and the performance of the alternatives under these criteria. This method utilizes the concept of information entropy, providing an objective and comprehensive reference for decision-making by calculating the composite entropy values of each alternative. Since the units of measurement for different indicators can vary, to eliminate the impact of these differences, the data must be standardized before calculating the composite indicators. In this study, we adopt a panel-wide (global) normalization and weight calculation approach. Let
xi,
j represent the value of the
j-th indicator for the
i-th region. The standardization process for positive indicators is as follows:
For negative indicators (where smaller values are better), the standardization process is as follows:
Secondly, calculate the proportion of the value of the
i-th region for the
j-th indicator relative to the total values of that indicator:
Next, calculate the entropy value of the
j-th indicator:
Then, calculate the information entropy redundancy:
Then, calculate the weights of each indicator:
Finally, calculate the composite indicator level:
Here, m is the number of indicators, n is the number of regions, is the weight of the j-th indicator, and is the composite score, which in this context refers to the levels of new quality productivity and skill formation system.
4.2. Coupling Coordination Degree
Coupling degree represents the strength of association between different dimensions within systems, but it cannot reflect whether these dimensions are developing harmoniously [
24]. Coupling coordination degree effectively addresses this issue. Coupling coordination degree provides a quantitative method to evaluate the degree of coordination among different parts within a system, helping to identify and optimize the synergistic effects of various factors. This paper introduces a coupling coordination degree model to explore the coupling and coordination relationship between new quality productivity and skill formation system levels.
In the formula, C represents the coupling degree; T represents the comprehensive coordination index; XS and XD, respectively, denote the level of new-quality productivity and the development level of skill formation system; α and β are the corresponding weights. Since the importance of the level of new-quality productivity and the development level of skill formation system is the same, both are assigned a value of 0.5.
4.3. Spatial Autocorrelation Analysis
The coupling coordination level of a region may have potential spatial dependence with the coupling coordination levels of surrounding provinces and cities. The key difference between spatial econometrics and traditional econometrics is the introduction of a spatial weights matrix, which can vary in capturing spatial spillover effects. Here, we use a spatial contiguity weights matrix for spatial autocorrelation analysis.
(1) Global Spatial Autocorrelation
Global spatial autocorrelation is a statistical method used to evaluate the overall correlation of spatial data within the entire study area. It measures the degree of spatial autocorrelation in geographic space, i.e., whether units that are close to each other geographically have similar attribute values. The Moran’s I index is the most commonly used measure of global spatial autocorrelation. The Moran’s I statistic measures the relationship between the attribute values of a region and those of its neighboring regions.
In the formula, n is the number of sample regions, which is 31 in this paper; Wij is the spatial weight matrix. The value of the global Moran’s I ranges from −1 to 1. A value greater than 0 indicates a positive correlation, and the closer it is to 1, the stronger the positive correlation. Conversely, the closer it is to −1, the stronger the negative correlation.
(2) Local Spatial Autocorrelation
Global autocorrelation measures primarily reveal the overall clustering trend in the entire study area, but they cannot accurately reflect the spatial autocorrelation among individual provinces. Since the spatial autocorrelation values of different provinces may have positive and negative differences, these can cancel each other out, leading to a Moran’s I index that is close to zero. In contrast, local autocorrelation measures effectively address this issue. By calculating the local Moran’s I, a LISA (Local Indicators of Spatial Association) cluster map can be generated, which clearly shows the local spatial relationships.
In the formula, Ii is the local spatial autocorrelation coefficient for region i. If Ii > 0, it indicates that the coupling coordination degree of the province is similar to that of its neighboring provinces, suggesting a ‘high-high’ or ‘low-low’ type of clustering. If Ii < 0, it indicates that the coupling coordination degree of the province is dissimilar to that of its neighboring provinces, suggesting a ‘high-low’ or ‘low-high’ type of clustering.
4.4. Grey Relational Degree
The calculation steps for grey relational degree are as follows:
Step 1: Select a reference sequence that reflects the characteristics of the system:
Step 2: determine the comparative sequence:
Step 3: Perform dimensionless processing on the data variables, where the initial value method and the mean value method are commonly used. Considering that the initial value of variable x2 is 0, the mean value method is selected here for processing and analysis. The result is:
Step 4: Calculate the absolute differences between each element of the evaluated object’s indicator sequence (comparative sequence) and the corresponding elements of the reference sequence, which is referred to as the difference sequence:
Step 5: Determine the maximum and minimum differences:
Step 6: Calculate the correlation coefficients:
In the formula, ρ is the resolution coefficient, which takes a value within (0,1). The smaller the value of ρ, the greater the differences between the correlation coefficients, and the stronger the distinguishing ability. Typically, ρ is set to 0.5.
Step 7, calculate the grey relational degree. First, for each evaluated object (comparative sequence), compute the average of its indicators with the corresponding elements of the reference sequence. This process is used to assess the degree of association between each evaluated object and the reference sequence. If the calculated result is close to 1, it indicates a high degree of correlation; conversely, if the result is far from 1, it indicates a low degree of correlation.
4.5. Spatial Durbin Model
Following the methodology of Zhou et al., we construct a Spatial Durbin model for the influencing factors of the coupling coordination degree between new quality productivity and the development level of vocational education. The specific model is specified as follows:
where
Dit represents the coupling coordination degree between new quality productivity and the development level of vocational education,
n denotes the number of samples,
t denotes the year,
i and
j denote the
i-th and
j-th regions, respectively,
CONit denotes the influencing factors of the coupling coordination degree in the local region,
CONjt denotes the influencing factors of the coupling coordination degree in neighboring regions,
Wij denotes the spatial weight matrix,
ui denotes the time effect,
denotes the regional effect, and
denotes the random error term.
is the spatial lag regression coefficient, representing the direction and intensity of the spatial spillover effect of the local region’s coupling coordination degree between new quality productivity and the development level of vocational education on neighboring regions.
is the spatial effect coefficient.
Based on the grey relational analysis, this paper selects the factors with a grey relational degree greater than 0.9 in the nation (overall level) for the coupling coordination degree as the independent variables in the Spatial Durbin Model. Specifically, these include four factors from the new quality productivity indicator system (Labor Productivity, Quality of Workers, Material Means of Labor, Ecological Environment) and three factors from the Skill Formation education development level indicator system (Background, Input, Process), totaling seven influencing factors.
5. Data Sources and Indicator System
5.1. Indicator System
The development level of new quality productivity can be comprehensively evaluated through qualitative changes in seven aspects: labor productivity, the quality of workers, the spirit of workers, the level of industrial development, the ecological environment, and tangible labor materials. Drawing on existing research [
25,
26], this paper constructs an evaluation indicator system for the development level of new quality productivity and uses the entropy method to conduct a comprehensive measurement of the new quality productivity level. The specific indicator system is shown in
Table 1.
The skill formation system in Skill Formation Education institutions is complex and diverse; therefore, establishing a scientific evaluation indicator system is crucial for assessing the level of skill formation systems in different provinces. Based on existing research [
27,
28,
29] and the 2020 China Education Monitoring and Evaluation Statistical Indicator System released by the Ministry of Education of China, this paper measures the development level of skill formation systems from four key aspects: the background of skill formation systems, investment in skill formation systems, the process of skill formation systems, and the outcomes of skill formation systems. To ensure the validity and representativeness of the data, data from skill formation systems are selected as the standard for measuring the level of skill formation systems in various provinces and cities. The specific indicator system is shown in
Table 2.
5.2. Data Sources
This study employs panel data of 31 provincial-level administrative regions (including provinces, autonomous regions, and municipalities directly under the Central Government) in the Chinese mainland from 2010 to 2022. The data are sourced from the National Bureau of Statistics of China, the CEIC China Statistical Database, China Statistical Yearbook on Environment, China Energy Statistical Yearbook, China Statistical Yearbook on Science and Technology, China Statistical Yearbook, and provincial-level statistical yearbooks. Missing values for individual provinces and years are filled by interpolation.
Indicator data for the level of Skill Formation education were obtained from multiple authoritative sources, including the National Bureau of Statistics, provincial Labor Statistical Yearbooks, the China Educational Statistics Yearbook, the China Population and Employment Statistics Yearbook, the Concise Statistical Analysis of National Education, the China Educational Finance Statistical Yearbook, the China Labor Statistical Yearbook, the China Regional Innovation Capability Evaluation Report, as well as relevant publicly available data from the Ministry of Education.
Innovative spirit was proxied by the full-time equivalent of R&D personnel in industrial enterprises above the designated size. This indicator measures the intensity of human input in enterprise R&D activities, reflects the degree of worker participation and engagement in technological innovation, and serves as an operationalized manifestation of “innovativeness”. The data were sourced from the China Statistical Yearbook on Science and Technology. Entrepreneurial spirit was proxied by the number of innovative enterprises per 100 people. In this context, “innovative enterprises” refer to recognized high-tech enterprises, technology-oriented small and medium-sized enterprises (SMEs), or enterprises holding at least one valid patent. This indicator captures the density of entrepreneurial innovation activities within a region and reflects the entrepreneurial spirit of risk-taking and innovation. The data were obtained from the National Intellectual Property Administration, the Torch High Technology Industry Development Center of the Ministry of Science and Technology, and the Qi Chacha database. Robot installation density was calculated as: regional industrial robot installations × (regional industrial employment/national total employment).
6. Analysis of Empirical Results
6.1. The Spatiotemporal Evolution Trend of the Coupling and Coordination Between New Quality Productivity and Skill Formation Education Development Level
This paper calculates the development levels of skill formation systems and new quality productivity, as well as the coupling coordination degree between the two systems, across the country and in different regions from 2010 to 2022. The specific calculation results are shown in
Table 3.
Across the 31 provincial-level administrative regions in the Chinese mainland, the overall development level of vocational skill education increased from 0.233 in 2010 to 0.347 in 2022, representing a net increase of 0.114. Its compound annual growth rate (CAGR) reaches 3.7% and average annual growth rate 4.0%, indicating steady improvement over the study period. From 2010 to 2022, vocational skill education development maintained an upward trend across eastern, central and western sub-samples. The eastern sub-sample registered the most notable growth, with the value climbing from 0.276 to 0.399 and an average annual growth rate of around 4.4%. The figure for the central sub-sample rose from 0.242 to 0.362 (approximately 4.3% average annual growth), while the western sub-sample grew from 0.187 to 0.290 (about 4.0% average annual growth).
The development level of vocational skill education in the eastern sub-sample is significantly higher than in the central and western sub-samples, which is largely associated with stronger economic foundations and more sufficient allocation of educational resources. The central sub-sample ranks between the eastern and western groups. While the western sub-sample started from a lower baseline, its growth rate is comparable to that of the central sub-sample, suggesting a gradual narrowing of the absolute development gap across regions.
Over the same period, new quality productive forces (NQPF) showed divergent growth trajectories across the three regional groups. The NQPF level in the eastern group surged from 0.126 to 0.369, with an average annual growth rate of approximately 18.8%. This trend reflects strong momentum in economic restructuring, technological innovation and efficient resource allocation, and underscores the region’s advantages as a core economic cluster. In comparison, the NQPF level in the central group rose from 0.100 to 0.229 (10.5% average annual growth), and the western group from 0.078 to 0.183 (13.4% average annual growth). While both central and western groups achieved growth, their growth magnitude is notably smaller than that of the eastern group.
At the aggregate level, the overall NQPF level increased from 0.101 to 0.261, with a net growth of 0.160 and a CAGR of 8.1%, presenting a general upward trend. Nevertheless, notable regional disparities persist, indicating that central and western regions require targeted development strategies to promote economic restructuring and optimize resource allocation.
The coupling coordination degree between vocational skill education and NQPF rose from 0.359 in 2010 to 0.593 in 2022, with a net increase of 0.234, a CAGR of 4.2% and an average annual growth rate of approximately 5.2%. The index declined only slightly in 2013 and maintained growth in all other years, following a stable upward trajectory. Despite minor short-term fluctuations, the overall trend is positive, confirming that the alignment between vocational skill education and productivity development is continuously improving.
In recent years, policymakers have introduced a series of policies to enhance the quality and adaptability of vocational skill education, including scaling up financial investment, optimizing curriculum design and strengthening school-enterprise collaboration. These measures seek to improve the practical outcomes of vocational skill education and cultivate more skilled workers to support economic development. Alongside ongoing economic restructuring and industrial upgrading, the economy has become increasingly dependent on high-tech and high-value-added industries, which further drives demand for skilled labor. Against this background, vocational skill education has been adjusted to better align with emerging industries and high-tech fields. The continuous updating of courses and training programs responds to evolving technological and industrial needs, further enhancing the practical value of vocational skill education. In turn, this effectively supports the development of NQPF and raises the overall level of coupling coordination between the two systems.
From a regional perspective, the eastern group maintained a consistently high coupling coordination degree throughout the study period, rising from 0.430 in 2010 to 0.694 in 2022. The net increase reached 0.264, with a CAGR of 4.3% and an average annual growth rate of around 5.7%. This sustained improvement reflects enhanced coordination between vocational skill education and NQPF in the region, which can be attributed to its solid economic foundation, rapid industrial upgrading, active technological innovation, in-depth educational reform and effective policy execution.
From an institutional perspective, eastern regions were early adopters of market-oriented economic practices and industrial opening-up, creating an institutional environment that facilitates the agglomeration of innovation factors. Their first-mover advantages in receiving industrial transfers have also accelerated the transformation of local manufacturing toward technology-intensive and green production. In addition, the early development of the digital economy—such as broader internet access and the construction of industrial internet platforms—has improved the matching efficiency between skill supply and market demand.
The coupling coordination degree of the central group increased from 0.380 in 2010 to 0.593 in 2022, with a net increase of 0.213 and an average annual growth rate of approximately 3.9%. While starting from a lower level than the eastern group, the central region achieved relatively rapid growth, particularly after 2016, when the growth of coupling coordination accelerated significantly. This demonstrates tangible progress in vocational skill education reform and industrial upgrading. Even so, its overall level still lags behind the eastern group, leaving room for further improvement.
The western group started from a relatively low baseline, with its coupling coordination degree rising from 0.280 in 2010 to 0.500 in 2022 and an average annual growth rate of around 5.3%. Despite notable growth, its initial baseline was low, and its overall development pace lags behind the eastern and central groups. Constrained by geographical conditions, relatively weak industrial foundations and underdeveloped digital infrastructure, western regions face limitations in undertaking industrial transfers. Coupled with talent outflow, vocational skill education has not yet fully realized its supporting role for NQPF development. Relatively slower economic development and a less mature vocational skill education system are the main constraints on regional coupling coordination. Nevertheless, the sustained growth trend indicates that the matching level between vocational skill education and NQPF is steadily improving in western regions.
6.2. Spatial Autocorrelation
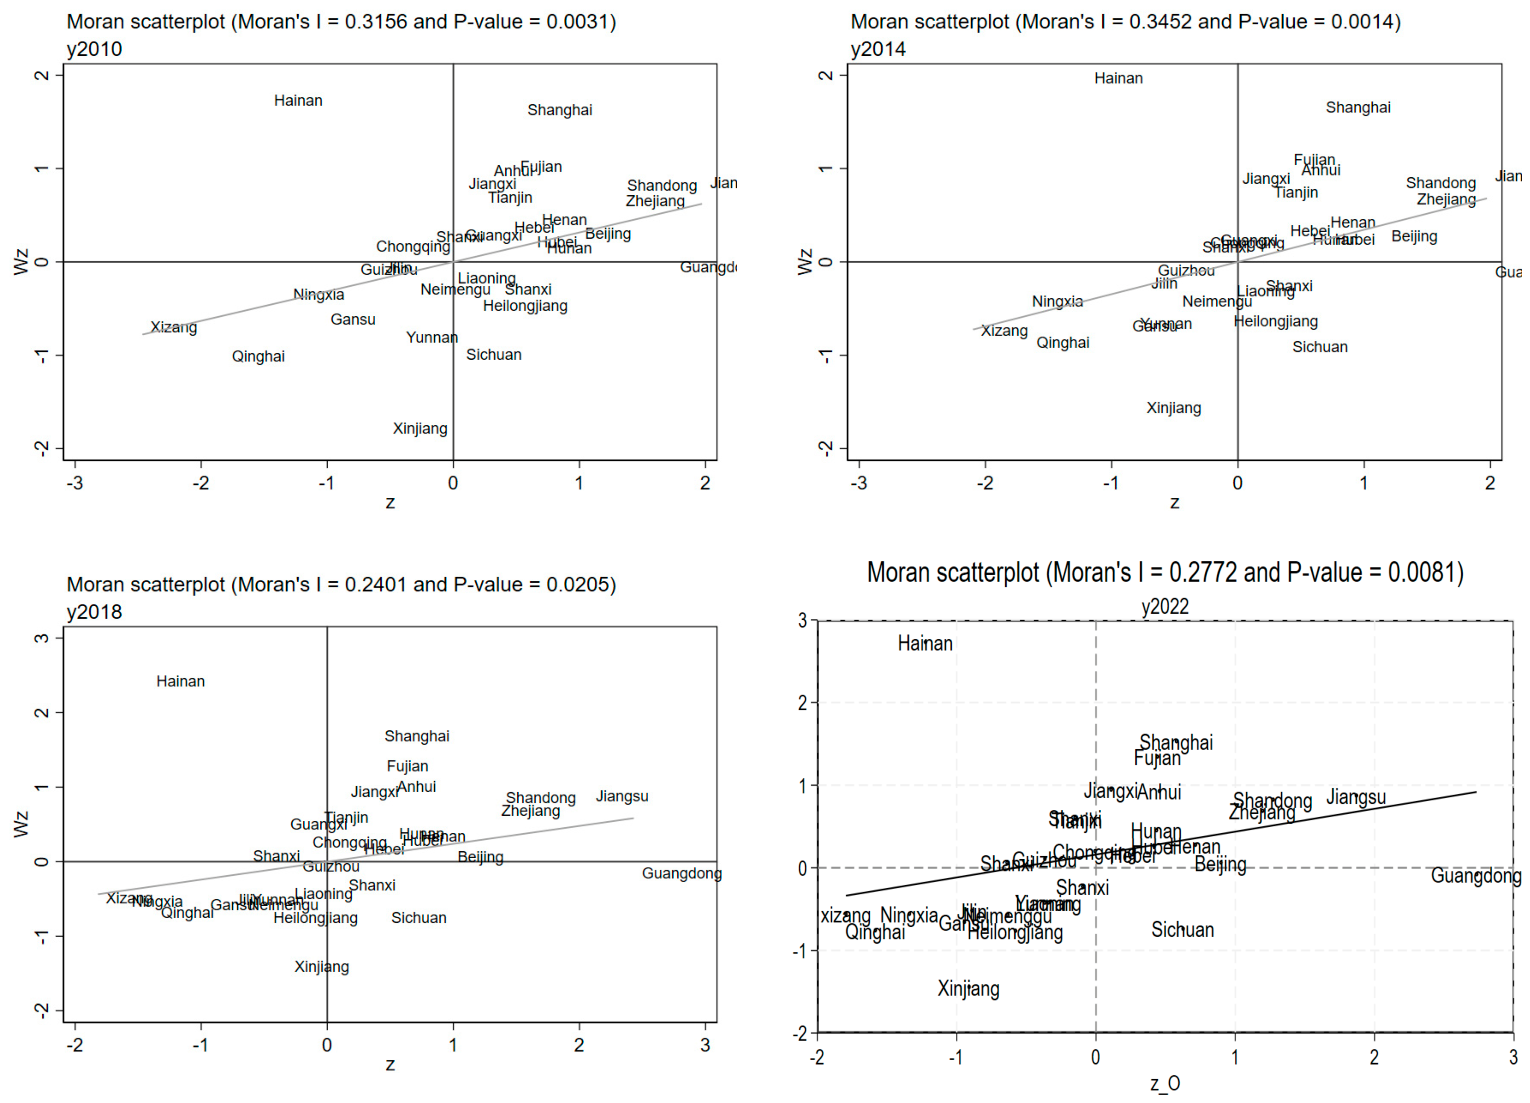
Based on panel data from 31 provincial-level administrative regions in the Chinese mainland, this paper employs Moran’s I index to conduct an in-depth analysis of the spatiotemporal characteristics and spatial clustering dynamics of the coupling coordination between the vocational skill formation system and new quality productive forces (NQPF). We calculate the global Moran’s I and local Moran’s I of the coupling coordination degree for four representative years (2010, 2014, 2018, and 2022) using Stata 17.0, and generate the corresponding Moran scatter plots.
As presented in
Table 4, the coupling coordination degree between the vocational skill formation system and NQPF generally exhibits stable spatial clustering features across sample regions from 2010 to 2022. The global Moran’s I remains consistently positive, indicating that provincial units with higher coupling coordination levels tend to form spatial agglomeration with neighboring regions. The index reached its peak of 0.347 in 2013, then gradually declined starting from 2016 and hit the lowest value of 0.240 in 2018, reflecting a weakening trend of spatial clustering effect during this period. The statistical significance supported by Z-values and P-values further confirms that significant spatial autocorrelation persists throughout the study period. Overall, the intensity of spatial clustering follows a trajectory of initial increase followed by decline. Such temporal variation can be attributed to multiple driving factors, including cross-regional collaborative development practices, the expanding coverage of digital infrastructure, and the spatial transfer of green industries. These factors have jointly enhanced the development capacity of central and western regional groups, and mitigated the polarization effect of core economic clusters in the eastern region.
The results of local spatial autocorrelation, as shown in
Figure 1 and
Table 5, indicate that from 2010 to 2022, there were noticeable changes in the clustering patterns of skill formation systems and new quality productivity. Provinces with high-high clustering, mainly concentrated in the more economically developed eastern and central regions, such as Beijing, Shanghai, Jiangsu, Zhejiang, Shandong, and Henan, maintained a stable pattern throughout the study period. Meanwhile, provinces with low-low clustering were mostly located in the western and northeastern parts of the country, including Inner Mongolia, Liaoning, Jilin, and Xinjiang, indicating relatively lower levels of skill formation systems and new quality productivity in these areas, which also remained fairly stable. Notably, the provinces characterized by high–low and low–high clustering showed variations across different years, particularly in Guizhou and Shaanxi. These transitions may be related to regional coordination policies that reallocated resources, the rapid expansion of digital infrastructure, and the transfer of green industries. Such factors have enhanced the development capacity of some central and western provinces, enabling them to gradually escape the low-level trap. This reflects the dynamic adjustments in the coupling relationship between skill formation systems and productivity in these regions.
6.3. Analysis of Internal Driving Factors for the Coupling and Coordination Between New Quality Productivity and Skill Formation Education
This paper further explores the driving effects of various indicators within the new quality productivity and skill formation systems on their coupling and coordination using the grey relational analysis method. The calculation results are shown in
Table 6.
Table 6 presents the grey relational degrees between new quality productive forces (NQPF) and vocational skill formation system indicators, calculated for the full sample as well as the eastern, central and western sub-samples. Overall, at the aggregate sample level, the grey relational degrees between NQPF and vocational skill formation system development stand at 0.901 and 0.912 respectively, indicating a notable driving effect of skill formation system development. Among specific indicators, workforce quality (0.951) and educational investment (0.941) register the highest grey relational degrees. This suggests that improving workforce quality and increasing resource input into skill formation systems are critical to advancing the coupling coordination between NQPF and the vocational skill formation system. In comparison, the grey relational degrees of workforce spirit (0.875) and output level (0.874) are relatively lower, meaning their influence is more limited yet still non-negligible.
The eastern sub-sample presents distinct features in the coupling coordination between NQPF and vocational skill formation system development. The grey relational degrees of workforce quality and labor productivity with NQPF reach 0.945 and 0.901 respectively, indicating that improved workforce quality and higher production efficiency are core drivers of coupling coordination in the eastern group. For the skill formation system, educational investment records the highest grey relational degree at 0.955, which is associated with the stronger economic foundation of the eastern sub-sample that enables greater resource allocation to skill development, in turn supporting NQPF growth. By contrast, the grey relational degrees of output level (0.863) and workforce spirit (0.851) are relatively lower, suggesting that while these factors play a role, they exert a weaker impact on the overall coordination of the eastern sub-sample.
The central sub-sample follows a similar pattern to the eastern group, yet its overall development levels of NQPF and vocational skill formation system are relatively lower. Workforce quality (0.943) and labor productivity (0.895) still maintain high grey relational degrees, underscoring the critical role of workforce quality in enhancing coupling coordination. Compared with the eastern sub-sample, the central group has a slightly higher grey relational degree for material labor resources (0.903), meaning hardware resource investment plays a more prominent role in driving NQPF development. For the skill formation system, the grey relational degree of educational investment stands at 0.920, indicating that the central sub-sample still relies on expanding educational resources to improve coupling coordination, while its investment scale is slightly lower than that of the eastern group, reflecting relatively constrained educational resource endowments in this region. Meanwhile, the grey relational degrees of output level (0.856) and workforce spirit (0.863) remain relatively low, with a weaker influencing effect.
The western sub-sample records high grey relational degrees across multiple indicators, especially workforce quality (0.962) and material labor resources (0.926). Against the background of a relatively weaker economic base in the western sub-sample, improving workforce quality and increasing investment in material labor resources serve as core pathways to boost coupling coordination. The grey relational degree of labor productivity reaches 0.921, further confirming the significant effect of improved production efficiency on overall coordination. For the skill formation system, the grey relational degrees of foundational support (0.933) and process management (0.924) are at a high level, indicating that the western sub-sample has made steady progress in the development and operation of its skill formation system. However, the grey relational degree of output level (0.897) remains relatively low, suggesting that despite improvements in educational resources and process management, there remains room for improvement in the effective translation of educational outcomes, which may constrain the coordinated development of NQPF and the skill formation system.
Overall, the regional disparities in grey relational degrees reflect the differing priorities of each sub-sample in enhancing the coupling coordination between NQPF and vocational skill formation systems. For the full sample overall, the core focus should be on improving workforce quality and increasing educational investment. Each regional group can optimize relevant indicators in line with its own development characteristics. Specifically, the western sub-sample should prioritize improving workforce quality and material labor resources, while the eastern sub-sample can continue to expand educational investment to achieve overall improvement in coupling coordination.
6.4. Spatial Durbin Model
To determine the optimal spatial econometric model, LM, LR, Wald, and Hausman tests were conducted, with the results reported in
Table 7. The LM-lag, LM-error, and their robust forms were all significant at the 1% level, indicating that the explained variable exhibits both spatial lag dependence and spatial error dependence. Therefore, the Spatial Durbin Model (SDM), which incorporates both types of effects, should be adopted. Furthermore, the LR tests rejected the null hypotheses that the SDM could be simplified to either the SAR or SEM model; the Wald tests also rejected the joint hypothesis that the coefficients of the spatially lagged independent variables (Wx) are zero and the nonlinear constraint Wx = −ρβ. These results consistently confirm that the SDM outperforms both the SAR and SEM. Finally, the Hausman test strongly rejected the random effects specification, supporting the use of a fixed effects model. In summary, this paper employs a two-way fixed effects SDM that controls for both individual and time effects in the subsequent estimation.
After controlling for other factors, the coefficient of labour productivity on the local coupling coordination degree was 0.0452, significant only at the 10% level. The coefficients of worker quality, ecological environment, material means of labor, educational background, educational input, and educational process were all positive and significant at the 1% level. Among these, educational process and educational input exhibited the largest coefficients, indicating that educational process and input are the strongest drivers of local coupling coordination improvement; educational background also plays a considerable facilitating role.
Regarding the influence of changes in neighboring regions’ variables on the local coupling coordination degree, the spatial spillover effects of worker quality, ecological environment, and educational background were significantly positive, suggesting that improvements in neighbors’ worker quality, ecological environment, and educational background generate positive radiation. In contrast, the spillover effect of material means of labor was significantly negative, implying that an increase in local material means of labor suppresses the coupling coordination degree of neighboring regions, possibly due to resource competition or negative externalities. The spillover effects of labor productivity, educational input, and educational process were not significant.
The direct effects were largely consistent with the main effects in terms of magnitude and significance, reconfirming the influence of each variable on the local region. For indirect effects, worker quality was marginally significantly positive; ecological environment and educational background were significantly positive; material means of labor were significantly negative; and educational input was marginally significantly negative. In terms of total effects, worker quality, ecological environment, educational background, educational input, and educational process were all significantly positive, with educational process having the largest total effect. The total effect of material means of labor was negative but not significant, as the positive direct effect was entirely offset by the negative spillover. The total effect of labor productivity was also not significant. The spatial autoregressive coefficient ρ was −0.0577 and not significant, indicating that after controlling for the independent variables and their spatial lags, the endogenous interaction among the dependent variables is weak, and spatial dependence is primarily transmitted through the spillover effects of the independent variables.
Table 8 reports the estimation results of the SDM, including the main effects, spatial spillover effects (Wx), direct effects, indirect effects, and total effects, together with the spatial autoregressive coefficient ρ.
These results indicate that educational factors (background, input, process) are the core drivers of regional coupling coordination improvement, and educational background exhibits a significant positive spatial spillover; therefore, inter-regional sharing and coordination of educational resources should be strengthened. The ecological environment not only directly promotes local development but also positively spills over to neighboring regions, suggesting the need for enhanced cross-regional ecological collaborative governance. Although material means of labor benefit the local region, they suppress the coupling coordination degree of neighbors, implying that resource competition and negative externalities should be guarded against, and green, shared allocation of material resources should be encouraged. Worker quality has a positive but marginally significant spillover effect; thus, overall quality should be further improved and channels for knowledge and skill spillover should be unblocked. Labor productivity plays a limited role, and future efforts should focus more on development quality and structural optimization.
6.5. Robustness Analysis
To avoid the influence of the choice of spatial weight matrix, this study re-estimated the SDM using an economic distance matrix (the reciprocal of the absolute difference in per capita GDP) in
Table 9. The results show that the log-likelihood value was close to that of the baseline model, and the signs and significance of the variables were largely consistent: in the main effects, worker quality, ecological environment, material means of labor, educational background, educational input, and educational process were all significantly positive; the spatial spillover of material means of labor remained significantly negative, while that of worker quality remained significantly positive; for the indirect and total effects, the core variables continued to exert significant positive influences, and the negative spillover of material means of labor remained. Although the significance of the spillover effects of some individual variables decreased, their total effects remained significantly positive. The spatial autoregressive coefficient ρ remained negative and insignificant. In summary, after replacing the weight matrix with the economic distance matrix, although model convergence was slightly less satisfactory, the signs and significance of the key variables were highly consistent with those of the baseline model, demonstrating the robustness of our estimation results.
7. Policy Recommendations
Based on empirical analysis of the coupling coordination between new quality productive forces (NQPF) and vocational skill formation systems across 31 provincial-level administrative regions in the Chinese mainland from 2010 to 2022, this study proposes three system-oriented optimization recommendations centered on vocational skill cultivation, together with generalized theoretical and practical implications for skill formation system development in transitional economies.
First, skill formation systems should be dynamically adapted to regional economic structures and productivity development stages. The empirical results indicate that sample regions with mature industrial upgrading and sufficient resource input maintain high-level coupling coordination. By contrast, regions with relatively lower developmental baselines achieve steady coordination improvement through workforce quality enhancement and increased material resource investment. These findings demonstrate that skill formation systems must be closely rooted in local industrial conditions and dynamically adjust to the technological demands and skill structure requirements of leading industries. For transitional and industrializing economies, skill cultivation construction should avoid blind imitation of mature development models. Instead, system design needs to match local productivity characteristics and industrial evolution trajectories, rationally layout technical training and talent cultivation priorities, and realize phased, context-specific coordination between skill supply and industrial development.
Second, workforce quality improvement serves as the core driving factor for optimizing the operational efficiency of skill formation systems. Grey relational analysis results verify that workforce quality dominates the coupling relationship across regional samples, with a consistently high correlation coefficient above 0.94. This indicates that the core value of modern skill formation systems lies not in the scale of educational infrastructure or curriculum expansion, but in effectively improving workers’ technical proficiency, adaptive capacity and innovative literacy. This conclusion has universal applicability for economic transformation worldwide. Regardless of economic development level, green transformation, digital upgrading and advanced manufacturing iteration all rely on high-quality human capital as the fundamental support. Optimizing talent training quality and building a lifelong learning system can effectively improve the adaptability of human resources to emerging industries and new productivity forms, thereby underpinning sustainable economic upgrading.
Third, skill formation systems should establish an outcome-oriented evaluation and resource allocation mechanism based on coordinated development efficiency. This study finds that some regions with continuous educational input growth still face insufficient transformation from educational resource investment to practical productivity output, reflecting a typical phenomenon of scale expansion exceeding practical benefit improvement. Therefore, the evaluation system of skill cultivation should shift from single input-oriented indicators such as capital investment and enrollment scale to a multi-dimensional evaluation framework covering skill-job matching degree, employment quality and industrial contribution. For public resource allocation, limited educational resources should be preferentially invested in high-efficiency training programs that can significantly improve workforce productivity and industrial adaptation, so as to avoid inefficient resource expansion. In addition, the spatial evolution characteristics of coupling coordination—initial agglomeration enhancement followed by gradual dispersion—suggest that excessive resource concentration in core regions should be avoided. Balanced regional development can be achieved through cross-regional resource collaboration and digital resource sharing to mitigate developmental polarization and promote inclusive industrial upgrading.
In summary, this study systematically explores the coordinated evolution mechanism between skill formation systems and new quality productive forces based on subregional empirical evidence. The core principles of industrial-adaptive talent cultivation, human capital-oriented development and performance-based resource governance provide generalized theoretical references and practical paths for realizing synergistic interaction between skill cultivation systems and high-quality economic development in multi-regional economies.
8. Conclusions and Future Directions
8.1. Conclusions
Based on provincial panel data covering 31 provincial-level administrative regions in the Chinese mainland from 2010 to 2022, this paper constructs an evaluation index system to measure the development levels of new quality productive forces (NQPF) and vocational skill formation systems. On this basis, it calculates the coupling coordination degree, evolutionary trends, and core driving factors of the interactive relationship between the two systems. The primary empirical findings are summarized as follows.
First, the overall development levels of NQPF and vocational skill formation systems maintained a steady upward trend throughout the research period, with obvious developmental heterogeneity across regional sample groups. Regions with superior industrial foundations show better performance in both productivity advancement and skill system construction. This result indicates that targeted development strategies adapted to local economic and industrial characteristics can effectively facilitate the coordinated improvement of productivity and talent cultivation systems.
Second, the overall coupling coordination degree between NQPF and vocational skill formation systems presents a stable growing trend, with only a slight temporary decline in 2013. Among regional subgroups, economically advanced sample regions maintain the highest coordination level, followed by intermediate developing regions, while less developed regions show a relatively lower coordination status. Such persistent regional differentiation emphasizes the necessity of differentiated development strategies that fully adapt to local institutional conditions, industrial structures, and human resource endowments.
Third, spatial econometric analysis verifies significant spatial clustering characteristics in the coupling coordination degree across provincial sample units. The intensity of spatial agglomeration follows an increasing-then-decreasing evolutionary trajectory. This temporal feature indicates that although high-level development regions can produce positive spatial spillover effects, excessive resource agglomeration may constrain balanced and coordinated development across regions. Accordingly, cross-regional cooperation and resource sharing mechanisms are essential to promote inclusive and balanced system development.
Fourth, grey relational analysis confirms a strong intrinsic correlation between NQPF and vocational skill formation systems at the aggregate sample level. Eastern and central sample groups show relatively consistent correlation characteristics, while western sample groups present differentiated relational patterns. This divergence further demonstrates that the collaborative development of productivity and skill cultivation systems requires context-specific, localized optimization paths adapted to regional developmental conditions.
Fifth, the Spatial Durbin Model estimation further identifies the driving mechanisms and spatial spillover effects affecting the coupling coordination degree. Educational foundation, educational investment, and operational procedures of skill cultivation act as core driving factors for system coordination, among which educational foundation exerts significant positive cross-regional spillover effects. Regional ecological environments can not only boost local coupling coordination but also generate favorable spillover impacts on adjacent regions. By contrast, material labor resources contribute to local coordinated development but produce negative spatial spillovers on neighboring areas. These findings suggest that cross-regional sharing of educational resources and joint ecological governance can amplify comprehensive developmental benefits, while the investment of material capital requires overall rational planning to avoid inter-regional resource competition and inefficient allocation.
8.2. Research Limitations and Future Directions
This study has several limitations that warrant further investigation in future research. First, this research lacks in-depth theoretical integration and rigorous causal identification. The study does not systematically incorporate classical international theoretical frameworks, such as human capital theory and skill-biased technological change theory. In addition, the coupling coordination model adopted in this study mainly captures the synchronous evolutionary relationship between two systems, while failing to clarify their bidirectional causal paths. Future studies can adopt dynamic panel GMM or instrumental variable methods to improve causal inference accuracy and verify endogenous mechanisms more rigorously. Second, this study has certain limitations in indicator construction and methodological selection. Currently, there is no universally unified evaluation standard for the indicator system of new quality productive forces (NQPF), which may bring potential uncertainty to empirical measurement. In addition, grey relational analysis has relatively limited mainstream recognition in international econometric research. Subsequent studies can introduce alternative quantitative methods, such as GTFP decomposition, PCA dimensionality reduction, and TOPSIS evaluation, to conduct multi-method robustness verification. Third, the selection of spatial weight matrices and the generalizability of empirical conclusions can be further expanded. This study only employs adjacency and economic distance spatial weight matrices for spatial econometric analysis. Meanwhile, the empirical findings are derived from provincial-level panel data of 31 provincial-level administrative regions in the Chinese mainland. Future research can adopt diversified spatial weight matrices to capture heterogeneous spatial interaction patterns and verify the applicability of relevant mechanisms based on multi-country and cross-regional samples, so as to further improve the external validity and generalizability of the research conclusions.