Article

Indoor Microbiological Contaminants in Residential Homes in Spain

by
Lara Pérez-Etayo
1,
Fernando Echarri
2,
Aurora Monge-Barrio
3,
Núria Casquero-Modrego
4,
Maira Bes-Rastrollo
5,6,7,
Ana Sánchez-Ostiz
3,
Ainhoa Arriazu-Ramos
3 and
Ana Isabel Vitas
1,*
1
Department of Microbiology and Parasitology, BIOMA Institute for Biodiversity and the Environment, University of Navarra, 31008 Pamplona, Spain
2
Department of Environmental Biology, University of Navarra, 31008 Pamplona, Spain
3
School of Architecture, BIOMA Institute for Biodiversity and the Environment, University of Navarra, 31009 Pamplona, Spain
4
Residential Building Systems Group, Lawrence Berkeley National Laboratory, Berkeley, CA 94720, USA
5
Department of Preventive Medicine and Public Health, University of Navarra, 31008 Pamplona, Spain
6
Navarra Institute for Health Research (IdiSNA), 31008 Pamplona, Spain
7
CIBERobn, Instituto de Salud Carlos III, 28029 Madrid, Spain
*
Author to whom correspondence should be addressed.
Sustainability 2026, 18(12), 6023; https://doi.org/10.3390/su18126023
Submission received: 28 April 2026 / Revised: 26 May 2026 / Accepted: 27 May 2026 / Published: 12 June 2026

Abstract

The indoor microbiological contaminants present in the built environment, including residential buildings, can pose significant risks to human health and well-being and the sustainability of indoor environments. Therefore, the total aerobic microbial count (TAMC) and total yeast and mold count (TYMC) are key indicators used to evaluate microbial contamination levels in indoor spaces. This study presents an assessment of TAMC and TYMC in residential indoor environments in two cities in Spain, Pamplona and Seville, which represent different climate zones, with Seville characterized by extensive air conditioning use due to its high summer temperatures. We conducted sampling and analysis in 20 dwellings over two summer campaigns to quantify microbial populations and identify parameters that worsen TAMC and TYMC and promote amplification (I/O, indoor/outdoor). The results show that ventilation type, building design, and climatic conditions significantly influence indoor bacterial amplification. The study indicates that the implementation of the Spanish building code in 2006 has improved microbial Indoor Air Quality (IAQ), even in airtight and energy-efficient dwellings, highlighting the importance of integrating ventilation and health considerations into sustainable building design. Environmental parameters such as temperature and CO2 concentration were reliable indicators of bacterial proliferation. Kitchen design and the presence of pets also emerged as relevant determinants of microbial loads. Overall, the use of I/O ratios proved effective for identifying indoor microbial amplification, supporting their application in future IAQ assessments, sustainable building evaluations, and healthy housing strategies.

1. Introduction

The built environment encompasses human-made physical spaces where people live and work. In developed countries, individuals may spend over 90% of their time indoors, which has significant implications for health, especially in those who are more critical [1]. Indoor air pollution is a key determinant of health, making it crucial to identify hazardous indoor air contaminants to implement effective exposure mitigation strategies in residential buildings [2]. Extensive studies have demonstrated the important role of residential environments in indoor air contaminant exposure. A study conducted by Morantes et al. [3] quantified chronic health impacts of indoor air contaminants in dwellings using disability-adjusted life years (DALYs), identifying PM2.5, PM10–2.5, NO2, formaldehyde, radon, and O3 as the most harmful contaminants in dwellings of median harm (2200 DALYs per 100,000 persons per year). Indoor Air Quality (IAQ) refers to the quality of air within and surrounding indoor environments and is critical for occupant health and well-being [4]. Poor IAQ is a recognized global environmental risk, contributing to respiratory, cardiovascular, and other health issues [5,6,7]. Therefore, assessing IAQ is crucial for understanding occupants’ daily contaminant exposure and associated health risks. Studies on building envelope retrofits in residential buildings found mixed impacts on IAQ: Building envelope retrofits can alter infiltration rates and introduce emissions from new materials, with most studies reporting increased contaminant concentrations post-retrofit, though values generally remained below health-based limits. Radon, CO2, VOCs, and formaldehyde showed the greatest variability, influenced by geography, ventilation, and building materials. These findings highlight the need for retrofit strategies that balance energy efficiency with the protection of IAQ and occupant health [8].
Various chemical and biological substances contribute to indoor air contaminants, including common air pollutants such as formaldehyde, total volatile organic compounds (TVOCs), fungi, and bacteria, with IAQ influenced by chemical properties, humidity, temperature, ventilation, and the presence of contaminants like CO, CO2, PM2.5, NOx, and VOCs among others [9]. According to Idris et al., indoor air pollution is caused by particles from furniture, building materials, occupants’ activities and insufficient ventilation [10]. Synthetic chemicals and poor ventilation can lead to high concentrations of indoor contaminants and VOCs. Cleaning activities, like sweeping and vacuuming without proper filters, release contaminates [11]. Bioaerosols, airborne particles from living or dead organisms, are common indoors and can affect health, requiring effective monitoring [12,13]. Exposure to bioaerosols, originating from equipment and humans, can cause respiratory problems and infections [14]. Although some argue that there has been limited research on the microbial diversity of indoor environments [15], this topic has been investigated for years [16,17]. Based on this, ventilation, whether natural or mechanical, plays a crucial role in reducing indoor contaminant concentrations in dwellings that may pose health risks to occupants.
Over the past decade, molecular studies have highlighted variations in microbial communities within the built environment, with differences observed based on building systems, microbial colonization in newly constructed buildings, and the interaction between human and home microbiomes [18,19,20]. For decades, research has investigated microbiological contamination in buildings suspected of contributing to respiratory issues. For example, Nevalainen et al. [21] examined indoor air bacteria in homes with natural, mechanical exhaust, and combined mechanical exhaust and supply ventilation, highlighting that while indoor environments harbor a diverse and abundant range of fungi and their metabolic products, the health impacts of these exposures remain poorly understood and difficult to assess. Fungi and bacteria, both key decomposers of organic matter, are common indoor contaminants, originating from outdoor air infiltration, occupant activities, and contaminated building materials and furnishings [22]. As such, occupants are exposed to microbial sources and contaminants within homes. Inhalation of endotoxins can have adverse health effects, triggering biochemical and cellular responses that contribute to conditions such as sick building syndrome (SBS) and chronic lung diseases. SBS is marked by symptoms like nasal and pharyngeal irritation, skin dryness, itchy eyes, headaches, and respiratory issues such as asthma. However, some studies suggest that early-life endotoxin exposure may reduce the risk of atopic diseases [23]. Microorganisms can easily transfer from humans to indoor surfaces, where they can survive and retain infective capacity under specific conditions, as observed with COVID-19 [24]. Cultivation-based techniques, the most common method for identifying microorganisms on indoor surfaces, have shown that kitchens and restrooms are hotspots for bacterial contamination [18]. High concentrations of fungi and bacteria in the built environment have been linked to a range of communicable and non-communicable diseases, as well as increased mortality rates [25]. Thus, microbiological studies are critical for understanding how microorganisms influence health, either by promoting or protecting against illness. Many microorganisms, however, cannot be easily cultured, limiting our understanding of their diversity in indoor environments [18]. Additionally, quantitatively assessing IAQ in terms of health effects remains challenging due to various influencing factors, including indoor contaminants, ventilation systems, temperature, and relative humidity (RH) [26]. These factors can influence building codes, standards, and material choices, including dwelling floor plans, as more data becomes available.
The TAMC and TYMC [27] are used as key indicators to evaluate microbial contamination levels in indoor spaces in homes. Only few studies sample and evaluate these parameters in existing dwellings [28], although their relationship with potential health risks is widely recognized [29]. Despite extensive research on chemical indoor contaminants, quantitative microbial assessments in residential homes using TAMC and TYMC are scarce, particularly when considering building typology, HVAC systems, occupancy, ventilation practices, and climatic differences. Additionally, seasonal variations in microbial contamination are underexplored in Southern European contexts. Addressing these gaps is essential to improve IAQ management and protect occupant health.
In the context of sustainable development, improving IAQ in residential buildings is essential to ensure healthy indoor environments while reducing energy consumption. Current building regulations increasingly promote airtight and energy-efficient dwellings; however, these strategies must be balanced with adequate ventilation to prevent the accumulation and amplification of indoor microbiological contaminants. Therefore, understanding the relationship between building design, ventilation practices, and microbiological IAQ is critical for developing sustainable and healthy housing strategies.
This study evaluates indoor microbiological contamination in residential homes by measuring TAMC and TYMC in living rooms, bedrooms, and kitchens of twenty residential units in Pamplona and Seville, Spain. These cities represent two different climate zones in Southern Europe: (1) Pamplona, with predominantly natural ventilation (Cfb and 4C according to Köppen–Geiger and ASHRAE climate classifications), and (2) Seville, where air conditioning is typically used during high summer temperatures (Csa and 2A). TAMC and TYMC serve as indicators of microbiological quality, helping to identify potential health risks from indoor contamination. In this study, the measurements were conducted during two consecutive summer campaigns. The study analyzes TAMC, TYMC, and indoor/outdoor (I/O) amplification ratios to evaluate their relationship with key parameters influencing IAQ, including HVAC, building period, building typology, room type, kitchen type, occupancy ratio, and presence of pets. The ultimate goal is to answer the following research questions:
(1)
How do TAMC, TYMC, and I/O amplification ratios vary across different indoor spaces?
(2)
How do building and occupancy factors, such as HVAC type, building age, kitchen design, occupancy density, and the presence of pets, affect TAMC, TYMC, and I/O amplification ratios?
(3)
How do ventilation practices (natural vs. air conditioned) and climatic differences between Pamplona and Seville influence microbial contamination patterns and seasonal variations during consecutive summer campaigns?

2. Materials and Methods

The study involved selecting a sample of dwellings from two different locations with varying environmental conditions and building characteristics. Microbiological samples were collected from multiple rooms in each dwelling to assess bacterial and fungal contamination. Environmental data, including temperature, relative humidity, and air quality parameters, were monitored over an extended period using specialized equipment. Data analysis included statistical methods to examine relationships between microbial contamination and factors such as indoor environmental conditions, building types, and occupancy characteristics. A multilevel mixed effects linear regression was used to account for multiple influencing variables and identify key determinants of IAQ.

2.1. Dwelling Characterization

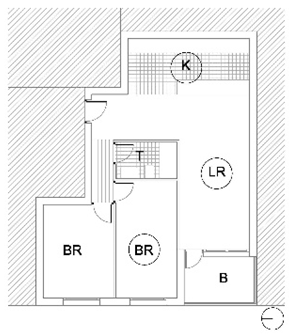
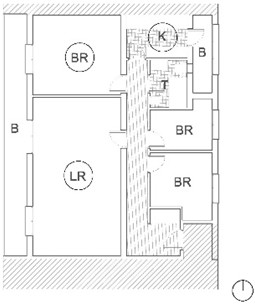
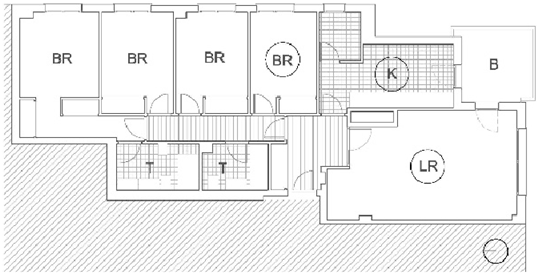
The current study involved the selection of 20 dwellings in Spain, with 10 located in the city of Pamplona and 10 in the city of Seville (floor plans of the dwellings are provided in Table A1). The dwellings were selected through a purposive sampling strategy aimed at capturing representative residential building typologies, ventilation systems, and climatic contexts in both cities. The study was designed as an exploratory field investigation of real residential conditions rather than a statistically representative population survey.
The sample of 20 dwellings is relatively small for broad statistical generalization, particularly given the diversity of building typologies and occupancy patterns included in the study. Consequently, the statistical power to detect subtle differences between some subgroups may be limited. However, this sample size allows for meaningful comparisons of indoor microbial contamination across building types, occupancy patterns, and climatic conditions, which is appropriate for an IAQ-focused study rather than an in-depth analysis of microbial diversity. Therefore, the findings should be interpreted as indicative trends that contribute to understanding the relationship between building design and indoor microbiological air quality, rather than as universally generalizable conclusions.

2.1.1. Location

Pamplona is in a temperate climate zone classified as Cfb under the Köppen–Geiger classification [30], D1 according to the Spanish Technical Building Code (CTE) [31], and 4C under ASHRAE climate classification [32]. The selected dwellings, as is common in the area, rely on natural ventilation and passive traditional design practices adapted to the region’s moderate climate with low humidity. On the other hand, the city of Seville falls within one of the more severe summer climate zones in Southern Europe. The climate of the location is classified as Csa under the Köppen–Geiger system, B4 according to the CTE, and 2A under the ASHRAE standard. Due to the region’s extreme high temperatures during summer (often exceeding 40 °C (104° F) during heatwaves), the installation of air conditioning in homes is common practice. However, households typically do not operate air conditioning continuously mainly due to economic reasons, and instead, it is used intermittently, primarily when occupants are at home and begin to feel thermal discomfort.

2.1.2. Building Typology

All the selected dwellings in this study were located in multifamily buildings, characterized by the following building typologies: (1) linear block (T1), where all dwellings are cross-ventilated (180°), with living rooms typically oriented towards the main street; (2) H-shaped block (T2), where all dwellings are cross-ventilated (180°), with the living room facing the main street and the kitchen and some bedrooms oriented towards an interior courtyard; (3) dwellings in multifamily buildings with a single orientation towards a street or square and with natural ventilation (T2B); and (4) tower (T3), where all dwellings are cross-ventilated (90° or 180°). The specific characteristics and typology of each selected dwelling in the study are summarized in Table 1.

2.1.3. Building Period

Regarding construction regulatory periods and their impact on energy efficiency and IAQ, considerations include not only thermal insulation but also the use of hybrid ventilation systems or heat recovery ventilation (HRV) systems compared to traditional natural ventilation. The specific building codes under which each selected dwelling was built are summarized in Table 1.
The first Spanish building code related to energy efficiency (NBE-CT-79) was published in 1979, which required (for the first time) the insulation of the building envelope to improve energy performance. However, the code lacked specific ventilation requirements [33]. Residential buildings from this period (NBE-CT-79) and before (pre-NBE-CT-79) rely on natural ventilation, with local regulations outlining varying ventilation needs. Due to habitability standards, all kitchens and bathrooms are statically ventilated through roof exhaust systems.
The first edition of the current Spanish Building Code was published in 2006 [34], which introduced more stringent building envelope energy performance standards [31] in line with the Energy Performance of Buildings Directive of 2002 (EPBD), as well as ventilation requirements for maintaining IAQ [35]. These requirements could be met through natural ventilation, vents or mechanical systems, such as HRV, which are commonly used in energy-efficient buildings under the Passivhaus standard.
In this study, 40% of the assessed dwellings were built before NBE-CT-79, meaning they lack building envelope insulation and consequently show poor energy performance. A total of 20% of the dwellings of the study were built according to NBE-CT-79, while 40% complied with the current Spanish building code (CTE) (Table 1). For the purpose of this study, all dwellings that were built before the CTE were grouped together and called PRE-CTE.

2.1.4. Assessed Parameters

Microbiological samples and environmental data were collected from three rooms in each of the 20 dwellings of the study: (1) living room (LR); (2) bedroom (BR); and (3) kitchen (K). The bedroom was typically located in the opposite building orientation from the living room (Table 1). Although only living rooms, bedrooms, and kitchens were sampled in this study, these rooms represent the primary spaces where occupants spend most of their time and are therefore the most relevant for assessing exposure to indoor microbial contamination. Bathrooms, halls, and utility spaces were not included. While these areas can serve as microbial hotspots, they are typically less frequently occupied. Focusing on the main living areas allows for a more direct evaluation of potential health risks to occupants.
As described in Table 1, per dwelling, in addition to location, building period, building typology and type of room, other parameters considered in the analysis of this study include the following: (1) the occupancy ratio, which represents the number of regular occupants per total dwelling area (m2), based on the number of permanent residents in each dwelling rather than real-time occupancy during microbiological sampling. The parameter was categorized dichotomously for statistical analysis as <30 m2/person and ≥30 m2/person and was applied uniformly across the entire dwelling. (2) Kitchen typology, which includes (K1) kitchen separated from the living room by a vestibule, (K2) kitchen with a door or sliding partition directly connecting to the living room, and (K3) kitchen integrated into the living room. (3) Last is the presence of pets (i.e., dog, cat, rabbit, etc.). In this study, no smokers were present in any of the dwellings.
Cleaning frequency, window opening, and air-conditioning use patterns were not systematically collected in this study. Although these occupant behaviors may influence indoor microbial levels and I/O ratios, they were not quantified because the study focused on overall indoor microbial contamination across different building types, room types, and climates. Capturing detailed behavioral patterns would have required continuous, long-term monitoring, which is beyond the scope of this study [36].

2.2. Monitoring of Indoor Environmental Quality and Microbiological Samples

Monitoring was conducted during summer conditions across two summer campaigns in 2021 and 2022. Additionally, qualitative data (such as occupancy ratio, kitchen typology and presence of pets) were collected for each dwelling, as described in Table 1.

2.2.1. Microbiological Data Collection

To assess the bacterial and fungal contaminant levels in the assessed dwellings and their outdoor environments, biological air samples were collected in Pamplona and Seville once during the summer of each year (2021 and 2022). In each dwelling, 100 L of air was sampled in the living room, bedroom and kitchen using an Air IDEAL 3P sampler (Biomerieux, Marcy l’Etoile, France). Air sampling was conducted at a height of approximately 1.0–1.5 m above the floor, corresponding to the typical breathing zone of occupants. In each room, sampling was performed at a central location to represent general exposure conditions. For the determination of TAMC (bacteria + fungi), the air was analyzed on Petri dishes containing Tryptic Soy Agar (TSA, Biomerieux), while TYMC (fungi) was assessed on Petri dishes with Sabouraud Agar with chloramphenicol (SAB-C, Biomerieux), following the European Pharmacopoeia [27]. After the sampling, the plates were transported to the Food and Water Microbiology Laboratory at the University of Navarra under appropriate temperature conditions (4 °C). TSA plates were incubated at 30 °C ± 1 °C for 72 h using a HERAEUS B6200 incubator (Hanau, Alemania), and SAB-C plates were incubated at 22 °C ± 2 °C for 5 days using a SANYO MIR-154 incubator (Oizumi, Japón). After the incubation periods, colony counts were performed using a SUNTEX colony counter (Taipéi, Taiwán) and the results were expressed as colony-forming units per cubic meter (CFU/m3). Quality control included calibration of the air sampler, sterile handling of culture media, and incubation under controlled temperature conditions as described above.

2.2.2. Indoor Environmental Monitoring

In this study, indoor environmental data were collected from living rooms and bedrooms. As data from kitchens were unavailable, the kitchen temperature (°C) was estimated based on the living room temperature. Outdoor temperature (°C) data were sourced from the Pamplona weather station (meteonavarra.es) and the weather station located at the University of Seville. Additionally, supplementary monitoring data, including temperature (accuracy: ±0.5 °C), CO2 concentration (accuracy: 30 ± 3% ppm), and relative humidity (accuracy: ±3%), were collected using MICA data-loggers (inBiot Monitoring SL, Mutilva, Navarra, Spain). These data-loggers recorded indoor environmental parameters at 10 min intervals over a 15-month period (from June 2021 to September 2022), with real-time data accessible online. For this study, we only used the data corresponding to the periods of the microbiological sample collection.

2.3. Data Analysis

Data cleaning was conducted to ensure accuracy and consistency of the dataset. Obvious errors and missing values were identified and handled appropriately, while outliers were assessed and treated in accordance with the study design.
In the absence of national or international regulations specifying maximum microbial levels in indoor environments acceptable for occupants, we referenced the UNE 100012 standard [37] for air-conditioning system sanitization, which sets microbiological standards for indoor air. This standard indicates that TAMC levels should remain below 800 CFU/m3, though no maximum values for TYMC are specified. Analysis was performed in relation to location and type of room. To illustrate the relationship between the variables and predict the value of one variable based on another, we performed a regression analyses, relating TAMC and TYMC counts to indoor CO2 levels (ppm), temperature (°C), and relative humidity (%).
The indoor/outdoor (I/O) ratio is widely used in IAQ [38,39,40] and bioaerosol emission studies [41,42] as a comparative indicator of indoor versus outdoor microbial sources and has been applied to identify indoor amplification or infiltration processes. As shown by Balasubramanian et al., the I/O ratio refers to the relative abundance of microbes in the indoor air with reference to the outdoor concentration. Similarly, Kim et al. [43] and Li et al. [44] reported that an I/O ratio of airborne bacterial and fungi concentrations below 1 suggests that outdoor air is the main source of indoor bioaerosols, while a ratio above 1 indicates that indoor sources dominate. In this study, I/O ratios were used to identify microbial amplification, with values > 1 indicating increased concentrations of TAMC or TYMC indoors relative to outdoors. Using this ratio, a descriptive analysis in relation to location, type of room, building period, and building typology were performed.
Finally, a statistical analysis was conducted using GraphPad Prism version 8.0.1 (GraphPad Software, San Diego, CA, USA) and STATA statistical software version 16 (StataCorp LLC, College Station, TX, USA). Microbial count data were not normally distributed; therefore, non-parametric statistical tests were applied where appropriate. Medians were used for descriptive analysis of TAMC and TYMC, while means were used for environmental parameters due to their approximately normal distribution. To assess differences between groups, a mixed-effects analysis with robust variance estimators (vce) was employed. Additionally, we conducted multivariate statistical analyses using a multilevel mixed-effects linear regression model. This method allowed us to obtain results for each analyzed parameter independently while adjusting for the influence of other parameters. The independent variables included in the multivariable study were the following: (1) location (Pamplona and Seville); (2) building period (before or after Spanish CTE code); (3) building typology (T1, T2, T2B, and T3); (4) room type (living room, bedroom, and kitchen); (5) kitchen type (K1, K2, and K3 according to its relation to other rooms); (6) occupancy ratio; and (7) presence of pets. The results are presented as beta coefficients with 95% confidence intervals for each category. Beta coefficients correspond to non-standardized regression coefficients, representing the expected change in the dependent variable for each unit change in the predictor. These coefficients reflect the average difference between categories while accounting for potential correlations among variables.

3. Results

3.1. Microbiological Analysis

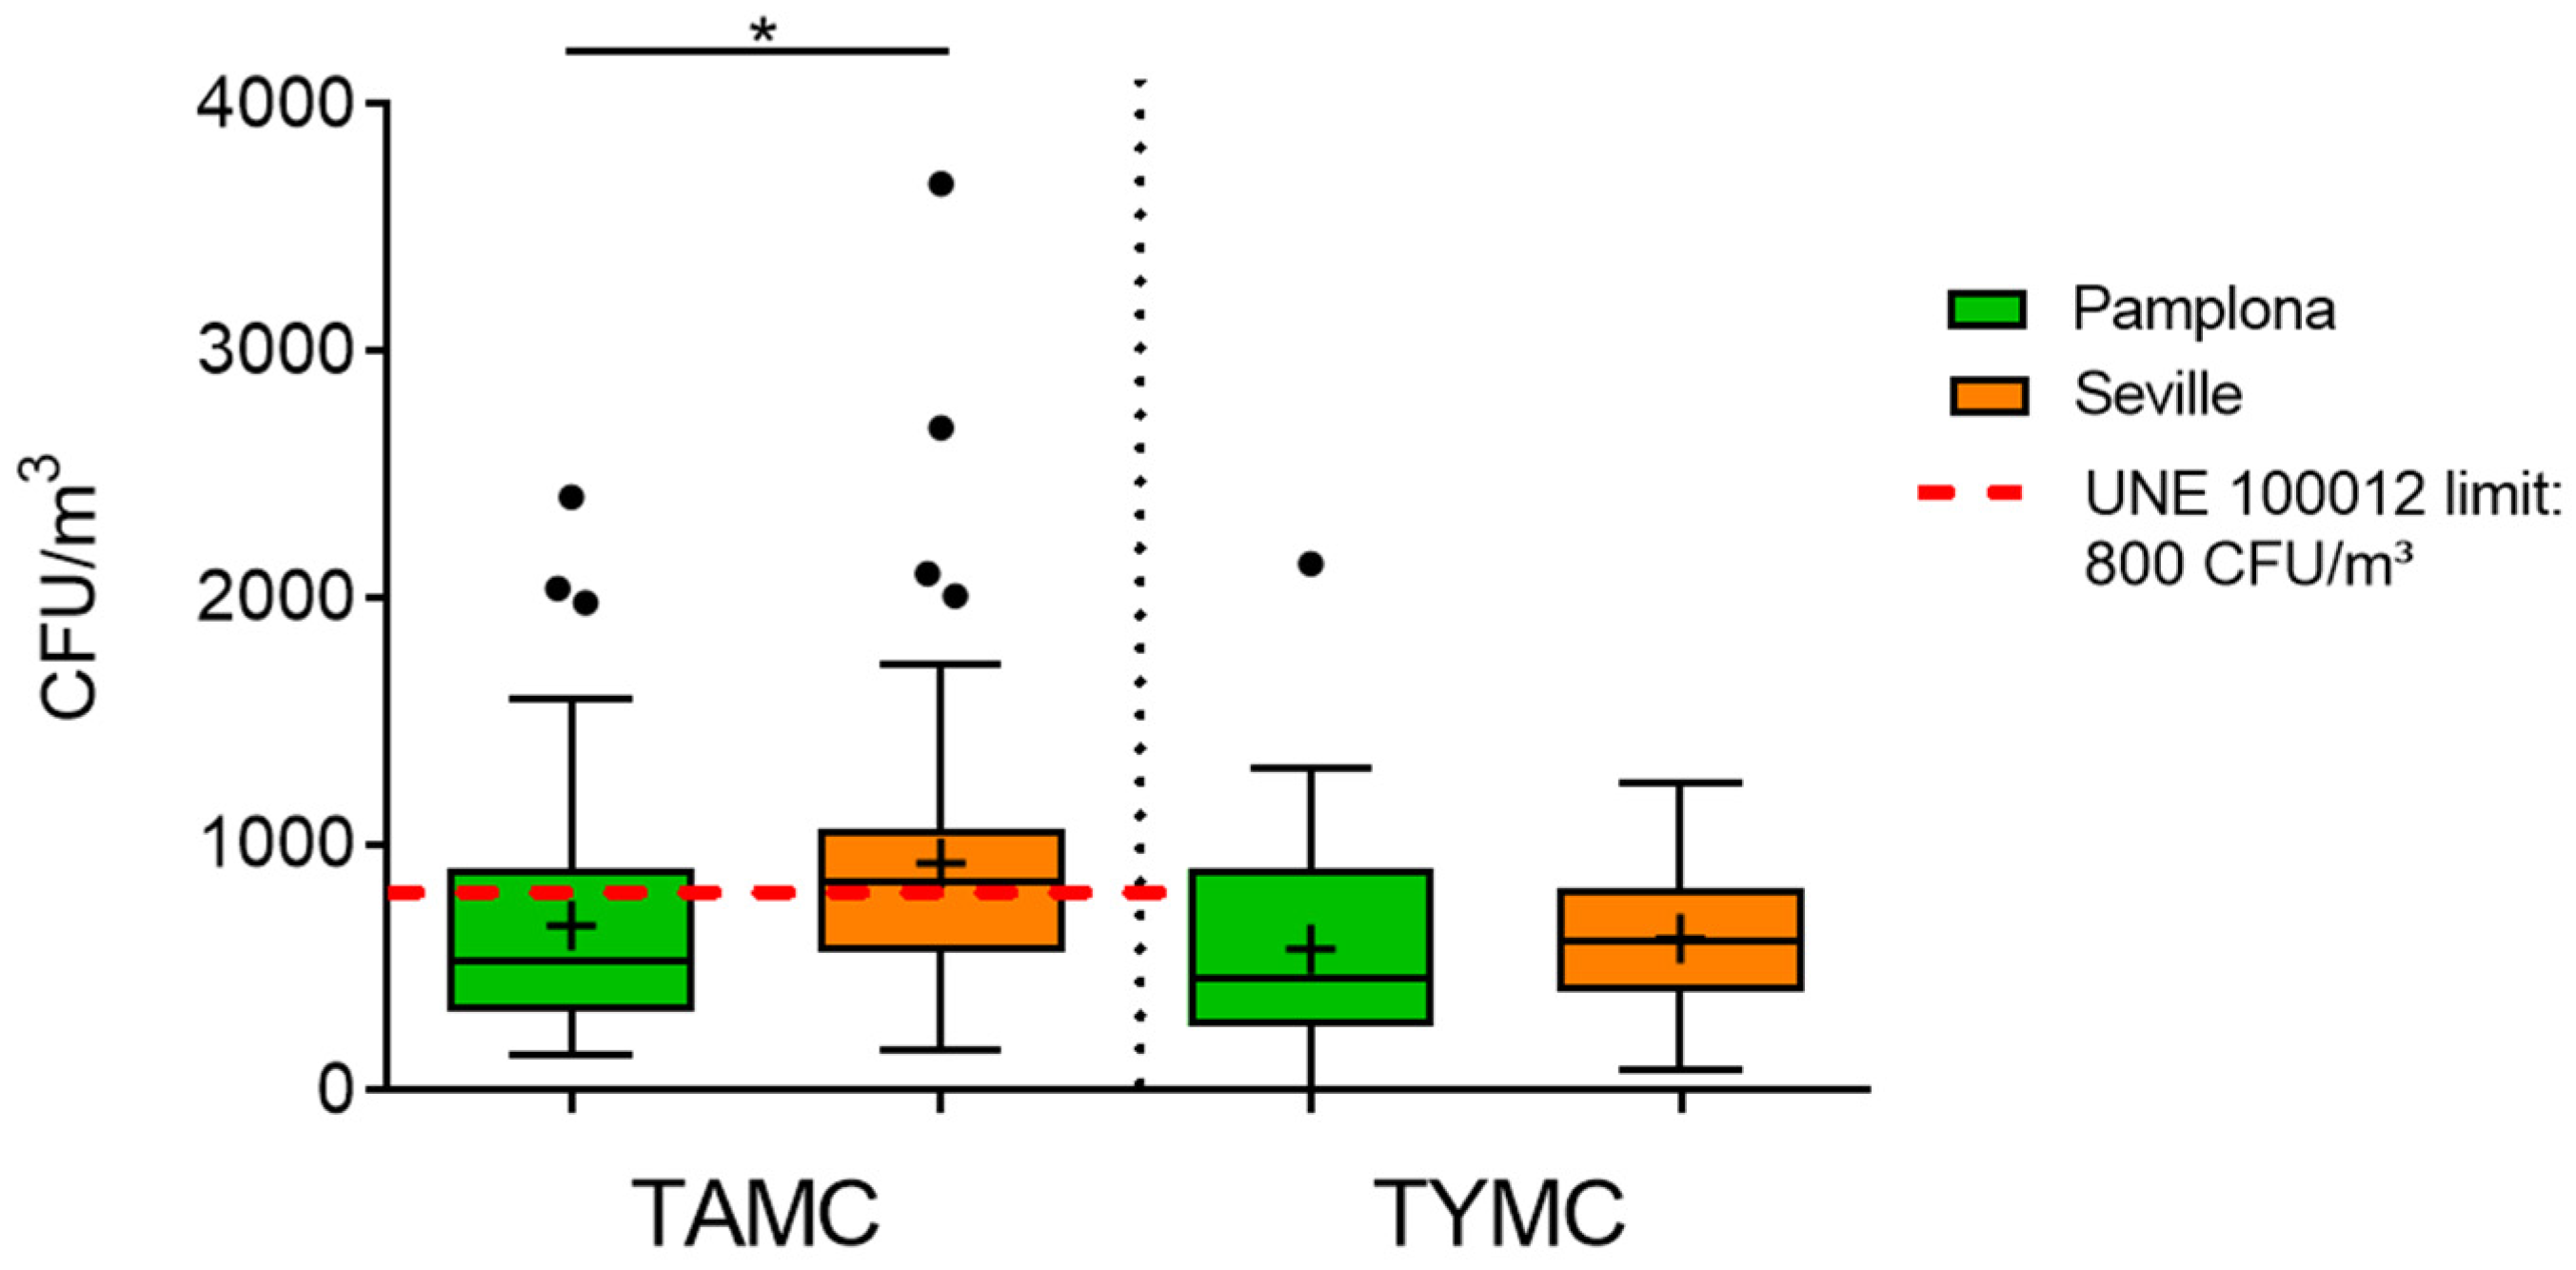
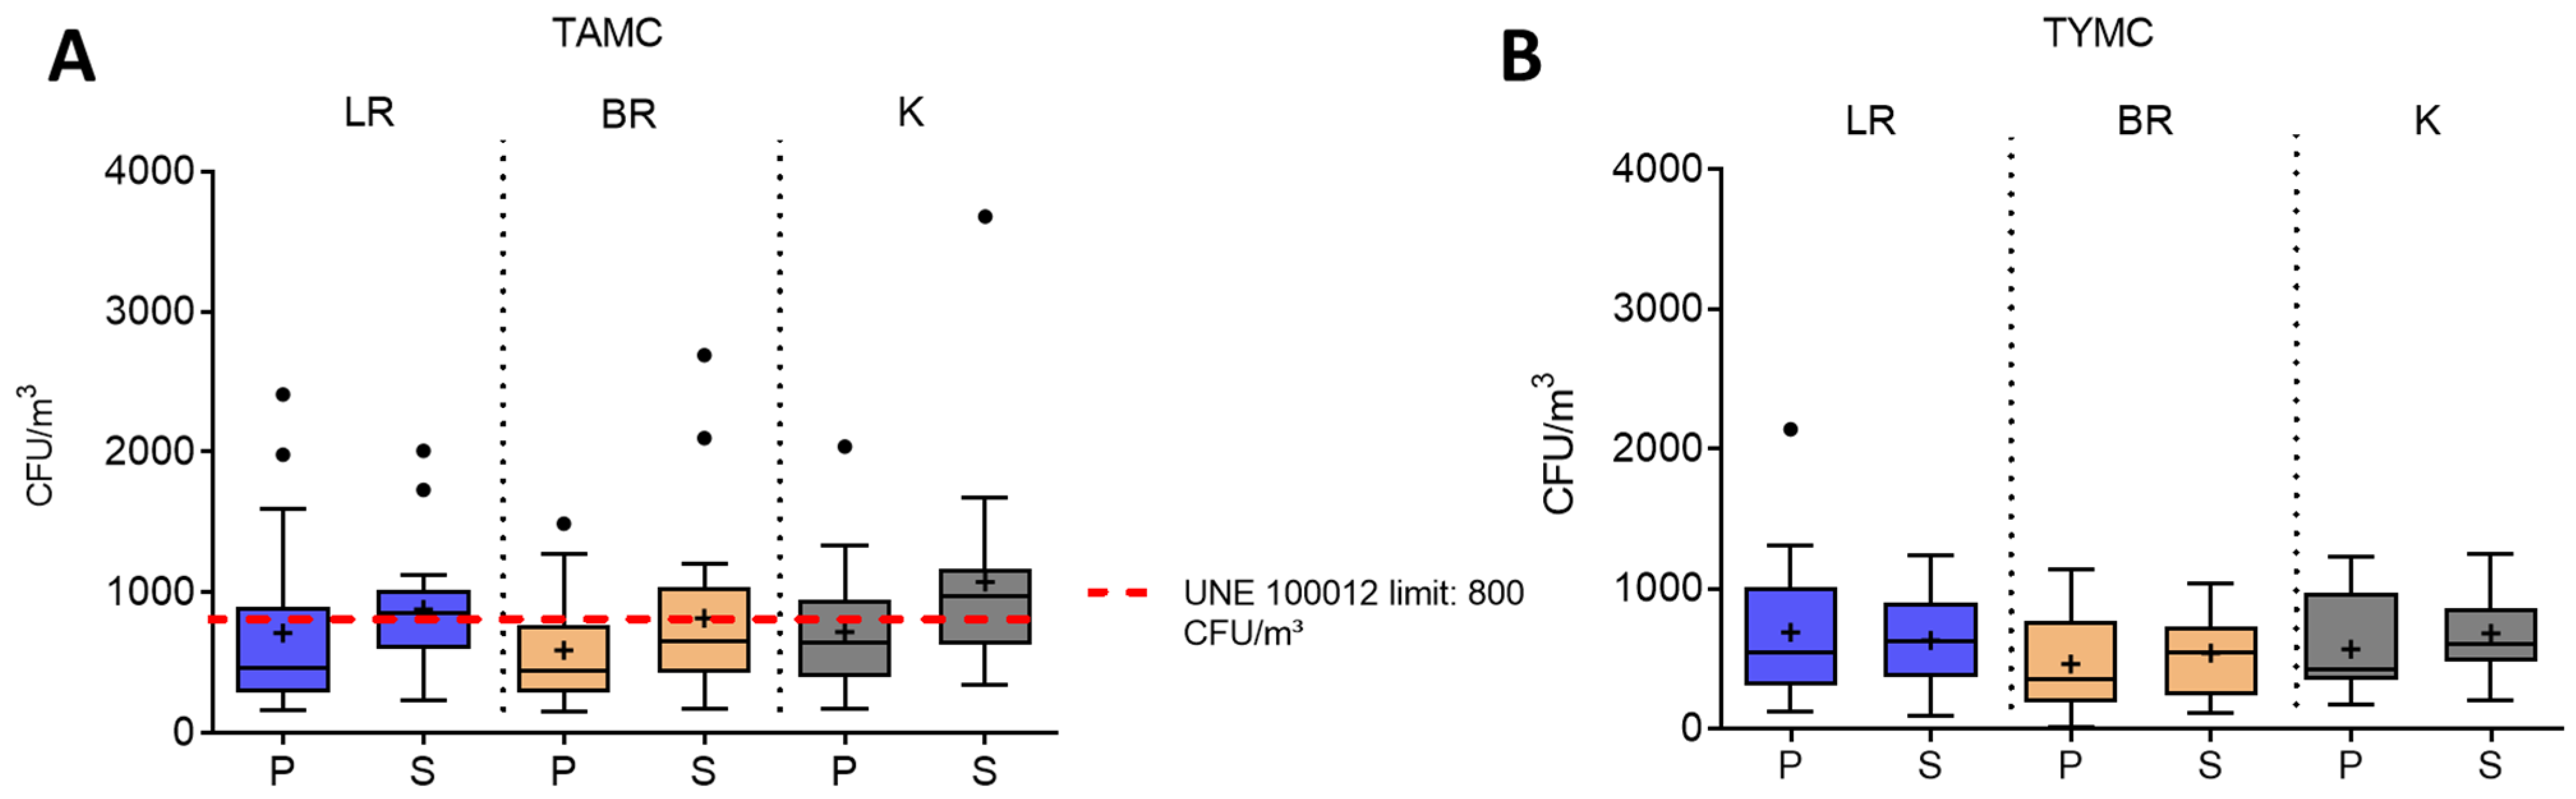
A descriptive analysis was conducted to assess the levels of TAMC and TYMC detected in various dwellings over a 15-month period, corresponding to the summer monitoring campaigns of 2021 and 2022. Figure 1 shows microbial counts (CFU/m3) by location (Pamplona and Seville), while Figure 2 presents the counts by room type (i.e., living room, bedroom, and kitchen).
Regarding location, higher levels of TAMC and TYMC were observed in homes in Seville, with median values of 850 CFU/m3 for TAMC and 610 CFU/m3 for TYMC (Figure 1). According to the UNE 1000121 standard [45] (as explained in Section 2.3), TAMC median levels in Seville exceeded the recommended limit of 800 CFU/m3 by 50 CFU/m3, with significant differences compared to the median levels measured in Pamplona (525 CFU/m3).
Similar results were observed selecting the data by type of room (Figure 2). As shown in Figure 2A, higher counts of TAMC were detected inside the three different rooms of the assessed dwellings of the city of Seville. As expected, the kitchen was the room in which the most counts were detected (median value 970 CFU/m3), followed by the living room (median value 850 CFU/m3). For TYMC (Figure 2B), the highest counts were detected in the living rooms of Pamplona (median value 630 CFU/m3); however, in all rooms, the detected levels remained below the maximum threshold of 800 CFU/m3 established by UNE 100012. No significant differences were observed in the counts of both TAMC and TYMC across the sampled locations in Pamplona and Seville in each of the rooms.
Finally, regarding the counts of the outdoor environments in both cities, both TAMC and TYMC counts were also higher in Seville (median value 1050 CFU/m3 and 870 CFU/m3, respectively), with significant differences only in the case of TAMC (p ≤ 0.0001).

3.2. Environmental Parameters Analysis

Other environmental parameters inside the homes that also affect Indoor Environmental Quality (IEQ) include temperature (°C), CO2 concentration (ppm) and relative humidity (%). The Spanish Building Code (CTE) sets a mean indoor CO2 concentration of 900 ppm for residential spaces (CTE-HS3) [35] corresponding to the IEQII Category (medium level of expectation). According to UNE EN 16798-1 [46], CO2 limits relative to outdoor levels are 800 ppm for living rooms and 550 ppm for bedrooms [46]. In relation to RH, there is no specific limitation for residential spaces in the Spanish CTE, although the recommended healthy RH in residential buildings typically ranges from 30% to 60%. In relation to temperature, typical set-points for energy efficiency established in summer conditions are 25–27 °C under the Spanish Building Code and 23–26 °C for IEQII in the UNE. In this study, these parameters were also monitored during the sampling, and they were in general within the recommended limits (Table 2).
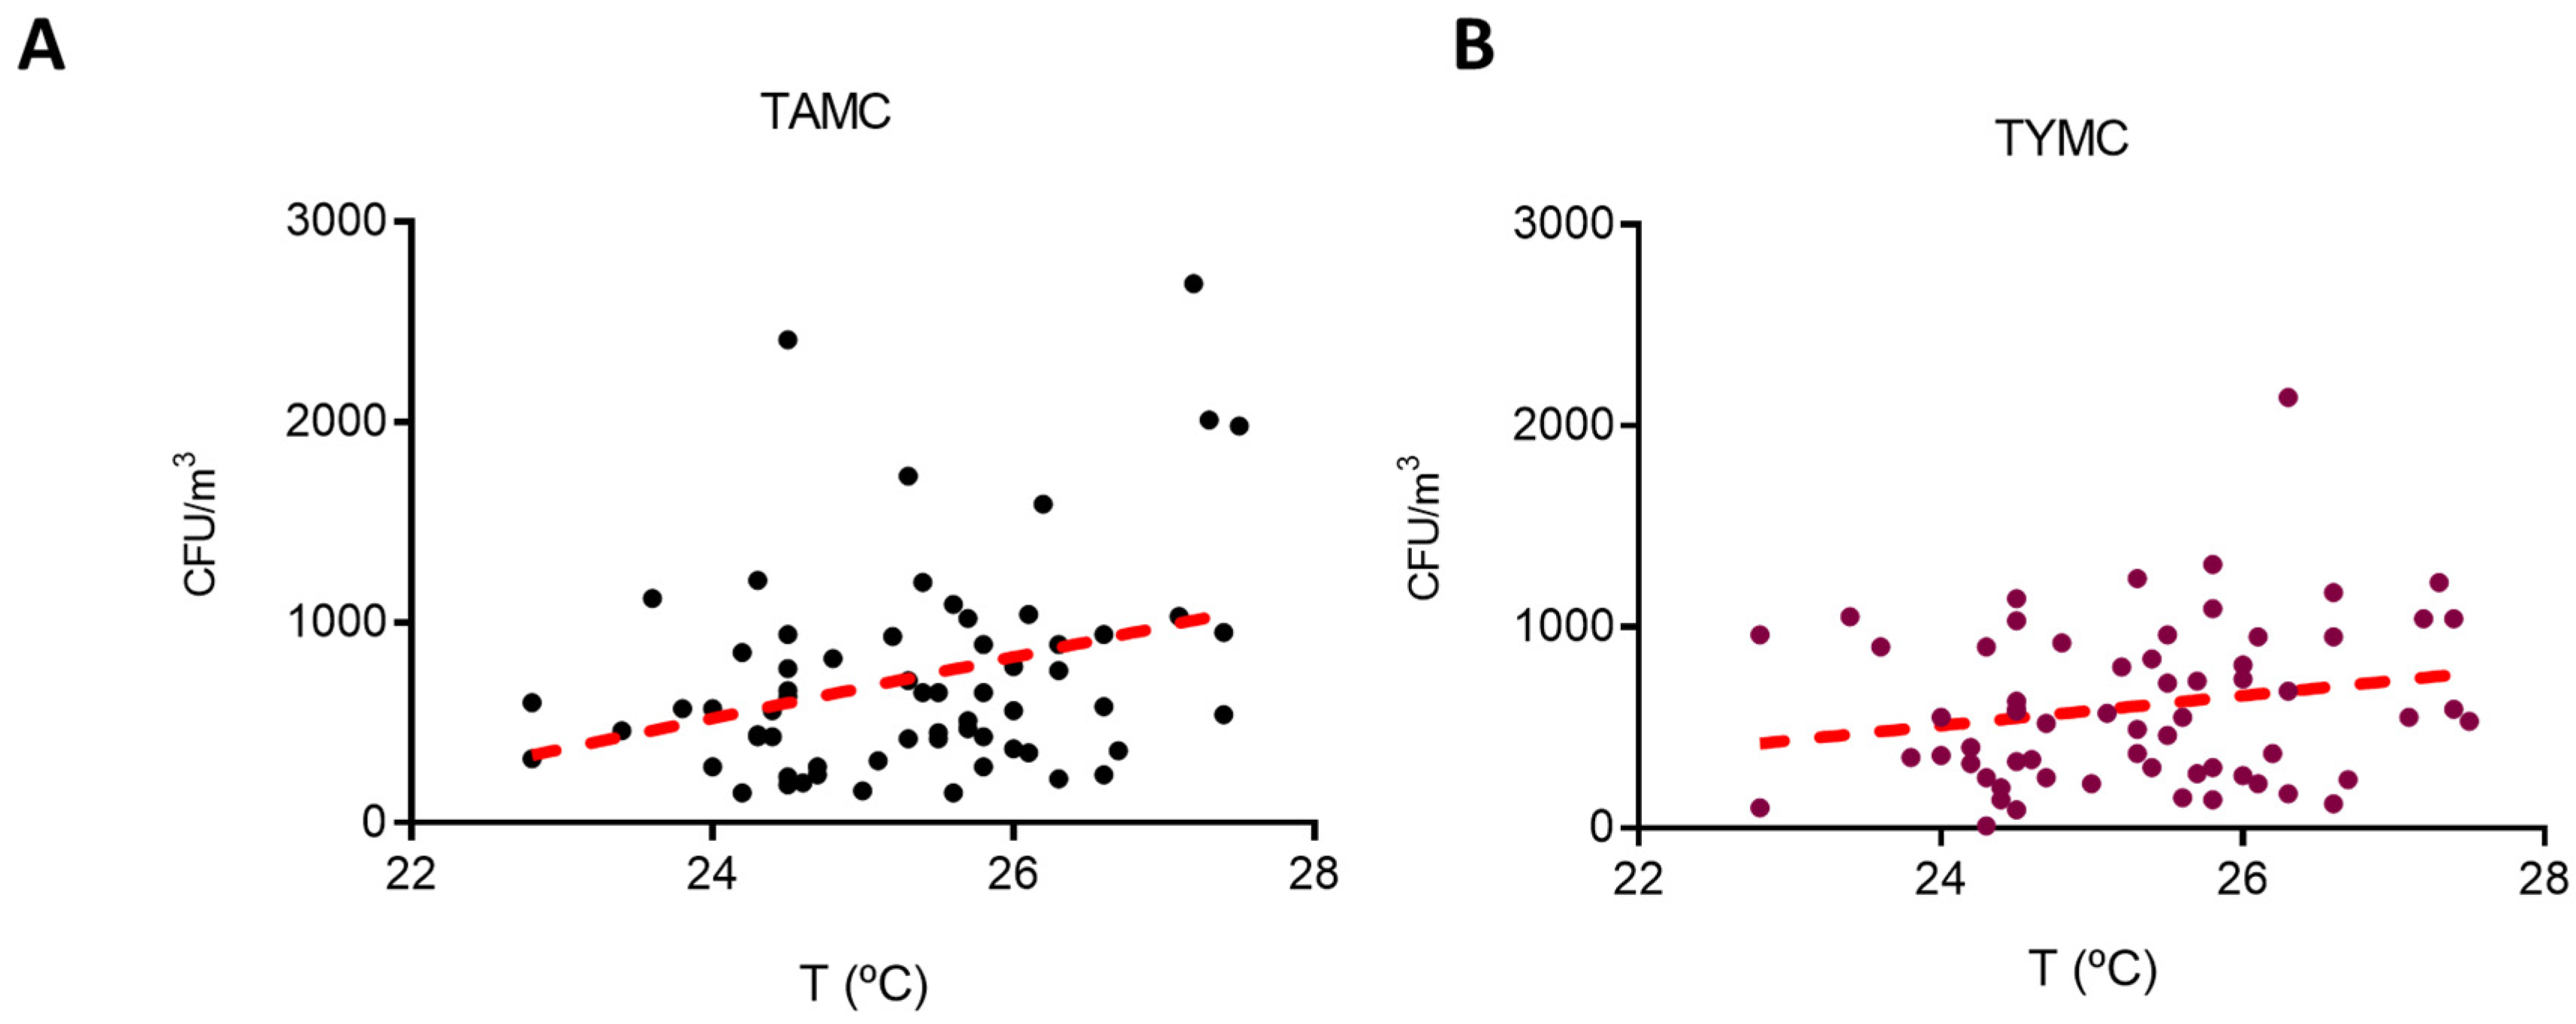
In order to verify whether high levels of these indoor environmental parameters predict higher concentrations of TAMC and TYMC (CFU/m3), data were analyzed using linear regression. In the case of the relationship with temperature (Figure 3), both correlations were positive (values of r = 0.3194 and r = 0.2073, TAMC and TYMC respectively), and the difference was only significant in the case of TAMC (p = 0.01) (Figure 3A).
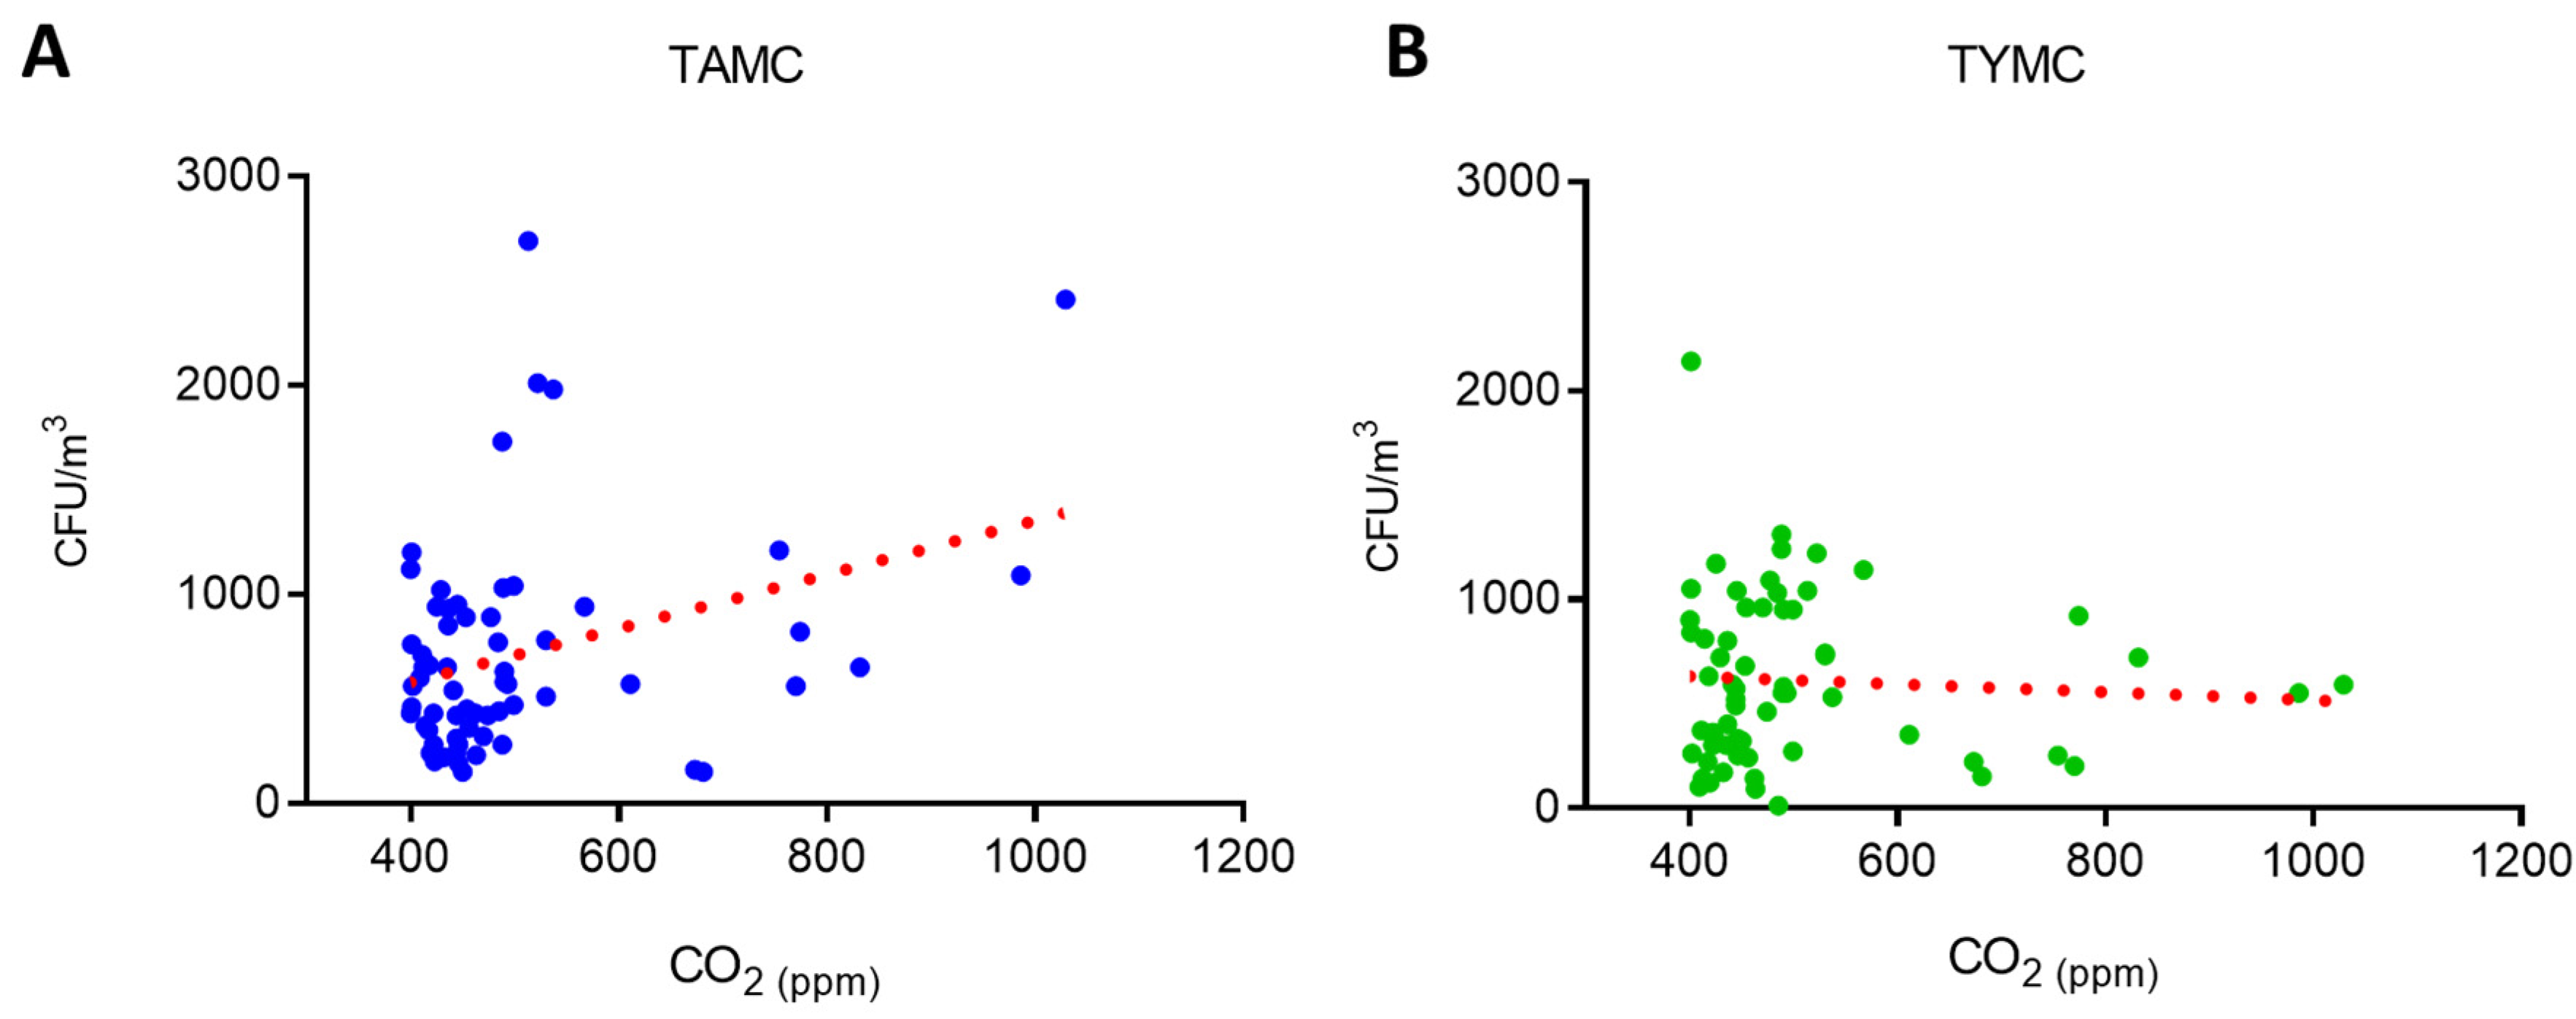
Similar results were obtained by studying the relationship between the microbiological counts and levels of CO2 (Figure 4). In the case of TAMC, correlation was positive with a value of r = 0.3302 and a p = 0.0082, while when studying TYMC, correlation was negative (r = −0.06416) and with non-significant negative correlation.
Finally, regarding the relationship with relative humidity (%), the correlations were very weak (r = −0.07439 and r = 0.0009982, TAMC and TYMC, respectively), and there was no statistical significance in either case.
These results suggest that, within the environmental conditions observed in the study, higher temperature and CO2 concentrations may favor bacterial growth (TAMC) but have limited influence on fungal counts (TYMC). RH, which has been shown in other studies to promote microbial growth above 60% [28], remained below recommended thresholds in our sampled dwellings (Table 2), likely explaining the lack of significant correlations with either TAMC or TYMC.
Overall, these findings indicate that temperature (°C) and occupancy-related factors (as reflected by CO2) may be more influential than humidity in determining indoor bacterial concentrations in typical Southern European homes during summer. They also highlight the importance of monitoring multiple environmental parameters, as fungal growth appears less responsive to these conditions, at least under the ranges observed in this study.

3.3. Data Analysis Studying the Indoor/Outdoor (I/O) Amplification Ratio

The indoor/outdoor ratios (I/O) were calculated using the results of both measurements to indicate whether microbiological amplification had occurred within the dwelling and/or room.
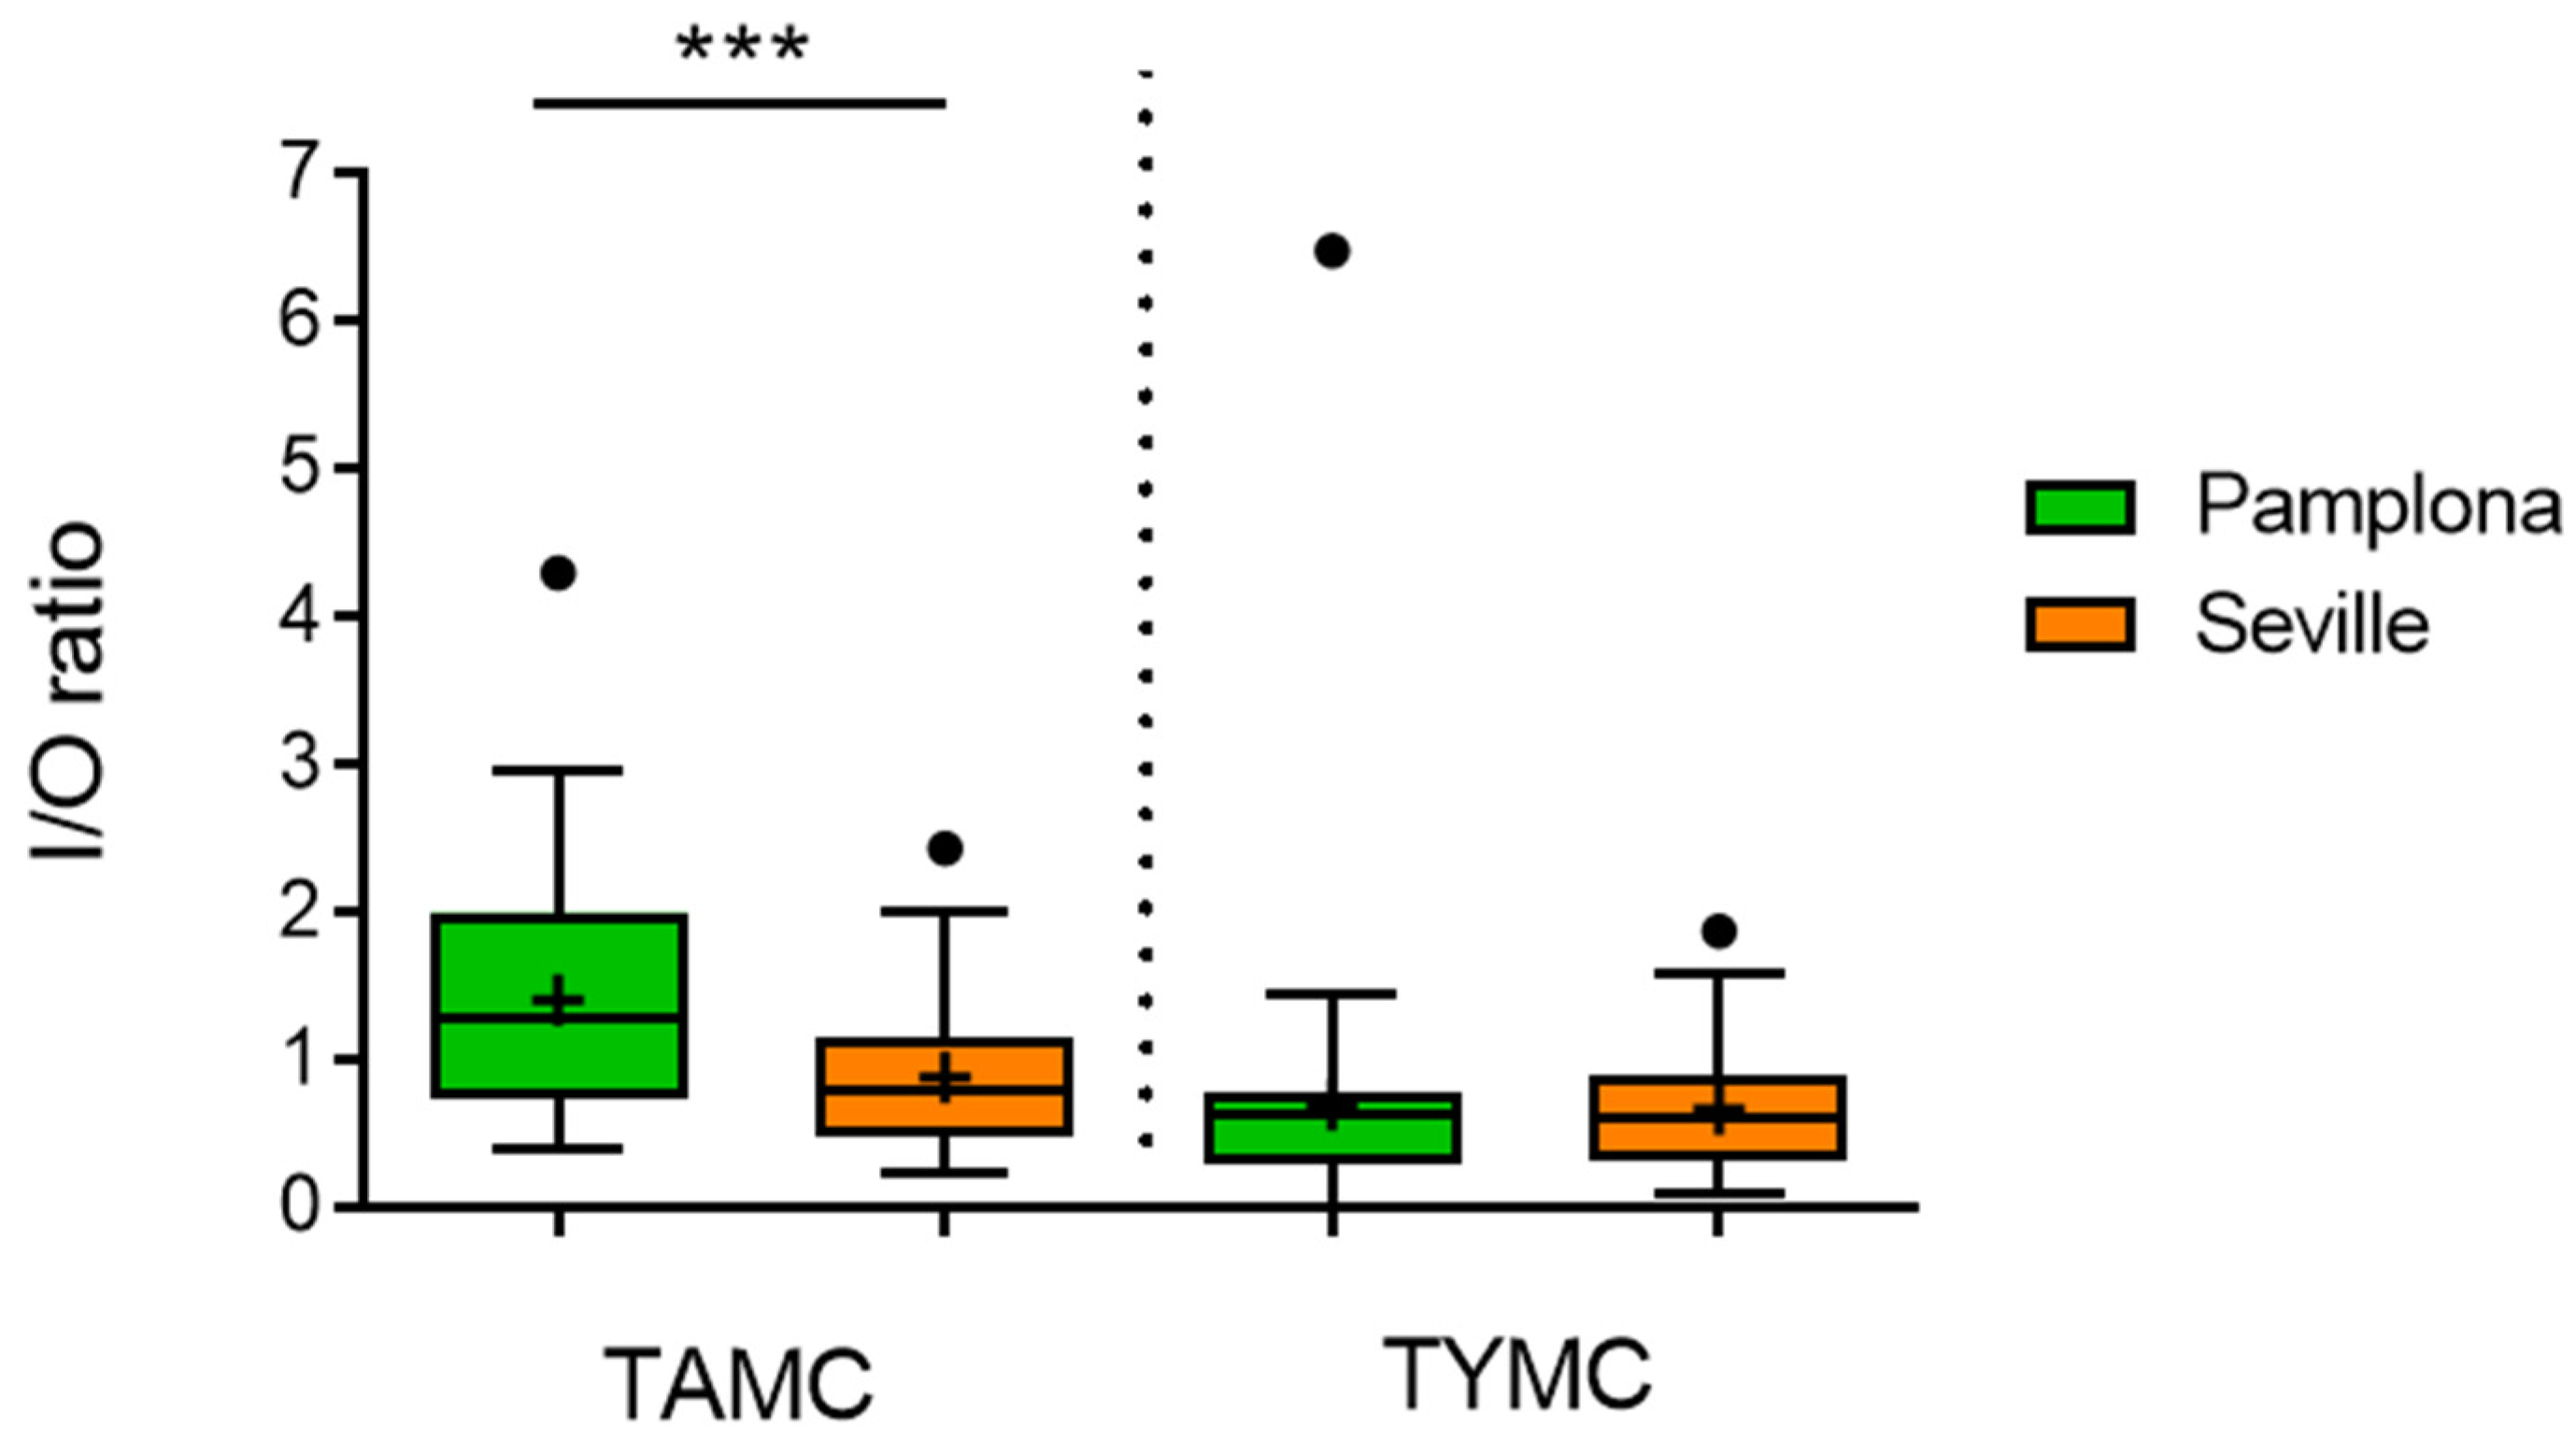
First, studying by building location, the I/O ratios for TAMC and TYMC were generally below 1 at both locations (Pamplona and Seville), except for the I/O TAMC ratio in Pamplona, which was above 1, indicating that microbial amplification had occurred inside the homes of this city (Figure 5). In this case, the differences between Pamplona and Seville were statistically significant. Regarding I/O TYMC, although the median I/O ratio is slightly lower in Seville, no statistically significant differences were observed between both cities.
The consistently low fungal amplification (TYMC < 1) compared with bacterial amplification (TAMC) likely reflects ecological and environmental differences between both groups (in Pamplona and Seville located in two different climate zones). Fungal growth depends strongly on high humidity and surface moisture, conditions generally absent in the sampled dwellings, whereas bacterial levels are more influenced by temperature (°C), occupancy, and CO2 concentration (ppm). Moreover, air movement and ventilation patterns may favor bacterial dispersal, while fungal spores tend to remain on surfaces unless disturbed. These factors together explain the limited indoor amplification of fungi relative to bacteria.
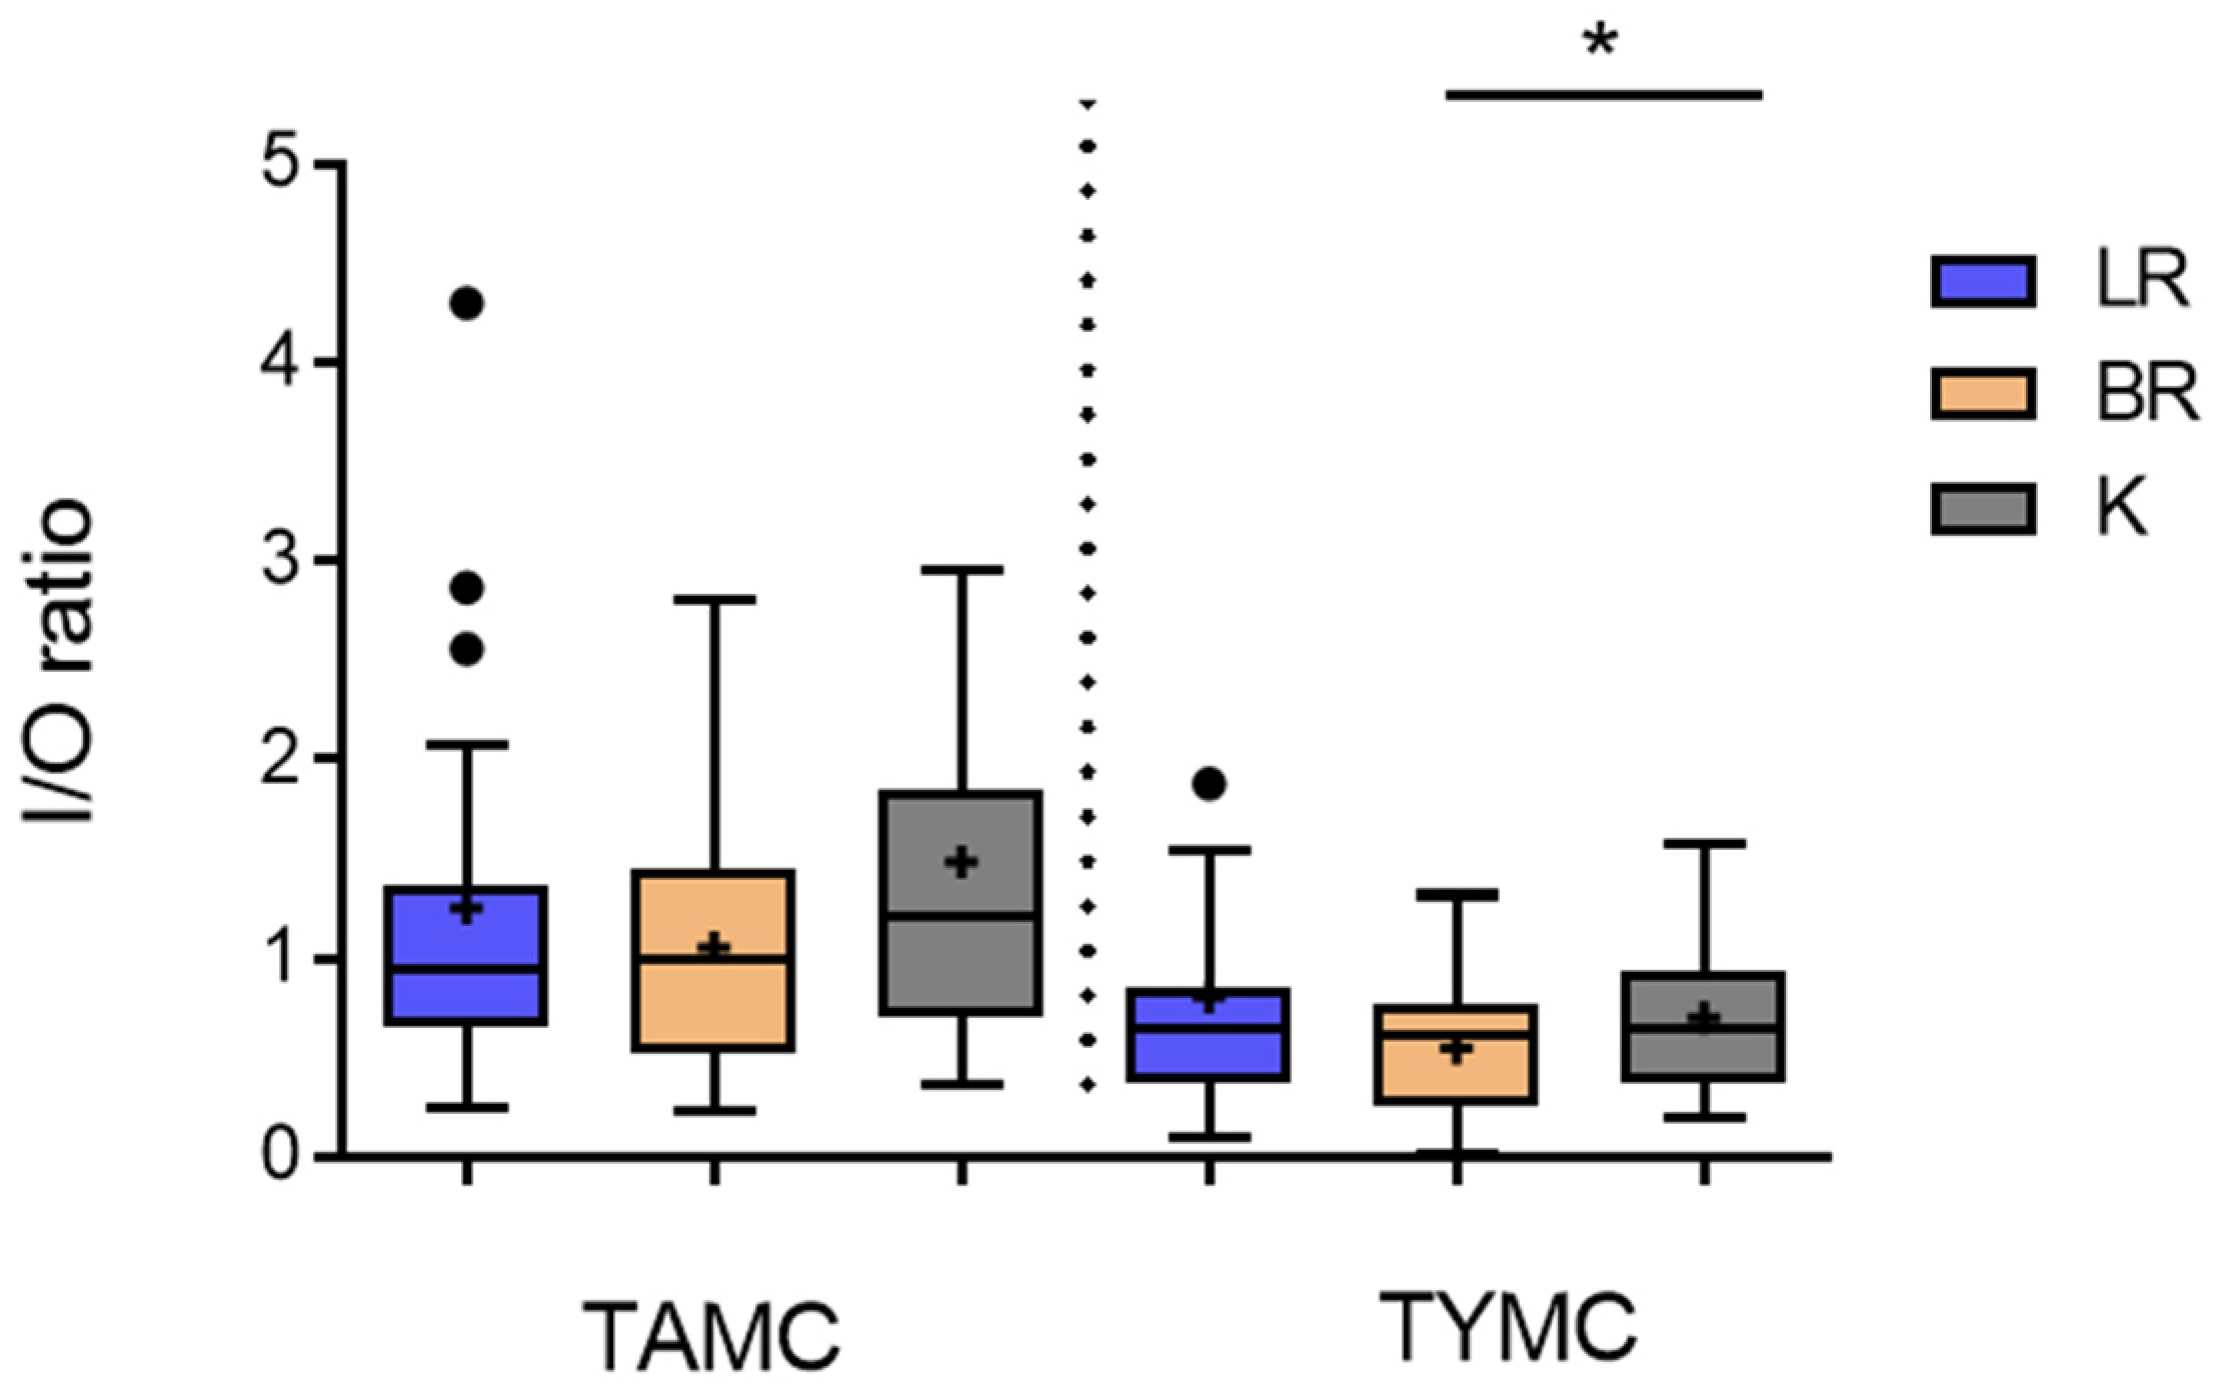
Using I/O ratios to identify the most contaminated room, results for TAMC indicate, as expected and consistent with Figure 2, that kitchens exceeded the threshold value of 1 and exhibited the highest values (Figure 6). Although differences between kitchens and other rooms were not statistically significant, there was a trend towards significance. For TYMC, I/O ratios in all rooms were below 1, with the kitchen showing the highest median value (0.65), and statistically significant differences were observed compared to the bedroom. In the assessed dwellings, all kitchens were equipped with a range hood, which is effective at removing contaminants generated during cooking activities. Nevertheless, microbial levels were higher than in living rooms and bedrooms, likely reflecting inconsistent use of the range hood or insufficient ventilation during cooking activities.
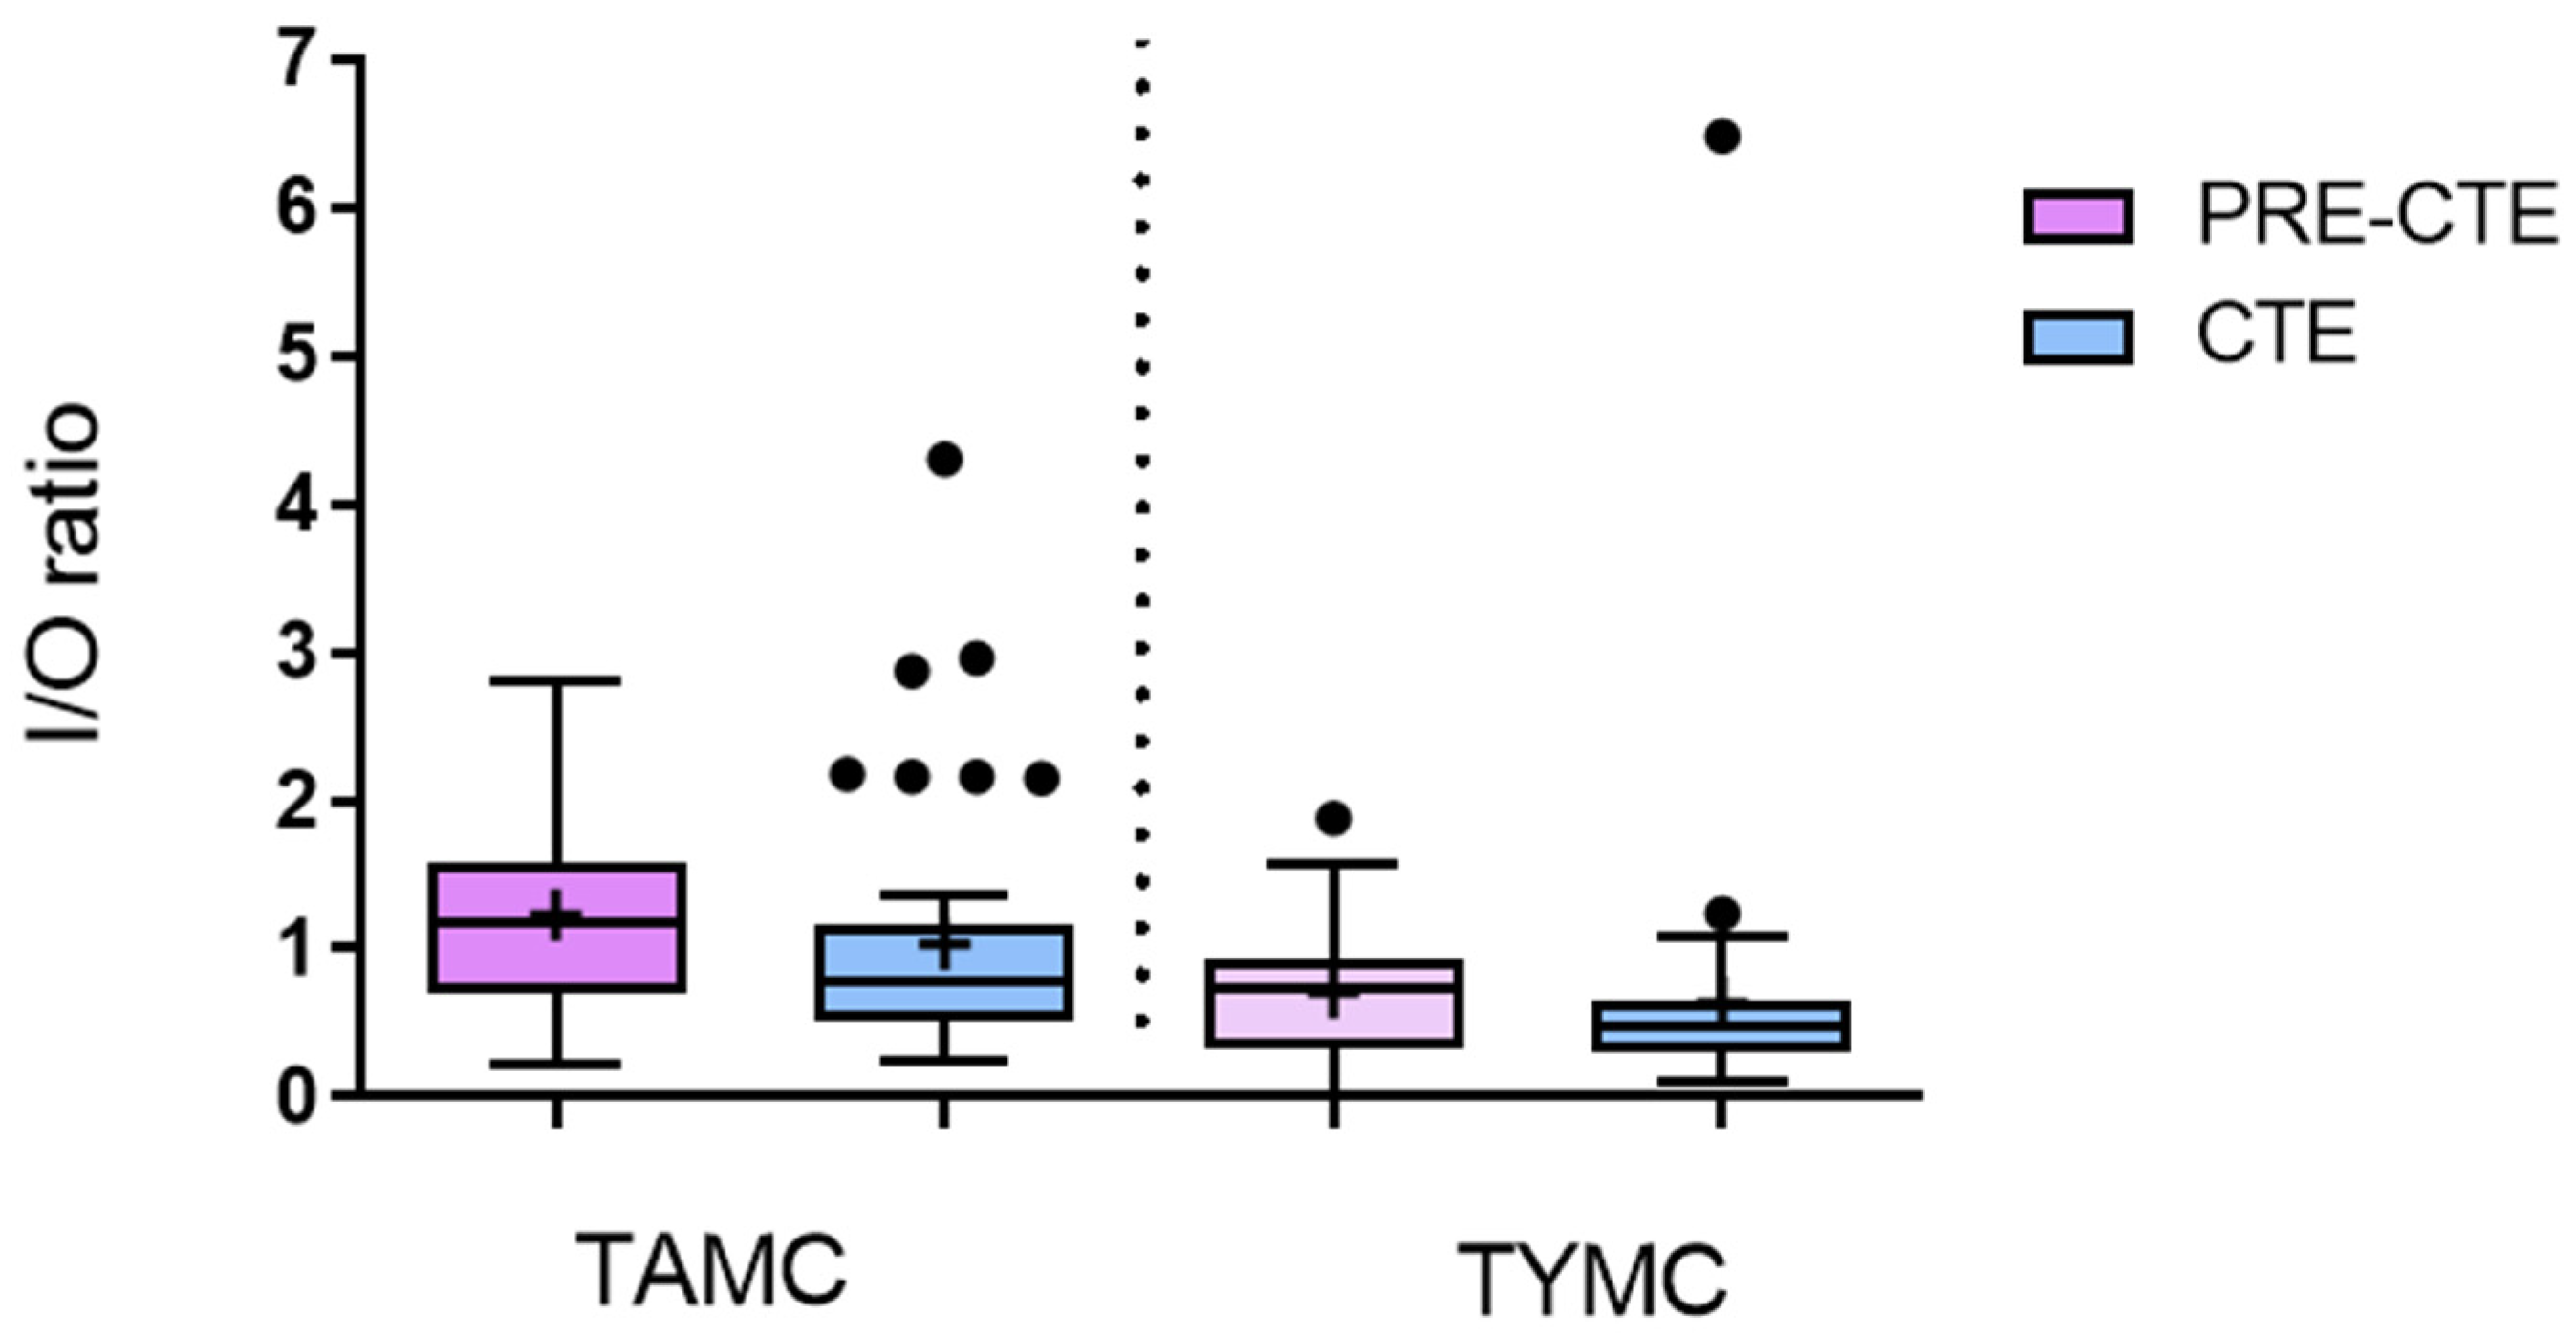
The following analysis classifies dwellings according to the Spanish regulatory construction period (Section 2.1.3). Our working hypothesis is that IAQ improvements would be more relevant in homes built after 2006, due to the ventilation requirements introduced in the Spanish building code (CTE). For TAMC (Figure 7), median I/O ratios in pre-2006 homes (PRE-CTE) exceeded 1, indicating microbial amplification, whereas dwellings built under the CTE period (post 2006) had a median I/O ratio of 0.78. This suggests that regulatory updates with better ventilation in homes may have contributed to improving IAQ, although differences between the periods were not statistically significant. We observed similar trends for TYMC (Figure 7), although in this case, I/O ratios remained below 1 in both periods.
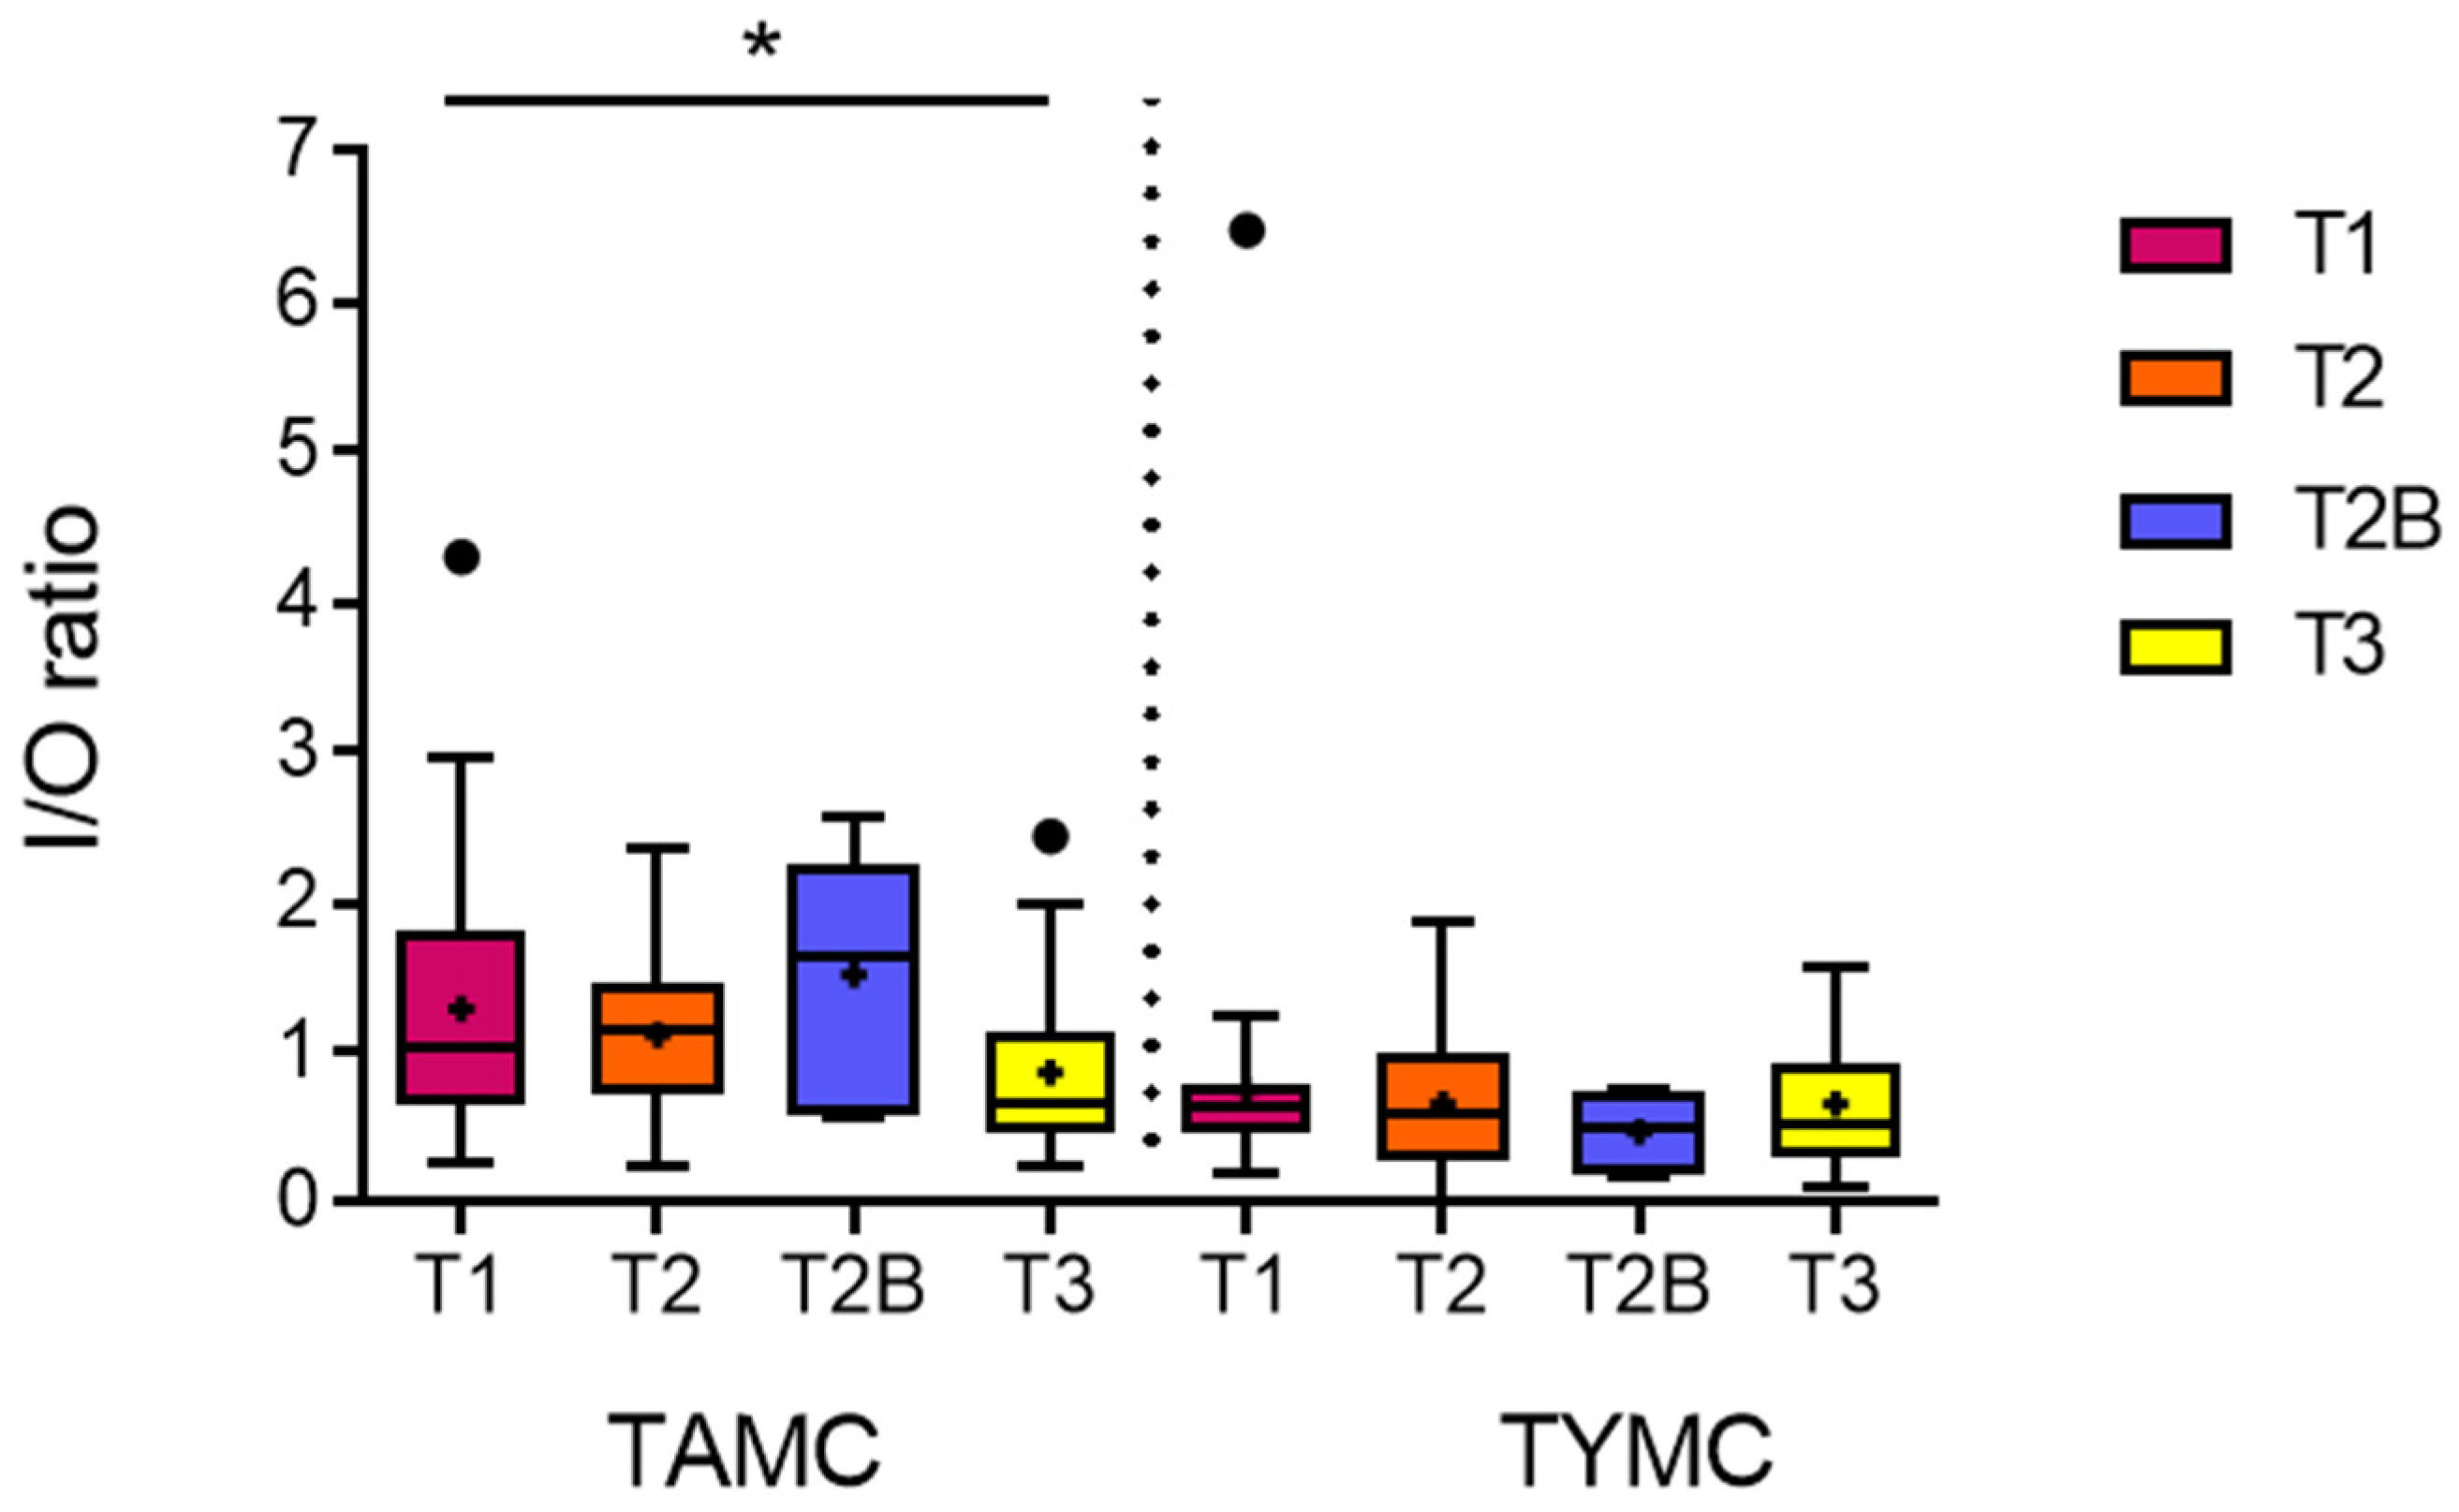
Finally, it is also important to study the building typology in relation to its number of façades, their orientation and the presence of courtyards to see the possible repercussions that this may have on natural ventilation and consequently on IAQ. Therefore, it was assessed whether there are significant differences between the I/O ratios according to the four studied building typologies (Section 2.1.2 and Table 1).
In the case of the I/O TAMC ratio (Figure 8), all building typologies except T3 present microbial amplification with a median I/O ratio above 1 (significant differences with T1), despite the fact that all homes have static ventilation in bathrooms and kitchens (Table 1). In this sense, the T2B typology (H block with only one orientation facing west) showed the highest amplification ratios in this study; however, these findings should be interpreted cautiously due to the limited representation of this typology in the sample. Regarding TYMC, the median I/O ratios were below 1 in all typologies, and no significant differences were found in any case.

3.4. Multilevel Mixed-Effects Linear Regression Analysis

A multilevel mixed effects linear regression was developed to relate the dependent variable (ratio I/O for TAMC) and seven independent variables (location, building period, building typology, type of room, type of kitchen, occupation rate and presence of a pet). As explained in Section 2.3, for the relationship of each independent variable with I/O TAMC, the rest of the variables analyzed are considered adjusted/equalized (the obtained results are independent of the potential correlation between parameters). Results are shown in Table 3.
Regarding the relationship between I/O TAMC and location, significant results were found. Homes located in Seville present lower amplification ratios than homes in Pamplona, with a beta coefficient of −0.4. In relation to construction regulatory building period according to energy standards, significant differences were also found between both periods, with a 0.4 ratio in homes built in the PRE-CTE period, similar to the results of the descriptive analysis (Figure 7). Dwellings built after 2006 have specific regulations at the national level in order to improve IAQ; therefore, a better performance is confirmed in newer dwellings. Regarding the building typology, due to its relationship with the potential of ventilation (see Section 2.1.2), the T2B home (H block, one west orientation) had a higher I/O ratio (+0.6) than those with cross-ventilation. This typology offers poor performance for natural ventilation, and consequently a higher microbial amplification occurs inside. In relation to the type of room and in line with the results of the descriptive analysis, no significant differences were found among the LB, BR, and K, although the kitchen had a higher TAMC I/O ratio. Furthermore, analyzing the results in relation to the kind of kitchen, kitchens integrated into the living room (K3) present significant differences, with a ratio 0.7 lower than the reference kitchen (K1). In terms of the occupancy ratio of the homes, no significant results were found. Finally, the presence of pets inside homes increases the TAMC I/O ratio by 0.3, with statistically significant differences. In summary, these findings suggest that location, building period, and typology significantly influence indoor microbiological amplification, with open kitchens and the presence of pets also playing notable roles.

4. Discussion

The observed higher microbial counts in Seville compared to Pamplona (with significant differences in TAMC) suggest that environmental factors, such as climate, may play a significant role in microbial proliferation. Seville, being warmer and more humid, may create favorable conditions for microbial growth, as observed by the higher TAMC and TYMC concentrations detected in the outdoor environments of Seville. These findings align with previous studies indicating that climate and environmental conditions influence IAQ and microbial levels. Elevated TAMC levels above guideline values may indicate increased exposure to airborne microorganisms, which has been associated with respiratory symptoms and reduced indoor environmental quality. Although this study does not perform a clinical risk assessment, the results highlight the importance of maintaining adequate ventilation to reduce microbial exposure. Internationally, indoor microbial guideline values vary widely, and in many countries no formal regulatory limits exist for TAMC and TYMC in residential buildings. The UNE 100012 standard used in Spain provides a reference threshold; however, the lack of harmonized global standards highlights the need for further research in this field.
The analysis of microbial contamination by room type reveals that kitchens tend to exhibit the highest microbial counts, particularly for TAMC, consistent with prior research suggesting that kitchens are prone to higher levels of bioaerosols due to cooking-related activities and moisture accumulation. Although no significant differences in TAMC and TYMC concentrations were observed across room types in Pamplona and Seville, kitchens consistently showed higher microbial amplification, especially in terms of the I/O ratios, being significant in TYMC amplification. This suggests that kitchens may act as a source of microbial amplification, contributing to higher concentrations of bioaerosols in indoor air, in spite of having range hoods.
The study found that homes built after the implementation of the Spanish CTE regulation (2006) exhibited better air quality in terms of microbial levels. This aligns with expectations that modern building codes, which emphasize better ventilation systems, contribute to improved IAQ. However, the differences between homes built before and after 2006 were not statistically significant for TYMC, indicating that other factors, such as room type or building typology, may also influence microbial concentrations. The results also suggest that although modern buildings might offer improved ventilation, microbial contamination still persists in certain types of buildings, such as those with limited ventilation.
Building typology significantly influenced microbial amplification, particularly in homes with limited cross-ventilation (T2B). These homes exhibited higher I/O ratios for TAMC, indicating microbial amplification. The poor ventilation performance of these homes could lead to stagnant indoor air and inadequate removal of bioaerosols. On the other hand, buildings with cross-ventilation (T1, T2 and T3) showed lower microbial amplification, emphasizing the importance of proper ventilation design in mitigating indoor air contamination. However, these findings are not representative because the T2B typology was represented by only one dwelling in the present study. So, this result is qualitative rather than quantitative.
The design of the kitchen (specifically whether it was integrated with the living room) was found to influence microbial contamination. Kitchens integrated with living rooms (K3) exhibited lower I/O ratios for TAMC compared to traditional kitchens (K1), potentially due to more frequent air exchange in integrated spaces. However, no significant differences were found across room types in terms of TYMC, suggesting that other factors beyond kitchen design also play a role in shaping microbial levels. Additionally, while the occupancy ratio did not show significant effects on microbial contamination, the presence of pets was associated with increased TAMC I/O ratios in the assessed dwellings. However, these findings should be considered preliminary because the study did not differentiate between pet species, number of animals, or activity patterns within the homes, all of which may influence indoor microbial communities differently.
The study also assessed the relationship between environmental parameters (temperature, CO2 concentration, and relative humidity) and microbial levels. Positive correlations were found between temperature and microbial concentrations, particularly for TAMC, indicating that higher indoor temperatures may promote microbial growth. This is consistent with previous research suggesting that elevated temperatures can enhance the growth of bacteria and fungi in indoor environments. CO2 levels also showed a positive correlation with TAMC, further supporting the idea that inadequate ventilation contributes to higher microbial concentrations. Conversely, the weak and non-significant correlations with relative humidity indicate that humidity, within the typical range observed in this study, may not be as influential in microbial contamination as other factors such as temperature and ventilation.
The multilevel mixed-effects regression model identified several factors as significant predictors of microbial amplification. Location, building period according to IAQ standards, building typology, the kind of kitchen, and the presence of pets were found to significantly influence microbial contamination, with homes in Seville, those built before 2006, homes with poor ventilation due to having one façade, those with pets, and open kitchens exhibiting higher microbial amplification. These findings underscore the complexity of IAQ, where multiple factors, including building design, occupant behavior, and environmental conditions, interact to shape microbial contamination levels.
Interestingly, Seville showed relatively high absolute microbial concentrations but lower I/O amplification ratios compared to Pamplona. This apparent discrepancy may be explained by the intensive use of air-conditioning systems during summer periods in Seville. Air-conditioning operation can reduce natural ventilation rates by limiting window opening and may partially reduce indoor microbial amplification through air recirculation, particle deposition, and filtration effects.
The findings of this study underscore the importance of improving building ventilation standards, particularly for the refurbishment of older buildings and those with limited natural ventilation. The relationship between building typology and microbial amplification suggests that design improvements aimed at enhancing air circulation could have a substantial impact on IAQ. Furthermore, the results suggest that pet ownership should be considered in IAQ assessments, as pets contribute to higher microbial levels indoors.
Although this kind of study requires a high amount of resources, much more research is needed to understand the design and use of dwellings in relation to IAQ and microbiological sources. This is particularly important given the well-established scientific evidence linking microbiological contaminants to occupant health, especially among vulnerable populations such as children, individuals with respiratory diseases, and the elderly.
Several methodological constraints should be considered when interpreting the findings of this study, particularly regarding the primary sample size of 20 dwellings. This constraint inherently limits the statistical power at the cluster level (Level 2), increasing the risk of Type II errors—where subtle but true environmental or structural influences on microbial loads might have gone undetected. However, to optimize the statistical integrity of our findings, we utilized a multilevel mixed-effects linear regression. This approach leverages the full dataset of 120 individual intra-dwelling measurements, effectively preserving degrees of freedom for lower-level factors. The fact that distinct, highly significant associations (p < 0.05) emerged despite the sample size constraints suggests that the identified determinants (such as regulatory periods, specific building typologies, and pet presence) exert strong and robust effects on indoor microbial proliferation.
A more complete picture of the dwellings could be done by also sampling relevant rooms of the dwellings, such as bathrooms or halls, and targeting vulnerable populations, as children or the elderly, to understand their risk to inadequate IAQ [47]. The path to high energy efficiency standards (based in high levels of insulation and airtightness) must go hand in hand with proven evidence of improved IAQ, and studies like this based on microbiological samples in real case studies provide more evidence to improve expected objectives.
In relation to other limitations of the study, there is not available data about specific cleaning practices in the dwellings or detailed window operation patterns. In addition, the study analyses a limited number of TAMC and TYMC samples collected during summer conditions in 2021 and 2022. Although focusing on summer periods allowed comparisons between Pamplona and Seville under similar climatic conditions, microbial communities and indoor/outdoor exchange dynamics may vary considerably throughout the year due to seasonal changes in temperature, humidity, occupant behavior, ventilation practices, and outdoor microbial concentrations, as reported in previous studies [48], especially of outdoor air. Furthermore, during hotter periods or during heatwave events, dwellings have more limited options to be naturally ventilated [49], which may further affect indoor microbial concentrations. Therefore, future studies covering all year and extreme weather events should improve the IAQ picture throughout the year. It is worth mentioning the difficulties in testing microbiological contaminants in relation to other environmental parameters such as CO2 or PM that can be easily monitored. Building typology T2B with only one façade orientation is only represented by one dwelling in this study, and although findings are consistent with other studies [50], future studies could increase the sample to improve conclusions, especially considering that the housing shortage could lead to the development of smaller, single-sided homes.

5. Conclusions

Contaminants in the built environment pose significant risks to human health and well-being. The total aerobic microbial count (TAMC) and total yeast and mold count (TYMC) are key parameters for evaluating microbial contamination levels. By conducting a thorough assessment of TAMC and TYMC in 20 selected dwellings across two distinct Spanish climate zones (Pamplona, Cfb and 4C, and Seville, Csa and 2A, according to Köppen–Geiger and ASHRAE climate classifications), we identified significant differences in microbial loads between naturally ventilated and mechanically conditioned homes.
Both TAMC and TYMC showed differences per location, with levels in Seville being higher and statistically significant for indoor and outdoor environments only in the case of TAMC. The threshold recommended by UNE 10000121 of 800 CFU/m3 was exceeded mainly in Seville and especially in TAMC levels, while dwellings in Pamplona showed values below the limit.
A key insight from our study is the positive correlation between temperature and CO2 concentration with TAMC levels, underscoring the role of thermal conditions and occupant activity in microbial amplification. The positive correlation between temperature and bacterial concentrations may be explained by the enhanced survival and metabolic activity of microorganisms under warmer indoor conditions, as well as increased particle resuspension during summer occupancy patterns. Similarly, the association between CO2 concentration and TAMC likely reflects the influence of occupant density and insufficient ventilation, since CO2 is commonly considered an indicator of indoor occupancy and ventilation efficiency. Higher occupancy levels may increase the emission and resuspension of bioaerosols from human activities. In contrast, relative humidity did not show significant correlations with microbial concentrations in the present study, possibly because humidity conditions remained within a relatively narrow range during the summer sampling campaigns and because air-conditioning systems may have moderated indoor humidity variability. Interestingly, the amplification of TAMC, measured through the indoor/outdoor ratio (I/O), was more pronounced in naturally ventilated homes in Pamplona, particularly in kitchens. This contrasts with Seville, where despite higher absolute values of TAMC, the amplification effect was lower due to the use of air conditioning.
Moreover, the analysis of building typology revealed that homes with limited natural ventilation options, such as those with a single orientation, exhibited the highest amplification ratios. In contrast, cross-ventilated dwellings showed lower TAMC amplification. TYMC amplification was consistently below 1 across all typologies, indicating minimal indoor amplification of fungal contaminants.
Through a multilevel mixed-effects regression analysis, we further demonstrated that homes built to meet more recent energy standards (CTE-2006 in this Spanish study) had significantly better air quality, as reflected by lower TAMC amplification ratios. Additionally, open-plan kitchen designs were associated with improved ratios due to increased air volume, while homes with pets and single-orientation typologies exhibited higher amplification ratios.
From a sustainability perspective, these findings emphasize the need to integrate IAQ considerations into energy-efficient building design and housing policies. Sustainable residential buildings should not only minimize energy consumption but also ensure healthy indoor environments through appropriate ventilation strategies and resilient building design adapted to different climatic conditions. This study contributes to the growing evidence supporting the integration of microbiological IAQ assessments into sustainable building evaluation frameworks and future residential retrofit strategies.
In conclusion, improving IAQ and mitigating microbial contamination in residential buildings requires a comprehensive approach that addresses both building design (e.g., ventilation and air exchange) and occupant behaviors related to kitchen activities, natural and AC interaction, and pet ownership. Future research should continue to explore these interactions to inform policies and strategies aimed at enhancing IAQ and reducing health risks associated with microbial exposure in homes.

Author Contributions

Conceptualization, A.M.-B., A.S.-O. and A.I.V.; methodology, L.P.-E., F.E., A.M.-B., N.C.-M., M.B.-R., A.S.-O., A.A.-R. and A.I.V.; formal analysis, M.B.-R. and L.P.-E.; investigation, L.P.-E., F.E., A.M.-B., A.S.-O., A.A.-R. and A.I.V.; data curation, L.P.-E. and A.I.V.; writing—original draft preparation, L.P.-E., A.M.-B. and N.C.-M.; writing—review and editing, L.P.-E., F.E., A.M.-B., N.C.-M., M.B.-R., A.S.-O., A.A.-R. and A.I.V.; supervision, A.M.-B. and A.I.V.; project administration, A.M.-B. and A.S.-O.; funding acquisition, A.M.-B. and A.S.-O. All authors have read and agreed to the published version of the manuscript.

Funding

This paper is part of the Research Project CLIMAREADY “Adaptation Assessment of Spanish residential buildings” (2020–2023), funded by Convocatoria I+D+I “Retos de Colaboración” del Programa Estatal de Investigación, Desarrollo e Innovación Orientada a los Retos de la Sociedad. Plan Estatal de Investigación Científica y de Innovación” Reference: PID2019-109008RB-C21.

Institutional Review Board Statement

Not applicable.

Informed Consent Statement

Not applicable.

Data Availability Statement

The authors confirm that the data supporting the findings of this study are available within the article and Appendix A.

Acknowledgments

The authors would like to give special thanks to all the occupants that allowed the tests of their homes.

Conflicts of Interest

Aurora Monge-Barrio reports that financial support was provided by Convocatoria I+D+I “Retos de Colaboración” del Programa Estatal de Investigación, Desarrollo e Innovación Orientada a los Retos de la Sociedad. Plan Estatal de Investigación Científica y de Innovación. All other authors declare that they have no known competing financial interests or personal relationships that could have appeared to influence the work reported in this paper.

Appendix A

Table A1. Layouts of dwellings in Pamplona (1P–10P) and in Seville (1S–10S).
1P
Sustainability 18 06023 i001
2P
Sustainability 18 06023 i002
3P
Sustainability 18 06023 i003
4P
Sustainability 18 06023 i004
5P
Sustainability 18 06023 i005
6P
Sustainability 18 06023 i006
7P
Sustainability 18 06023 i007
8P
Sustainability 18 06023 i008
9P
Sustainability 18 06023 i009
10P
Sustainability 18 06023 i010
1S
Sustainability 18 06023 i011
2S
Sustainability 18 06023 i012
3S
Sustainability 18 06023 i013
4S
Sustainability 18 06023 i014
5S
Sustainability 18 06023 i015
6S
Sustainability 18 06023 i016
7S
Sustainability 18 06023 i017
8S
Sustainability 18 06023 i018
9S
Sustainability 18 06023 i019
10S
Sustainability 18 06023 i020

References

  1. Chamseddine, A.; Elzein, I.M.; Hassan, N. Indoor Air Quality in Critical Indoor Environments: A Review Paper; Springer International Publishing: Berlin/Heidelberg, Germany, 2025; Volume 236, ISBN 0123456789. [Google Scholar]
  2. Logue, J.M.; Mckone, T.E.; Sherman, M.H.; Singer, B.C. Hazard assessment of chemical air contaminants measured in residences. Indoor Air 2011, 21, 92–109. [Google Scholar] [CrossRef] [Scilit]
  3. Morantes, G.; Jones, B.; Molina, C.; Sherman, M.H. Harm from Residential Indoor Air Contaminants. Environ. Sci. Technol. 2024, 58, 242–257. [Google Scholar] [CrossRef] [Scilit]
  4. Prabhakaran, J.; Jayabal, S.; Ramesh Kumar, A.; Vinoth, V. Air quality assessment in indoor and outdoor environments: A review. Mater. Today Proc. 2022, 66, 1260–1266. [Google Scholar] [CrossRef] [Scilit]
  5. Daisey, J.M.; Angell, W.J.; Apte, M.G. Indoor air quality, ventilation and health symptoms in schools: An analysis of existing information. Indoor Air 2003, 13, 53–64. [Google Scholar] [CrossRef] [Scilit] [PubMed]
  6. Liu, H.; Zhang, X.; Zhang, H.; Yao, X.; Zhou, M.; Wang, J.; He, Z.; Zhang, H.; Lou, L.; Mao, W.; et al. Effect of air pollution on the total bacteria and pathogenic bacteria in different sizes of particulate matter. Environ. Pollut. 2018, 233, 483–493. [Google Scholar] [CrossRef] [Scilit] [PubMed]
  7. Wang, J.; Janson, C.; Gislason, T.; Gunnbjörnsdottir, M.; Jogi, R.; Orru, H.; Norbäck, D. Mold, bacteria, allergens, and volatile organic compounds in homes associated with tear film break-up time, oculo-nasal symptoms, and allergic rhinitis. Build. Environ. 2024, 264, 111923. [Google Scholar] [CrossRef] [Scilit]
  8. Lozinsky, C.H.; Casquero-Modrego, N.; Walker, I.S. The health and indoor environmental quality impacts of residential building envelope retrofits: A literature review. Build. Environ. 2025, 270, 112568. [Google Scholar] [CrossRef] [Scilit]
  9. Idris, S.A.A.; Hanafiah, M.M.; Ismail, M.; Abdullah, S.; Khan, M.F. Laboratory air quality and microbiological contamination in a university building. Arab. J. Geosci. 2020, 13, 580. [Google Scholar] [CrossRef] [Scilit]
  10. Saadoon Abdulaali, H.; Usman, I.M.; Umairah Nizam, N.M.; Hanafiah, M.M.; S Usman, I.M.; Jamal Abdulhasan, M. A Review on Green Hotel Rating Tools, Indoor Environmental Quality (IEQ) and Human Comfort. Int. J. Adv. Sci. Technol. 2020, 29, 128–157. [Google Scholar]
  11. Ashraf, M.A.; Mohd Hanafiah, M. Sustaining life on earth system through clean air, pure water, and fertile soil. Environ. Sci. Pollut. Res. 2019, 26, 13679–13680. [Google Scholar] [CrossRef] [Scilit]
  12. Gudmundsson, A.; Löndahl, J.; Bohgard, M. Methodology for identifying particle sources in indoor environments. J. Environ. Monit. 2007, 9, 831–838. [Google Scholar] [CrossRef] [Scilit]
  13. Yang, J.; Duan, J.; Niu, X.; Hu, T.; Huang, Y.; Sun, J.; Cao, J. A Comprehensive Review on Indoor Air Pollutants and Their Health Impacts: Priority Pollutants and Suggested Mitigations; Springer: Dordrecht, The Netherlands, 2025; Volume 18, ISBN 0123456789. [Google Scholar]
  14. Madhwal, S.; Prabhu, V.; Sundriyal, S.; Shridhar, V. Ambient bioaerosol distribution and associated health risks at a high traffic density junction at Dehradun city, India. Environ. Monit. Assess. 2020, 192, 196. [Google Scholar] [CrossRef] [Scilit]
  15. Chase, J.; Fouquier, J.; Zare, M.; Sonderegger, D.L.; Knight, R.; Kelley, S.T.; Siegel, J.; Caporaso, J.G. Geography and Location Are the Primary Drivers of Office Microbiome Composition. mSystems 2016, 1, 10.1128. [Google Scholar] [CrossRef] [Scilit] [PubMed]
  16. Al-Shaarani, A.A.Q.A.; Pecoraro, L. A review of pathogenic airborne fungi and bacteria: Unveiling occurrence, sources, and profound human health implication. Front. Microbiol. 2024, 15, 1–15. [Google Scholar] [CrossRef] [Scilit] [PubMed]
  17. Muafa, M.H.M.; Quach, Z.M.; Al-Shaarani, A.A.Q.A.; Nafis, M.M.H.; Pecoraro, L. The influence of car traffic on airborne fungal diversity in Tianjin, China. Mycology 2024, 15, 506–520. [Google Scholar] [CrossRef] [Scilit] [PubMed]
  18. Flores, G.E.; Bates, S.T.; Knights, D.; Lauber, C.L.; Stombaugh, J.; Knight, R.; Fierer, N. Microbial biogeography of public restroom surfaces. PLoS ONE 2011, 6, e28132. [Google Scholar] [CrossRef] [Scilit]
  19. Lax, S.; Smith, D.P.; Hampton-Marcell, J.; Owens, S.M.; Handley, K.M.; Scott, N.M.; Gibbons, S.M.; Larsen, P.; Shogan, B.D.; Weiss, S.; et al. Longitudinal analysis of microbial interaction between humans and the indoor environment. Science 2014, 345, 1048–1052. [Google Scholar] [CrossRef] [Scilit]
  20. Travis, W.D.; Costabel, U.; Hansell, D.M.; King, T.E.; Lynch, D.A.; Nicholson, A.G.; Ryerson, C.J.; Ryu, J.H.; Selman, M.; Wells, A.U.; et al. An official American Thoracic Society/European Respiratory Society statement: Update of the international multidisciplinary classification of the idiopathic interstitial pneumonias. Am. J. Respir. Crit. Care Med. 2013, 188, 733–748. [Google Scholar] [CrossRef] [Scilit]
  21. Nevalainen, A.; Täubel, M.; Hyvärinen, A. Indoor fungi: Companions and contaminants. Indoor Air 2015, 25, 125–156. [Google Scholar] [CrossRef] [Scilit]
  22. Macher, J.M.; Huang, F.Y.; Flores, M. A two-year study of microbiological indoor air quality in a new apartment. Arch. Environ. Health 1991, 46, 25–29. [Google Scholar] [CrossRef] [Scilit]
  23. Bouillard, L.; Michel, O.; Devleeschouwer, M. Bacterial contamination of indoor air, surfaces, and settled dust, and related dust endotoxin concentrations in healthy office buildings. Ann. Agric. Environ. Med. 2005, 12, 187–192. [Google Scholar] [PubMed]
  24. WHO. Transmission of SARS-CoV-2: Implications for Infection Prevention Precautions; World Health Organization: Geneva, Switzerland, 2020; pp. 1–10. [Google Scholar]
  25. Pakpour, S.; Li, D.W.; Klironomos, J. Relationships of fungal spore concentrations in the air and meteorological factors. Fungal Ecol. 2015, 13, 130–134. [Google Scholar] [CrossRef] [Scilit]
  26. Qi, Z.; Lee, D.; Lee, S.; Jeong, T.K.; Kim, S. A health performance evaluation model of apartment building indoor air quality. Indoor Built Environ. 2011, 20, 26–35. [Google Scholar] [CrossRef] [Scilit]
  27. Council of Europea. 2.6.12. Microbial Examination of Non-sterile products: Microbial Enumaration tests. Eur. Pharmacopoeia 2023, 217–221. Available online: https://ehpm.org/wp-content/uploads/2022/04/QG22_2-6-12_Microbiological_examination_of_non-sterile_products-microbial_enumeration_tests_ep10-2.pdf (accessed on 26 May 2026).
  28. Fischer, G.; Dott, W. Relevance of airborne fungi and their secondary metabolites for environmental, occupational and indoor hygiene. Arch. Microbiol. 2003, 179, 75–82. [Google Scholar] [CrossRef] [Scilit]
  29. Dirección General de Industria. Energía y Minas de la Comunidad de Madrid Guía de Calidad del Aire Interior. Fenercom 2016, 186. Available online: https://www.fenercom.com/wp-content/uploads/2016/11/Guia-de-Calidad-del-Aire-Interior-fenercom-2016.pdf (accessed on 26 May 2026).
  30. Kottek, M.; Grieser, J.; Beck, C.; Rudolf, B.; Rubel, F. World map of the Köppen-Geiger climate classification updated. Meteorol. Z. 2006, 15, 259–263. [Google Scholar] [CrossRef] [Scilit] [PubMed]
  31. CTE-HE Spanish Technical Building Code. Basic Document DB-HE: Energy Saving. Decree 314/2006 of 17 March. Official State Gazette (BOE): Madrid, Spain, 2006. Available online: http://www.estif.org/fileadmin/estif/content/policies/downloads/CTE_solar_thermal_sections_ENGLISH.pdf (accessed on 26 May 2026).
  32. Climatic Data for Building Design Standards. ASHRAE Stand. 2020. Available online: https://www.ashrae.org/file%20library/technical%20resources/standards%20and%20guidelines/standards%20addenda/169_2020_a_20211029.pdf (accessed on 26 May 2026).
  33. NBE-CT-79 Spanish Basic Building Code on Thermal Conditions in Buildings (in Spanish). 1997. Available online: https://www.scribd.com/document/51455040/NBE-CT-79 (accessed on 26 May 2026).
  34. CTE Spanish Technical Building Code (CTE). Royal Decree 314/2006 of 17 March. Official State Gazette (BOE), Madrid, Spain, 2006. Available online: https://www.boe.es/boe/dias/2006/03/28/pdfs/A11816-11831.pdf (accessed on 26 May 2026).
  35. Official State Gazette (BOE). CTE-HS Spanish Technical Building Code. Basic Document DB-HS: Salubrity; Royal Decree 314/2006 of 17 March; Official State Gazette (BOE): Madrid, Spain, 2006. [Google Scholar]
  36. Lozinsky, C.H.; Casquero-Modrego, N.; Walker, I.S.; Less, B.D.; Graessle, Q.P.; Sohn, M.D. The impact of simplified window and exhaust fan assumptions on indoor air quality in multifamily buildings. Int. J. Vent. 2025, 1–22. [Google Scholar] [CrossRef] [Scilit]
  37. UNE 100012; Cleaning of Ventilation and Air Conditioning Systems. AENOR: Madrid, Spain, 2005.
  38. Guo, H.; Lee, S.C.; Chan, L.Y. Indoor air quality investigation at air-conditioned and non-air-conditioned markets in Hong Kong. Sci. Total Environ. 2004, 323, 87–98. [Google Scholar] [CrossRef] [Scilit] [PubMed]
  39. Balasubramanian, R.; Nainar, P.; Rajasekar, A. Airborne bacteria, fungi, and endotoxin levels in residential microenvironments: A case study. Aerobiologia 2012, 28, 375–390. [Google Scholar] [CrossRef] [Scilit]
  40. Bragoszewska, E.; Mainka, A.; Pastuszka, J.S. Bacterial and fungal aerosols in rural nursery schools in Southern Poland. Atmosphere 2016, 7, 142. [Google Scholar] [CrossRef] [Scilit]
  41. Chegini, F.M.; Baghani, A.N.; Hassanvand, M.S.; Sorooshian, A.; Golbaz, S.; Bakhtiari, R.; Ashouri, A.; Joubani, M.N.; Alimohammadi, M. Indoor and outdoor airborne bacterial and fungal air quality in kindergartens: Seasonal distribution, genera, levels, and factors influencing their concentration. Build. Environ. 2020, 175, 106690. [Google Scholar] [CrossRef] [Scilit]
  42. Zhao, H.; Du, R.; Liu, Y.; Wang, D.; Li, Y. Assessing indoor PM2.5 microbial activity in a university campus environments in Beijing. Build. Environ. 2023, 246, 111003. [Google Scholar] [CrossRef] [Scilit]
  43. Kim, K.Y.; Kim, C.N. Airborne microbiological characteristics in public buildings of Korea. Build. Environ. 2007, 42, 2188–2196. [Google Scholar] [CrossRef] [Scilit]
  44. Li, C.S.; Kuo, Y.M. Microbiological indoor air quality in subtropical areas. Environ. Int. 1993, 19, 233–239. [Google Scholar] [CrossRef] [Scilit]
  45. Arriazu-Ramos, A.; Bes-Rastrollo, M.; Sánchez-Ostiz Gutiérrez, A.; Monge-Barrio, A. Building parameters that influence overheating of apartment buildings in a temperate climate in Southern Europe. Build. Environ. 2023, 228, 109899. [Google Scholar] [CrossRef] [Scilit]
  46. UNE-EN 16798-1; Energy Performance of Buildings. Ventilation for Buildings. Part 1: Indoor Environmental Input Parameters for Design and Assessment of Energy Performance of Buildings Addressing Indoor Air Quality, Thermal Environment, Lighting and Acoustics. Spanish Asso.: Madrid, Spain, 2020. Available online: https://www.mendeley.com/catalogue/b7d7c4f9-233a-3352-a9ec-df9baddfaa48/?utm_source=desktop&utm_medium=1.19.8&utm_campaign=open_catalog&userDocumentId=%7Be758421b-fd9b-4862-89d9-5bff4244dc38%7D (accessed on 26 May 2026).
  47. Maestre, J.P.; Jarma, D.; Williams, E.; Wylie, D.; Horner, S.; Kinney, K.A. Microbial communities in rural and urban homes and their relationship to surrounding land use, household characteristics, and asthma status. Build. Environ. 2024, 266, 112014. [Google Scholar] [CrossRef] [Scilit]
  48. Guo, K.; Qian, H.; Ye, J.; Sun, F.; Zhuge, Y.; Wang, S.; Liu, C.; Cao, G.; Zheng, X. Assessment of airborne bacteria and fungi in different-type buildings in Nanjing, a hot summer and cold winter moist Chinese city. Build. Environ. 2021, 205, 108258. [Google Scholar] [CrossRef] [Scilit]
  49. Gamero-Salinas, J.C.; Monge-Barrio, A.; Sánchez-Ostiz, A. Overheating risk assessment of different dwellings during the hottest season of a warm tropical climate. Build. Environ. 2020, 171, 106664. [Google Scholar] [CrossRef] [Scilit]
  50. Arriazu-Ramos, A.; Pons Izquierdo, J.J.; Ramos Ruiz, G.; Sánchez-Ostiz, A.; Monge-Barrio, A. Facing Climate Change in a Temperate European City: Urban-Scale Diagnosis of Indoor Overheating and Adaptation Strategies for Residential Buildings. Buildings 2024, 14, 1423. [Google Scholar] [CrossRef] [Scilit]
Figure 1. Total aerobic microbial count (TAMC) and total combined yeasts and molds count (TYMC) levels according to the selected location (n = 10 Pamplona; n = 10 Seville). A reference line at 800 CFU/m3 is included, corresponding to the limit established by the UNE 100012 standard for TAMC levels. * Indicates that it is statistically significant at p < 0.05.
Sustainability 18 06023 g001
Figure 2. (A) Total aerobic microbial count (TAMC) and (B) total combined yeasts and molds count (TYMC) levels according to the type of room (LR: living room; BR: bedroom and K: kitchen) and city (P: Pamplona n = 10; S: Seville n = 10).
Sustainability 18 06023 g002
Figure 3. Relationship between (A) TAMC and (B) TYMC counts and dwelling indoor temperature (n = 20). The dashed line indicates the regression line.
Sustainability 18 06023 g003
Figure 4. Relationship between (A) TAMC and (B) TYMC counts and CO2 levels inside homes (n = 20). The dashed line indicates the regression line.
Sustainability 18 06023 g004
Figure 5. Relationship between amplification ratios I/O TAMC (left) and I/O TYMC (right) according to the two locations: Pamplona (n = 10) and Seville (n = 10). *** Indicates that it is statistically significant p < 0.05.
Sustainability 18 06023 g005
Figure 6. Relationship between amplification ratios I/O TAMC (left) and I/O TYMC (right) according to the type of room (LR: living room n = 20; BR: bedroom n = 20 and K: kitchen n = 20). * Indicates that it is statistically significant at p < 0.05.
Sustainability 18 06023 g006
Figure 7. Differences between amplification ratios I/O TAMC (left) and I/O TYMC (right) according to the regulatory construction period: PRE-CTE (n = 12) and CTE (n = 8).
Sustainability 18 06023 g007
Figure 8. Relationship between amplification ratios I/O TAMC (left) and I/O TYMC (right) according to the building typology: T1 (n = 8), T2 (n = 7), T2B (n = 1) and T3 (n = 4). * Indicates that it is statistically significant p < 0.05.
Sustainability 18 06023 g008
Table 1. Building characteristics of the 20 selected dwellings for the study.
CityDwelling NumberBuilding PeriodBuilding TypologyRatio of Occupancy (m2 Dwelling/Pers.)Kitchen TypologyPetVentilation *Orientation of Monitored Rooms (LR-BR-K) **AC System
Pamplona1Ppre-NBE-CT-79T129K1NoNV_CW-E-WNo
2Ppre-NBE-CT-79T129K1NoNV_CW-E-WNo
3Ppre-NBE-CT-79T233K2NoNV_C + VDS-N-WNo
4Ppre-NBE-CT-79T216K3YesNV_C + VDE & W-N-WNo
5PNBE-CT-79T2B17K3NoNV + VDW-W-WNo
6PNBE-CT-79T238K2YesNV_C + VDNE & SE-NE-NWNo
7PNBE-CTET186K1YesVents + VDSW-NE-SWNo
8PNBE-CTET129K1NoVents + VDSE-NW-NWNo
9PCTE + PassivhausT122K1YesHRVSW & NW-NE-SWNo
10PCTE + PassivhausT118K2YesHRVSW-NE-SWNo
Seville1Spre-NBE-CT-79T322K2NoNV_C + VDN-S-ELR & BR: 2 splits
2Spre-NBE-CT-79T368K2NoNV_C + VDS-S-SNo
3Spre-NBE-CT-79T225K1NoNV_C + VDW-W-ELR: 1 split
4Spre-NBE-CT-79T225K1NoNV_C + VDW-W-ELR & BR: 2 splits
5SNBE-CT-79T261K1NoNV_C + VDS-S-WLR: 1 split
6SNBE-CT-79T261K1NoNV_C + VDS-N-WAll rooms
7SCTET198K1YesVents + VDS-N-SAll rooms
8SCTET128K2NoVents + VDS & W-N-NAll rooms
9SCTET354K1NoVents + VDS-W-SAll rooms
10SCTET353K1NoVents + VDS-E-SAll rooms
* NV: natural ventilation; NV_C: natural and cross-ventilation; vents: fixed vents in addition to openable windows; VD, ventilation ducts in wet rooms (kitchen and bathrooms); and HRV: mechanical and heat recovery ventilation, in addition to operable windows. ** LR: living room; BR: bedroom; K: kitchen. All rooms are equipped with roller blinds, which, according to questionnaires, were used daily throughout the summer.
Table 2. Mean values and standard deviation (mean ± SD) of environmental parameters measured during sampling (temperature, CO2 concentration and relative humidity).
Dwelling NumberTemperature (°C)CO2 Concentration (ppm)Relative Humidity (%)
1P24.5 ± 0.9422 ± 2551.2 ± 3.9
2P26 ± 1.3490 ± 5651.5 ± 3.9
3P25.7 ± 0.8444 ± 4050.2 ± 4.8
4P24.7 ± 1.5464 ± 3448.3 ± 3.2
5P25.6 ± 0.6677 ± 654.5 ± 0.7
6P26.642550.8
7P24.4 ± 0.2462 ± 2456.3 ± 2.1
8P25.4 ± 0.9418 ± 2044.1 ± 10.2
9P25.2 ± 1659 ± 29145 ± 8.1
10P27.553745.3
Overall P25.6 ± 1499.8 ± 95.749.7 ± 4.1
1S25.8 ± 0.253053.1 ± 0.1
2S26.6 ± 1.2490 ± 4744.2 ± 10.4
3S24.5 ± 0.8443 ± 4943.4 ± 12.9
4S25.2 ± 0.8569 ± 17543.1 ± 8.6
5S25 ± 1.6656 ± 27345 ± 12.2
6S26.5 ± 1.2435 ± 836.4 ± 0.8
7S25 ± 0.9417 ± 446.9 ±13.1
8S26.2 ± 0.1476 ± 3232.4 ± 3
9S24.6 ± 0.5449 ± 1639.5 ± 8.6
10S25.1 ± 1.8623 ± 14144.9 ± 8.3
Overall S25.4 ± 0.8508.8 ± 8342.9 ± 5.7
Data are shown as mean ± standard deviation (SD) for each parameter. Overall values correspond to the mean ± SD calculated from all dwellings sampled in each city.
Table 3. Adjusted differences (beta regression coefficients [95% CI]) in the percentage of ratio I/O TAMC according to different parameters.
ParametersBeta Coefficients[95% Conf. Interval]p Value
Location
Pamplona0 (ref.)
Seville−0.4(−0.7, −0.1)0.004 *
Construction regulatory period
PRE-CTE0 (ref.)
CTE−0.4(−0.7, −0.009)0.014 *
Building typology
T10 (ref.)
T2−0.07(−0.5, +0.3)0.749
T2B+0.6(+0.2, +1.1)0.004 *
T3+0.1(−0.2, +0.5)0.557
Type of room
Living room0 (ref.)
Bed room−0.1(−0.3, +0.05)0.170
Kitchen+0.1(−0.05, +0.3)0.150
Kind of Kitchen
K10 (ref.)
K2+0.02(−0.2, +0.2)0.827
K3−0.7(−1.1, −0.2)0.001 *
Room occupation (m2/person)
<300 (ref.)
≥30−0.2(−0.5, +0.08)0.150
Pet 0.006 *
No0 (ref.)
Yes+0.3(+0.1, +0.6)
* Statistical difference with p value < 0.05.
Disclaimer/Publisher’s Note: The statements, opinions and data contained in all publications are solely those of the individual author(s) and contributor(s) and not of MDPI and/or the editor(s). MDPI and/or the editor(s) disclaim responsibility for any injury to people or property resulting from any ideas, methods, instructions or products referred to in the content.