Article

Urban Resilience as Lived Experience: A Structural Evaluation of Residential Satisfaction in Post-Earthquake İzmit


Faculty of Architecture, Department of City and Regional Planning, Izmir Institute of Technology, 35430 Izmir, Türkiye
Sustainability 2026, 18(12), 5877; https://doi.org/10.3390/su18125877
Submission received: 30 April 2026 / Revised: 31 May 2026 / Accepted: 3 June 2026 / Published: 9 June 2026
(This article belongs to the Section Sustainable Urban and Rural Development)

Abstract

Residential satisfaction serves as a critical metric for lived resilience, reflecting the sustained functionality of sociospatial systems. However, its long-term evolution in post-disaster, rapidly urbanizing landscapes remains under-researched. This study evaluates sociospatial dynamics in İzmit, Turkey, nearly three decades after the 1999 İzmit Earthquake, analyzing how urbanization trajectories shape resilience outcomes. Grounded in a bottom-up spillover model, the research utilizes a Structural Equation Modeling (SEM) framework to analyze resident survey data, complemented by a spatial “sections-based” analysis to capture intraurban variability across distinct development processes. Social capital emerged as the strongest predictor of residential satisfaction, potentially acting as a compensatory mechanism in deprived neighborhoods, despite physical deficiencies. Findings revealed profound sociospatial heterogeneity in long-term urban recovery. Paradoxically, contemporary mass housing exhibited lower satisfaction scores than older informal developments, challenging the assumption that formal planning and modern construction inherently guarantee sustained resilience. By utilizing residential satisfaction to interpret uneven lived resilience across urbanization trajectories, this study advocates for prioritizing the most influential quality domains through targeted interventions. These insights move beyond technical recovery metrics to offer a transferable framework for disaster-prone cities seeking to align institutional planning goals with the actualized residential satisfaction of communities.

1. Introduction

People pursuing improved living conditions are drawn to cities. This movement from rural to urban areas coupled with growth, referred to as urbanization, places significant pressure on urban systems, undermining urban Quality of Life (QoL), particularly in developing cities. These pressures are further intensified in cities exposed to natural hazards, where disaster impacts interact with pre-existing structural vulnerabilities such as informal development, inadequate housing, and limited planning capacity. In this context, urban resilience and sustainability are increasingly understood not merely as technical capacities but as dynamic processes where the “lived quality of a place” is inextricably linked to the well-being and satisfaction of its inhabitants. Residential satisfaction thus serves as an evaluative feedback mechanism, revealing whether the urban systems successfully meet the evolving adaptive needs of their inhabitants.
Within this perspective, residential satisfaction provides a valuable, outcome-based lens through which the performance of urban systems can be assessed. As a subjective indicator, residential satisfaction captures the combined and cumulative effects of physical conditions, social relations, and governance processes over time. Accordingly, it offers a means to bridge urban QoL research with broader debates on urban resilience and sustainability by foregrounding how residents perceive and adapt to their living environments. Over recent decades, urban QoL research has increasingly emphasized the role of the built environment in shaping well-being [1,2], leading to growing attention to spatial context as a key component of urban quality of life, particularly as rapid urbanization continues to degrade built environments [3].
Despite this shift, empirical research explicitly linking urban QoL to built environments remains limited [2,4,5]. While existing models address correlations, the intricate interplay between the attributes and subjective perceptions of the built environment—and their combined effect on residential satisfaction—remains under-explored [6]. Additionally, much of the existing literature is grounded in developed-country contexts [7,8], where formal planning frameworks and regulated development processes are more prevalent. In contrast, cities in developing countries, especially those shaped by industrialization and large-scale migration, often experience informal settlements, housing inadequacy, poor infrastructure, and uneven access to urban services. When compounded by sudden shocks such as earthquakes, these pressures frequently exceed local adaptive capacities, resulting in persistent reductions in residential satisfaction and uneven post-disaster recovery trajectories.
İzmit, a mid-sized industrial city in northwestern Turkey, located in the Marmara region that consistently exhibits elevated vulnerability levels in recent national indices [9], exemplifies these challenges and provides a critical analytical case for examining long-term post-disaster urban outcomes. Like many industrial cities in Turkey, İzmit, in the hinterland of İstanbul, experienced rapid population growth fueled by migration linked to industrial expansion. This period of accelerated urbanization produced extensive informal and semi-formal development, much of which failed to meet contemporary building standards despite the country’s high seismic risk [10]. The 1999 İzmit Earthquake (also called the Marmara Earthquake) further reshaped the city through large-scale destruction, emergency reconstruction, and the provision of permanent housing, followed by continued mass housing development in the subsequent decades. Together, these processes have resulted in a highly heterogeneous urban fabric characterized by distinct development and reconstruction trajectories, making the city an intriguing case.
The unique evolution of such environments suggests that residents’ perceptions of urban quality of life often differ from those observed in developed countries, reflecting variations in expectations, social relations, and adaptive strategies [11]. This underscores the need for context-sensitive, long-term assessments that move beyond short-term recovery metrics and examine how different urbanization and reconstruction processes shape residential satisfaction over time. Addressing this gap, the present study investigates residential satisfaction in İzmit 27 years after a major earthquake, focusing on how physical conditions, social ties, and spatial development patterns interact to produce urban QoL outcomes across residential environments. Consequently, the multidimensional nature of long-term urban resilience is explored through the lens of “lived resilience”—captured empirically via residential satisfaction.
The study utilizes a comprehensive survey to capture residents’ perceptions of their living environment—operationalized here as residential satisfaction—alongside their individual characteristics. Methodologically, the research is grounded on a subjective, indicator-based, bottom-up spillover approach adopting the model of Campbell et al. [12]. Accordingly, residential satisfaction is conceptualized as an overarching construct encompassing both housing and neighborhood spheres, reflecting the holistic experience of living in a particular place and community. Extending the traditional framework of Campbell et al. [12], this study explicitly incorporates spatial context, arguing that residents’ satisfaction is shaped not only by individual and dwelling-level characteristics but also by underlying sociospatial patterns formed through diverse processes of urbanization and post-disaster reconstruction. These processes tend to generate relatively homogeneous areas within cities, which are analytically meaningful and can be effectively examined through spatial units [13]. In this study, such areas are operationalized as spatial sections called “sectors” defined by distinct development and reconstruction trajectories rather than administrative boundaries. Utilizing these sectors, the study maps and compares uneven lived resilience across diverse urban environments to evaluate how distinct spatial development and reconstruction trajectories shape the long-term physical and social fabric of post-earthquake İzmit. By adopting this thorough analysis of key contributors of residential satisfaction and spatial contextualization, the paper provides a precise lens through which dynamics of urban resilience are revealed, moving beyond physical metrics.
The significance of this approach is reflected in three key contributions. First, it utilizes an extensive multidimensional dataset to structurally evaluate the hierarchical interdependencies between perceived and evaluated urban domains revealing how these interconnected factors converge to shape residential satisfaction in a post-disaster, developing-city context. Second, by employing a structural approach to isolate the primary predictors influencing residential satisfaction, the study identifies the underlying pathways as critical yet underemphasized facets of a human-centric resilience framework. Third, it introduces a process-based, spatial sections approach that captures intraurban variability, grounding residents’ perceptions within the specific spatial context of distinct urbanization and reconstruction trajectories. Taken together, these contributions provide a transferable analytical framework that bridges the gap between resident experience and urban resilience in post-disaster cities. The findings provide insight into how rapid urbanization and post-earthquake development trajectories shape residential satisfaction over the long-term, offering evidence-based implications for sustainable urban development and resilience building in disaster-prone cities.

2. Background and Theoretical Framework

In QoL research, residential satisfaction studies place neighborhoods in a special setting determined by their micro-scale attribute space referring to the physical and social aspects of the built environment. Besides the substantial body of research addressing Neighborhood Satisfaction (NS), Residential Satisfaction (RS) research extends beyond neighborhood to encompass housing-related conditions [14]. Residential satisfaction refers to feelings and perceptions regarding one’s place of residence [15] or attitude toward their living space [16]. Hence, its assessment can be operationalized by comprehensively measuring attitudes towards housing, neighborhood, and the city [17,18].
In the assessment of QoL in urban environments, indicator-based methods are the most prevalent approaches [19]. QoL is conceptualized using either subjective indicators, objective indicators, or a combination of both [20]. Following the assumption of behaviorism, that people’s perceptions and material conditions would normally correspond, subjective indicators are considered convenient to measure people’s appraisal of objective conditions [21]. Moreover, objective indicators that rely on limited numbers of data sources are typically considered inadequate in measuring indicators such as place attachment, social bonds, or aesthetic aspects [22] and hence may pose problems of validity [11]. Consequently, the recognition of an individual’s satisfaction as a key subjective measure of well-being has led to a shift toward perceived characteristics of the living environment, moving beyond purely objective attributes [12,23,24,25,26].
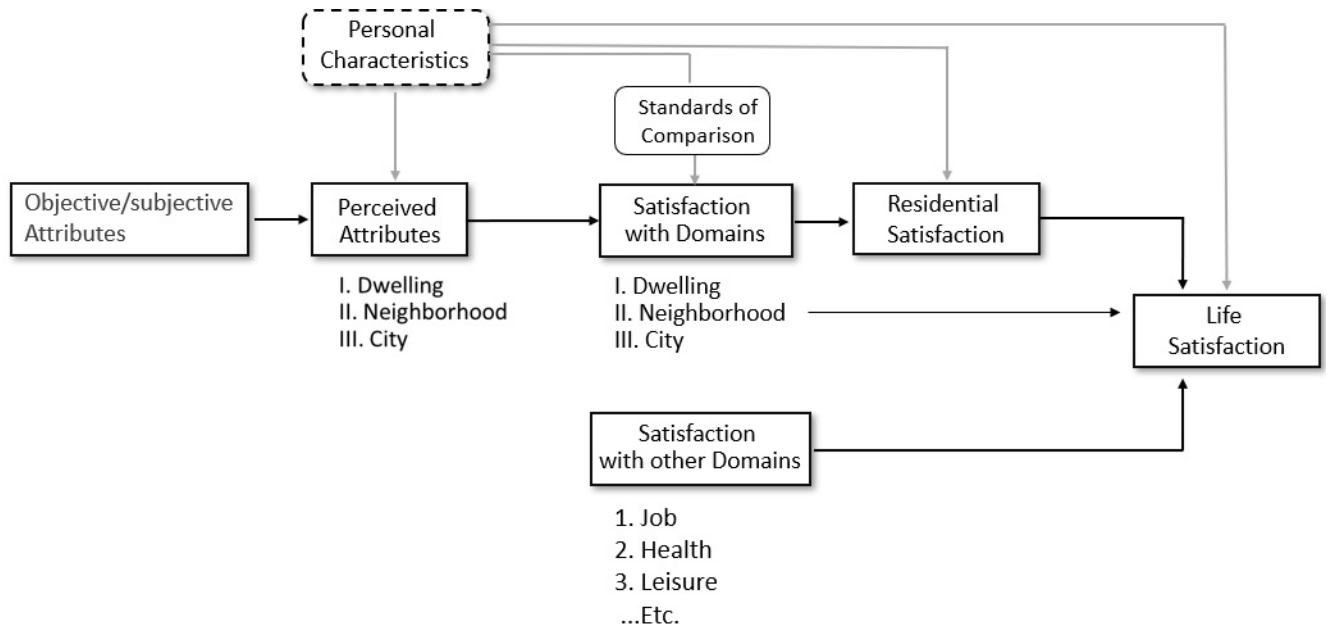
Campbell et al.’s model [12] underscores the influence of subjective built environment characteristics on satisfaction regarding both the living environment and overall quality of life. It operationalizes a bottom-up spillover theory, suggesting that subjective evaluations of the residential environment contribute to satisfaction within specific domains; these, in turn, aggregate into satisfaction with the living environment and, ultimately, into life satisfaction [27]. Within this framework, perception is defined as the cognitive evaluation of objective measures, whereas satisfaction constitutes the comparative assessment between these perceptions and internal normative standards. Life Satisfaction (LS) represents the comprehensive cognitive appraisal of life, encompassing numerous domains beyond the residential environment, such as work, family, and leisure [12].
This study employs a subjective indicator-based bottom-up spillover approach, utilizing perceived attributes of the living environment encompassing housing, neighborhood and the city as the determinants of residential satisfaction. Physical, locational, and functional characteristics and sociocultural setting of the built environment are the primary influences on the quality of built environments [17,28]. Accordingly, it is generally accepted that residential satisfaction is related to both the physical and social aspects of the residential environment [29]. However, individuals’ characteristics, needs, goals, and past experiences may affect how they perceive the existing environment, and their perception would affect their satisfaction with the living environment [30]. Based on these premises, perceived living environment quality, together with an individual’s sociodemographic characteristics, including sex, age, education, etc. [25], is considered the main determinant of a resident’s satisfaction. Proposed framework suggests that satisfaction with housing (HS), neighborhood (NS), and city (CS) contribute to Residential Satisfaction (RS) and finally to satisfaction with one’s life (LS) as shown in the conceptual model (Figure 1).
  • Dwelling/Housing
Housing satisfaction refers to the degree of contentment experienced by a household with reference to the current housing situation [31]. Characteristics associated with housing satisfaction encompass factors such as the design, space/size, adequacy, construction quality, and amenities [32,33]. An individual is likely to express a high level of satisfaction with housing if their household’s current housing situation meets their norms [34].
  • Neighborhood
Neighborhood commonly refers to the proximity and social context that is inherently experienced and territorialized by its inhabitants. Individuals’ perception of urban green and recreation facilities [35], appearance of neighborhoods, including landscape, lighting and aesthetics [36,37], public services [38], maintenance and physical upkeep [39], perceived safety [36], traffic load [40], crowding and noise [41], proximity to facilities [42], social interaction [43], the attitudes of other residents in the neighborhood [44], and social ties and place attachment [24,45,46] have all been reported to be influential on satisfaction with the neighborhood. Neighborhood characteristics are broadly represented by indicators of physical conditions of local, environmental attributes, functional services/facilities, and social (human, sociorelational) conditions [17,28].
  • City
Residents engage with various spaces and functions of the city as integral parts of their living environment, rather than viewing their dwelling or neighborhood in isolation [18]. Consequently, the satisfaction of residents is, in part, connected to their satisfaction with the city itself and the experience of urban living.
The multilayered nature of satisfaction domains suggests that they do not act in isolation but rather form a complex structural system. To effectively capture these interrelated pathways while maintaining statistical rigor, this study employs a structural model. Structural Equation Modeling (SEM), a multivariate technique uniquely suited to capturing the hierarchical and multifaceted nature of constructs, was employed to operationalize the bottom-up spillover conceptual framework. Indicators of housing and neighborhood quality are grouped into coherent and reliable constructs, called domains in this study. The structural model tests the hypothesized paths: from the structured domains to satisfaction with housing (HS), neighborhood (NS), and the city (CS), and their subsequent impact on overall Residential Satisfaction (RS) and Life Satisfaction (LS). This methodology enables the simultaneous examination of direct and indirect effects, identifying which specific environmental attributes most significantly contribute to the resident’s cognitive appraisal of their living environment and life.

3. Study Area and Dataset

3.1. Case Study

İzmit, in the hinterland of İstanbul, Turkey, with its suitable logistics and physical conditions, underwent a heavy industrialization in the 1950s leading to unbalanced development, accompanied by mass migration and rapid urbanization to the present day. Extensive destruction caused by the 1999 earthquake (7.4 Mw) worsened the situation, leading to rapid interventions and haphazard reconstruction actions. Continuing to struggle with a growing population, migration, and environmental issues, the city exhibited low urban quality of life [47]. Having undergone rapid urbanization and the devastating impact of an earthquake, İzmit showcases various dynamics that contribute to the diverse qualities and characteristics of its living environments seemingly not even across the urban space, hence it proves to be an intriguing case study.
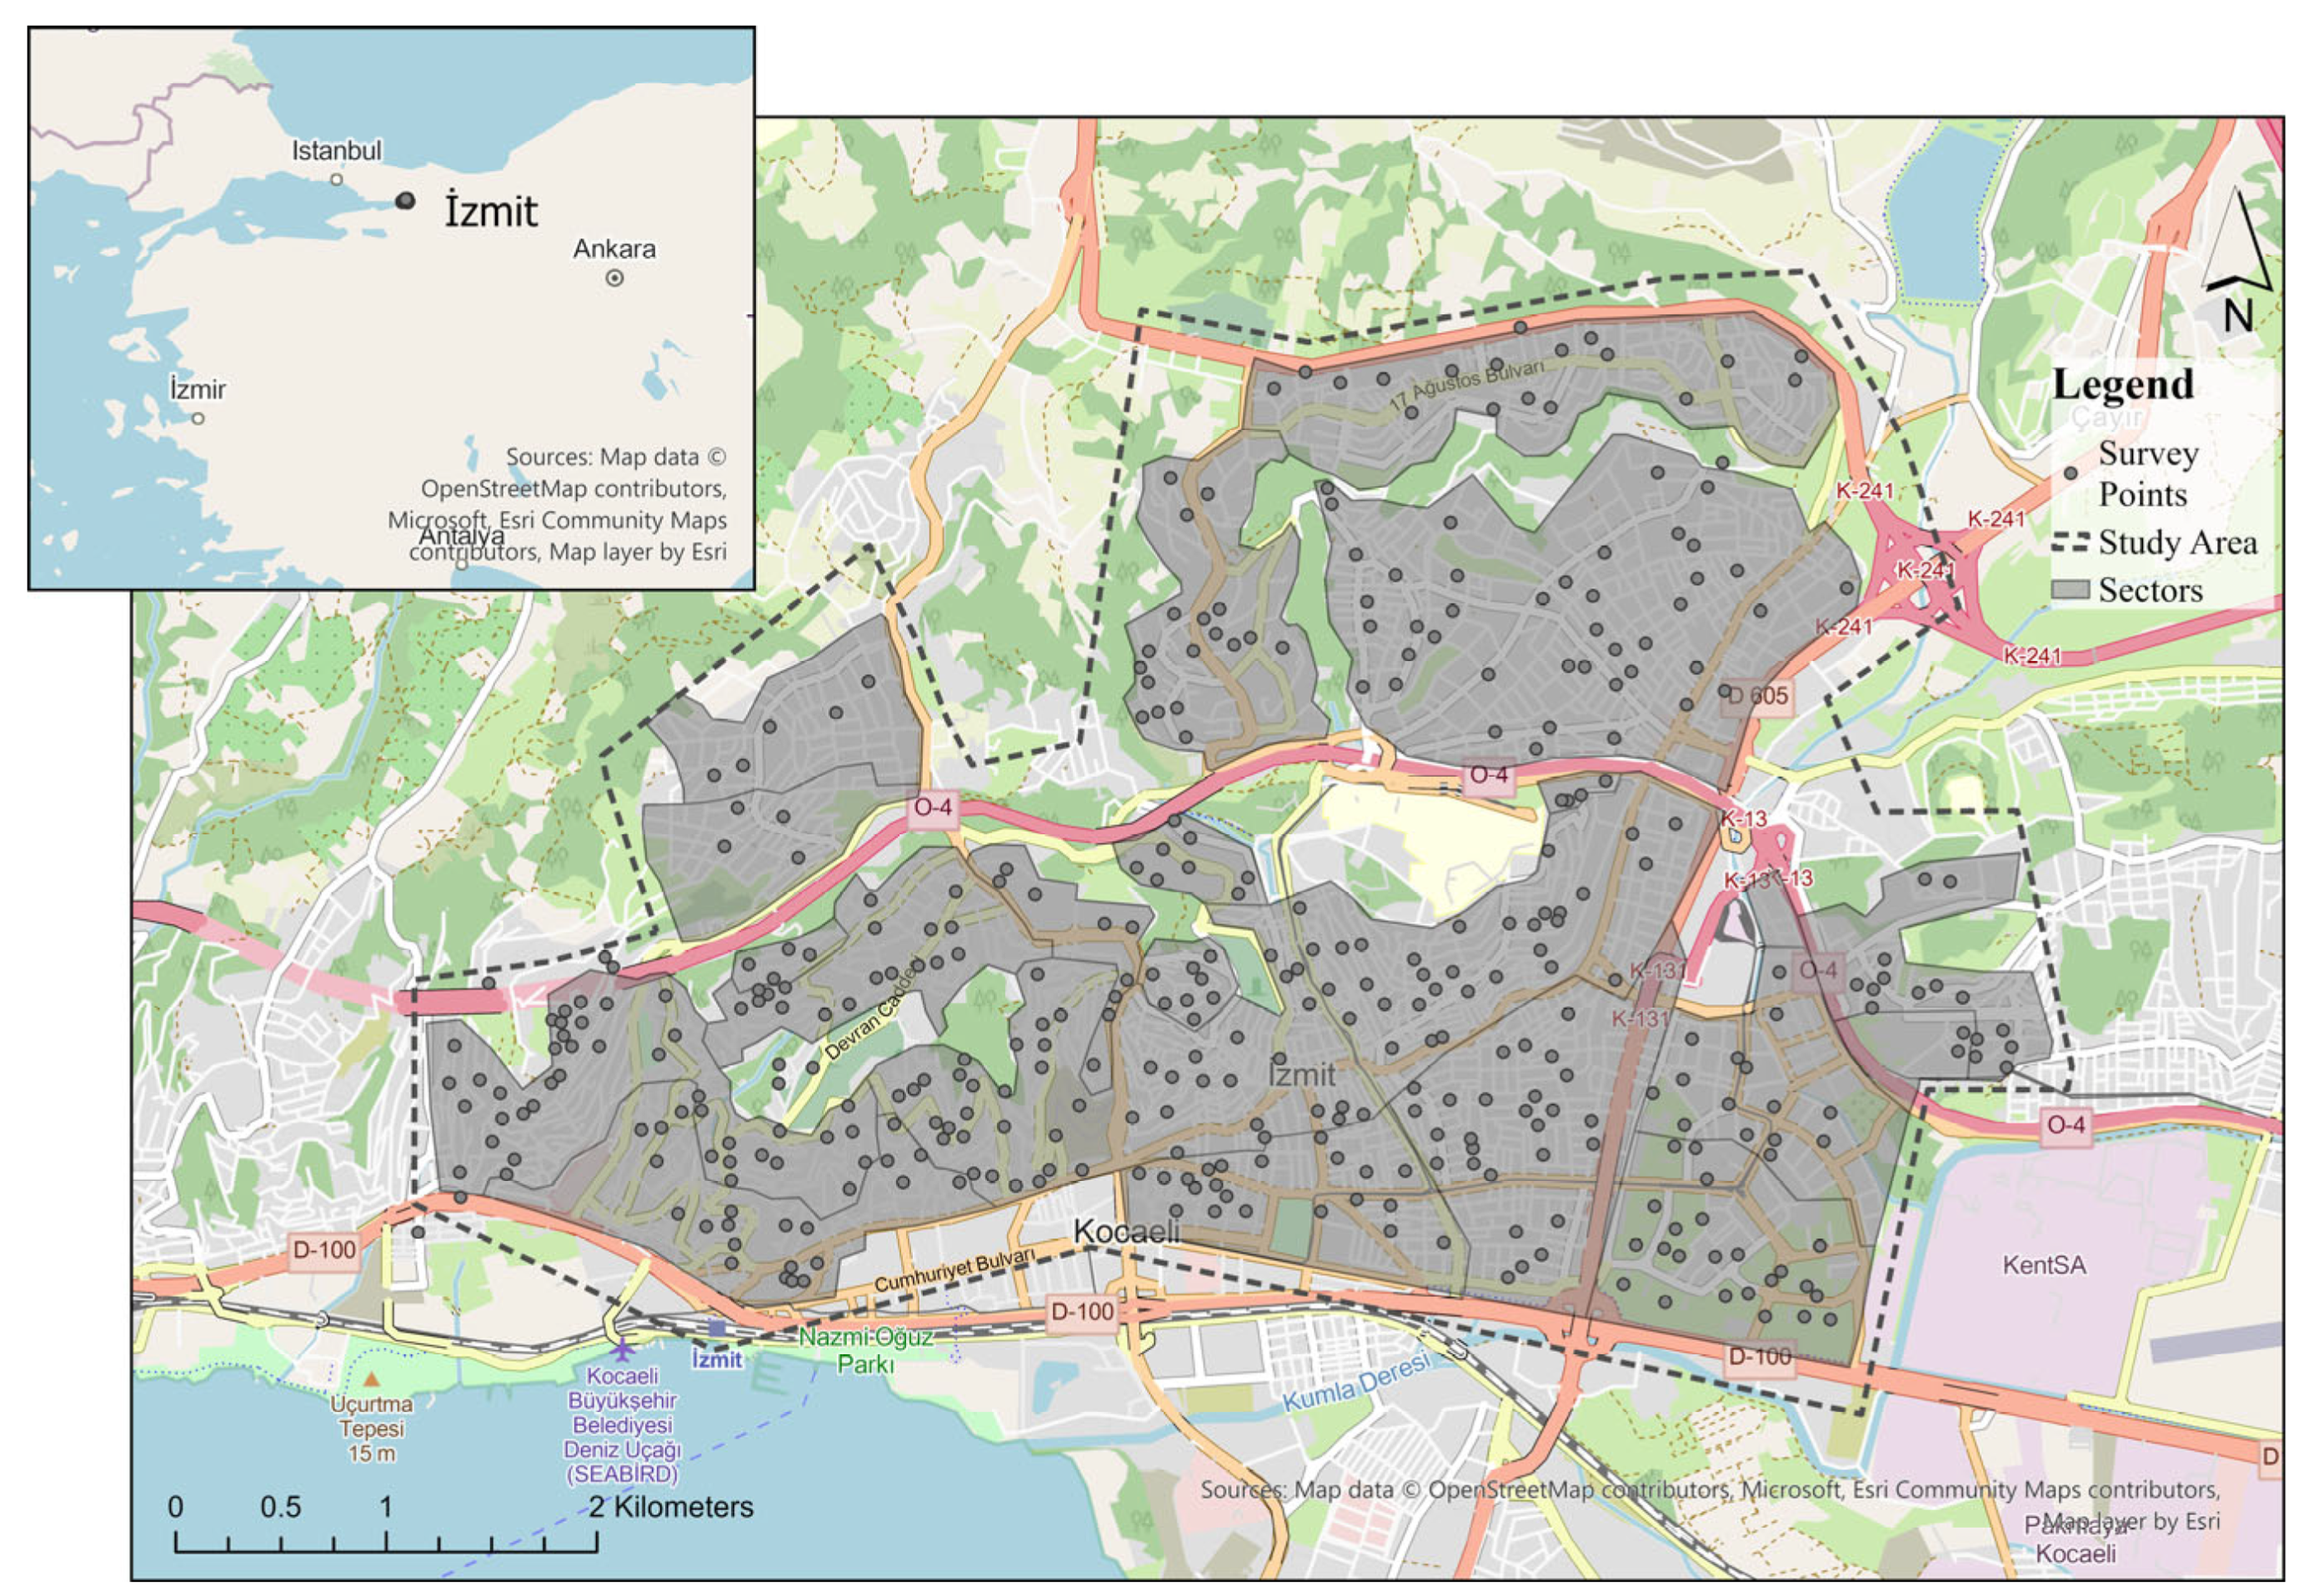
The study area spans 2500 hectares of urbanized residential zone of İzmit, which holds a population of 280,317 as of 2025. Living environments that share common characteristics related to their development process were delineated into sections, so-called “sectors” in this study (Figure 2). These include, e.g., informal settlements from the industrial era, mass housing, modern residential developments, emerging gated communities.

3.2. Survey Structure

The survey questionnaire comprises three sections: (i) individual’s sociodemographic characteristics, (ii) perceptions of the living environment, (iii) satisfaction with the living environment. Under physical dimensions of the living environment are the attributes directly linked to observable properties of the built environment, e.g., air quality, crowding, car parking, upkeep, etc., whereas the social dimension comprises, e.g., feeling of safety, social interactions, sense of belonging, etc. In the conceptualization of Neighborhood Quality (NQ), particular urban QoL research [48,49,50,51,52] has been decisive. In the selection of a comprehensive set of indicators, global residential satisfaction studies [17,26,53,54,55,56,57], along with research from Turkey [58,59,60], provided academic depth and local relevance.
The questionnaire utilized a 5-point Likert scale ranging from strongly negative (1) to strongly positive (5), where 3 was always neutral. In the survey, respondents’ perceptions on living environment attributes were measured using a scale ranging from strongly agree to strongly disagree. Satisfaction, on the other hand, was measured as a gestalt response to a single question, “How satisfied are you with your dwelling/neighborhood/city, or with your overall life these days?”, on a scale from strongly dissatisfied (1) to strongly satisfied (5).
The optimal sample size was calculated as 384 using Cochran’s (1977) formula [61], assuming a 95% confidence level (Z = 1.96) and a 5% margin of error (e = 0.05). To ensure proportional population representation and uniform spatial distribution, a stratified random sampling approach was employed utilizing administrative wards as primary strata. While administrative boundaries served as the initial sampling frame to leverage official census baseline data, the fieldwork protocol was structured to enforce both a proportional and a spatially homogeneous distribution across the analyzed urban sectors. Because the analytical sectors align closely with clusters of these administrative units, this approach naturally yielded a highly representative cross-sectional database. Minor spatial discrepancies where sector boundaries intersect ward lines were resolved via spatial approximation, intersecting ward-level census data with sector geometries in a GIS environment. As detailed in Table 1, the within-sector sampling rates range between 0.125% and 0.158%, tightly bounding the overall study area representation rate of 0.139% (n = 392 out of a total population of 280,317). This uniform coverage supports sectoral comparability and reduces potential imbalances in representation.
The survey questionnaire was administered anonymously to random individuals aged above 18, and the survey employed a balanced sampling strategy to ensure representative age and gender distribution. The survey was conducted from 4 to 10 April 2026. In total, 400 individuals participated, and 392 valid responses were obtained. Figure 2 depicts the study area, coverage of “sectors”, and the survey spatial distribution.

4. Methodology

The methodological workflow began with the preparation of indicators for housing and neighborhood quality, alongside their respective satisfaction variables. Following data structuring, the latent domains (factors) and observed indicators underwent measurement validation. Structural Equation Modeling (SEM) was then employed to analyze the complex, hierarchical relationships between exogenous latent constructs (quality domains) and endogenous satisfaction variables. All statistical analyses were conducted using JASP v.0.19.6, while spatial analysis and cartographic visualizations were performed in ArcGIS Pro 3.4.0.

4.1. Data Measurement and Statistical Treatment

Variables were selected based on the established conceptual framework (Figure 1) that defines residential satisfaction as a multidimensional construct and previous empirical research cited in Section 2 and Section 3. The dataset had two primary components: (1) perceptions of the living environment, operationalized through 7 housing quality and 36 neighborhood quality indicators; and five evaluative satisfaction variables, specifically Housing Satisfaction (HS), Neighborhood Satisfaction (NS), City Satisfaction (CS), Residential Satisfaction (RS), and Life Satisfaction (LS). The primary data on a 5-point scale, while inherently ordinal, were treated as pseudo-continuous. This approach is a standard practice in social science research, particularly when ordinal indicators possess five or more levels and composite scales demonstrate robust psychometric properties [62,63].

4.2. Structuring of Data and Measurement Validation Domains and Indicators

Modeling a vast number of individual indicators is computationally intensive and difficult to interpret. In addition, determining the weight of indicators within their respective domains is often complex and prone to subjectivity [64], where the respondents may not even consciously recognize underlying patterns in their evaluations [65]. To address these challenges, an Exploratory Factor Analysis (EFA) was conducted to statistically quantify the dimensionality of the housing and neighborhood quality indicators and quantify their statistical exploratory influences on their respective domains. Factors, called domains in this study, were extracted using EFA, Principal Axis Factoring (PAF) with an oblique Promax rotation, allowing for correlations between factors [66]—a decision theoretically grounded in the interrelated nature of living environment quality domains [67]. This step also served as a prerequisite to identify and remove items with low factor loadings (λ < 0.5) or cross-loadings, thereby refining the construct validity of the measurement scales.

4.3. Structural Equation Modeling (SEM)

Structural Equation Modeling (SEM) is a comprehensive multivariate statistical framework used to analyze complex, hierarchical relationships between observed indicators and latent constructs. Historically, the tool has evolved from a methodology known as “causal modeling” [68], effectively blending the strengths of factor analysis and multiple regression into a single unified system [69]. SEM is specifically chosen for its capacity to examine complex, multilayered relationships between observed indicators and living environment satisfaction domains while explicitly accounting for measurement error—a critical advantage over traditional regression techniques. The mathematical architecture of SEM is divided into two primary components: the measurement model and the structural model [70]. The measurement model (confirmatory factor analysis) component defines the relationship between unobserved latent variables (e.g., quality domains) and their observed items (survey indicators). CFA was performed to validate the measurement model, ensuring that the identified factor structure reliably represents the latent constructs before testing the hypothesized structural relationships within the SEM framework. By isolating the measurement error (σ and ϵ) from the true score variance, SEM ensures that the estimated paths are not attenuated by the “noise” inherent in subjective survey data.
The linear equations created for the observed variables belonging to the independent latent variables are formulated in Equation (1).
x = Λx·ξ + σ
where:
x: Matrix of observed variables,
Λx: Coefficients matrix of the measured independent variables affected by independent latent variables,
ξ: Independent latent variable,
σ: Error vector of the observed variables belonging to the independent latent variable.
The linear equations created for observed variables of dependent latent variables are formulated in Equation (2).
y = Λy·η + ε
where:
y: The observed variables vector of dependent latent variables,
Λy: The coefficients matrix of the observed variables belonging to the dependent latent variable,
η: Dependent latent variable,
ε: Error vector of the observed variables belonging to dependent latent variables.
The structural model (path analysis): This component estimates the hypothesized pathways between the latent constructs. It allows for the simultaneous calculation of direct, indirect, and total effects, which is essential for testing the “spillover” mechanisms within the residential satisfaction hierarchy. A linear equation created for the structural model is formulated as in Equation (3).
η = Γ·ξ + B·η + ζ
where:
η: Represents endogenous (dependent) latent variables,
Γ: The matrix of regression coefficients representing the effects of exogenous (independent) latent variables on endogenous (dependent) latent variables,
B: The regression coefficient matrix between dependent latent variables affected by independent latent variables,
ζ: An error matrix of dependent latent variables that is not affected by independent latent variables.

5. Results

5.1. Data Structure: Domains and Indicators

Prior to testing the hypothesized structural relationships, the measurement framework was empirically validated through Exploratory Factor Analysis (EFA). This data-driven approach was essential to identify the underlying dimensionality of the housing and neighborhood quality indicators, ensuring that the subjective survey responses were transformed into robust, statistically coherent latent constructs. Consequently, a single Housing Quality (HQ) domain and seven Neighborhood Quality (NQ) domains were extracted out of seven HQ indicators and 36 NQ indicators respectively.
All seven indicators of Housing Quality (HQ) remained with high factor loadings. The Neighborhood Quality (NQ) scale was refined by removing many of the 36 indicators that exhibited poor factor distinction due to low factor loadings (λ < 0.5) or cross-loadings. A set of 23 NQ indicators remained after item elimination, thereby enhancing construct validity without significantly reducing explanatory power (see Supplementary Materials File S1 for initial EFA results and the removed items list). Factors were labeled based on the semantic context of indicators with high loadings, representing distinct environmental and social domains (Table 2). This exploratory phase ensured that only statistically robust and theoretically coherent constructs were transitioned into the subsequent structural equation model. The extracted domains are defined as follows: NQ_Environ encapsulating the natural environmental characteristics of the area; NQ_Access measuring neighborhood accessibility; and NQ_Aesthetics representing the aesthetic quality of the built environment. NQ_Upkeep operationalizes waste management services and street maintenance, while NQ_Crime tracks the prevalence of criminal acts. Distinct from the latter, NQ_Safety provides a broader measure of subjective sense of security within the neighborhood. Finally, NQ_Social represents social capital, which embodies social cohesion, neighborly networks, place attachment, and shared lifestyle patterns as perceived by the individual.
All observed indicators exhibited standardized factor loadings (λ) ranging from 0.588 to 0.919, well above the conventional threshold of 0.50 [71]. All standardized factor loadings were statistically significant (p < 0.001), confirming that the selected indicators accurately represent their respective housing and neighborhood quality domains (Table 2). The stability and reliability of the latent constructs were supported by grounding the variables in the conceptual model and by verifying internal consistency and domain distinctness through extensive diagnostic metrics.
Accordingly, the Kaiser–Meyer–Olkin (KMO) measure of sampling adequacy value was 0.843 and 0.923 for HQ and NQ indicators respectively, exceeding the recommended threshold of 0.60. Individual item values ranged from 0.775 to 0.919, indicating high sampling adequacy. Furthermore, Bartlett’s test of sphericity yielded significant results for HQ (χ2 = 1027.280, df = 21, p < 0.001) and NQ (χ2 = 8537, df = 630, p < 0.001), confirming the presence of sufficient correlations between items for factor analysis. Factors were extracted using the Kaiser criterion (eigenvalues > 1), a conventional threshold in the literature, which ensures that each retained factor explains at least as much variance as a single observed variable. The interfactor correlations were examined to assess the relationships between the identified latent domains. The observed correlations, ranging from 0.177 to 0.685, indicate that, while the constructs are theoretically linked, they maintain sufficient discriminant validity to be modeled as distinct dimensions of urban quality.
Construct reliability and validity measures, Cronbach’s alpha (α) and McDonald’s omega (ω), values exceeded the 0.70 threshold. All Composite Reliability (CR) values for domains ranged between 0.804 and 0.903, comfortably exceeding the 0.70 benchmark, demonstrating strong internal consistency and construct reliability. Average Variance Extracted (AVE) values were above the 0.5 benchmark, indicating robust convergent validity and signifying that the latent factors explain a substantial portion of the variance in their indicators (Table 3). Although the housing quality domain (0.468) was slightly below the 0.50 AVE benchmark, the construct was retained, as it exhibited high internal consistency (α = 0.859, ω = 0.857) [72]. Discriminant validity was assessed by comparing the square root of the Average Variance Extracted (AVE) for each latent construct against the interfactor correlations. The results indicate that each construct shares more variance with its own indicators than with other latent variables, confirming the distinctiveness of the identified quality domains.
Following initial Exploratory Factor Analysis (EFA), the proposed measurement model was rigorously tested using Confirmatory Factor Analysis (CFA) and Structural Equation Modeling (SEM).

5.2. Structural Model and Path Analysis

Following the initial structuring of survey data, Structural Equation Modeling (SEM) was conducted to test the hypothesized pathways between the perceived quality of the living environment and the satisfaction outcomes (neighborhood, residential, and life satisfaction). The structural model estimated the hypothesized pathways between the exogenous environmental domains (HQ and NQs) and the endogenous satisfaction constructs (HS, NS, RS, LS). After the measurement models that indicated the relationship between indicators and their respective factors were assessed (Section 5.1), the structural model—the hypothetical model set by the researcher based on the conceptual framework (Figure 1)—was tested and verified.
Prior to the SEM testing, the exploratory analysis on the dataset revealed mild-to-moderate negative skewness (ranging from −0.2 to −0.8) and platykurtic (flat-topped) distributions (kurtosis from −0.008 to −1.25) (please see Section 3.1) with a global Mardia’s test also verifying the multivariate skewness and kurtosis (p < 0.001). These values indicate a “positivity bias” common in residential satisfaction surveys. While WLSMV is often preferred for ordinal data, it relies on the estimation of an asymptotic weight matrix that can become unstable and yield inflated chi-square statistics in medium-sized samples (N < 500), particularly as model complexity increases [73]. Testing of both ordinal-based estimation (involving polychoric correlations) and the MLR estimator confirmed that, while global fit indices were slightly weaker under ordinal estimation, the substantive path results remained broadly consistent with those obtained using MLR. Following the recommendations on treating categorical variables with at least five categories and moderate threshold asymmetry as continuous [74], MLR was selected because it provided more stable parameter estimates and reliable fit indices (CFI and RMSEA). Thus, the MLR estimator was adopted for maintaining model convergence in the present complex structural framework. Furthermore, an integrated Satorra–Bentler scaled test statistic and robust standard errors for ML were adopted to effectively address multivariate non-normality and the bias inherent in the data. While this rigorous estimation strategy provides a more conservative assessment of path significance, it ensures that the reported model fit and influences of the latent constructs are statistically robust and less prone to the biases of standard estimation methods. Missing data were addressed via the Full Information Maximum Likelihood (FIML) technique that utilizes all available data points within the covariance matrix, unlike deletion methods that discard cases list/pairwise and reduce statistical power.
The evaluation of the structural model proceeded in two distinct stages. First, the global goodness-of-fit assessment and, second, the assessment of the significance of the path coefficients. Testing with the fit metrics ensures that the hypothesized model adequately represented the observed data. Tests conducted for the study revealed that the structural model evidenced a moderate-to-good overall fit, with a normed chi-square (χ2/df) of 1.932 (χ2: p < 0.001), CFI of 0.908, RMSEA of 0.055, and SRMR of 0.080 [75,76].
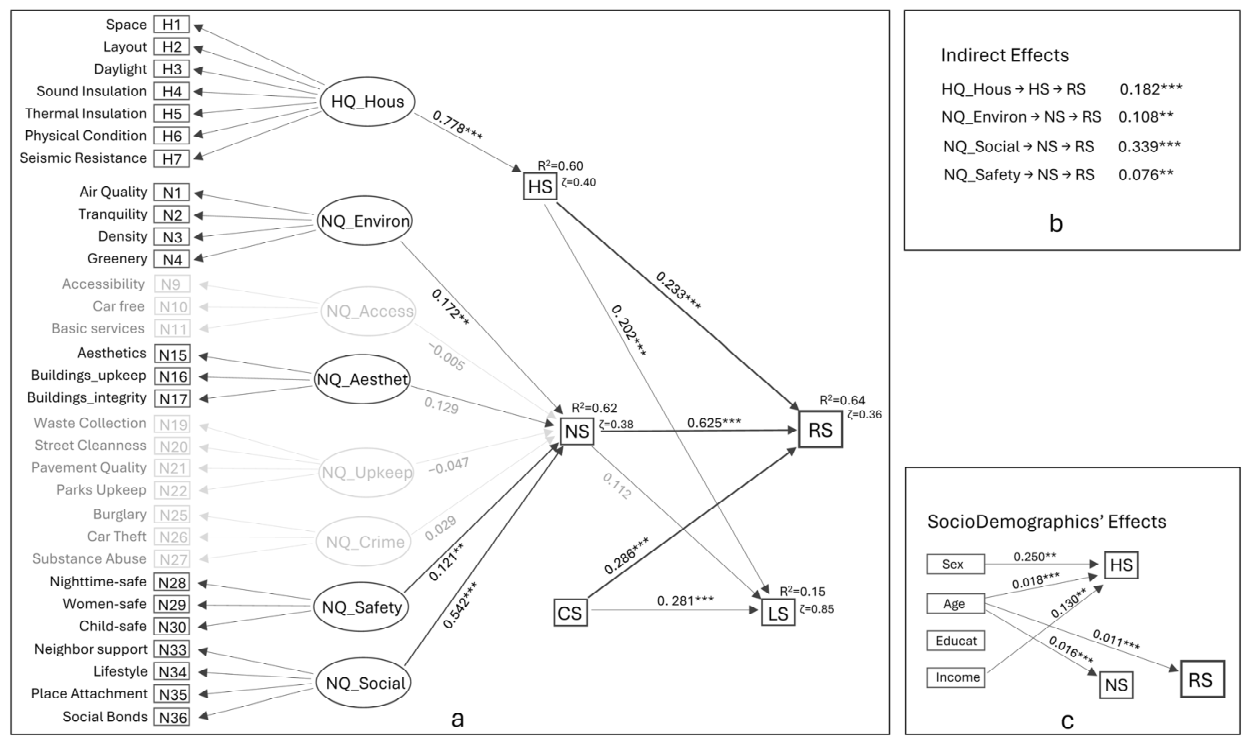
The structural path diagram (Figure 3) illustrates the hypothesized satisfaction hierarchy. Latent constructs are represented by ovals—encompassing exogenous (ξ), e.g., HQ, NQs, and endogenous (η) variables, e.g., HS, NS, RS. Observed indicators (x, y) are denoted by rectangles (H1, H2, … N2, N2, …). Single-headed arrows delineate the structural pathways (Γ, B), labeled with standardized path coefficients (β) indicating the predictive weight of each domain. Each endogenous construct is accompanied by an error metric, specifically structural disturbance (ζ), while R2 values quantify the model’s explanatory power [77].
To maintain theoretical integrity and evaluate the comprehensive framework, all latent domains were retained in the structural model, regardless of their statistical significance. NQ_Upkeep, NQ_Access, and NQ_Crime did not emerge as significant predictors of neighborhood satisfaction (p > 0.05) (shown in gray). Conceptualized as a holistic assessment of the living environment, Residential Satisfaction (RS) integrates evaluations of the housing, neighborhood, and city. RS is an observed variable rather than a latent construct. The specific survey item used to measure this variable was: “When you consider your home, your immediate surroundings/neighborhood, and İzmit, are you generally satisfied with living within this environment?”. In the structural framework, latent constructs, representing multidimensional quality domains, are measured by observed indicators and linked through directional paths. It reveals that Residential Satisfaction (RS) is driven by Housing Satisfaction (HS), Neighborhood Satisfaction (NS), and City Satisfaction (CS), with neighborhood social capital (NQ_Social) exerting the most significant direct influence on NS (Figure 3a). The impact of neighborhood-level factors is not direct but is channeled through satisfaction with housing and neighborhood with the NQ_Social to NS to RS pathway showing the strongest indirect effect (0.339 ***) (Figure 3b). Furthermore, personal attributes, such as age and income, are not just background variables but exert a notable influence on individuals’ perceptions of Housing Satisfaction (HS), Neighborhood Satisfaction (NS), and Residential Satisfaction (RS) (Figure 3c).
Empirical testing of these structural links confirmed that the residential experience is associated with a multidimensional set of predictors, validating several key hypotheses within the conceptual framework [78].
  • Housing
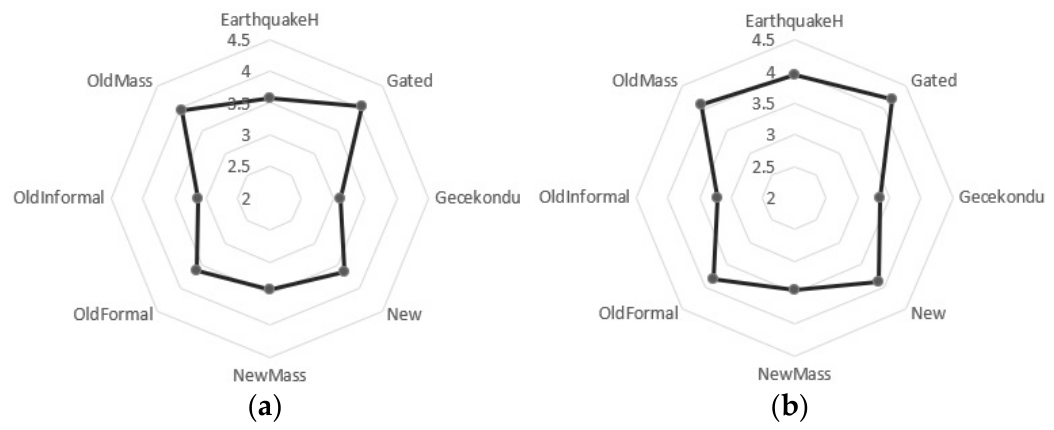
The physical attributes of housing (HQ_Hous) serve as the primary predictors for housing satisfaction (β = 0.778, p < 0.001). This exceptionally strong coefficient indicates that the tangible qualities of the dwelling—such as size, layout, seismic resistance, and insulation—are the key contributors of how residents psychologically appraise their homes. Given the critical nature of earthquake risk in the city, perceived seismic resistance (H7) was analyzed independently of the aggregate HQ_Hous domain. The results reveal an overall mean score of 3.53, with significant sectoral variation: Gated, OldMass, and EarthquakeH areas report scores slightly above 4.0, whereas Gecekondu and OldInformal sectors score as low as 3.1 and 3.0, respectively, and NewMass scores 3.4. Within the HQ_Hous latent construct, seismic resistance exhibits a factor loading of 0.630 (Table 2), which is the lowest among the seven indicators of housing quality domain. This suggests that while seismic safety is recognized as a critical concern, it is currently appraised as a distinct—and perhaps less essential—component of overall housing quality compared to more immediate physical attributes such as space or layout.
Housing Satisfaction (HS), on the other hand, acts as a significant direct predictor for both residential satisfaction (β = 0.233, p < 0.001) and life satisfaction (β = 0.202, p < 0.001). This confirms that the domestic sphere is a critical, independent contributor to a resident’s overall sense of well-being, separate from the influence of the neighborhood.
  • Neighborhood
The analysis identifies social quality as the dominant predictor of neighborhood satisfaction (β = 0.542, p < 0.001), followed by environmental quality (β = 0.172, p = 0.039) and safety (β = 0.121, p = 0.037). Additionally, aesthetics (of the built environment) (β = 0.129, p = 0.057) approached the threshold for statistical significance at the 95% level, suggesting a meaningful trend in the visual appraisal of the neighborhood. Conversely, several domains typically considered central to urban Quality of Life (QoL) failed to reach significance in the present case. Accessibility (β = −0.005, p = 0.927), upkeep (β = −0.047, p = 0.469), and crime (β = 0.029, p = 0.626) exhibited negligible effects on overall neighborhood satisfaction.
The structural analysis confirms that neighborhood satisfaction serves as the primary predictor for residential satisfaction, exhibiting the model’s most robust relationship (β = 0.625, p < 0.001). The direct path from neighborhood to life satisfaction was marginally significant (β = 0.112, p = 0.052), suggesting that the lived experience of the neighborhood exerts a mild influence on global well-being. This transmission is instead driven by specific indirect effects on residential satisfaction, where social quality emerged as the primary vehicle for spillover (βindirect = 0.339, p < 0.001). While the indirect contributions of environmental quality (βindirect = 0.108, p = 0.038) and safety (βindirect = 0.076, p = 0.038) were statistically significant, the data suggest that the social aspect representing social bonds, community support, and place attachment is the primary force shaping the residential experience. The structural hierarchy facilitates significant indirect effects, where neighborhood domains exert a “spillover” influence on residential satisfaction via their impact on the broader neighborhood context (Figure 3b). Please see Supplementary Materials File S2 for SEM total effects.
  • City
City Satisfaction (CS) acts as a significant direct predictor for both residential satisfaction (β = 0.286, p < 0.001) and life satisfaction (β = 0.281, p < 0.001).
City Satisfaction (CS) and Housing Satisfaction (HS) emerged as the primary significant direct predictors of Life Satisfaction (LS). These results indicate that, while neighborhood-level perceptions provide a foundational context for the residential experience, the broader urban climate and immediate dwelling-level appraisals serve as the more immediate structural determinants of overall subjective well-being.
The findings also support the initial hypothesis that sociodemographic attributes are not neutral; they act as “filters” through which residents evaluate their surroundings. While the core of the satisfaction hierarchy is influenced by social and environmental quality, these demographic results indicate that personal context—particularly sex and age—provide a significant baseline for how resilience and urban quality are experienced in daily life (Figure 3c). Accordingly, sex (β = 0.250, p < 0.01), emerging as a primary factor, indicates that women report significantly lower levels of Housing Satisfaction (HS) than men. Income (β = 0.130, p < 0.01) also exerts a positive influence on HS, confirming that greater economic capacity provides an increased domestic appraisal. Furthermore, age demonstrates a low but significant positive effect (p < 0.001) across the entire hierarchy—HS, NS, and RS—suggesting that residential satisfaction tends to mature and increase with age.

5.3. Overall Perceived Quality and Satisfaction

The dataset of overall responses is regarded as a reflection of residents’ perceptions of their living environment and satisfaction levels. Table 4 presents the descriptive statistics of quality domains along with satisfaction; HS, NS, CS, RS, and LS.
Since the quality domains are the latent constructs rather than directly measured variables, their means were calculated by aggregating their respective indicators. Consequently, Housing Quality (HQ) achieved a mean score of 3.48, exceeding the neutral midpoint and surpassing all Neighborhood Quality (NQ) domains. While this indicates a modestly positive evaluation rather than a high one, it suggests that residents perceive their housing conditions more favorably than the broader neighborhood environment. While individual housing units may transform and show signs of improvement, the built environment appears more rigid and limited in potential for enhancement. Neighborhood Quality (NQ) domains scored around the midpoint of 3.0, suggesting that neighborhoods were perceived as having quality slightly above neutral. The two lowest-ranking neighborhood domains were safety (2.84) and aesthetics of the built environment (2.90), whereas accessibility was rated highest (3.40), followed by social capital (3.34).
The Residential Satisfaction (RS) score of 3.66 aligns with the proposed model, providing empirical support for the premise that RS is a multidimensional construct with housing, neighborhood, and city attributes serving as key explanatory pathways, having mean scores of 3.71, 3.58, and 3.89, respectively. Life Satisfaction (LS) of 3.31 was considerably lower than all other satisfaction domains.

5.4. Sector-Based Spatial Assessment

Tests of spatial dependence of satisfaction domains based on the survey locations reveal that both Housing Satisfaction (HS) and Neighborhood Satisfaction (NS) exhibited significant spatial autocorrelation (Moran’s I = 0.13 and 0.218, p < 0.001), partially overlapping with previously identified earthquake vulnerability hotspots in İzmit [79]. Furthermore, while sex and age were evenly distributed as expected, significant spatial clustering was observed for education and income (Moran’s I = 0.115 and 0.092, p < 0.01)—the key socioeconomic indicators of wealth. These patterns indicate a clear socioeconomic spatial segregation in the city [80] driven by the diverse urbanization processes that is further explored through sectors.
The sectors were typologically categorized and delineated in a multicriteria framework indicating (i) developmental progress, (ii) density and (iii) status of planning (as detailed in Table 5) and complemented by the manual interpretation of high-resolution satellite imagery to identify variations in urban texture and historical development. Transitional zones were classified by identifying the dominant morphological character through the satellite data. The old residential areas developed before 1980 comprise partially formal settlements around the city center. However, most residential areas consisted of informal settlements or “Gecekondu”—typical squatter housing that emerged during the Turkish industrialization era as a result of migration waves from rural to urban areas. The three sectors belonging to this period in the city—OldFormal, OldInformal, Gecekondu—are recognized as deprived neighborhoods. Mass housing projects, typically defined by high-density footprints, play a critical role in accommodating the city’s growing population. Mass housing was an evolving strategy of urban provision, starting with the pre-earthquake OldMass development. This was followed by the EarthquakeH initiatives—implemented as a direct response to post-disaster displacement—and eventually the NewMass era, which addresses the pressing demand for affordable housing among middle and low socioeconomic classes primarily implemented by the Housing Development Administration of the Republic of Türkiye (TOKİ). Among mass housing projects, the “Yayhakaptan” housing project representing “OldMass” in the study area consisted of 70 buildings and 4900 apartments. This sector is an example with adequate social, physical, and green infrastructure and earthquake-resistant construction techniques, providing resistant buildings and high quality of life to its inhabitants. The sector became even more popular after the earthquake for the resistance of its buildings, favorable green areas, and physical and social amenities. When the 1999 earthquake of 7.4 Mw struck, it caused damage to 244,383 buildings and up to 600,000 people were forced to leave their homes, the majority of which were in İzmit [81]. Government-subsidized permanent housing for thousands of displaced residents was initiated and completed within three years after the earthquake (EarthquakeH). These housing projects are in four different parts of the city, the largest of which having 4626 apartments in the north (Gündoğdu) [82]. In the years that followed up until the present, steady growth of the city fueled by ongoing industrial, educational, and commercial activities also produced new residential areas with standalone construction (New) and ultimately gated communities inhabited by a relatively wealthy population (Gated).
  • Housing
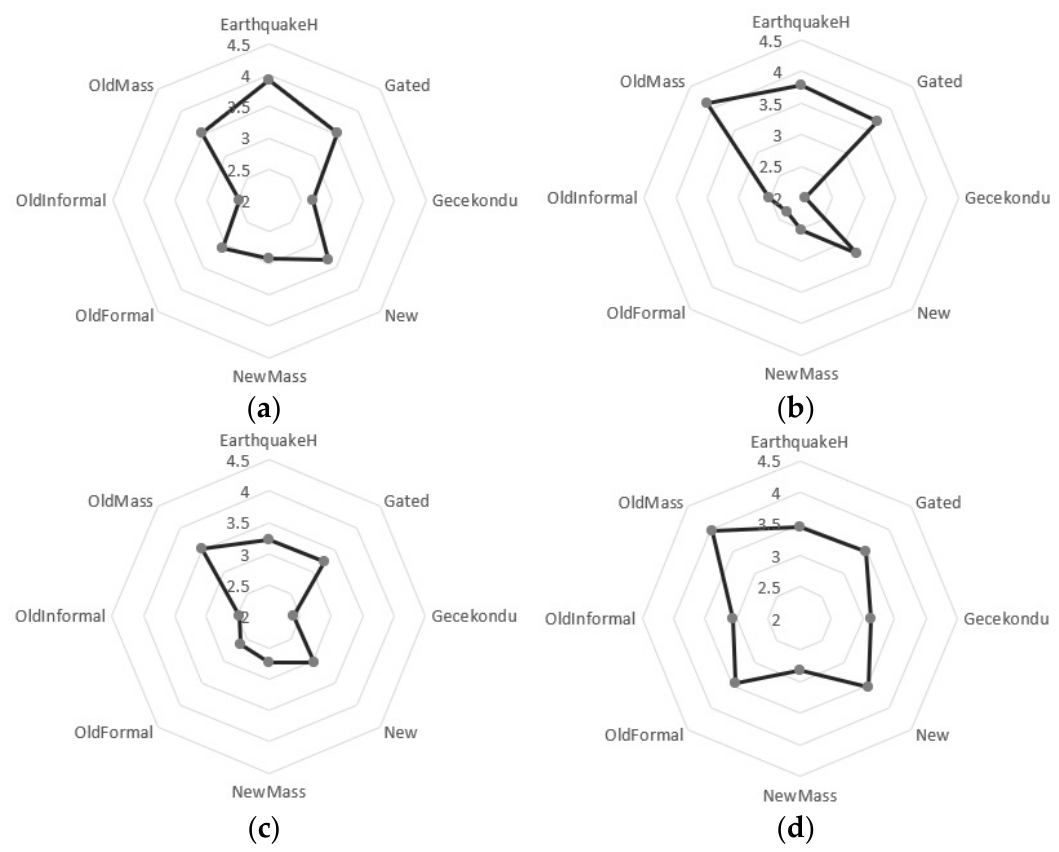
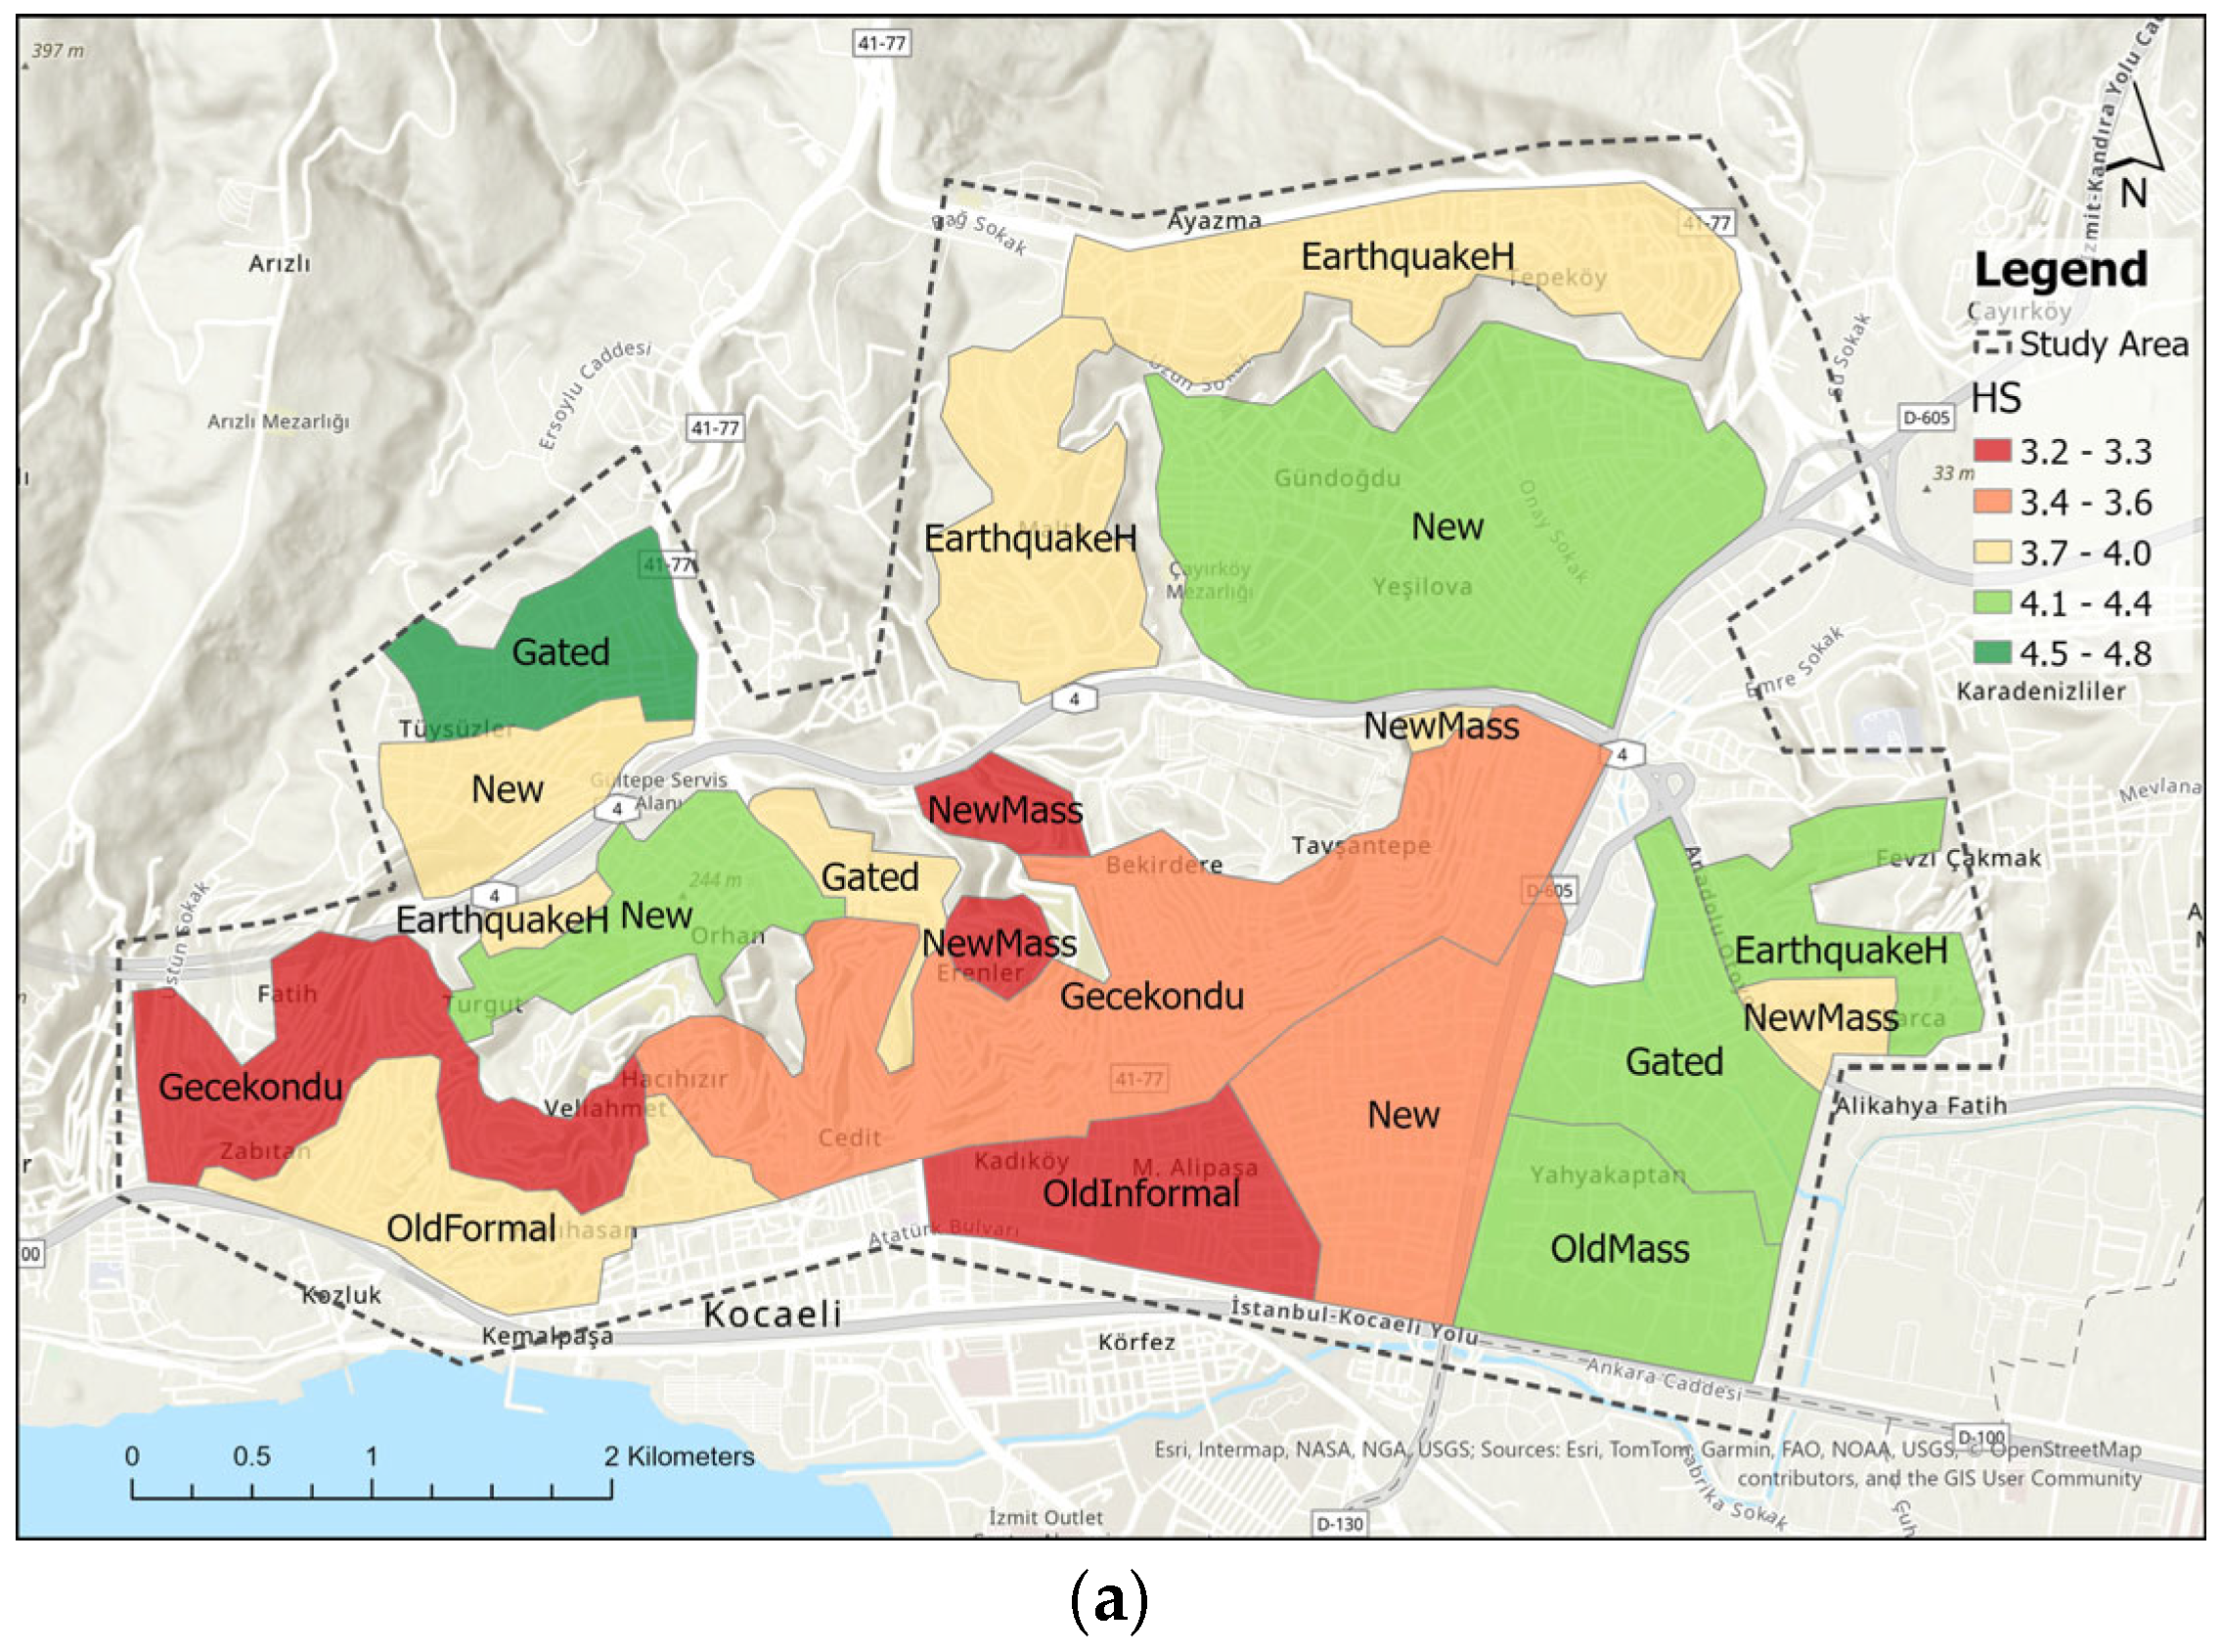
The sectoral analysis for housing reveals a significant quality divergence among the sectors (Figure 4). Gated (4.05) and OldMass (3.97) developments provide the highest housing quality, whereas Gecekondu (3.10) and OldInformal (3.13) areas reflect the lowest. Within the mass housing categories, a clear hierarchy exists: established OldMass blocks (3.97) outperform both EarthquakeH (3.57) and NewMass (3.44) projects, highlighting that housing quality is not uniform across planned environments. On the other hand, a significant divergence is observed between perceived living environmental quality and the satisfaction with it, which is particularly more pronounced in the Gecekondu (3.35) and OldInformal (3.21) sectors. In these deprived environments, satisfaction levels consistently exceed perceived quality, suggesting that residents’ subjective evaluations effectively offset their objective housing deficits.
  • Neighborhood
Neighborhood quality domains revealed a sharp divergence between sectors (Figure 5). OldMass consistently emerges as the highest-performing sector, achieving the city’s highest scores in aesthetics (4.109), social capital (3.957), and safety (3.522), even outperforming Gated communities, demonstrating how quality of the built environment and place attachment and safety effectively buffer aging infrastructure.
The urban vulnerability is most pronounced in the informal sectors: Gecekondu and OldInformal, which consistently report the lowest scores across all domains, with aesthetics in Gecekondu (2.056) and environmental quality in OldInformal (2.476) marking the critical failures of the urban fabric. EarthquakeH represents a functional success, achieving the city’s peak environmental appraisal (3.92), although scored neutral to fair in most other domains. In contrast, the material attributes necessary to support a high-quality residential experience—specifically environmental character (2.92) built environment aesthetics (2.515), and social capital (2.82)—were recorded in the lowest observed ranges for NewMass.
A comparative analysis of Neighborhood Satisfaction (NS) and Neighborhood Quality (NQ) domains reveals that NQ_Social consistently outperforms environmental, aesthetic, and safety domains. This disparity is particularly pronounced in Gecekondu, OldFormal, and OldInformal sectors, where social capital scores are notably higher than physical and safety-related metrics. The alignment between relatively higher and almost equal social capital and overall NS in these mature, deprived trajectories suggests a potential compensatory dynamic, wherein social networks might have compensated for physical deficiencies. In contrast, Gated, OldMass, and New sectors do not exhibit this social capital dominance; instead, they maintain balanced and consistently high scores across all four NQ domains, which equivalent with elevated overall NS.
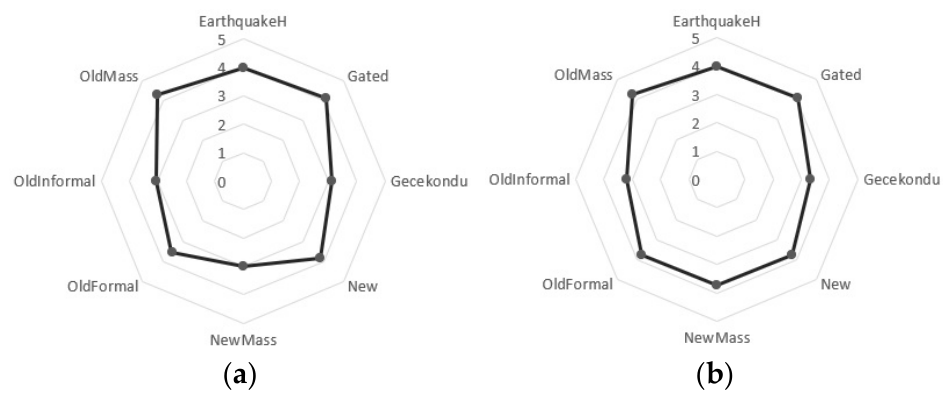
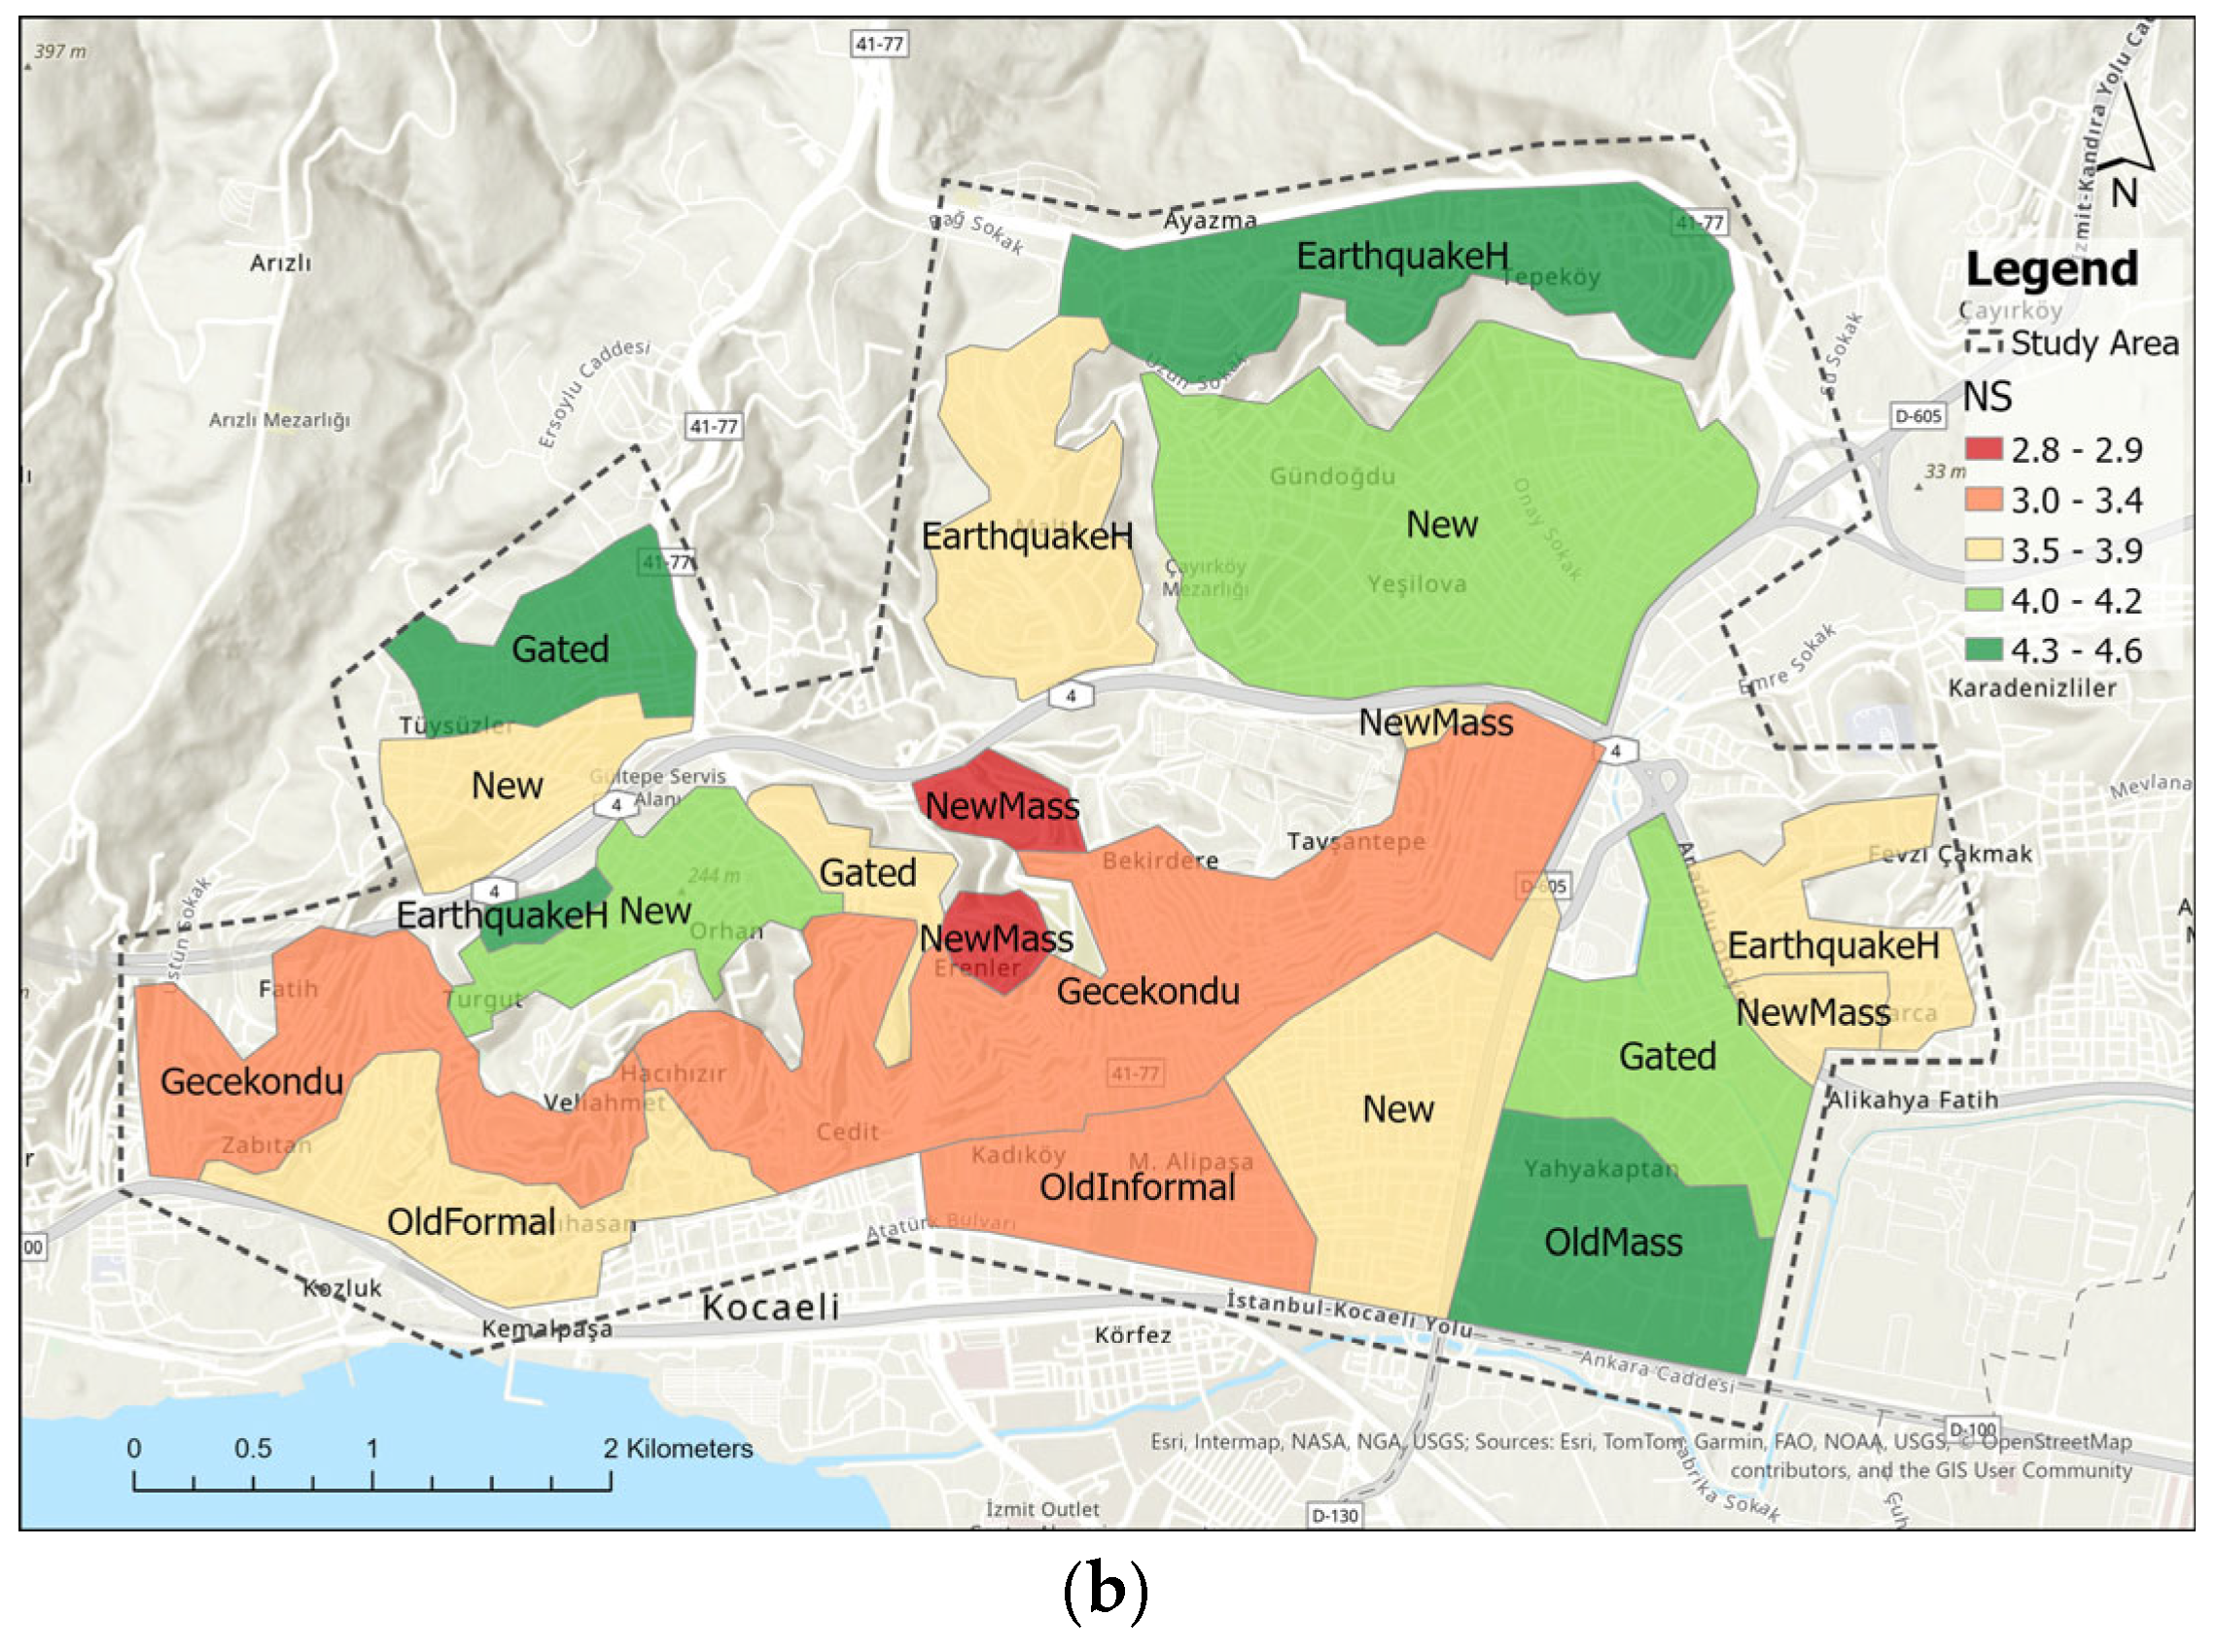
Sectoral data reveals that RS is majorly in line with NS, which was expected as NS is the strongest structural estimator of RS (Figure 6). RS is most robust in OldMass (4.227) and Gated (4.077) communities, where high performance across multiple scales reinforces the satisfaction hierarchy. Notably, in the NewMass sector, RS (3.722) remained higher than the NS (3.0). This suggests that, despite severe neighborhood deficits, residents in newer mass housing maintain a higher level of general residential well-being, which is likely explained by underlying pathways of housing satisfaction and city-wide factors that compensate for the lack of local neighborhood quality.
While the defined sectors represent shared characteristics, intracategory heterogeneity was observed in satisfaction levels of some sectors (Figure 7). For instance, EarthquakeH sectors maintained medium-to-high satisfaction levels, but they still exhibited some internal divergence within the group owing to funding mechanisms and design processes independent of each other. NewMass sectors consistently reported low HS and NS scores across their various spatial distributions with some divergence.

6. Discussion

6.1. Comparison to Other Examples

In the developing urban context of İzmit, shaped by rapid urbanization and post-earthquake recovery, residential appraisals across all satisfaction domains were relatively high (HS of 3.71, NS of 3.58, and RS of 3.66). However, consistent with its status as a developing city, İzmit’s mean neighborhood satisfaction (3.58) is notably lower than the levels reported in developed urban centers, for example, King County and Baltimore, US, 3.78/5 [26], Netherlands cities, 3.98/5 (7.96/10) [23], Oslo, 4.11/5 (8.23/10) [83], Warsaw, 4.29/5 (1.19/−2 + 2) [84], Utrecht, 3.66 (7.32/10) [24]. Housing satisfaction: 3.71 was again lower compared to what was found in the above examples of Dutch cities, 4.08/5 (8.16/10) [22], Oslo, 4.27/5 [83], and Utrecht, 3.85/5 (7.7/10) [24]. In contrast, although scarce, some studies in developing cities, for example, Guangzhou, with RS of 3.47, subsidized housing for low-income households [6], rapidly developing Chinese city Hangzhou had an RS of 2.89/5 [14], the underdeveloped city of Benin City, Nigeria had an HS of 3.17 (63.5/100) and NS of 1.18 (36.23/100) [31], and substantially lower satisfaction scores of Kabul, Iran for different neighborhood components from 1.88–2.87/5 [7] portray that satisfaction from the living environment is closely aligned with the development level of the cities. İzmit’s city satisfaction (3.89/5) represents a 64% satisfaction rate, nearly identical to the 66% reported in the EUROSTAT Urban Audit [85]—although relatively high, a figure previously noted as the lowest across European urban centers [47].

6.2. Factors Driving Residential Satisfaction

While extensive literature relates both HS and NS with RS, the present study—aligning with findings from Suzhou, China—reveals that the neighborhood environment exerts a more profound influence on residential satisfaction than housing [86]. Among the predictors of Residential Satisfaction (RS), Neighborhood Satisfaction (NS) emerged as the most powerful explanatory pathway for the current case (0. 625, p < 0.001). Housing (HS) and Community Satisfaction (CS) exhibited comparable, low-to-moderate influences (0.233, 0.281 (p < 0.001) respectively). Combined effects of these three domains account for 64% (R2: 0.64) of the variance in RS. Empirical findings of this study also align with seminal research papers which report that perceived characteristics of the living environment are strong predictors of neighborhood or residential satisfaction [4,24,36]. Specifically, perceived neighborhood quality domains—led by social factors, followed by environmental and safety aspects in this study—exerted a spillover effect over Neighborhood Satisfaction (NS), which significantly influenced global Residential Satisfaction (RS) through indirect effects.
The empirical findings reveal that NQ_Social representing social capital stands out as the most influential dimension of NS. Followed by NQ_Environ, NQ_Safety, and NQ_Aesthetics. While physical dimensions such as environmental quality and aesthetics of the built environment encapsulate the appraisal of the material urban landscape, the significance of social ties, community support, lifestyle, and place attachment points to a deeper sociospatial dynamic shaping the residential experience. This focus on the social aspect is consistent with cross-cultural findings, which identify a social connectedness marked by close neighborly relationships [6] and place attachment [87]. In contrast, several domains—such as crime, upkeep, and accessibility—typically considered central to urban Quality of Life (QoL) failed to reach significance in the present case. The reason for this lack of statistical significance might be attributed to the diminished explanatory strength of these variables within the local urban fabric. If certain services, such as basic accessibility or crime management, are perceived as uniformly adequate or inadequate across all study sectors, they diminish in their capacity to serve as significant predictors of satisfaction differences because they fail to account for the variance in the dataset. In other words, if residents throughout the city have collectively internalized or “normalized” these baseline conditions, these variables lack the necessary discriminatory power to explain the observed differences in residential satisfaction levels.
Individuals’ characteristics were also influential on residential satisfaction, but their impact was less substantial compared to that of quality of the living environment, consistent with the earlier findings [1,88]. Nevertheless, notable differences in residential satisfaction were observed based on sex, age and income. Specifically, females found their home less satisfactory than men and so did the lower-income residents. Older individuals reported significantly higher housing, neighborhood and residential satisfaction compared to younger individuals, consistent with previous research [1,24,25].

6.3. Perceived Quality vs. Satisfaction

The relationship between quality and satisfaction domains, on the other hand, while strong and significant, exhibits an intricate dynamic in this study. Specifically, a mean HQ score of 3.48 was exceeded by HS (3.71). Similarly, while NQ domain scores clustered near the midpoint (ranging from 2.90 to 3.40), the global NS (3.58) exceeded all NQ domain ratings. This inconsistency likely stemmed from underlying emotional factors that could not be communicated through perceived quality, a gap which could be addressed by the concept of “cognitive dissonance” [89]. It is also worth noting that social capital exerts a disproportionately high influence on neighborhood and residential satisfaction in İzmit when compared to other empirical cases [24,45]. Consequently, higher social capital scores may have effectively mitigated the negative perceptions associated with poor physical conditions. Also, constrained by limited mobility and low socioeconomic status, residents may undergo a perceptual adjustment, framing their living conditions as “acceptable” even if their living environment does not fully meet their needs and expectations [24,44,90]. This psychological adjustment is driven by the disproportionate strength of social capital in İzmit, surpassing the influence of physical quality in a manner that distinguishes this case from other international examples.

6.4. Post-Earthquake Context

Long-term comparisons with other cities in a post-disaster context revealed that HS, NS, and RS in EarthquakeH (3.71 and 3.58, and 3.66 respectively) were lower compared to Beichuan City, where off-site earthquake housing achieved an RS score of 4.06/5, fourteen years after the 2008 Wenchuan earthquake [45]. Findings of the İzmit case align with studies in Turkey in a post-earthquake context indicating some correspondence in residents’ satisfaction. In Düzce, Turkey after an earthquake, resident’s satisfaction was 3.33/5 (originally 2/3) [91]. In Van, Turkey, a survey conducted in 2014 in permanent housing which was built after the 2011 Van earthquakes reported residential satisfaction of 3.32/5 [92]. Previous research in 2007 focusing on the “Gündoğdu Permanent Housing”—the largest of the three earthquake housing developments in İzmit—reported a Housing Satisfaction (HS) score of 3.85 [82], very close to the mean of 3.87 observed in the present study in the same housing region, reflecting a stable resident evaluation over time.
In deprived sectors (OldFormal, OldInformal, and Gecekondu), NQ domains—particularly social capital, environmental quality, safety, and aesthetics—were consistently rated low, aligning with earlier studies that link deprivation to diminished neighborhood quality [24,59,93].
The findings reveal that social capital (NQ_Social) is most robust in sectors characterized by high physical quality, such as OldMass (3.96) and Gated (3.49), where established community bonds or deliberate alignment of similar resident profiles reinforce overall satisfaction. In contrast, among neighborhoods with limited physical and environmental quality, Gecekondu and OldFormal exhibit a significant reliance on social cohesion. In the Gecekondu sector, while physical domains like aesthetics (2.06) and safety (2.22) score poorly, social capital remains higher at 3.12, aligning with an NS of 3.12 and RS of 3.3. This suggests that strong social interactions and shared place identity may serve as a potential buffer, helping to mitigate the impact of physical deficiencies in the built environment—a dynamic that is consistent with empirical study of informal settlements in Turkey where social ties mitigate the impact of low environmental quality [94].
Conversely, residents of EarthquakeH—despite reporting the city’s highest environmental quality (3.92)—show a relatively lower social capital score (3.22) compared to the mature fabric of OldMass (3.96). This suggests that, while physical reconstruction has been somewhat successful, the social fragmentation caused by post-disaster relocation has not fully reached the cohesion levels of non-disrupted sectors. Most notably, NewMass displays the lowest social capital score in the dataset (2.82) and a neutral NS (3.00), leaving residents without a social buffer and making them highly vulnerable to the sector’s physical and safety shortcomings. This underscores the necessity of post-disaster and urban transformation interventions that prioritize community rebuilding and social integration alongside physical infrastructure to ensure long-term residential resilience.
Gated communities have emerged as an alternative housing model, providing high-quality privately secured environments, yet predominantly accessible to socioeconomically advantaged groups. Beyond physical infrastructure, these developments serve as a mechanism for reconstituting a sense of belonging, safety, and lifestyle—often as a direct response to perceived urban deterioration in the urban environment. Reflecting this shift in the Turkish context, these developments have become a significant component of housing supply and planning policy, as they are increasingly associated with elevated levels of both residential and life satisfaction.
This study prioritizes mass housing projects due to their nature as formalized, institutionally regulated environments that are expected to meet specific planning standards. A comparative analysis of these typologies revealed that the OldMass model performs superiorly to its counterparts. While the post-disaster EarthquakeH developments yielded relatively favorable results, they remained secondary to OldMass.
The EarthquakeH sector in İzmit represents a pragmatic, yet limited, response to disaster. Following the top-down logic typical of post-disaster environments [95], where the scene is very chaotic and resources are scarce, the priority was placed on the rapid delivery of units rather than participatory planning or academic integration [10,95]—a pattern that persists in contemporary disaster responses [96]. While this achieved the essential goal of rehousing displaced residents, the absence of bottom-up processes limited the development of deeper social resilience [97]. Thus, EarthquakeH is best understood as a functional baseline: it addressed the immediate crisis but struggled to transcend the limitations of its production.
Further critical findings concern newer mass housing developments (NewMass). Paradoxically, the NewMass projects—despite their modern construction—exhibited the lowest performance scores, even falling below deprived sectors across several domains. On the one hand, the findings challenge the urban-scale mass housing models encouraged by Turkey’s post-1980 liberal policies [59]. On the other hand, the transformation of OldFormal, OldInformal, and Gecekondu areas remains a fragmented, incremental process that negatively reshapes the functional quality of these residential settings [59,98]. Unlike the post-disaster projects, which were constrained by emergency conditions, NewMass was developed during a period of relative institutional stability. Consequently, its inferior HS and NS scores—surpassing the deficits of EarthquakeH and even deprived sectors (OldInformal, Gecekondu)—are difficult to justify, signaling a fundamental breakdown in the quality of housing delivery and production of space.
Ultimately, this study confirms that affordability-driven housing provision alone is insufficient to ensure residential satisfaction. Improving satisfaction requires spatial strategies that foster social interaction [99,100] and provide accessible, high-quality public spaces for both everyday use and emergency situations [101,102], rather than relying solely on financial instruments or housing quantity. Social capital can be utilized to inform the planning and design to be tailored to residents’ expectations and behavioral preferences [103,104].
OldMass represents the study’s most successful housing model, outperforming all other sectors—including high-income Gated communities—in NS, RS, and all NQ domains, except NQ_Environ, the single deficit noted that largely owes to its central urban location, which entails higher noise and air pollution.
This outcome demonstrates that housing provision is most effective when integrated with robust social infrastructure, providing a vital blueprint for future housing policies that move beyond the mere delivery of units toward the creation of sustained urban communities. Remarkably, OldMass surpassed even Gated communities, despite the latter’s market-driven focus on private amenities. This finding underscores the enduring value of planning that prioritizes human-centered design, recreation, and collective infrastructure, offering a critical counter-narrative for both post-disaster recovery and contemporary housing strategies. OldMass (the Yahya Kaptan housing project) is a landmark in Turkish urban planning history and is widely considered one of the most successful examples of mass housing in the country. The housing project emerged in the climate of specific political, social, and architectural philosophy that flourished in the late 1980s and early 1990s and was envisioned as a social project. The goal was not just to build “units” but to create a self-sufficient “neighborhood” for the middle and working classes. The project adopted a “superblock” concept, which prioritized pedestrian-centric inner green belts by pushing vehicular traffic to the periphery. Unlike modern TOKİ-style projects (NewMass), where the houses are built first and the social amenities come years later—or never—Yahya Kaptan integrated schools, markets, and sports facilities into the initial master plan. Furthermore, its cooperative origins fostered a stable demographic of civil servants and teachers who have “aged in place”, creating deep social bonds and a culture of active local management that newer, more transient developments lack. Finally, its legendary seismic performance during the 1999 earthquake—where it stood firm while much of İzmit collapsed—provided a foundation of psychological security and place attachment that continues to drive high satisfaction scores decades after.

7. Conclusions

This research highlights the central role of living environment perception in shaping residential satisfaction and lived sociospatial resilience within a developing-city context. The observed satisfaction levels in İzmit reveal a persistent sociospatial divergence, highlighting a complex relationship between the tangible outcomes of physical construction or reconstruction and the subjective quality of life reported by residents, as well as being characterized by significant variations in residents’ satisfaction across urban sectors. Consequently, the primary contributions of this research are outlined as methodological advancements, empirical findings, and policy implications.
Residential satisfaction research is advanced through the operationalization of satisfaction as a multidimensional construct, grounded in theory and tested across diverse urban sectors. A primary strength of this research is found in the methodological rigor of employing a Structural Equation Modeling (SEM) framework to provide a robust assessment of satisfaction hierarchies. By utilizing an extensive multidimensional dataset, the structural evaluation of how perceived and evaluated domains converge is provided. Furthermore, a process-based, spatial sector approach is introduced, which captures intraurban variability across distinct urbanization trajectories. A transferable framework is thus provided for assessing the lived experience of resilience in post-disaster or disaster-prone cities through the evaluation of residential satisfaction, providing a robust tool for future researchers.
A clear performance hierarchy across urban trajectories was revealed. OldMass (Yahya Kaptan) emerged as the most successful housing model, outperforming even high-income gated communities in nearly all neighborhood quality domains. Conversely, striking underperformance is exhibited by NewMass projects, which yield lower satisfaction than even the oldest deprived sectors, underscoring that affordability and housing quantity alone are insufficient to ensure residential well-being. Furthermore, it is identified that social capital appears to function as a vital resource in matured or informal sectors like Gecekondu, where strong social ties and a sense of belonging effectively mitigate the perceived impact of structural deficits—a buffer notably absent in NewMass sectors. In contrast, more affluent sectors exhibited a more balanced distribution of high scores across all quality domains, suggesting that the role of social capital in residential satisfaction varies according to the socioeconomic context. Additionally, it is observed that residential satisfaction is not a neutral metric but is filtered through demographic lenses; for low-income and less-educated communities, the strength of social capital is more profound, while younger individuals report more negative perceptions of neighborhood quality due to a satisfaction gap between modern aspirations and existing conditions.
The results indicate that, in resource-constrained urban contexts, prioritizing highly influential attributes—specifically social capital—is an effective strategy for improving satisfaction. A shift from providing mere “housing” to creating “dynamic urban ecosystems” that offer connectivity, social mobility, and vibrant public spaces is argued to be necessary. The success of, e.g., OldMass is rooted in pedestrian-centric design, superblock parks and green areas, and the integration of social infrastructure into the initial master plan. The role of the municipal administration in facilitating social connectivity reflects broader arguments regarding the state’s responsibility in shaping equitable urban environments. True urban resilience in disaster-prone cities requires the integration of seismic-resistant and adequate housing with built environment qualities that foster community engagement and social connectivity. Prioritizing the enhancement of social interactions and place attachment through thoughtful design principles—particularly in public spaces and recreation areas—is essential for achieving these goals. A transition in future housing policies from mere shelter provision to the creation of high-quality living environments capable of absorbing both physical shocks and the long-term social pressure of rapid urbanization is essential. For deprived sectors (OldFormal, OldInformal, and Gecekondu), policy should prioritize incremental, community-led regeneration that preserves existing social networks while upgrading physical and safety infrastructure. Given that social cohesion currently appears to function as a vital resource for residents in these areas, planning efforts must avoid top-down displacement and instead foster participatory processes that formalize local assets.
This study acknowledges several limitations. First, cross-sectional design restricts the ability to establish definitive causal pathways and relationships may be subject to bi-directional influence. Second, as a single-city case study, it does not aim to generalize outcomes but rather presents an analytical framework intended for application in different urban or cultural contexts, hence other city contexts remain to be tested. Third, the reliance on self-reported data introduces the risk of common-method bias, a challenge inherent in all subjective measurements of personal traits, where perceptions may reflect personal predispositions rather than objective reality, and the study lacks objective validation of built environment conditions, relying on perceived measures. Fourth, the full dataset (N = 392) was employed for the structural model, because partitioning the data for cross-validation would have compromised the accuracy of parameter estimation as the research focuses on multiple complex relationships of domains and indicators within a single structural framework. However, it would be beneficial to utilize cross-validation in future studies with larger samples to mitigate potential overfitting. While full robustness testing against ordinal estimators was not feasible due to the study’s modest sample size, the MLR estimator was adopted for its stability in complex structural frameworks. For future research with larger sample sizes, the adoption of polychoric-based estimation approaches, such as WLSMV, is suggested. Fifth, while the sampling strategy was designed to ensure a balanced representation across demographic characteristics—such as age and sex—an exact refusal rate for all recruitment methods could not be determined due to the limitations of the recruitment method; consequently, the possibility of potential selection effects could not be fully ruled out. Sixth, while the role of social capital offers a plausible interpretation, future research employing moderation and interaction analyses is necessary to empirically validate a potential compensatory mechanism. Finally, the potential for residential self-selection—where residents choose neighborhoods that align with their existing preferences—cannot be fully ruled out. Future research should employ longitudinal designs and incorporate objective environmental metrics as well to validate these subjective findings.
Ultimately, by centering human experience within urban resilience, a necessary blueprint is provided for transforming disaster-prone environments into resilient, socially integrated, and enduring habitats.

Supplementary Materials

The following supporting information can be downloaded at: https://www.mdpi.com/article/10.3390/su18125877/s1, File S1: Explaratory Factor Analysis (EFA) Results for Housing and Neighborhood Indicators; File S2: SEM Total Effects (Includes direct and Indirect effects).

Funding

This research received no external funding.

Institutional Review Board Statement

The study was conducted in accordance with the Declaration of Helsinki and approved by the Institutional Review Board of Izmir Institute of Technology (protocol code 03/02, and date of approval: 26 March 2026).

Informed Consent Statement

Informed consent was explicitly obtained from all participants (aged 18+) prior to their participation in the survey. Participants were fully informed of the study’s purpose and the nature of the questions. All participants were notified that data collection was entirely anonymous and that they maintained the option to withdraw from the survey at any time.

Data Availability Statement

Available upon reasonable request.

Conflicts of Interest

The author declares no conflicts of interest.

References

  1. Parkes, A.; Kearns, A.; Atkinson, R. What makes people dissatisfied with their neighbourhoods? Urban Stud. 2002, 39, 2413–2438. [Google Scholar] [CrossRef]
  2. Aminian, L. Modelling and Measuring Quality of Urban Life: Housing, Neighbourhood, Transport and Job. Ph.D. Thesis, Technische Universiteit Eindhoven, Eindhoven, The Netherlands, 2019. [Google Scholar]
  3. Basolo, V.; Strong, D. Understanding the neighborhood: From residents’ perceptions and needs to action. Hous. Policy Debate 2002, 13, 83–105. [Google Scholar] [CrossRef]
  4. Cao, X.J. How does neighborhood design affect life satisfaction? Evidence from Twin Cities. Travel Behav. Soc. 2016, 5, 68–76. [Google Scholar] [CrossRef]
  5. Feng, J.; Tang, S.; Chuai, X. The impact of neighbourhood environments on quality of life of elderly people: Evidence from Nanjing, China. Urban Stud. 2018, 55, 2020–2039. [Google Scholar] [CrossRef]
  6. Tang, Q.; Wei, Z.; Huang, S. Residential Satisfaction of Subsidized Housing Estates in Post-Reform China: Roles of the Built and Social Environments. Land 2024, 13, 899. [Google Scholar] [CrossRef]
  7. Shahraki, S.Z.; Hosseini, A.; Sauri, D.; Hussaini, F. Fringe more than context: Perceived quality of life in informal settlements in a developing country: The case of Kabul, Afghanistan. Sustain. Cities Soc. 2020, 63, 102494. [Google Scholar] [CrossRef]
  8. Biswas, B.; Sultana, Z.; Priovashini, C.; Ahsan, M.N.; Mallick, B. The emergence of residential satisfaction studies in social research: A bibliometric analysis. Habitat Int. 2021, 109, 102336. [Google Scholar] [CrossRef]
  9. Yükseler, M.; Teniker, G. Assessment of social vulnerability in terms of natural hazards in Türkiye based on entropy method. Nat. Hazards 2026, 122, 169. [Google Scholar] [CrossRef]
  10. Akıncı, F. The aftermath of disaster in urban areas: An evaluation of the 1999 earthquake in Turkey. Cities 2004, 21, 527–536. [Google Scholar] [CrossRef]
  11. Mohit, M.A. Quality of Life in Natural and Built Environment: An Introductory Analysis. Procedia-Soc. Behav. Sci. 2013, 101, 33–43. [Google Scholar] [CrossRef]
  12. Campbell, A.; Converse, P.E.; Rodgers, W.L. The Quality of American Life: Perceptions Evaluations and Satisfactions; Russell Sage Foundation: New York, NY, USA, 1976. [Google Scholar]
  13. Discoli, C.; Martini, I.; San Juan, G.; Barbero, D.; Dicroce, L.; Ferreyro, C.; Esparza, J. Methodology aimed at evaluating urban life quality levels. Sustain. Cities Soc. 2014, 10, 140–148. [Google Scholar] [CrossRef]
  14. Huang, Z.; Du, X.; Yu, X. Home ownership and residential satisfaction: Evidence from Hangzhou, China. Habitat Int. 2015, 49, 74–83. [Google Scholar] [CrossRef]
  15. Cutter, S.L. Residential satisfaction and the suburban homeowner. Urban Geogr. 2013, 3, 315–327. [Google Scholar] [CrossRef]
  16. Sirgy, M.J. The Psychology of Quality of Life: Hedonic Well-Being, Life Satisfaction, and Eudaimonia; Springer Science & Business Media: Dordrecht, The Netherlands, 2012; Volume 50. [Google Scholar]
  17. Bonaiuto, M.; Fornara, F.; Bonnes, M. Indexes of perceived residential environment quality and neighbourhood attachment in urban environments: A confirmation study on the city of Rome. Landsc. Urban Plan. 2003, 65, 41–52. [Google Scholar] [CrossRef]
  18. Mouratidis, K. Urban Planning and Quality of Life:. A Review of Pathways Linking the Built Environment to Subjective Well-Being. Cities 2021, 115, 103229. [Google Scholar] [CrossRef]
  19. Somarriba, N.; Pena, B. Synthetic indicators of quality of life in Europe. Soc. Indic. Res. 2009, 94, 115–133. [Google Scholar] [CrossRef]
  20. Marans, R.W.; Stimson, R. An Overview of Quality of Urban Life. In Investigating Quality of Urban Life, Theory, Methods and Empirical Research; Marans, R.W., Stimson, R., Eds.; Springer: Dordrecht, The Netherlands, 2011. [Google Scholar]
  21. Sun, Y. Development of Neighbourhood Quality of Life Indicators; CUISR—Community Institute for Social Research: Saskatoon, SK, Canada, 2005. [Google Scholar]
  22. Jansen, S.J.T. The impact of the have–want discrepancy on residential satisfaction. J. Environ. Psychol. 2014, 40, 26–38. [Google Scholar] [CrossRef]
  23. McCrea, R.; Shyy, T.-K.; Stimson, R. What is the Strength of the Link Between Objective and Subjective Indicators of Urban Quality of Life? Appl. Res. Qual. Life 2006, 1, 79–96. [Google Scholar] [CrossRef]
  24. Permentier, M.; Bolt, G.; van Ham, M. Determinants of Neighbourhood Satisfaction and Perception of Neighbourhood Reputation. Urban Stud. 2011, 48, 977–996. [Google Scholar] [CrossRef]
  25. Lee, S.M.; Conway, T.L.; Frank, L.D.; Saelens, B.E.; Cain, K.L.; Sallis, J.F. The Relation of Perceived and Objective Environment Attributes to Neighborhood Satisfaction. Environ. Behav. 2017, 49, 136–160. [Google Scholar] [CrossRef]
  26. Wesz, J.G.B.; Miron, L.I.G.; Delsante, I.; Tzortzopoulos, P. Urban Quality of Life: A Systematic Literature Review. Urban Sci. 2023, 7, 56. [Google Scholar] [CrossRef]
  27. Sirgy, M.J.; Cornwell, T. How neighborhood features affect quality of life. Soc. Indic. Res. 2002, 59, 79–114. [Google Scholar] [CrossRef]
  28. Connerly, C.E.; Marans, R.W. Handbook of Housing and the Built Environment in the United States; Greenwood: New York, NY, USA, 1988. [Google Scholar]
  29. Amérigo, M.; Aragones, J.I.A. Theoretical and methodological approach to the study of residential satisfaction. J. Environ. Psychol. 1997, 17, 47–57. [Google Scholar] [CrossRef]
  30. Lee, E.; Park, N. Perceived cultural housing differences and residential satisfaction: A case study of Korean sojourners. Fam. Consum. Sci. Res. J. 2012, 41, 131–144. [Google Scholar] [CrossRef]
  31. Ogu, V.I. Urban residential satisfaction and the planning implications in a developing world context: The example of Benin City, Nigeria. Int. Plan. Stud. 2002, 7, 37–53. [Google Scholar] [CrossRef]
  32. Wang, F.; Wang, D. Changes in residential satisfaction after home relocation: A longitudinal study in Beijing, China. Urban Stud. 2019, 57, 583–601. [Google Scholar] [CrossRef]
  33. Aigbavboa, W.; Thwala, W. A notional appraisal of the bases of housing satisfaction. Int. J. Hous. Sci. Its Appl. 2016, 40, 133–145. [Google Scholar]
  34. Teck-Hong, T. Housing satisfaction in medium- and high-cost housing: The case of Greater Kuala Lumpur, Malaysia. Habitat Int. 2012, 36, 108–116. [Google Scholar] [CrossRef]
  35. Addas, A. Influence of Urban Green Spaces on Quality of Life and Health with Smart City Design. Land 2023, 12, 960. [Google Scholar] [CrossRef]
  36. Lovejoy, K.; Handy, S.; Mokhtarian, P. Neighborhood satisfaction in suburban versus traditional environments: An evaluation of contributing characteristics in eight California neighborhoods. Landsc. Urban Plan. 2010, 97, 37–48. [Google Scholar] [CrossRef]
  37. de Jong, K.; Albin, M.; Skarback, E.; Grahn, P.; Bjork, J. Perceived green qualities were associated with neighborhood satisfaction, physical activity, and general health: Results from a cross-sectional study in suburban and rural Scania, southern Sweden. Health Place 2012, 18, 1374–1380. [Google Scholar] [CrossRef]
  38. Metwally, E.; Samir, E. Assessing citizen satisfaction indicators for urban public services to enhance quality of life in Sharm el-Sheikh. Ain Shams Eng. J. 2024, 15, 102841. [Google Scholar] [CrossRef]
  39. Batson, C.D.; Monnat, S.M. Distress in the desert: Neighborhood disorder, resident satisfaction, and quality of life during the Las Vegas foreclosure crisis. Urban Aff. Rev. 2015, 51, 205–238. [Google Scholar] [CrossRef]
  40. Leslie, E.; Cerin, E. Are perceptions of the local environment related to neighbourhood satisfaction and mental health in adults? Prev. Med. 2008, 47, 273–278. [Google Scholar] [CrossRef]
  41. Zhang, Z.; Měchurová, K.; Resch, B.; Amegbor, P.; Sabel, C.E. Assessing the association between overcrowding and human physiological stress response in different urban contexts: A case study in Salzburg, Austria. Int. J. Health Geogr. 2023, 22, 15. [Google Scholar] [CrossRef]
  42. Zhan, D.; Kwan, M.-P.; Zhang, W.; Fan, J.; Yu, J.; Dang, Y. Assessment and determinants of satisfaction with urban livability in China. Cities 2018, 79, 92–101. [Google Scholar] [CrossRef]
  43. Corrado, G.; Corrado, L.; Santoro, E. On the individual and social determinants of neighbourhood satisfaction and attachment. Reg. Stud. 2013, 47, 544–562. [Google Scholar] [CrossRef]
  44. Mohan, J.; Twigg, L. Sense of place, quality of life and local socioeconomic context: Evidence from the survey of English housing, 2002/03. Urban Stud. 2007, 44, 2029–2045. [Google Scholar] [CrossRef]
  45. Xiang, X.; Xiao, Y.; Feng, Q.; Wang, R.; Huang, H. Relationship among residential satisfaction, social ties, place attachment and perceived disaster risk in the off-site reconstruction area—Evidence from an earthquake-stricken county in southwestern China. Int. J. Disaster Risk Reduct. 2024, 111, 104741. [Google Scholar] [CrossRef]
  46. Bottoni, G.; Addeo, F. The Effect of Social Cohesion on Subjective Individual Quality of Life in European Countries. Soc. Indic. Res. 2024, 171, 1111–1133. [Google Scholar] [CrossRef]
  47. Şenlier, N.; Yıldız, R.; Aktaş, E.D. A Perception Survey for the Evaluation of Urban Quality of Life in Kocaeli and a Comparison of the Life Satisfaction with the European Cities. Soc. Indic. Res. 2009, 94, 213–226. [Google Scholar] [CrossRef]
  48. McCrea, R.; Western, J.; Stimson, R. Modeling Determinants of Subjective QOUL at Different Geographic Scales: The Case of the Brisbane-SEQ Region. In Investigating Quality of Urban Life, Theory, Methods and Empirical Research; Marans, R.W., Stimson, R., Eds.; Springer: Dordrecht, The Netherlands, 2011. [Google Scholar]
  49. Chen, S.; Cerin, E.; Stimson, R.; Laia, P.C. An Objective Measure to Assessing Urban Quality of Life based on Land Use Characteristics. Procedia Environ. Sci. 2016, 36, 50–53. [Google Scholar] [CrossRef]
  50. Brambilla, M.; Michelangeli, A.; Peluso, E. Equity in the City: On Measuring Urban (Ine)quality of Life. Urban Stud. 2013, 50, 3205–3224. [Google Scholar] [CrossRef]
  51. Santos, L.D.; Martins, I. Intra-Urban Disparities in the Quality of Life in the City of Porto: A Spatial Analysis Contribution; Research Report, PEst-OE/EGE/UI4105/2014; CEF.UP—Center for Economics and Finance at University of Porto: Porto, Portugal, 2014. [Google Scholar]
  52. Haslauer, E.; Delmelle, E.C.; Keul, A.; Blaschke, T.; Prinz, T. Comparing Subjective and Objective Quality of Life Criteria: A Case Study of Green Space and Public Transport in Vienna. Soc. Indic. Res. 2015, 124, 911–927. [Google Scholar] [CrossRef]
  53. Feneri, A.M.; Vagiona, D.; Karanikolas, N. Multi-Criteria Decision Making to Measure Quality of Life: An Integrated Approach for Implementation in the Urban Area of Thessaloniki, Greece. Appl. Res. Qual. Life 2015, 10, 573–587. [Google Scholar] [CrossRef]
  54. Brunton, C. Quality of Life Survey 2016: Topline Report; A Report Prepared on Behalf of Auckland Council, Wellington City Council, Christchurch City Council, and Dunedin City Council. 2016. Available online: https://hamilton.govt.nz/assets/Uploads/Documents/Content-Documents/Your-City/Quality-of-Life-Survey/Previous-Quality-of-Life-Reports/2016/2016-Quality-of-Life-Report.pdf (accessed on 14 April 2026).
  55. Zhang, F.; Li, D.; Chan, A.P.C. Diverse contributions of multiple mediators to the impact of perceived neighborhood environment on the overall quality of life of community-dwelling seniors: A cross-sectional study in Nanjing, China. Habitat Int. 2020, 104, 102253. [Google Scholar] [CrossRef]
  56. Poortinga, W.; Calve, T.; Jones, N.; Lannon, S.; Rees, T.; Rodgers, S.E.; Lyons, R.A.; Johnson, R. Neighborhood Quality and Attachment: Validation of the Revised Residential Environment Assessment Tool. Environ. Behav. 2016, 49, 255–282. [Google Scholar] [CrossRef]
  57. Al-Qawasmi, J.; Saeed, M.; Asfour, O.S.; Aldosary, A.S. Assessing Urban Quality of Life: Developing the Criteria for Saudi Cities. Front. Built Environ. 2021, 7, 682391. [Google Scholar] [CrossRef]
  58. Oktay, D.; Rüstemli, A. Measuring the Quality of Urban Life and Neighbourhood Satisfaction: Findings from Gazimagusa (Famagusta) Area Study. Int. J. Soc. Sci. Humanit. Stud. 2010, 2, 1309–8063. [Google Scholar]
  59. Türkoğlu, H.; Terzi, F.; Salihoğlu, T.; Bölen, F.; Okumuş, G. Residential satisfaction in formal and informal neighborhoods: The case of Istanbul, Turkey. International will help develop an integrated picture of the attributes of residential satisfaction. J. Archit. Res. 2018, 13, 112–132. [Google Scholar]
  60. Salihoğlu, T.; Türkoğlu, H. Residential Environment and Quality of Urban Life. Megaron 2019, 14, 203–217. [Google Scholar] [CrossRef]
  61. Cochran, W.G. Sampling Techniques, 3rd ed.; John Wiley & Sons: New York, NY, USA, 1977. [Google Scholar]
  62. Pallant, J. SPSS Survival Manual: A Step by Step Guide to Data Analysis Using SPSS, 2nd ed.; Allen and Unwin: Sydney, Australia, 2005. [Google Scholar]
  63. Rattray, J.C.; Jones, M.C. Essential elements of questionnaire design and development. J. Clin. Nurs. 2007, 16, 234–241. [Google Scholar] [CrossRef]
  64. Rodcha, R.; Tripathi, N.K.; Shrestha, R.P. Comparison of cash crop suitability assessment using parametric, AHP, and FAHP methods. Land 2019, 8, 79. [Google Scholar] [CrossRef]
  65. Marans, R.W. Quality of Urban Life Studies: An Overview and Implications for Environment-Behaviour Research. Procedia-Soc. Behav. Sci. 2012, 35, 9–22. [Google Scholar] [CrossRef]
  66. Hair, J.; Black, W.; Babin, B.; Anderson, R. Multivariate Data Analysis, 7th ed.; Pearson: Essex, UK, 2014. [Google Scholar]
  67. Say-Wah, L.; Chuen-Wah, S.; Xue, K. Residents’ Sustainable City Evaluation, Satisfaction and Loyalty: Integrating Importance-Performance Analysis and Structural Equation Modelling. Sustainability 2021, 13, 6766. [Google Scholar] [CrossRef]
  68. Mondiana, Y.Q.; Pramoedyo, H.; Sumarminingsih, E. Structural Equation Modeling on Likert Scale Data with Transformation by Successive Interval Method and with No Transformation. Int. J. Sci. Res. Publ. 2018, 8, 398–405. [Google Scholar] [CrossRef]
  69. Bentler, P.M. Multivariate Analysis with Latent Variables: Causal Modeling. Annu. Rev. Psychol. 1980, 31, 419–456. [Google Scholar] [CrossRef]
  70. Byrne, B.M. Structural Equation Modeling with AMOS: Basic Concepts, Applications, and Programming; Routledge: New York, NY, USA, 2010. [Google Scholar]
  71. Hair, J.F.; Babin, B.J.; Anderson, R.E.; Black, W.C. Multivariate Data Analysis, 8th ed.; Pearson Prentice: London, UK, 2019. [Google Scholar]
  72. Fornell, C.; Larcker, D.F. Evaluating structural equation models with unobservable variables and measurement error. J. Mark. Res. 1981, 18, 39–50. [Google Scholar] [CrossRef]
  73. Rhemtulla, M.; Brosseau-Liard, P.É.; Savalei, V. When can categorical variables be treated as continuous? A comparison of robust continuous and categorical SEM estimation methods under suboptimal conditions. Psychol. Methods 2012, 17, 354–373. [Google Scholar] [CrossRef]
  74. Brown, T.A. Confirmatory Factor Analysis for Applied Research, 2nd ed.; Guilford Press: New York, NY, USA, 2015. [Google Scholar]
  75. Schermelleh-Engel, K.; Moosbrugger, H.; Müller, H.E. Evaluating the fit of structural equation models: Tests of significance and descriptive goodness-of-fit measures. Methods Psychol. Res. 2003, 8, 23–74. [Google Scholar]
  76. Vandenberg, R.J.; Lance, C.E. A review and synthesis of the measurement invariance literature: Suggestions, practices, and recommendations for organizational research. Organ. Res. Methods 2000, 3, 4–70. [Google Scholar] [CrossRef]
  77. Sakaria, D.; Maat, S.M.; Mohd Matore, M.E.E. Examining the Optimal Choice of SEM Statistical Software Packages for Sustainable Mathematics Education: A Systematic Review. Sustainability 2023, 15, 3209. [Google Scholar] [CrossRef]
  78. Goldberger, A.S. Structural Equation Methods in the Social Science. Econometrica 1972, 40, 979–1001. [Google Scholar] [CrossRef]
  79. Gerçek, D.; Güven, İ.T. Urban earthquake vulnerability assessment and mapping at the microscale based on the catastrophe progression method. Int. J. Disaster Risk Sci. 2023, 14, 768–781. [Google Scholar] [CrossRef]
  80. Gerçek, D. Assessment of Spatial Clustering of Socioeconomic Variables and Facilities at District Level: The Case of Körfez-Derince-İzmit. Resilience 2023, 7, 209–220. [Google Scholar] [CrossRef]
  81. World Bank. Project Appraisal Document for the Marmara Earthquake Emergency Reconstruction Project; Report No. 19844-TU; World Bank, Europe and Central Asia Region: Washington, DC, USA, 1999. [Google Scholar]
  82. Taş, N.; Coskun, N.; Taş, M. A qualitative evaluation of the after earthquake permanent housings in Turkey in terms of user satisfaction—Kocaeli, Gundogdu Permanent Housing model. Build. Environ. 2007, 42, 3418–3431. [Google Scholar] [CrossRef]
  83. Mouratidis, K. Commute satisfaction, neighborhood satisfaction, and housing satisfaction as predictors of subjective well-being and indicators of urban livability. Travel Behav. Soc. 2020, 21, 265–278. [Google Scholar] [CrossRef]
  84. Mantey, D. Objective and Subjective Determinants of Neighborhood Satisfaction in the Context of Retrofitting Suburbs. Sustainability 2021, 13, 11954. [Google Scholar] [CrossRef]
  85. Urban Audit—Perception Survey. Perception Survey Local Perceptions of Quality of Life in 31 European Cities. 2004. Available online: https://www.evonymos.org/files1/45BUCLET.URBAN.AUDIT.pdf (accessed on 14 April 2026).
  86. Chen, J.; Pellegrini, P.; Xu, Y.; Ma, G.; Wang, H.; An, Y.; Feng, X. Evaluating residents’ satisfaction before and after regeneration: The case of a high-density resettlement neighbourhood in Suzhou, China. Cogent Soc. Sci. 2022, 8, 2144137. [Google Scholar] [CrossRef]
  87. Manzo, L.C.; Perkins, D.D. Finding Common Ground: The Importance of Place Attachment to Community Participation and Planning. J. Plan. Lit. 2006, 20, 335–350. [Google Scholar] [CrossRef]
  88. Lu, M. Do people move when they say they will? Inconsistencies in individual migration behavior. Popul. Environ. 1999, 20, 467–488. [Google Scholar] [CrossRef]
  89. Schwanen, T.; Mokhtarian, P.L. The Extent and Determinants of Dissonance between Actual and Preferred Residential Neighborhood Type. Environ. Plan. B Plan. Des. 2004, 31, 759–784. [Google Scholar] [CrossRef]
  90. Anton, C.E.; Lawrence, C. Home is where the heart is: The effect of place of residence on place attachment and community participation. J. Environ. Psychol. 2014, 40, 451–461. [Google Scholar] [CrossRef]
  91. Akıncı-Kesim, G.; Müderrisoğlu, H.; Uzun, O.; Karaca, H.; Aydın, Ş.; Ak, K.; Eroğlu, E.; Uzun, S. Residents’ satisfaction on Re-urbanization after Earthquake Disaster in Düzce, Turkey. J. Appl. Sci. 2006, 6, 303–310. [Google Scholar] [CrossRef]
  92. Kamacı-Karahan, E.; Kemeç, S. Residents’ satisfaction in post-disaster permanent housing: Beneficiaries vs. non-beneficiaries. Int. J. Disaster Risk Reduct. 2022, 73, 102901. [Google Scholar] [CrossRef]
  93. Mouratidis, K. Neighborhood characteristics, neighborhood satisfaction, and well-being: The links with neighborhood deprivation. Land Use Policy 2020, 99, 104886. [Google Scholar] [CrossRef]
  94. İnal-Çekiç, T.; Kozaman-Aygün, S.; Bilen, Ö. Reflections on “place attachment”: Perceptions of urban redevelopment in an informal neighborhood in Istanbul. J. Hous. Built Environ. 2024, 39, 1–20. [Google Scholar]
  95. Davidson, C.H.; Johnson, C.; Lizarralde, G.; Dikmen, N.; Sliwinski, A. Truths and myths about community participation in post-disaster housing projects. Habitat Int. 2007, 31, 100–115. [Google Scholar] [CrossRef]
  96. Özdoğan, F.; Lizarralde, G.; Herazo, B. The politics of land management after disasters: The case of post-earthquake reconstruction in Türkiye. Disaster Prev. Manag. 2024, 33, 535–560. [Google Scholar] [CrossRef]
  97. Zhao, Z.; Zhou, X.; Zheng, Y.; Meng, T.; Fang, D. Enhancing infrastructural dynamic responses to critical residents’ needs for urban resilience through machine learning and hypernetwork analysis. Sustain. Cities Soc. 2024, 106, 105366. [Google Scholar] [CrossRef]
  98. Oudeh, S.; Türkoğlu, H. Governance-Driven Incremental Transformation of Open Spaces in an Originally Planned Satellite Town: Implications for Urban Quality of Life in the Case of Bahçeşehir, Istanbul. Sustainability 2026, 18, 3365. [Google Scholar] [CrossRef]
  99. Ahmadi, R.; Asemani, M.; Hamidi, N.; Rezaei, S.S.; Ahmadi, A.; Amirahmadi, F.; Aghaei, S.; Bayat, F. Analyzing the relationship between place attachment and residential satisfaction through the mediation of social capital- the case of affordable housing. J. Hous. Built Environ. 2024, 39, 1843–1865. [Google Scholar] [CrossRef]
  100. Du, T.; Zeng, N.; Huang, Y.; Vejre, H. Relationship between the dynamics of social capital and the dynamics of residential satisfaction under the impact of urban renewal. Cities 2020, 107, 102933. [Google Scholar] [CrossRef]
  101. Li, Q.; Peng, S.; Chen, Z.; Du, H.; Liu, Y.; Li, W. Resilience Evaluation and Renovation Strategies of Public Spaces in Old Communities from a Disaster-Adaptive Perspective. Sustainability 2024, 16, 6823. [Google Scholar] [CrossRef]
  102. Kaya, A.Y.; Imren, E.; Giyik, C.; Karadeniz, E.; Adıgüzel, F.; Özel, H.B.; Bulucu, Y. Assessing the Spatial Suitability and Adequacy of Emergency Assembly Areas for Urban Disaster Resilience Using GIS and the Best–Worst Method (BWM): The Case of Malatya, Türkiye. Appl. Sci. 2026, 16, 5206. [Google Scholar] [CrossRef]
  103. Honda, A.; Sato, S.; Sugiura, M.; Abe, T.; Imamura, F. Personality Traits and Types of Housing Recovery after the 2011 Great East Japan Earthquake and Tsunami. Sustainability 2023, 15, 5679. [Google Scholar] [CrossRef]
  104. Nikounam Nezami, H.; Asadpour, A. Social capital and the spatial quality of neighborhoods: Parameters, indicators & strategies. ITU A|Z 2021, 18, 301–318. [Google Scholar]
Figure 1. Conceptual model for Residential Satisfaction.
Sustainability 18 05877 g001
Figure 2. Study area, sectors’ coverage, and overall spatial distribution of the survey sites.
Sustainability 18 05877 g002
Figure 3. Structural Model. (a) SEM Path Diagram. (b) Indirect Effects. (c) Sociodemographic variables’ effects on latent constructs (p-values: *** p < 0.001, ** p < 0.01). Insignificant latent constructs are shown in gray.
Sustainability 18 05877 g003
Figure 4. Housing Quality (HQ_Hous) (a) and Housing Satisfaction (HS) (b) in sectors of İzmit.
Sustainability 18 05877 g004
Figure 5. Neighborhood Quality Domains. (a) Environment character. (b) Aesthetics. (c) Safety. (d) Social Capital.
Sustainability 18 05877 g005
Figure 6. (a) Neighborhood Satisfaction, (b) Residential Satisfaction.
Sustainability 18 05877 g006
Figure 7. (a) Housing Satisfaction (HS), (b) Neighborhood Satisfaction (NS) based on sectors in İzmit.
Sustainability 18 05877 g007aSustainability 18 05877 g007b
Table 1. Summary of Sampling and Population Data by Sector.
SectorsSample SizePopulationWithin-Sector Representation (%)
OldInformal2619,4470.134
OldFormal2721,2730.127
Gecekondu9862,2000.157
OldMass2515,8220.158
EarthquakeH5741,6050.137
NewMass3528,0280.125
New9066,0590.136
Gated3425,8830.131
Total392280,3170.139
Table 2. Measurement model results: Standardized factor loadings (λ) for housing and neighborhood quality domains.
Domain
(Latent Construct)
CodeIndicator
(Observed Variable)
Std. Factor Loadings (λ)
HQ_HousH1Space0.702 ***
H2Layout0.769 ***
H3Daylight0.637 ***
H4Sound Insulation0.706 ***
H5Thermal Insulation0.661 ***
H6Physical Condition0.680 ***
H7Seismic Resistance0.630 ***
NQ_EnvironN1Air Quality0.588 ***
N2Tranquility0.819 ***
N3Density0.793 ***
N4Greenery0.685 ***
NQ_AccessN9Accessibility0.788 ***
N10Car-free0.714 ***
N11Basic Services0.673 ***
NQ_AestheticsN15Aesthetics0.911 ***
N16Buildings_upkeep0.919 ***
N17Buildings_integrity0.672 ***
NQ_UpkeepN19Waste Collection0.729 ***
N20Street Cleanness0.820 ***
N21Pavement Quality0.799 ***
N22Parks Upkeep0.806 ***
NQ_CrimeN25Burglary0.896 ***
N26Car Theft0.815 ***
N27Substance Abuse0.656 ***
NQ_SafetyN28Nighttime-safe0.881 ***
N29Women-safe0.904 ***
N30Child-safe0.793 ***
NQ_SocialN33Neighbor Support0.759 ***
N34Lifestyle0.782 ***
N35Place Attachment0.813 ***
N36Social Bonds0.691 ***
p-values: *** p < 0.001.
Table 3. Construct reliability and convergent validity metrics for the latent domains.
Domain
(Latent Construct)
Cronbach’s αMcDonald’s ωCRAVE
HQ_Hous0.8590.8570.8840.468
NQ_Environ0.8050.8230.8500.529
NQ_Access0.7640.7730.8040.529
NQ_Aesthetics0.8640.8710.9030.691
NQ_Upkeep0.8700.8760.9010.636
NQ_Crime0.8160.8370.8550.616
NQ_Safety0.8920.9010.9020.747
NQ_Social0.8450.8400.8890.575
Table 4. Descriptive statistics of living environment quality and satisfaction domains.
Domain
(Latent Construct)
MeanStd. Dev.
HQ_Hous3.480.81
NQ_Environ3.160.98
NQ_Access3.401.02
NQ_Aesthetics2.901.12
NQ_Upkeep3.270.98
NQ_Crime3.041.10
NQ_Safety2.841.06
NQ_Social3.340.96
HS3.710.92
NS3.581.04
CS3.890.90
RS3.660.95
LS3.311.15
Table 5. Criteria used in categorization of the sectors of the city.
Pre-EarthquakeEarly Post-EarthquakePost-EarthquakeDensityStatus
<19801980–19981999–20022003–20132014–2020+
OldFormal highformal
OldInformal highinformal
Gecekondu lowinformal
OldMass mediumformal
EarthquakeH mediumformal
NewMass highformal
New mediumformal
Gated lowformal
The ■ symbol indicates the specific era in which each sector was implemented.
Disclaimer/Publisher’s Note: The statements, opinions and data contained in all publications are solely those of the individual author(s) and contributor(s) and not of MDPI and/or the editor(s). MDPI and/or the editor(s) disclaim responsibility for any injury to people or property resulting from any ideas, methods, instructions or products referred to in the content.