Article

Research on the Coupling Coordination and Influencing Factors Between Digital Economy and High-Quality Cultural Tourism Development in Shanxi Province Under the Background of Sustainable Development

1
School of History and Tourism Culture, Shanxi Normal University, Taiyuan 030031, China
2
School of Business Administration and Tourism Management, Yunnan University, Kunming 650091, China
3
Border Tourism Research Base of China Tourism Research Institute, Kunming 650091, China
*
Authors to whom correspondence should be addressed.
Sustainability 2026, 18(11), 5684; https://doi.org/10.3390/su18115684
Submission received: 28 April 2026 / Revised: 26 May 2026 / Accepted: 2 June 2026 / Published: 3 June 2026

Abstract

In the context of the increasingly deepening concept of sustainable development, the coupling coordination between the digital economy (DE) and high-quality cultural tourism development (HQCTD) has become an important pathway for promoting the sustainable growth of Shanxi Province’s digital cultural tourism industry. Based on an in-depth analysis of the coupling relationship between the DE and HQCTD, and using panel data from 11 prefecture-level cities in Shanxi Province from 2014 to 2023, the entropy weight method and the coupling coordination degree (CCD) model were employed to investigate the relationship between the two systems, while the obstacle degree model and geographic detector were applied to identify the internal and external obstacle factors. The results indicate that both the DE and HQCTD in Shanxi Province experienced slight fluctuations under the impact of COVID-19, and significant spatial differences were observed in the comprehensive development levels of the two systems. The CCD between the DE and the HQCTD in Shanxi Province remains at a good level, with the spatial distribution having evolved from “a single-center pattern” to a “southward extension of the center”. The core obstacle factor for the DE is public budget expenditure, while the main obstacle factor for HQCTD is the number of students enrolled in higher-education institutions. The primary external driving factors at the single-factor level are industrial structure, opening up, and transportation accessibility, while the dominant interaction factors are Z2∩Z4, Z4∩Z6, Z1∩Z6, and Z1∩Z4, respectively. Based on these findings, development strategies are proposed.

1. Introduction

In the context of the deepening implementation of global sustainable development initiatives, economic growth patterns and industrial structures are undergoing profound transformations. The tourism industry is intrinsically linked to multiple United Nations Sustainable Development Goals (SDGs): United Nations SDG 8 emphasizes the role of tourism in promoting local employment and enhancing economic resilience [1], while SDG 11 concerns the impacts of tourism activities on community culture, natural heritage, and environmental carrying capacity [2]. SDG 12 further calls for reducing resource consumption and waste emissions throughout the tourism process and advancing a circular economy model [2]. Therefore, China’s tourism industry urgently needs to pursue transformation and upgrading guided by these goals in order to achieve high-quality and sustainable development. In this context, the report of the 20th National Congress of the Communist Party of China proposed to “shape tourism with culture and showcase culture through tourism, thereby promoting the deep integration of the culture and tourism industries”, and emphasized “promoting the deep integration of the DE and the real economy”. The DE, with data serving as a key production factor, is characterized by technological advancement, integration, openness, and sustainability, and can effectively restructure the development system of the culture tourism industries by promoting resource optimization, innovation-driven development, and efficiency improvement [3], becoming a core driving force for empowering HQCTD. At the same time, the culture tourism industries take culture as its soul and tourism as its carrier; aiming to achieving the goals of high-quality development characterized by innovation, coordination, green development, openness, and sharing [4], it provides a broad application space and practical scenarios for the expansion of the DE. The coupling coordinated development between the DE and HQCTD has become a new engine driving high-quality regional economic development.
Shanxi is located in the middle reaches of the Yellow River Basin and serves as an important ecological barrier and energy base in China, making it imperative to achieve sustainable transformation through industrial structure upgrading and the cultivation of digital technologies. In 2024, the blockbuster Chinese game Black Myth: Wukong triggered a surge of visits to its real-world filming and inspiration sites due to its highly accurate representation of Shanxi’s cultural heritage. Luong et al. argued that games can significantly stimulate tourists’ enthusiasm for visiting Shanxi by integrating cultural pride, nostalgic narratives, and immersive experiences [5]. Li et al. further explored the influence of gamers’ virtual experiences on their attitudes toward on-site tourism and their behavioral intentions [6]. These studies indicate that the digitalization and intelligent transformation of the culture tourism industries can effectively promote their development. Therefore, in the context of sustainable development, systematically exploring the coupling coordination and driving factors between the DE and HQCTD will not only promote high-quality development in Shanxi, the Yellow River Basin, and indeed across China, but also provide practical reference value for advancing the sustainable development of digital cultural tourism worldwide.
In summary, the major contributions of this study are as follows: Firstly, an evaluation index system for the DE and HQCTD in energy-based cities is constructed, providing a reference framework for subsequent research. Secondly, the spatiotemporal evolution characteristics of the DE and HQCTD are revealed, and the evolution patterns of their coupling coordination are clarified. And thirdly, the major obstacles and external driving factors hindering the coupling coordinated development of the two systems are identified, thereby providing theoretical guidance for practical development.

2. Literature Review

The DE has provided a direction for global economic growth and has become a decisive factor in empowering the development of other industries [7]. Current academic research mainly examines the value-creation effects of the DE in unleashing the potential of production factors from the perspectives of industries, enterprises, and governments, the mediating effects of industrial efficiency improvement and economic structure optimization [8], and the platform effects in promoting the alignment between global resource supply and demand [9]. To accurately capture the effects of the DE, econometric methods such as the spatial Durbin model and fixed-effects model have been employed to measure the spatiotemporal evolution of DE development levels [10]. Meanwhile, the widespread application of digital technologies has also posed certain security risks to nations and individuals, leading to growing concern over digital security [11], and the cultivation of digital technology talent has become a core driving force for intelligent development [12]. HQCTD has become an important component of China’s high-quality economic development, reflecting the transformation of the Chinese economy from scale expansion to quality improvement. Scholars argue that HQCTD encompasses multiple dimensions, including sociocultural development, ecological environment, economic efficiency, and public services; accordingly, evaluation index systems for HQCTD have been constructed based on the five new development concepts of innovation, coordination, green development, openness, and sharing [13], as well as dimensions such as environment, resources, services, and attractiveness [14]. Research has revealed that HQCTD exhibits significant spatial disparities and still has substantial room for improvement overall [15].
The research on the relationship between the DE and the cultural tourism industry began in the late 20th century, with research perspectives focusing on tourism informatization and exploring the tourism effects brought about by information technology [16]. In the 21st century, with the widespread application of the Internet and computers, tourism e-commerce developed rapidly, and research on the role of Internet technology in innovating tourism business models gradually increased. Subsequently, digital technologies such as big data, virtual technology, and cloud computing have exerted a significant impact on the tourism industry, constantly transforming tourism development models and reshaping the internal logic of tourism [17]. Current research mainly focuses on the cultural tourism effects of the digital economy, arguing that the DE empowers the development of the culture tourism industries by realizing the value potential of production factors, optimizing industrial structures, and enhancing industrial efficiency [18]. Information and communication technologies, particularly the Internet, have become one of the most effective tools for promoting cultural tourism development [19], facilitating the transformation of supply and demand from monolog to dialog. On the demand side, research focuses on the impacts of digital media on tourist behavior [20], tourist safety [21], and tourist value [22], whilst on the supply side, research has been conducted on the construction of digital cultural tourism scenarios [23], the digital and intelligent utilization of tourism resources [24], the tourism application of digital technologies, etc. [25].
Research on the relationship between the DE and HQCTD has provided valuable insights into their coupling coordination mechanisms. However, several limitations remain: (a) there is excessive emphasis on unidirectional empowerment, while neglecting the bidirectional interaction between the DE and HQCTD; (b) existing studies have mainly focused on macro and provincial scales, with insufficient exploration at the municipal level; and (c) traditional methods, such as the obstacle degree model and regression analysis, primarily identify internal influencing factors while overlooking external driving factors. Consequently, symbiosis theory was employed to systematically reveal the coupling coordination mechanisms between the DE and HQCTD. The 11 prefecture-level cities in Shanxi, a resource-dependent province in the middle reaches of the Yellow River Basin that is currently undergoing a critical stage of economic transformation, were selected as the specific spatial units of this study. The obstacle degree model and geographic detector were employed to comprehensively analyze internal obstacle factors and external driving factors.

3. Coupling Coordination Mechanisms Between the DE and HQCTD from the Perspective of Symbiosis Theory

Symbiosis theory originated in biology and refers to the interactions and interdependence among organisms, emphasizing value co-creation and collaborative evolution among multiple entities. Since its introduction in 1879 [26], the theory has gradually been extended and deepened in disciplines such as economics, sociology, and management. Given the diversity of stakeholders in tourism destinations and their mutually beneficial symbiotic relationships in ecological, social, and economic dimensions, Stringer introduced symbiosis theory into tourism research in 1984 and proposed tourism symbiosis theory [27]. Based on Symbiosis Theory, the DE and HQCTD are not characterized by simple one-way empowerment; rather, they have formed a symbiotic system connected through tourism demand. Based on the five types of symbiotic relationships proposed in existing studies, mutualistic symbiosis, parasitic symbiosis, commensal symbiosis, parasitism, and mimicry [28], mutualistic symbiosis is regarded, from a practical perspective, as the most desirable path for the coordinated development of the DE and HQCTD. The symbiotic system formed by the DE and HQCTD consists of symbiotic system, symbiotic environment, symbiotic mechanisms, and symbiotic effects (Figure 1).

3.1. Symbiotic Mechanism Through Which the DE Empowers HQCTD

Within the symbiotic relationship, the DE system, with digital infrastructure, digital development, and digital outcomes as its core components, promotes HQCTD by upgrading cultural tourism consumption, optimizing cultural tourism structure, and transforming cultural tourism governance. Firstly, digital cultural tourism technologies have expanded the channels for transmitting the value of cultural tourism resources, through the virtualization and intelligent reconfiguration of the dissemination modes of cultural tourism resources, these technologies enhance the perceptibility and interactivity of cultural tourism destinations, thereby deepening tourists’ immersive experiences. Secondly, the flow of data elements improves the efficiency of cultural tourism resource allocation, promotes the transformation of tourism consumption from standardized supply to precise and personalized supply, and facilitates the optimization of the cultural tourism consumption structure. Finally, digital platforms facilitate information sharing and collaborative governance among all stakeholders in the culture tourism industry chain, strengthen interactions among enterprises, governments, local communities, and tourists, and enhance the level of green and sustainable development of the culture tourism industries.

3.2. Symbiotic Mechanism Through Which HQCTD Drives the Evolution of the DE

Within the symbiotic relationship, the HQCTD system, with innovation, coordination, green development, openness, and sharing as its core elements, promotes the development of the DE by guiding digital innovation, upgrading digital infrastructure, and leveraging digital ecosystems. As tourists’ demands for immersive experiences, personalized services, and digitalized services continue to increase, the culture tourism industries will inevitably place higher demands on digital technological innovation, data-processing capabilities, and digital infrastructure development, thereby driving the development of the DE from the demand side. Meanwhile, the integration of culture, tourism, healthcare, agriculture, and industry has given rise to new business models such as smart scenic areas, digital cultural creativity, and online consumption; this process has accelerated the deep integration of digital technologies with the real economy and expanded the application boundaries of the DE. Furthermore, in order to improve the overall service quality throughout the tourism process, a multi-stakeholder collaborative digital governance system involving governments, enterprises, and research institutions has gradually been established, thereby promoting the continuous improvement of the digital ecological environment.

4. Research Design

4.1. Study Area

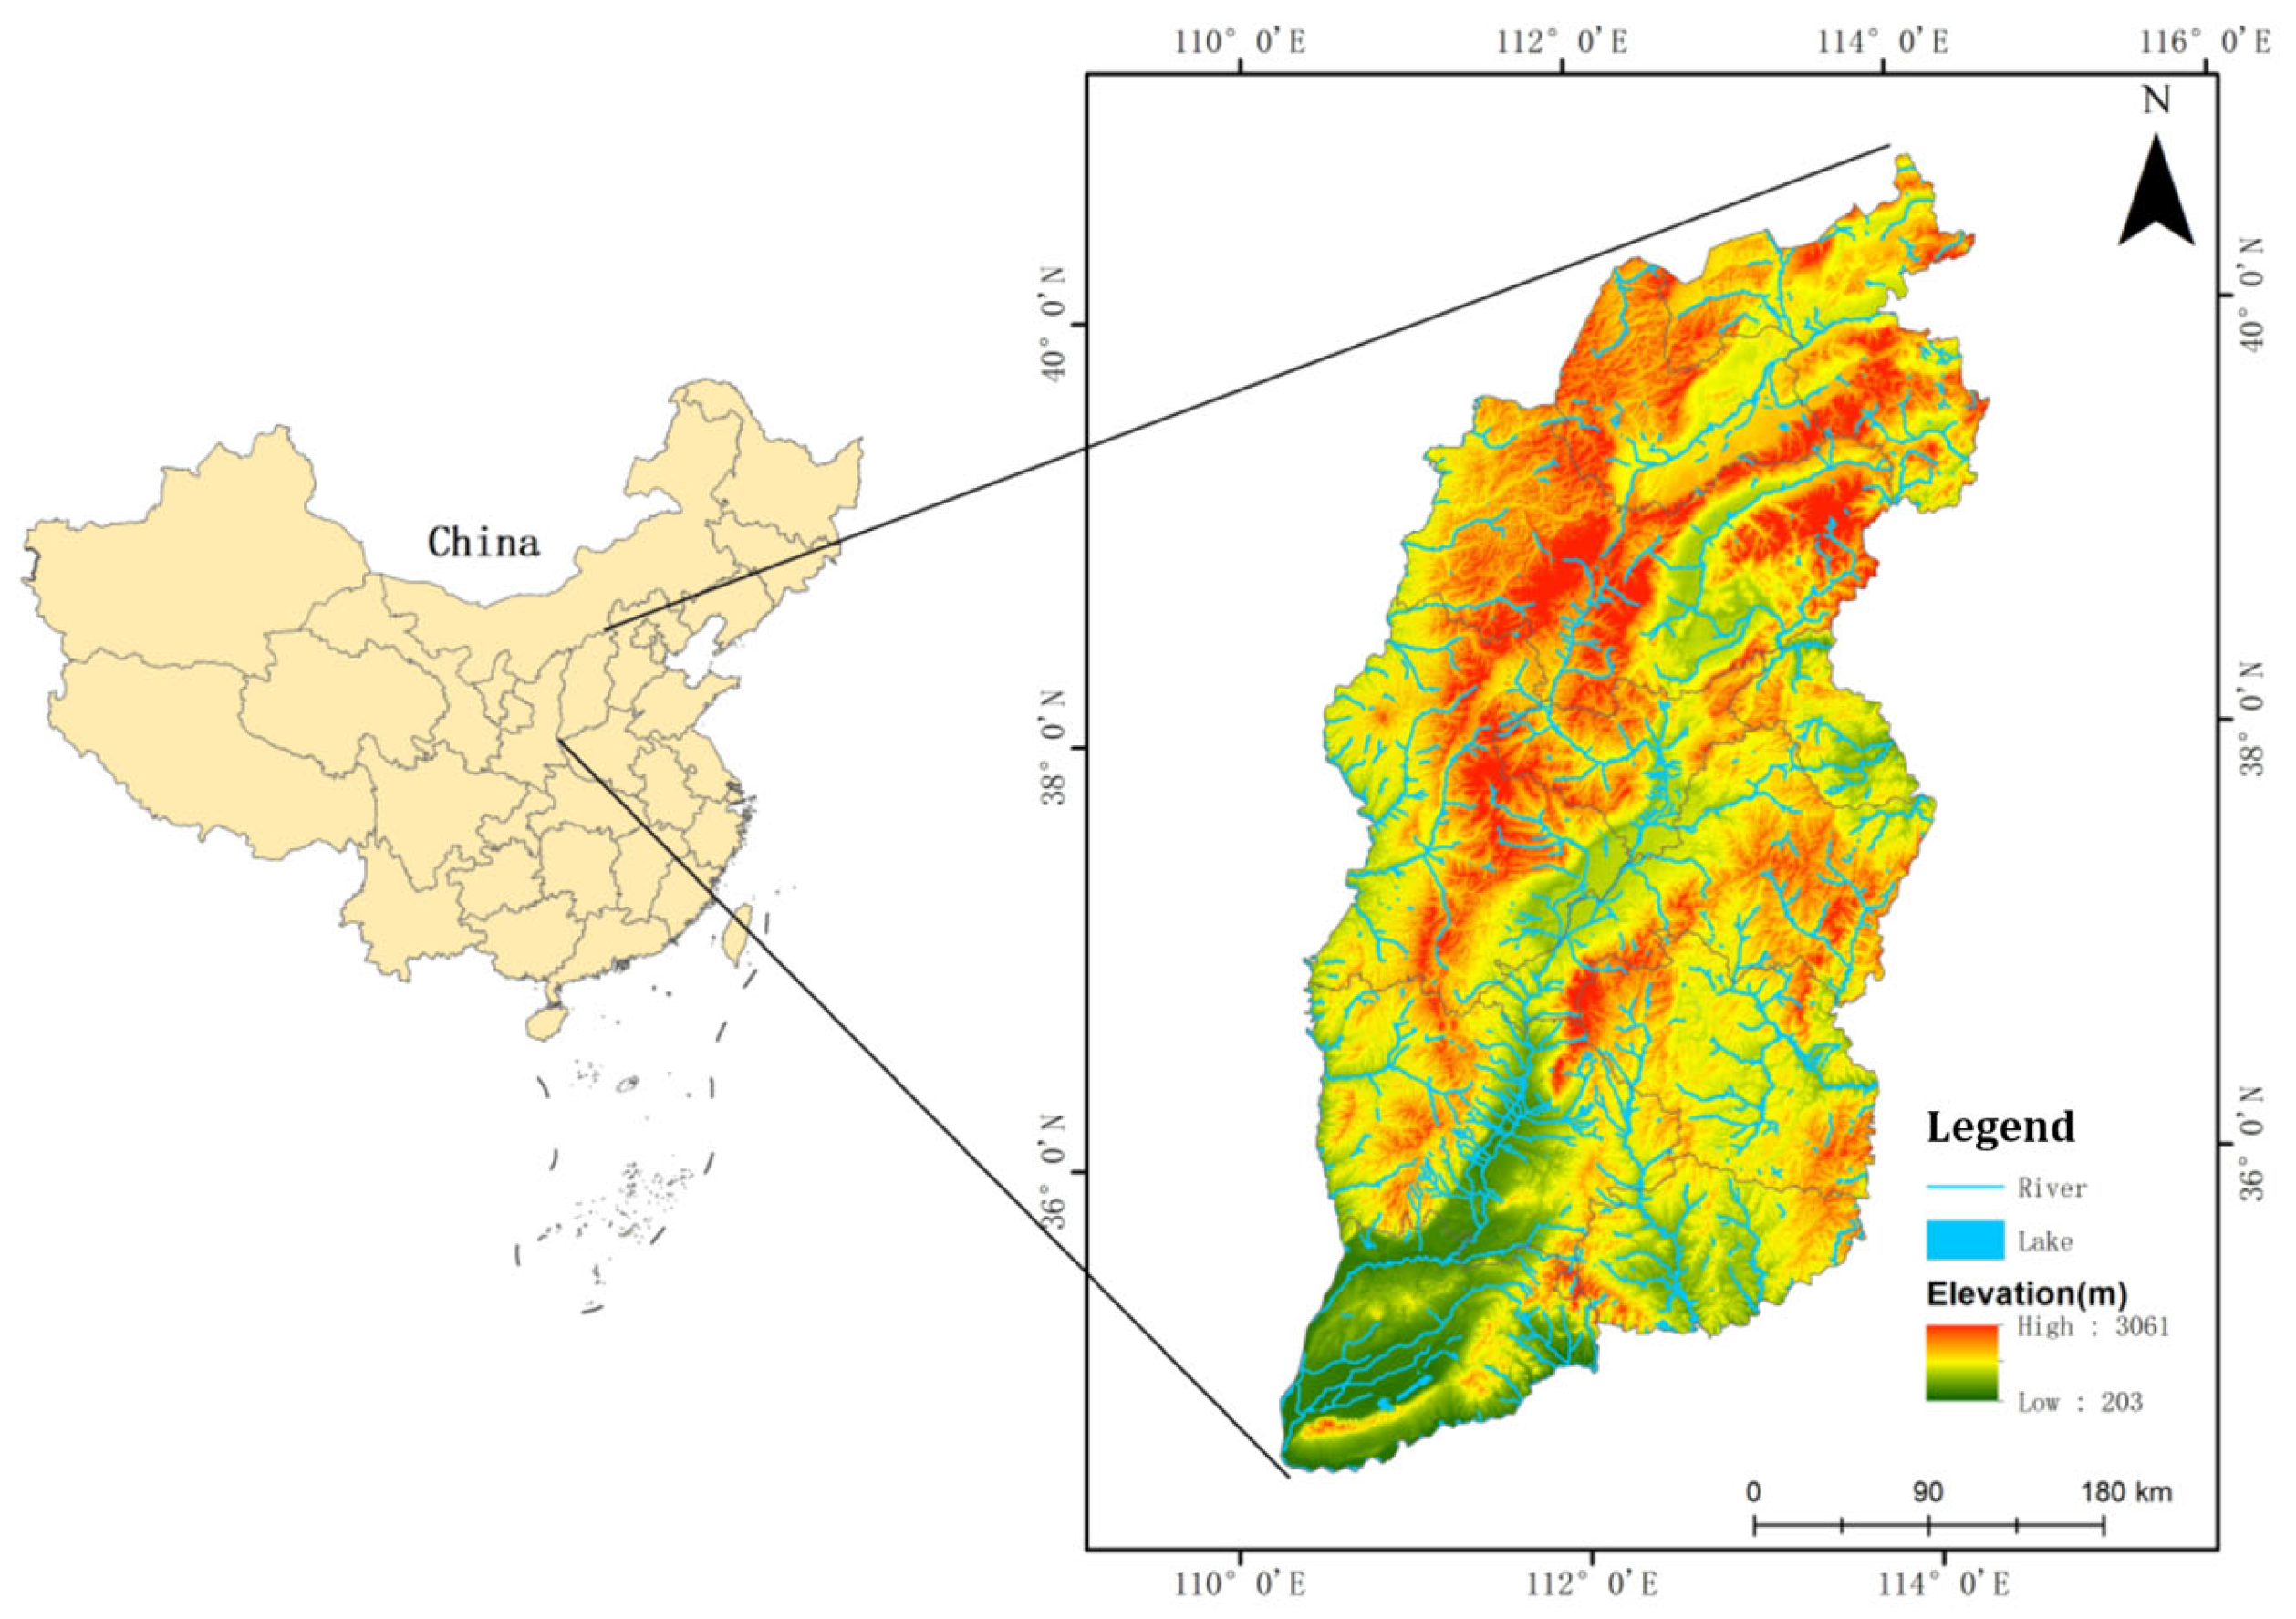
Shanxi Province is located in the central part of North China, with geographical coordinates ranging from 34°34′ N to 40°44′ N and 110°15′ E to 114°32′ E (Figure 2). It borders Hebei Province to the east, Shaanxi Province to the west, Henan Province to the south, and Inner Mongolia to the north. The province extends approximately 682 km from north to south and 385 km from east to west, with a total area of around 156,700 square kilometers. The terrain is predominantly mountainous and hilly, with an overall pattern of higher altitudes in the northeast and lower elevations in the southwest. The western part is dominated by the Lüliang Mountain Range, the eastern part by the Taihang Mountain Range, and the central Fen River Valley runs north to south. As an important component of the Yellow River Basin, Shanxi Province is both a resource-based economy and a typical example of a region where traditional energy industries coexist with emerging digital cultural tourism industries. Its sustainable development provides important implications for regional coordination and the transformation and upgrading of other resource-based regions.

4.2. Indicator Development

Based on the theoretical connotations and core dimensions of the DE and HQCTD, this study reviewed existing research, selected high-frequency indicators, and ultimately established the final indicator system by considering data availability.
This study constructs a DE evaluation system comprising 12 indicators across three dimensions: digital infrastructure, digital development, and digital outcomes. Similarly, based on the new development philosophy, the HQCTD evaluation system is established across five dimensions, innovation, coordination, green development, openness, and sharing—with a total of 14 indicators selected (Table 1).

4.3. Research Methods

4.3.1. Entropy Method

The entropy method is an objective weighting approach used to measure the dispersion of indicators, thereby accurately reflecting the information contained within them. The specific steps are as follows:
(1)
Data Standardization Processing
The standardization equations for positive and negative indicators are given by:
Y i j = X i j m i n X i j m a x X i j m i n X i j + 0.01 Y i j = m a x X i j X i j m a x X i j m i n X i j + 0.01
In equation above, Y i j represents the standardized value of the data, while X i j denotes the original value. m a x X i j and m i n X i j represent the maximum and minimum values of X i j . To avoid standardized values being equal to zero, 0.01 was added during the data standardization process to ensure that all standardized values fall within the range of (0,1).
(2)
Determination of System Development Level
The proportion of the j -th indicator in the i -th year relative to that indicator is calculated as follows:
S i j = Y i j / i = 2014 2023 Y i j
The information entropy of the (j)-th indicator is calculated as follows:
E j = ln n 1 i = 2014 2023 ( S i j × l n S i j )
The weight of the (j)-th indicator is calculated as follows:
W j = ( 1 E j ) / j = 1 m ( 1 E j )
In the above equations, n denotes the number of years, m represents the number of indicators, and W j refers to the weight of the indicator. Based on the above formulas, the standardized data and indicator weights are calculated, and the evaluation values of the DE and HQCTD are then calculated as follows:
C = j = 1 m W j Y i j
T = j = 1 m W j * Y i j *
In the equation, C and T represent the evaluation values of the DE system and the HQCTD system.

4.3.2. CCD Model

Coupling refers to the phenomenon of interdependence, mutual influence, and constraints among different parts of a system. The CCD model measures the degree of interaction between multiple systems, with a value range of 0–1. A higher value indicates better coupling coordination between the DE and HQCTD, reflecting stronger industrial integration, whereas lower values signify weaker integration. According to the parameter values proposed by Weng [36], we set the parameters α and β to 0.5, and employ a “three-stage” and “ten-level” classification method to categorize the CCD between the DE and HQCTD, as shown in Table 2.

4.3.3. Standard Deviation Ellipse (SDE) and Center of Gravity Trajectory Model (CGT)

The SDE is a statistical method used to describe the direction and dispersion of spatial point data. It provides a visual representation of the center of clustering, the primary direction of extension, and the compactness of the distribution. It calculates three key parameters from the coordinate date: the center of the ellipse, the lengths of the major and minor axes, and the rotation angle. By applying the SDE, we can explore the spatiotemporal evolution characteristics of coupling coordination between the DE and HQCTD, revealing central trends, dispersion, and directional tendencies.
CGT is a tool that quantitatively depicts the spatial variation trends of geographic phenomena based on the fundamental attributes of geographic centers, thereby reflecting regional imbalances of the study subject to some extent.

4.3.4. Obstacle Degree Model

To explore the factors constraining the coupling between the DE and HQCTD, we introduced the obstacle degree model, and the calculation formula is as follows:
O ij = ( 1 Y ij ) W j j = 1 n 1 Y ij W j
where W j is the weight of the indicator; Y ij is the standardized data; and n is the number of evaluation indicators. A larger obstacle degree O ij indicates a higher hindering effect on the coordinated development of the system; conversely, a lower obstacle degree suggests a weaker hindering effect.

4.3.5. Optimal Parameter-Based Geographic Detector

The geographic detector model is based on the core principle of spatial hierarchical heterogeneity, enabling the detection of spatial differentiation in the research subject, the screening of core driving factors, and the identification of multi-factor interaction effects. The q statistic is used to measure the explanatory power of a single factor, with q values ranging from 0 to 1. By combining factor detection, interaction detection, and p-value significance tests, the model screens core driving factors and reveals the patterns of multi-factor interactions. Referring to existing research, interactions among factors are classified into five types [37], as shown in Table 3.

4.4. Data Sources

The study focuses on 11 prefecture-level cities in Shanxi Province. Due to the availability of indicator data, the study period covers the ten years from 2014 to 2023. The data primarily comes from the “China Urban Statistical Yearbook”, the “Shanxi Statistical Yearbook”, the “China Urban Construction Statistical Yearbook”, the “China Environmental Yearbook”, municipal statistical yearbooks, municipal government work reports, and municipal statistical announcements on national economic and social development. Data for digital inclusive finance indicators were sourced from the “Peking University Inclusive Finance Index”, compiled jointly by the Peking University Inclusive Finance Research Center and Ant Financial. Missing data were supplemented using linear interpolation methods [38].

4.5. Data Robustness Test

To address the potential impact of missing data interpolation on the robustness of the research results, this study not only employed the linear interpolation method to supplement partial missing data, but also further adopted the multiple imputation method to conduct robustness tests. The comparison results show that the temporal evolution trends of the coupling coordination degree obtained using the two interpolation methods are generally consistent, and the research conclusions remain largely unchanged, which indicates that the missing data interpolation processing adopted in this study demonstrates good reliability and robustness.

5. Empirical Analysis

5.1. Analysis of Development Levels

5.1.1. Level of DE Development

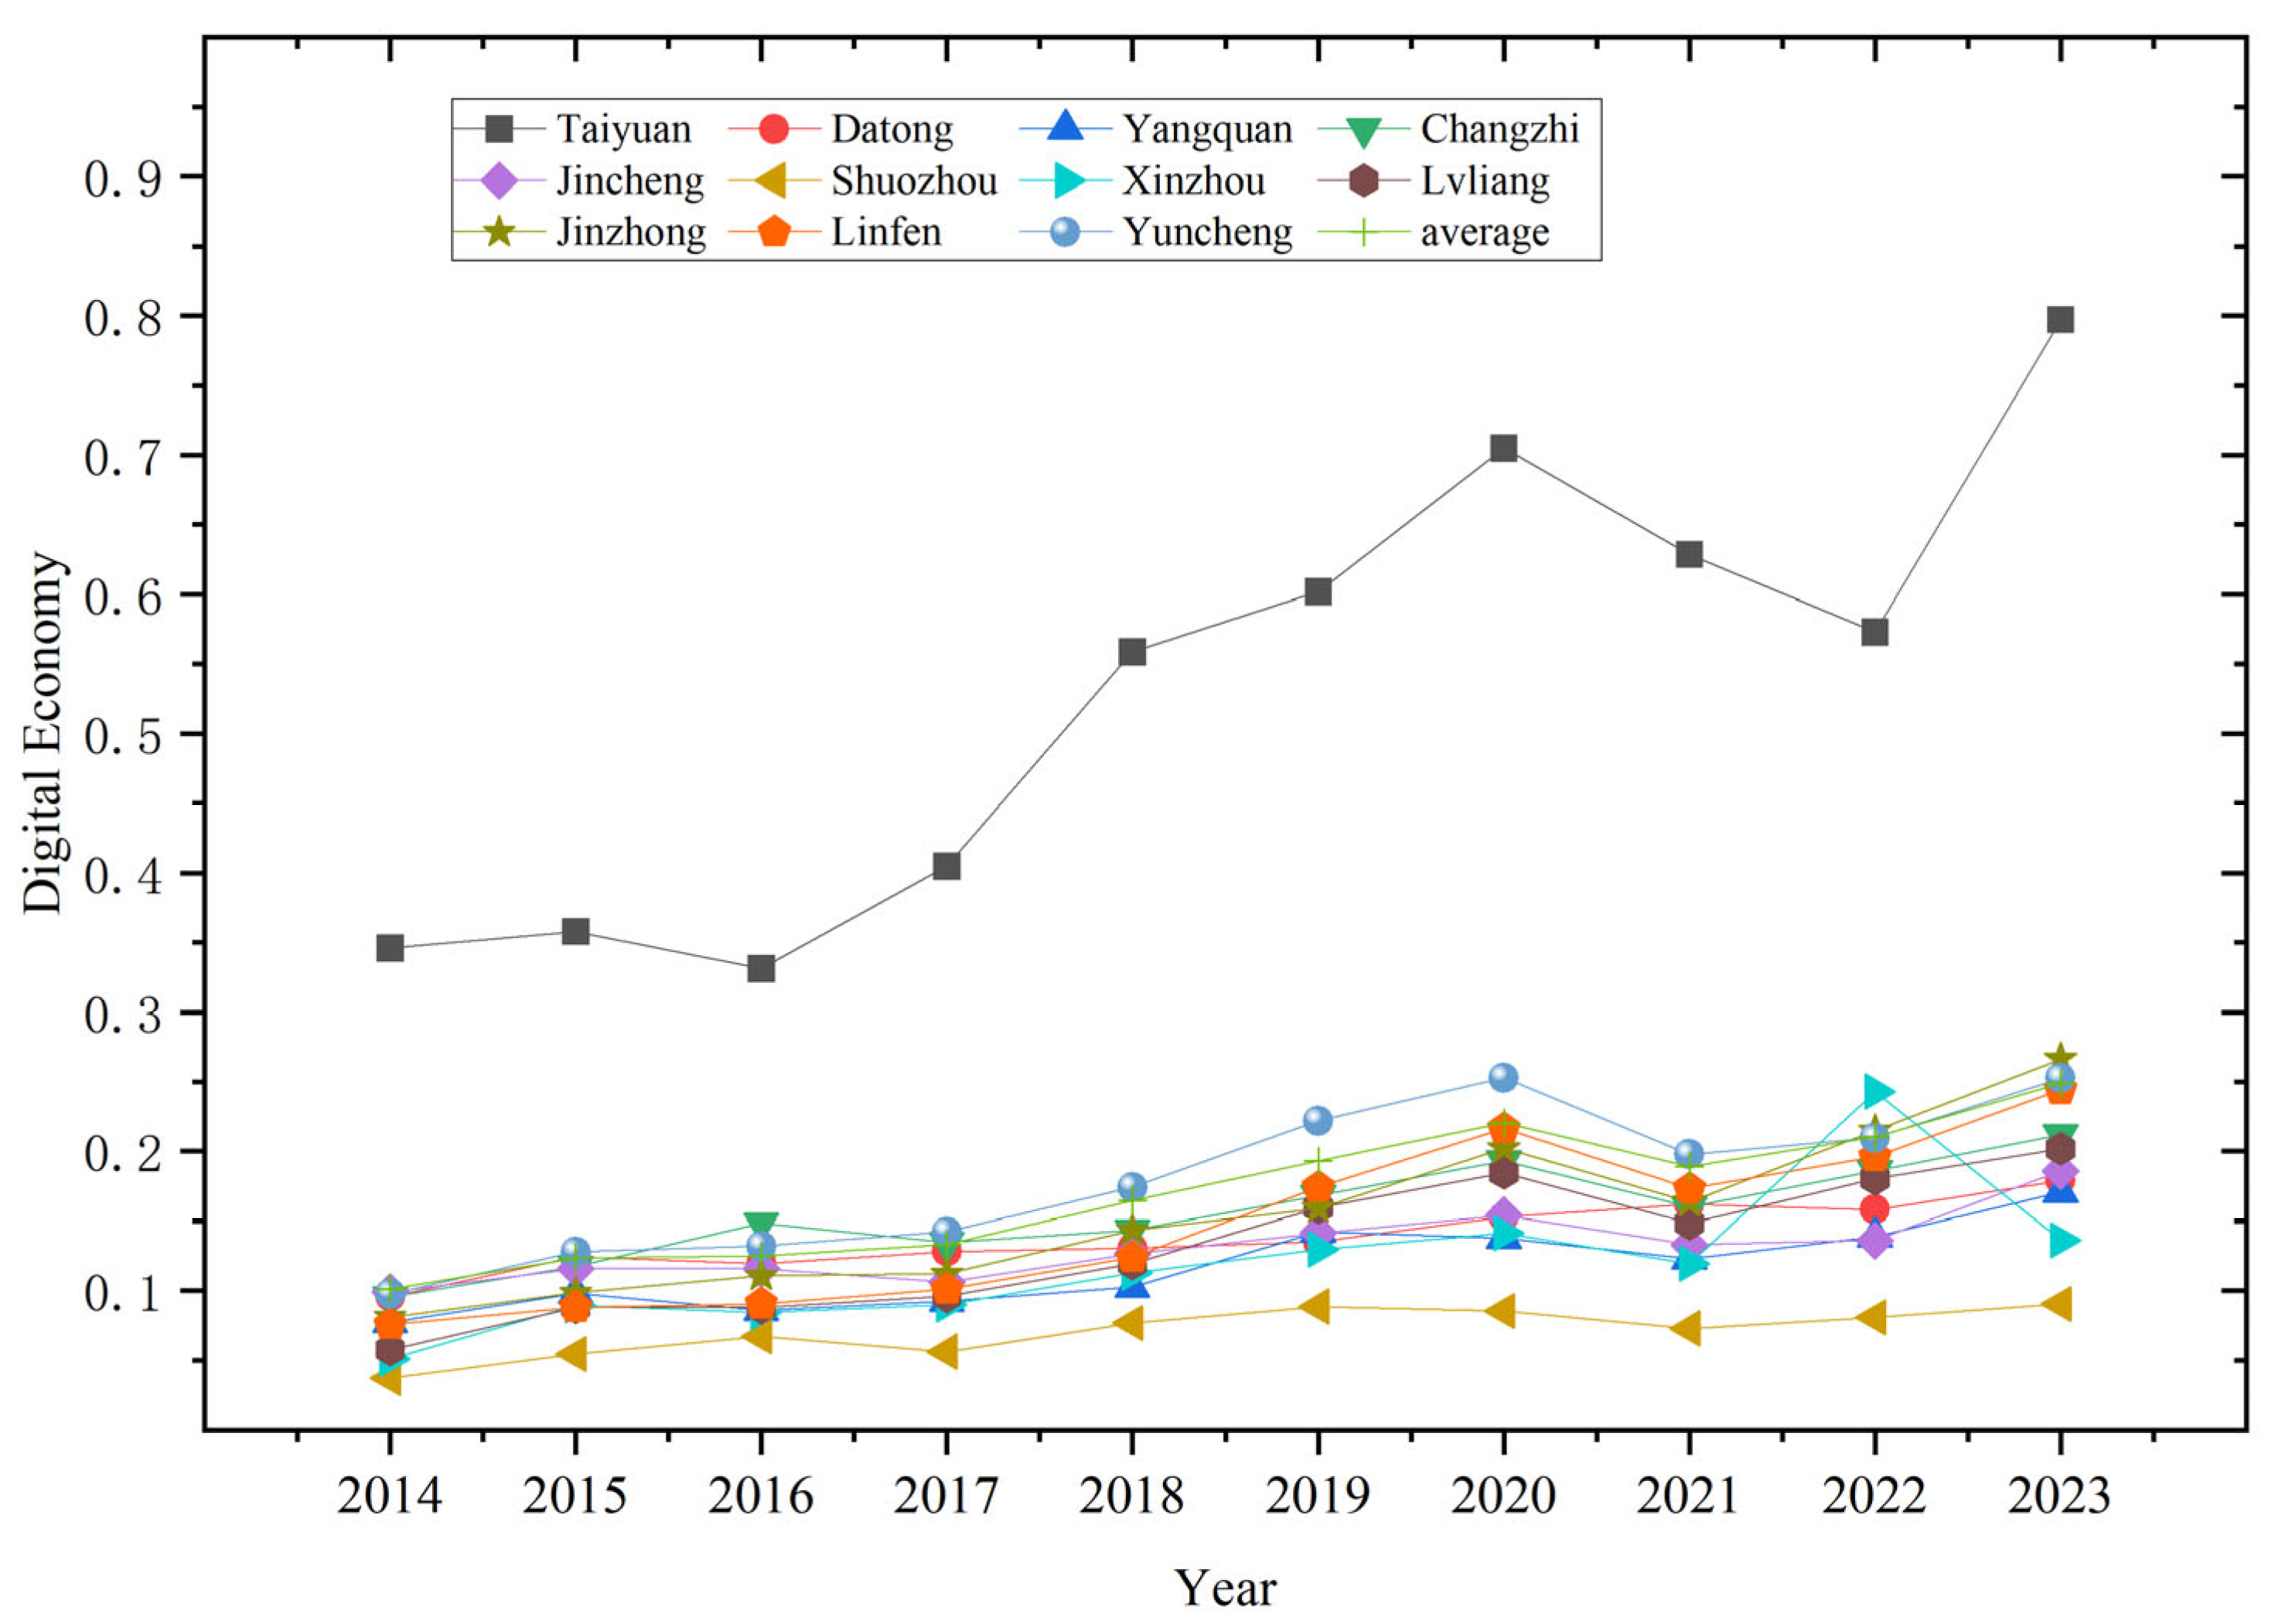
From 2014 to 2023, the DE in Shanxi maintained a relatively stable development trend and generally exhibited continuous growth, except for the period from 2020 to 2022 (Figure 3). The regional average value increased from 0.1013 in 2014 to 0.2488 in 2023, with the most rapid growth occurring in 2018. A possible explanation is that Shanxi launched and implemented its big data strategy in March 2017 and subsequently introduced the “Several Policies for Promoting Big Data Development and Application in Shanxi Province”. Supportive measures have been introduced in areas such as data openness and sharing, big data utilization, and incentives for scientific and technological innovation. Negative growth was observed from 2020 to 2022; this period coincided with the global COVID-19 pandemic, which led to declines in revenues from electronic manufacturing and software exports, as well as decreases in the digitalization indicators of industries such as tourism, transportation, and offline exhibitions [39].
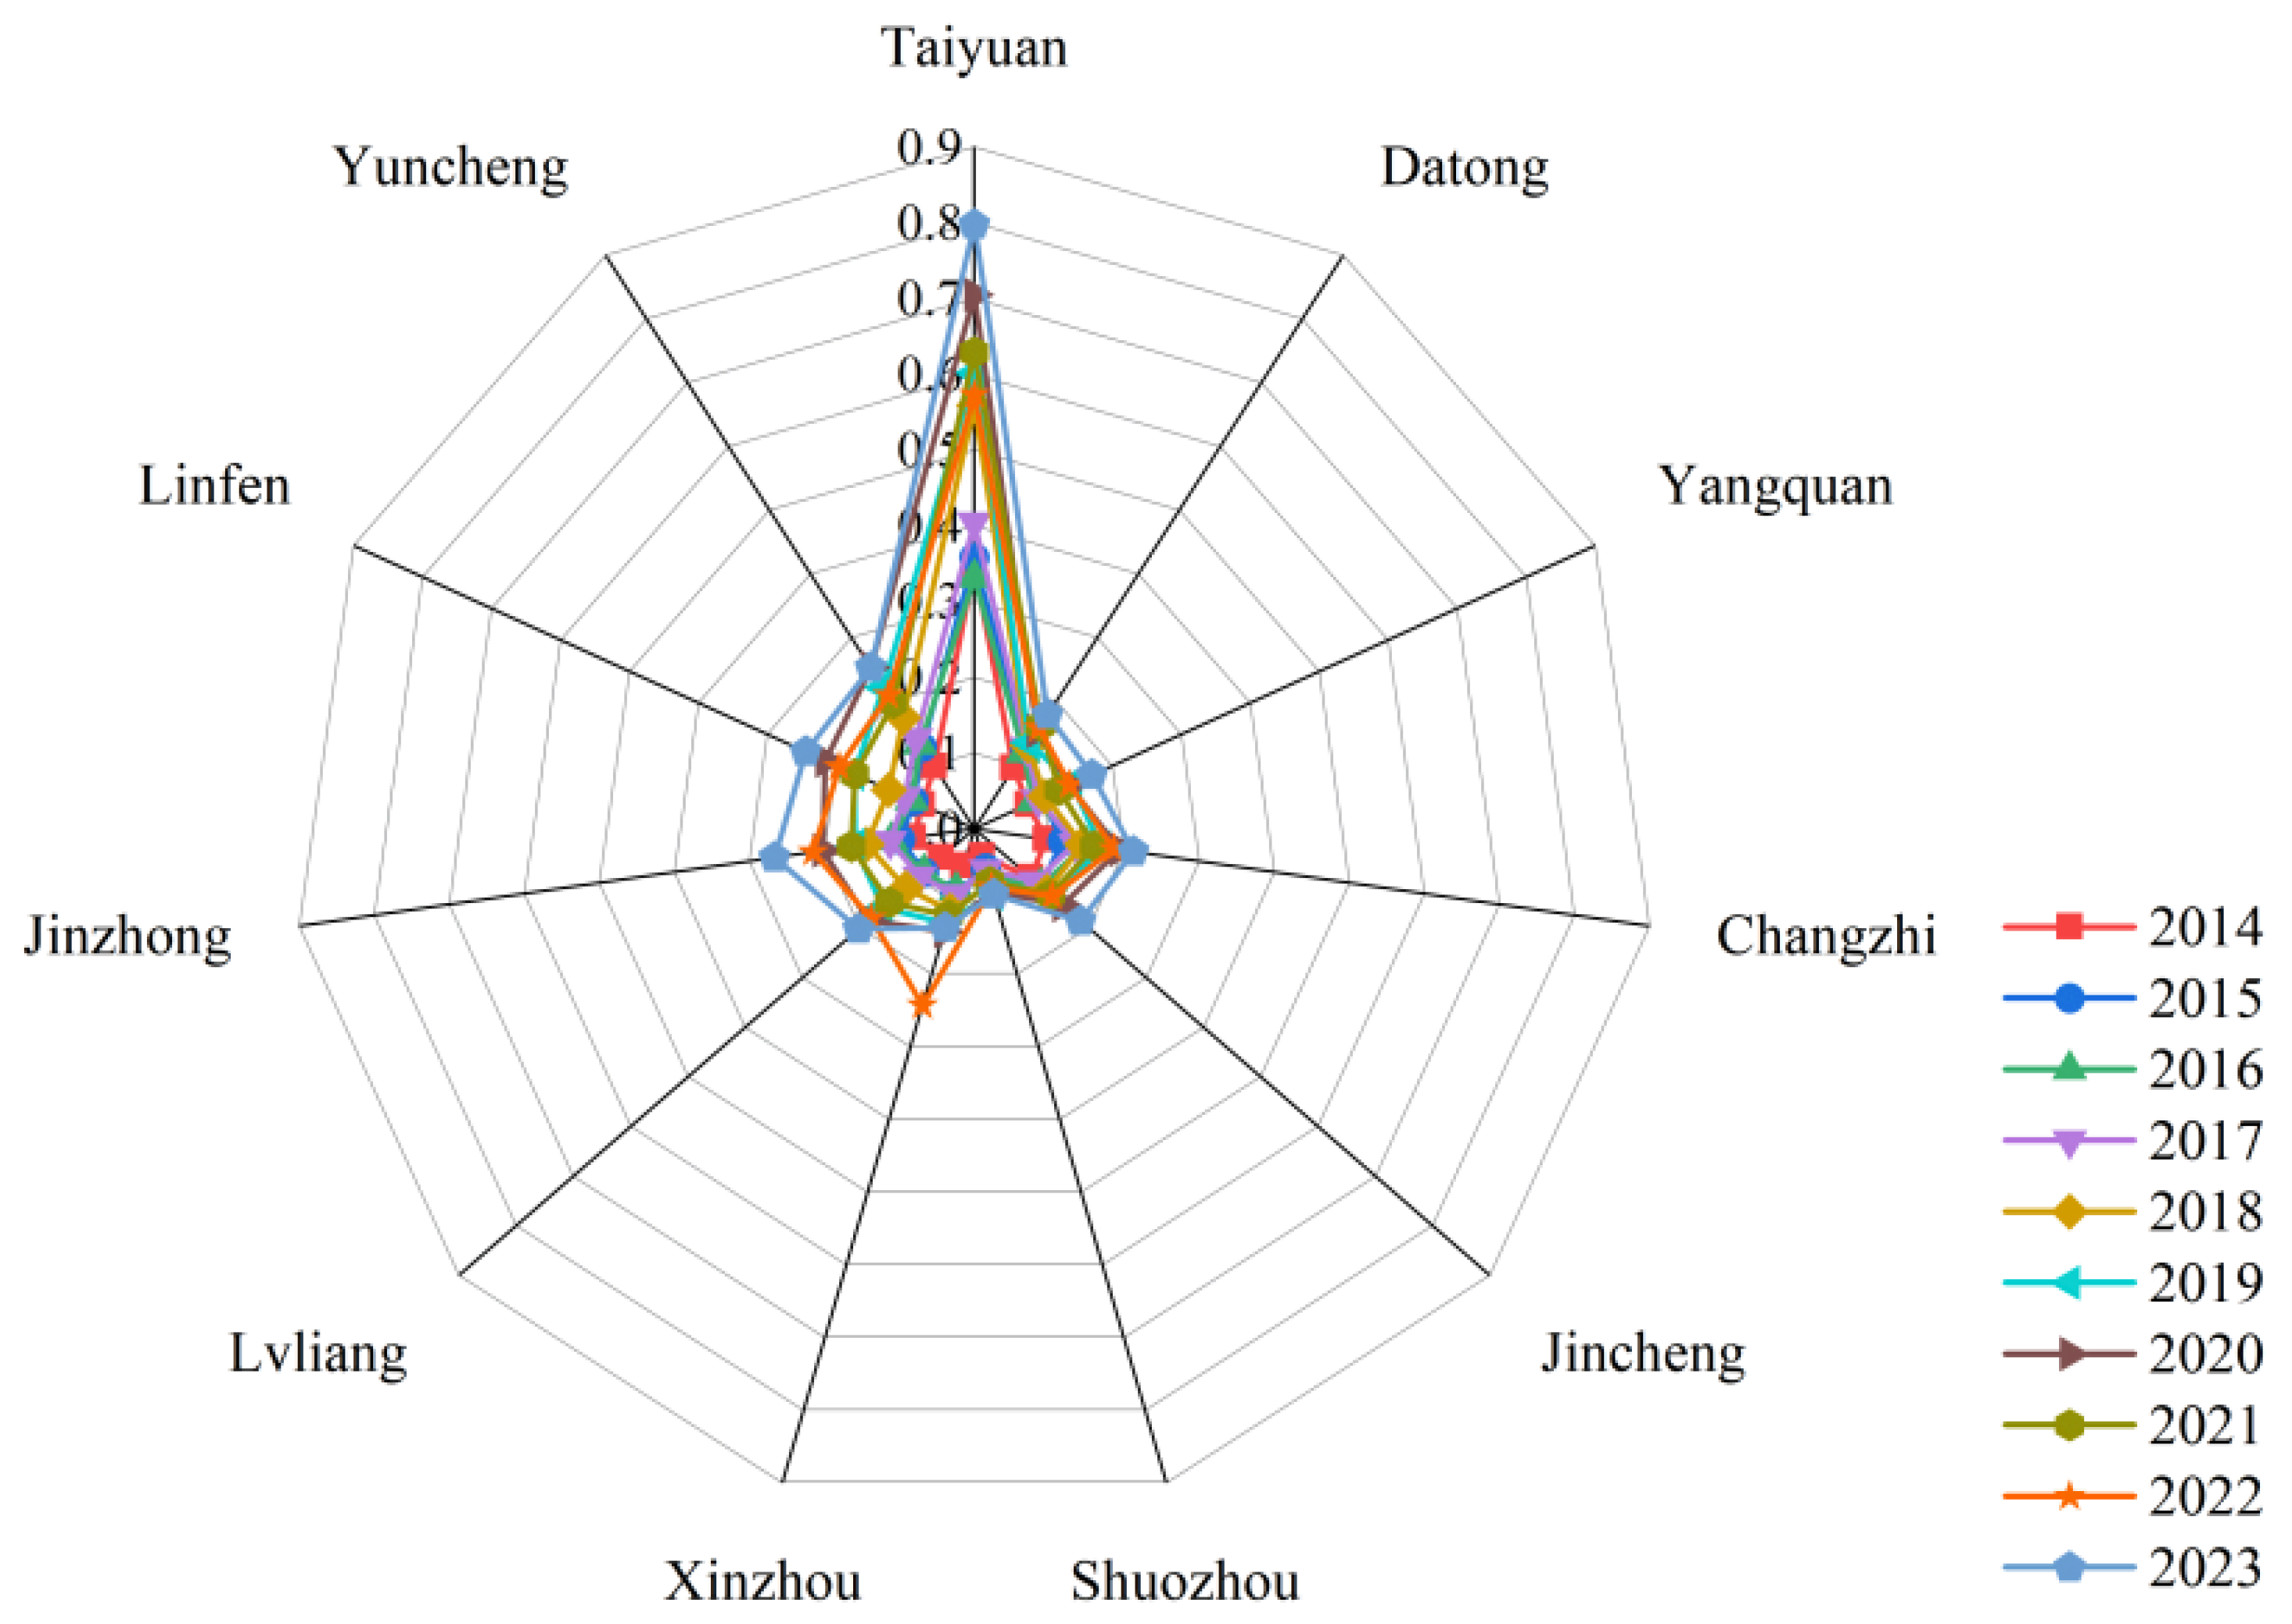
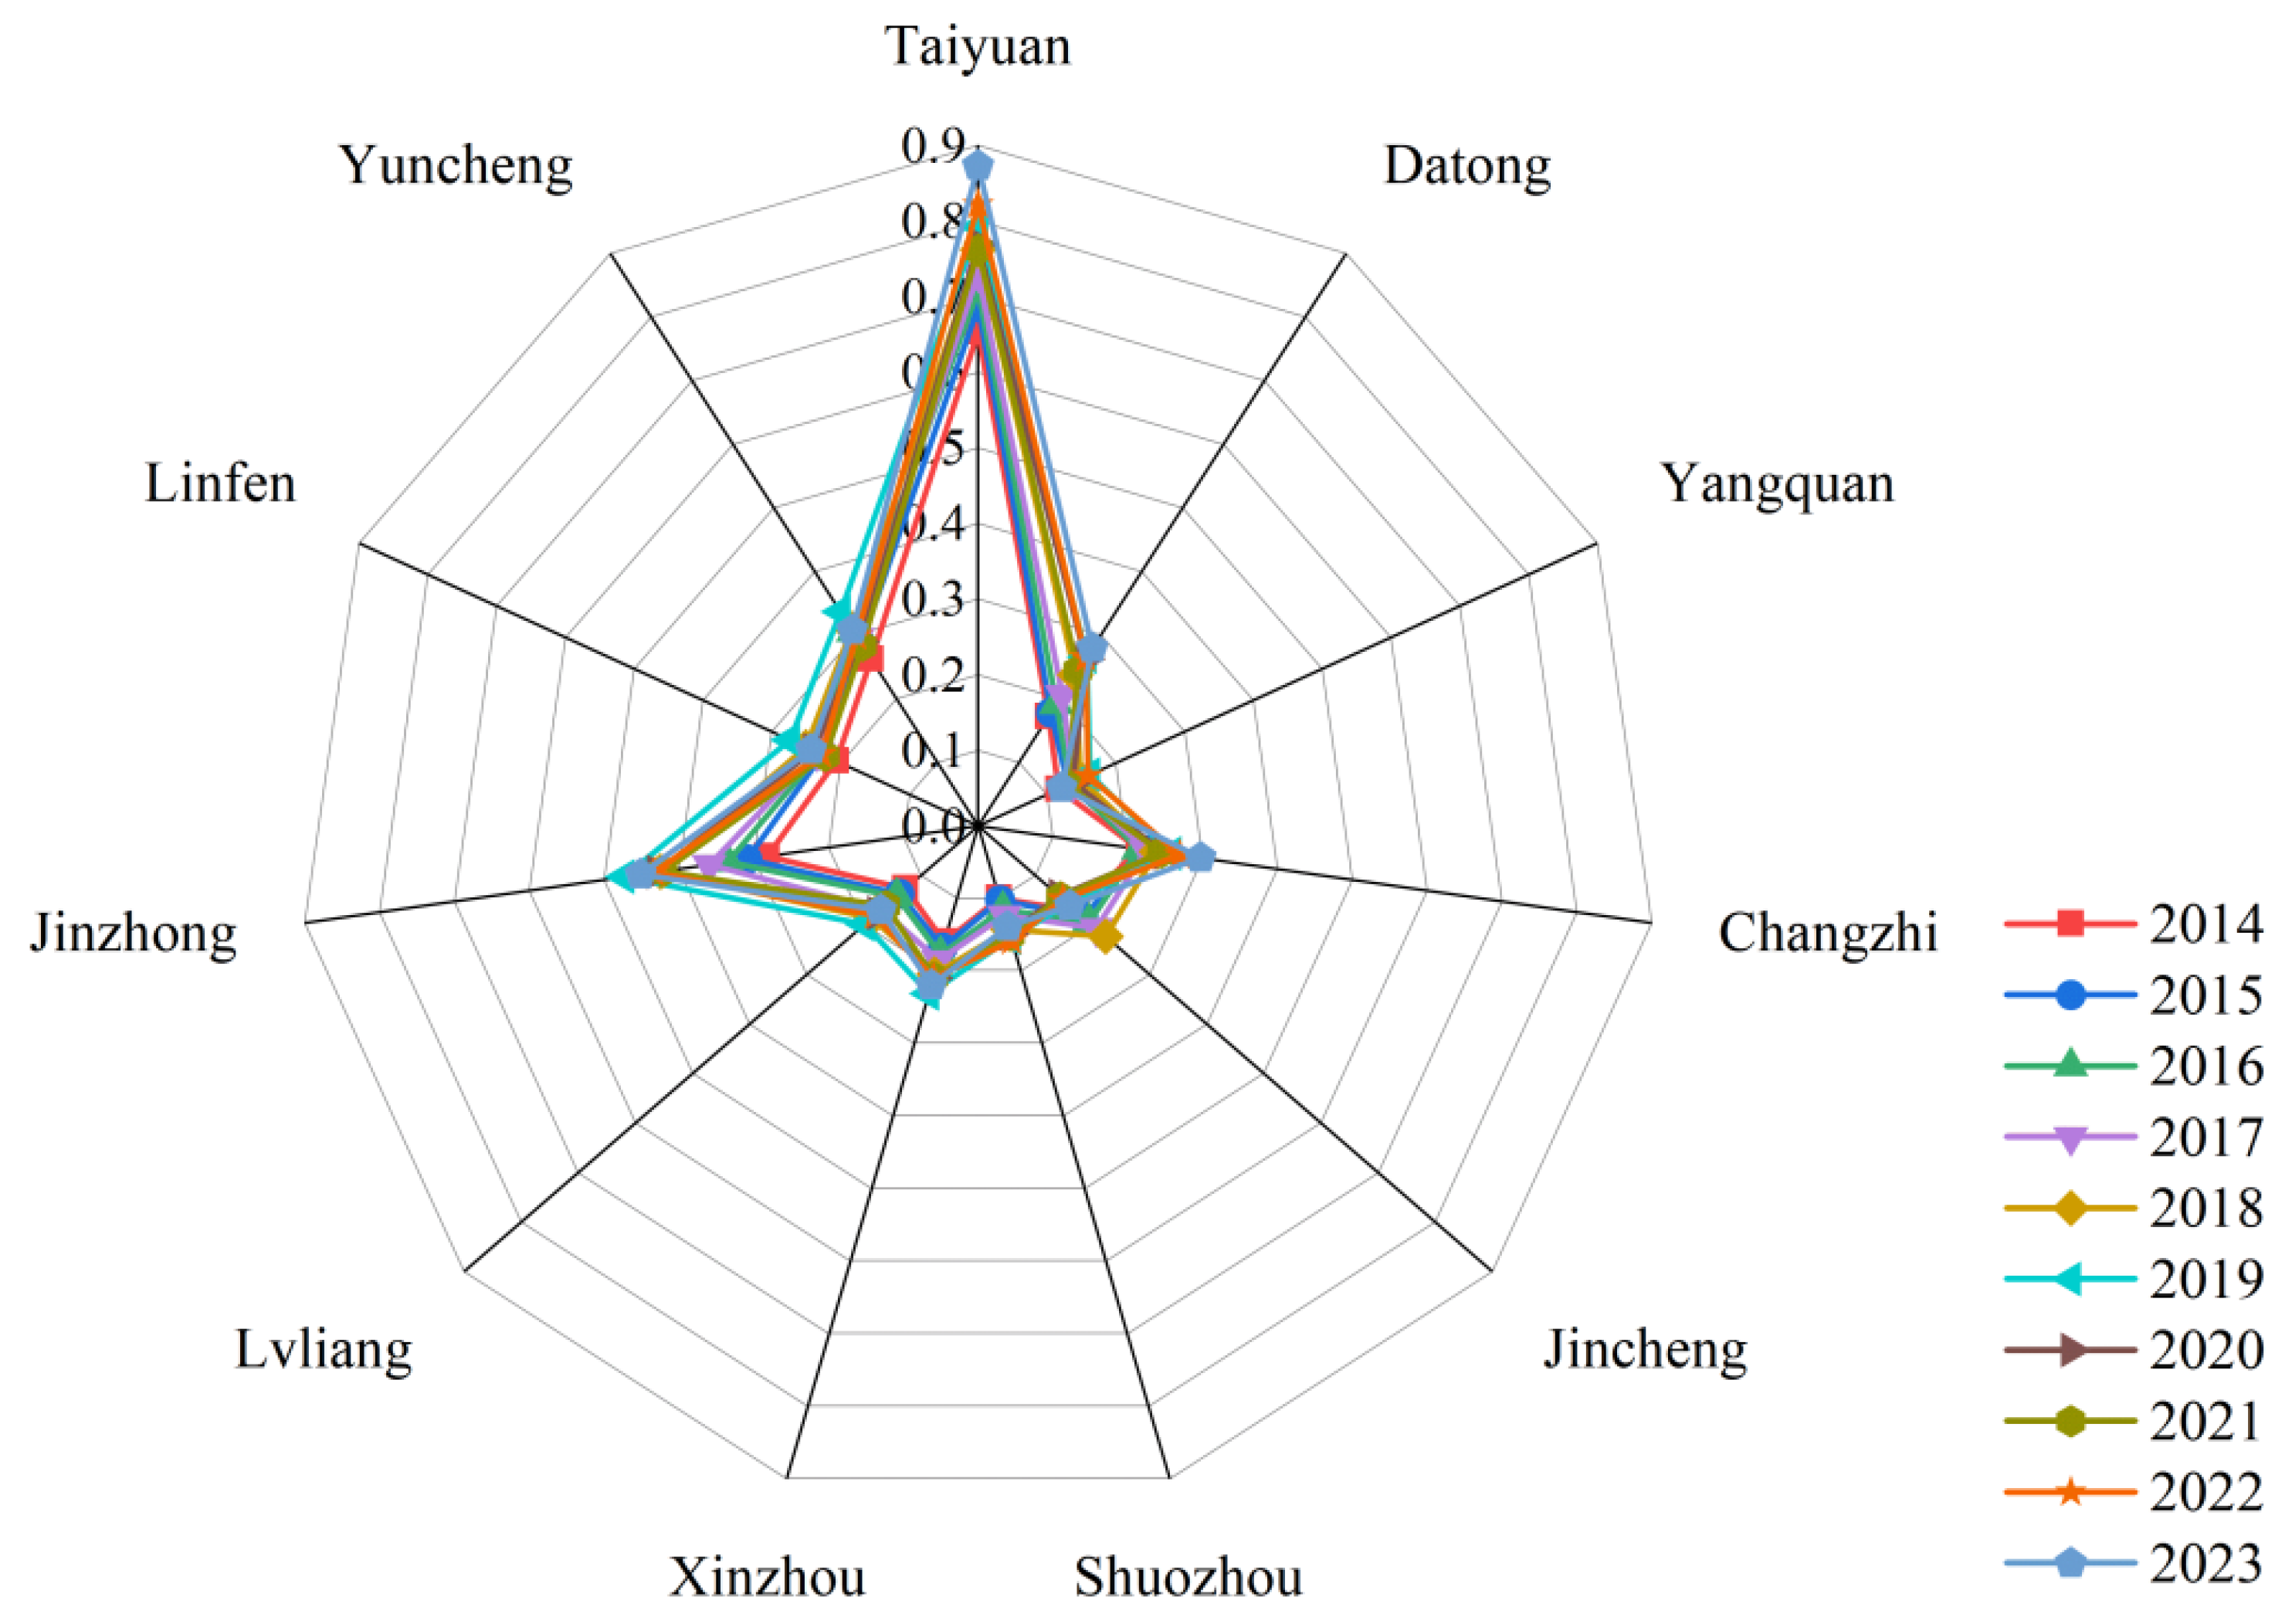
There are notable disparities in the level of DE development among the 11 prefecture-level cities in Shanxi (Figure 4). As the provincial capital, Taiyuan exhibits a substantially higher level of DE development than other cities, primarily because it has long possessed more advanced digital infrastructure and received stronger policy support [40]. Since the implementation of the digital development strategy, Taiyuan has actively aligned with the policy directives of the central and provincial governments. In 2021, it established the Taiyuan Digital Economy Industry Association and subsequently promulgated the Implementation Opinions on Accelerating the Development of the DE in Taiyuan, which significantly accelerated the city’s digital transformation and generated significant effects. Shuozhou ranked last, with an average value of only 0.071 during the period from 2014 to 2023. First, because Shuozhou has long relied on the coal industry, its industrial transformation process has primarily focused on upgrading traditional industries while relatively neglecting investment in and support for the digital technology industry. Second, large-scale digital infrastructure development in Shuozhou was not vigorously promoted until 2023, resulting in a significant temporal lag compared with other cities in Shanxi.

5.1.2. Level of HQCTD

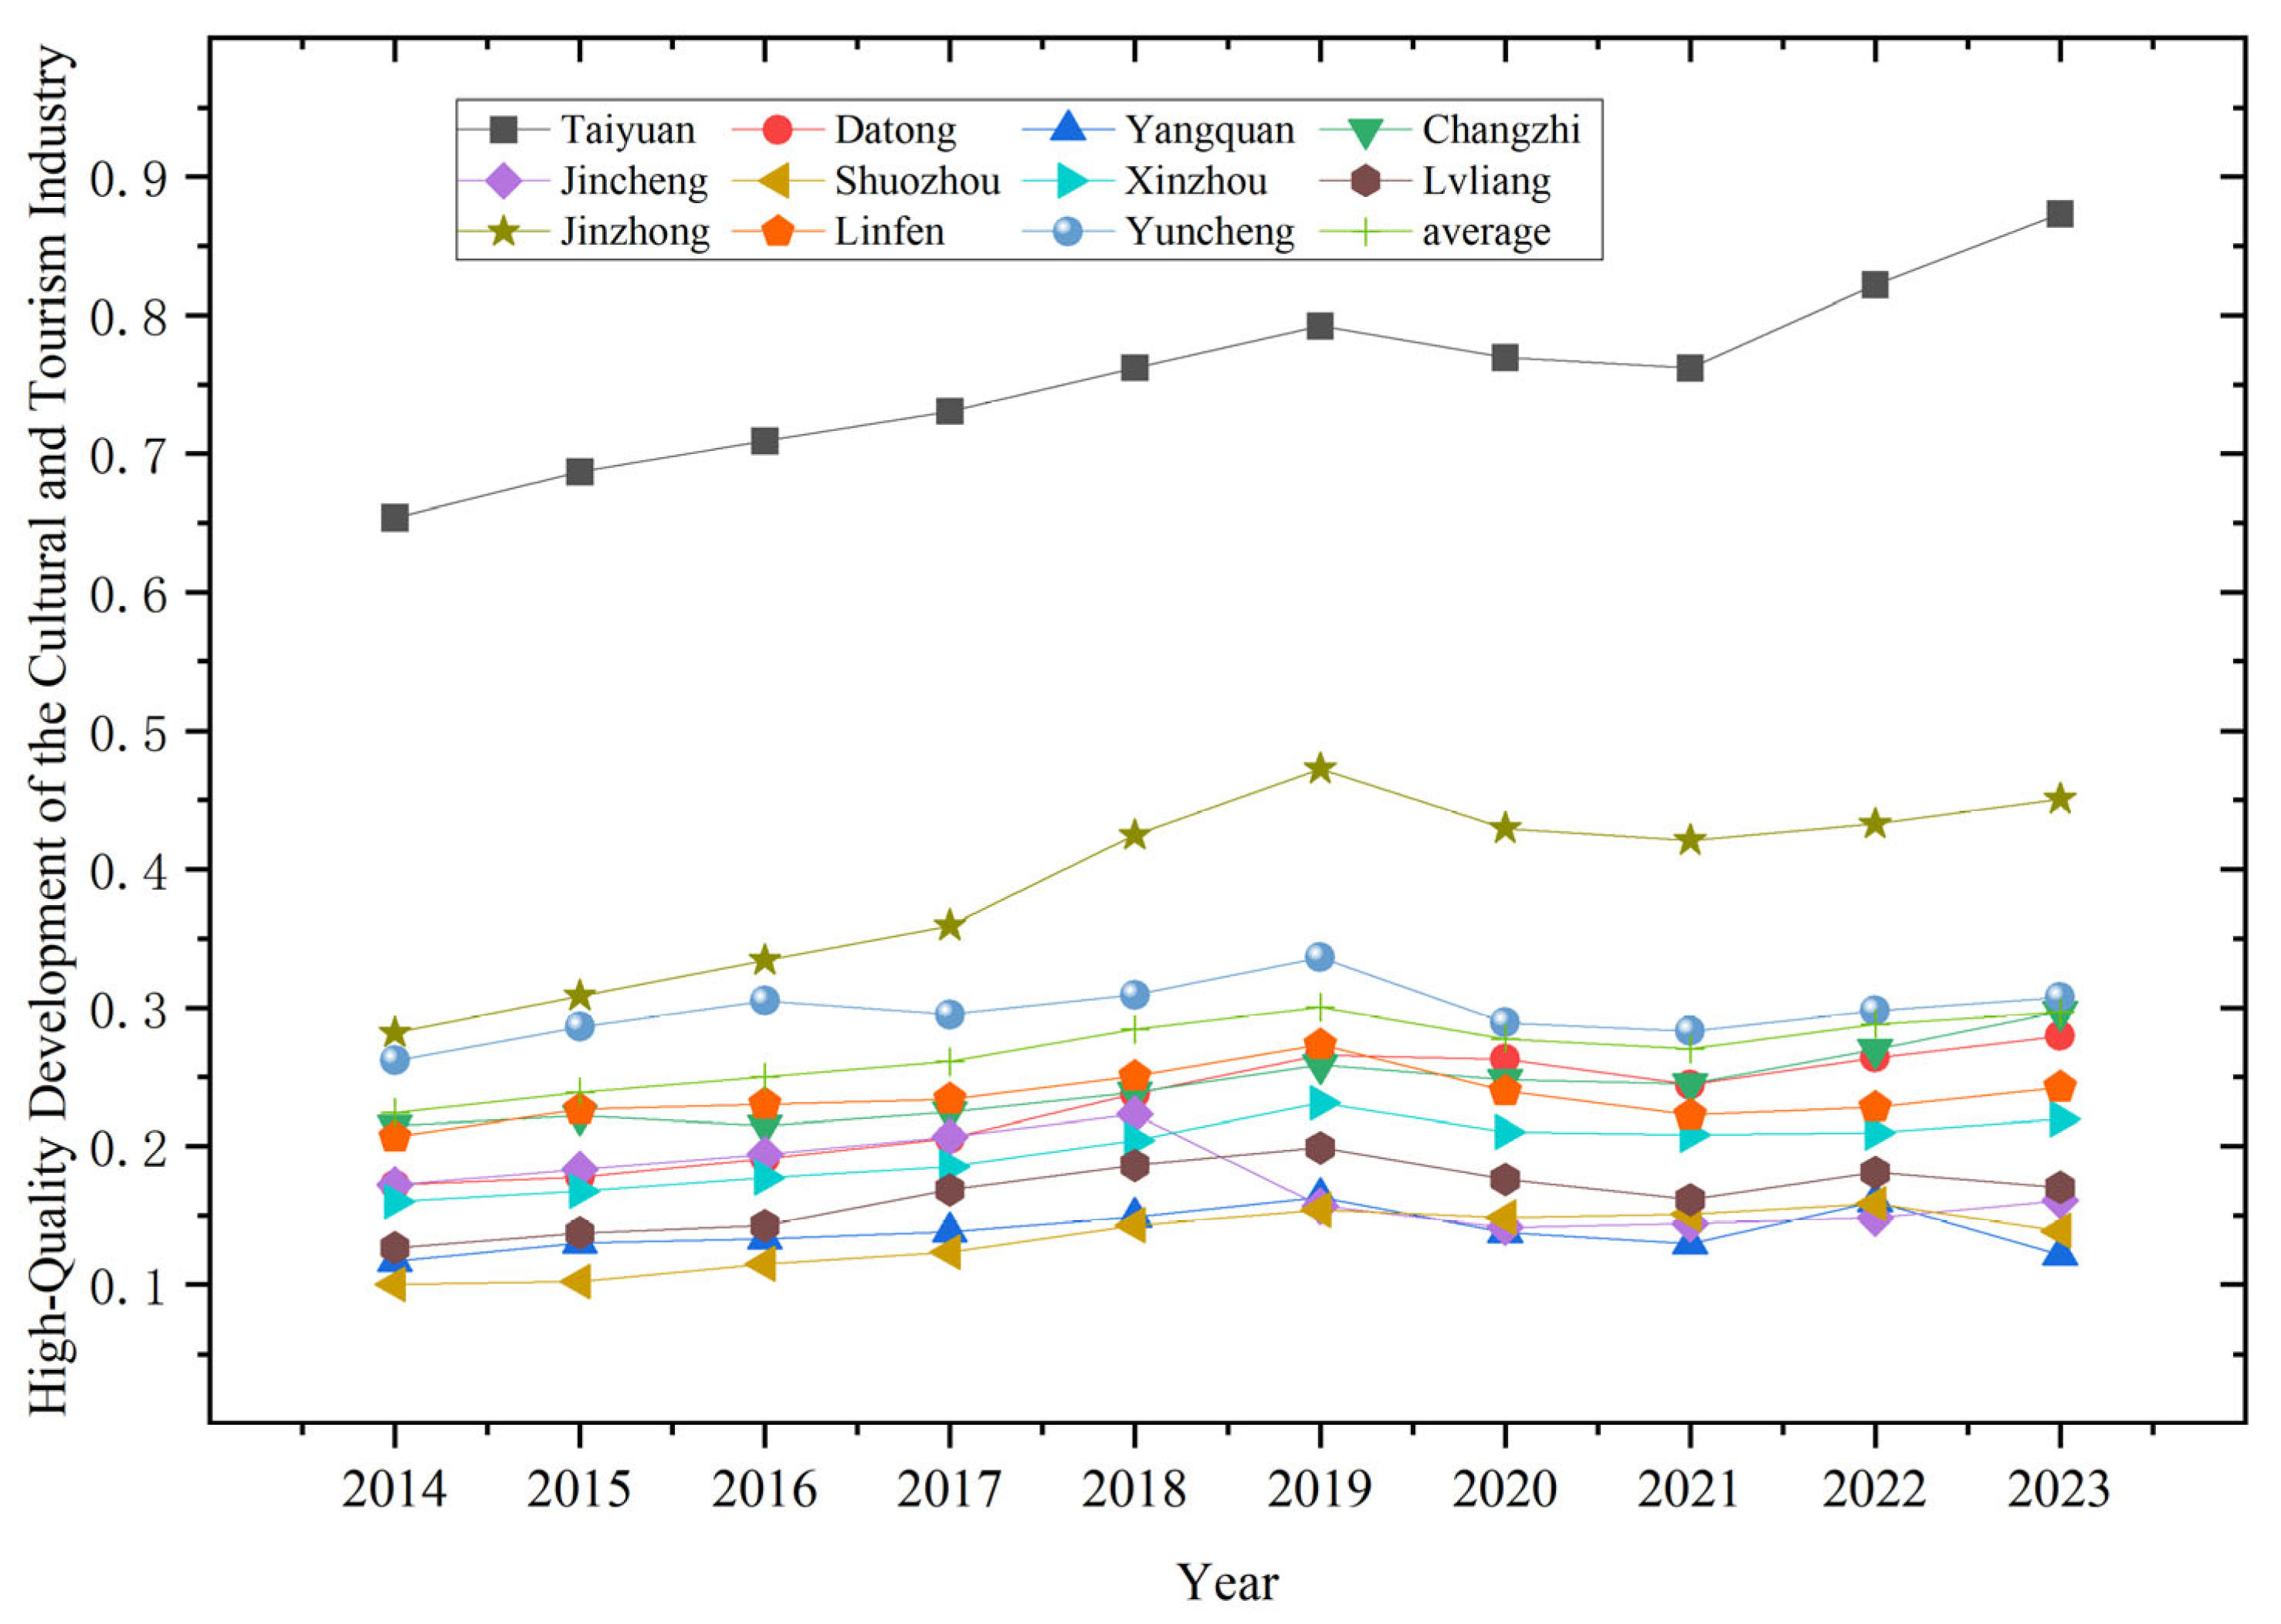
From 2014 to 2019, HQCTD steadily increased in all cities except Jincheng (Figure 5). In 2010, Shanxi initiated its industrial transformation and actively explored pathways for the transformation of its resource-based economy. During the process of reducing dependence on the coal industry, a consensus gradually emerged that “a consensus gradually emerged that promoting the development of culture tourism should be regarded as a key pathway for industrial transformation.” This understanding has continuously promoted the deep integration of culture tourism, thereby achieving the goal of using culture to shape tourism and using tourism to highlight culture. In 2020, HQCTD experienced a slight decline. Owing to the global COVID-19 pandemic and the complex domestic and international environment, many regions successively implemented restrictions on cross-regional mobility, which significantly affected the tourism industry, characterized by its strong interregional mobility, and consequently led to a contraction of the tourism market [41]. After 2021, HQCTD gradually recovered. To mitigate the impact of COVID-19 on the culture tourism industries, the government of Shanxi introduced a series of pro-consumption policies aimed at benefiting the public, thereby stimulating cultural tourism consumption and promoting the rapid recovery of the provincial cultural tourism market.
There are significant disparities in the level of HQCTD among the 11 prefecture-level cities in Shanxi (Figure 6). Among all the cities, Taiyuan, the provincial capital, exhibits the highest level of HQCTD. Although it does not possess abundant high-grade tourism resources, it serves as an important tourist transit hub, attracting a large number of tourists from other provinces and regions, thereby promoting the development of its culture tourism industries. Jinzhong ranks second, primarily due to its proximity to the provincial capital, Taiyuan, which provides significant spatial spillover advantages. In addition, the city is endowed with high-quality tourism resources, including renowned attractions such as Pingyao Ancient City and the Qiao Family Compound, which further promote the high-quality development of its cultural tourism industry. Yuncheng ranks closely behind, situated within the Jin-Shan-Yu Yellow River Golden Triangle region, the city benefits from significant advantages in regional connectivity and interprovincial linkages. As one of the important cradles of Chinese civilization, Yuncheng possesses distinctive cultural resources and symbolic cultural IPs, particularly Guan Culture and Salt Culture, which provide strong support for the development of its cultural tourism industry. Furthermore, in recent years, the local government has attached increasing importance to the integrated development of culture tourism, implementing a series of supportive policies and development initiatives that have substantially enhanced the city’s cultural tourism performance, placing it among the leading cities in the province.

5.2. Coupling Coordination Analysis

Based on the CCD model, the CCD between the two systems was calculated. To further examine its spatiotemporal evolution characteristics, four representative years—2014, 2017, 2020, and 2023—were selected at equal intervals for comparative analysis [39].

5.2.1. Characteristics of Changes in Coupling Coordination over Time

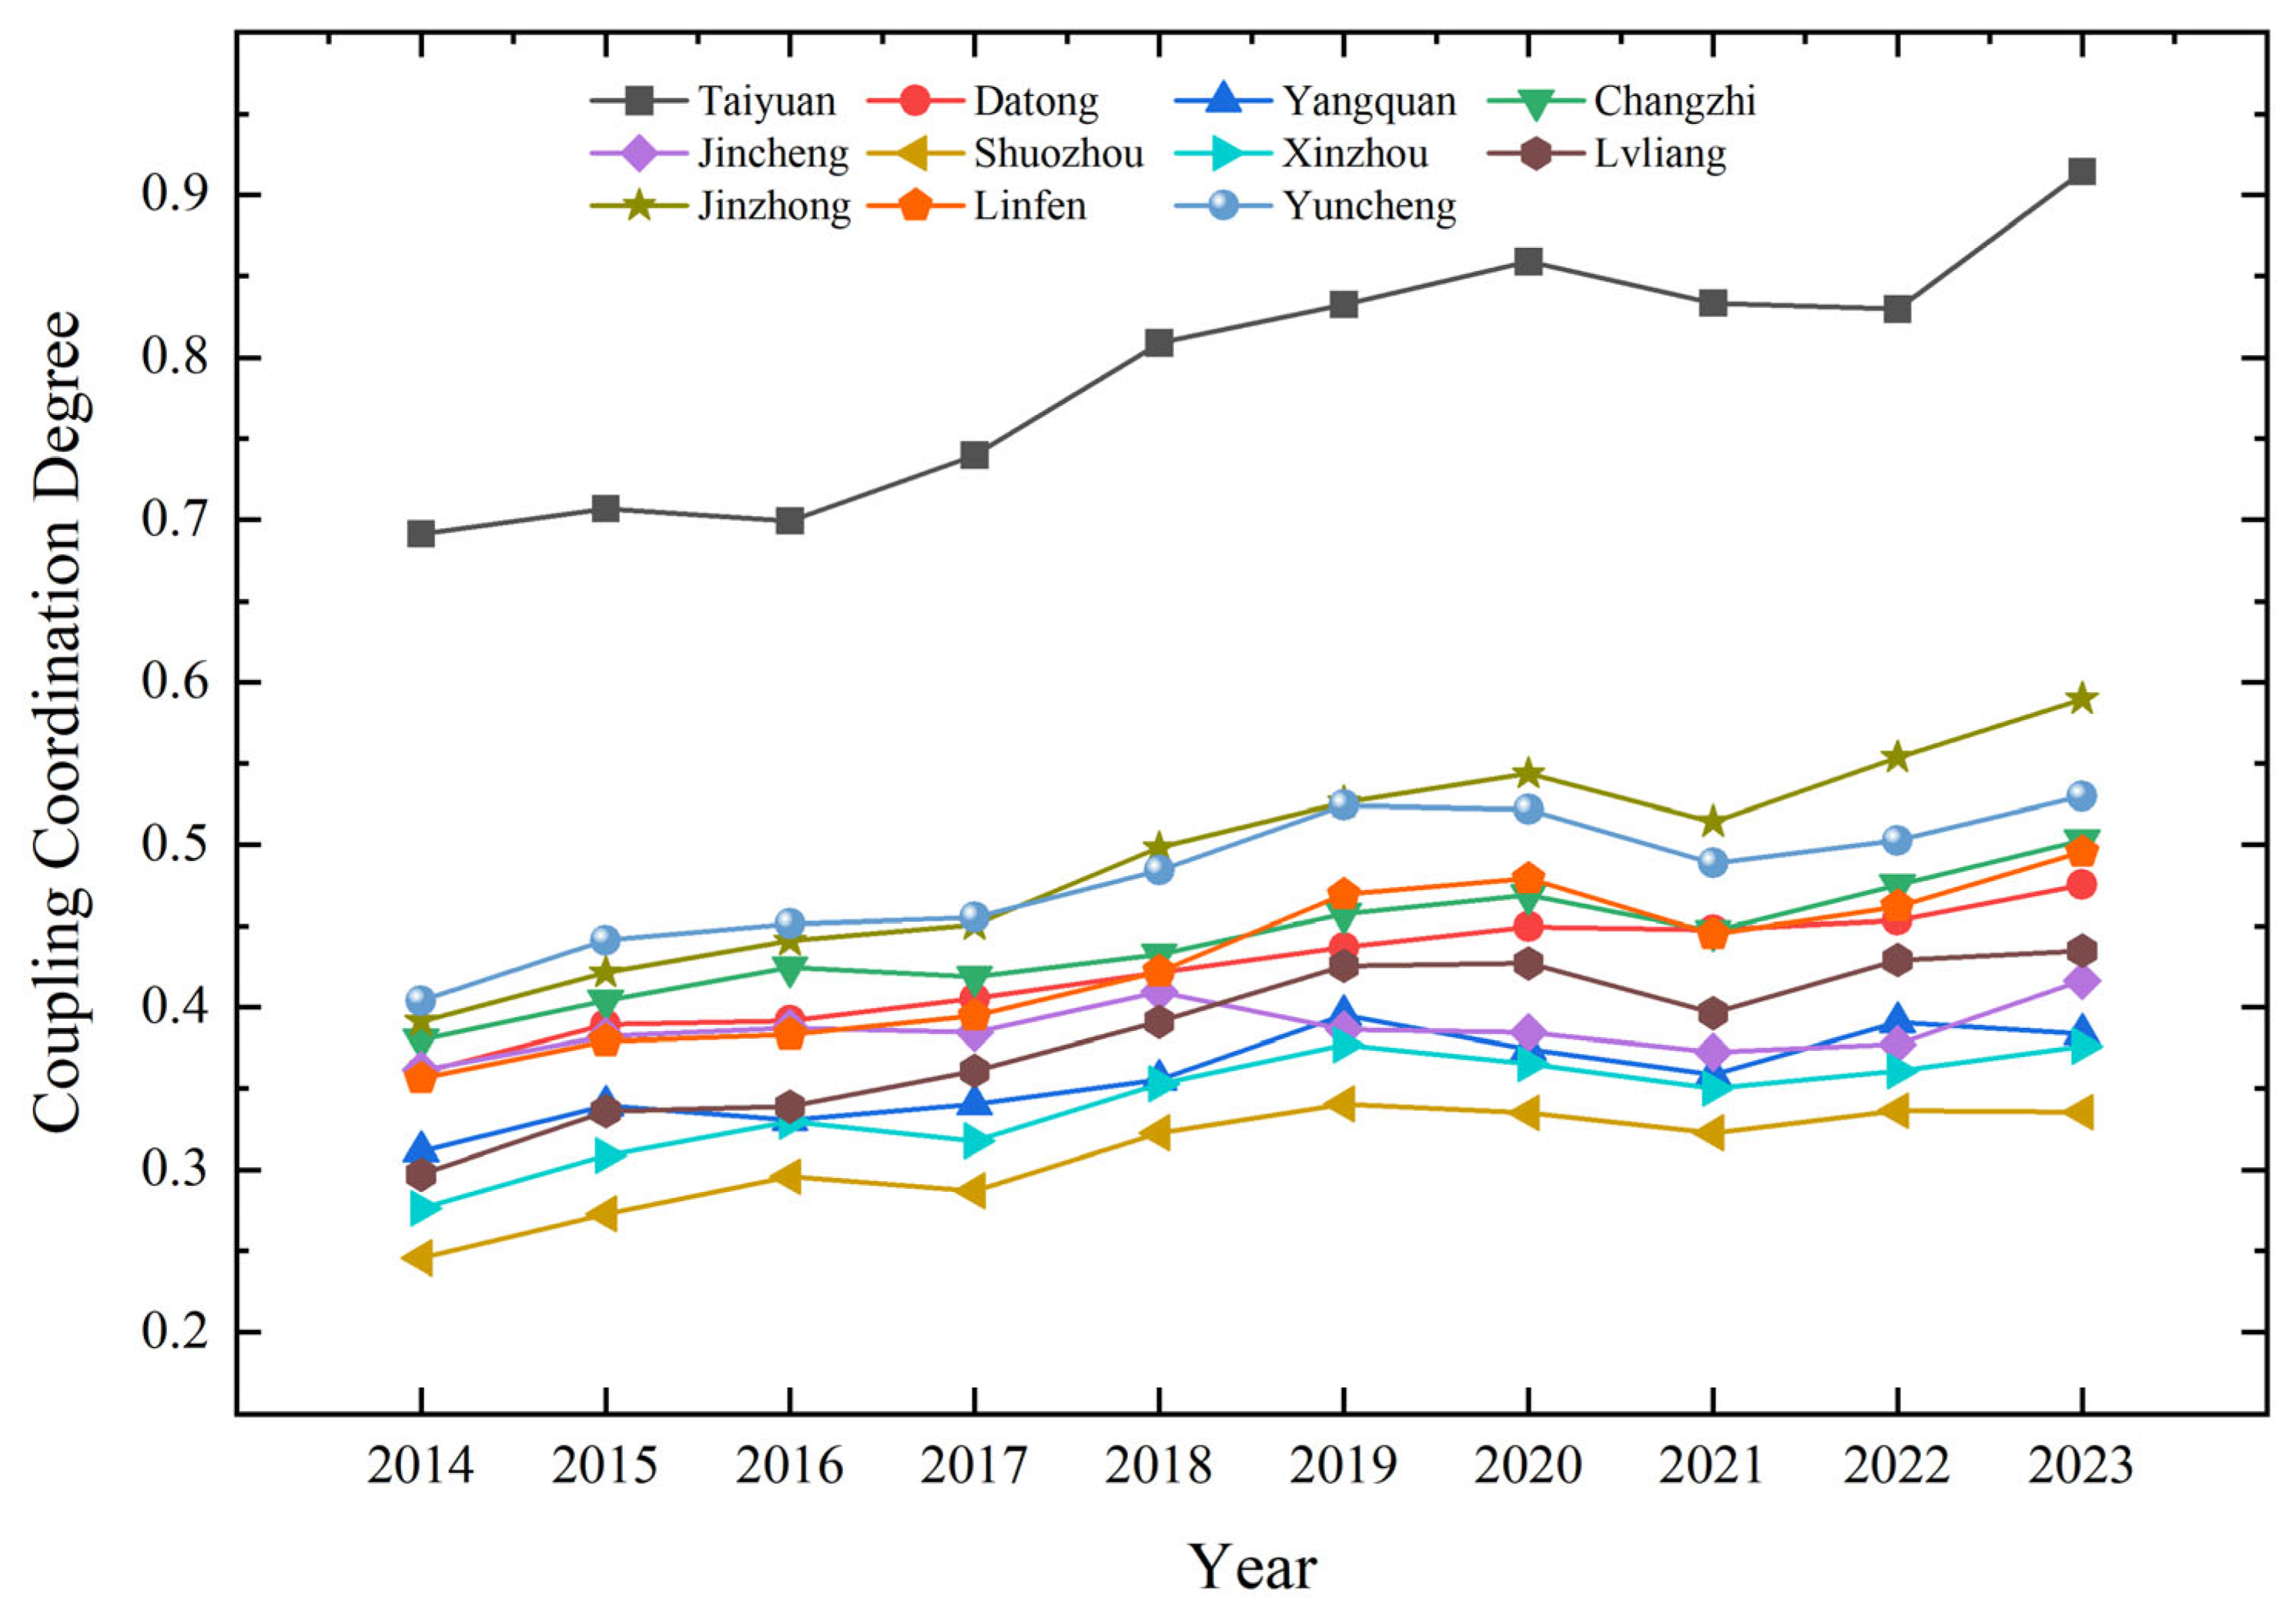
The CCD between the DE and HQCTD in Shanxi Province has shown a fluctuating upward trend (Figure 7). The coupling coordination relationship has shifted from the “dysregulation Stage” to the “transitional stage”, and the coupling coordination situation is positive. Based on the coupling coordination trends between the DE and HQCTD across the 11 prefecture-level cities in Shanxi Province, the ten-year study period was divided into four distinct stages. (a) From 2014 to 2016, the system was in a stage of mild dysregulation, during which the CCD of most cities exhibited a relatively slow upward trend. Following the launch of the national big data strategy at the end of 2015, the DE in Shanxi Province was still in its initial stage of development. Meanwhile, the transformation and upgrading of the cultural tourism industry progressed relatively slowly through a process of continuous exploration and adjustment. Although the two systems gradually began to interact and integrate, the coupling coordination effect remained relatively weak and failed to achieve satisfactory outcomes. (b) From 2017 to 2019, the system gradually evolved from a disordered stage toward a transitional stage. During this period, the growth rate of the CCD in the vast majority of cities was significantly higher than that observed in the previous stage. In 2017, the concept of the DE was officially incorporated into the Government Work Report for the first time, after which local governments across China successively introduced a series of policies and measures to promote the development of the DE. In 2018, the integration of the cultural and tourism administrative departments marked the realization of deep institutional integration between culture tourism, and local governments began to prioritize industrial digitalization and digital industrialization. (c) From 2020 to 2022, both systems were negatively impacted by COVID-19 the pandemic. As a result, the CCD between the DE and HQCTD across the 11 prefecture-level cities in Shanxi Province exhibited an overall downward trend. To mitigate the impacts of the COVID-19 pandemic, many scenic spots and cultural tourism destinations launched a variety of online activities and digital tourism products as substitutes for traditional offline cultural tourism experiences, resulting in a certain improvement in the CCD in 2021. (d) In 2023, the majority of cities were in the stages of borderline and barely in a stage of coordination, both factors showing rapid growth compared with the previous stage.

5.2.2. Spatial Characteristics of Coupling Coordination Relationships

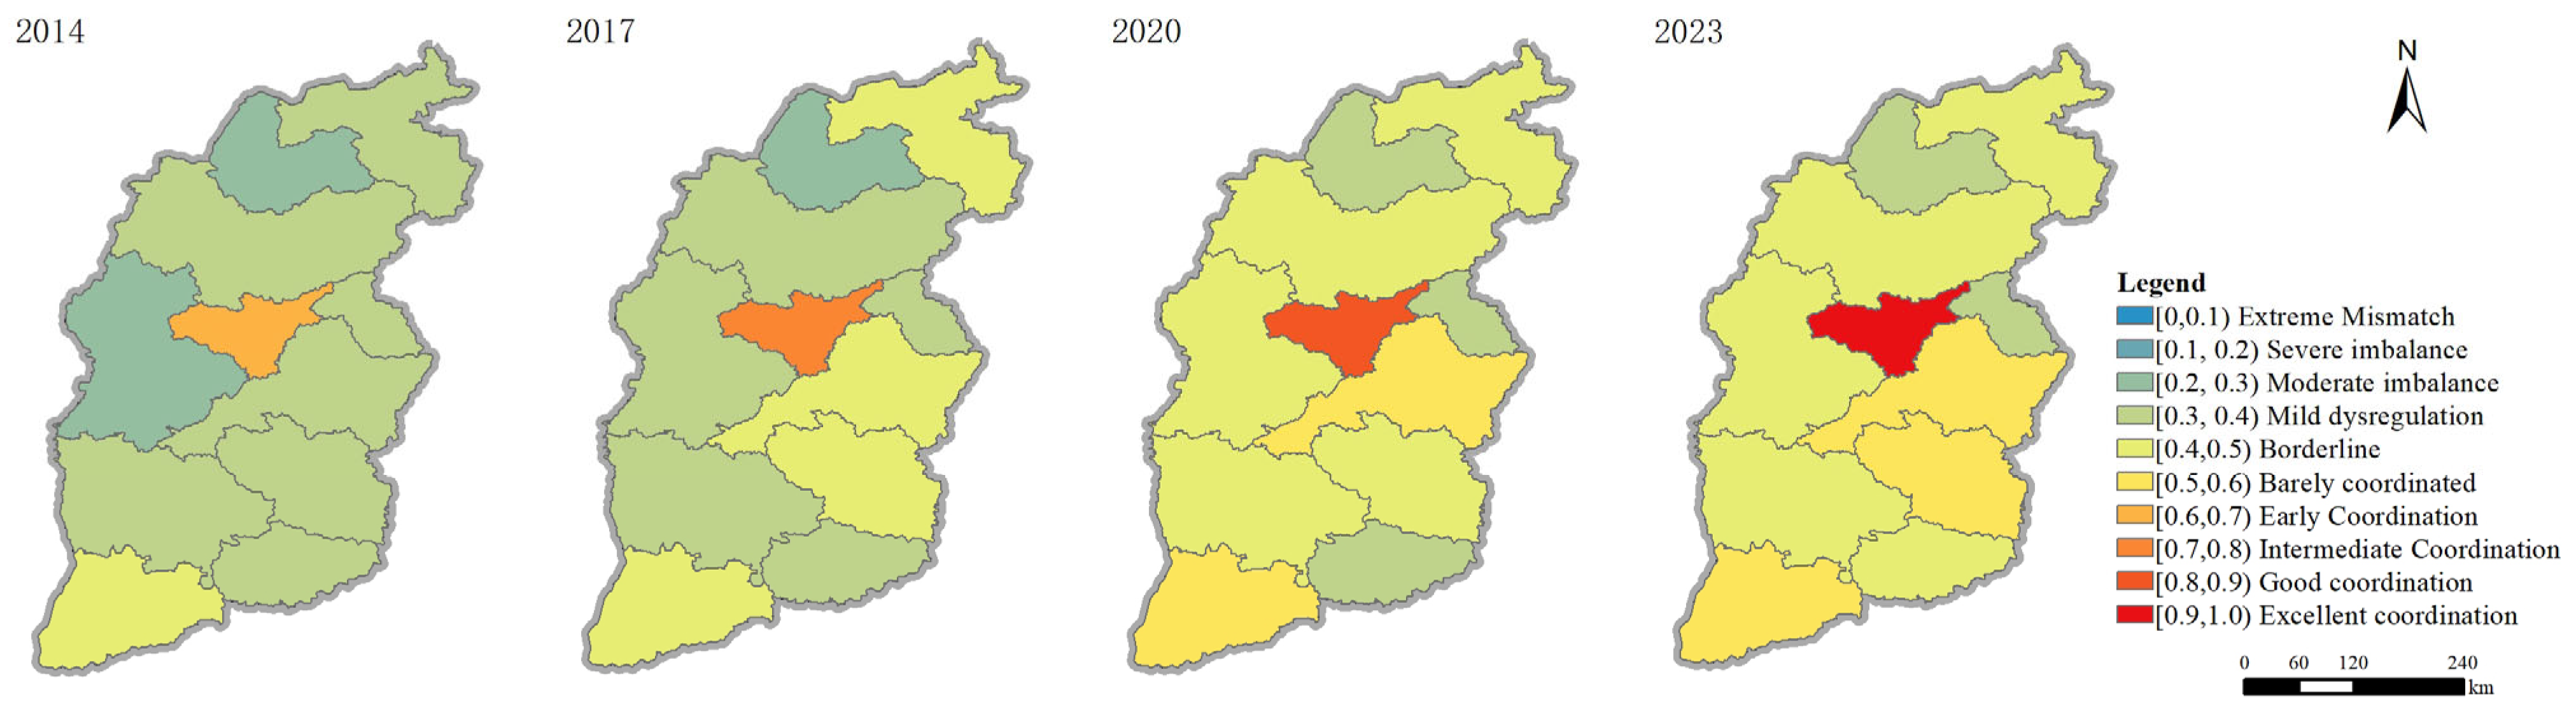
To further explore the spatiotemporal distribution characteristics of the DE and HQCTD, ArcGIS10.8 was used to map the spatial distribution of the coupling coordination between the two systems (Figure 8). (a) In 2014, the level of CCD between the two systems was relatively low. Overall, it exhibited a spatial pattern characterized by “a single core center”. Most cities were in moderate imbalance or mild dysregulation stages, with only Yuncheng has just reached the borderline stage, while Taiyuan was in the early coordination stage. (b) In 2017, the level of CCD between the two systems improved slightly, and the spatial distribution pattern gradually evolved into a structure characterized by “the central region supplemented by the northern and southern poles”. The cities of Datong and Yuncheng, located at the northern and southern ends of the province, were both at a borderline stage, while Taiyuan, Jinzhong, and Changzhi, situated in the central region, were, respectively, at both a borderline stage and one of intermediate coordination. (c) In 2020, the level of CCD between the two systems improved significantly, and the spatial distribution pattern gradually evolved into a structure characterized by “the central region combined with the southern region”. Yuncheng, located in the southern part of the province, advanced to a stage of barely coordinated. Meanwhile, the central cities of Taiyuan and Jinzhong reached the stages of good coordination and barely coordinated, respectively. Although the coupling coordination levels of the northern cities also improved to varying degrees, most of them remained at the borderline stage. (d) In 2023, the level of CCD between the two major systems improved rapidly, giving rise to a development pattern characterized by “the central region extending southward”. The original core area centered on Taiyuan and Jinzhong further expanded to include Changzhi.
Cities in the central region were mostly in the coordinated development phase. The northern and southern regions were predominantly in a transitional stage of coordinated development. Benefiting from its proximity to the provincial capital, Taiyuan possesses a relatively advanced economic foundation. The concentration and diffusion of resources such as population, capital, technology, and infrastructure in the city generate significant spillover effects, thereby promoting the coupling coordinated development of the two systems in surrounding regions. Overall, the CCD between the two systems across the 11 prefecture-level cities in Shanxi Province exhibited a positive and steadily improving development trend, while the number of cities experiencing mild dysregulation declined significantly over the study period. Cities at the borderline stage exhibited contiguous expansion, while cities at the barely coordinated stage and excellently coordinated stage gradually emerged.

5.2.3. Spatio-Temporal Evolution Characteristics of CCD

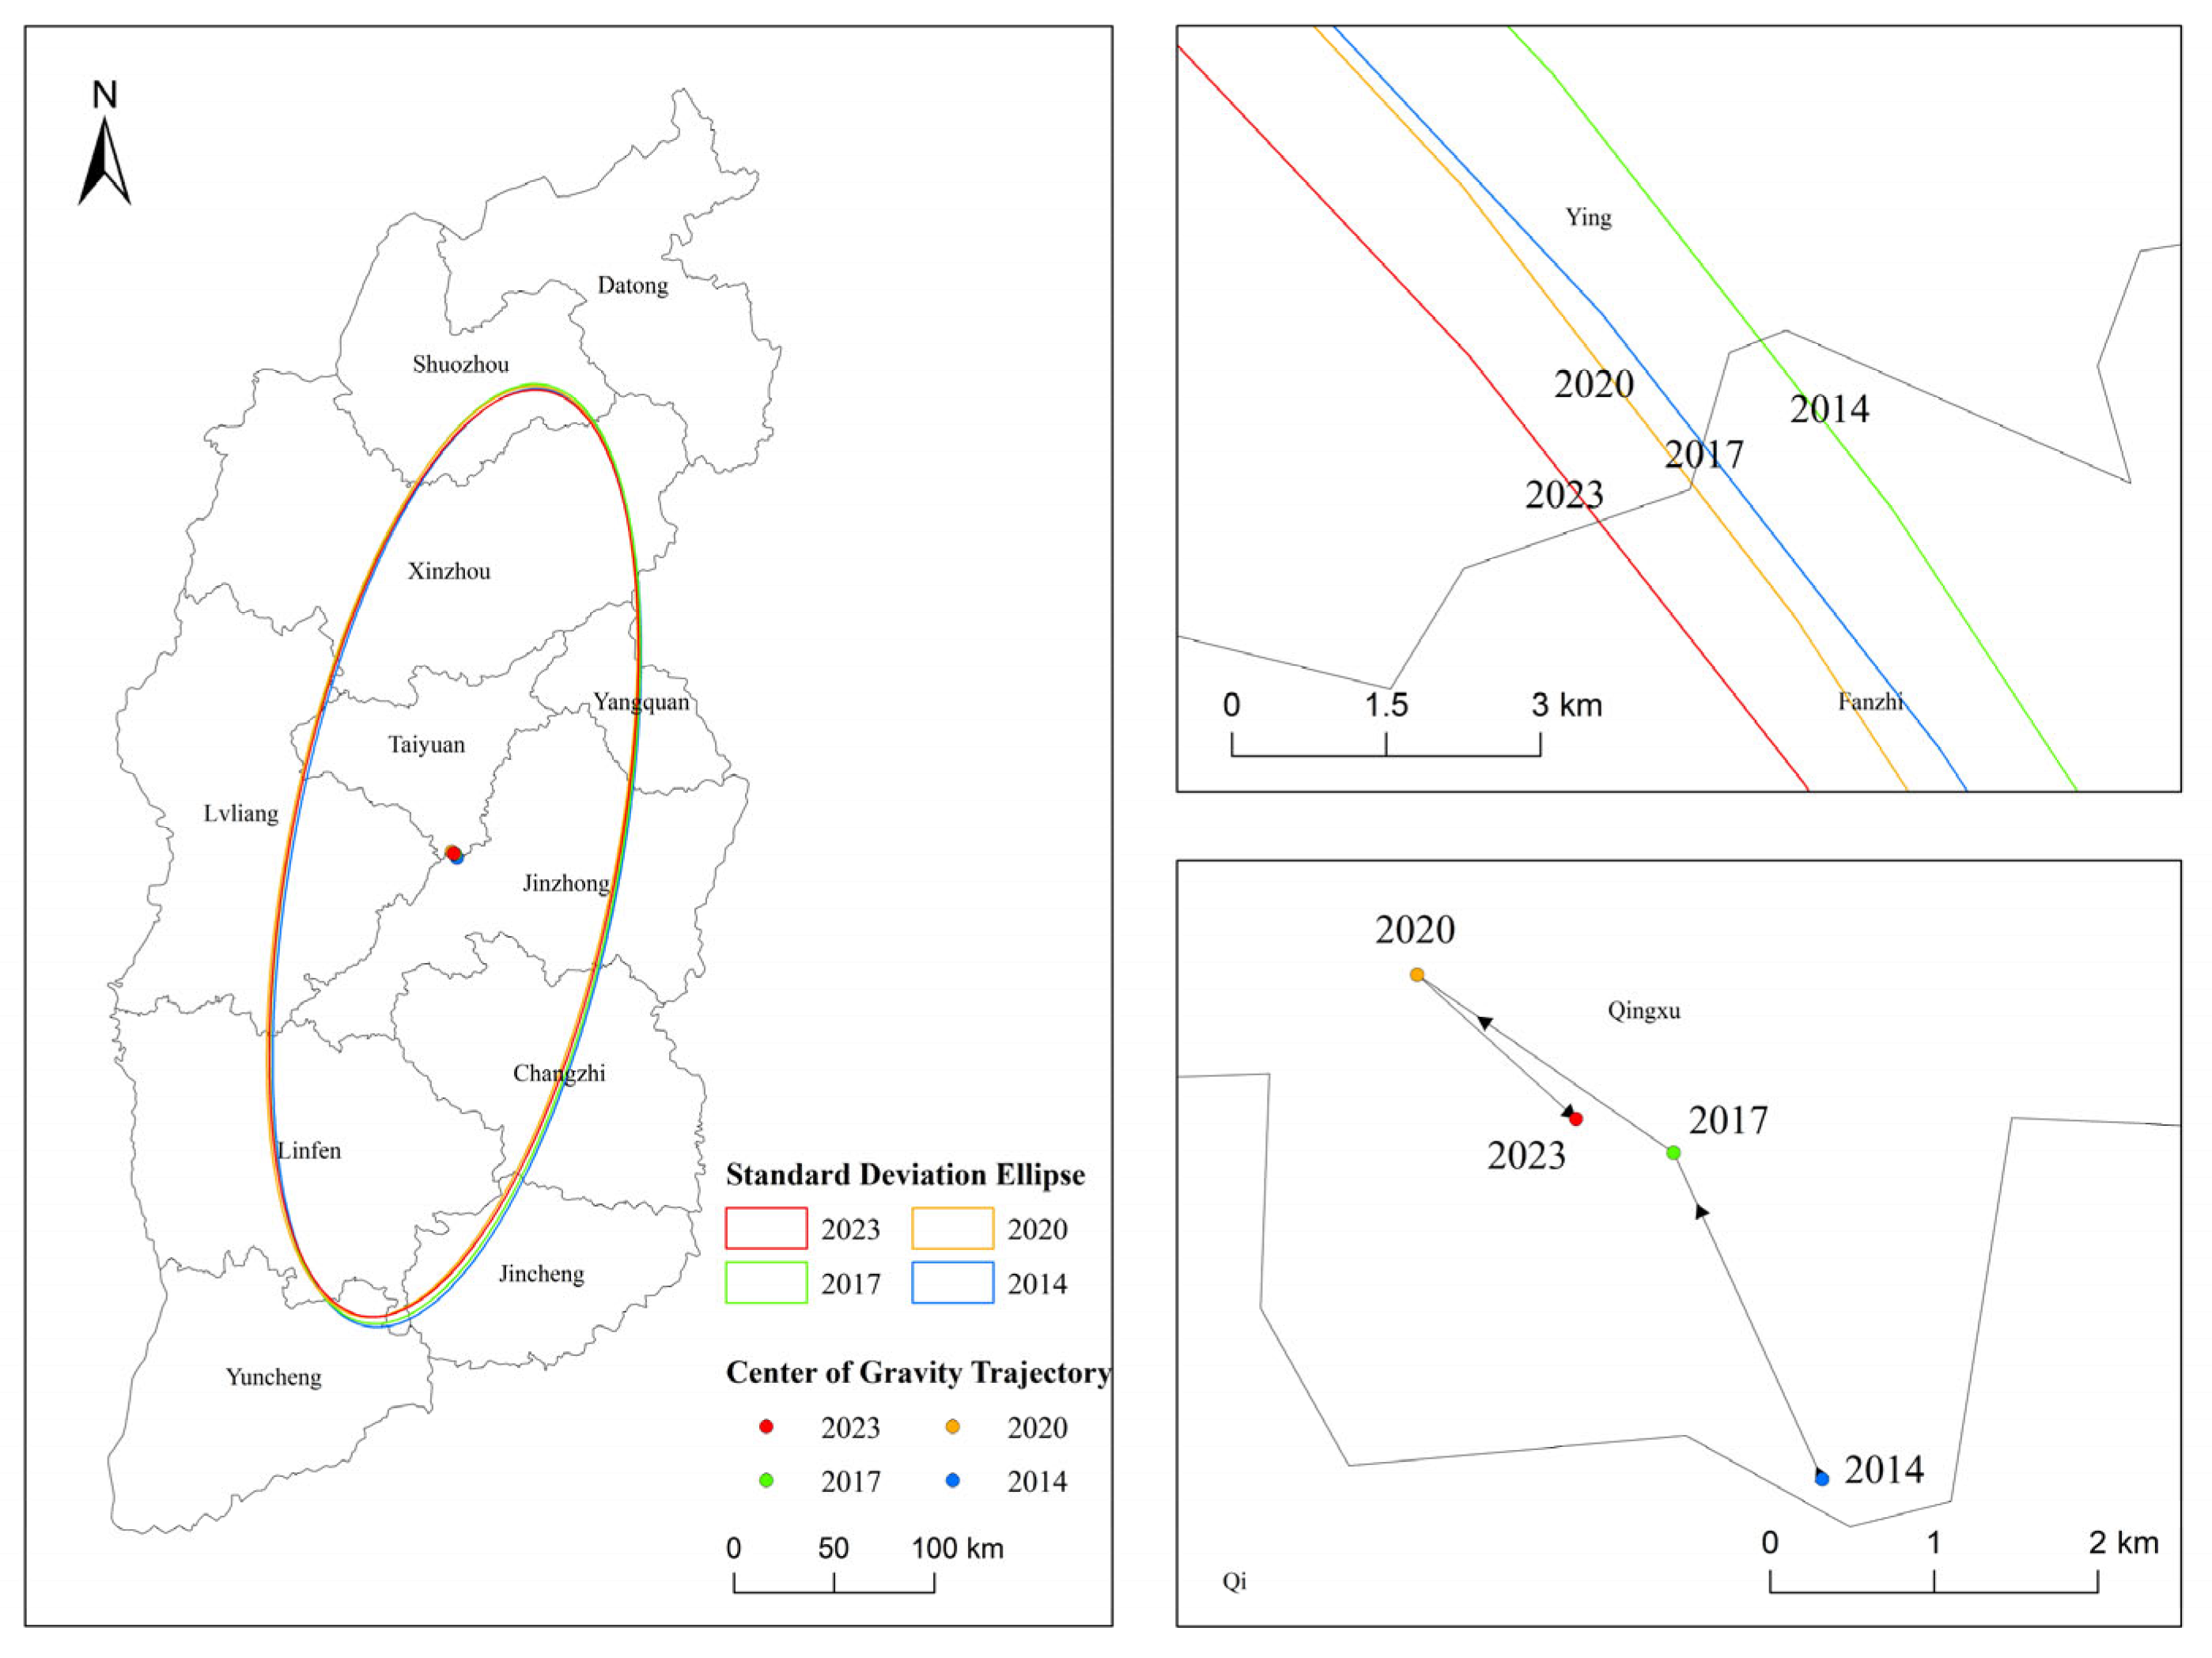
To accurately interpret the multidimensional characteristics of the spatial distribution of CCD between the DE and HQCTD in Shanxi Province, we plotted the standard deviation ellipses (SDEs) of the CCD for the two systems in 2014, 2017, 2020, and 2023 (Figure 9) and derived their center of gravity trajectories (CGTs) (Table 4).
From 2014 to 2023, the spatial center of gravity of CCD for the two major systems in Shanxi Province was located in Taiyuan City, with geographic coordinates ranging from 112°406′ E to 112°432′ E and 37°465′ N to 37°494′ N. Specifically, from 2014 to 2020, the center of gravity shifted slightly toward the northwest, whereas from 2020 to 2023, it exhibited a slight shift toward the southeast, indicating that the core driving forces of coordinated development initially agglomerated toward the northwest and subsequently shifted toward the southeast. Major projects such as the Smart Cultural Tourism Cloud Platform and 5G scenic area demonstration zones are predominantly located in the provincial capital and neighboring cities, and the spatial orientation of policies implementation contributed to the slight shift in the center of gravity. In terms of parameters, the major axis consistently exceeds the minor axis, indicating that the CCD between the two systems exhibits a distinct north–south distribution pattern. Moreover, both the major and minor axes exhibited an evolutionary trend of first increasing and then decreasing, this indicates that the CCD exhibited a spatial evolutionary trend characterized by initial dispersion followed by gradual agglomeration along both the north–south major axis and the east–west minor axis. Due to the substantial regional disparities in the development levels of the two major systems during the early stage, a pronounced spatial polarization effect emerged. With the gradual strengthening of interregional linkages, this spatial polarization effect progressively diffused from core areas to surrounding regions. The azimuth exhibited a fluctuating upward trend, while the ellipse as a whole underwent a slight clockwise rotation. Cities in northern Shanxi are dominated by energy-based industries, and the integration between the DE and the cultural tourism industry began relatively late in this region. In contrast, southern cities, benefiting from abundant cultural and tourism resources, established relatively mature online and offline cultural tourism systems at an earlier stage. Together with the continuous improvement of transportation networks, the transformation of resource-based cities in northern Shanxi, and the strengthening of industrial synergy within urban agglomerations, these factors collectively contributed to the spatial evolution characteristics of the CCD between the two systems in Shanxi Province.

5.3. Analysis of Influencing Factors

5.3.1. Internal Obstacle Factors in the Coupled Coordination System

(a)
Obstacle factors at the indicator level
Based on the obstacle degree model, the primary obstacle factors and their corresponding obstacle degrees affecting the two systems in the 11 prefecture-level cities of Shanxi Province were calculated. The detailed results are presented in Table 5. In the DE system, except for Taiyuan, where the primary obstacle factor is the total telecommunications industry output (X6), the primary obstacle factor for all other cities is general public budget expenditure (X3); the secondary obstacle factor for all cities is e-commerce transactions (X11); the third obstacle factor is e-commerce industry development (X5) for all cities except Taiyuan, where it is general public budget expenditure (X3). In the HQCTD system, except for Taiyuan, where the primary obstacle factor is the proportion of days with good air quality (Y6), the primary obstacle factor for all other cities is the number of students enrolled in regular higher education institutions (Y1); except for Taiyuan, where the secondary obstacle factor is the number of parks (Y13), the primary obstacle factor for all other cities is the number of regular higher education institutions (Y2); with the exception of Taiyuan, where the third major obstacle factor is the number of museums (Y12), and Jincheng, where it is urban green coverage area (Y5), the third major obstacle factor in all other cities is the number of parks (Y13).
(b)
Criteria-Level Obstacle Factors
Based on the average obstacle scores of the two major systems—DE and HQCTD—across the 11 prefecture-level cities in Shanxi Province, this study further analyzes the obstacle characteristics at the criterion level. The detailed results are presented in Table 6.
Within the DE system, throughout the 2014–2023 study period, digital development remained the core obstacle factor, while digital infrastructure and digital outcomes were identified as the primary and secondary obstacle factors, respectively. The pace of digital development directly influences the degree of digitalization in cultural tourism industry and therefore plays a pivotal role in the CCD between the two systems. Digital infrastructure and digital development are closely interrelated. Digital infrastructure influences the pace of digital development, while the continuous advancement of digital development further promotes the improvement of digital infrastructure. In recent years, Shanxi Province has accelerated the construction of digital infrastructure in sectors such as transportation, science and technology, and internet services. However, due to limitations in talent availability, financial support, and market accessibility compared with other provinces, digital infrastructure has become the primary factor hindering the improvement of the CCD between the two systems.
Within the HQCTD system, the three most significant obstacle factors in all cities, with the exception of Taiyuan, were innovation, sharing, and green development, in descending order of influence. Although Shanxi Province possesses abundant cultural and historical resources, it faces a significant shortage of skilled cultural tourism professionals, which constrains the development of diversified and high-quality tourism experiences. Furthermore, due to its relatively low level of economic development, public service provision remains limited in both supply capacity and spatial equity. Furthermore, despite Shanxi Province’s ongoing efforts toward industrial transformation and upgrading in recent years, heavy industry continues to dominate its economic structure. Although these transformation initiatives have contributed to certain improvements in environmental quality, the long-standing dependence on heavy industry remains a significant constraint on the HQCTD in Shanxi Province.

5.3.2. External Influencing Factors of the Coupling Coordination System

(a)
Variable selection
Referring to existing research findings, this study identifies six key influencing factors. First, economic development level (Z1) [31] determines the efficiency of resource allocation and the capacity to attract innovative resources, thereby significantly affecting digital infrastructure development and the digital transformation of the cultural tourism industry. GDP per capita was used as the measurement indicator for this factor. Second, the degree of openness (Z2) [31] directly affects the cross-regional flow of capital, technology, and information, thereby creating favorable conditions for the digital delivery of cultural tourism services and access to international markets. This factor was measured using the ratio of total imports and exports to GDP. Third, transportation accessibility (Z3) [31] reflects the extent to which transportation infrastructure facilitates regional connectivity. Well-developed transportation systems can attract digital economy enterprises to establish business operations and effectively improve the spatial accessibility of cultural tourism resources. This factor was measured using highway mileage. Fourth, industrial structure (Z4) [13] reflects the degree of coordination between industrial development and economic transformation. An optimized industrial structure facilitates factor integration and structural coordination between the digital economy (DE) and the cultural tourism industry. This factor was measured using the share of tertiary industry value added in GDP. Fifth, market environment (Z5) [42] reflects the institutional and competitive conditions that support economic development. A well-developed market environment facilitates resource allocation efficiency and promotes the coordinated development of the DE and HQCTD. This factor was measured using the marketization index. Sixth, government regulation (Z6) [43] reflects the government’s role in macro-level regulation and policy guidance. Through public resource allocation and industrial policy intervention, the government significantly influences the CCD between the two systems. This factor was measured using per capita public fiscal expenditure.
(b)
Single-Factor Detection Analysis
During the factor discretization process, five classification methods were employed, including equal interval classification, natural breaks classification, quantile classification, geometric interval classification, and standard deviation classification. Considering that the optimal discretization effect is generally achieved when the number of categories is fewer than 10, the number of categories in this study was set to range from 3 to 8. By comparing q values under different classification methods, the method yielding the highest q value was selected for subsequent geographical detector analysis to assess the influence of various factors on the coupling coordination between the DE and HQCTD.
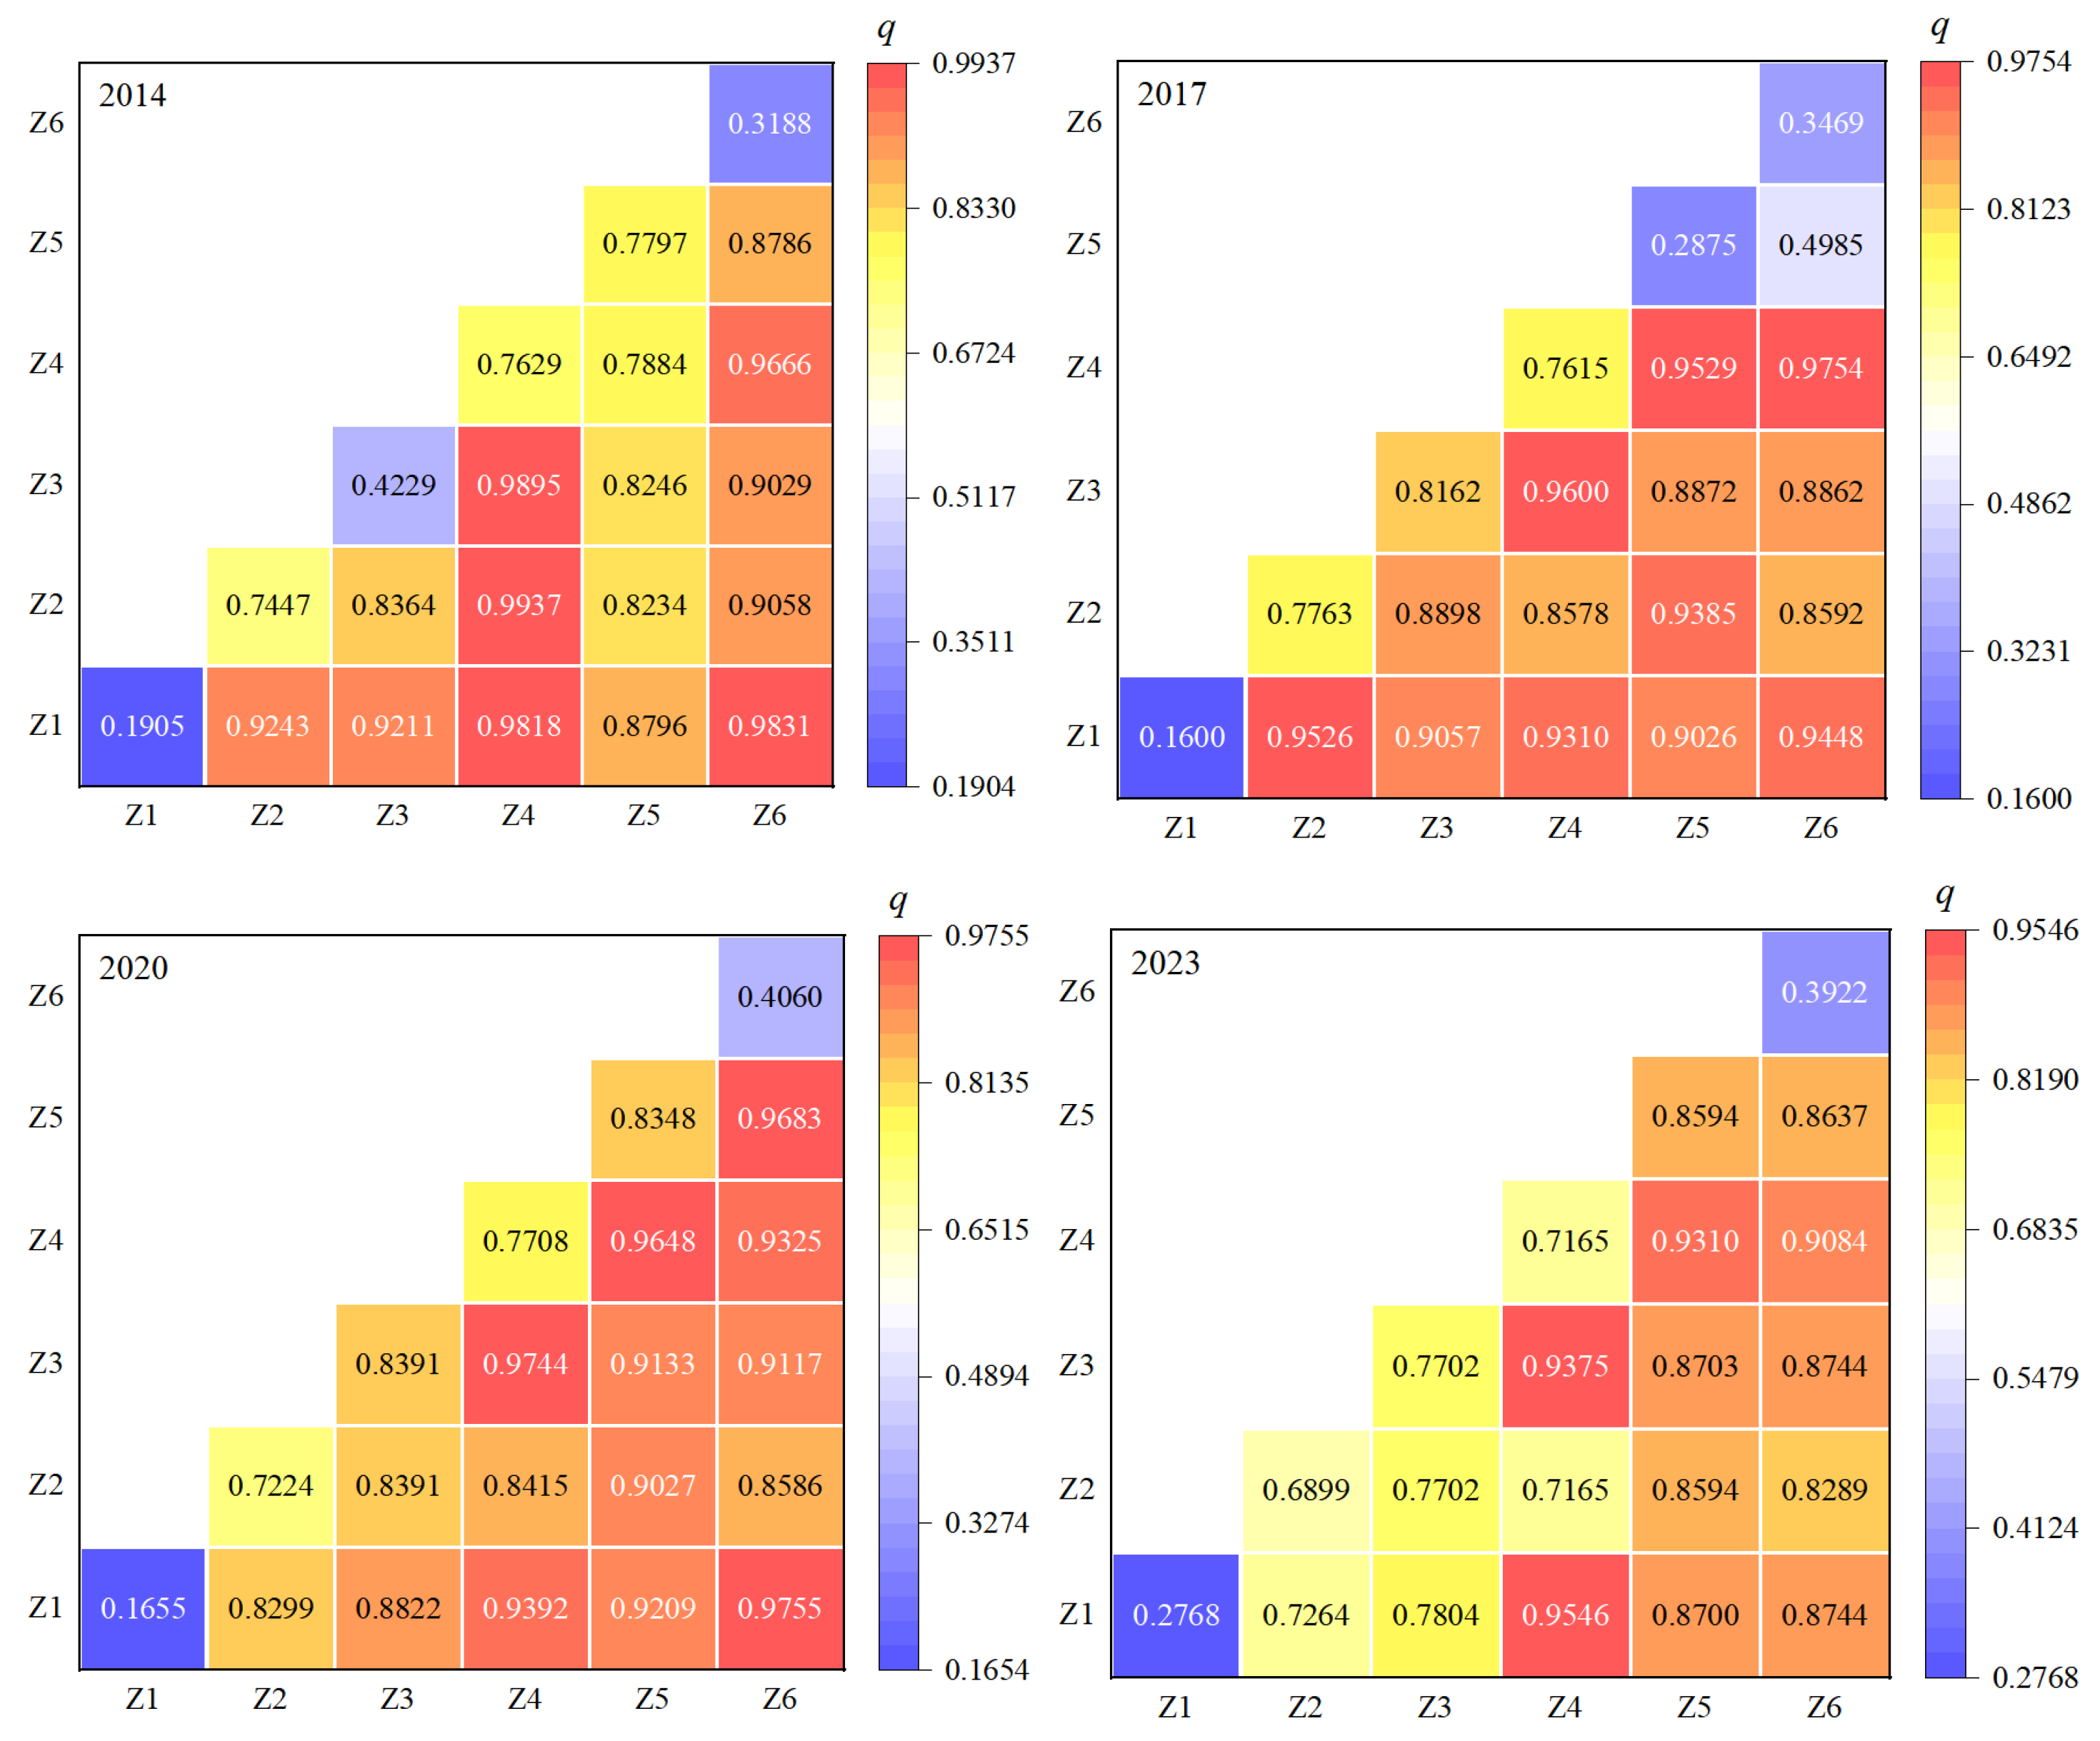
Geographical detector analysis (Table 7) indicates that the industrial structure (Z4) is the most critical factor driving the DE and HQCTD of Shanxi Province. Since being designated in 2010 as a national comprehensive reform pilot zone for resource-based economic transformation, Shanxi Province has continuously promoted the transformation of its resource-dependent economy and accelerated the development of modern service industries. In 2017, the DE was identified as a key direction for resource-based economic transformation. Increasing attention was subsequently directed toward the integration of digital technologies into the cultural tourism industry, with efforts focused on strengthening the linkages and factor integration between the DE and the cultural tourism industry. Shanxi Province has continuously strengthened international cultural and tourism cooperation, optimized the business environment, and promoted the cross-regional flow of resources, thereby providing strong support for the coupling coordination between the two systems. Therefore, the degree of openness (Z2) has become a crucial factor following the industrial structure. Shanxi Province has continuously improved its comprehensive multi-modal transportation network and enhanced the strategic service capacity of its transportation system. These improvements have significantly increased the spatial accessibility of production factors related to the digital economy and the cultural tourism industry, thereby enhancing the efficiency of cross-regional resource diffusion and agglomeration among major cities and scenic areas across the province. Consequently, transportation accessibility (Z3) has emerged as a key driving factor facilitating the coupling coordination between the DE and HQCTD. The value of Z5 decreased from 0.7797 in 2014 to 0.2875 in 2017 and subsequently increased to 0.8348 in 2020. This fluctuation may be attributed to the fact that, during the early stage of coupling coordination, the two systems were highly dependent on a favorable external market environment. In 2017, as the two systems continued to develop, the market environment became more stable, and their reliance on these systems decreased. In 2020, the outbreak of COVID-19 intensified market uncertainty, thereby significantly increasing the influence of this factor.
(c)
Interaction Detection Analysis
Analysis of the interaction detection results (Figure 10) reveals that interaction factors generally exert a stronger influence on the CCD than single factors. This finding indicates that the spatiotemporal differentiation of CCD is a complex process driven by the synergistic effects of multiple factors rather than a simple linear superposition. The interaction effects are primarily manifested in two forms: bivariate enhancement and nonlinear enhancement (Table 3).
In 2014, the dominant interaction factor was Z2∩Z4 (degree of openness∩industrial structure). During this stage, the CCD between the two systems was in its early phase. Due to the relatively low level of export-oriented economic development and the imbalance in its industrial structure, Shanxi Province has promoted the optimization and upgrading of its industrial structure by introducing external resources such as talent and technology, thereby creating favorable conditions for the coupling coordination between the two systems. In 2017, the dominant interaction factor shifted to Z4∩Z6 (industrial structure∩government regulation). In 2020, the dominant interaction factor became Z1∩Z6 (economic development∩government regulation). Under the impact of the COVID-19 pandemic, economic development experienced considerable challenges. In response, the government implemented a series of macroeconomic policy measures aimed at improving the business environment, strengthening infrastructure construction, and stimulating market activity. In 2023, the dominant interaction factor was Z1∩Z4 (economic development∩industrial structure), the economic performance of Shanxi Province has improved significantly, accompanied by the optimization and upgrading of its industrial structure and the strengthening of interregional linkages. These developments have facilitated the spatial integration between the DE and the cultural tourism industry.

6. Discussion and Recommendations

6.1. Discussion

In the context of global sustainable development, the empowering role of the DE has not only promoted innovation and service upgrading within the cultural tourism industry but also facilitated interactive synergy between the two systems. The coupling coordination between the DE and HQCTD has become a key driving force for green and sustainable growth in Shanxi Province. Compared with previous studies that primarily focused on qualitative or macro-level analyses, this study systematically reveals the mechanisms underlying coupling coordination, the spatiotemporal evolution characteristics, and the driving factors influencing the coordinated development of the DE and HQCTD. Based on these findings, targeted policy recommendations are further proposed to promote the coupling coordination between the DE and HQCTD in Shanxi Province.
Firstly, after reaching a temporary peak in 2020, the level of DE development in most prefecture-level cities in Shanxi Province experienced a slight decline in 2021. This presents a certain contradiction with the continuous improvement of the DE [44]; however, due to differences in locational conditions, policy support, and development potential, there are significant regional disparities in DE development levels [45]. During 2021 and 2022, against the backdrop of pandemic controls and structural industry adjustments, the DE in some provinces demonstrated heightened sensitivity to macroeconomic environmental changes, as verified by existing research [41]. It is worth noting that, compared to the real economy, the DE system was relatively less affected by the pandemic [43], resulting in a time lag in its decline; however, as the pandemic persisted, the resilience of the DE system gradually weakened [40]. The level of high-quality development of the cultural tourism industry in Shanxi Province exhibited a fluctuating upward trend, experienced a slight decline under the impact of COVID-19, and gradually recovered in the post-pandemic period. The COVID-19 pandemic has had a significant impact on HQCTD, with an overall trend of growth followed by decline and then renewed growth [44]. Given the differences among regions in terms of infrastructure and economic development levels, it led to varying DE development patterns across regions [46], exhibiting non-uniform characteristics and significant spatial disparities [47].
Secondly, the CCD between Shanxi Province’s DE and HQCTD has shown a fluctuating upward trend. The coupling coordination relationship has shifted from dysfunctional stage to transitional stage, though the overall level of coupling coordination remains relatively low [48]. This indicates that, under the combined influence of internal and external environments, the relationship between the two systems has improved. However, the provincial capital, Taiyuan, has consistently maintained a leading position, and this aligns with the view proposed by Luo et al. that cities with higher CCD typically emerge first in provincial capital or regional centers before expanding influence to surrounding cities [49]. These regions primarily benefit from robust economic foundations, comprehensive digital infrastructure, and mature cultural tourism [40]. The shift in the coupling coordination center of gravity toward the south aligns with the rapid development of transportation infrastructure in southern regions, and improved transportation has facilitated the growth of the DE and cultural tourism [50]. Northern resource-based cities are gradually transitioning from the energy industry to the digital cultural tourism, with significant changes in CCD [51]; however, due to late-stage transitions, they still lag behind the central and southern cities.
Finally, general public budget expenditure was identified as the dominant obstacle factor at the element level within the digital economy system in Shanxi Province, while digital development emerged as the core obstacle factor at the criterion level. This indicates that insufficient general public budget expenditure, as a critical source of financial support for digital infrastructure development and cultural tourism public service systems [52], has significantly constrained the improvement of the CCD between the two systems [53]. Regarding external driving factors, the DE and the HQCTD of Shanxi Province’s requires multiple drivers including openness, transportation accessibility, industrial structure, market environment, and government regulation. Opening up to the outside world generates spillover and demonstration effects by attracting external tourism resources, production factors, and high-tech products [54]. Transportation accessibility enables the flow of capital and information to create agglomeration effects, providing an external development environment for the DE and the cultural tourism [44]. Industrial structure drives the rational allocation of digital elements and stimulates innovation in cultural tourism models [55]. A relaxed and fair market environment enables digital technology empowerment for cultural tourism product upgrades, business innovation, and market expansion, thereby promoting the deep integration of the DE and cultural tourism [42]. Government intervention can promote the orderly flow of digital elements and eliminate the negative externalities of tourism resources [43].

6.2. Recommendations

Based on the analysis of internal obstacle factors and external driving forces affecting the coupling coordination between the DE and the HQCTD in Shanxi Province, the following policy recommendations are proposed.
First, innovation has emerged as the core obstacle factor constraining the high-quality development of the cultural tourism industry. To strengthen the role of innovation-driven factors in promoting the development of the cultural tourism industry, priority should be given to implementing pilot programs in regions with well-developed digital infrastructure and abundant cultural tourism resources. Leveraging regions with concentrated innovation resources, such as Taiyuan and Jinzhong, a digital cultural tourism innovation platform integrating universities, research institutions, and cultural tourism enterprises should be established. Priority should be given to promoting the application and diffusion of digital technologies in areas such as cultural heritage attractions and historical cultural districts. For digital projects characterized by advanced technical requirements and substantial capital investment, a phased implementation strategy should be adopted by combining government guidance with market-oriented enterprise operation. Priority should be given to the development of key scenic areas with high visitor volumes and high-quality tourism resources in order to reduce initial construction costs and the risks associated with technology implementation. Meanwhile, leveraging the provincial-level cultural tourism data platform, data sharing among stakeholders in tourism-related sectors such as catering, accommodation, transportation, and tourism services should be promoted, thereby enhancing the tourism market’s capacity for targeted service provision.
Second, digital infrastructure has become a major obstacle factor restricting the development of the digital economy system. Significant regional disparities exist in digital infrastructure development across Shanxi Province. Therefore, priority should be given to improving digital network coverage in key scenic areas, transportation hubs, and public cultural spaces, with gradual expansion to county-level regions and rural tourism destinations. In terms of implementation strategies, the financial burden of infrastructure construction can be alleviated through measures such as dedicated government funding, cooperation with telecommunications operators, and private-sector investment. Furthermore, immersive technologies such as VR and AR should be widely applied in scenic areas. Through digital guided tours, virtual restoration, and interactive exhibitions, tourists’ cultural engagement can be enhanced, thereby improving the dissemination efficiency of cultural tourism resources and increasing visitor satisfaction.
Third, industrial structure has emerged as the primary external driving factor influencing the coordinated development of the two systems. Based on the differing resource endowments and industrial foundations across regions, Shanxi Province should explore differentiated pathways for the digital integration of culture and tourism in order to avoid product homogenization. Resource-based cities should leverage their industrial heritage and energy industries to promote the development of digitally enabled industrial tourism. Regions rich in cultural resources should focus on developing digital cultural and creative industries, smart tourism, and cultural intellectual property (IP) products, while regions with strong ecological advantages should appropriately develop health tourism, ecotourism, and other sustainable tourism models. On this basis, cross-regional resource integration and industrial collaboration should be strengthened to promote integrated development within the digital cultural tourism sector and enhance the endogenous driving force for coordinated development.

7. Conclusions and Outlook

7.1. Research Conclusions

First, Shanxi Province’s DE has maintained steady growth, with a continuous upward trend except for the period from 2020 to 2022. HQCTD grew steadily prior to the COVID-19 pandemic, but experienced a slight decline due to the pandemic, and gradually recovering post-pandemic. There are significant spatial disparities in the comprehensive levels of the two systems. As the provincial capital, Taiyuan significantly outperforms other prefecture-level cities.; however, all cities remain considerably below the level of high-quality coordination.
Second, the coupling coordination between the DE and the HQCTD in Shanxi Province demonstrates a favorable development trend. The coupling coordination relationships in the vast majority of prefecture-level cities have shifted from the “dysregulation stage” to the “transitional stage”. Taiyuan, the provincial capital, has advanced to a stage of excellent coordination.
The spatial distribution of coupling coordination between the DE and the HQCTD has evolved from “a single-center pattern”, “northern, southern, and central regions” and “the southern part, and the central region” to “southward extension of the core area”.
Third, the primary obstacles at the indicator level for the DE are general public budget expenditure on science and technology, e-commerce transaction volume, and postal service revenue. At the criteria level, the key obstacles are digital development, digital infrastructure, and digital outcomes. For HQCTD, the primary obstacles at the indicator level are the number of students enrolled in regular higher education institutions, number of regular higher education institutions, and number of parks. At the criteria level, the primary obstacles are innovation, sharing, and green development.
Fourth, the primary external single-factor drivers are industrial structure, the degree of openness, and transportation accessibility. In 2014, the dominant interactive factors were Z2∩Z4 (degree of openness∩industrial structure). In 2017, they were Z4∩Z6 (industrial structure∩government regulation). In 2020, they were Z1∩Z6 (economic development level∩government regulation). And in 2023, they were Z1∩Z4 (economic development level∩industrial structure).

7.2. Limitations and Outlook

This study systematically examined the coupling coordination between the DE and the HQCTD in Shanxi Province. Nevertheless, several limitations remain and warrant further investigation. Future research could focus on the following aspects. First, due to data availability limitations, this study only covers the period from 2014 to 2023 and does not incorporate earlier or more recent data. Future studies could extend the time series to further explore the long-term evolution of coupling coordination between the two systems. Second, although this study adopts prefecture-level cities as the unit of analysis, which effectively reflects the overall regional pattern, it cannot fully capture intra-city disparities. Future research could refine the analysis to the county level to better characterize the spatial heterogeneity of the two systems. Third, although methods such as the entropy method, coupling coordination model, obstacle degree model, and GeoDetector can reveal the overall characteristics of coupling coordination, they cannot fully capture the dynamic interactions among variables. Future research could incorporate system dynamics models and machine learning approaches to investigate the dynamic evolution and predictive trends of the two systems.

Author Contributions

Conceptualization, J.W. and P.S.; methodology, Y.T.; software, Y.T.; validation, P.S.; formal analysis, Y.T.; data curation, P.S.; writing—original draft preparation, Y.T.; writing—review and editing, J.W.; supervision, J.W. and P.S. All authors have read and agreed to the published version of the manuscript.

Funding

This research was supported by the Young Research Project of Philosophy and Social Sciences of Shanxi Province (Grant No. 2024QN066); the Philosophy and Social Sciences Project of Shanxi Higher Education Institutions (Grant No. 2024W044); and the Special Project of Shanxi Normal University (Grant No. SZQH20250004). Additionally, this research also received support from the First-Class Course Construction Project of Shanxi Province (Grant No. K2024798).

Institutional Review Board Statement

Not applicable.

Informed Consent Statement

Not applicable.

Data Availability Statement

The original contributions presented in this study are included in the article. Further inquiries can be directed to the corresponding author.

Acknowledgments

We acknowledge all reviewers and editors for this paper.

Conflicts of Interest

The authors declare no conflicts of interest.

Abbreviations

The following abbreviations are used in this manuscript:
CCDCoupling Coordination Degree
HQCTDHigh-Quality Cultural Tourism Development
DEDigital Economy
SDEStandard Deviation Ellipse
CGTCenter of Gravity Trajectory Model

References

  1. Sinh, T.T.T.; Németh, N. Decent Work and Economic Growth Goals 8: Tourism and the Sustainable Development in Southeast Asia; Budapesti Gazdasági Egyetem: Budapest, Hungary, 2023; pp. 104–115. [Google Scholar]
  2. ShuShu, K.; Samsurijan, M.S.; Yao, O.Z. The Influence of Smart Infrastructure, Cultural Heritage Preservation, and Green Mobility on Urban Sustainable Tourism Development: The Mediating Role of Tourist Satisfaction. Int. J. Synerg. Eng. Technol. 2025, 6, 61–81. [Google Scholar]
  3. Banalieva, E.R.; Dhanaraj, C. Internalization theory for the digital economy. J. Int. Bus. Stud. 2019, 50, 1372–1387. [Google Scholar] [CrossRef] [Scilit]
  4. He, Q. Research on the Measurement of High-quality Development Level of Provincial Tourism in China. Front. Econ. Manag. 2024, 5, 117–124. [Google Scholar]
  5. Luong, V.H.; Manthiou, A. Video game-inspired tourism: A synergistic framework. Tour. Manag. 2026, 112, 105282. [Google Scholar] [CrossRef] [Scilit]
  6. Yifan, L.; Hongmei, Y.; Qin, Y. Research on the mechanism of the impact of human land relations in virtual tourism on the supporting behavior of actual tourism sites-Taking “Black Myth: Wukong” as an example. Resour. Dev. Mark. 2026, 42, 309–320. [Google Scholar]
  7. Purnomo, A.; Susanti, T.; Rosyidah, E.; Firdausi, N.; Idhom, M. Digital economy research: Thirty-five years insights of retrospective review. Procedia Comput. 2022, 197, 68–75. [Google Scholar] [CrossRef] [Scilit]
  8. Razzaq, A.; Sharif, A.; Ozturk, I.; Skare, M. Asymmetric influence of digital finance, and renewable energy technology innovation on green growth in China. Renew. Energy 2023, 202, 310–319. [Google Scholar] [CrossRef] [Scilit]
  9. Oliveira, L.; Fleury, A.; Fleury, M.T. Digital power: Value chain upgrading in an age of digitization. Int. Bus. Rev. 2021, 30, 101850. [Google Scholar] [CrossRef] [Scilit]
  10. Chu, H.; Ning, Y.; Qie, X. Measurement and spatial correlation analysis of the development level of the digital economy in the Yangtze River delta urban agglomeration. Sustainability 2023, 15, 13329. [Google Scholar] [CrossRef] [Scilit]
  11. Wang, Y.; Huang, L.; Ren, Y.; Hu, X.; Li, C. Can Digital Rural Construction Improve Household Food Security? Evidence From Rural China. Food Energy Secur. 2026, 15, e70205. [Google Scholar] [CrossRef] [Scilit]
  12. Luo, J.; Yang, Q.Q.; Zhang, P.P. Digital talent allocation and digital industrial chain resilience. China Sci. Technol. Forum 2026, 2, 73–82. [Google Scholar]
  13. Zhang, H.; Xia, Z.; Zeng, Z. The economic governance capability of the government and high-quality development of China’s tourism industry. Sustainability 2024, 16, 7370. [Google Scholar] [CrossRef] [Scilit]
  14. Zhao, X.N.; Mei, X.H.; Xiao, Z.Q. Impact of the Digital Economy in the High-Quality Development of Tourism—An Empirical Study of Xinjiang in China. Sustainability 2022, 14, 12972. [Google Scholar] [CrossRef] [Scilit]
  15. Yao, H.; Zou, Z.; Zhu, Y.; Zhou, C. From pursuing quantity to pursuing quality: Exploring the coupling coordination and influencing factors of high-quality tourism development and ecosystem service value in the Pearl River Delta urban agglomeration of China. Front. Public Health 2025, 3, 1705088. [Google Scholar] [CrossRef] [Scilit] [PubMed]
  16. Theobald, W.F.; Dunsmore, H.E. Internet Resources for Leisure and Tourism; Taylor and Francis: Abingdon, UK, 1999. [Google Scholar]
  17. Sang, Q.; Hu, Y. Research on Precision Marketing Strategy of Rural Tourism Combining Big Data and Cloud Computing Technology. Appl. Math. Nonlinear Sci. 2025, 10, 1014. [Google Scholar] [CrossRef] [Scilit]
  18. Tan, L.; Yang, Z.; Irfan, M.; Ding, C.J.; Hu, M.; Hu, J. Toward low-carbon sustainable development: Exploring the impact of digital economy development and industrial restructuring. Bus. Strategy Environ. 2024, 33, 2159–2172. [Google Scholar] [CrossRef] [Scilit]
  19. Qi, S.; Leung, R.; Law, R.; Buhalis, D. Hong Kong residents’ perception of travel websites. In Information and Communication Technologies in Tourism; Springer: Berlin/Heidelberg, Germany, 2010; pp. 75–86. [Google Scholar]
  20. Li, Y.; Li, C.; Cui, J.; Gao, Y. Application and Reflection of Virtual Reality in Digital Tourism Development. Appl. Math. Nonlinear Sci. 2024, 9, 20240841. [Google Scholar] [CrossRef] [Scilit]
  21. Florido-Benítez, L. The role of cybersecurity as a preventive measure in digital tourism and travel: A systematic literature review. Discov. Comput. 2025, 28, 28. [Google Scholar] [CrossRef] [Scilit]
  22. Morosan, C.; DeFranco, A. Co-creation of value using hotel interactive technologies: Examining intentions and conversion. Int. J. Contemp. Hosp. Manag. 2019, 31, 1183–1204. [Google Scholar] [CrossRef] [Scilit]
  23. Deng, T.; Wan, G.; Ma, M. Impact of tourism companies digital transformation on employment: Some evidence from China. Asia Pac. J. Tour. Res. 2024, 29, 225–238. [Google Scholar] [CrossRef] [Scilit]
  24. Orús, C.; Ibáñez-Sánchez, S.; Flavián, C. Enhancing the customer experience with virtual and augmented reality: The impact of content and device type. Int. J. Hosp. Manag. 2021, 98, 103019. [Google Scholar] [CrossRef] [Scilit]
  25. Tang, R. Digital economy and total factor productivity of tourism enterprises in China: The perspective of market competition theory. Curr. Issues Tour. 2024, 27, 76–91. [Google Scholar] [CrossRef] [Scilit]
  26. Xu, C.; Tang, H. An analysis of the measurement of symbiosis intensity in scenic spots and the influence mechanism. Sustainability 2022, 14, 8297. [Google Scholar] [CrossRef] [Scilit]
  27. Stringer, P.F.; Pearce, P.L. Toward a symbiosis of social psychology and tourism studies. Ann. Tour. Res. 1984, 11, 5–17. [Google Scholar] [CrossRef] [Scilit]
  28. Wang, Z.; Li, X. Public Cultural Services and Cultural Industries: Symbiotic Mechanisms and Practical Pathways. J. Shenzhen Univ. (Humanit. Soc. Sci. Ed.) 2024, 3, 58–66. [Google Scholar]
  29. Dong, H.; Zeng, J. Digital Empowerment and Sustainable Tourism: Spatiotemporal Coupling Coordination Analysis of Digital Technology and High-Quality Development in China’s A-Level Scenic Spots. Sustainability 2025, 17, 10293. [Google Scholar] [CrossRef] [Scilit]
  30. Pei, R.; Xie, X.; Bai, K.; Pei, R. Regional Differences and Influencing Factors of the Integrated Development of the Digital Economy and the Cultural Tourism Industry. Areal Res. Dev. 2025, 44, 8–17. [Google Scholar]
  31. Shu, X.; Min, Z.; Guo, X.; He, Y.; Zhang, Q. Coupling coordination and driving factors between provincial digital economy and high-quality tourism development. Econ. Geogr. 2024, 44, 197–208. [Google Scholar]
  32. Ke, Y.; Yang, M.; Xie, Y. An empirical research based on spatial–temporal evolution of high-quality tourism development in Fujian Province of China. PLoS ONE 2025, 19, e0315221. [Google Scholar] [CrossRef] [Scilit]
  33. Liu, J.; Wang, Z.; Li, C. All-for-One tourism demonstration zones and high-quality development of tourism: Evidence from the quasi-natural experiment in China. Sustainability 2023, 15, 11626. [Google Scholar] [CrossRef] [Scilit]
  34. Tang, Z. An integrated approach to evaluating the coupling coordination between tourism and the environment. Tour. Manag. 2015, 46, 11–19. [Google Scholar] [CrossRef] [Scilit]
  35. Xiao, Y.; Qiang, W.W.; Chan, C.S.; Yim, S.H.; Lee, H.F. How far can air pollution affect tourism in China? Evidence from panel unconditional quantile regressions. PLoS ONE 2024, 19, e0304315. [Google Scholar] [CrossRef] [Scilit] [PubMed]
  36. Weng, G.; Li, L. Coupling coordination degree and spatial correlation analysis of the integration of tourism and cultural industries in China. Econ. Geogr. 2016, 36, 178–185. [Google Scholar]
  37. Geng, Y.; Yan, Y. Higher education and science popularization: Can they achieve coordinated growth? PLoS ONE 2021, 16, e0256612. [Google Scholar] [CrossRef] [Scilit]
  38. Li, F.; Shuai, C.; Xu, Z.; Chen, X.; Wang, C.; Zhao, B.; Qu, S.; Xu, M. Machine learning-enhanced assessment of urban sustainable development goals progress. Cities 2025, 158, 105718. [Google Scholar] [CrossRef] [Scilit]
  39. Zhao, B.; Li, G.; Xiao, N.; Zhou, D.; Song, Y.; Li, C. Obstacle Degree and Improvement Path of the Coupling Coordination Between the Digital Economy and the Sports Industry. J. Shenyang Sport Univ. 2026, 45, 107–114. [Google Scholar]
  40. Pan, Z.; Luo, Y.; Wang, Y.; Ji, J.; Lai, B. Coupling coordination and driving mechanism between tourism development, ecological conservation and digital economy: Insights from Chinese 278 cities. Sci. Rep. 2025, 15, 37445. [Google Scholar] [CrossRef] [Scilit]
  41. Wang, C.; Meng, X.; Siriwardana, M.; Pham, T. The impact of COVID-19 on the Chinese tourism industry. Tour. Econ. 2022, 28, 131–152. [Google Scholar] [CrossRef] [Scilit]
  42. Tang, Y.; Weng, G.; Tian, F. Spatiotemporal evolution and influencing factors of the integrated development level between the digital economy and the cultural tourism industry. Stat. Decis. 2026, 42, 97–102. [Google Scholar]
  43. ur Rehman, S.; Khan, S.N.; Antohi, V.M.; Bashir, S.; Fareed, M.; Fortea, C.; Cristian, N.P. Open innovation big data analytics and its influence on sustainable tourism development: A multi-dimensional assessment of economic, policy, and behavioral factors. J. Open Innov. Technol. Mark. Complex. 2024, 10, 100254. [Google Scholar] [CrossRef] [Scilit]
  44. Liu, M.; Lu, M.; Li, Z. Coupling coordination analysis on digital economy-tourism development-ecological environment. J. Clean. Prod. 2024, 470, 143320. [Google Scholar] [CrossRef] [Scilit]
  45. Wang, W.; Yang, X.; Cao, J.; Bu, W.; Dagestani, A.A.; Adebayo, T.S.; Dilanchiev, A.; Ren, S. Energy internet, digital economy, and green economic growth:evidence from China. Innov. Green Dev. 2022, 1, 100011. [Google Scholar] [CrossRef] [Scilit]
  46. Yi, M.; Liu, Y.; Sheng, M.S.; Wen, L. Effects of digital economy on carbon emission reduction: New evidence from China. Energy Policy 2022, 171, 113271. [Google Scholar] [CrossRef] [Scilit]
  47. Ma, M.; Tang, J. Interactive coercive relationship and spatio-temporal coupling coordination degree between tourism urbanization and eco-environment: A case study in Western China. Ecol. Indic. 2022, 142, 109149. [Google Scholar] [CrossRef] [Scilit]
  48. Ren, B.P.; Du, Y.X. Coupling coordination of economic growth, industrial development and ecology in the Yellow River Basin. China Popul. Resour. Environ. 2021, 31, 119–129. [Google Scholar]
  49. Luo, Y.; Wang, Y.; Pan, Z.; Li, H.; Lai, B.; Qin, Y. Synergizing high-quality tourism development and digital economy: A coupling coordination analysis in Chinese prefecture-level cities. Entropy 2025, 27, 1061. [Google Scholar] [CrossRef] [Scilit]
  50. Yanyan, G.; Wei, S.; Kaini, W. Does high-speed rail boost tourism growth? New evidence from China. Tour. Manag. 2018, 72, 220–231. [Google Scholar]
  51. Song, H.; Zhang, X.; Wu, X. Research on the Spatial-Temporal Evolution and Driving Mechanism of Coupling Coordination among Digital-Tourism-Environment in the Yellow River Basin. Sustainability 2024, 16, 5339. [Google Scholar] [CrossRef] [Scilit]
  52. Zhang, Z.; Gong, J.; Ma, H.; Zhang, J. The spatial and temporal evolution and influencing factors of the coupling and coordinated development of basic public services, urbanization, and tourism in China. Sustainability 2023, 15, 11753. [Google Scholar] [CrossRef] [Scilit]
  53. Liu, H.; Tan, Z.; Xia, Z. The coupling coordination relationship and driving factors of the digital economy and high-quality development of rural tourism: Insights from Chinese experience data. Land 2024, 13, 1734. [Google Scholar] [CrossRef] [Scilit]
  54. Zhang, Y.; Zhu, Y.; Wei, T.; Guo, D. Assessment of coupling coordination between China’s digital economy and new-type urbanization and identification of driving factors. Econ. Change Restruct. 2024, 57, 122. [Google Scholar] [CrossRef] [Scilit]
  55. Tian, L.; Sun, F.; Zhang, Z.; Zhang, S. Coupling coordination and driving mechanism of tourism industry, urbanization, and ecological environment: A case study of Shandong, China: T. Lei et al. Environ. Dev. Sustain. 2024, 26, 28367–28388. [Google Scholar] [CrossRef] [Scilit]
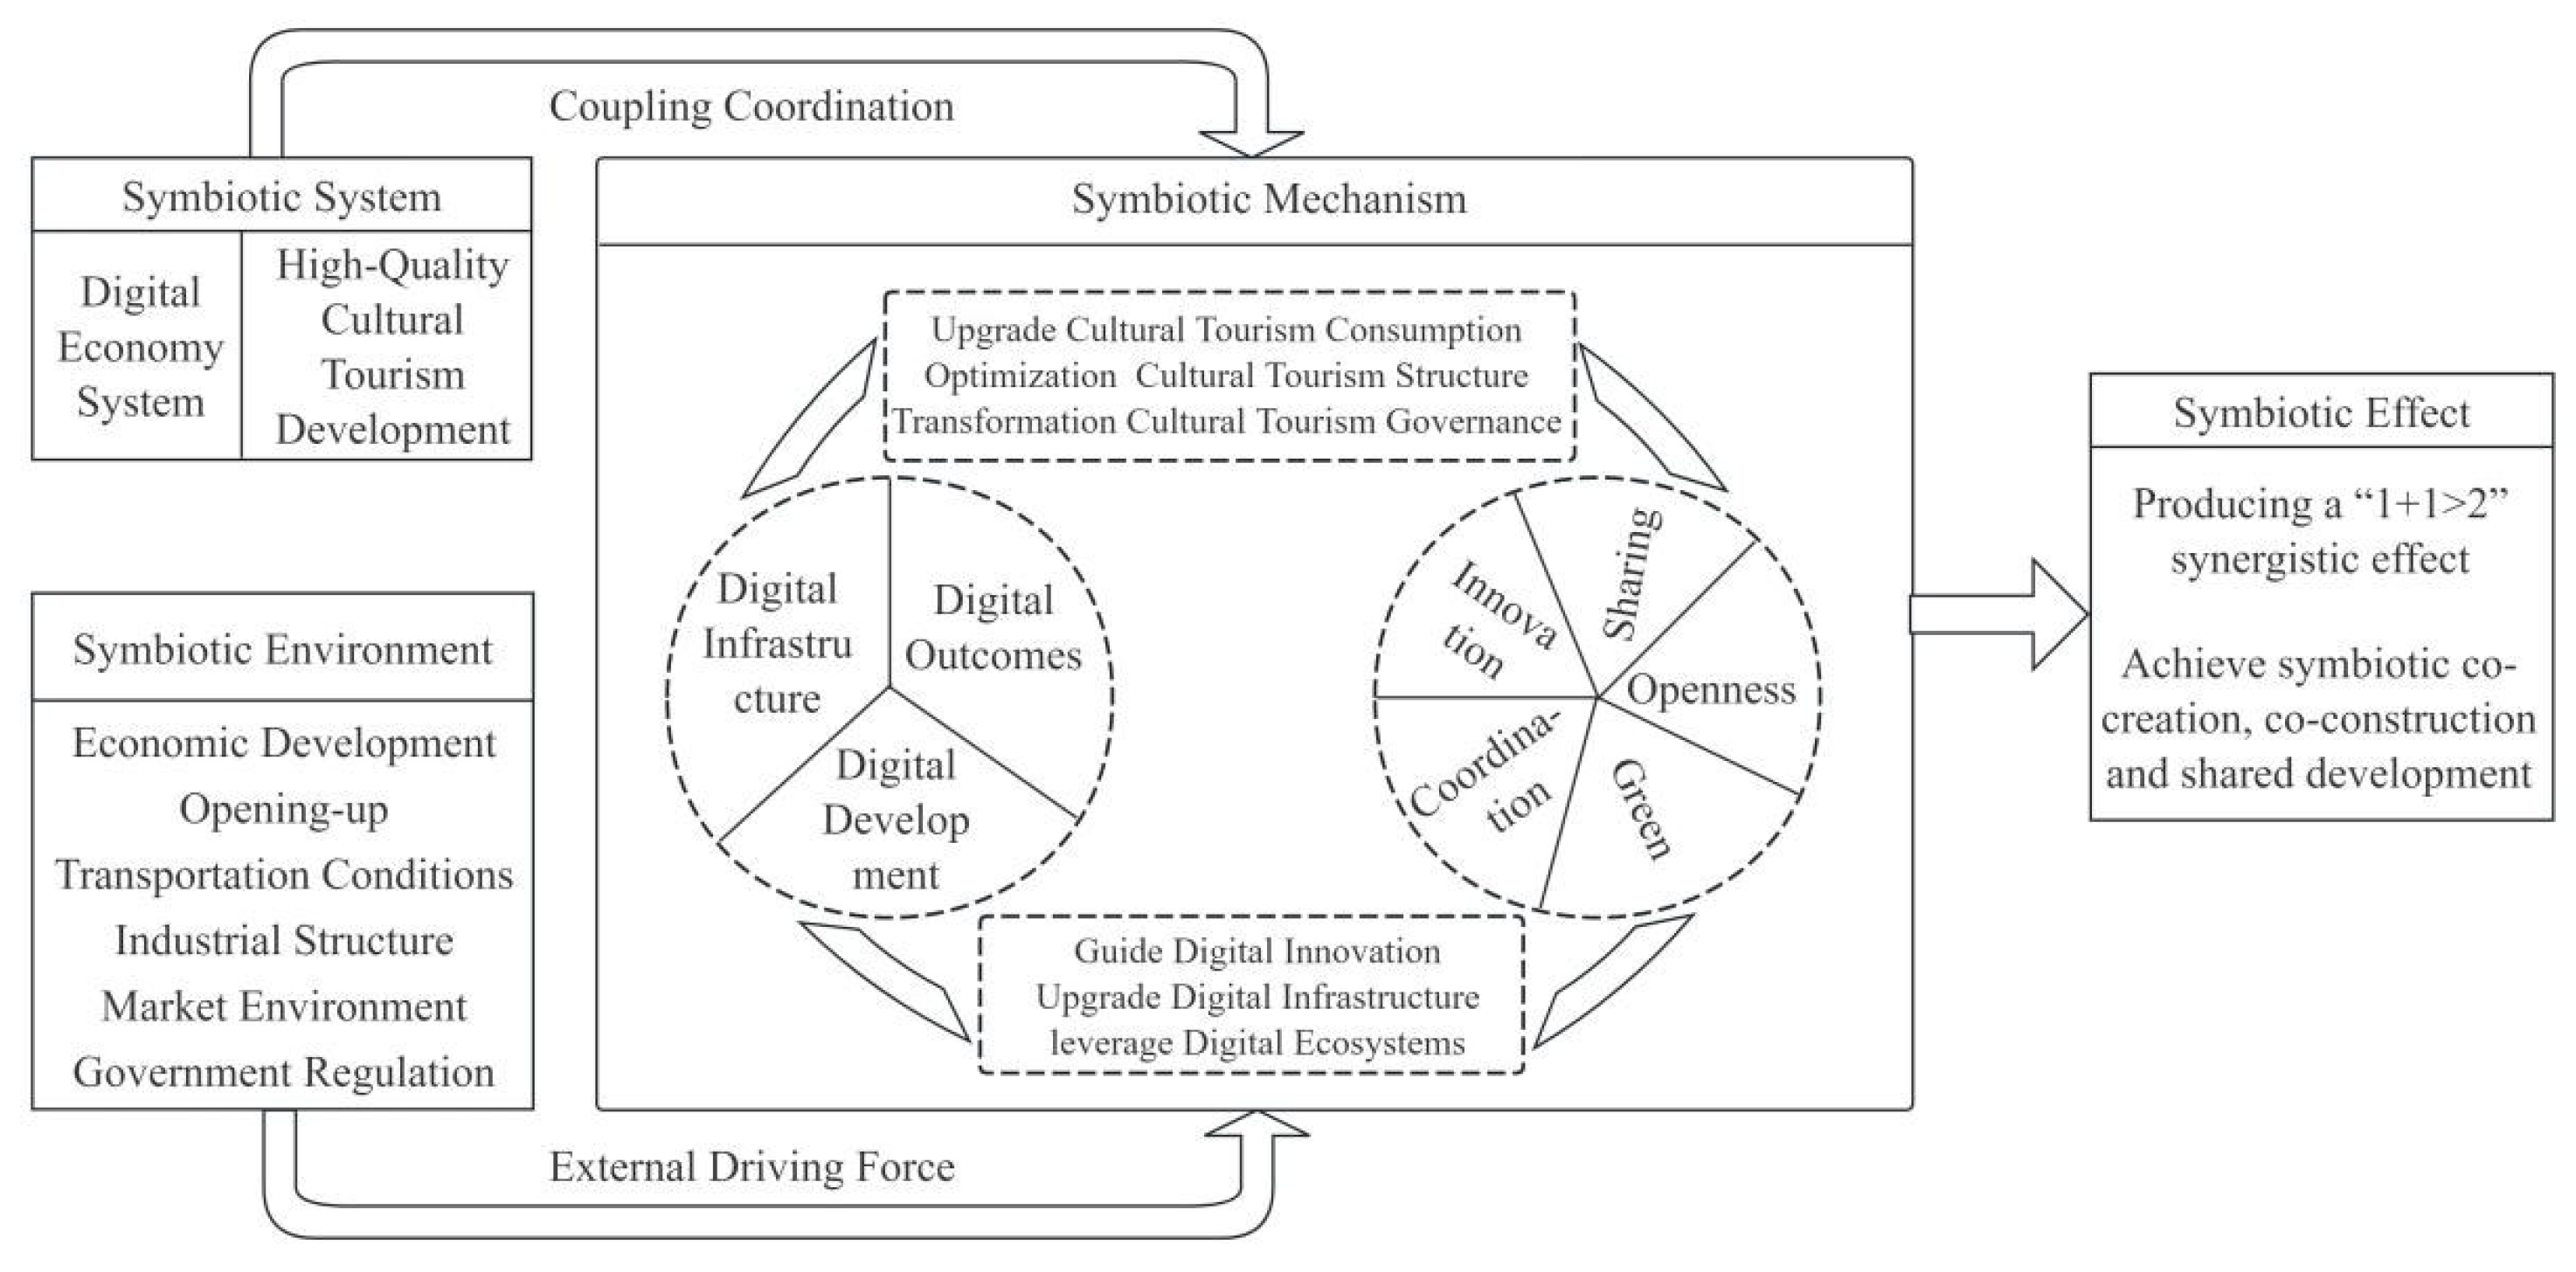
Figure 1. Mechanism of the symbiotic relationship between the DE and HQCTD.
Sustainability 18 05684 g001
Figure 2. Overview map of the study area.
Sustainability 18 05684 g002
Figure 3. Line chart of DE development levels.
Sustainability 18 05684 g003
Figure 4. Radar chart of DE development levels.
Sustainability 18 05684 g004
Figure 5. Line chart of HQCTD levels.
Sustainability 18 05684 g005
Figure 6. Radar chart of HQCTD levels.
Sustainability 18 05684 g006
Figure 7. Evolutionary trends in the coupling coordination of the DE and HQCTD.
Sustainability 18 05684 g007
Figure 8. Spatial distribution map of CCD types between the DE and HQCTD.
Sustainability 18 05684 g008
Figure 9. SDE of CCD and CGT, 2014–2023.
Sustainability 18 05684 g009
Figure 10. Multi-factor interaction detection map.
Sustainability 18 05684 g010
Table 1. Indicator systems for the DE and HQCTD.
System LevelCriterion LevelIndicator LevelIndicator DirectionIndicator WeightReferences
DE
system
Digital InfrastructureX1: Internet Broadband Penetration Rate (%)0.0300Positive[29]
X2: Mobile Phone Penetration Rate (%)0.0364Positive[29]
X3: General Public Budget Expenditure on Science and Technology (10,000 RMB)0.1956Positive[30]
X4: Proportion of R&D Expenditure (%)0.0475Positive[31]
Digital DevelopmentX5: Postal Service Revenue (10,000 RMB)0.1508Positive[31]
X6: Total Output Value of the Telecommunications Industry (10,000 RMB)0.1344Positive[29]
X7: Education Expenditure (10,000 RMB)0.0312Positive[32]
X8: Number of Employees in Scientific Research and Technical Services (10,000 persons)0.1421Positive[30]
Digital OutcomesX9: Digital Economy Innovation and Entrepreneurship Index0.0213Positive[30]
X10: Invention Patent Authorization Rate (%)0.0408Positive[13]
X11: E-commerce Transaction Volume (10,000 RMB)0.1521Positive[30]
X12: Digitalization Index of Digital Inclusive Finance0.0178Positive[31]
HQCTD
system
InnovationY1: Number of Students Enrolled in Regular Higher Education Institutions (1000 persons)0.2021Positive[33]
Y2: Number of Regular Higher Education Institutions (units)0.1898Positive[33]
CoordinationY3: Urban–Rural Income Ratio (times)0.0239Negative[33]
Y4: Proportion of Tourism Revenue in Regional GDP (%)0.0331Positive[34]
Green
development
Y5: Urban Green Coverage Area (hectares)0.1093Positive[32]
Y6: Proportion of Days with Good Air Quality (%)0.0557Positive[35]
Y7: Sewage Treatment Rate (%)0.0041Positive[13]
Y8: Harmless Treatment Rate of Domestic Waste (%)0.0060Positive[13]
OpennessY9: Number of Tourist Visits (10,000 person-times)0.0463Positive[32]
Y10: Tourism Revenue (100 million RMB)0.0554Positive[32]
SharingY11: Number of Public Libraries (units)0.0567Positive[32]
Y12: Number of Museums (units)0.0607Positive[13]
Y13: Number of Parks (units)0.1269Positive[13]
Y14: Road Area (10,000 m2)0.0301Positive[29]
Table 2. Classification criteria for CCD Levels.
No.Development StageCCDCCD LevelValue Range
01Dysregulation Stage[0, 0.1)Extreme mismatch0 ≤ D < 0.4
02[0.1, 0.2)Severe imbalance
03[0.2, 0.3)Moderate imbalance
04[0.3, 0.4)Mild dysregulation
05Transitional stage[0.4, 0.5)Borderline0.4 ≤ D < 0.6
06[0.5, 0.6)Barely coordinated
07Harmonious phase[0.6, 0.7)Early coordination0.6 ≤ D ≤ 1.0
08[0.7, 0.8)Intermediate coordination
09[0.8, 0.9)Good coordination
10[0.9, 1.0)Excellently coordinated
Table 3. Identification and types of interaction detection.
CriteriaInteraction Type
q(Xm∩Xn) < Min(q(Xm), q(Xn))nonlinear weaken
Min(q(Xm), q(Xn)) < q(Xm∩Xn) < Max(q(Xm), q(Xn))single-factor nonlinear weaken
q(Xm∩Xn) > Max(q(Xm), q(Xn))bivariate enhancement
q(Xm∩Xn) = q(Xm) + q(Xn)independence
q(Xm∩Xn) > q(Xm) + q(Xn)nonlinear enhancement
Table 4. Parameters for the SDE of CCD.
YearLongitudeLatitudeSemi-Major Axis/mMinor Axis/mAzimuth
2014112.43237.46581,842.44236,794.1711.069
2017112.4337.48382,237.88237,158.2411.129
2020112.40637.49481,751.6235,209.6611.536
2023112.41737.48581,692.35234,122.5511.405
Table 5. Major obstacle factors and obstacle levels (%) for the DE and HQCTD.
CityDE System (Obstacle Degree %)HQCTD System (Obstacle Level %)
First Obstacle FactorSecond Obstacle FactorThird Obstacle FactorFirst Obstacle FactorSecond Barrier FactorThird Obstacle Factor
TaiyuanX6 (21.08)X11 (20.35)X3 (17.26)Y6 (20.05)Y13 (12.84)Y12 (10.83)
DatongX3 (22.93)X11 (17.73)X5 (15.75)Y1 (26.03)Y2 (23.38)Y13 (14.25)
YangquanX3 (22.7)X11 (18.02)X5 (16.97)Y1 (23.19)Y2 (21.58)Y13 (11.82)
ChangzhiX3 (23.08)X11 (18.34)X5 (16.78)Y1 (24.46)Y2 (23.35)Y13 (15.6)
JinchengX3 (22.24)X11 (18.28)X5 (16.82)Y1 (24.87)Y2 (23.06)Y5 (11.45)
ShuozhouX3 (21.72)X11 (17.14)X5 (16.16)Y1 (22.6)Y2 (21.69)Y13 (13.39)
XinzhouX3 (22.68)X11 (18.07)X5 (14.68)Y1 (24.69)Y2 (22.83)Y13 (15.28)
LüliangX3 (22.77)X11 (17.64)X5 (16.14)Y1 (24.68)Y2 (22.2)Y13 (13.61)
JinzhongX3 (22.57)X11 (18.05)X5 (16.38)Y1 (22.32)Y2 (19.37)Y13 (18.99)
LinfenX3 (23.59)X11 (18.17)X5 (16.1)Y1 (24.76)Y2 (23.28)Y13 (15.29)
YunchengX3 (23.86)X11 (17.57)X5 (15.27)Y1 (25.36)Y2 (24.18)Y13 (16.56)
Table 6. Obstacle degree of the criterion layer for the DE and HQCTD.
YearDE System (Obstacle Level, %)HQCTD System (Obstacle Level, %)
Digital InfrastructureDigital DevelopmentDigital OutcomesInnovationCoordinationGreen
Development
OpennessSharingVitality
Taiyuan33.4840.7625.7612.224.6323.9718.8540.3312.22
Datong31.3246.6322.0549.414.5114.88.6822.6149.41
Yangquan30.2946.8322.8844.783.6515.619.6126.3544.78
Changzhi30.746.9722.3247.83.4417.148.9622.6547.8
Jincheng29.0348.1422.8347.933.3616.988.3823.3447.93
Shuozhou31.1746.7122.1244.294.0815.6710.1125.8644.29
Xinzhou32.4945.0122.547.524.9718.388.7220.4147.52
Lüliang32.3645.6621.9846.884.617.538.9822.0146.88
Jinzhong31.1946.5822.2341.683.3519.027.928.0441.68
Linfen31.5545.3823.0748.043.8218.848.5520.7648.04
Yuncheng32.0745.6622.2649.544.314.748.9222.549.54
Table 7. Single-factor detection table.
Influencing Factorq-ValueMeanRank
2014201720202023
Z10.1905 ***0.1600 ***0.1655 ***0.2768 ***0.1982 ***6
Z20.7447 ***0.7763 ***0.7224 ***0.6899 ***0.7333 ***2
Z30.4230 ***0.8162 ***0.8391 ***0.7702 ***0.7121 ***3
Z40.7629 ***0.7615 ***0.7708 ***0.7165 ***0.7530 ***1
Z50.7797 ***0.2875 ***0.8348 ***0.8594 ***0.6904 ***4
Z60.3188 ***0.3469 ***0.4060 ***0.3922 ***0.3660 ***5
Note: *** indicates p < 0.01.
Disclaimer/Publisher’s Note: The statements, opinions and data contained in all publications are solely those of the individual author(s) and contributor(s) and not of MDPI and/or the editor(s). MDPI and/or the editor(s) disclaim responsibility for any injury to people or property resulting from any ideas, methods, instructions or products referred to in the content.