1. Introduction
Rapid urbanization has profoundly reshaped urban landscapes, leading to the continuous loss and fragmentation of ecological spaces. Habitat fragmentation, declining landscape connectivity, and ecosystem service degradation have become major challenges to regional ecological security and sustainable development [
1,
2]. In response, ecological security networks (ESNs) have been widely adopted as an effective spatial strategy to reconcile urban expansion with ecological conservation by enhancing connectivity among critical habitats.
Wetlands are among the most valuable ecological assets in urban environments, providing essential ecosystem services such as biodiversity conservation, water purification, flood regulation, and urban climate mitigation [
3]. However, due to their strong dependence on hydrological processes and spatial connectivity, urban wetlands are highly vulnerable to land-use change and infrastructure expansion. Our land-use transfer matrix analysis explicitly quantifies the conversion pathways: 44.49 km
2 of wetlands were directly converted to impervious surfaces between 2004 and 2024, accounting for 9.7% of total wetland loss. This quantitative evidence confirms that urban expansion, rather than agricultural reclamation alone, is the dominant driver of wetland degradation in Wuhan.
Urban wetland ecological structural connectivity refers to the capacity of urban wetland systems to maintain their structural linkages, sustain ecosystem services, and adapt to disturbances from urbanization and climate change. In this study, we focus specifically on the structural prerequisites of connectivity: (1) structural connectivity of ecological sources, (2) network redundancy (via circuit theory and node-removal simulation), and (3) landscape resistance [
4,
5,
6]. Rather than fully simulating long-term ecological recovery dynamics, this study emphasizes the disturbance response characteristics and connectivity maintenance ability of the ecological network under urbanization pressure.
The integration of Morphological Spatial Pattern Analysis (MSPA) and the Minimum Cumulative Resistance (MCR) model has been widely used to construct ecological networks. For example, Hu et al. (2022) applied an MSPA–MCR model to evaluate the ecological network in Wuhan [
7]. Our study builds upon this existing body of work by providing three specific contributions: (i) integrating circuit theory specifically to identify and prioritize pinch points; (ii) incorporating a multi-temporal land-use change analysis (2004–2024) to explicitly link corridor locations with recent urbanization pressure; and (iii) conducting a node-removal robustness analysis to assess network structural redundancy—an aspect rarely addressed in static connectivity studies. MSPA identifies core habitat patches and key landscape structures [
8,
9,
10], while the MCR model simulates species movement by quantifying landscape resistance [
11,
12]. In addition, circuit theory has been increasingly applied to identify multiple movement pathways and assess corridor importance. Although these approaches are primarily designed for ecological network identification, they can be explicitly linked to structural connectivity assessment: MSPA captures the structural connectivity of ecological sources, the MCR model reflects landscape resistance and movement constraints, and circuit theory reveals alternative pathways and network redundancy. Together, these methods provide a quantitative framework for operationalizing the three dimensions of urban wetland ecological structural connectivity.
Nevertheless, existing studies have mainly focused on forest ecosystems or large-scale green infrastructure, with limited attention to urban wetland systems and their structural connectivity under rapid land-use change. Moreover, most studies emphasize static network structures constructed from single-period land-use data, with insufficient consideration of how multi-temporal land-use dynamics reshape the spatial configuration of wetland ecological networks. To address this gap, this study incorporates multi-temporal land-use data (2004, 2014, 2024) to characterize wetland loss and fragmentation patterns, providing a temporal context for interpreting the static ecological network identified from the most recent land-use data.
Wuhan, a rapidly urbanizing megacity located in the middle reaches of the Yangtze River, is characterized by abundant wetland resources and is often referred to as the “City of a Hundred Lakes.” However, accelerated urban expansion has resulted in significant wetland loss, increased fragmentation, and declining connectivity. These pressures underscore the urgent need to construct a wetland ecological network and evaluate its structural connectivity under urbanization.
To address these issues, this study moves beyond static network mapping to ask the following question: how does the structural configuration of Wuhan’s wetland network constrain or maintain ecological flows under urbanization pressure? Specifically, we test two ecological hypotheses: (i) that high-resistance urban barriers (e.g., ring roads) create functional bottlenecks that reduce the probability of waterbird movement between core foraging and roosting sites; and (ii) that network robustness to node removal is uneven, with a few large lakes acting as “ecological irreplaceables.” Thus, our objectives are not merely to identify corridors, but to (1) quantify functional connectivity using dispersal-sensitive metrics (dPC), (2) locate operational pinch points where ecological flow is both concentrated and vulnerable, and (3) assess structural connectivity under simulated loss of key habitats.
4. Result
4.1. Spatiotemporal Patterns of Land-Use Change
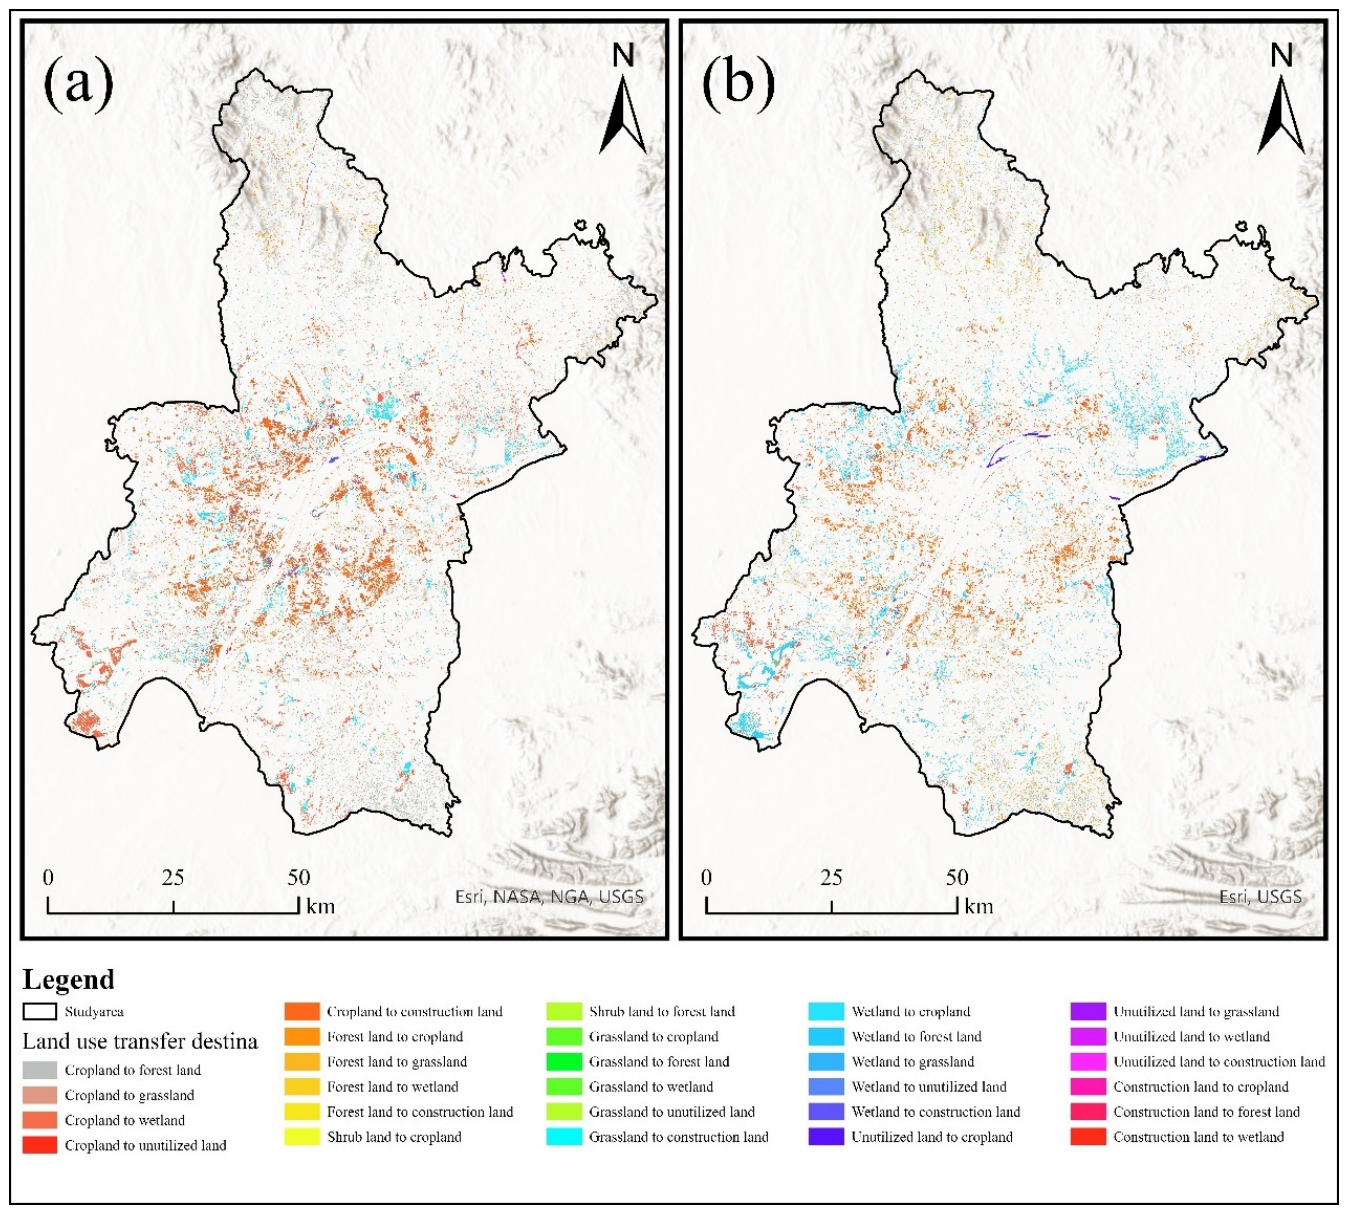
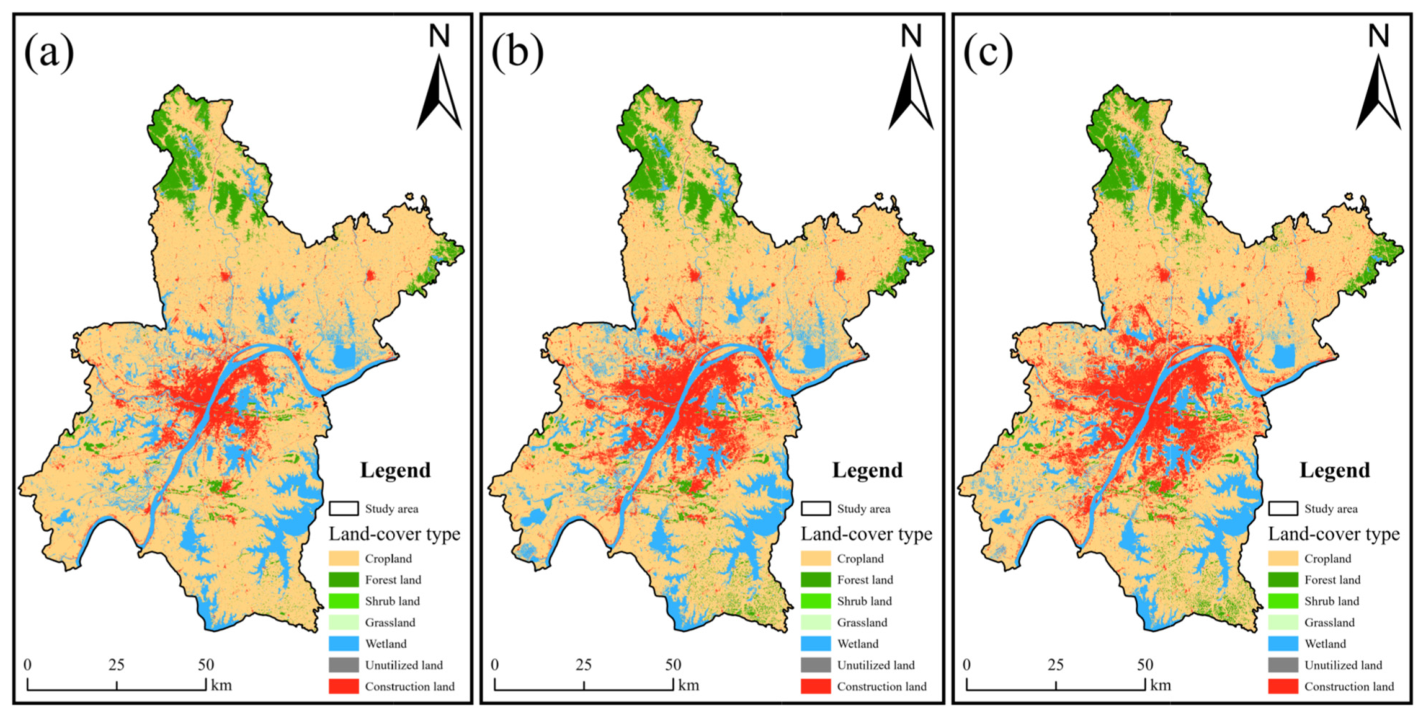
Significant changes in land-use patterns occurred in Wuhan between 2004 and 2024, primarily characterized by rapid urban expansion and continuous wetland loss (
Figure 3). Construction land expanded outward from the urban core toward the surrounding suburban areas, particularly around the Third Ring Road, forming a clear spatial pattern of urban sprawl. Meanwhile, wetland areas showed noticeable shrinkage and fragmentation, especially in peri-urban zones where development pressure was most intense.
Spatial analysis of land-use change hotspots indicates that these areas are mainly distributed along the Third Ring Road and newly developed urban zones. These areas represent key zones where rapid land transformation may interfere with landscape connectivity and future ecological corridor construction. Overall, the results indicate that land-use change has significantly altered the spatial configuration of wetlands and constitutes an important driver influencing regional ecological security.
From the land-use transfer matrix (
Table 4), we extracted the specific conversion pathways related to wetland loss. Between 2004 and 2024, a total of 413.02 km
2 of wetlands were converted to cropland, while 278.9 km
2 of cropland reverted to wetlands, resulting in a net wetland loss of 134.12 km
2 through agricultural conversion. More critically, 26.20 km
2 of wetlands were directly converted to construction land during 2004–2014, and an additional 18.29 km
2 during 2014–2024, totaling 44.49 km
2 of wetland loss due to urbanization over the two decades. In contrast, only 8.98 km
2 of construction land reverted to wetlands in the first decade and 3.36 km
2 in the second decade, indicating that wetland-to-urban conversion is nearly irreversible.
The spatial distribution of wetland-to-urban conversion hotspots (
Figure 4) aligns closely with the expansion of the Third Ring Road and new development zones, confirming that rapid urbanization is the primary driver of wetland degradation in Wuhan.
4.2. Wetland Landscape Pattern and Ecological Source Identification
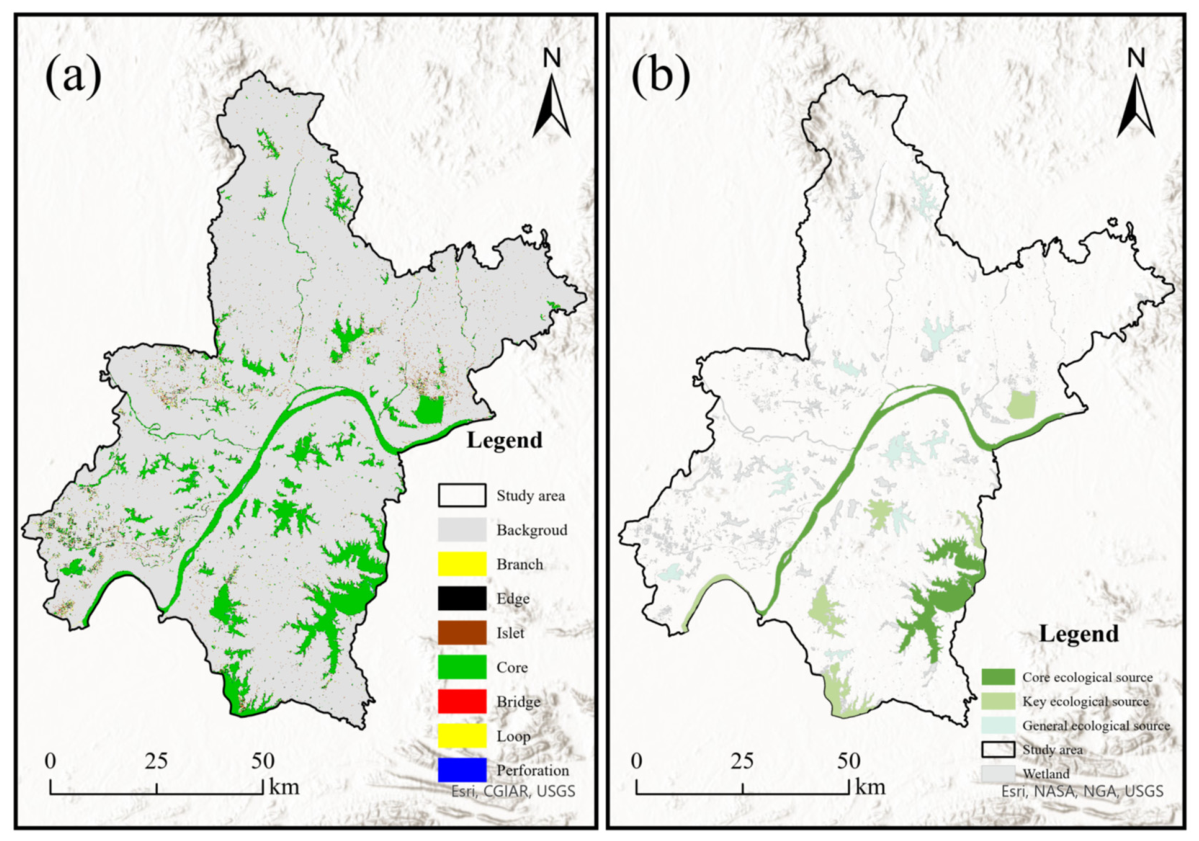
Morphological Spatial Pattern Analysis (MSPA) was applied to identify wetland landscape elements in the study area (
Figure 5). The results show that the total wetland ecological space covers 1103.26 km
2, accounting for 12.85% of the total area. Among the MSPA landscape elements, core areas dominate the wetland landscape, covering 866.25 km
2 (78.52%), indicating that large wetland patches remain the primary carriers of regional ecological functions (
Table 5).
Edge areas account for 152.92 km
2 (13.86%), while bridge elements occupy 10.33 km
2 (0.94%), functioning as stepping-stone structures that facilitate connectivity between larger habitat patches. Smaller and more isolated landscape elements are also present. The very low proportion of bridge elements indicates that stepping-stone structures facilitating connectivity between larger habitat patches are scarce, suggesting limited structural connectivity within the wetland network. Similarly, loop elements are negligible (3.04 km
2, 0.28%), indicating few alternative pathways that could provide network redundancy. Islet patches occupy 38.97 km
2 (3.53%), and most of these patches are located within urbanized or suburban areas where human disturbances are strong. These isolated patches reflect the increasing fragmentation of wetland landscapes under land-use change. The sensitivity analysis further confirms that the spatial pattern of ecological sources and the overall network structure remains relatively stable under different distance thresholds, supporting the robustness of the selected parameters (
Appendix A,
Table A1).
Based on the MSPA results, the dPC (delta Probability of Connectivity) index was used to further identify ecological source areas (
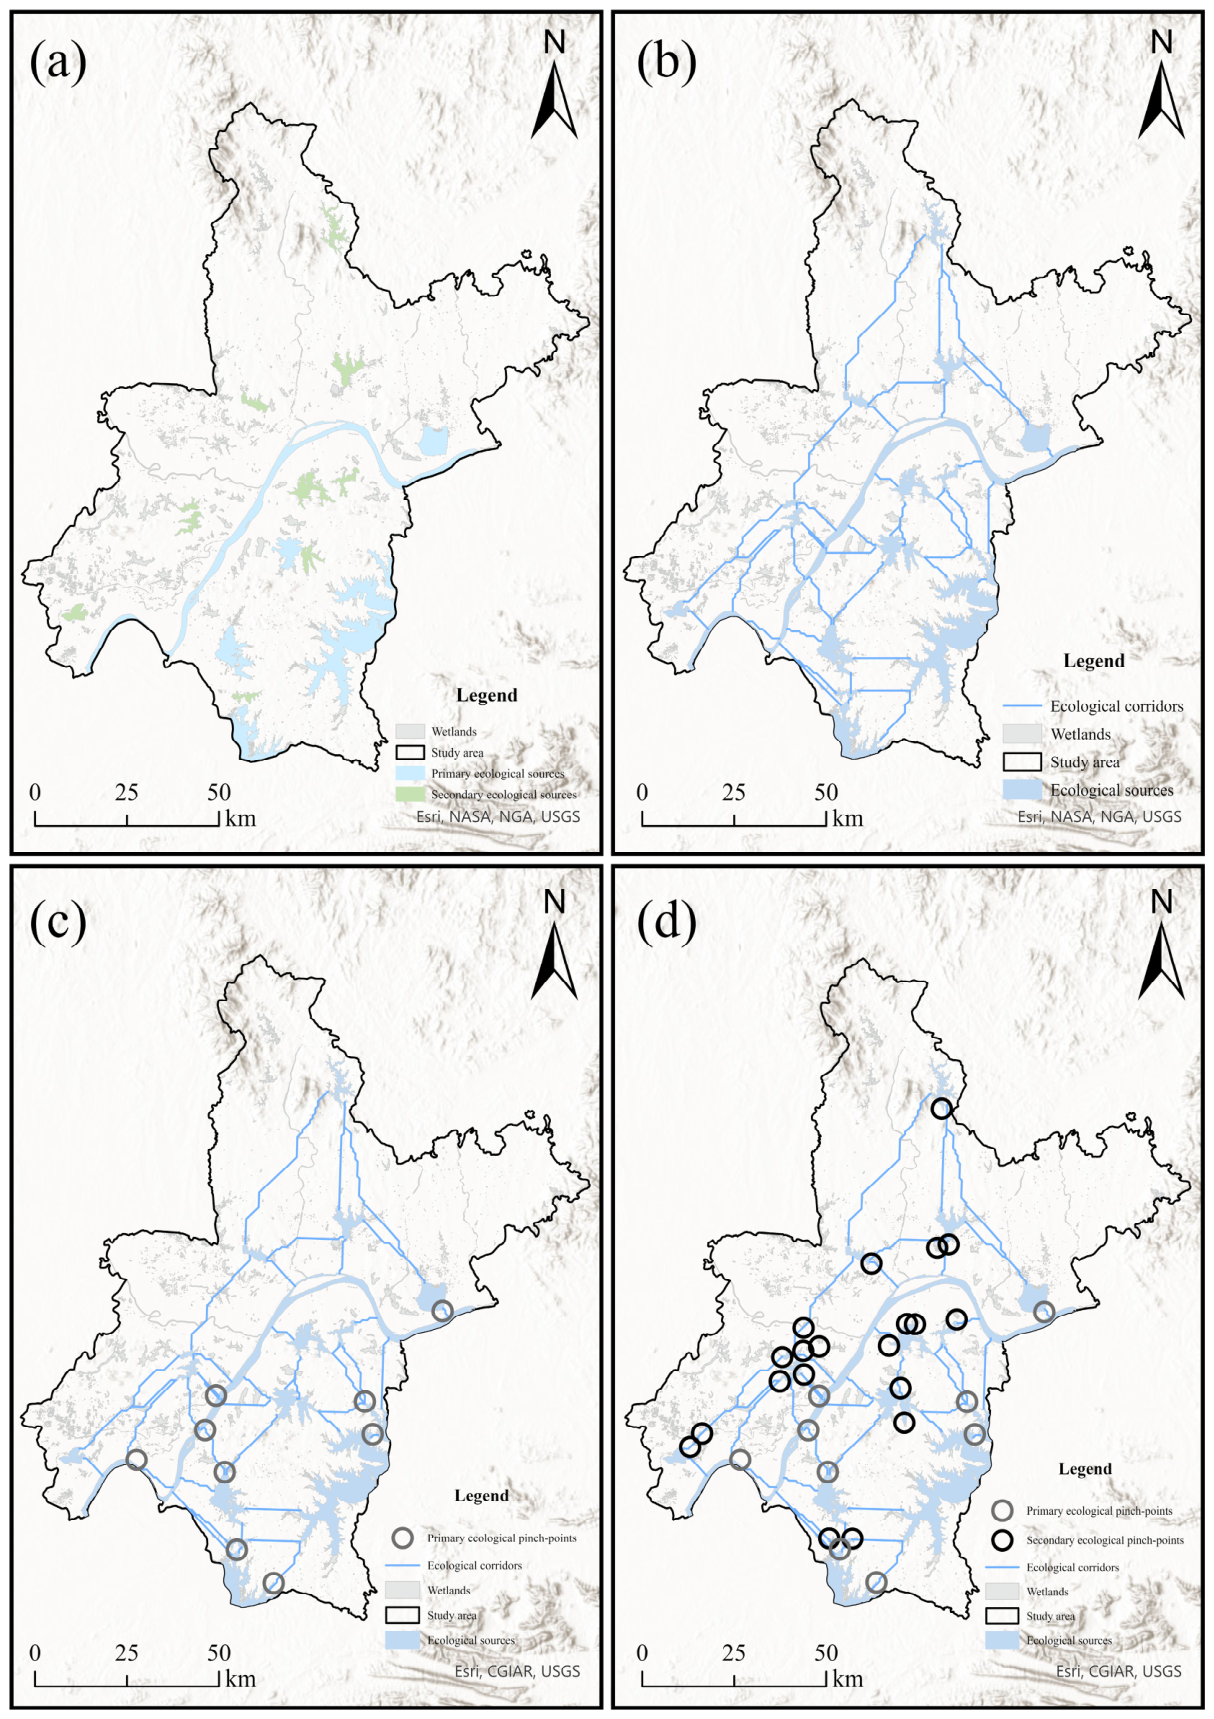
Figure 6). To further improve the objectivity of ecological source classification, the natural breakpoint method (Jenks) was applied to analyze the distribution of dPC values. The results reveal a clear hierarchical structure in connectivity contributions among wetland patches. The algorithm identified breakpoints at dPC = 9.8, 1.2, and 0.15. For ecological interpretability, we rounded these to dPC > 10 (core ecological sources), 1 ≤ dPC < 10 (important ecological sources), and 0.1 ≤ dPC < 1 (general ecological sources). Core and important patches were integrated into primary ecological sources, while general patches were treated as secondary ecological sources due to their relatively smaller connectivity contributions.
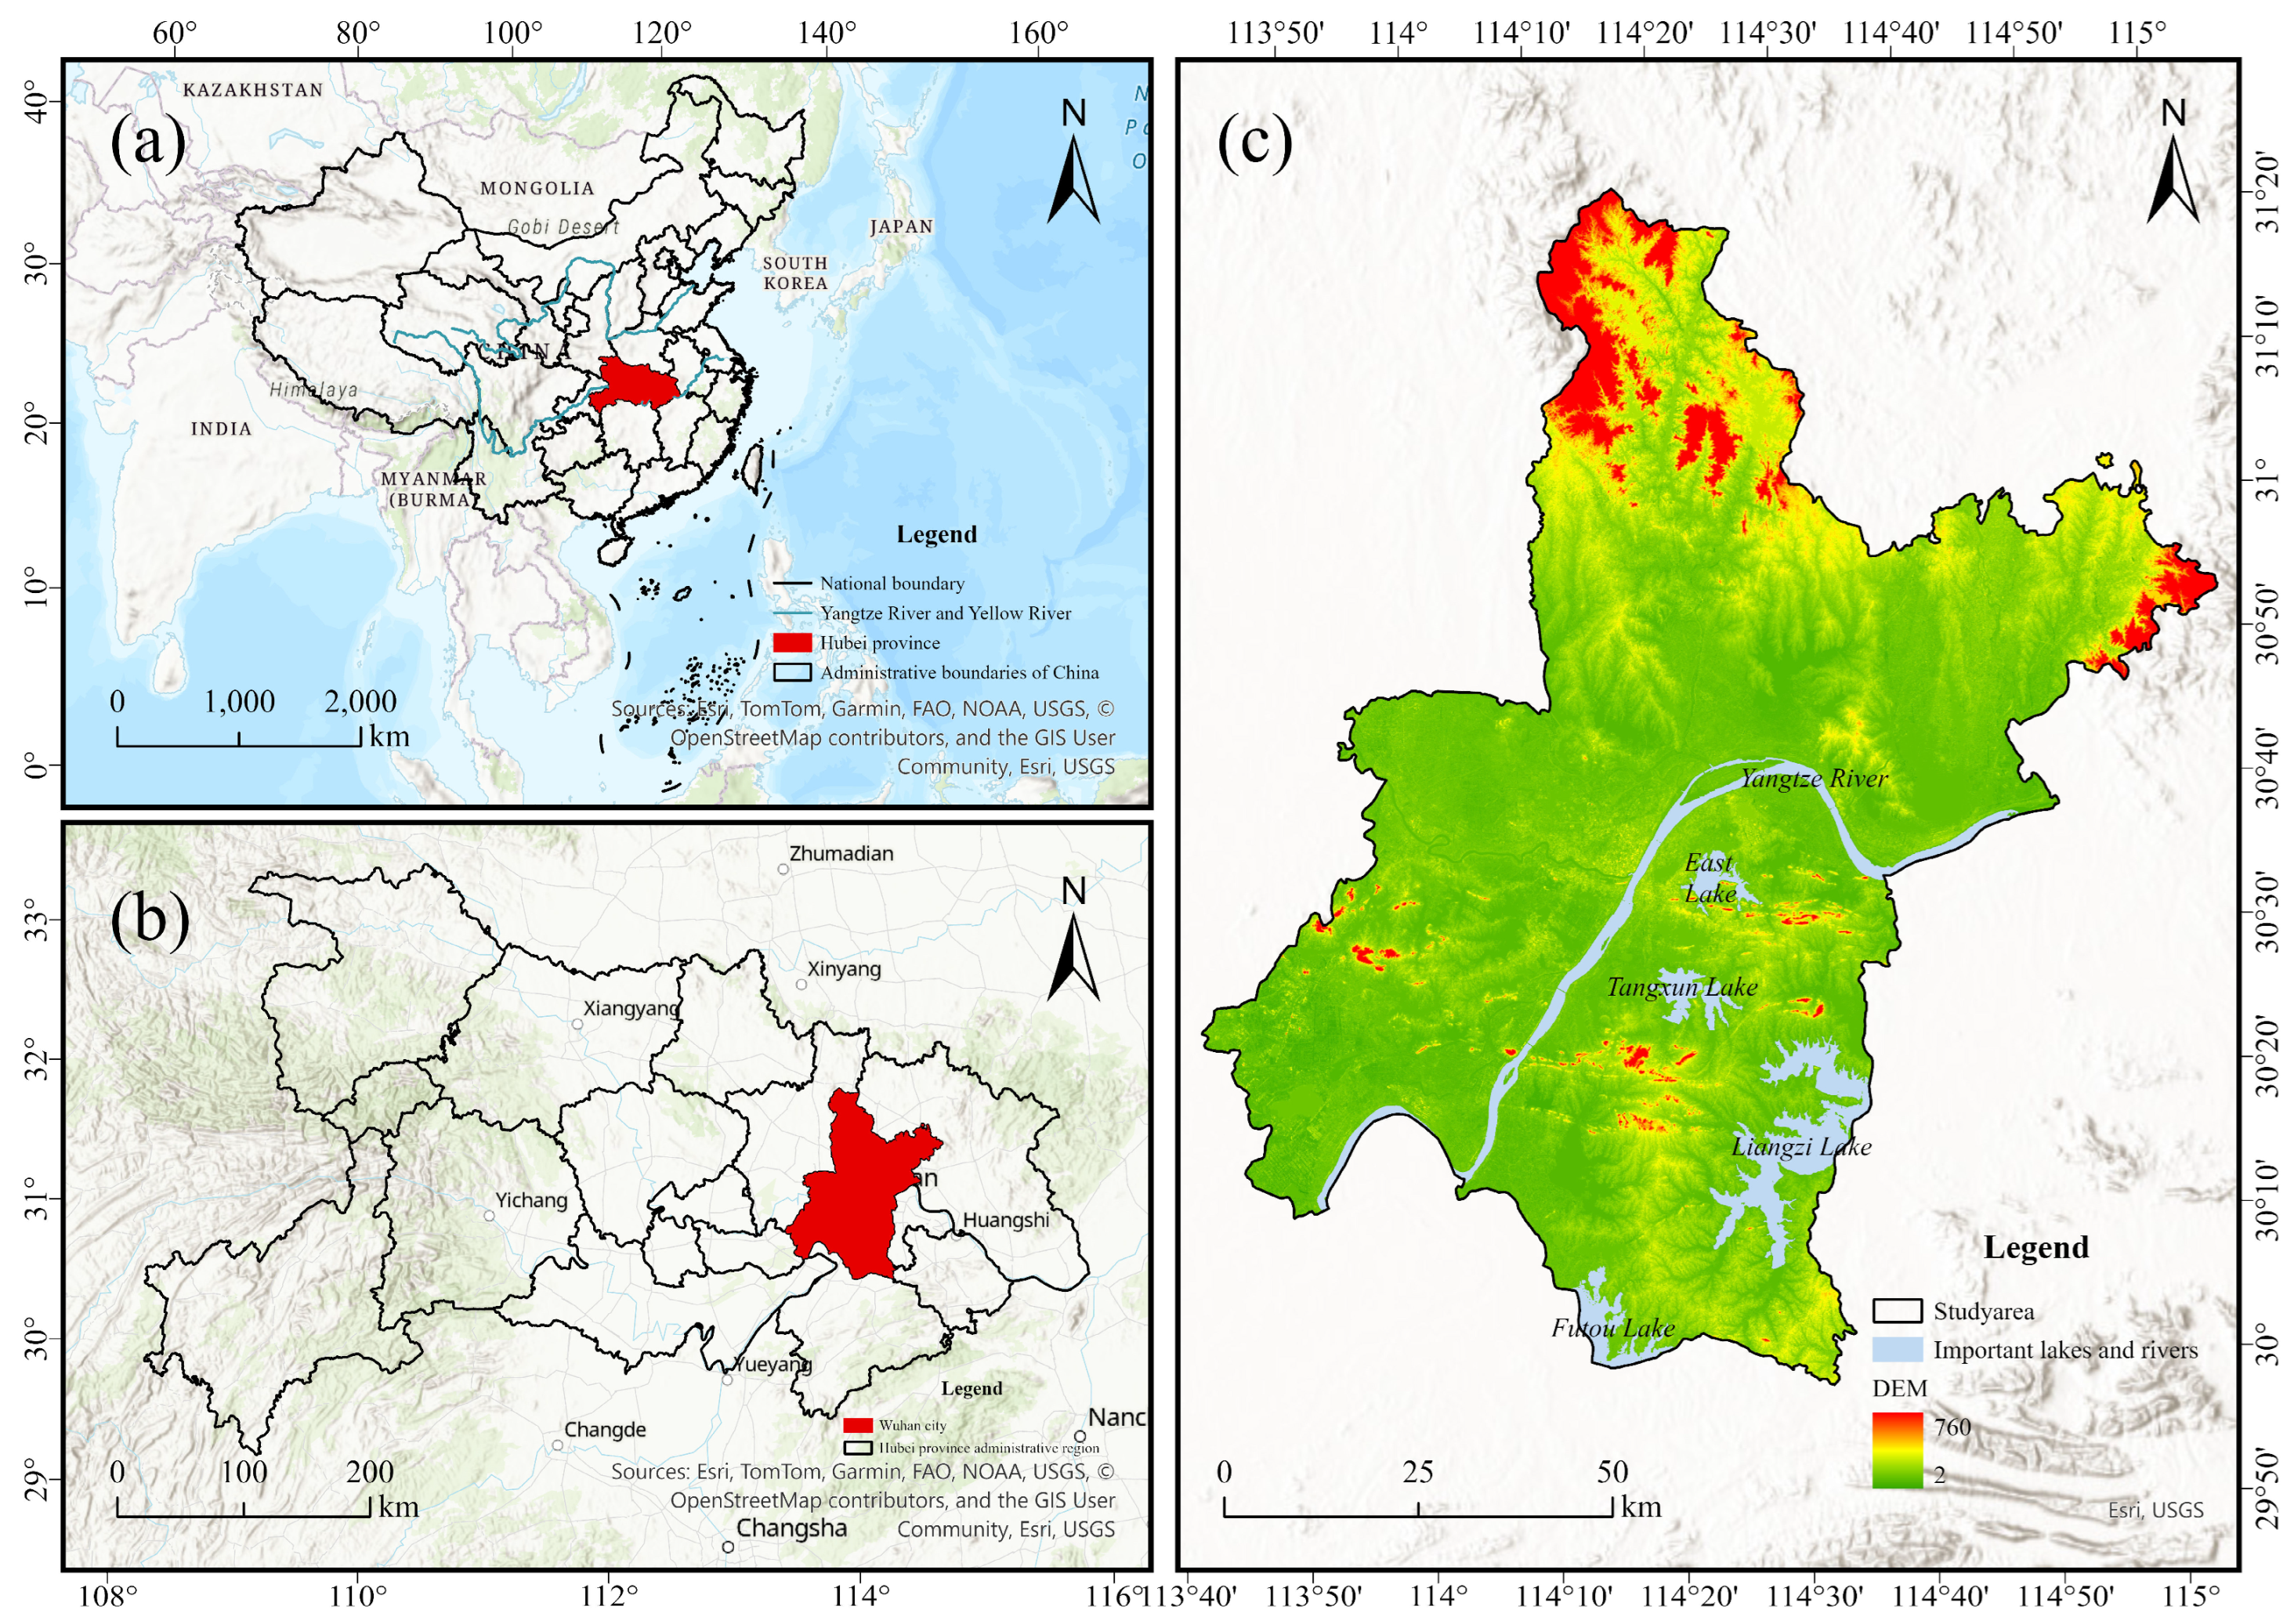
The identified ecological network covers all major wetland habitats mentioned in the study area, including Liangzi Lake, Futou Lake, Tangxun Lake, and the Yangtze-Han River corridor (see
Figure 1). Smaller or isolated wetlands (e.g., Islet patches in MSPA) were not selected as ecological sources due to their limited connectivity contribution (dPC < 0.1), but they may still serve as stepping-stone habitats for local species. The network therefore represents a prioritized subset of critical connectivity hubs rather than an exhaustive map of all wetland patches.
A reclassification of MSPA-identified core areas based on the 2024 CLCD land-cover further distinguishes three functional wetland types: (i) permanent open-water lakes (e.g., Liangzi Lake, Futou Lake; 612.4 km2), which serve as primary waterbird foraging and roosting habitat; (ii) seasonally inundated floodplain meadows (136.8 km2), critical for passage migrants during spring/autumn stopovers; and (iii) riverine wooded wetlands (117.0 km2), dominated by willow and poplar stands, which provide nesting sites for herons and egrets.
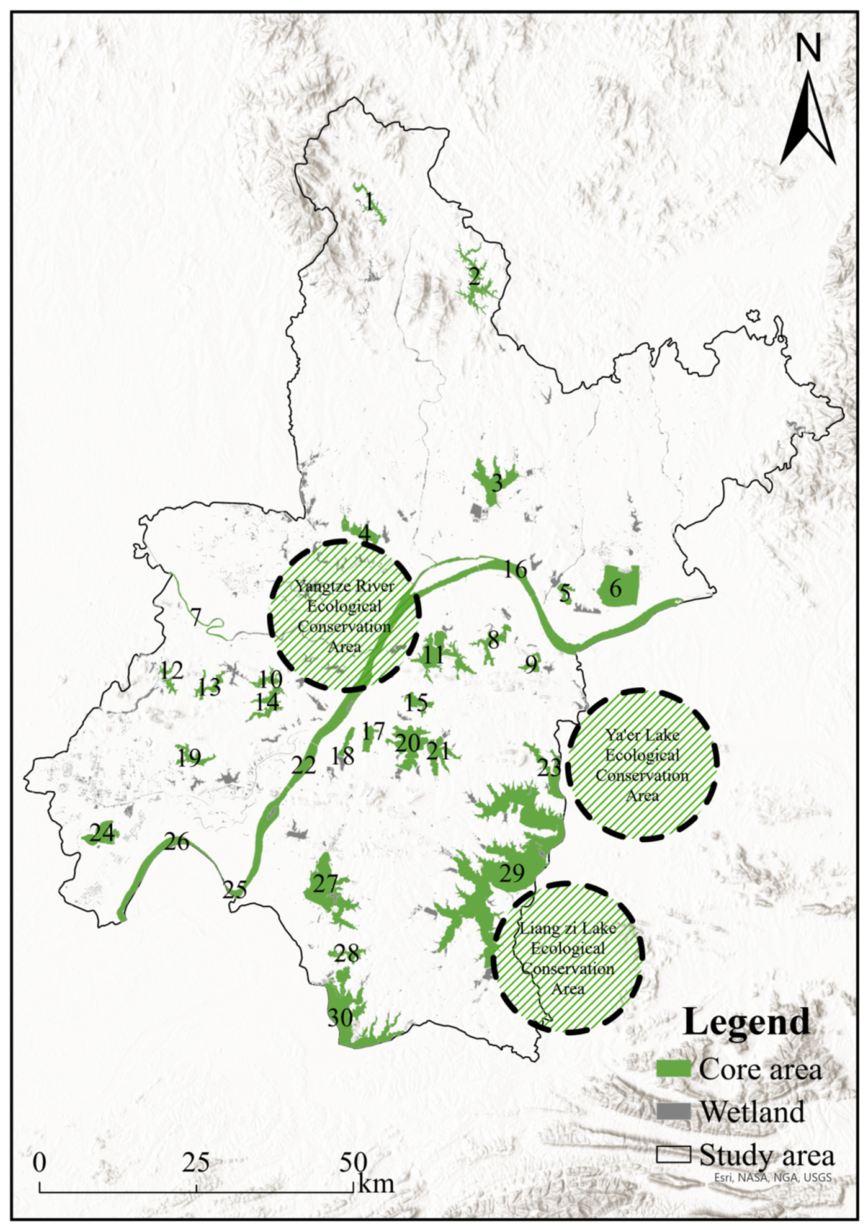
The ranking of wetland patches based on dPC values indicates a highly uneven distribution of connectivity contributions (
Table 6). The Liangzi Lake ecological conservation area (Patch 29) represents the most important ecological source, covering 179.80 km
2 with a dPC value of 50.55. The Yangtze River wetland system, including several major patches (e.g., Patches 16, 22, 25, and 26), also plays a critical role in maintaining regional ecological connectivity. In addition, the Ya’er Lake ecological conservation area (Patch 23) serves as another important ecological source.
Going beyond this aggregate finding, we identified specific stepping-stone patches and priority restoration nodes based on their dPC values and spatial configuration. Patches with intermediate dPC values (1 ≤ dPC < 10), such as Ya’er Lake (Patch 23, dPC = 4.96) and Patch 6 (dPC = 1.77), serve as connectivity stepping-stones that bridge the Yangtze River corridor with peripheral lake systems. Conversely, several islet patches (MSPA classification) located in rapidly urbanizing fringe areas, although exhibiting low dPC (<0.1), represent potential restoration nodes where targeted interventions (e.g., small wetland creation or ecological culverts) could significantly enhance overall network redundancy at relatively low cost. This nuanced classification transforms the statistical observation of connectivity inequality into actionable spatial priorities.
The distribution of dPC values exhibits a strong hierarchical pattern, with a few patches contributing disproportionately to overall connectivity. Notably, patches with dPC > 10 represent the highest connectivity tier and play a dominant role in maintaining network integrity.
The sensitivity analysis results (
Appendix A,
Table A2) further demonstrate that the number and total area of core ecological sources remain stable when the threshold varies between 8 and 10. Even under stricter thresholds (dPC > 15), the identified core patches still represent a consistent subset of the most important connectivity contributors. This indicates that the classification of ecological sources is robust and not highly sensitive to moderate threshold variations.
4.3. Landscape Resistance Surface
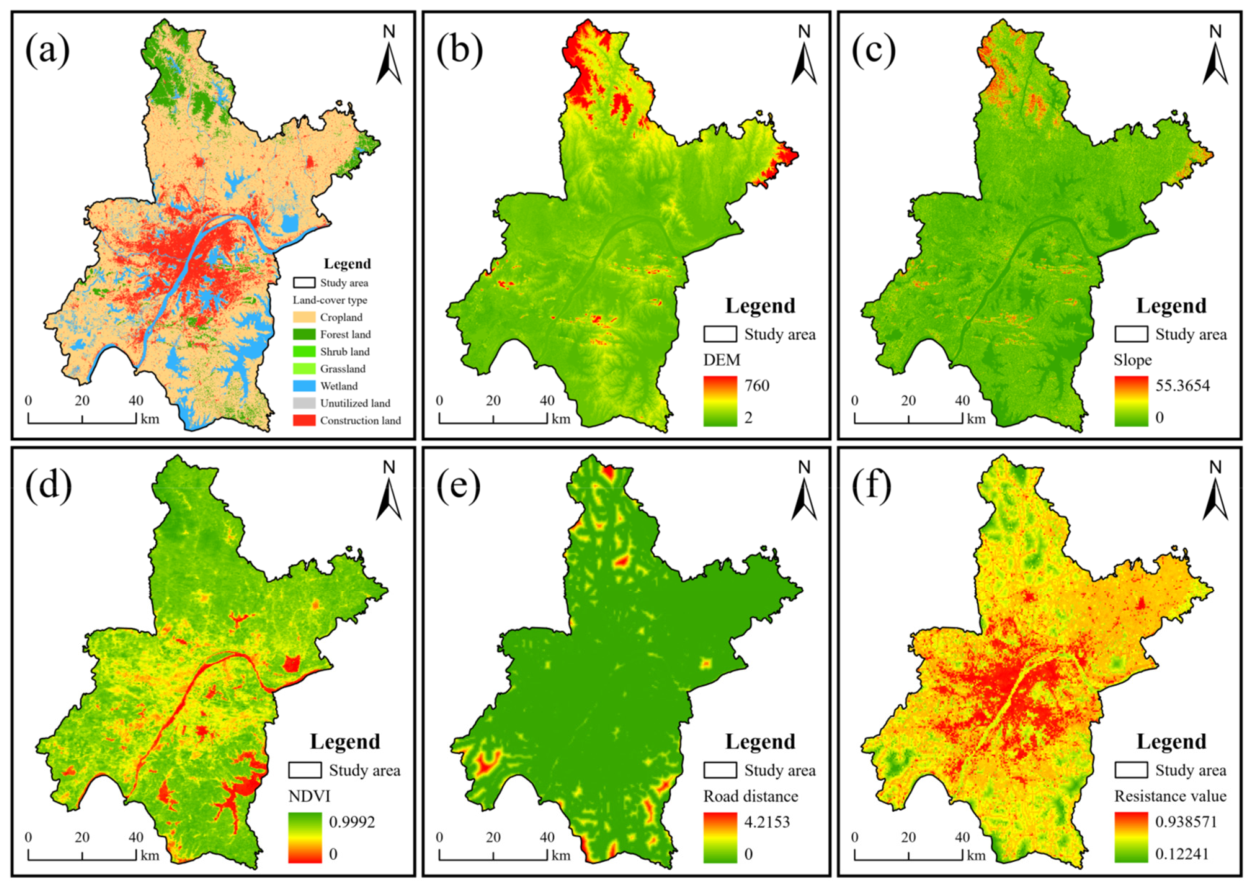
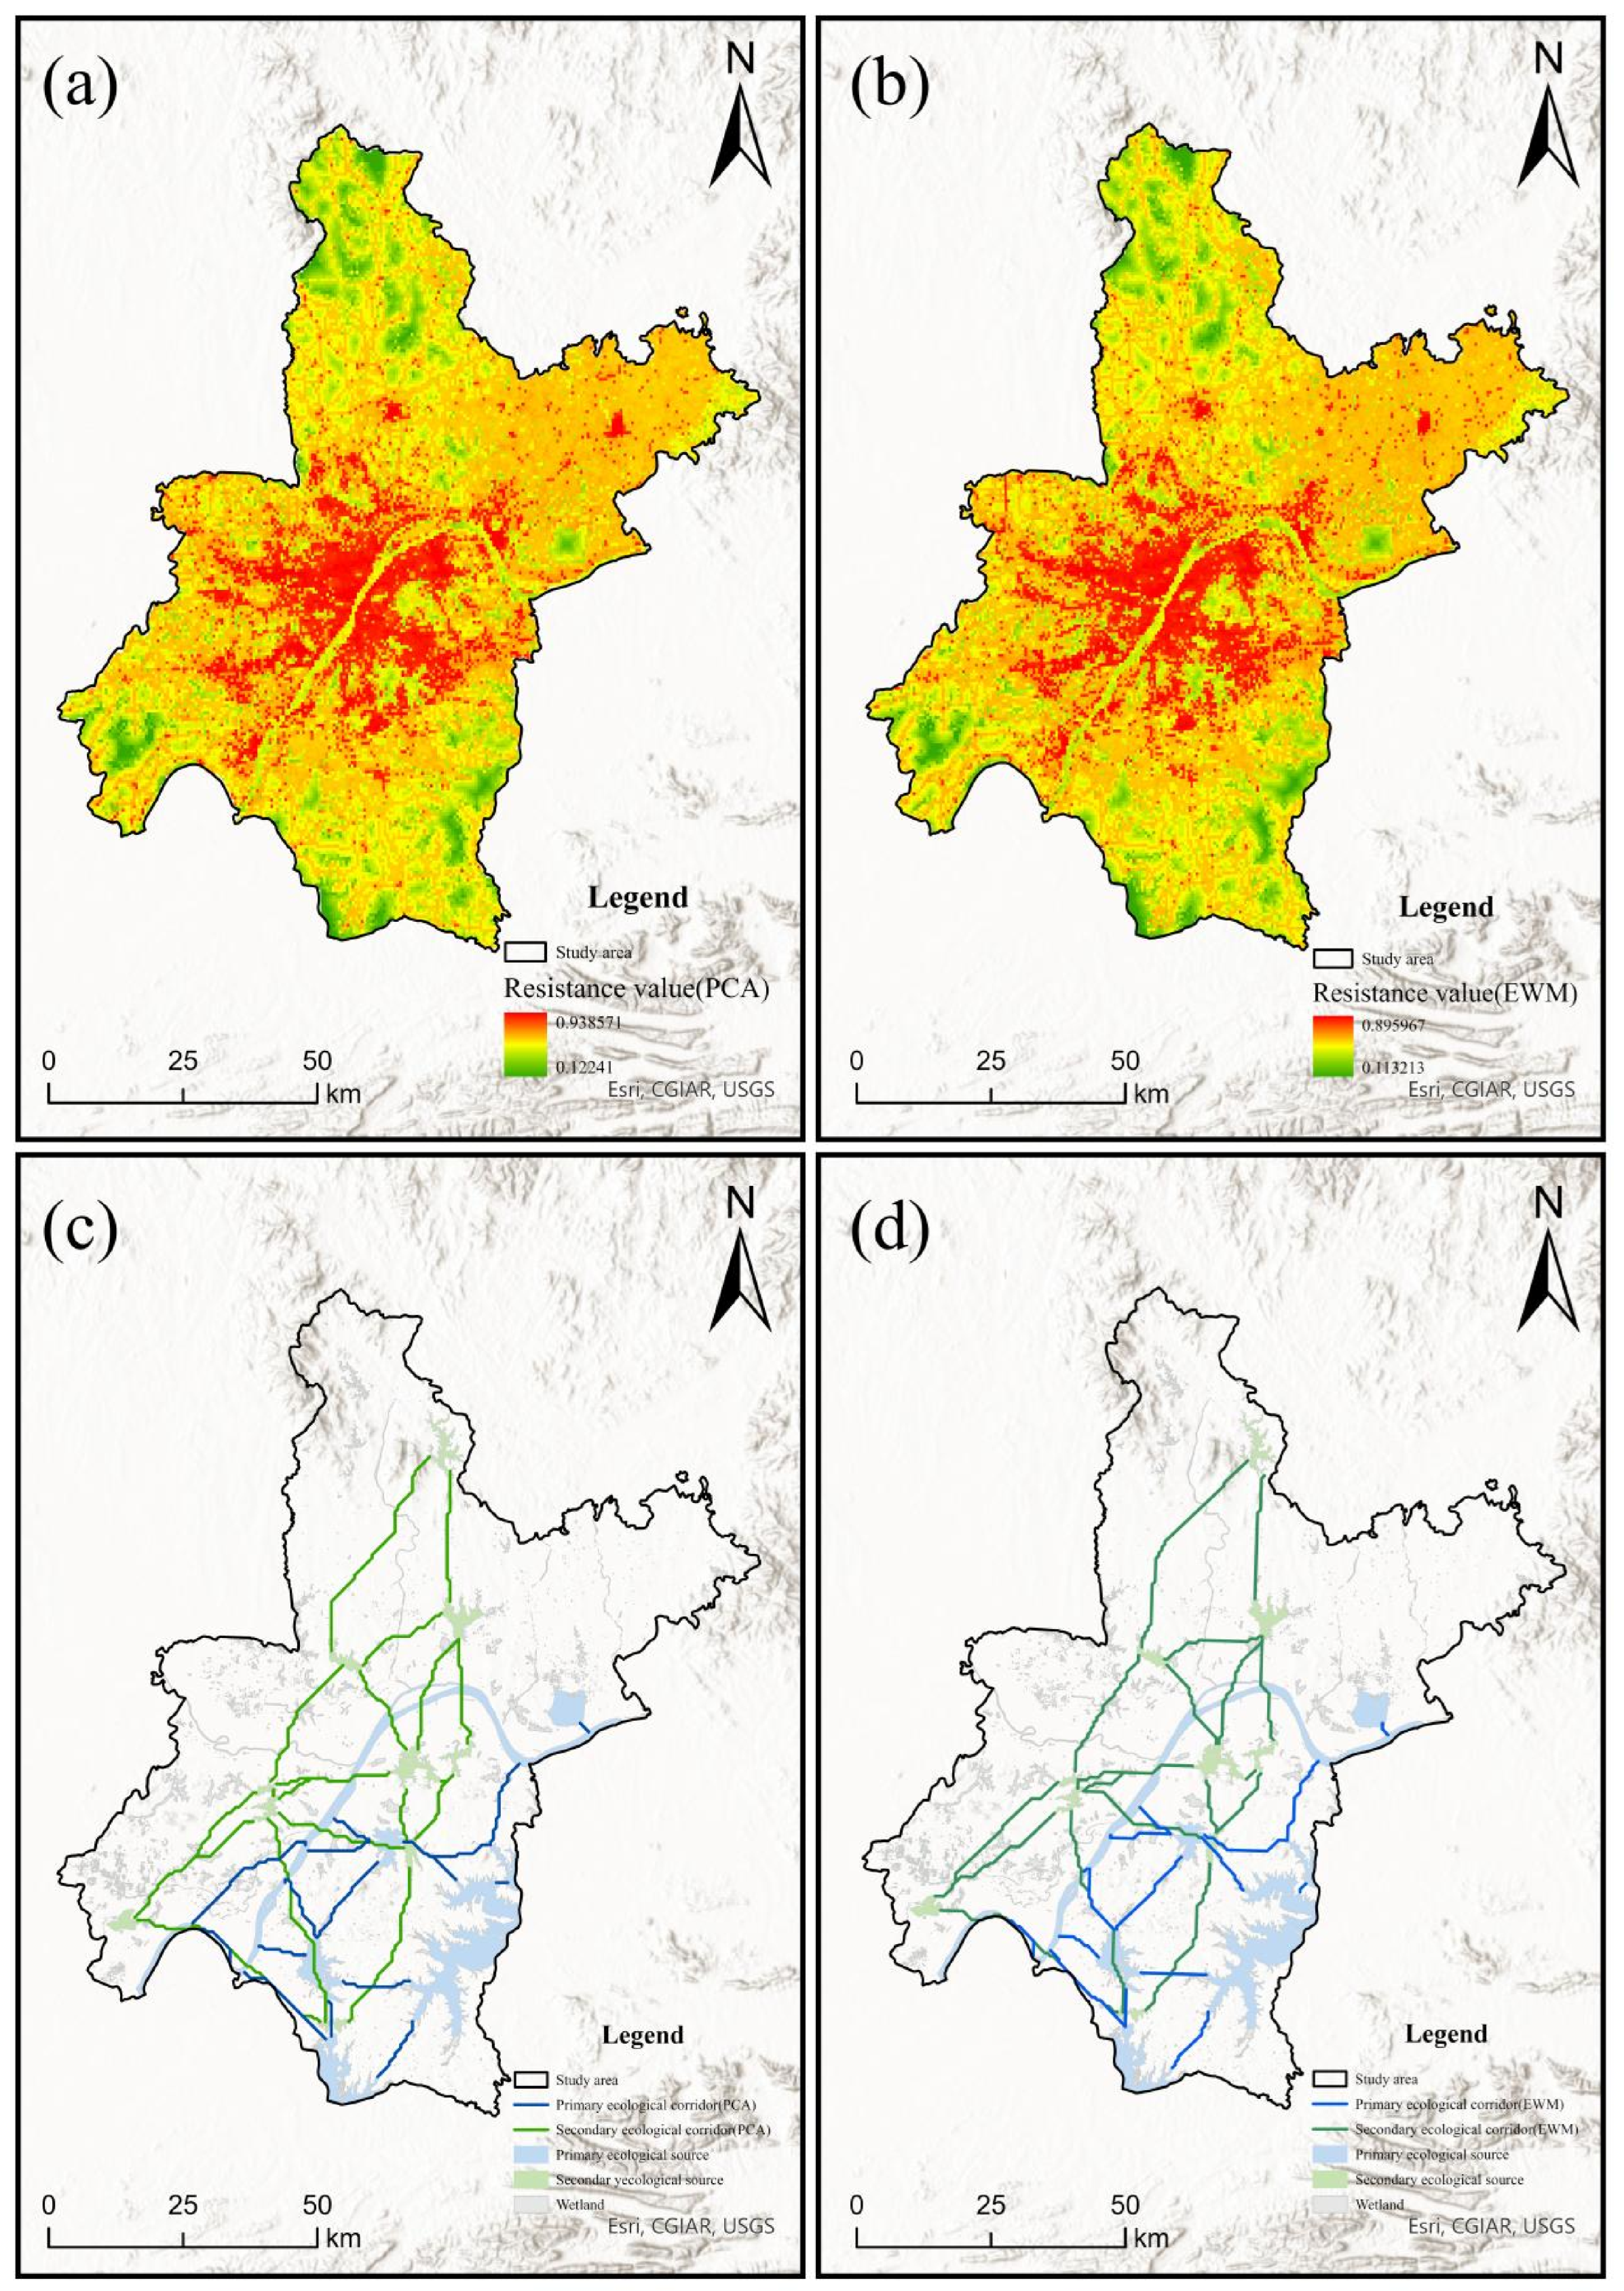
To quantify landscape resistance affecting ecological flows, a comprehensive resistance surface was constructed using five factors: land-use type, DEM, slope, NDVI, and distance to roads (
Figure 7). Principal component analysis was used to determine the weights of these factors.
The results indicate that distance to roads (0.4499) and land-use type (0.309) are the two most influential factors shaping landscape resistance. NDVI (0.1917), slope (0.0335), and DEM (0.0159) contribute relatively less to overall resistance. These findings suggest that transportation infrastructure and land-use patterns play dominant roles in determining ecological flow resistance within the study area.
The spatial distribution of resistance values shows a clear “ring + radial” pattern. High-resistance areas (resistance value > 0.7) are mainly concentrated in the densely built urban core and along major transportation corridors such as the Third Ring Road and surrounding expressways. These areas correspond closely with construction land and zones of intensive human activities.
In contrast, low-resistance areas (resistance value < 0.3) are mainly distributed along the Yangtze River, the Han River, and the shorelines of major lakes. These natural water systems form a cross-shaped ecological framework that facilitates ecological flows and species movement. Overall, the resistance surface clearly reflects the spatial imprint of land-use change, where urban expansion creates ecological barriers while natural wetlands and river corridors maintain lower resistance pathways.
4.4. Interaction Strength Among Ecological Sources
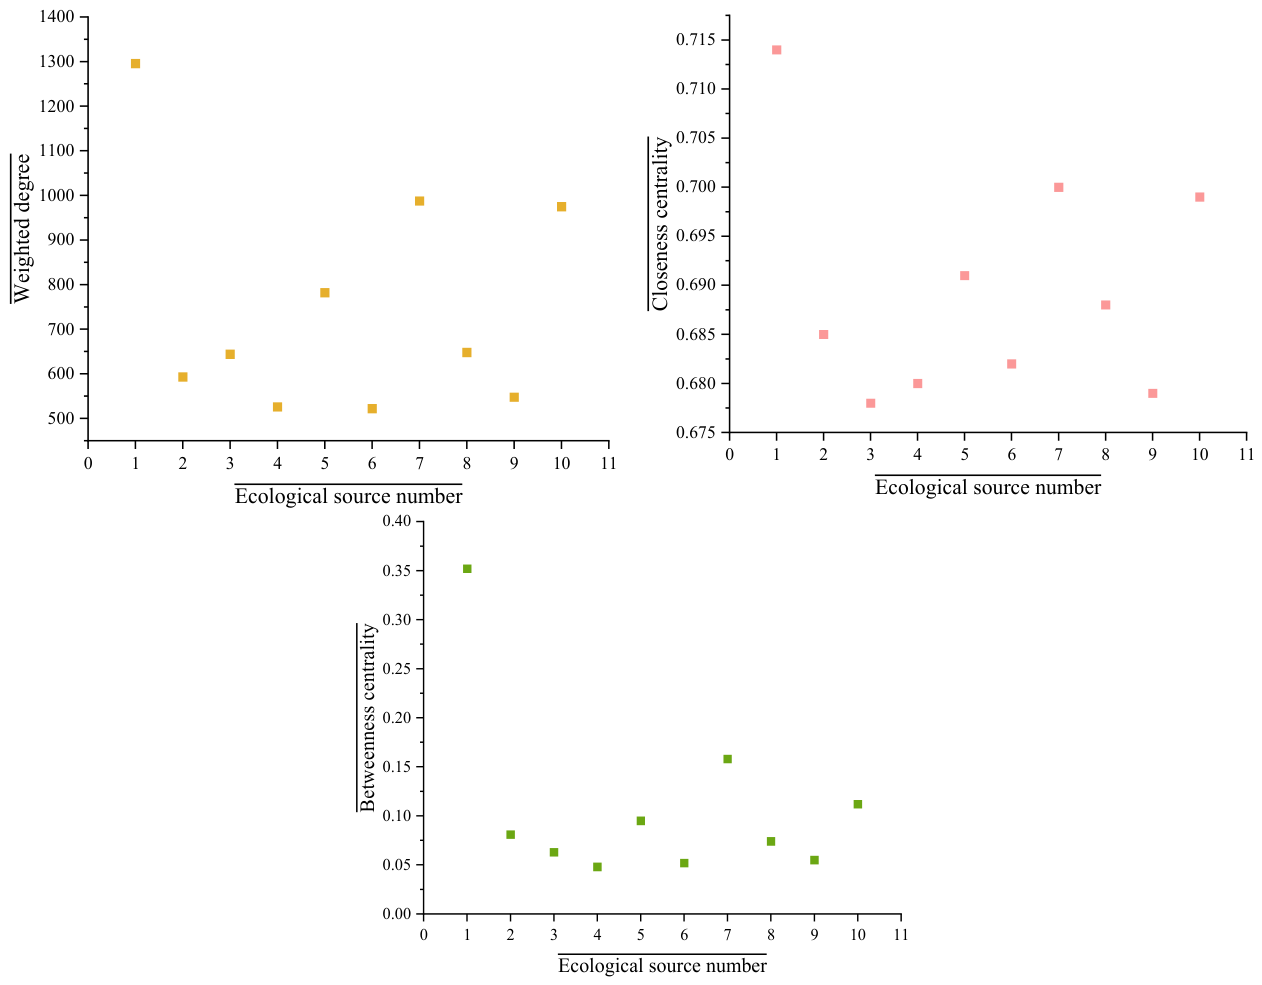
To evaluate the ecological relationships among different source areas, a gravity model was used to calculate the interaction strength between major ecological sources (
Figure 8,
Table 7). The results reveal significant differences in interaction intensity across the ecological source network.
Patches 6, 26, and 30 exhibit particularly strong interaction strengths with other sources, indicating their central roles within the ecological network. These sources show weighted centrality values of 1295, 987, and 975, respectively, and corresponding betweenness centrality values of 0.352, 0.158, and 0.112. This suggests that these sources function simultaneously as strong ecological attractors and critical connectors, facilitating ecological flows across the region.
The interaction matrix further indicates that ecological sources located along major river systems generally exhibit stronger interactions with other sources compared to those located in isolated inland areas. This pattern highlights the importance of river–lake systems as structural backbones of regional ecological connectivity.
4.5. Wetland Ecological Security Network Structure
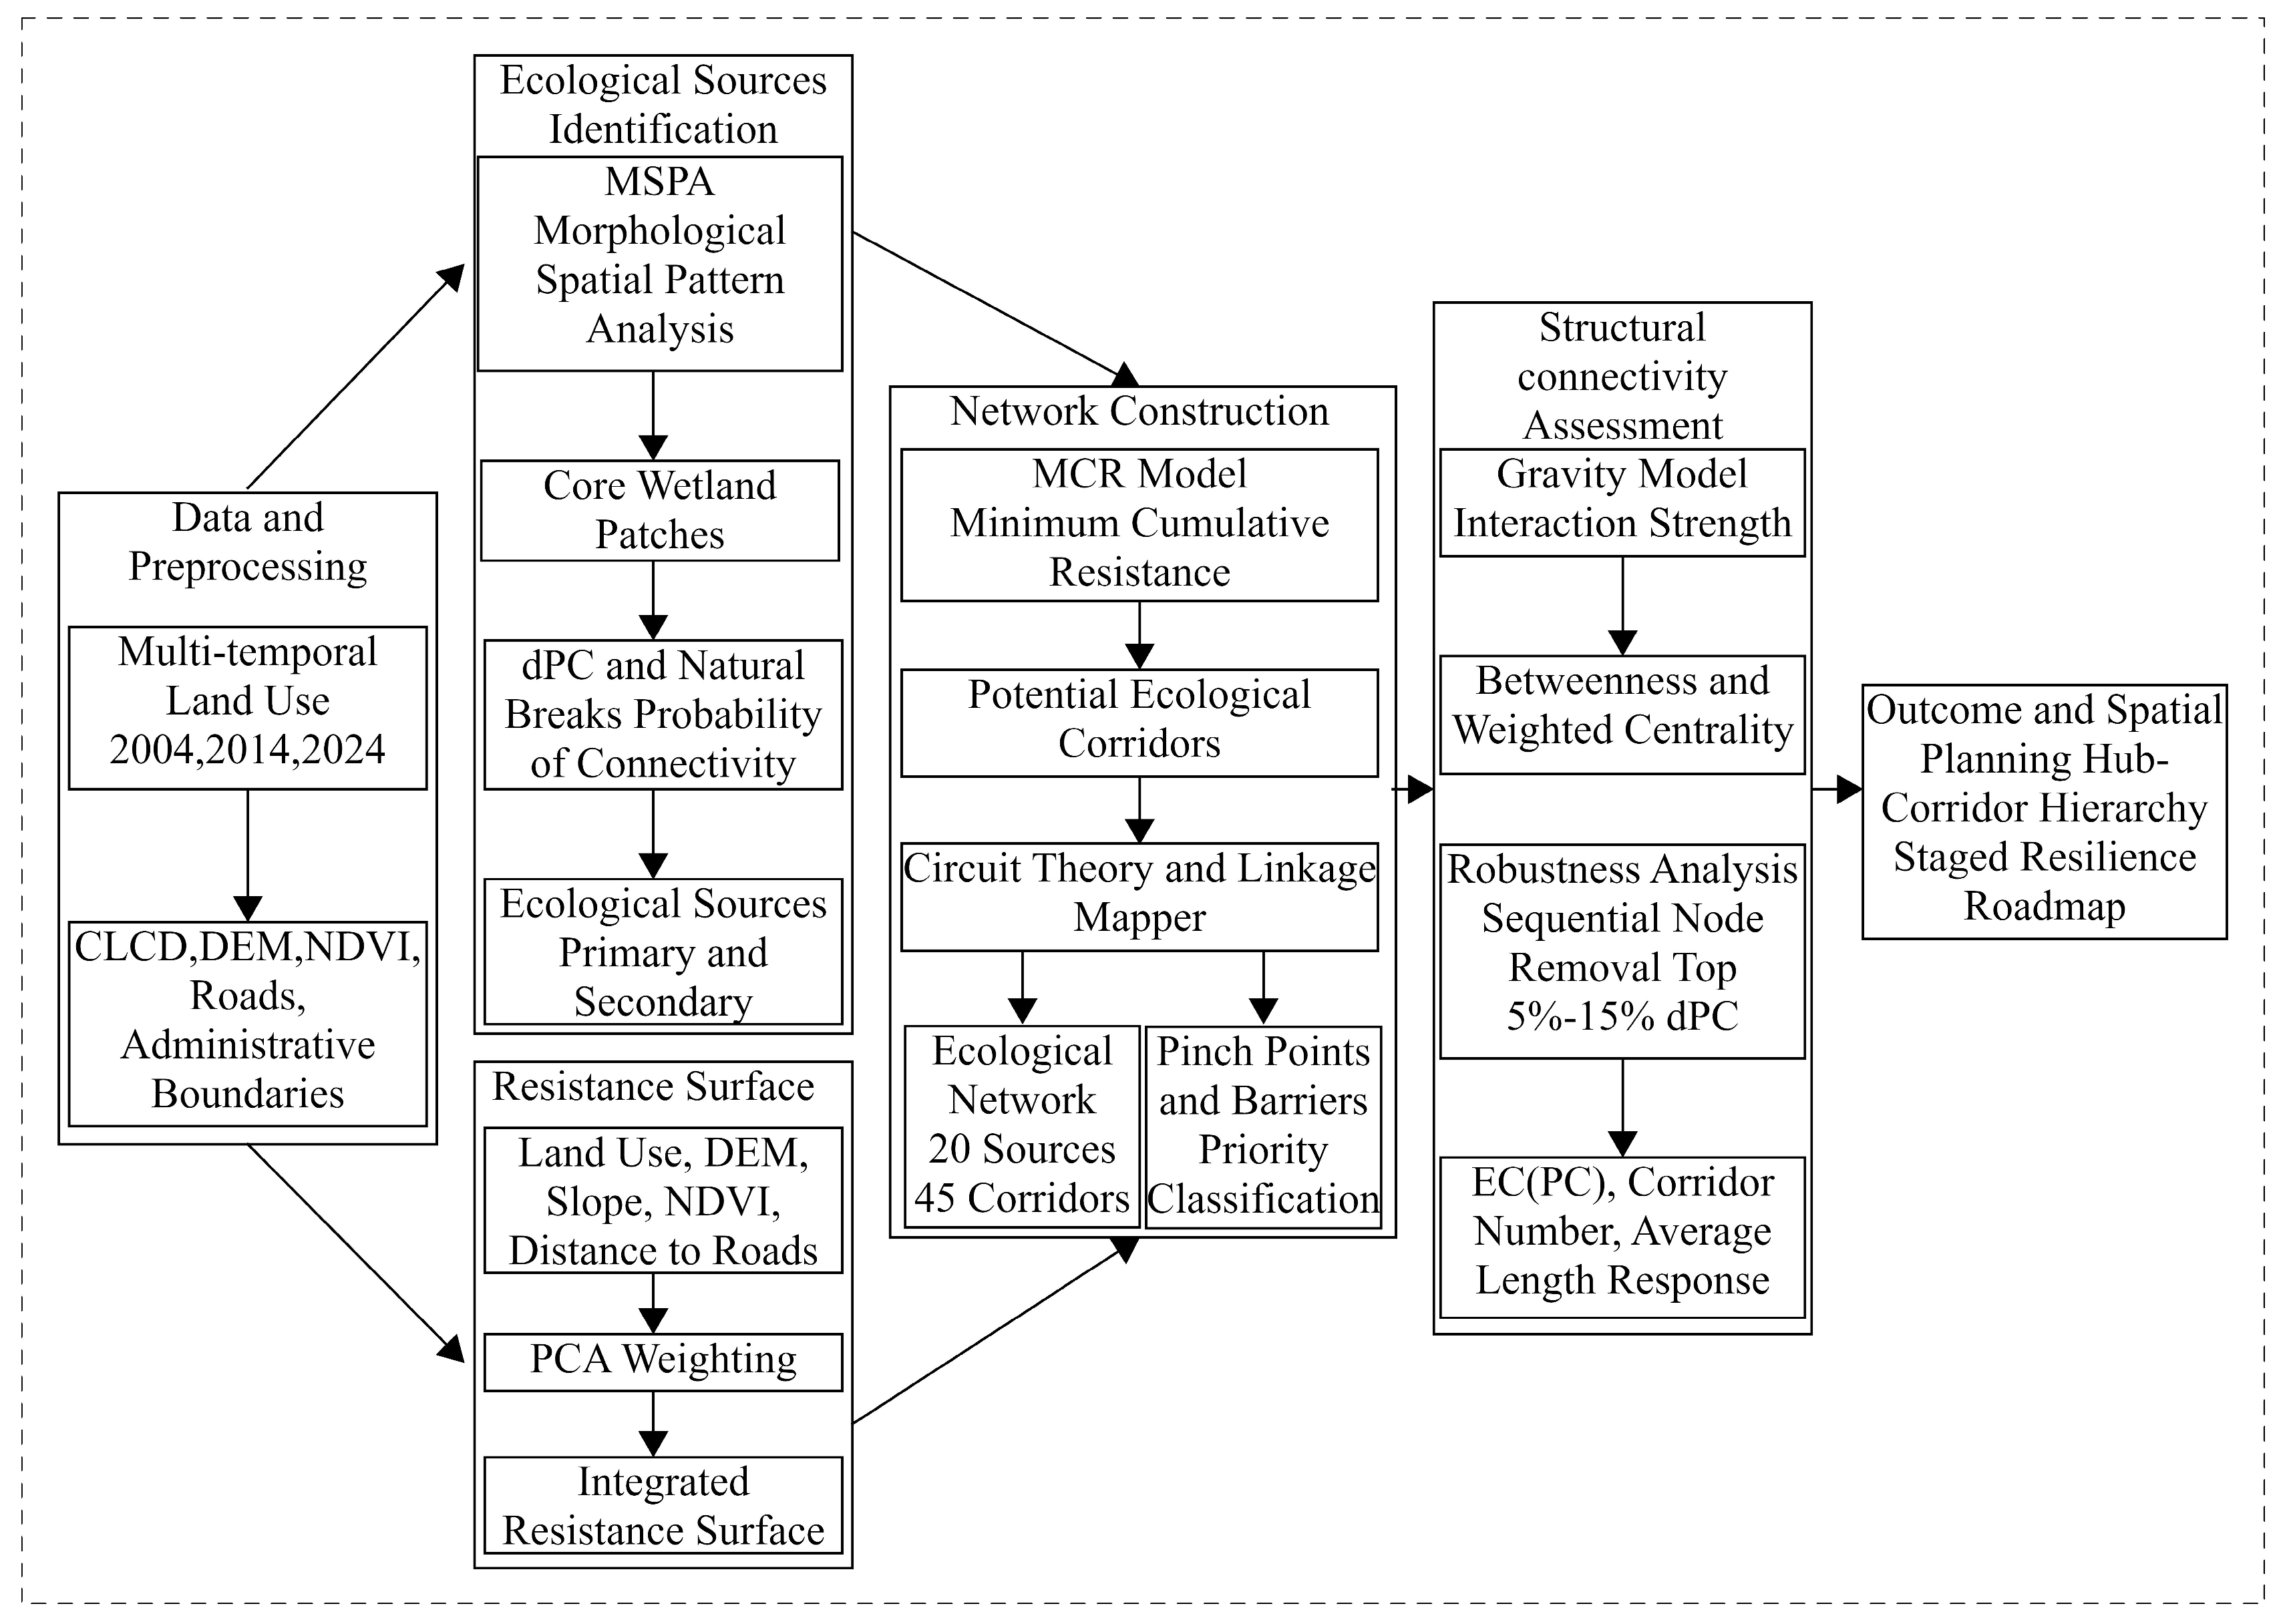
Based on the integrated results of the minimum cumulative resistance (MCR) model and circuit theory analysis, a wetland ecological network was constructed for the Wuhan Metropolitan Area (
Figure 9). The network consists of 20 ecological source areas and 45 ecological corridors, forming a relatively interconnected spatial structure centered around major river systems and large wetland clusters. Ecological sources are primarily distributed along the Yangtze River, Han River, and major lake systems, including Liangzi Lake, Tangxun Lake, and Dongxi Lake, reflecting the fundamental role of river–lake wetlands in maintaining regional ecological connectivity.
The ecological corridors exhibit a spatial configuration characterized by multi-directional linkage and hierarchical connectivity. Major corridors are mainly distributed along the Yangtze River and Han River ecological axes, while secondary corridors extend toward suburban and urban wetland patches, facilitating ecological flow among fragmented habitats. This interconnected corridor system enhances landscape connectivity and provides potential alternative pathways for species migration and ecological processes under disturbance conditions.
Pinch point analysis identified several critical ecological bottlenecks concentrated near major transportation corridors, urban expansion zones, and transitional areas between built-up land and wetland ecosystems. These areas represent locations where ecological flows are highly concentrated and particularly vulnerable to external disturbance. Barrier points are mainly distributed in rapidly urbanizing regions, indicating that continuous land-use transformation and infrastructure expansion have increased landscape resistance and constrained ecological movement.
Overall, the wetland ecological network in the Wuhan Metropolitan Area demonstrates a relatively stable structural framework supported by major river corridors and key ecological hubs. However, rapid urban expansion and land-use change have generated high-resistance zones and critical bottlenecks that may weaken long-term connectivity efficiency and structural connectivity of the ecological network.
4.6. Priority Classification of Pinch Points
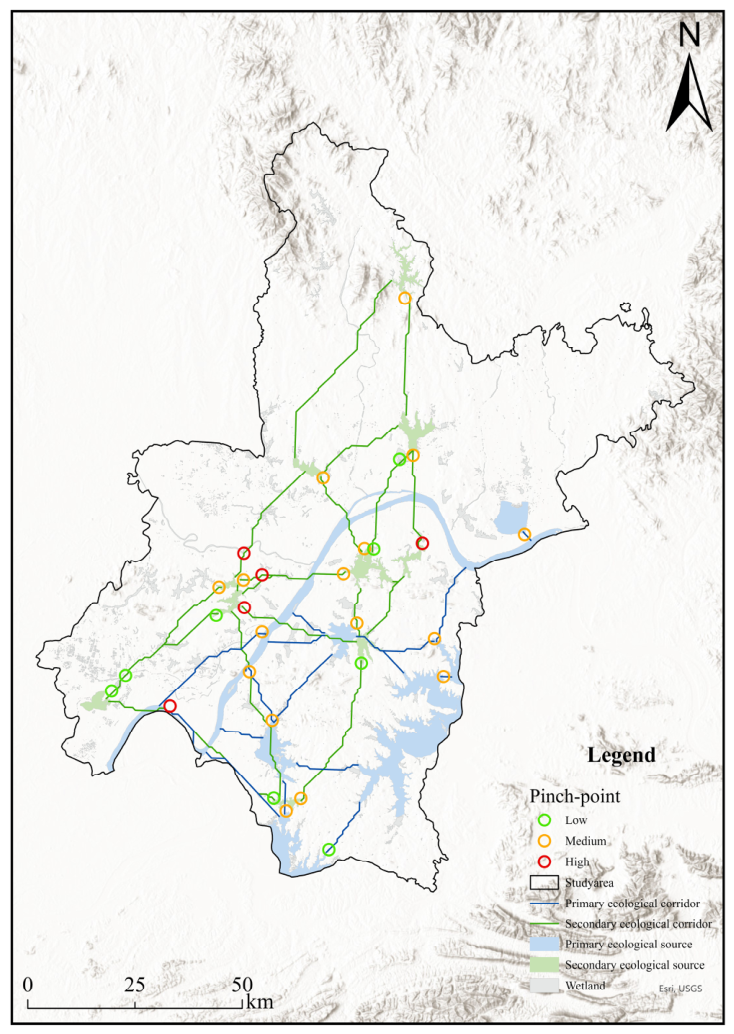
Based on the circuit theory model, 29 ecological pinch points were identified and classified into three priority levels using a composite index (PI) that integrates three normalized factors: current density (CD, from circuit theory, representing flow concentration), landscape resistance (R, representing movement difficulty), and land-use disturbance intensity (DI, derived from the 2024 land-use map, with built-up areas assigned highest disturbance). The index is calculated as:
The results show that (1) High-priority pinch points (n = 6, red circles) are mainly concentrated near the Third Ring Road and major transportation corridors, where high current density overlaps with intensive urban development and high landscape resistance; (2) Medium-priority pinch points (n = 11, orange circles) are distributed in urban fringe areas experiencing rapid land-use change; and (3) Low-priority pinch points (n = 12, green circles) are located in suburban wetland zones with relatively lower human disturbance (
Figure 10). Spatial validation indicates that high-priority pinch points overlap significantly with existing ecological corridor planning, confirming their critical role as connectivity bottlenecks in the wetland ecological network. These priority areas should be targeted for ecological restoration interventions such as wildlife passages, vegetation buffers, and land-use regulation to reduce barrier effects and maintain network functionality.
4.7. Robustness Analysis of the Wetland Ecological Network
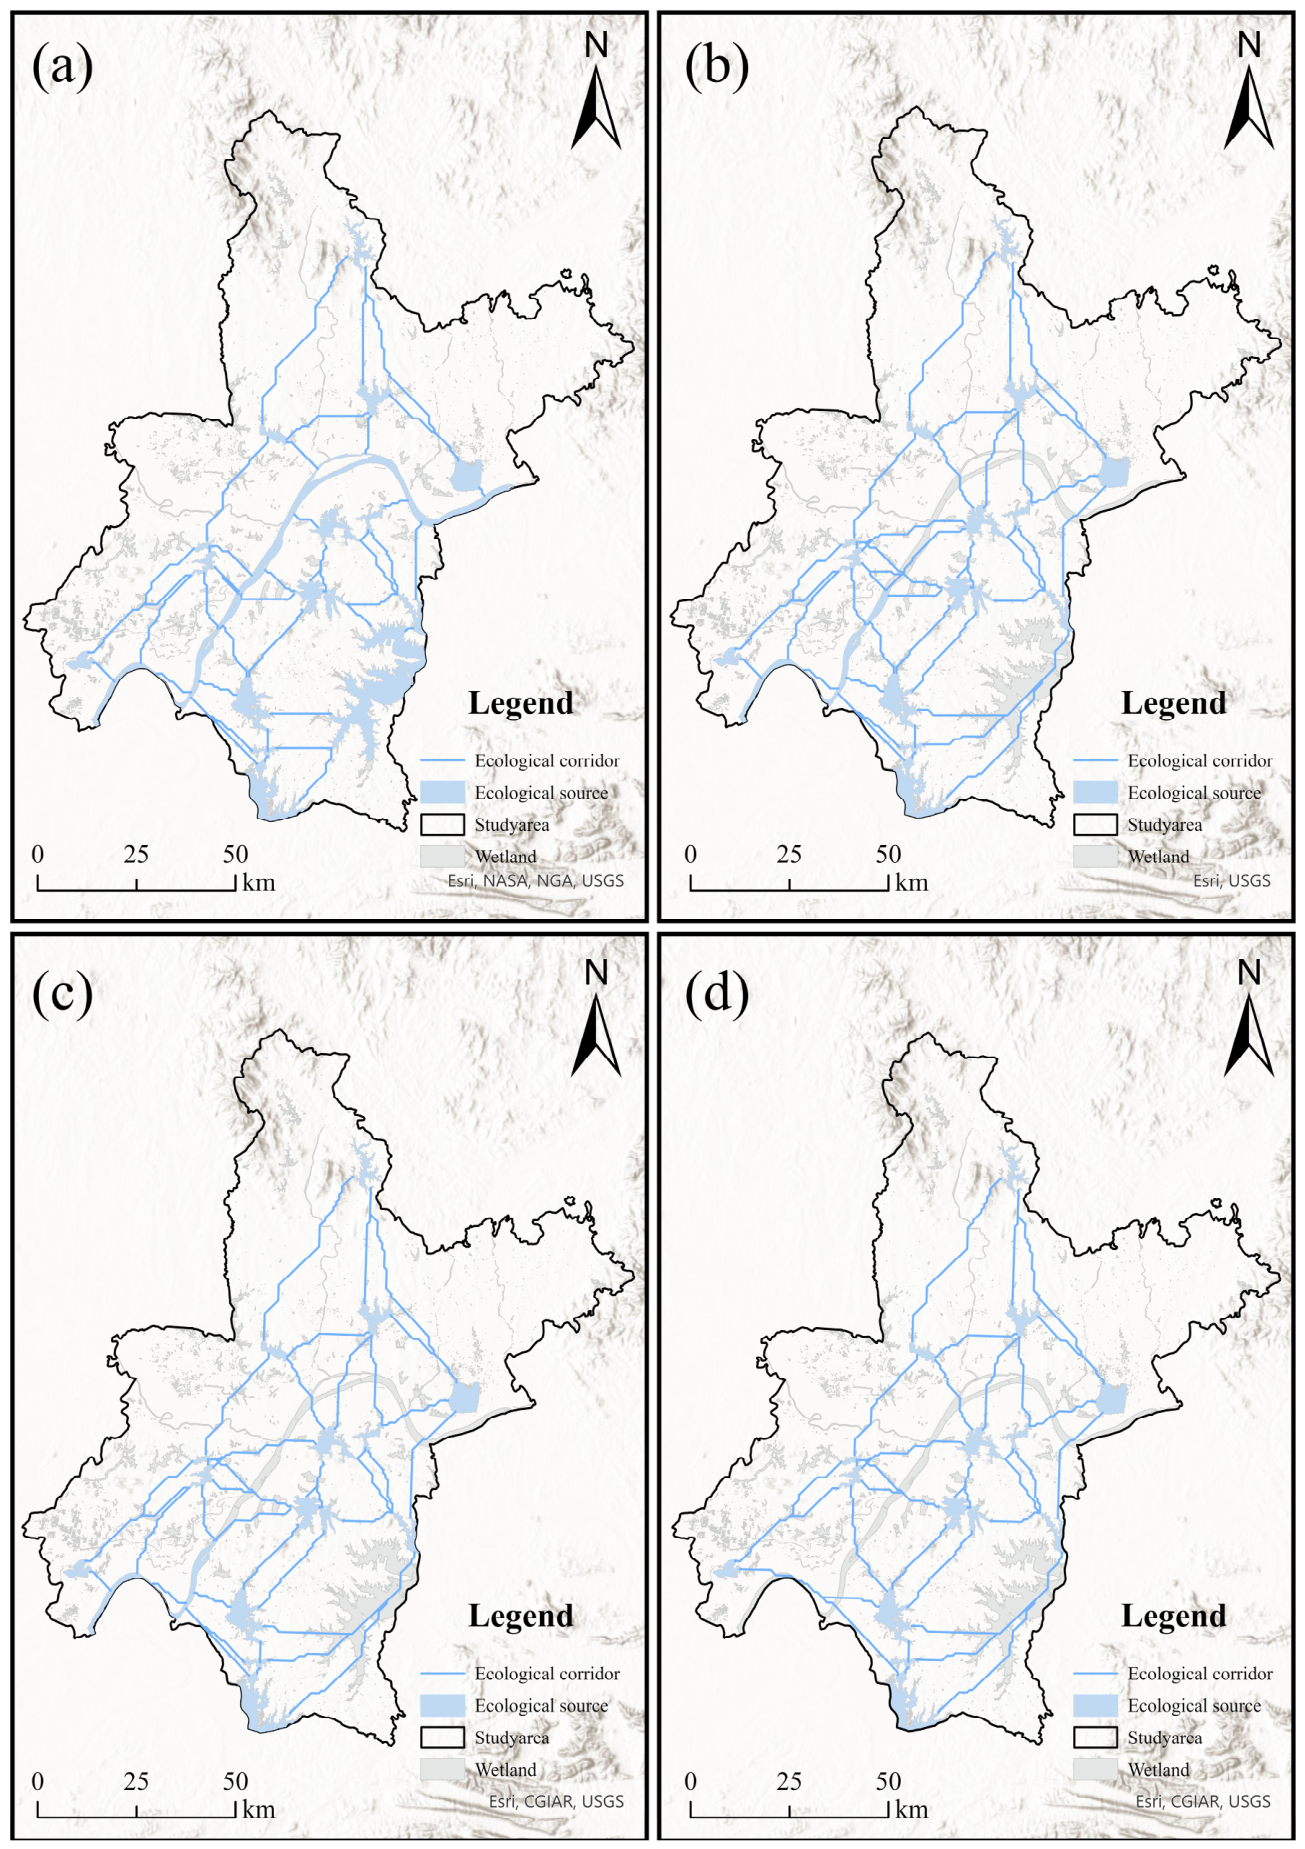
To evaluate the structural connectivity of the wetland ecological network under disturbance conditions, robustness analysis was conducted through sequential removal of high-dPC ecological source patches. The top 5%, 10%, and 15% of ecological sources ranked by dPC values were progressively removed to simulate increasing disturbance intensity, and the corresponding changes in EC(PC), ecological corridor number, and corridor length were analyzed.
The results showed that EC(PC) continuously declined with increasing node removal intensity, indicating progressive degradation of overall network connectivity and structural stability. This demonstrates that several high-dPC ecological sources play dominant roles in maintaining regional ecological connectivity and ecological flows within the network.
Meanwhile, the number of ecological corridors decreased from 45 in the original network to 44, 40, and 35 under the 5%, 10%, and 15% removal scenarios, respectively (
Figure 11). The reduction in corridor number suggests that the removal of key ecological hubs weakened network connectivity and reduced available ecological pathways between wetland patches.
Despite the continuous decline in EC(PC) and corridor number, the ecological network did not become completely fragmented after node removal. Instead, the average corridor length increased substantially under higher disturbance scenarios, indicating that ecological connectivity was maintained through alternative and less efficient pathways. This suggests that the wetland ecological network possesses a certain degree of structural redundancy and connectivity maintenance capacity under disturbance conditions (
Table 8).
However, the elongation of ecological corridors also implies increased ecological movement costs and reduced connectivity efficiency. The results indicate that although the wetland ecological network in the Wuhan Metropolitan Area exhibits moderate structural connectivity through alternative pathways, it remains highly dependent on several dominant ecological hubs. Continuous loss of these key source patches may further weaken network stability and ecological flow efficiency under future urbanization pressure.
5. Discussion
5.1. Structural Characteristics and Stability of the Wetland Ecological Network
The results reveal that the wetland ecological network in Wuhan exhibits a hub–corridor hierarchical structure, in which several key ecological sources play a dominant role in maintaining network stability. The network analysis indicates that ecological sources 6, 26, and 30 present higher weighted degree, closeness centrality, and betweenness centrality, suggesting that they function as structural hubs that control ecological flow within the network. These areas serve as critical nodes connecting multiple corridors and therefore play a disproportionate role in maintaining the overall stability of the ecological network.
The formation of this hub–corridor hierarchical structure is spatially consistent with natural and anthropogenic factors. On the one hand, the river–lake system of Wuhan provides a natural spatial framework that supports the development of ecological corridors. On the other hand, rapid urban expansion is spatially associated with the redistribution of ecological sources and increased landscape fragmentation, thereby reinforcing the dominance of several key nodes in maintaining network connectivity.
Interestingly, some relatively small ecological sources also show high interaction intensity. This suggests that the ecological importance of habitat patches is not determined solely by their size but also by their topological position within the ecological network. Similar findings have been reported in studies of wetland ecological networks in the Yangtze River Basin, where small but strategically located patches can function as stepping-stone habitats and significantly contribute to ecological connectivity [
23,
24]. Likewise, Yang et al. found that core wetland areas in the middle and lower reaches of the Yangtze River are associated with a decisive role in maintaining ecosystem functionality [
25].
Compared with ecological network studies in highly urbanized regions such as the Yangtze River Delta [
26] and Shenzhen [
12], the wetland ecological network in Wuhan still retains a relatively continuous structural framework dominated by river–lake systems. However, increasing urban expansion is gradually fragmenting these ecological spaces, which may weaken the long-term stability of the network if key nodes are not effectively protected.
Therefore, maintaining the integrity of high-centrality patches and strengthening their connectivity should be regarded as a priority for sustaining ecological network stability in rapidly urbanizing wetland cities.
We acknowledge that a single dispersal threshold cannot fully capture the ecological heterogeneity among different waterbird guilds. However, the multi-threshold sensitivity analysis indicates that the core–periphery structure of the wetland ecological network remains consistent across a range of dispersal assumptions. Future studies could incorporate species-specific dispersal kernels (e.g., for wading vs. swimming birds) to refine network design for targeted conservation goals.
5.2. Resistance Patterns and Driving Mechanisms of Ecological Connectivity
The spatial distribution of ecological resistance reveals strong influences from both natural environmental conditions and anthropogenic disturbances. In this study, land-use type (weight = 0.309) and road distance (weight = 0.450) contributed the largest weights in the resistance surface, indicating that transportation infrastructure and vegetation cover are the primary determinants of ecological connectivity.
High resistance values are mainly distributed in urban construction areas and transportation corridors, reflecting the barrier effects of urban expansion. Previous studies in Wuhan and other Chinese cities have similarly emphasized the significant impact of road networks and built-up land on ecological connectivity [
7,
27]. For example, research on the ecological network of Shenzhen also demonstrated that construction land significantly increases resistance and restricts ecological flows [
12].
In contrast, low-resistance areas are mainly located around large wetlands and riparian zones along the Yangtze River and Han River, where vegetation cover is relatively high and human disturbance is comparatively low. These areas, therefore, provide potential ecological pathways that facilitate species movement and energy exchange.
Compared with previous ecological network studies in Wuhan [
7], our analysis extends the literature by (i) incorporating circuit theory to identify specific pinch points rather than just corridors; (ii) explicitly linking land-use dynamics (2004–2024) to corridor vulnerability; and (iii) conducting a node-removal robustness assessment. Compared with inland cities such as Hefei or Nanjing, Wuhan’s resistance pattern is strongly shaped by its river–lake wetland system, where extensive water bodies provide important natural ecological corridors [
14,
28].
These results further indicate that ecological resistance is not only a reflection of landscape patterns but also a direct manifestation of human-induced spatial constraints. The interaction between natural landscape features and anthropogenic disturbances determines the spatial heterogeneity of ecological connectivity, which in turn influences the stability of the ecological network.
While the high weight of road distance may initially appear disproportionate for a wetland system, it reflects the actual ecological conditions in Wuhan, where major roads (e.g., Third Ring Road) bisect wetland corridors and create substantial barriers for waterbird movement. This finding underscores the importance of mitigating road impacts in urban wetland conservation, rather than indicating a methodological flaw.
5.3. Ecological Corridor Configuration and Critical Connectivity Zones
The ecological corridor analysis reveals that corridors are primarily distributed along the Yangtze River, Han River, and their tributaries, forming the backbone of the regional ecological network. Additional corridors extend from these main channels into urban areas, connecting isolated wetland patches such as East Lake, West Lake, Houguan Lake, and Tangxun Lake.
This corridor configuration forms a “trunk–branch” morphological pattern, where major rivers serve as the main ecological conduits and smaller urban wetlands function as stepping-stone habitats that support local connectivity. Similar patterns have been observed in large river basin cities such as Shanghai, where river systems and green corridors play a key role in maintaining landscape connectivity [
29]. In these systems, major rivers provide long-distance ecological pathways, while smaller urban wetlands serve as stepping-stone habitats that maintain local connectivity.
Ecological pinch points identified along these corridors are mainly located near the urban fringe, particularly around major transportation infrastructures such as ring roads. These areas represent critical connectivity bottlenecks where ecological flows are highly vulnerable to disturbance. Similar patterns have been observed in Beijing and other metropolitan regions, where urban edge zones often act as weak links in ecological networks [
30].
To further assess the vulnerability and restoration priority of these critical locations, a composite priority index (PI) was constructed by integrating current density, resistance, and land-use disturbance. The results indicate that high-priority pinch points are predominantly located in urban fringe areas with high resistance and intensive human activities. These high-PI areas represent potential bottlenecks where ecological flows are highly concentrated yet extremely vulnerable to disruption. If future urban expansion continues to encroach upon these zones, the ecological network may experience structural disconnection and functional degradation. Therefore, these pinch points should be regarded as priority areas for ecological restoration and targeted management.
Therefore, targeted interventions in these pinch points—such as ecological bridges, culverts, and vegetation buffer zones—are essential to reduce landscape fragmentation and maintain functional ecological corridors.
5.4. Structural Connectivity and Robustness of the Wetland Ecological Network
The robustness analysis revealed that the wetland ecological network in the Wuhan Metropolitan Area exhibited clear disturbance response characteristics under sequential removal of high-dPC ecological sources. Continuous declines in EC(PC) indicate that several dominant ecological hubs contribute disproportionately to overall network connectivity and structural stability. This finding suggests that the wetland ecological network has a strong dependence on key ecological source patches, particularly those distributed along major river systems and large wetland clusters.
Meanwhile, the gradual reduction in ecological corridor number under increasing disturbance intensity demonstrates that the loss of critical ecological hubs weakens connectivity pathways among wetland patches and accelerates network degradation. However, the ecological network did not become completely fragmented after node removal, indicating that the network still maintains a certain degree of structural redundancy and alternative connectivity pathways. This characteristic reflects moderate structural connectivity of the wetland ecological network under spatial disturbance conditions.
Notably, the average ecological corridor length increased substantially following the removal of key ecological sources. This suggests that ecological flows increasingly relied on indirect and less efficient alternative pathways to maintain overall connectivity. Although these alternative corridors partially compensated for the loss of key nodes, longer corridor distances may increase species dispersal costs, reduce ecological flow efficiency, and weaken long-term ecological stability. Similar findings have been reported in previous ecological network studies, where increased corridor length under disturbance conditions was considered an important indicator of declining connectivity efficiency and reduced network robustness [
31].
The results further indicate that rapid urban expansion and land-use transformation in the Wuhan Metropolitan Area have intensified pressure on ecological connectivity by increasing landscape resistance and fragmenting wetland habitats. Therefore, future ecological conservation and spatial planning should prioritize the protection of high-dPC ecological hubs and critical connectivity corridors while simultaneously enhancing alternative ecological pathways and corridor redundancy to improve the long-term structural connectivity of the wetland ecological network.
5.5. Land-Use Change and Implications for Ecological Network Stability
An important finding of this study is the close relationship between land-use change and ecological network stability. Analysis of multi-temporal land-use patterns and land-use transition matrices indicates that rapid urban expansion remains the dominant factor threatening wetland ecological connectivity in the Wuhan Metropolitan Area. From 2004 to 2024, construction land expanded continuously, primarily through the conversion of wetlands and agricultural land, resulting in increasing landscape fragmentation and ecological resistance.
This phenomenon has also been observed in other rapidly urbanizing regions of China. For instance, studies in the Yangtze River Delta have shown that urban land expansion significantly increases landscape fragmentation and reduces ecological connectivity [
26]. Similarly, previous studies in Wuhan have demonstrated that rapid urbanization has exerted persistent pressure on wetland ecosystems, leading to wetland loss and degradation of ecological functions [
6].
The results of this study further suggest that land-use change not only reshapes landscape spatial patterns but also directly affects ecological network stability by altering the resistance distribution and disrupting ecological connectivity among wetland patches. Continuous expansion of built-up land has intensified the isolation of ecological sources and increased movement costs for ecological flows, thereby weakening the overall structural stability of the wetland ecological network. This finding highlights that land-use transformation acts as a critical driver linking urbanization processes and ecological network degradation.
From a management perspective, targeted and priority-based conservation strategies should be implemented according to the functional importance of different ecological elements within the network. First, ecological source areas with high dPC values should be strictly protected, as they contribute most significantly to maintaining overall network connectivity and structural stability. Development activities surrounding these key ecological hubs should be carefully controlled to avoid further fragmentation.
Second, ecological pinch points identified in the network should be regarded as critical intervention zones because ecological flows are highly concentrated and vulnerable to disturbance in these areas. Restoration measures such as ecological bridges, wetland restoration, vegetation buffer construction, and habitat connectivity enhancement should therefore be prioritized to reduce ecological resistance and maintain ecological flows.
Third, major ecological corridors should be incorporated into regional ecological protection and territorial spatial planning frameworks to ensure long-term landscape connectivity. Wetland restoration and ecological corridor optimization should be implemented to enhance corridor continuity and ecological flow efficiency. Meanwhile, supplementary corridors should be gradually improved to increase network redundancy and strengthen structural connectivity under future disturbance scenarios.
Finally, future urban development should avoid encroachment on high-value wetland ecological spaces and prioritize spatial expansion toward areas with relatively lower ecological sensitivity and resistance. Ecological compensation mechanisms and adaptive ecological planning strategies should also be strengthened to balance urban growth and wetland conservation [
32,
33].
By integrating land-use dynamics with ecological network analysis and structural connectivity assessment, this study provides a new perspective for understanding the long-term sustainability of urban wetland systems under rapid urbanization. The proposed framework may support more adaptive ecological planning and resilient wetland conservation in rapidly urbanizing metropolitan regions.
5.6. From Connectivity Inequality to Actionable Priorities: A Staged Structural Connectivity Enhancement Route
The finding that seven core patches dominate network connectivity has profound implications for structural connectivity-based conservation under Wuhan’s intensifying urbanization pressure. We propose a spatially explicit, staged route that directly addresses the trade-off between urban development and wetland protection.
Stage I (Immediate, 1–3 years): Securing irreplaceable hubs.
The top-ranked ecological sources (Patches 29, 16, 22, 25, 26, 30, and 23) should be designated as “no-go” zones for any form of construction or land conversion. Currently, Patch 23 (Ya’er Lake) and the periphery of Patch 16 (Yangtze River wetland) face encroachment from new development zones. We recommend that Wuhan’s ongoing territorial spatial planning revise ecological red-line boundaries to explicitly include these patches and establish 200 m vegetation buffer zones along their shorelines to reduce edge effects and maintain hydrological connectivity.
Stage II (Medium-term, 3–7 years): Activating stepping-stone patches and pinch point restoration.
Patches with intermediate dPC (1–10) and high-priority pinch points (
Figure 10, red circles near the Third Ring Road) should be targeted for active restoration. Specific actions include (a) constructing three wildlife underpasses beneath the Third Ring Road where it bisects the ecological corridor between Tangxun Lake and East Lake, (b) restoring riparian wetlands along 5 km of the Han River’s fragmented southern bank (identified as a high-current but high-resistance zone), and (c) converting abandoned agricultural plots adjacent to Patch 6 (dPC = 1.77) into seasonal wetlands to enhance stepping-stone functionality.
Stage III (Long-term, 7–15 years): Building corridor redundancy and adaptive governance.
To reduce dependence on a few hubs, supplementary corridors should be established using lower-resistance pathways (e.g., along the Fuhe River and the eastern shore of Liangzi Lake). These corridors are not urgently needed, but will become critical if hubs degrade. We recommend an adaptive management framework; in particular, monitor EC(PC) annually and, if EC(PC) drops by >15% within three years due to unexpected development, trigger the activation of these pre-identified supplementary corridors through land acquisition or incentive-based easements.
The proposed roadmap inevitably constrains urban expansion. Based on our land-use transition matrix, the 44.49 km2 of wetland converted to construction land over two decades generated substantial economic returns, but at the cost of losing wetland area and creating critical bottlenecks. We explicitly quantify the trade-off: protecting the identified hubs and pinch points would permanently restrict development on approximately 85 km2 (estimated through buffer zones and corridor widths), representing less than 1% of Wuhan’s administrative area. In exchange, the network maintains EC(PC) at 1.03 × 10⁸ under the 15% hub-loss scenario—a 64% reduction from the original, but still functional through alternative pathways. Without protection, continued hub erosion would likely push EC(PC) below 5 × 10⁷, leading to network collapse. This quantification allows planners to weigh the marginal value of preserving the last 85 km2 of critical wetlands against the marginal cost of relocating planned developments to lower-sensitivity areas (e.g., existing industrial brownfields identified in our resistance surface).
5.7. Comparison with Official Wetland Protection Plans and Identification of Conservation Gaps
To assess the practical utility of our ecological network, we compared the identified ecological sources, corridors, and pinch points with existing protected areas under Wuhan’s Wetland Protection Plan (2022–2035) and the Ecological Red Line policy.
Most core ecological sources (e.g., Liangzi Lake, Futou Lake, Yangtze River wetlands) are already designated as provincial nature reserves or national wetland parks. This alignment confirms that current protection efforts have prioritized the most critical connectivity hubs.
However, several important network components fall outside existing protected areas.
Secondary ecological sources (e.g., patches 11, 21, and 24; dPC between 0.2 and 1.0) are not legally protected but contribute to network redundancy. Seven ecological pinch points (classified as high- or medium-priority in
Figure 10) are located near the Third Ring Road and major expressways, where no specific conservation measures currently exist. Three ecological corridors connecting Tangxun Lake to East Lake cross unprotected urban fringe areas, making them vulnerable to future development.
Therefore, this study provides the following novel contributions beyond existing plans: (1) spatial prioritization of pinch points requiring immediate restoration; (2) identification of unprotected secondary sources that enhance network structural connectivity; and (3) a quantitative robustness assessment that existing static plans do not provide.
These findings translate the general “protection” mandate into actionable, spatially explicit priorities for ecological restoration and land-use regulation.
5.8. From Structural Corridors to Functional Connectivity: Species, Measures, and Validation Needs
To move from structural to functional connectivity, we anchor our network to two waterbird guilds with contrasting dispersal capacities and habitat requirements, which are particularly affected by urbanization in Wuhan. The first guild comprises large-bodied wading birds (e.g., Great Egret, Ardea alba; Grey Heron, Ardea cinerea), which require open water for foraging and commute between major lakes along river corridors. The second guild consists of dabbling ducks (e.g., Eastern Spot-billed Duck, Anas zonorhyncha), which rely on seasonally inundated floodplain meadows and small ponds for breeding and stopover sites. Urbanization impacts these guilds differently: for large waders, road infrastructure (especially the Third Ring Road) creates physical and acoustic barriers that interrupt daily commuting flights between roosting and foraging sites. For dabbling ducks, the loss and isolation of small seasonal wetlands—many of which were converted to construction land (44.49 km2 over two decades)—eliminate critical stepping-stone habitats.
Based on our pinch point prioritization, we propose three specific, location-targeted interventions that directly address these species-specific constraints.
- (i)
At high-priority pinch point P3 (where the Third Ring Road bisects the ecological corridor between Tangxun Lake and East Lake): Construct a 120 m long, 3 m high vegetated underpass combined with noise barriers. This intervention is designed to maintain acoustic and physical connectivity for egrets and herons, which avoid crossing noisy, open roads.
- (ii)
At secondary ecological source patch 6 (dPC = 1.77): Convert 15 ha of adjacent abandoned agricultural land into a seasonally managed shallow-water wetland. This site currently functions as a weak stepping-stone; active restoration would create reliable stopover habitat for dabbling ducks between the Yangtze River corridor and Futou Lake.
- (iii)
For floodplain meadow corridors along the Han River’s southern bank: Remove two disused culverts to re-establish hydrological connectivity, allowing seasonal flood pulses to reconnect isolated wet meadows. This low-cost measure directly addresses the 42% loss of seasonal floodplain meadows.
We explicitly acknowledge that these interventions remain proposals awaiting empirical validation. We therefore recommend a staged validation protocol: (a) deploy camera traps and acoustic recorders at P3, P7, and P12 over two spring and two autumn migration seasons to document waterbird crossing rates; (b) conduct GPS tracking of 10–15 egrets and 20 ducks to map realized movement paths and compare them with our modeled corridor. This is what we mean by “combining species tracking” in our conclusions—a future research agenda rather than a claim achieved in the present study.