Article

Low-Carbon City Pilot Policy and Corporate Green Innovation: Evidence from Chinese Listed Firms


1
School of Economics and Management, Wuhan University, Wuhan 430072, China
2
School of Accounting, Zhongnan University of Economics and Law, Wuhan 430072, China
*
Author to whom correspondence should be addressed.
Sustainability 2026, 18(11), 5464; https://doi.org/10.3390/su18115464 (registering DOI)
Submission received: 11 March 2026 / Revised: 13 May 2026 / Accepted: 18 May 2026 / Published: 29 May 2026

Abstract

Environmental policies play an important role in promoting corporate green innovation, yet existing studies often treat such policies as a single exogenous shock and pay limited attention to the institutional context in which firms respond. Using the Low-Carbon City Pilot (LCCP) policy in China as a quasi-natural experiment, this study examines how environmental policies influence corporate green innovation. Based on panel data of Chinese A-share listed firms from 2007 to 2023, a staggered difference-in-differences model is employed to identify the policy effect. The results show that the LCCP policy significantly promotes corporate green innovation and stimulates both substantive and strategic green innovation. From the perspective of institutional logics, capital market time orientation plays an important moderating role: long-term institutional investors strengthen the positive policy effect, while short-term institutional investors weaken it. Mechanism tests further show that the policy promotes green innovation mainly by increasing managerial attention to environmental and low-carbon issues, while its effect on temporal attention allocation is not significant. These findings highlight the importance of institutional contexts and managerial attention in shaping firms’ strategic responses to environmental policies and provide new empirical evidence on how environmental governance policies influence corporate green innovation.

1. Introduction

With the deepening of global climate governance and the rapid advancement of China’s “dual-carbon” goals—carbon peaking and carbon neutrality—low-carbon transformation has become a critical challenge for firms. As key actors in achieving national climate targets, corporations play a central role in reducing carbon emissions and promoting green technological progress. Corporate green innovation not only contributes to environmental governance but also reshapes firms’ competitive advantages and long-term sustainability. It is also closely related to the United Nations Sustainable Development Goals (SDGs), particularly SDG 9 on Industry, Innovation and Infrastructure, SDG 12 on Responsible Consumption and Production, and SDG 13 on Climate Action, because it promotes green technological upgrading, more sustainable production practices, and carbon-emission mitigation. In China, the sustainability transition has increasingly been driven not only by global climate governance but also by domestic policy commitments and implementation mechanisms, especially the “dual-carbon” goals and place-based low-carbon governance policies. Consequently, understanding how policy interventions influence firms’ green innovation strategies has become an important topic in environmental economics and management research [1]. A growing body of literature has examined whether environmental regulations can stimulate corporate green innovation, with the Porter Hypothesis providing one influential explanation. Recent empirical studies have provided supporting evidence that environmental policies can promote green technological innovation through regulatory pressure, technological incentives, and improved environmental governance mechanisms [2,3]. However, other studies argue that excessively stringent or poorly designed regulations may crowd out innovation resources, increase compliance costs, and induce symbolic or less technologically intensive responses rather than substantive innovation [4]. These conflicting findings suggest that the relationship between environmental regulation and corporate green innovation is more complex than previously assumed.
One important reason for these inconsistent findings lies in the insufficient consideration of the institutional context in which environmental policies operate. Many existing studies treat environmental policies as a single and exogenous institutional shock and analyze their innovation effects mainly from cost–benefit or technological incentive perspectives. However, firms rarely operate under a single institutional pressure in practice. Instead, they simultaneously face multiple institutional logics originating from government regulation, market competition, and financial markets [5]. Under such conditions of institutional complexity, firms’ responses to environmental policies are not merely decisions about whether to innovate but involve strategic choices regarding the direction, intensity, and substance of green innovation. Consequently, ignoring the interaction among different institutional logics may limit our understanding of the heterogeneous effects of environmental policies on corporate innovation behavior. The Low-Carbon City Pilot (LCCP) policy provides an ideal quasi-natural experimental setting to explore this issue. Initiated by China’s National Development and Reform Commission in 2010, the LCCP program aims to promote regional low-carbon development by integrating carbon-reduction targets into local economic planning, industrial policy, and government performance evaluation systems. In this sense, the LCCP policy represents an important domestic governance instrument through which China translates sustainability and carbon-mitigation objectives into local administrative responsibilities and corporate strategic responses. Recent research on low-carbon city development also shows that low-carbon city policies can improve ecological efficiency through green technology innovation, further highlighting the relevance of examining the innovation effects of the LCCP policy [3]. Through these mechanisms, the policy strengthens the institutional authority of environmental goals and encourages firms to adopt low-carbon technologies and practices. Nevertheless, the effectiveness of the policy varies significantly across firms. Some firms respond by increasing green R&D investment and developing environmentally friendly technologies, thereby engaging in substantive green innovation. In contrast, other firms adopt lower-cost, legitimacy-oriented, or incremental responses, resulting in strategic green innovation activities whose environmental outcomes may be more limited or uncertain. Such heterogeneous responses indicate that the effects of environmental policies cannot be fully understood without considering the broader institutional environment in which firms operate.
However, prior research has not fully explained why firms exposed to the same environmental policy may adopt markedly different innovation responses. This limitation arises partly because existing studies tend to focus on formal regulatory pressure while paying less attention to the informal institutional influence of capital markets. In practice, firms are simultaneously evaluated by governments, regulators, investors, and financial markets. While state logic emphasizes policy compliance, administrative accountability, and public environmental objectives, financial logic emphasizes capital efficiency, risk control, and performance evaluation. Depending on its temporal orientation, financial logic may either complement state-led environmental governance or conflict with it. Long-term-oriented financial logic can support firms’ sustained investment in green innovation, whereas short-term-oriented financial logic may intensify managerial pressure for visible and immediate outcomes. Therefore, heterogeneous corporate responses to the same LCCP policy should be understood not only as a result of firm-level resource differences but also as an outcome of the interaction between formal state logic, environmental logic, and informal financial logic.
The institutional logics perspective does not replace established explanations such as the Porter Hypothesis or the resource-based view; rather, it complements them by explaining why firms exposed to the same environmental policy may respond differently. The Porter Hypothesis emphasizes how well-designed environmental regulation can stimulate innovation through innovation compensation [6], while the resource-based view highlights the role of firm-specific resources and capabilities in supporting green innovation [7]. However, these perspectives pay relatively limited attention to how multiple institutional demands shape managerial interpretation and strategic choice. Institutional logics theory helps address this limitation by showing how state logic, environmental logic, and financial logic jointly shape firms’ attention allocation, temporal orientation, and green innovation strategies. Therefore, this study extends existing explanations by shifting the focus from whether environmental regulation promotes innovation to how different institutional logics condition the form and intensity of firms’ green innovation responses.
Building on this theoretical synthesis, institutional logics theory provides an analytical framework for explaining the strategic differentiation observed under the LCCP policy. This perspective emphasizes that organizations operate within multiple institutional orders, each characterized by distinct value systems, evaluation standards, and behavioral expectations. These institutional logics shape organizational attention allocation and decision-making processes, thereby influencing firms’ strategic choices. When multiple institutional logics coexist, organizations may experience compatibility, tension, or conflict among competing institutional demands. Recent studies have shown that the effectiveness of environmental governance often depends on how different institutional logics interact and whether policy objectives are compatible with the mechanisms through which they are implemented [8]. Following this perspective, the present study conceptualizes the Low-Carbon City Pilot policy as an institutional practice characterized by the interaction between state logic and environmental logic. Specifically, the policy relies on state logic—manifested through government regulation and policy enforcement—as the primary implementation mechanism, while environmental logic serves as the core normative objective. However, firms implementing green innovation strategies are also embedded in capital markets governed by financial logic. Differences in time orientation, risk preferences, and performance evaluation criteria across these institutional logics may shape how firms interpret policy signals and determine their strategic responses. As a result, the same environmental policy may lead to different types of green innovation strategies across firms.
Based on this theoretical perspective, this study addresses three key research questions. First, does the Low-Carbon City Pilot policy significantly promote corporate green innovation strategies? Second, in the presence of multiple institutional logics, does the financial logic represented by capital markets strengthen or weaken the policy effect? Third, through what mechanisms does the policy influence firms’ green innovation strategies? This study makes three main contributions to the literature. First, it introduces the institutional logics perspective to explain how environmental policies influence corporate green innovation strategies, thereby complementing traditional cost–benefit and resource-based explanations. By emphasizing the interaction among state logic, environmental logic, and financial logic, this study shifts attention from whether environmental regulation promotes innovation to how multiple institutional logics shape the form and intensity of firms’ green innovation responses. Second, by distinguishing between long-term and short-term institutional investors, the study reveals how the time orientation of capital markets affects the effectiveness of environmental policies. Third, using a quasi-natural experiment based on the Low-Carbon City Pilot policy, the study provides new empirical evidence on the heterogeneous effects of environmental regulation on corporate green innovation strategies in emerging economies.
Beyond its theoretical implications, this study also clarifies a practical corporate decision scenario faced by firms under low-carbon governance. When a city is selected as a low-carbon pilot, carbon-reduction targets are incorporated into local development plans, administrative evaluation systems, and policy agendas. Firms located in these cities therefore face stronger environmental legitimacy pressure, while listed firms are simultaneously evaluated by capital markets. Managers must decide whether to commit resources to long-cycle, technologically intensive green innovation or adopt more incremental and legitimacy-oriented green innovation responses. By linking this practical decision scenario to institutional logics and managerial attention allocation, this study shows how macro-level environmental policy and sustainability objectives are translated into firm-level strategic choices.

2. Theoretical Analysis and Hypotheses Development

2.1. Institutional Logics and Strategic Differentiation in Green Innovation

Prior studies typically conceptualize environmental governance policies as exogenous institutional shocks and emphasize their influence on corporate green innovation through cost–benefit constraints or technological incentive mechanisms. While such approaches provide valuable insights, they often implicitly assume homogeneous firm responses to environmental regulation. However, firms operating under identical policy environments frequently exhibit heterogeneous strategic behaviors. This variation suggests that environmental policies do not operate in isolation but are embedded within broader institutional contexts [8]. Institutional logics theory offers a powerful framework for explaining this heterogeneity. The theory posits that organizations are embedded within multiple institutional orders—such as state, market, and financial systems—each characterized by distinct value systems, temporal orientations, and evaluation criteria [9]. These logics shape managerial cognition and attention allocation, thereby influencing strategic decision-making processes. Rather than passively complying with a single institutional mandate, firms navigate and reconcile competing institutional expectations.
Under conditions of institutional complexity, firms’ responses to environmental policies are not limited to the binary decision of whether to innovate. Instead, firms make strategic choices concerning the direction, intensity, and substance of green innovation. In this study, substantive green innovation refers to technologically intensive green innovation characterized by higher R&D investment, longer development cycles, and greater potential for fundamental environmental improvement. By contrast, strategic green innovation refers to more incremental, lower-resource, and legitimacy-oriented green innovation responses that enable firms to address environmental expectations while managing resource constraints and short-term performance pressure. It should be noted that strategic green innovation is not necessarily a purely negative or deceptive behavior. Under institutional complexity, it may serve as a legitimate buffering strategy through which firms respond to environmental expectations while managing resource constraints, technological uncertainty, and short-term performance pressure. Compared with substantive green innovation, strategic green innovation usually requires lower resource commitment, involves shorter development cycles, and produces more visible signals of environmental responsiveness. Therefore, the distinction between substantive and strategic green innovation reflects not only differences in technological depth, but also firms’ adaptive choices under competing institutional demands. This strategic differentiation reflects firms’ efforts to balance innovation costs, expected returns, temporal horizons, and legitimacy pressures under competing institutional logics [10].
Recent research on institutional complexity further emphasizes that heterogeneous strategic responses often emerge when institutional demands differ in temporal orientation or performance expectations [11]. Therefore, examining green innovation strategies through the lens of institutional logics enables a deeper understanding of why identical environmental policies generate divergent corporate responses.

2.2. The Low-Carbon City Pilot Policy and Corporate Green Innovation

Institutional logics theory argues that organizational action is deeply embedded in the institutional environment in which firms operate. Different institutional logics define what constitutes legitimate goals and appropriate means, thereby shaping firms’ strategic cognition and behavioral choices [12]. In the context of green transformation, environmental logic and state logic constitute two central institutional forces. Environmental logic emphasizes ecological responsibility, resource conservation, and long-term sustainability, gradually reshaping traditional economic logics centered on short-term profit maximization [13]. State logic, in contrast, operates through regulatory enforcement, administrative control, and performance evaluation systems, stressing compliance, public objectives, and governance order [14]. In the domain of low-carbon transition, these two logics converge.
The Low-Carbon City Pilot (LCCP) policy represents a hybrid institutional arrangement characterized by the interaction between environmental logic and state logic. At the goal level, the policy prioritizes carbon intensity reduction and low-carbon development, embodying a clear environmental orientation. At the implementation level, it relies on government planning, administrative mandates, performance assessments, and policy incentives—mechanisms rooted in state logic. Thus, the LCCP policy can be conceptualized as an institutional practice that pursues environmental logic through state-based governance mechanisms. Recent institutional research highlights the importance of goal–means alignment in determining governance effectiveness [5]. When institutional goals are supported by compatible implementation mechanisms, organizations are more likely to internalize external pressures and translate them into sustained strategic action. Conversely, when goals and means are misaligned, firms may be more likely to adopt symbolic, selective, or decoupled responses [15].
By integrating explicit environmental objectives with enforceable state mechanisms, the LCCP policy provides relatively clear and consistent institutional expectations. This configuration reduces policy uncertainty and strengthens the legitimacy of green innovation as a strategic response. Compared with purely compliance-oriented environmental investments, green innovation strategies—particularly those involving technological development—can simultaneously satisfy regulatory requirements and enhance long-term competitiveness. Therefore, under the joint constraints of environmental and state logics, firms are incentivized to increase green innovation activities. Moreover, institutional logics influence not only external constraints but also internal managerial attention structures [16]. Policies shape what issues are considered strategically salient and worthy of sustained organizational attention. By embedding carbon reduction targets into local development plans and government evaluation systems, the LCCP policy elevates environmental issues to the core strategic agenda of firms.
At the micro level, the LCCP policy may trigger a psychological conflict in managerial decision-making. On the one hand, the inclusion of carbon-reduction targets in local planning and administrative evaluation systems increases managers’ perceived pressure to comply with government priorities and demonstrate environmental responsiveness. On the other hand, green innovation, especially substantive green innovation, often requires substantial R&D investment, long development cycles, and uncertain returns. Managers therefore need to balance administrative accountability and environmental legitimacy against short-term profitability, budget constraints, and market performance expectations. This tension may shape how managers interpret the policy signal: some may view the LCCP policy as a long-term strategic opportunity, whereas others may perceive it as an immediate compliance pressure that needs to be addressed with lower-cost and more visible responses. Although managers may interpret the policy signal differently, the LCCP policy generally increases the strategic salience of environmental issues and directs organizational attention toward low-carbon development. As environmental concerns become more closely linked to administrative accountability, legitimacy evaluation, and future competitiveness, firms are more likely to allocate resources to green innovation activities. Therefore, the LCCP policy is expected to promote corporate green innovation overall, while the specific form of innovation may vary across firms depending on their institutional and financial contexts. Accordingly, we propose:
H1. 
The Low-Carbon City Pilot policy significantly promotes the overall level of corporate green innovation.

2.3. The Moderating Role of Institutional Investors

Although the LCCP policy integrates environmental and state logics, institutional signals do not automatically translate into strategic action across all firms. Institutional logics theory suggests that policy effectiveness depends on whether institutional goals are compatible with other dominant logics in the firm’s environment [9]. In the context of green transformation, financial logic—embedded in capital markets—plays a crucial moderating role. Financial logic influences firms through capital allocation mechanisms, performance evaluation criteria, and governance participation [17]. It may either reinforce environmental objectives or create tension, depending on its temporal orientation. Recent studies emphasize that financial practices can serve as legitimate means to achieve environmental goals when aligned with sustainability objectives [5].
Long-term institutional investors typically exhibit lower portfolio turnover and longer holding periods. Their investment strategies emphasize sustainable value creation and long-term risk management [17]. Through continuous ownership and governance engagement, these investors transmit expectations regarding long-term performance and sustainability to corporate managers. In other words, long-term financial logic reduces the psychological tension between environmental responsibility and financial performance by extending managers’ evaluation horizon and increasing their tolerance for uncertain but potentially valuable green innovation projects. In contexts where long-term institutional investors hold significant ownership stakes, managers are more likely to interpret environmental policies as strategic opportunities rather than short-term compliance burdens. The temporal orientation of long-term investors aligns with the long development cycles and uncertain returns associated with substantive green innovation. Consequently, financial logic becomes compatible with environmental logic, reinforcing the internalization of policy signals. Therefore, we propose:
H2a. 
Long-term institutional investors positively moderate the relationship between the Low-Carbon City Pilot policy and corporate green innovation.
In contrast, short-term institutional investors tend to focus on immediate financial returns and stock price fluctuations. Their high-turnover trading behavior increases firms’ sensitivity to short-term performance changes, thereby strengthening managerial pressure to deliver visible and prompt results. Under such conditions, managers are more likely to interpret environmental policy through a “cost–constraint” lens rather than as a long-term strategic opportunity.
In a short-term financial environment, even when managers recognize the long-term value of green innovation, they may still hesitate to sustain high-intensity green R&D because of market pressure, performance evaluation, and uncertainty regarding the timing of returns. In this situation, short-term financial logic does not necessarily eliminate firms’ incentives to respond to environmental policies. Rather, it changes the form of response. Managers may prefer green innovation activities that are less costly, more incremental, and more easily observable in the short run. Strategic green innovation therefore becomes an adaptive buffering response through which firms can address environmental and regulatory expectations while limiting resource commitments and performance risks. Recent studies on managerial myopia and green innovation similarly show that short-term managerial and financial pressures tend to inhibit firms’ willingness to invest in long-cycle green innovation projects [18].
Thus, short-term institutional investors are expected to weaken the positive effect of the LCCP policy on corporate green innovation by intensifying the tension between financial logic and environmental logic. We propose:
H2b. 
Short-term institutional investors negatively moderate the relationship between the Low-Carbon City Pilot policy and corporate green innovation.
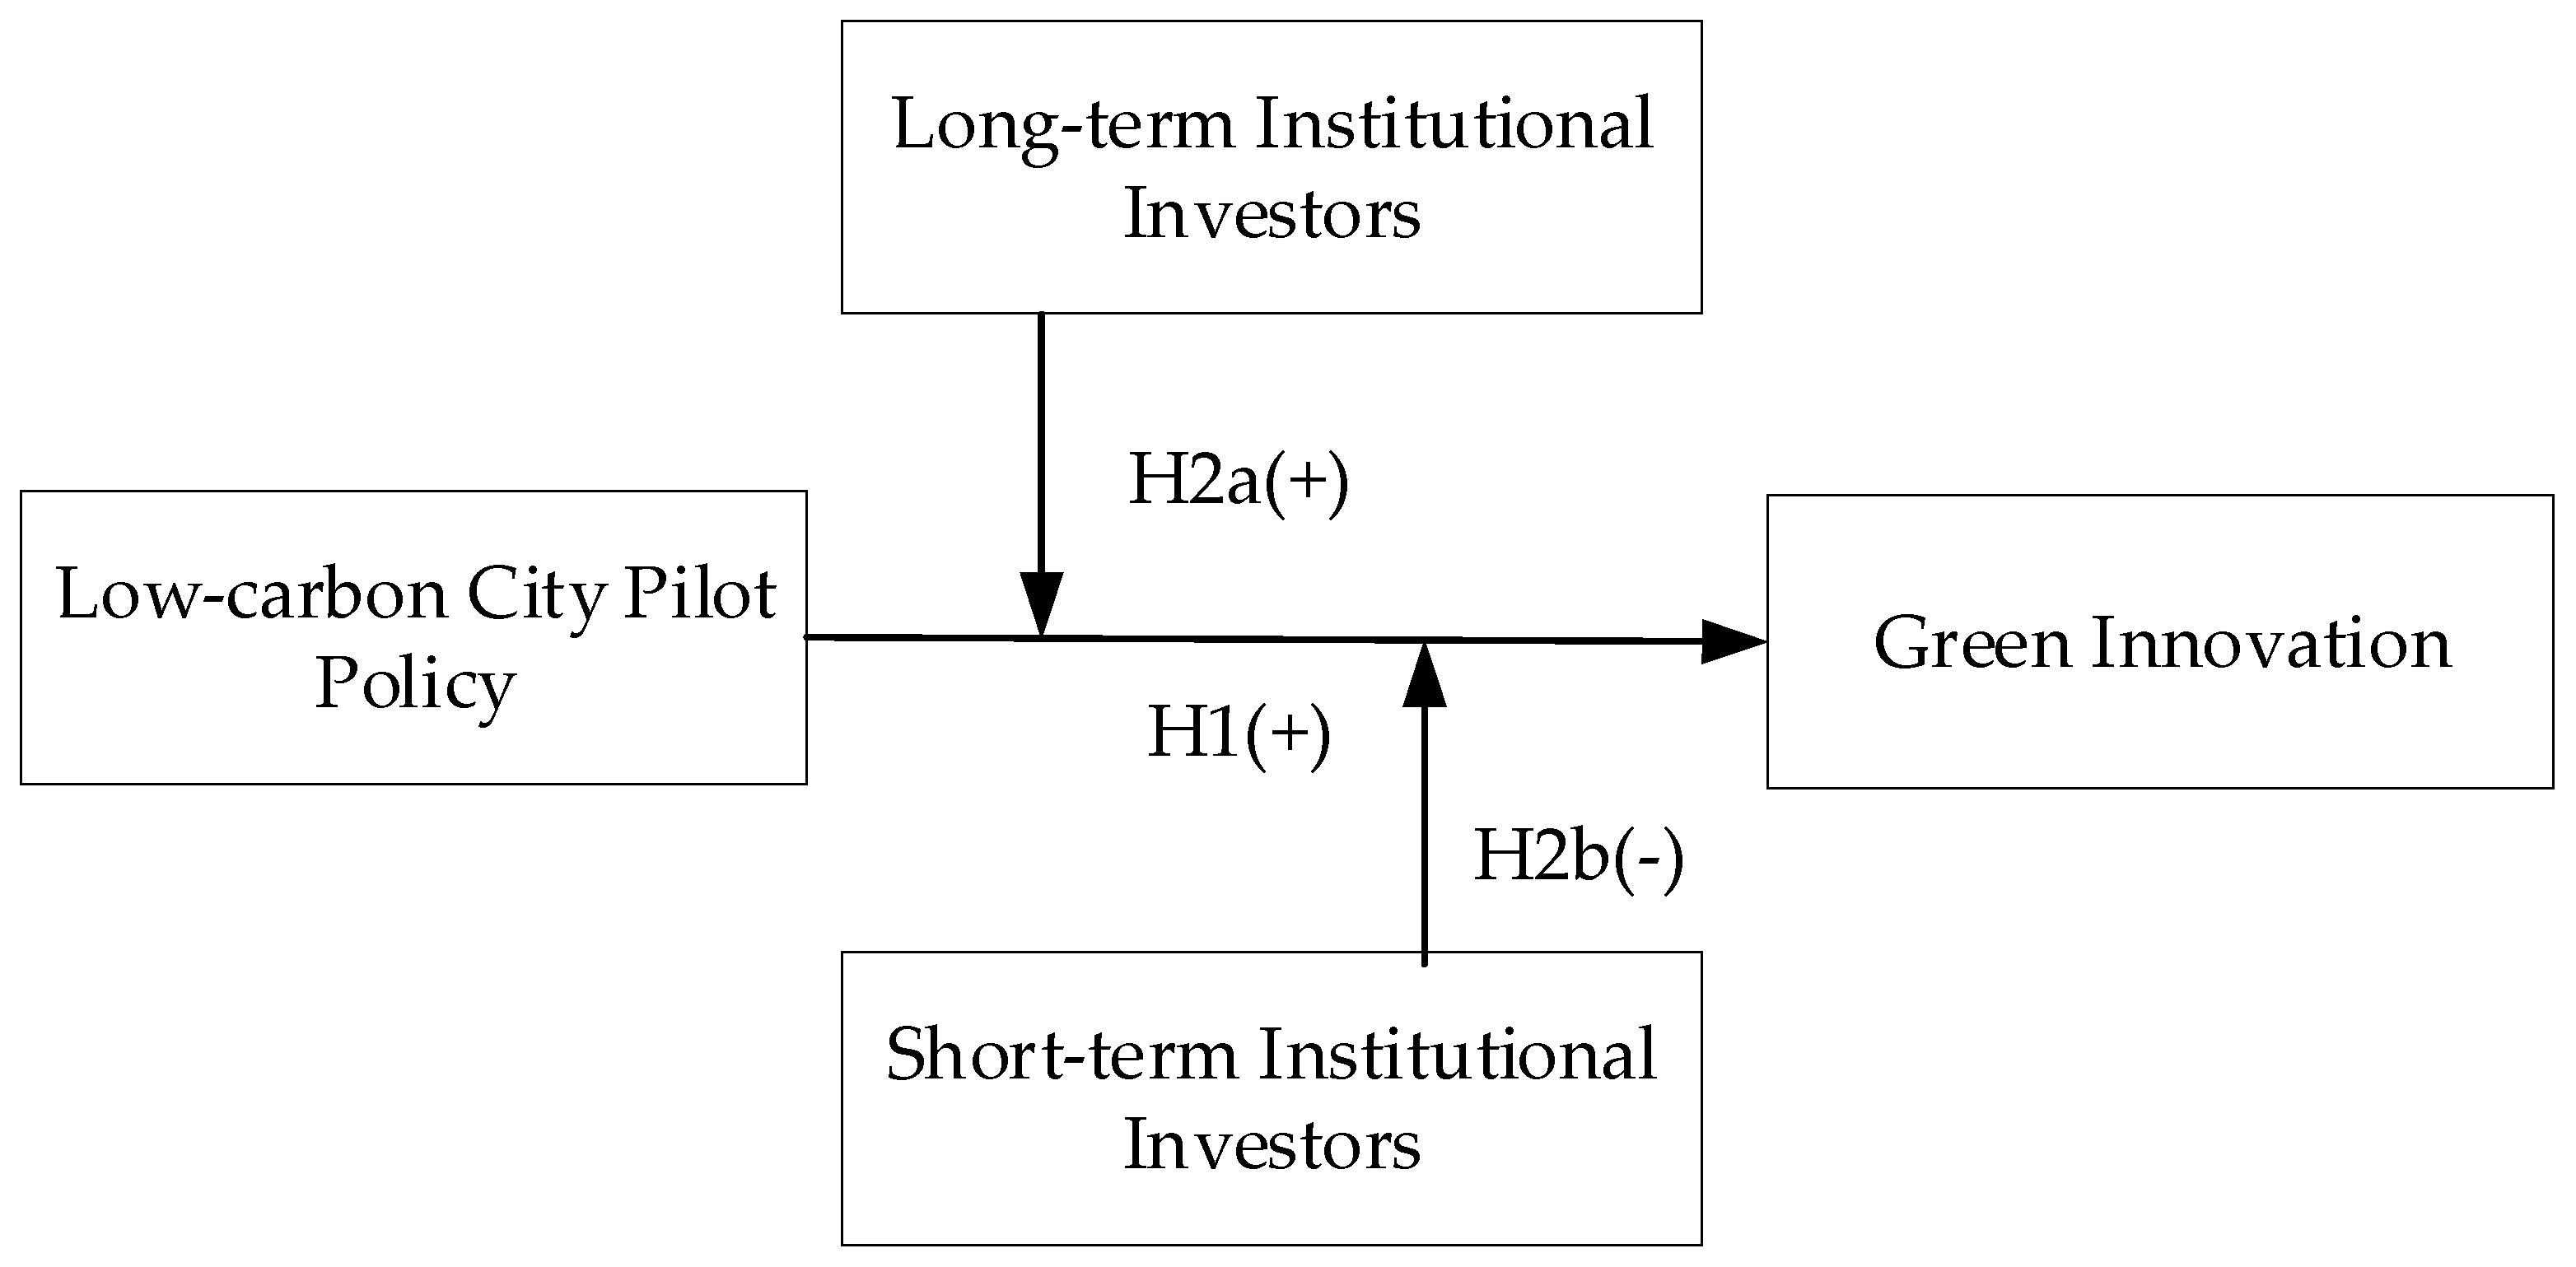
Figure 1 shows the theoretical model of this study.

3. Materials and Methods

3.1. Data Sources and Sample Selection

This study aims to identify the causal effect of the Low-Carbon City Pilot (LCCP) policy on corporate green innovation and further examine how the compatibility and tension among multiple institutional logics moderate this policy effect. Because the LCCP policy was implemented in different cities at different time points and was not voluntarily chosen by firms, it can be treated as a quasi-natural experiment. Accordingly, this study adopts a staggered Difference-in-Differences (DID) approach for causal identification, which has been widely applied in policy evaluation settings to address endogeneity concerns [19].
Given that treatment timing varies across cities, we follow the modern staggered DID framework [20], which allows for heterogeneous treatment timing and mitigates potential biases arising from traditional two-way fixed-effects estimators. By comparing changes in green innovation strategies between firms located in pilot and non-pilot cities before and after policy implementation, this method effectively controls for unobservable firm-level heterogeneity and common time trends, thereby identifying the net policy effect [21].
The sample consists of Chinese A-share listed firms from 2007 to 2023, forming an unbalanced firm–year panel dataset. The starting year 2007 ensures a sufficiently long pre-policy observation window prior to the first batch of pilot cities in 2010, satisfying the parallel trend assumption required for DID identification. The end year 2023 allows us to capture medium- and long-term policy effects. Following standard practices in corporate finance and innovation research [22], the sample is filtered as follows: (1) financial firms are excluded; (2) ST, *ST, and delisted firms are excluded; and (3) observations with missing key variables are removed. To mitigate the influence of extreme values, all continuous variables are winsorized at the 1% and 99% levels.
Firm-level financial and governance data are obtained from the CSMAR database. Green patent data are collected from the National Intellectual Property Administration (CNIPA) database and matched according to the World Intellectual Property Organization (WIPO) Green Inventory classification, which has been widely used in environmental innovation research [23]. Specifically, we first collect all patent applications filed by the sample firms from the CNIPA database. We then identify green patents by matching the International Patent Classification (IPC) codes of each patent with the IPC codes included in the WIPO Green Inventory. Patents whose IPC codes fall into the WIPO Green Inventory categories are classified as green patents. We further distinguish green invention patents and green utility model patents according to patent type. This IPC-based matching procedure avoids relying solely on keyword searches and improves the reproducibility of the green patent identification process. The list of pilot cities and implementation years is compiled from official documents issued by the National Development and Reform Commission (NDRC). City-level data are sourced from the China City Statistical Yearbook. Institutional investor data are obtained from the CSMAR institutional investor database.
According to official NDRC documents, the LCCP policy was implemented in three batches: First batch (2010): 5 provinces and 8 cities; Second batch (2012): 1 province and 28 cities; Third batch (2017): 41 cities and 4 districts/counties. The policy implementation years are defined as 2010, 2012, and 2017, respectively. If a city appears in multiple batches, the earliest implementation year is used. County-level pilot areas are excluded to maintain consistency in city-level policy treatment.

3.2. Variable Definitions

3.2.1. Dependent Variables

Green Innovation (GI). Green innovation reflects firms’ systematic allocation of resources toward green technological activities. Following prior studies, the intensity of green innovation is measured by the total number of green patent applications filed by firm i in year t, and logarithmically transformed:
G I i t = L n 1 + G r e e n P a t e n t i t
To capture heterogeneous strategic responses, we further distinguish between substantive and strategic green innovation. This distinction is consistent with recent studies that use different types of green patents to capture heterogeneous green innovation strategies and distinguish substantive green innovation from strategic green innovation [24].
Substantive Green Innovation (SGI) is measured as the logarithm of one plus the number of green invention patent applications. Green invention patents typically involve higher technological content and stronger innovation intensity.
S G I i t = L n ( 1 + G r e e n I n v e n t i o n i t )
Strategic Green Innovation (StGI) is measured as the logarithm of one plus the number of green utility model patent applications. Compared with invention patents, utility model patents generally reflect more incremental technological improvements, shorter development cycles, and lower resource requirements, and are therefore used in this study to capture strategic green innovation responses.
S t G I i t = L n ( 1 + G r e e n U t i l i t y i t )
We acknowledge that the distinction between substantive green innovation and strategic green innovation is a proxy-based distinction rather than an absolute categorization. Some green utility model patents may also represent meaningful incremental innovations. Nevertheless, because utility model patents usually involve lower technological thresholds and shorter examination cycles than invention patents, they are more suitable for capturing incremental, visible, and legitimacy-oriented responses under institutional pressure. To mitigate potential measurement concerns, we further conduct robustness checks using granted green patents as alternative dependent variables.

3.2.2. Independent Variable

Low-Carbon City Pilot Policy (LCC). The LCC variable captures the exogenous institutional shock induced by the pilot policy. It is defined as:
L C C = 1 if firm i is located in a pilot city c and t T c 0                                                                                                     otherwise
where Tc denotes the implementation year of the LCCP policy in city c.
Consistent with environmental regulation literature, place-based climate policies are frequently operationalized using policy–time interaction indicators to capture staggered treatment effects [25]. The LCCP policy represents a state-led environmental governance mechanism that integrates carbon targets into local performance evaluation systems, thereby strengthening the institutional authority of environmental logic.

3.2.3. Moderating Variables

Long-Term Institutional Investors (LT) and Short-Term Institutional Investors (ST). To examine the moderating role of financial logic’s temporal orientation, we introduce institutional investor investment horizons. Following prior research on investor time horizons [26], institutional investors are classified based on portfolio turnover rates. After excluding valuation changes driven by price fluctuations, average turnover rates are calculated over a rolling two-year window (four semi-annual periods). Investors in the bottom tertile are classified as long-term investors, and those in the top tertile as short-term investors.
These classifications capture differences in temporal orientation and monitoring intensity, which in turn shape firms’ tolerance for long-term, high-uncertainty investments such as green innovation. Investor types are then matched to firm–year observations to compute LT and ST shareholding ratios. Recent sustainability research further shows that long-term institutional investors tend to support ESG-related investments and innovation activities, while short-term investors exert pressure for short-term performance [27].

3.2.4. Control Variables

Following prior studies on environmental regulation and corporate innovation [28,29], we control for a series of firm-level and city-level characteristics that may influence green innovation outcomes. Specifically: (1) Firm size (Size) is measured as the natural logarithm of total assets at the end of the fiscal year. Larger firms generally possess more abundant resources and greater capacity to engage in innovation activities. (2) Firm age (Age) is calculated as the natural logarithm of the number of years since the firm’s establishment (current year minus establishment year plus one), capturing organizational maturity and accumulated experience. (3) Return on assets (ROA) is measured as net income divided by average total assets, reflecting firm profitability and internal financing capacity. (4) Leverage (Lev) is calculated as total liabilities divided by total assets, representing firms’ financial risk and debt pressure. (5) Tobin’s Q (TobinQ) is computed as the sum of the market value of tradable shares, the book value of non-tradable shares, and the book value of liabilities divided by total assets, capturing growth opportunities and market valuation. (6) Asset turnover (ATO) is measured as operating revenue divided by average total assets, capturing operational efficiency. (7) Board size (Board) is measured as the natural logarithm of the number of directors on the board, reflecting governance structure complexity. (8) CEO duality (Dual) is a dummy variable equal to 1 if the CEO concurrently serves as the board chair, and 0 otherwise. (9) Ownership concentration (Top5) is measured as the shareholding proportion of the top five shareholders, reflecting ownership structure and monitoring incentives. (10) Independent directors (Indep) is calculated as the proportion of independent directors on the board, representing board independence. (11) Revenue growth (Growth) is measured as the annual growth rate of operating revenue (current-year revenue divided by previous-year revenue minus one), capturing firm growth potential. (12) Inventory intensity (Inv) is calculated as net inventory divided by total assets, reflecting operational characteristics. At the city level, we control for regional environmental conditions and low-carbon development characteristics to account for city-level heterogeneity: (13) Industrial particulate emissions (PME) is measured as the natural logarithm of industrial particulate emissions per unit of GDP at the city level. (14) Sulfur dioxide emissions (SO2) is measured as the natural logarithm of sulfur dioxide emissions per unit of GDP at the city level. (15) Urban carbon emission intensity (CEI) is measured as city-level carbon dioxide emissions divided by city-level GDP, expressed in tons per 10,000 yuan. This variable captures differences in cities’ baseline carbon-efficiency conditions and low-carbon transition pressure. Additionally, firm fixed effects and year fixed effects are included in all regressions to control for time-invariant firm characteristics and common macroeconomic shocks.
Table 1 provides summary descriptions of the variables.

3.3. Empirical Model Specification

To identify the effect of the Low-Carbon City Pilot (LCCP) policy on corporate green innovation, we employ a staggered difference-in-differences (DID) model that exploits variation in treatment timing across cities [30]. The baseline specification is:
G I i t = α 0 + α 1 L C C i t + α 2 X i t + μ i + λ t + ε i t
where GIit represents firm i’s green innovation in year t; LCCit is the policy treatment indicator; Xit denotes control variables; μi captures firm fixed effects; λt captures year fixed effects; εit is the error term. Firm fixed effects control for time-invariant firm characteristics, while year fixed effects absorb macroeconomic shocks, nationwide policy changes, and technological trends. The identification assumption is that, in the absence of the policy, treated and control firms would have followed parallel trends in green innovation. Recent studies also suggest that, under staggered treatment timing, event-study analyses should be used to verify pre-trends and to interpret dynamic effects more carefully [31].
To test H2a and H2b, we estimate:
G I i t = β 0 + β 1 L C C i t + β 2 L T i t + β 3 L C C i t × L T i t + β 4 X i t + μ i + λ t + ε i t
G I i t = θ 0 + θ 1 L C C i t + θ 2 S T i t + θ 3 L C C i t × S T i t + θ 4 X i t + μ i + λ t + ε i t
The interaction terms LCCit × LTit and LCCit × STit test whether long-term or short-term institutional investors strengthen or weaken the policy effect. Because the policy is implemented at the city level and firms within the same city may share correlated shocks, while firm-level observations may exhibit serial correlation, we adopt two-way clustered robust standard errors at both the firm and city levels to ensure reliable statistical inference.

4. Results

4.1. Descriptive Statistics and Correlation Analysis

Table 2 reports the descriptive statistics of the main variables. The mean value of green innovation (GI) is 0.813, with a median of 0 and a maximum of 7.38, indicating a sparse and right-skewed distribution of green patent applications. Specifically, most firms exhibit little or no green innovation activity, while a small subset of firms demonstrate relatively high levels of green innovation output. When distinguishing between patent types, the mean values of substantive green innovation (SGI) and strategic green innovation (StGI) are 0.533 and 0.554, respectively, and both medians are zero. This suggests that green innovation remains relatively uncommon in the sample overall, although both substantive and strategic patenting activities are present. The Low-Carbon City Pilot policy variable (LCC) has a mean of 0.542, indicating that treated and control observations are sufficiently balanced to support difference-in-differences estimation. Regarding institutional investor variables, both long-term (LT) and short-term (ST) institutional ownership ratios are relatively low on average and display right-skewed distributions. This variation across firms provides sufficient heterogeneity to test the moderating role of capital market time orientation.
To improve the readability and flow of the empirical analysis, the full Pearson correlation matrix is reported in Table A1 in Appendix A. The correlation results show that GI is positively correlated with LCC, which is consistent with the expectation that the LCCP policy may stimulate corporate green innovation. In addition, LT is positively correlated with GI, whereas ST is negatively correlated with GI, aligning with our theoretical predictions regarding the differential effects of long-term versus short-term financial logic. Among the control variables, most pairwise correlation coefficients are below 0.5 in absolute value. Variance inflation factors (VIFs) are generally low, with a maximum value of 2.48, indicating that multicollinearity is unlikely to be a serious concern in the regression analysis.

4.2. Baseline Regression Results

Table 3 reports the regression results examining the impact of the Low-Carbon City Pilot (LCCP) policy on corporate green innovation strategies.
Columns (1)–(3) present the baseline estimations. After controlling for firm fixed effects, year fixed effects, and a comprehensive set of firm- and city-level covariates, the coefficient on LCC is positive and statistically significant across all three specifications.
Specifically, in Column (1), the coefficient of LCC on overall green innovation (GI) is 0.105 (p < 0.001), indicating that firms located in pilot cities significantly increase their green patent applications following policy implementation. In Column (2), the coefficient on substantive green innovation (SGI) is 0.108 (p < 0.001), suggesting that the policy promotes invention-based green innovation with higher technological intensity.
In Column (3), the coefficient on strategic green innovation (StGI) is 0.086 (p < 0.001), indicating that the policy also stimulates green utility-model patenting. Given that the dependent variables are measured in logarithmic form, these coefficients imply that the implementation of the LCCP policy increases green patent applications by approximately 8–11%, reflecting economically meaningful effects. These findings provide strong support for H1.
Columns (4) and (5) further examine the moderating role of financial logic by incorporating interaction terms between LCC and institutional investor structures.
In Column (4), the interaction term LCC × ST is negative and statistically significant. This result indicates that short-term institutional investors weaken the positive effect of the LCCP policy on green innovation strategies. This finding suggests that in contexts dominated by short-term financial logic, firms are more likely to interpret environmental policy as a compliance burden rather than a long-term strategic opportunity, thereby dampening the policy’s innovation-enhancing effect. Thus, H2b is supported.
In Column (5), the interaction term LCC × LT is positive and highly significant, indicating that long-term institutional investors significantly strengthen the policy’s impact on green innovation. This result implies that when firms operate in a financial environment characterized by long-term orientation, environmental policy signals are more likely to be internalized as sustained strategic investments. In such institutional settings, financial logic complements environmental and state logics, amplifying the policy’s effectiveness. Therefore, H2a is supported.
Overall, the results suggest that the effectiveness of the LCCP policy is contingent upon the compatibility between environmental logic and financial logic. When long-term financial logic prevails, the policy’s innovation-promoting effect is amplified. Conversely, when short-term financial logic dominates, the policy effect is weakened. These findings highlight the importance of institutional context in shaping corporate strategic responses to environmental regulation.
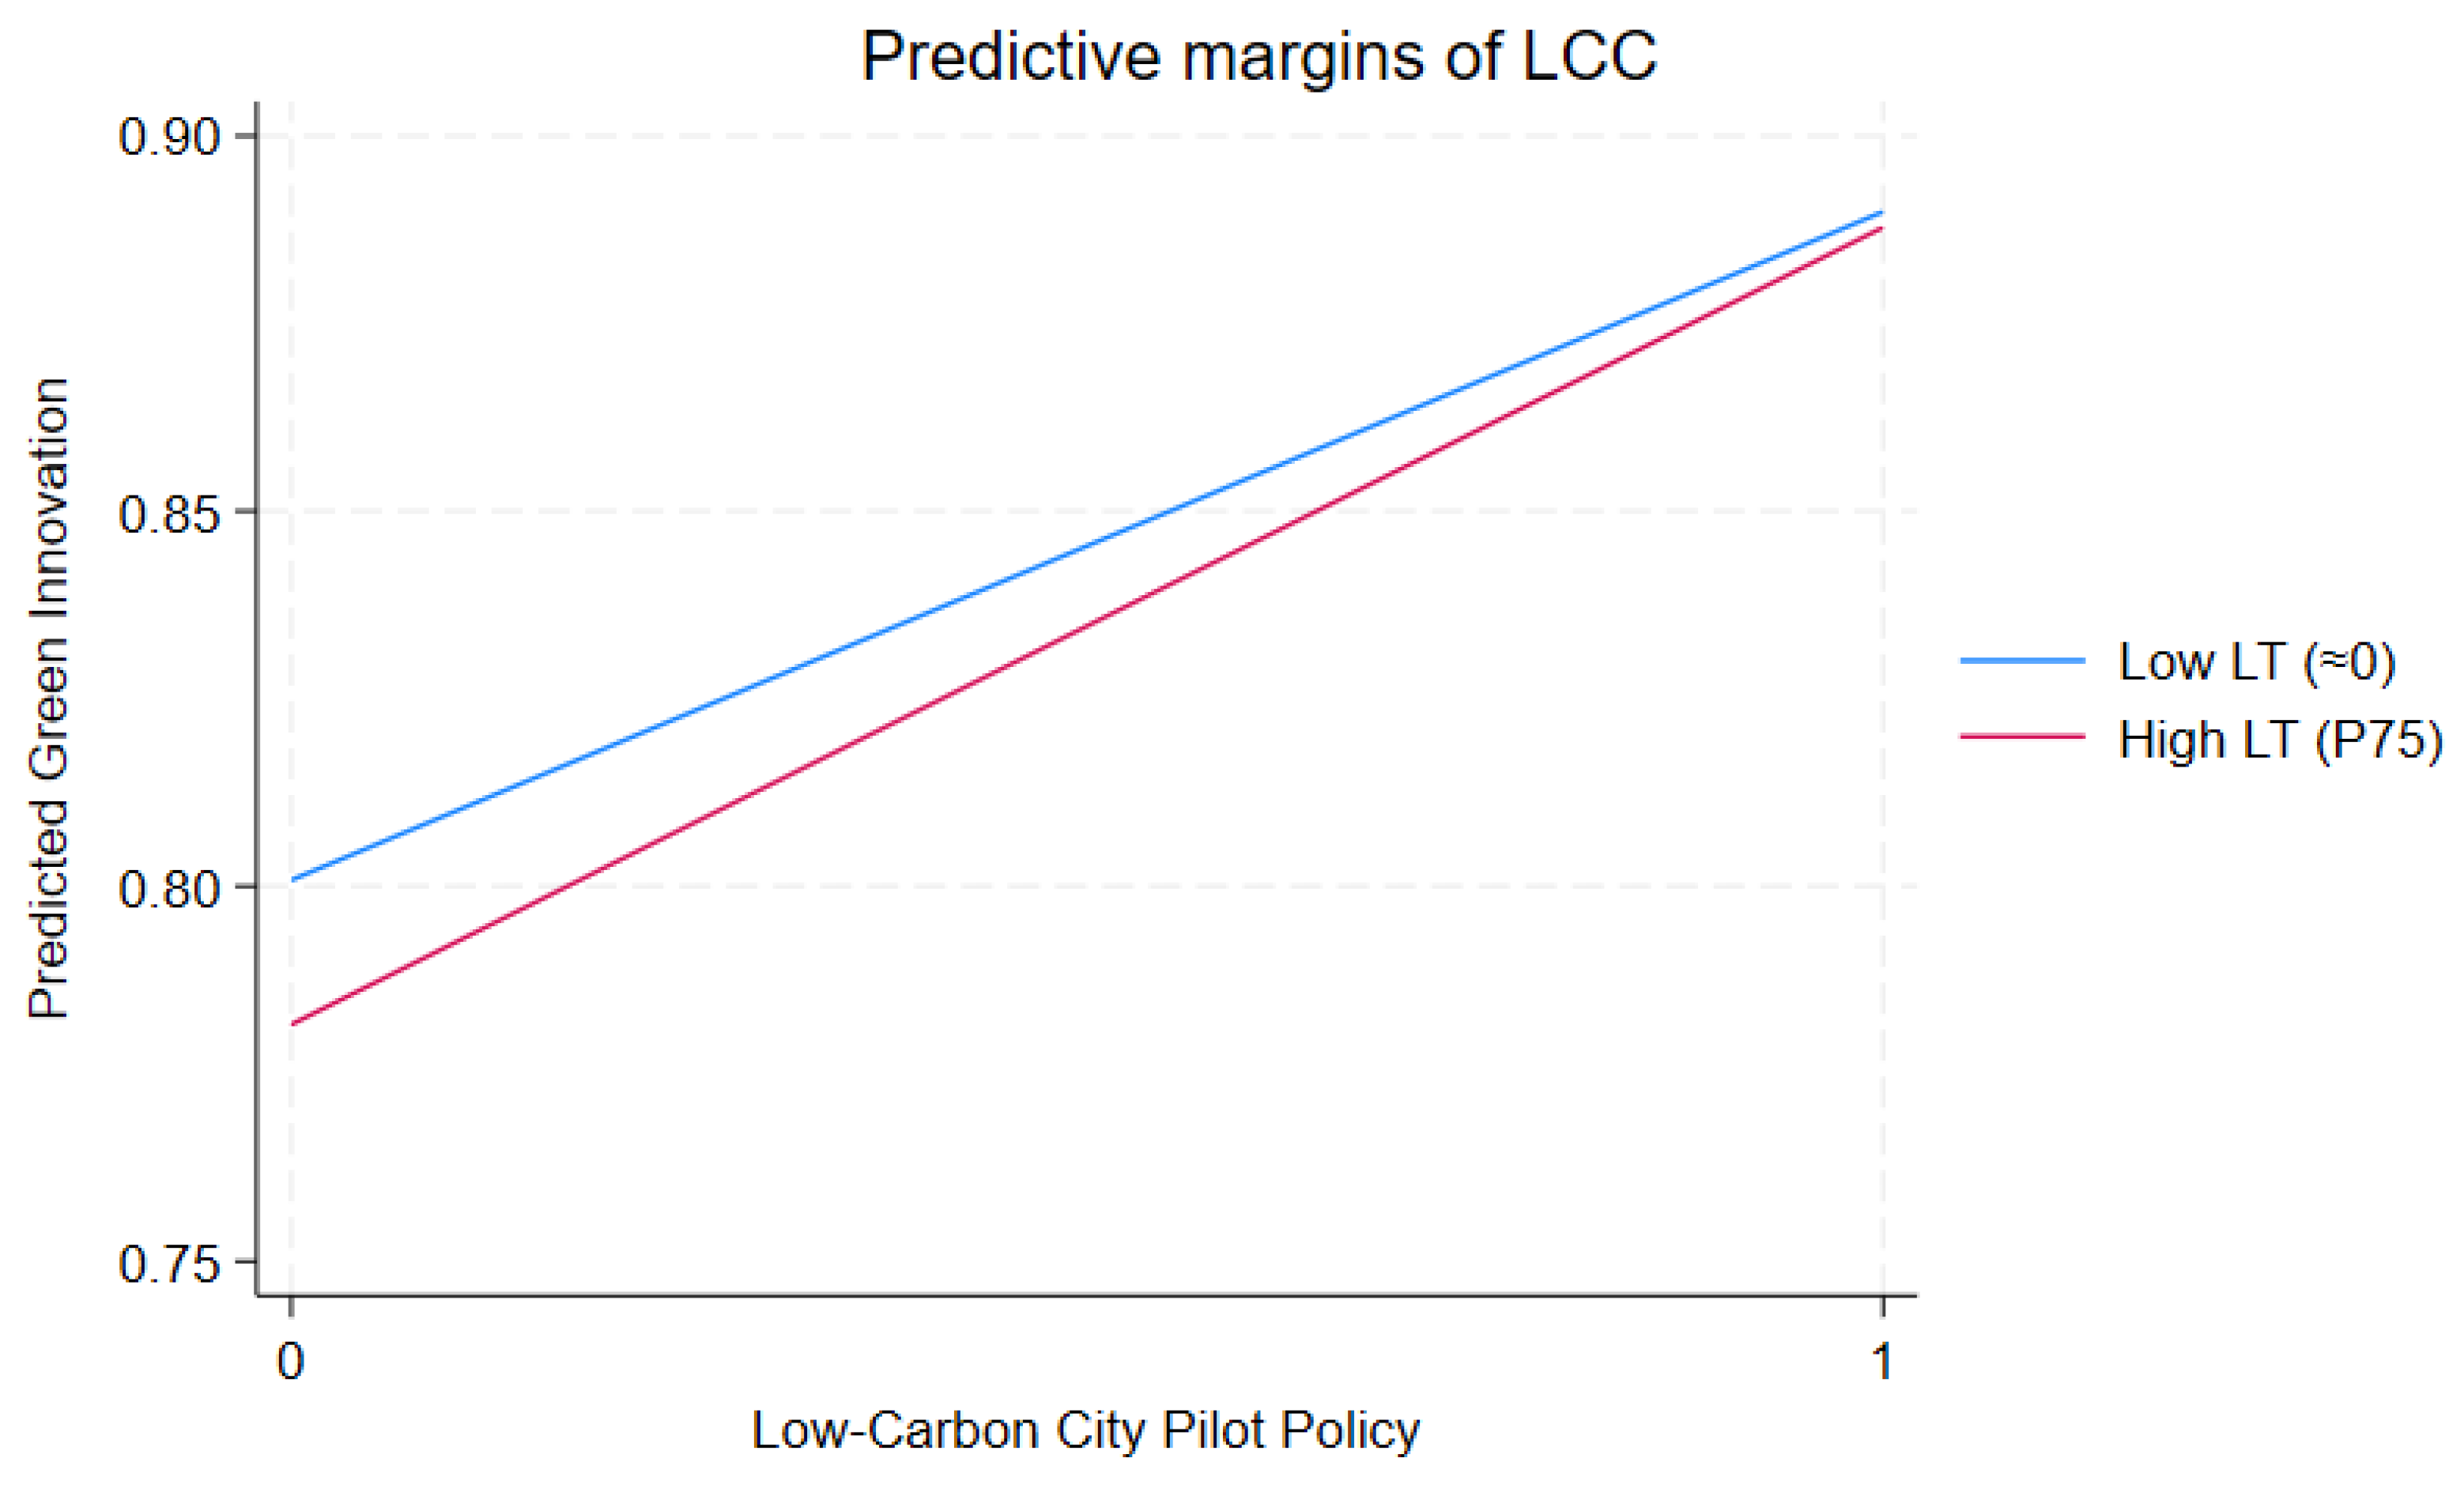
Figure 2 further illustrates this moderating effect. Although the absolute level differences in green innovation after policy implementation are not dramatically different across firms, the increase from pre-policy to post-policy periods is substantially larger for firms with higher long-term institutional ownership. This suggests that long-term-oriented financial capital alleviates short-term performance pressure and provides governance support for firms to absorb and internalize the long-term environmental objectives embedded in the policy. In this context, financial logic does not conflict with environmental logic; instead, it complements it by facilitating resource commitment to long-term innovation. Hypothesis 2a is therefore supported.
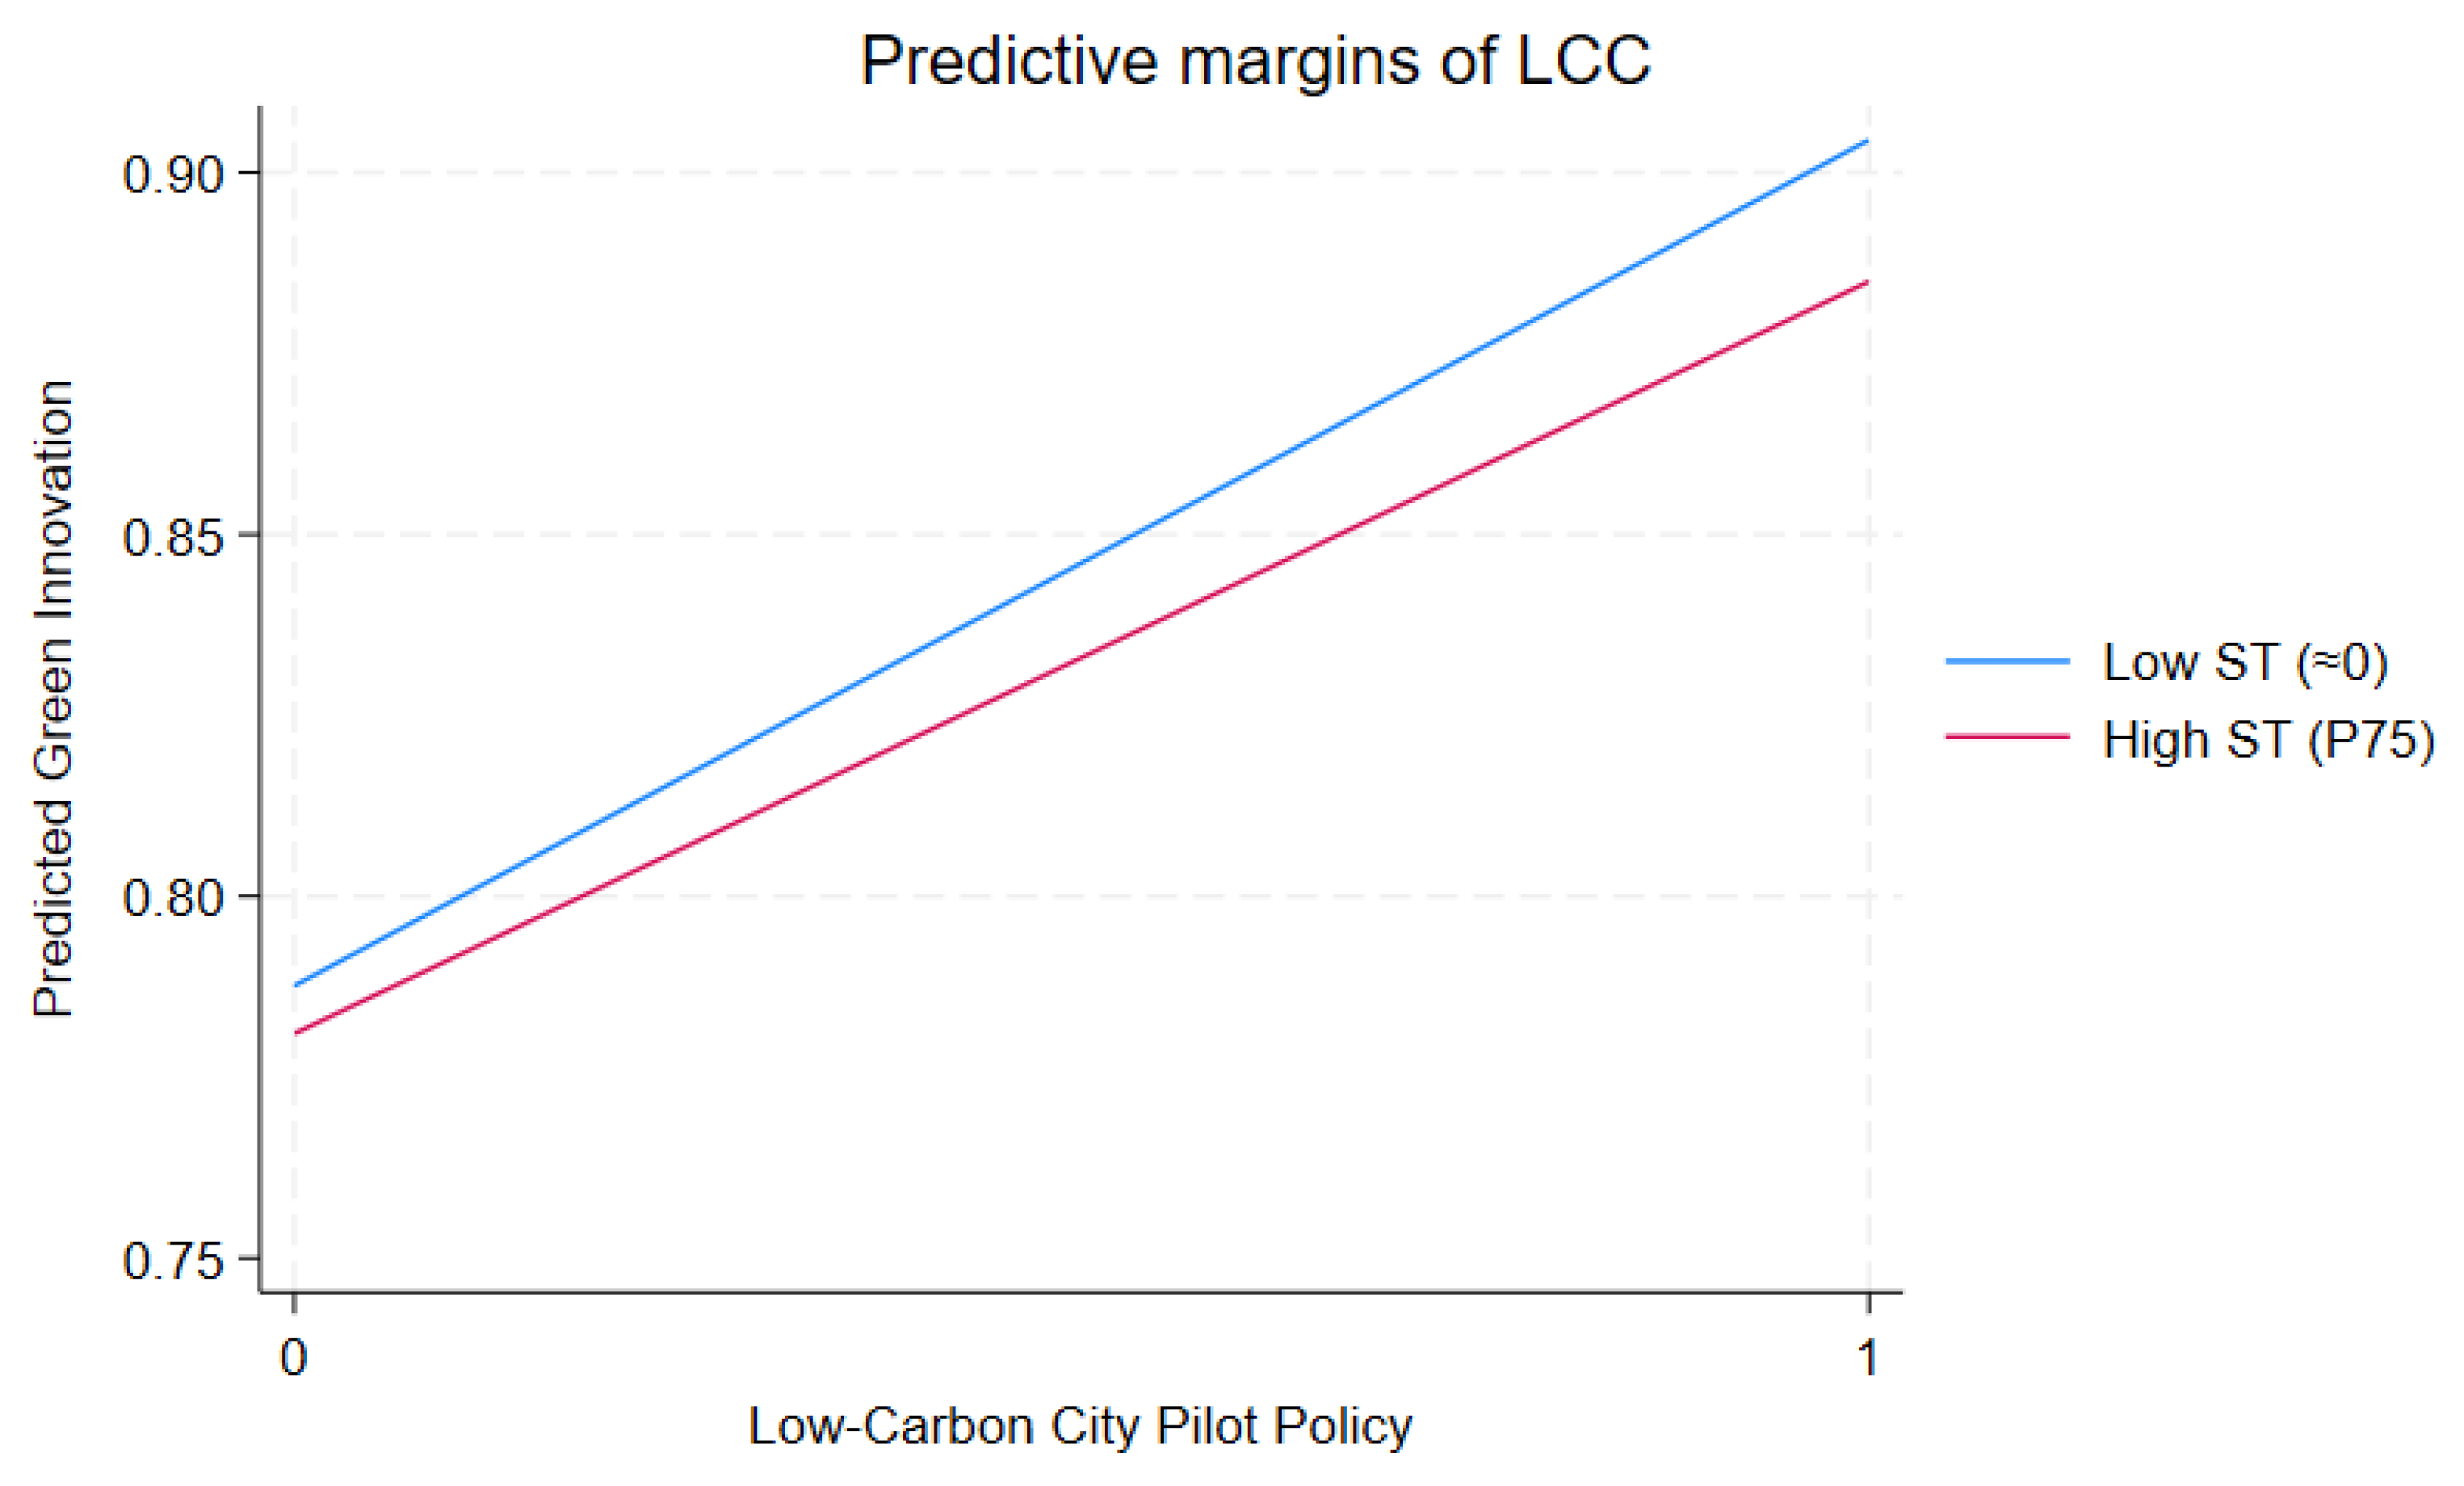
Figure 3 further confirms this pattern: firms facing stronger short-term capital pressure exhibit a smaller increase in green innovation following policy implementation. This finding suggests that short-term performance-oriented financial logic partially offsets the policy’s long-term innovation incentives. When capital markets emphasize immediate returns and risk avoidance, managers are more likely to interpret the LCCP policy as a compliance requirement rather than a strategic opportunity, thereby constraining sustained investment in green innovation. Hypothesis 2b is thus supported.

4.3. Robustness Checks

4.3.1. Parallel Trend Test

A key identifying assumption of the staggered DID model is the parallel trend assumption; that is, before the implementation of the policy, the trends in green innovation should be similar between firms in pilot cities and those in non-pilot cities. To test this assumption, we employ the event-study approach [25,30], which can be specified as follows:
G I i t = β 0 + k = 5 4 θ k D i t k + ρ X i t + α i + γ t + ε i t
where D i t k is a set of event-time dummy variables indicating whether firm i, located in city c, is in the k-th year relative to the implementation of the LCCP policy. The remaining variables are defined as in the baseline specification. The coefficients of interest are θk, which capture the difference in green innovation between firms in pilot and non-pilot cities in each event year relative to policy implementation.
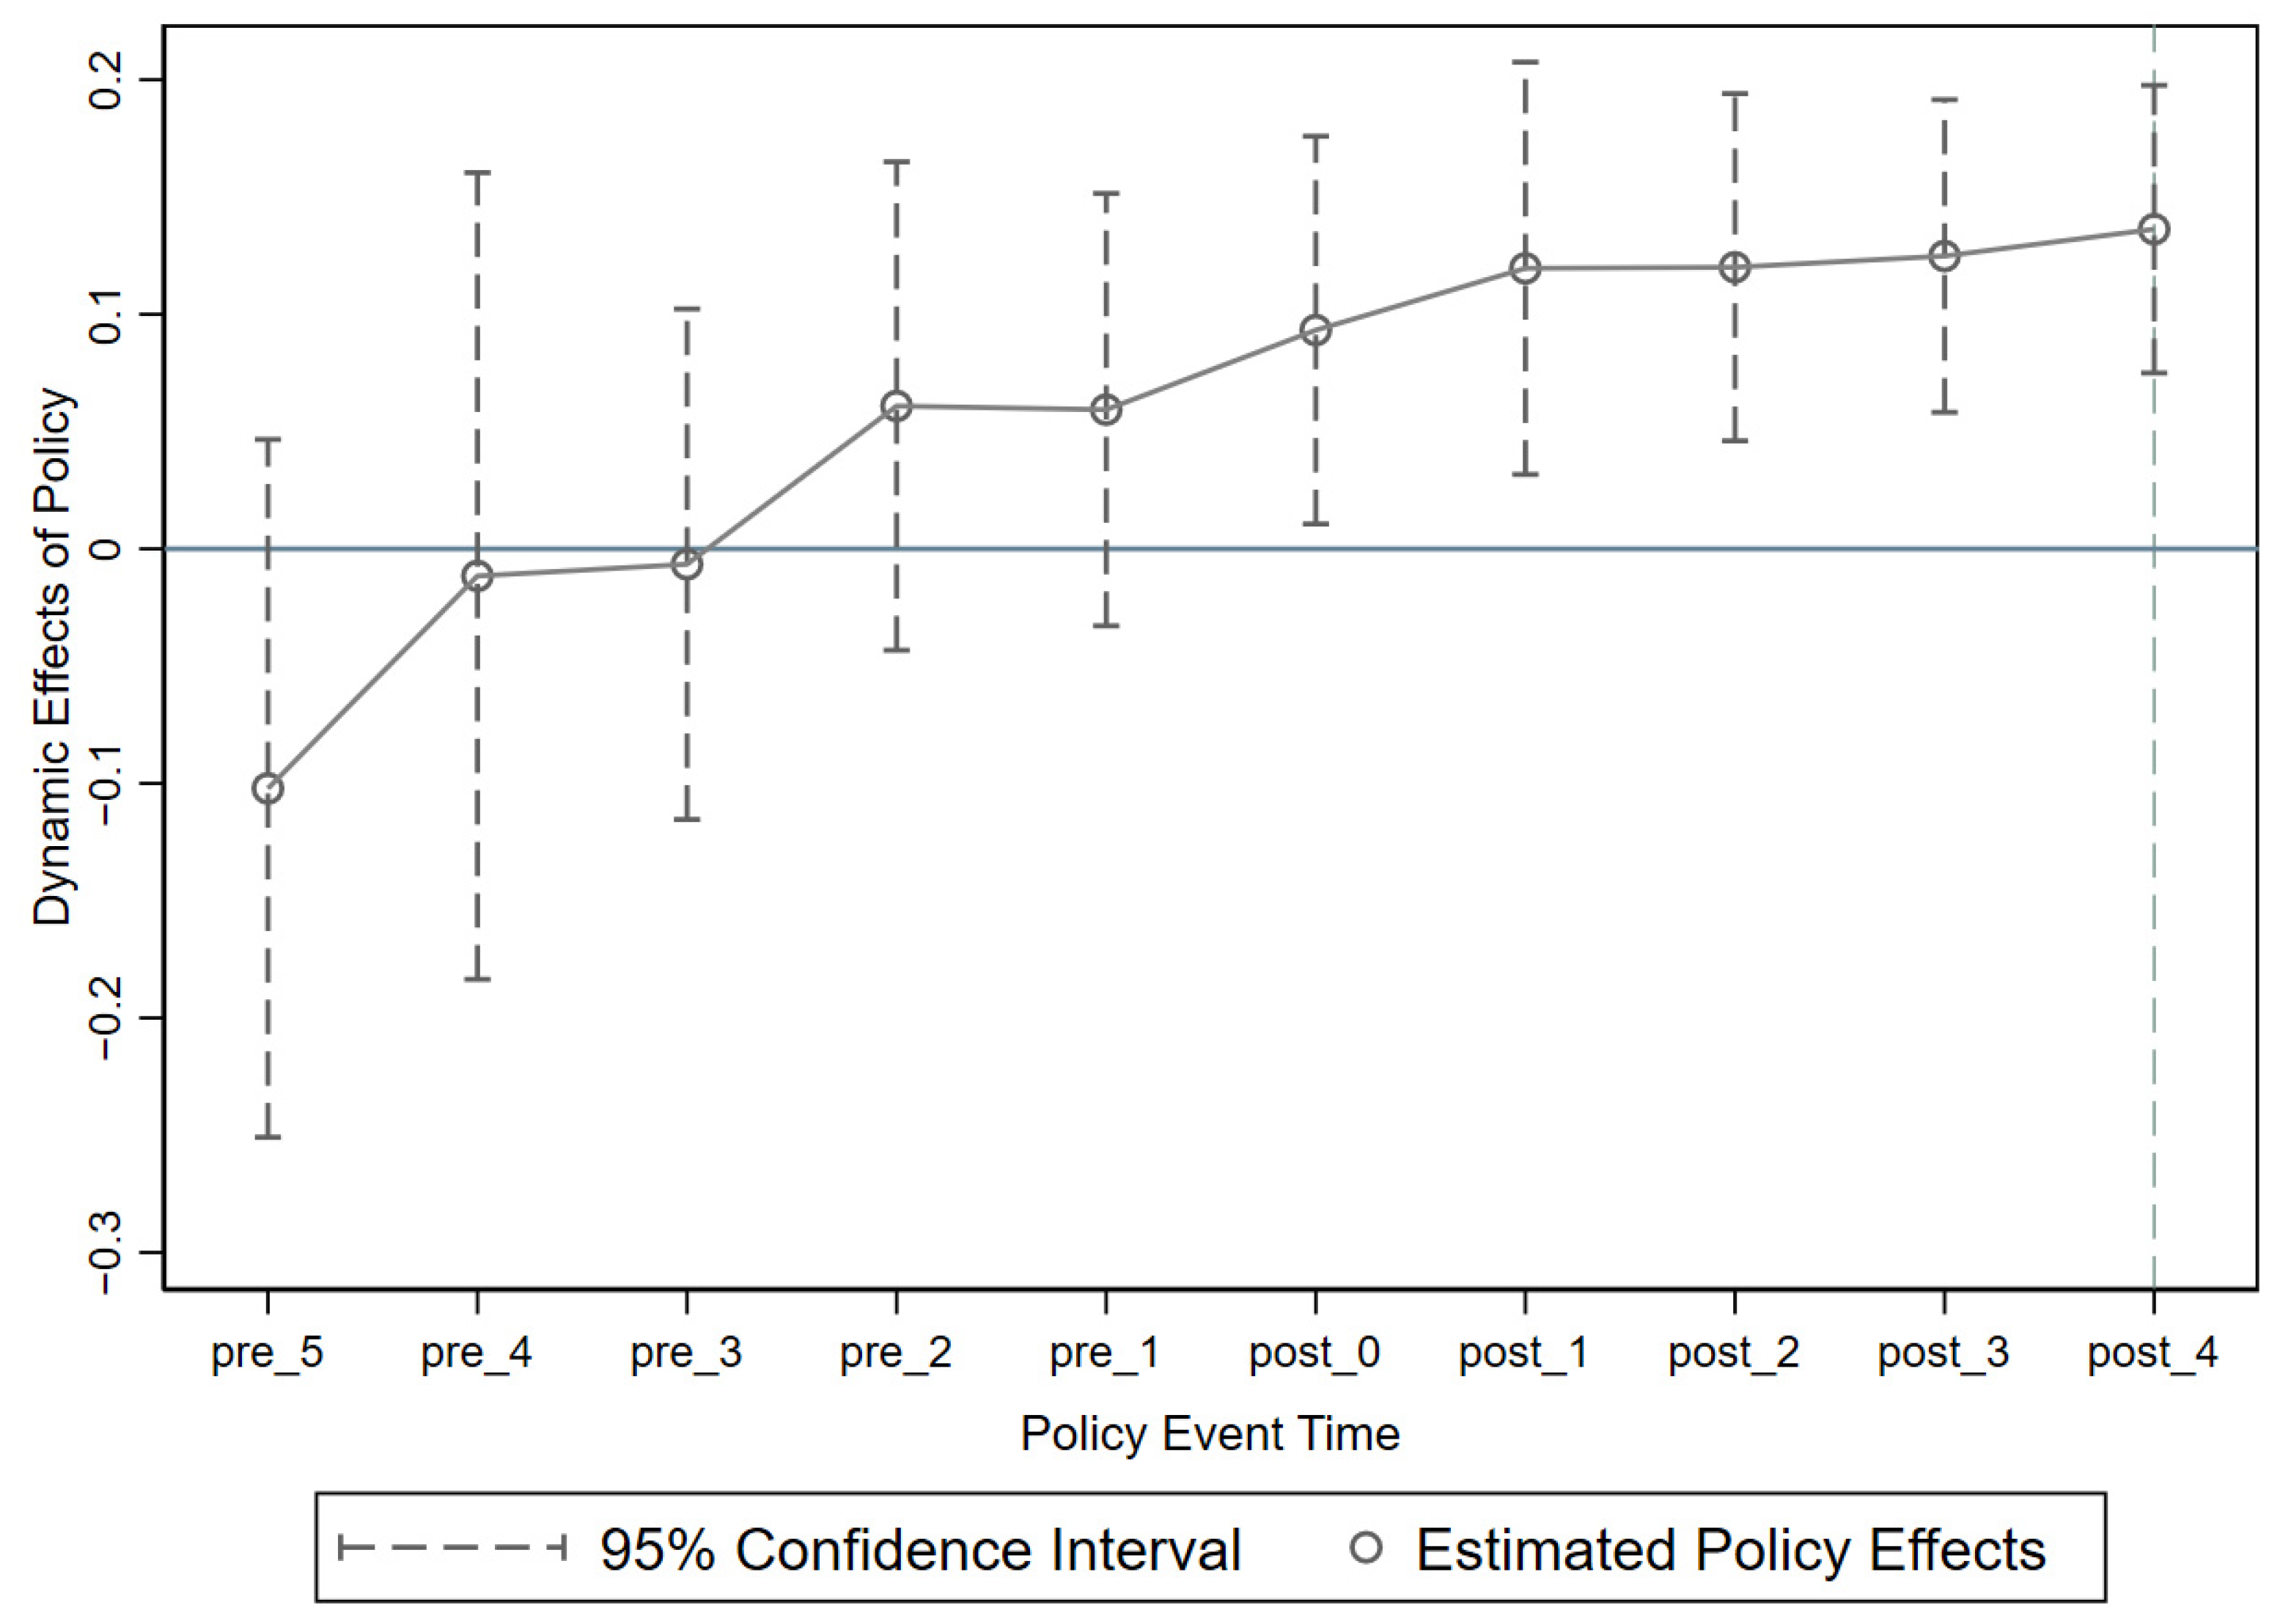
Because the number of observations is relatively limited in the distant pre- and post-treatment periods, observations earlier than five years before policy implementation are grouped into pre_5, while observations later than four years after implementation are grouped into post_4. For ease of visualization, the estimated event-study coefficients are centered by subtracting the average of the pre-treatment coefficients, such that the dynamic pattern can be interpreted relative to the mean pre-policy level.
Figure 4 presents the results of the parallel trend test. Before the implementation of the LCCP policy (pre_5 to pre_1), the estimated coefficients are statistically indistinguishable from zero and exhibit no systematic upward or downward trend, indicating that treated and control firms followed comparable pre-treatment trends in green innovation. This finding supports the validity of the parallel trend assumption.
By contrast, the coefficients become significantly positive in the implementation year (post_0) and remain positive thereafter. The policy effect further strengthens during the first one to two years after implementation and remains persistently positive over the longer term. This dynamic pattern is consistent with the institutional characteristics of the LCCP policy. Once a city is selected as a low-carbon pilot, carbon-reduction objectives are quickly incorporated into local development plans, administrative evaluation systems, and policy agendas, generating a strong and immediate signal for firms. Because this study measures green innovation using patent applications rather than patent grants or realized emission reductions, firms may respond relatively quickly by transforming existing R&D reserves, ongoing environmental projects, or incremental technological improvements into formal green patent applications. This helps explain why a significant policy effect emerges in the implementation year.
The further strengthening of the effect in post_1 and post_2 suggests that the policy impact is not merely a one-off compliance response. As local governments gradually introduce supporting measures, firms reallocate resources, and environmental objectives become more deeply embedded in organizational decision-making, the innovation-promoting effect of the policy accumulates over time. The persistently positive coefficients in subsequent years indicate that the LCCP policy functions not only as an immediate regulatory signal but also as a sustained institutional arrangement that encourages firms to internalize green innovation as a stable strategic response.

4.3.2. Two-Way Placebo Test

To further assess the robustness of the baseline results, we conduct a two-way placebo test after the parallel trend analysis. This test is designed to rule out spurious policy effects arising from model misspecification, sample selection bias, or unobserved common shocks [21,32].
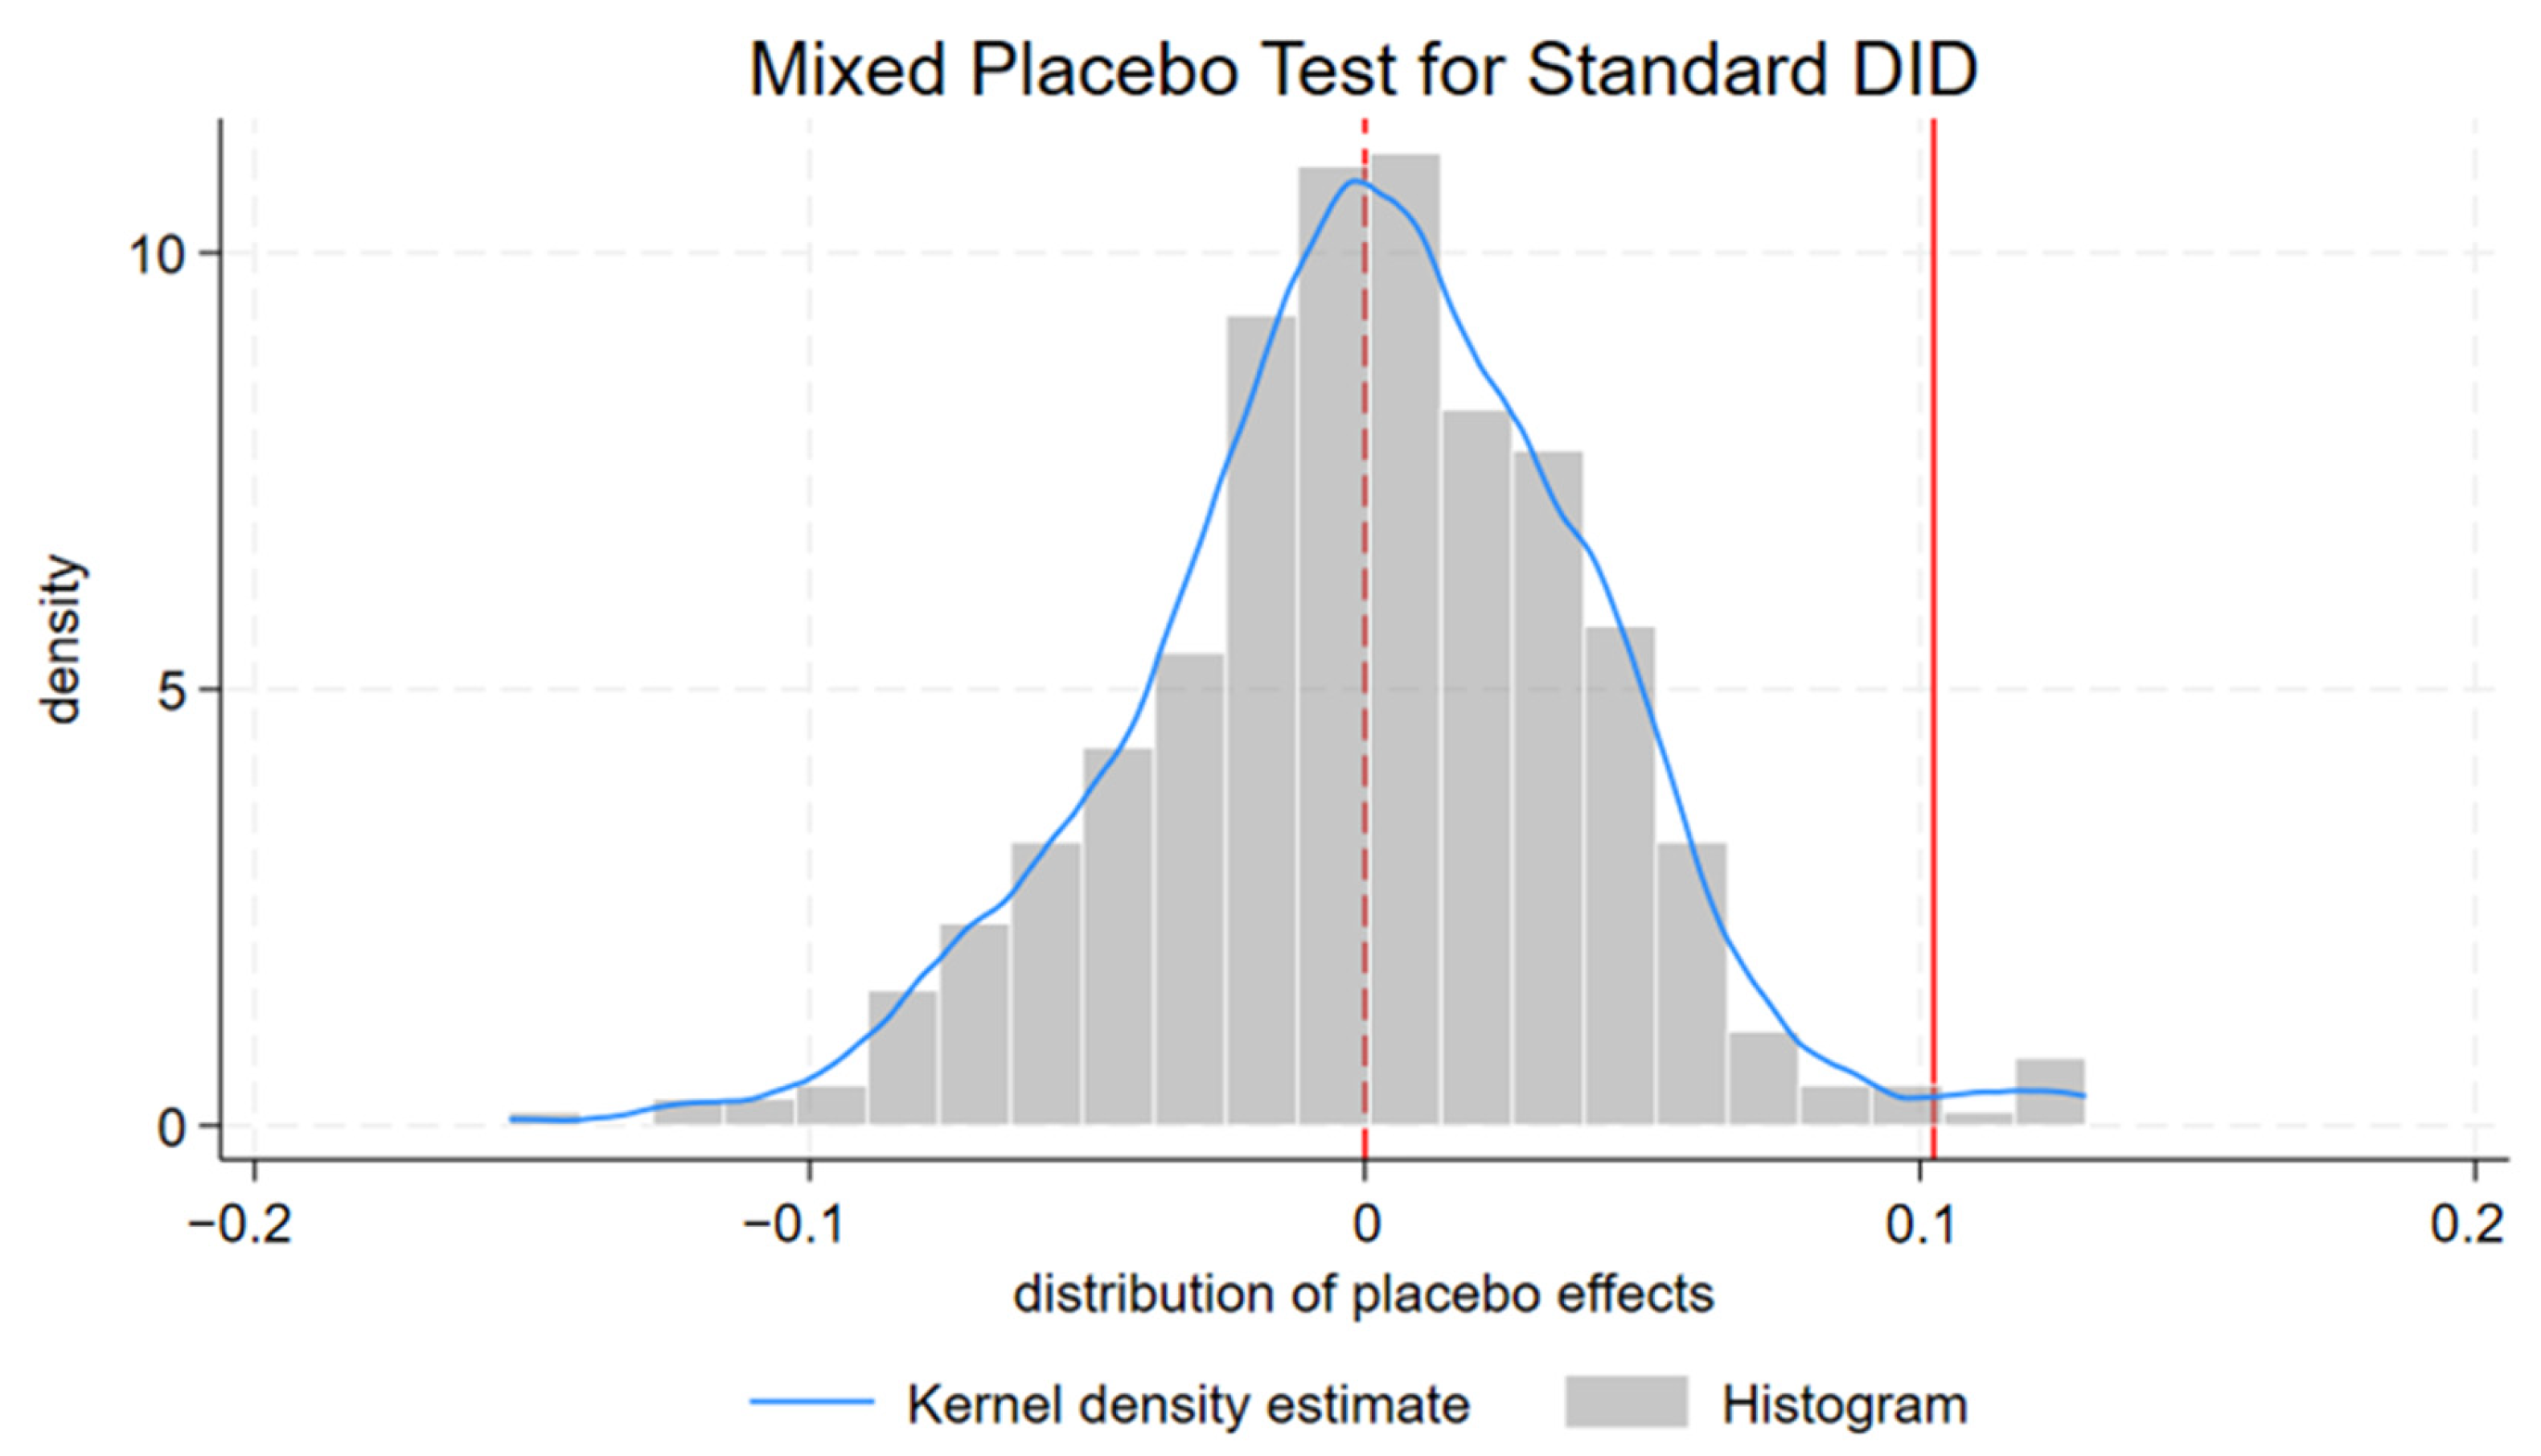
Unlike conventional placebo tests that randomize treatment only across time or units, the two-way placebo test randomizes both the assignment of treated cities and the timing of policy implementation. Specifically, we construct a set of “fake policy shocks” by randomly selecting placebo pilot cities while keeping the sample size unchanged, and then randomly assigning placebo implementation years within the sample period. Based on these random policy assignments, we re-estimate the baseline DID model 500 times and obtain the empirical distribution of placebo coefficients. The actual estimated policy effect is then compared with this distribution.
This design simultaneously breaks the true spatial assignment and temporal structure of the LCCP policy, thereby providing a strong test of the causal identification strategy. If the estimated policy effect were merely driven by model structure, sample characteristics, or common trends rather than by the policy itself, then similar significant coefficients should also arise under random policy assignments.
Figure 5 shows that the placebo estimates, represented by the gray histogram and blue kernel density curve, are approximately symmetrically distributed around zero. Most placebo coefficients are concentrated near zero and are statistically insignificant. By contrast, the actual estimated policy coefficient, shown by the red dashed line, lies far in the right tail of the placebo distribution and is substantially separated from its center. The probability of obtaining an estimate larger than the true policy effect under random assignment is therefore extremely small.
These results suggest that, in the absence of the actual policy shock, the model rarely generates a positive coefficient comparable to the baseline estimate. In other words, the positive effect of the LCCP policy on corporate green innovation is unlikely to be driven by spurious correlation, sample selection, or unobserved city-level heterogeneity. Combined with the parallel trend test, the placebo evidence shows that our identification strategy passes both the “pre-trend consistency” test and the “post-randomization invalidity” test. This further strengthens the credibility of our causal interpretation.

4.3.3. Alternative Measurement of the Dependent Variable

To examine whether the baseline findings are sensitive to the measurement of green innovation, we replace the original dependent variable with alternative indicators based on granted green patents rather than patent applications [28]. Specifically, we use the total number of granted green patents, granted green invention patents, and granted green utility model patents as alternative dependent variables, while keeping the sample period, model specification, control variables, and fixed effects unchanged. The results are reported in Table 4. The estimated coefficients remain consistent in both sign and significance across alternative measures of green innovation, suggesting that the baseline conclusion does not depend on a particular patent-based measure. The positive effect of the LCCP policy on corporate green innovation is therefore robust.

4.3.4. Sample Trimming

To ensure that the baseline results are not driven by extreme observations, we re-estimate the main model after trimming the sample at the 1% and 5% levels [33]. The results are reported in Table 5. After trimming the sample at both levels, the estimated coefficient on LCC remains significantly positive. Under 1% trimming, the coefficient of LCC is 0.086 and significant at the 1% level. Under 5% trimming, the coefficient is 0.050 and remains significant at the 10% level. These findings suggest that the baseline result is not driven by outliers and that the positive effect of the LCCP policy on corporate green innovation is robust to alternative sample restrictions.

4.3.5. Controlling for Other Policy Interventions

Given that green innovation may also be affected by overlapping policy interventions, recent studies increasingly emphasize the need to disentangle the effect of the focal policy from concurrent pilots or policy synergies [34]. To rule out the possibility that the baseline results are confounded by other policies implemented during the sample period, we identify five pilot policies that may also affect corporate green innovation: the Innovative City Pilot policy (Innocitypost), the Air Pollution Prevention and Control Action Plan pilot (Air10post), the National Smart City pilot (Smartcitypost), the Carbon Emissions Trading pilot (CarbonTradepost), and the Green Credit Subsidy policy (GreenCreditpost).
We incorporate these policy dummies into the baseline regression to allow them to compete directly with the LCCP policy in explaining green innovation outcomes, rather than absorbing them into a single aggregate control. Specifically, Innocitypost equals 1 if the firm’s city is included in the Innovative City Pilot program in a given year, and 0 otherwise; the other policy variables are defined analogously.
Table 6 shows that after controlling for these concurrent policy interventions, the estimated coefficient of LCC remains positive and statistically significant, and the overall pattern of results is highly similar to the baseline findings. This suggests that the main effect of the LCCP policy is unlikely to be driven by omitted policy shocks.

4.3.6. Controlling for Baseline City Characteristics and Trends

The ideal DID setting assumes that treatment assignment is random. However, if the selection of pilot cities is systematically related to city characteristics such as economic development, historical mission, or geographic location, then the evolution of these characteristics over time may bias the estimated policy effect.
To alleviate this concern, we further include interactions between baseline city characteristics and year trends. Specifically, we construct indicators for whether a city belongs to the “Two Control Zones,” whether it is a provincial capital, whether it is a special economic zone, and whether it is located east of the Hu Huanyong Line. These city characteristics are then interacted with year dummies, allowing different types of cities to follow heterogeneous time trends.
Although this approach cannot fully eliminate all unobservable selection bias, it substantially reduces systematic bias arising from observable city-level heterogeneity. As reported in Table 7, after controlling for these interacted city characteristics, the coefficient on LCC remains positive and statistically significant. This finding suggests that the baseline result is unlikely to be driven by systematic differences between pilot and non-pilot cities along observable dimensions.

4.3.7. Propensity Score Matching DID

Finally, to further address potential sample selection bias, we implement a propensity score matching difference-in-differences (PSM-DID) approach. Reverse causality is less of a concern in our setting because corporate green innovation, as the dependent variable, is unlikely to affect whether a city is selected into the LCCP policy. Nevertheless, treatment assignment may still be correlated with firm characteristics, generating sample selection bias.
PSM-DID does not rely on fully random treatment assignment; rather, it improves the comparability between treated and control groups by matching firms with similar observable characteristics [35]. Specifically, we use 2009, the year before the first batch of the LCCP policy, as the base year to estimate propensity scores based on firm characteristics. We then construct matched samples using three matching methods: nearest-neighbor matching, kernel matching, and radius matching. On these matched samples, we re-estimate the same DID specification with firm and year fixed effects.
Table 8, Table 9 and Table 10 report the results. Across all three matching methods, the estimated coefficient on LCC remains significantly positive, and the magnitude and significance levels are highly consistent with the baseline estimates. This indicates that the positive effect of the LCCP policy on green innovation remains robust even after imposing a stricter balance between treated and control firms. The slight differences in sample size across matching methods arise from differences in the observations satisfying the common support condition.
Overall, the PSM-DID results further confirm that the baseline conclusion is not driven by sample selection bias and that the positive effect of the LCCP policy on corporate green innovation is robust.

4.4. Further Analysis

4.4.1. Heterogeneity Analysis

(1) Ownership Structure
Given the institutional characteristics of the Chinese economy, state-owned enterprises (SOEs) and non-state-owned enterprises (non-SOEs) differ substantially in resource constraints, policy sensitivity, and strategic objectives. To examine whether the effect of the Low-Carbon City Pilot (LCCP) policy varies across ownership types, we divide the sample into SOEs and non-SOEs and re-estimate the baseline models for overall green innovation (GI), substantive green innovation (SGI), and strategic green innovation (StGI). This heterogeneity design is consistent with recent studies showing that ownership structure shapes firms’ green innovation responses to environmental regulation and public policy in China [36].
Table 11 reports the results. The positive effect of the LCCP policy on corporate green innovation is concentrated primarily in the SOE subsample. For SOEs, the coefficients of LCC on GI, SGI, and StGI are all positive and statistically significant at the 1% level. By contrast, for non-SOEs, the coefficient of LCC is generally insignificant, with only a marginally positive effect observed for StGI. These findings suggest that the policy effect differs substantially across ownership forms.
This pattern may be explained not only by political embeddedness, but also by differences in administrative performance evaluation and financing constraints across ownership types. SOE executives are more closely embedded in the state-led governance system and are more likely to face administrative performance evaluations linked to local policy priorities, including low-carbon development and environmental governance. As a result, the LCCP policy can be more readily translated into managerial accountability, organizational resource allocation, and green innovation activities in SOEs. In addition, SOEs often have relatively stronger access to policy support, credit resources, and long-term investment capacity, which enables them to absorb the costs and uncertainties associated with green innovation.
By contrast, non-SOEs are more exposed to market discipline, external financing constraints, and short-term performance pressure. Even when non-SOEs recognize the legitimacy of low-carbon transformation, limited access to stable financing and stronger pressure for immediate financial returns may reduce their ability or willingness to undertake green innovation projects with uncertain payoffs. The marginally significant effect on StGI in the non-SOE subsample further suggests that non-SOEs may be more inclined to adopt lower-cost and more visible green innovation responses when facing policy pressure. Therefore, the stronger policy effect observed in SOEs reflects both their closer connection to state logic and their greater capacity to respond to low-carbon policy objectives through sustained innovation activities. At the same time, the weaker response among non-SOEs suggests that low-carbon policies may require complementary financial and technological support to avoid widening the green innovation gap across ownership types.
(2) Firm Size
To further explore whether the policy effect varies by firm size, we construct a size dummy variable (Size_1) based on whether a firm’s total assets are above the industry-year mean, and then interact this variable with LCC in the baseline model. This approach is motivated by the idea that larger firms generally possess stronger resource endowments, greater absorptive capacity, and higher tolerance for compliance and innovation costs, and are therefore more likely to transform environmental policy pressure into innovation output. Recent studies on environmental regulation and green innovation also suggest that firm heterogeneity, including resource endowment and organizational capacity, conditions firms’ innovation responses to environmental constraints [37].
Table 12 presents the results. In the model for overall green innovation (GI), the main effect of LCC is not statistically significant, whereas the interaction term between LCC and Size_1 is positive and significant at the 1% level. This indicates that the positive effect of the LCCP policy is concentrated among larger firms. Similar patterns are observed when distinguishing between innovation types. In the SGI model, the interaction term LCC × Size_1 is significantly positive, suggesting that the policy effect on substantive green innovation is more pronounced among larger firms. In the StGI model, the interaction term also remains significantly positive, indicating that even for more incremental and legitimacy-oriented forms of green innovation, policy incentives are more effectively absorbed by larger firms.
Taken together, the size heterogeneity analysis shows that the impact of the LCCP policy is strongly size-dependent. Whether for overall green innovation or for its substantive and strategic components, the policy effect is mainly concentrated in larger firms, whereas smaller firms exhibit no significant response.
(3) Environmental Regulation Strength
Following recent studies that measure local environmental regulation intensity using the textual salience of environmental issues in government work reports, we construct a city-level indicator of environmental regulation strength (ERS) based on the share of sentence length devoted to environmental topics in municipal government reports. This measure captures the prominence of environmental governance in local policy discourse and has been increasingly used in recent studies of green innovation and environmental governance in China [38].
The regression results are shown in Table 13. After controlling for firm characteristics, city-level conditions, firm fixed effects, and year fixed effects, the LCCP policy remains positively and significantly associated with GI, SGI, and StGI, confirming the robustness of the baseline findings. However, neither the coefficient of ERS nor the interaction term LCC × ERS is statistically significant in any of the three models.
These results indicate that although environmental regulation is generally an important external constraint on corporate environmental behavior, city-level variation in environmental regulation intensity does not significantly strengthen or weaken the marginal effect of the LCCP policy on green innovation. A plausible explanation is that the LCCP policy itself constitutes a relatively strong and independent institutional arrangement with explicit targets and performance assessment mechanisms. As a result, firms may respond primarily to the specific incentives and constraints embodied in the low-carbon pilot policy rather than to broader differences in local environmental regulation intensity. More generally, the effect of city-level environmental regulation may operate more through compliance, environmental investment, or long-run governance adjustment than through short-term observable green patent outcomes [39].
Taken together, the heterogeneity analyses suggest that the effect of the LCCP policy is not uniform across firms and institutional environments. The ownership and firm-size results indicate that the policy is more easily translated into green innovation when firms have stronger ties to state logic, greater resource slack, and higher absorptive capacity. By contrast, the insignificant moderating effect of environmental regulation strength suggests that the LCCP policy operates as a relatively targeted institutional arrangement rather than simply being amplified by broader local environmental regulation intensity. These findings indicate that the effectiveness of low-carbon policy depends not only on policy design itself, but also on firms’ resource endowments, ownership-related governance structures, and institutional embeddedness. This pattern also suggests a potential equity concern: without complementary support, low-carbon policies may widen the green innovation gap between resource-rich firms and resource-constrained firms.

4.4.2. Mechanism Tests

The preceding analyses demonstrate that the Low-Carbon City Pilot (LCCP) policy significantly promotes corporate green innovation and that its effect varies across institutional contexts. However, understanding why and how the policy effect emerges requires moving beyond external regulatory explanations. Rather than treating the LCCP policy merely as an exogenous environmental constraint, this study argues that its influence operates through a cognitive transmission mechanism within the firm. Specifically, we propose that the LCCP policy reshapes managerial attention allocation, which in turn affects firms’ green innovation decisions. This perspective integrates institutional logics theory with the attention-based view (ABV) of the firm. Unlike a purely theoretical proposition, this section empirically tests the attention mechanism using text-based measures constructed from annual report narratives.
According to the attention-based view, organizational behavior depends fundamentally on what decision-makers attend to [40]. Institutional shocks do not directly translate into strategic action; instead, they first alter how managers allocate attention across competing issues and time horizons. Empirical research has shown that managerial attention mediates the relationship between external pressures and strategic change [41]. In the context of green transition, climate policies may influence firms not only by imposing compliance costs, but also by increasing the salience of environmental issues within managerial cognition. Recent studies also show that environmental attention—whether at the governmental or top-management level—can significantly affect firms’ green innovation behavior [42].
From an institutional logics perspective, the LCCP policy represents a hybrid institutional arrangement: it advances environmental logic while being implemented through state logic mechanisms such as performance evaluation and policy accountability. Such institutional design elevates environmental concerns within the organizational decision agenda. Therefore, if the LCCP policy changes what managers pay attention to—and how they structure their attention across content and time dimensions—green innovation may emerge as a cognitively mediated strategic response rather than merely a compliance-driven reaction.
(1) Attention Content Allocation
Attention content allocation refers to the distribution of managerial cognitive resources across issue domains—namely, what managers choose to focus on in strategic discourse and decision-making. Under the LCCP framework, firms must reconcile traditional economic objectives with environmental sustainability goals. The policy strengthens the institutional legitimacy of environmental logic, potentially increasing managerial attention toward environmental protection, low-carbon development, green technologies, and emission reduction. When environmental issues occupy a greater proportion of managerial attention, firms are more likely to allocate strategic resources toward green innovation.
Empirically, managerial attention can be inferred from textual disclosures. Annual reports—especially the Management Discussion and Analysis (MD&A) section—provide structured and repeated expressions of managerial priorities. In practical corporate settings, these narratives communicate firms’ strategic priorities, risk perceptions, and future plans to investors, regulators, and other stakeholders. Prior research has demonstrated that annual report text captures managerial cognition and issue salience [43], and that textual signals are closely associated with corporate green innovation behavior. Building on this literature, this study constructs a text-based measure of attention content allocation (ACA) using MD&A narratives. Specifically, (1) we begin with a baseline environmental keyword dictionary adopted from prior Chinese research [44]. (2) We train a Word2Vec Continuous Bag-of-Words (CBOW) model on the corpus of annual reports to identify semantically similar terms. (3) Candidate words that appear more than 1000 times and exhibit similarity above 30% are retained. (4) Three academic and industry experts manually validate the expanded vocabulary to ensure contextual appropriateness. ACA is measured as the proportion of environment-related word frequency in the MD&A section multiplied by 100, and then log-transformed to mitigate skewness.
(2) Attention Temporal Allocation
In addition to what managers pay attention to, the attention-based view also emphasizes when they focus their attention. Attention temporal allocation reflects whether managers prioritize short-term operating performance or long-term strategic objectives and future development. Recent studies on government environmental attention and top management environmental attention also suggest that temporal and issue-based attention can reshape firms’ environmental innovation behavior [44]. Green innovation is typically characterized by long development cycles, uncertain returns, and delayed performance realization, and therefore requires a stronger long-term orientation. Because the LCCP policy has an inherently long-term and cumulative character, it may have the potential to influence not only the content of managerial attention but also its temporal orientation. However, compared with attention to specific issues, temporal orientation is likely to be more deeply embedded in firms’ existing investment cycles, performance evaluation systems, and strategic routines. Whether the policy can shift managers from present-oriented concerns toward future-oriented planning therefore remains an empirical question.
Overall, as a hybrid institutional arrangement that uses state logic as a means to pursue environmental logic, the LCCP policy continuously embeds environmental concerns into the decision-making environment of local governments and firms through target setting, performance assessment, and supporting policy measures. On the one hand, it raises the priority of environmental issues in the institutional field, increasing firms’ exposure and responsiveness to low-carbon policy signals. On the other hand, its gradual implementation means that low-carbon concerns become a persistent institutional background rather than a one-off external shock. In this process, managers may incorporate green and low-carbon issues into their core agenda in terms of attention content, while whether such institutional pressure is sufficient to reshape their temporal orientation remains less certain.
Attention temporal allocation (ATA) is measured in two directions: future-oriented attention (ATA1), which captures the degree of attention devoted to long-term development, future planning, and strategic outlook; and present-oriented attention (ATA2), which captures attention devoted to short-term performance, current operations, and immediate issues. We further construct a relative temporal attention measure, Rel_ATA = ATA1 − ATA2, and standardize it to capture the extent to which managerial attention shifts from a present-oriented to a future-oriented structure. Higher values indicate stronger long-term orientation. The lexical construction for ATA1 and ATA2 follows the same three-step text-mining procedure used for ACA. This text-based attention design is consistent with a growing literature that uses annual report narratives and managerial discourse to capture environmental attention and strategic cognition. Table 14 shows the keyword list for attention allocation.
Table 15 reports the mechanism results. The LCCP policy has a positive effect on attention content allocation (ACA), with a coefficient of 0.001 that is significant at the 10% level. This suggests that the policy increases the salience of environmental issues in firms’ overall attention structure by reinforcing the institutional authority of environmental goals. When ACA is then included in the green innovation regression, it is positively and significantly associated with GI. At the same time, the coefficient on LCC declines from 0.105 in the baseline model to 0.100, while remaining significant at the 1% level. These results indicate that greater managerial attention to environmental issues promotes corporate green innovation and partially mediates the effect of the LCCP policy.
We next examine whether the policy affects firms’ temporal attention allocation. The results show that the LCCP policy does not significantly affect future-oriented attention (ATA1), present-oriented attention (ATA2), or their relative structure (Rel_ATA). This implies that the policy does not systematically shift managers’ attention from short-term operations toward long-term planning, and that the cognitive transmission of the LCCP policy is more evident in the content dimension than in the temporal dimension of attention.
The insignificant effects on temporal attention are theoretically meaningful. Compared with attention to specific issues, managerial temporal orientation may be more difficult to alter because it is embedded in firms’ predetermined investment cycles, technological trajectories, budgeting arrangements, and existing performance evaluation systems. Even after the salience of low-carbon issues increases, managers may remain constrained by ongoing projects and established resource-allocation routines, making it difficult to rapidly reorient attention from present concerns to future planning. In addition, listed firms continue to face external market performance pressure and short-term financial evaluation, which may limit managers’ willingness or ability to adopt a more future-oriented attention structure. Uncertainty regarding the timing, intensity, and continuity of local policy implementation may also help explain the limited immediate effect of the LCCP policy on temporal attention, as managers may remain cautious about whether low-carbon policy signals will generate sufficiently stable long-term returns.
However, ATA2 is negatively associated with GI at the 5% level, indicating that when managers focus more heavily on current performance, short-term results, and immediate returns, firms’ green innovation declines significantly. This suggests that present-oriented attention constitutes an important constraint on green innovation. Importantly, this inhibitory effect does not arise because the LCCP policy directly increases present-oriented attention; rather, it reflects a broader structural short-termism faced by firms. Thus, the results imply that environmental policy can raise the strategic salience of green issues without necessarily overcoming the temporal rigidity created by investment cycles and market pressures.
Overall, the mechanism analysis suggests that under multiple institutional logics, institutional practices are more likely to influence firms by reshaping what managers pay attention to rather than when they pay attention. The LCCP policy increases the weight of environmental issues in the managerial attention structure, and this increase in environmental attention significantly promotes green innovation. By contrast, temporal attention allocation does not appear to be significantly altered by the policy, even though present-oriented attention itself constrains green innovation. These findings reveal an internal cognitive mechanism through which the LCCP policy affects firms: rather than directly transforming firms’ temporal orientation, the policy first gives environmental issues greater strategic priority within managerial cognition. This pattern also indicates that changing managers’ long-term orientation may require not only environmental policy signals but also complementary institutional conditions that relax short-term performance pressure and provide more stable expectations for long-cycle green investment. This mechanism-based evidence complements the institutional logics perspective and the attention-based view by clarifying how institutional shocks are translated into organizational innovation behavior.

5. Conclusions

5.1. Main Findings

Against the backdrop of deepening global climate governance and China’s continued pursuit of its “dual-carbon” goals, this study examines how the Low-Carbon City Pilot (LCCP) policy affects corporate green innovation using a gradual DID design. Three main conclusions emerge.
First, the LCCP policy significantly promotes corporate green innovation. The positive effect holds not only for overall green innovation but also for both substantive green innovation (green invention patents) and strategic green innovation (green utility-model patents). This indicates that the policy generates a broad-based innovation response rather than inducing a single technologically intensive innovation path. In this sense, the LCCP policy functions as an effective institutional driver that encourages firms to internalize environmental objectives into innovation activities, consistent with recent evidence that environmental regulation can stimulate firm-level green innovation [36].
Second, the policy effect is institutionally contingent on the temporal orientation of financial capital and firm characteristics. Long-term institutional investors significantly strengthen the positive impact of the LCCP policy on green innovation, whereas short-term institutional investors weaken this relationship. Moreover, the policy effect is more pronounced among state-owned enterprises and large firms, while it does not significantly vary with general city-level environmental regulation intensity. These findings suggest that the governance effectiveness of low-carbon policy depends on the compatibility between environmental logic and financial logic, as well as firms’ organizational capacity to absorb policy pressure.
Third, the policy influences corporate green innovation primarily through a cognitive mechanism—reconstructing managerial attention content rather than shifting attention temporality. Specifically, the LCCP policy increases managerial attention to environmental and low-carbon issues, and this heightened environmental attention is positively associated with green innovation. However, the policy does not significantly alter firms’ overall future-versus-present attention orientation. This finding indicates that low-carbon policy operates mainly by reshaping “what firms focus on” rather than “how far ahead they focus,” highlighting the micro-level cognitive channel through which institutional pressures translate into strategic innovation behavior.

5.2. Theoretical Contributions

This study makes two primary theoretical contributions. On the one hand, it advances institutional logics research by theorizing and empirically demonstrating the institutional contingency of environmental policy effects. Some studies have increasingly recognized that firms operate under institutional complexity and that strategic responses depend on how multiple logics interact rather than on any single institutional pressure alone [45]. More recent sustainability research further suggests that environmental regulation does not uniformly stimulate green innovation; instead, its effect varies across governance contexts and firm-level characteristics [46]. Building on this stream, we conceptualize the Low-Carbon City Pilot (LCCP) policy as a hybrid institutional arrangement that advances environmental logic through the enforcement mechanisms of state logic [5]. Rather than treating policy as an exogenous shock with homogeneous effects, we embed it within a multiple-logics framework and demonstrate that its innovation effect is contingent upon the temporal orientation of financial logic. Specifically, long-term institutional investors amplify, whereas short-term capital weakens, the policy’s effect on green innovation. This finding contributes to recent debates on sustainable finance, which emphasize that financial capital is not monolithic but differs in time horizon, monitoring intensity, and sustainability orientation [27,47]. By integrating institutional logics with financial time orientation, this study provides a micro-foundational explanation for why environmental policy produces heterogeneous governance outcomes across firms.
On the other hand, this study further contributes to attention-based and sustainability strategy research by identifying attention content reconstruction as a distinct cognitive transmission mechanism linking institutional pressure to green innovation. While institutional theory often assumes that external pressures translate into strategic action, recent work calls for greater attention to the cognitive processes through which managers interpret and respond to institutional signals [16]. In parallel, emerging research shows that managerial climate attention can be systematically measured through textual analysis of corporate disclosures and that such attention is closely related to corporate climate action and green innovation [44]. Building on this literature, we distinguish between attention content allocation (what managers focus on) and attention temporality (future vs. present orientation). Our findings show that the LCCP policy significantly increases managerial attention to environmental and low-carbon issues, and that this increase is positively associated with green innovation. By contrast, the policy does not significantly shift firms’ overall future-versus-present attention structure. This distinction refines the attention-based view by demonstrating that institutional change may operate primarily through re-prioritizing issue salience rather than altering intertemporal orientation. By combining textual measures of managerial attention with a gradual DID design, we bridge institutional logics theory and attention-based research, offering a more granular explanation of how macro-level sustainability policy is cognitively internalized and translated into firm-level innovation.

5.3. Practical Implications

This study also offers several practical implications. First, the findings clarify how corporate green innovation strategies contribute to sustainable development in China’s low-carbon transition. Substantive green innovation, which involves more technologically intensive and long-cycle investment, can support SDG 9 on Industry, Innovation and Infrastructure by strengthening firms’ green technological capabilities, and SDG 13 on Climate Action by contributing to carbon-emission mitigation. Strategic green innovation, although more incremental and legitimacy-oriented, may still help firms respond to sustainability expectations and gradually incorporate environmental concerns into organizational routines, thereby contributing to SDG 12 on Responsible Consumption and Production and SDG 13 on Climate Action. In the Chinese context, the “dual-carbon” goals have transformed sustainability from a broad normative agenda into concrete policy targets embedded in local planning, administrative evaluation, and industrial policy. The LCCP policy reflects this governance logic by translating carbon-mitigation objectives into local government responsibilities and corporate innovation behavior.
Second, policymakers should pay attention not only to regulatory intensity itself, but also to whether policy incentives are compatible with capital market governance structures and firm-level resource conditions. Since the policy effect is stronger in firms with more long-term institutional ownership, improving green disclosure standards, strengthening long-term performance assessment, and providing stable expectations for long-cycle green investment may help policy signals be translated into substantive innovation investment. At the same time, differentiated support should be provided to smaller and non-state firms, which may face stronger financing constraints and weaker resource capacity. Such differentiated support can reduce financing constraints and resource barriers, helping a wider range of firms participate in low-carbon transformation and sustainable production. Recent studies similarly show that both green institutional investors and analyst attention can promote firms’ green innovation, and that the relationship between environmental regulation and green innovation differs systematically by ownership type.
Third, firms themselves should strengthen internal governance mechanisms that bring environmental issues onto the strategic agenda. Since our mechanism results suggest that attention content matters more than temporal attention shifts, firms may improve green innovation persistence by embedding environmental issues into managerial reporting, sustainability committees, internal carbon-management systems, and strategic planning routines. This is particularly important because sustainability goals are not automatically translated into organizational action; they need to be internalized through managerial attention, resource allocation, and governance routines. This implication is supported by recent research showing that climate-related managerial attention and external information attention are positively associated with green innovation.

5.4. Limitations and Future Research

This study has several limitations that suggest promising directions for future research. First, green innovation is measured mainly by green patent applications. Although patent applications are suitable for capturing firms’ innovation intentions and policy responses, they do not directly reflect whether such innovation ultimately leads to actual emission reductions or environmental performance improvements. Future research could combine patent-based indicators with firm-level or facility-level carbon-emission data to examine whether policy-induced green innovation is translated into measurable low-carbon outcomes. Second, although the text-based measures of managerial attention used in this study are consistent with prior research and enable large-sample analysis, they remain primarily descriptive proxies for managerial cognition. Future studies could combine textual analysis with experimental methods, surveys, interviews, or more detailed executive background data to strengthen the causal explanation of how managerial attention is formed and how it affects green innovation decisions. Third, this study focuses mainly on internal managerial attention and on the temporal orientation of institutional investors as one important boundary condition. Future research could further examine how external attention from governments, analysts, media, investors, and the public interacts with internal managerial attention, and how other institutional actors or governance mechanisms jointly shape firms’ responses to low-carbon policy.

Author Contributions

Conceptualization, Y.G.; methodology, Y.G. and C.C.; software, Y.G. and Z.Z.; validation, Y.G., D.L. and C.C.; formal analysis, Y.G., X.H. and Z.Z.; investigation, Y.G.; resources, Y.G. and C.C.; data curation, X.H. and Z.Z.; writing—original draft preparation, Y.G.; writing—review and editing, Y.G., D.L., C.C., Z.Z. and X.H.; visualization, X.H. and Z.Z.; supervision, Y.G.; project administration, Y.G. All authors have read and agreed to the published version of the manuscript.

Funding

This paper was supported by the Ministry of Education of Humanities and Social Science project (grant number: 23YJA630063).

Institutional Review Board Statement

Not applicable.

Informed Consent Statement

Not applicable.

Data Availability Statement

The original contributions presented in this study are included in the article. Further inquiries can be directed to the corresponding author.

Conflicts of Interest

The authors declare no conflicts of interest.

Appendix A. Supplementary Analysis

Table A1 reports the full Pearson correlation matrix for the variables used in the empirical analysis.
Table A1. Correlation matrix.
VariablesGISGIStGILCCLTSTSizeLevTobinQAgeROAATODualTop5BoardGrowthInvIndepPMESO2CEI
GI1.000
SGI0.926 ***1.000
StGI0.916 ***0.749 ***1.000
LCC0.162 ***0.153 ***0.143 ***1.000
LT0.053 ***0.063 ***0.036 ***−0.061 ***1.000
ST−0.067 ***−0.058 ***−0.071 ***−0.029 ***0.275 ***1.000
Size0.546 ***0.527 ***0.507 ***0.056 ***0.190 ***−0.023 ***1.000
Lev0.260 ***0.237 ***0.252 ***−0.071 ***−0.002−0.100 ***0.460 ***1.000
TobinQ−0.154 ***−0.136 ***−0.151 ***0.0110.068 ***0.105 ***−0.311 ***−0.195 ***1.000
Age0.119 ***0.110 ***0.100 ***0.193 ***−0.074 ***−0.166 ***0.216 ***0.119 ***0.016 **1.000
ROA−0.040 ***−0.036 ***−0.038 ***−0.017 **0.164 ***0.246 ***−0.012 *−0.400 ***0.153 ***−0.113 ***1.000
ATO0.022 ***0.025 ***0.011−0.084 ***0.049 ***0.051 ***0.079 ***0.165 ***−0.026 ***−0.045 ***0.211 ***1.000
Dual−0.064 ***−0.052 ***−0.066 ***0.120 ***−0.0010.072 ***−0.171 ***−0.162 ***0.045 ***−0.052 ***0.055 ***−0.056 ***1.000
Top50.014 *0.026 ***0.024 ***0.065 ***0.021 ***0.057 ***0.087 ***−0.131 ***−0.107 ***−0.179 ***0.252 ***0.067 ***0.037 ***1.000
Board0.101 ***0.103 ***0.092 ***−0.131 ***0.063 ***−0.0090.258 ***0.184 ***−0.104 ***−0.021 ***0.0010.057 ***−0.188 ***−0.0081.000
Growth0.015 **0.012 *0.015 *−0.0090.092 ***0.166 ***0.047 ***0.045 ***0.055 ***−0.099 ***0.274 ***0.167 ***0.015 **0.068 ***0.012 *1.000
Inv−0.061 ***−0.048 ***−0.068 ***−0.058 ***0.022 ***0.016 **−0.056 ***0.177 ***0.038 ***−0.042 ***−0.056 ***0.222 ***−0.008−0.072 ***0.0010.034 ***1.000
Indep0.031 ***0.033 ***0.033 ***0.091 ***−0.0100.002−0.004−0.031 ***0.033 ***0.026 ***−0.023 ***−0.037 ***0.105 ***0.046 ***−0.528 ***−0.011−0.021 ***1.000
PME−0.051 ***−0.046 ***−0.043 ***−0.173 ***−0.011−0.003−0.016 **0.047 ***−0.011−0.118 ***0.029 ***0.028 ***−0.074 ***0.042 ***0.109 ***0.023 ***−0.004−0.062 ***1.000
SO2−0.056 ***−0.053 ***−0.050 ***−0.088 ***0.006−0.0000.017 **0.024 ***−0.041 ***0.0010.020 ***0.036 ***−0.063 ***0.027 ***0.079 ***0.0010.020 ***−0.062 ***0.568 ***1.000
CEI−0.112 ***−0.115 ***−0.085 ***−0.392 ***0.043 ***−0.0020.022 ***0.133 ***−0.057 ***−0.147 ***−0.025 ***0.060 ***−0.135 ***−0.050 ***0.153 ***0.024 ***0.012 *−0.087 ***0.298 ***0.299 ***1.000
Note: The table reports Pearson correlation coefficients. *, **, and *** indicate significance at the 10%, 5%, and 1% levels, respectively.

References

  1. Zhang, X.Y.; Hou, Y.L.; Geng, K.W. Environmental Regulation, Green Technology Innovation, and Industrial Green Transformation: Empirical Evidence from a Developing Economy. Sustainability 2024, 16, 6833. [Google Scholar] [CrossRef]
  2. Su, L. Environmental Regulation and Corporate Green Innovation: Evidence from the Implementation of the Total Energy Consumption Target in China. J. Bus. Econ. 2025, 95, 499–526. [Google Scholar] [CrossRef]
  3. Du, M.Z.; Antunes, J.; Wanke, P.; Chen, Z.F. Ecological Efficiency Assessment Under the Construction of Low-Carbon City: A Perspective of Green Technology Innovation. J. Environ. Plan. Manag. 2022, 65, 1727–1752. [Google Scholar] [CrossRef]
  4. Ren, P.H.; Cheng, Z.H.; Dai, Q.L. Can Green Bond Issuance Promote Enterprise Green Technological Innovation? N. Am. J. Econ. Financ. 2024, 69, 102021. [Google Scholar] [CrossRef]
  5. Yan, S.P.; Almandoz, J.; Ferraro, F. The Impact of Logic (In)Compatibility: Green Investing, State Policy, and Corporate Environmental Performance. Adm. Sci. Q. 2021, 66, 903–944. [Google Scholar] [CrossRef]
  6. Porter, M.E.; van der Linde, C. Green and Competitive: Ending the Stalemate. Harv. Bus. Rev. 1995, 73, 120–134. [Google Scholar]
  7. Hart, S.L. A Natural-Resource-Based View of the Firm. Acad. Manag. Rev. 1995, 20, 986–1014. [Google Scholar] [CrossRef]
  8. Yang, Y.; Jiang, Y.; Yang, Y. Institutional Logics and Organizational Green Transformation: Evidence from the Agricultural Industry in Emerging Economies. J. Environ. Manag. 2024, 370, 122932. [Google Scholar] [CrossRef]
  9. Thornton, P.H.; Ocasio, W.; Lounsbury, M. The Institutional Logics Perspective: A New Approach to Culture, Structure, and Process; Oxford University Press: New York, NY, USA, 2012. [Google Scholar]
  10. Li, X.; Guo, F.; Xu, Q.; Wang, S.; Huang, H. Strategic or Substantive Innovation? The Effect of Government Environmental Punishment on Enterprise Green Technology Innovation. Sustain. Dev. 2023, 31, 3365–3386. [Google Scholar] [CrossRef]
  11. Greenwood, R.; Raynard, M.; Kodeih, F.; Micelotta, E.R.; Lounsbury, M. Institutional Complexity and Organizational Responses. Acad. Manag. Ann. 2011, 5, 317–371. [Google Scholar] [CrossRef]
  12. Friedland, R.; Alford, R.R. Bringing Society Back In: Symbols, Practices, and Institutional Contradictions. In The New Institutionalism in Organizational Analysis; Powell, W.W., DiMaggio, P.J., Eds.; University of Chicago Press: Chicago, IL, USA, 1991; pp. 232–263. [Google Scholar]
  13. Bansal, P.; Roth, K. Why Companies Go Green: A Model of Ecological Responsiveness. Acad. Manag. J. 2000, 43, 717–736. [Google Scholar] [CrossRef]
  14. Scott, W.R. Institutions and Organizations: Ideas, Interests, and Identities, 4th ed.; Sage Publications: Thousand Oaks, CA, USA, 2013. [Google Scholar]
  15. DiMaggio, P.J.; Powell, W.W. The Iron Cage Revisited: Institutional Isomorphism and Collective Rationality in Organizational Fields. Am. Sociol. Rev. 1983, 48, 147–160. [Google Scholar] [CrossRef]
  16. Ocasio, W.; Laamanen, T.; Vaara, E. Communication and Attention Dynamics: An Attention-Based View of Strategic Change. Strateg. Manag. J. 2018, 39, 155–167. [Google Scholar] [CrossRef]
  17. Shi, X.Y.; Lin, Y.J.; Wang, Y.Z. Institutional Investor Heterogeneity and Green Innovation in China: Does Transformation Matter? Int. Rev. Econ. Financ. 2024, 93, 994–1014. [Google Scholar] [CrossRef]
  18. Zhang, X.Y.; Jiang, F.X.; Liu, H.Z.; Liu, R.Z. Green Finance, Managerial Myopia and Corporate Green Innovation: Evidence from Chinese Manufacturing Listed Companies. Financ. Res. Lett. 2023, 58, 104383. [Google Scholar] [CrossRef]
  19. Imbens, G.W.; Wooldridge, J.M. Recent Developments in the Econometrics of Program Evaluation. J. Econ. Lit. 2009, 47, 5–86. [Google Scholar] [CrossRef]
  20. Goodman-Bacon, A. Difference-in-Differences with Variation in Treatment Timing. J. Econom. 2021, 225, 254–277. [Google Scholar] [CrossRef]
  21. Bertrand, M.; Duflo, E.; Mullainathan, S. How Much Should We Trust Differences-in-Differences Estimates? Q. J. Econ. 2004, 119, 249–275. [Google Scholar]
  22. He, J.J.; Tian, X. The Dark Side of Analyst Coverage: The Case of Innovation. J. Financ. Econ. 2013, 109, 856–878. [Google Scholar] [CrossRef]
  23. Dechezleprêtre, A.; Sato, M. The Impacts of Environmental Regulations on Competitiveness. Rev. Environ. Econ. Policy 2017, 11, 183–206. [Google Scholar] [CrossRef]
  24. Song, J.; Xue, L.X.; Song, Y. The Synergistic Effects of Digital Technology Application on Corporate Green Innovation: Empirical Evidence from China. Int. Rev. Financ. Anal. 2025, 106, 104453. [Google Scholar] [CrossRef]
  25. Callaway, B.; Sant’Anna, P.H. Difference-in-Differences with Multiple Time Periods. J. Econom. 2021, 225, 200–230. [Google Scholar] [CrossRef]
  26. Cremers, M.; Pareek, A. Patient Capital Outperformance: The Investment Skill of High Active Share Managers Who Trade Infrequently. J. Financ. Econ. 2016, 122, 288–306. [Google Scholar] [CrossRef]
  27. Krueger, P.; Sautner, Z.; Starks, L.T. The Importance of Climate Risks for Institutional Investors. Rev. Financ. Stud. 2020, 33, 1067–1111. [Google Scholar]
  28. Aghion, P.; Dechezleprêtre, A.; Hemous, D.; Martin, R.; Van Reenen, J. Carbon Taxes, Path Dependency, and Directed Technical Change: Evidence from the Auto Industry. J. Political Econ. 2016, 124, 1–51. [Google Scholar] [CrossRef]
  29. Qiu, S.; Shen, L.; Chen, J. Do Environmental Rights Trading Schemes Induce Green Innovation? Evidence from Listed Firms in China. Econ. Res. J. 2018, 53, 129–143. (In Chinese) [Google Scholar]
  30. Roth, J.; Sant’Anna, P.H.; Bilinski, A.; Poe, J. What’s Trending in Difference-in-Differences? A Synthesis of the Recent Econometrics Literature. J. Econom. 2023, 235, 2218–2244. [Google Scholar] [CrossRef]
  31. Borusyak, K.; Jaravel, X.; Spiess, J. Revisiting Event-Study Designs: Robust and Efficient Estimation. Rev. Econ. Stud. 2024, 91, 3253–3285. [Google Scholar] [CrossRef]
  32. Eggers, A.C.; Tuñón, G.; Dafoe, A. Placebo Tests for Causal Inference. Am. J. Political Sci. 2024, 68, 1106–1121. [Google Scholar] [CrossRef]
  33. Li, S.; Zheng, X.; Liao, J.; Niu, J. Low-Carbon City Pilot Policy and Corporate Environmental Performance: Evidence from a Quasi-Natural Experiment. Int. Rev. Econ. Financ. 2024, 89, 1248–1266. [Google Scholar] [CrossRef]
  34. Han, C.; Su, H.; Chen, B.; Xu, X. Synergistic Effect of the Low-Carbon City and Sci-Tech Finance Pilots on Green Innovation in China. Humanit. Soc. Sci. Commun. 2026, 13, 22. [Google Scholar] [CrossRef]
  35. Fan, J.; Terabe, S.; Yaginuma, H. Propensity Score Matching–Difference-in-Differences Analysis of the Causal Effect of Opening Intermediate High-Speed Railway Stations on Employment Status in Surrounding Municipalities. Case Stud. Transp. Policy 2025, 22, 101592. [Google Scholar] [CrossRef]
  36. Zhao, Z.; Zhao, Y.; Lv, X.; Li, X.; Zheng, L.; Fan, S.; Zuo, S. Environmental Regulation and Green Innovation: Does State Ownership Matter? Energy Econ. 2024, 136, 107762. [Google Scholar] [CrossRef]
  37. Wang, L.; Long, Y.; Li, C. Research on the Impact Mechanism of Heterogeneous Environmental Regulation on Enterprise Green Technology Innovation. J. Environ. Manag. 2022, 322, 116127. [Google Scholar] [CrossRef] [PubMed]
  38. Zhang, Z.; Dai, X.; Ding, Y. Government Environmental Governance and Firms’ Green Innovation: Evidence from Listed Firms in Heavy Pollution Industries of China. Financ. Res. Lett. 2023, 55, 103848. [Google Scholar] [CrossRef]
  39. Song, W.; Han, X.; Liu, Q. Patterns of Environmental Regulation and Green Innovation in China. Struct. Change Econ. Dyn. 2024, 71, 176–192. [Google Scholar] [CrossRef]
  40. Ocasio, W. Towards an Attention-Based View of the Firm. Strateg. Manag. J. 1997, 18, 187–206. [Google Scholar] [CrossRef]
  41. Cho, T.S.; Hambrick, D.C. Attention as the Mediator between Top Management Team Characteristics and Strategic Change: The Case of Airline Deregulation. Organ. Sci. 2006, 17, 453–469. [Google Scholar] [CrossRef]
  42. Yuan, D.; Wu, X.; Shang, D.; Pan, L. How Government Environmental Attention Influences Corporate Green Innovation: A Chain Mediating Model. Technol. Forecast. Soc. Change 2025, 218, 124195. [Google Scholar] [CrossRef]
  43. Jiang, J.; Lu, X.; Xie, L.; Ye, R.; Cheng, P. The Impact of Managerial Attention to Digital Transformation on Stock Price Synchronicity from the Dynamic Capability Perspective. J. Int. Account. Audit. Tax. 2026, 60, 100751. [Google Scholar] [CrossRef]
  44. Yu, Z.; Li, Y.; Li, X. External Tariff Shocks, Entrepreneurial Attention Allocation, and Innovation Development. J. World Econ. 2024, 47, 65–94. (In Chinese) [Google Scholar]
  45. Besharov, M.L.; Smith, W.K. Multiple Institutional Logics in Organizations: Explaining Their Varied Nature and Implications. Acad. Manag. Rev. 2014, 39, 364–381. [Google Scholar] [CrossRef]
  46. Hong, Q.; Cui, L.; Hong, P. The Impact of Carbon Emissions Trading on Energy Efficiency: Evidence from Quasi-Experiment in China’s Carbon Emissions Trading Pilot. Energy Econ. 2022, 110, 106025. [Google Scholar] [CrossRef]
  47. Bolton, P.; Kacperczyk, M. Do Investors Care About Carbon Risk? J. Financ. Econ. 2021, 142, 517–549. [Google Scholar]
Figure 1. Theoretical model.
Sustainability 18 05464 g001
Figure 2. The moderating effect of long-term institutional investors.
Sustainability 18 05464 g002
Figure 3. The moderating effect of short-term institutional investors.
Sustainability 18 05464 g003
Figure 4. Parallel trend test.
Sustainability 18 05464 g004
Figure 5. Two-way placebo test.
Sustainability 18 05464 g005
Table 1. Variable descriptions.
VariableSymbolMeasurement
Green InnovationGINatural logarithm of one plus the total number of green patent applications filed by firm i in year t.
Substantive Green InnovationSGINatural logarithm of one plus the number of green invention patent applications filed by firm i in year t.
Strategic Green InnovationStGINatural logarithm of one plus the number of green utility model patent applications filed by firm i in year t.
Low-Carbon City Pilot PolicyLCCDummy variable equal to 1 if firm i is located in a pilot city and year t is after the implementation year of the policy in that city; 0 otherwise.
Long-term Institutional InvestorsLTShareholding proportion of long-term institutional investors in firm i in year t.
Short-term Institutional InvestorsSTShareholding proportion of short-term institutional investors in firm i in year t.
Firm SizeSizeNatural logarithm of total assets.
LeverageLevTotal liabilities divided by total assets.
Tobin’s QTobinQ(Market value of tradable shares + book value of non-tradable shares + book value of liabilities) divided by total assets.
Firm AgeAgeNatural logarithm of (current year − establishment year + 1).
Return on AssetsROANet income divided by average total assets.
Asset TurnoverATOOperating revenue divided by average total assets.
CEO DualityDualDummy variable equal to 1 if the CEO also serves as board chair; 0 otherwise.
Top 5 OwnershipTop5Shareholding proportion of the five largest shareholders.
Board SizeBoardNatural logarithm of the number of board directors.
GrowthGrowthAnnual revenue growth rate (current revenue/previous-year revenue − 1).
Inventory RatioInvNet inventory divided by total assets.
Independent DirectorsIndepProportion of independent directors on the board.
Industrial Particulate EmissionsPMENatural logarithm of industrial particulate emissions per unit of GDP at the city level.
SO2 EmissionsSO2Natural logarithm of sulfur dioxide emissions per unit of GDP at the city level.
Urban Carbon Emission IntensityCEICity-level carbon dioxide emissions divided by city-level GDP, expressed in tons per 10,000 yuan.
Note: All continuous variables are winsorized at the 1% and 99% levels.
Table 2. Descriptive Statistics.
VariablesObs.MeanS.D.MedianMinMax
GI28,6160.8131.138007.38
SGI28,6160.5330.94006.896
StGI28,6160.5540.899006.425
LCC28,6160.5420.498101
LT28,6160.0150.0320.00201
ST28,6160.0210.0430.00300.524
Size28,61622.0361.24821.84119.40626.44
Lev28,6160.3980.1980.3910.0270.925
TobinQ28,6162.0251.2811.6220.78916.647
Age28,6162.8720.3662.9441.0993.638
ROA28,6160.0450.0660.043−0.3750.254
ATO28,6160.6610.3940.5820.0553.106
Dual28,6160.3070.461001
Top528,6160.540.1540.5410.1760.892
Board28,6162.1190.1992.1971.6092.708
Growth28,6160.1550.3630.102−0.6533.808
Inv28,6160.1320.0920.11400.778
Indep28,6160.3750.0530.3330.2500.600
PME28,6168.8221.098.782.94416.401
SO228,61611.8431.28211.90.69315.071
CEI28,6161.0351.0530.7060.0735.842
Note: All continuous variables are winsorized at the 1% and 99% levels.
Table 3. Baseline regression results.
(1)
GI
(2)
SGI
(3)
StGI
(4)
GI
(5)
GI
LCC0.105 ***0.108 ***0.086 ***0.117 ***0.089 **
(0.036)(0.032)(0.028)(0.036)(0.035)
ST −0.291
(0.205)
LT −1.240 ***
(0.280)
LCC × ST −0.571 *
(0.307)
LCC × LT 1.105 ***
(0.369)
Size0.426 ***0.337 ***0.298 ***0.426 ***0.430 ***
(0.027)(0.025)(0.023)(0.027)(0.027)
Lev−0.079−0.093−0.029−0.079−0.089
(0.065)(0.070)(0.051)(0.066)(0.066)
TobinQ0.0050.009 **0.0020.0070.007
(0.006)(0.004)(0.005)(0.006)(0.006)
Age−0.240 ***−0.233 ***−0.119 *−0.247 ***−0.254 ***
(0.085)(0.080)(0.069)(0.084)(0.084)
ROA−0.163 *−0.166 **−0.094−0.116−0.139
(0.089)(0.077)(0.085)(0.090)(0.089)
ATO0.087 **0.063 *0.063 **0.086 **0.089 **
(0.035)(0.035)(0.025)(0.036)(0.035)
Dual0.0000.025−0.0230.001−0.000
(0.017)(0.016)(0.016)(0.017)(0.017)
Top50.2210.285 **0.1350.229 *0.220
(0.140)(0.123)(0.114)(0.138)(0.138)
Board0.0160.012−0.0010.0170.012
(0.064)(0.058)(0.063)(0.064)(0.064)
Growth−0.064 ***−0.051 ***−0.052 ***−0.058 ***−0.061 ***
(0.015)(0.012)(0.015)(0.015)(0.015)
Inv0.0750.037−0.0120.0620.060
(0.143)(0.123)(0.106)(0.142)(0.142)
Indep0.004 *0.0030.004 *0.004 *0.004 *
(0.002)(0.002)(0.002)(0.002)(0.002)
PME0.0310.0190.0200.0320.031
(0.024)(0.022)(0.021)(0.024)(0.024)
SO2−0.057 **−0.077 ***−0.038 *−0.055 **−0.055 **
(0.026)(0.023)(0.022)(0.026)(0.025)
CEI−0.013−0.013−0.006−0.015−0.011
(0.029)(0.027)(0.022)(0.029)(0.029)
Constant−7.839 ***−5.820 ***−5.660 ***−7.856 ***−7.874 ***
(0.724)(0.635)(0.560)(0.734)(0.727)
Firm FEYesYesYesYesYes
Year FEYesYesYesYesYes
Observations28,61628,61628,61628,61628,616
Adj.R20.7010.6770.6370.7010.701
Note: *, **, and *** indicate significance at the 10%, 5%, and 1% levels, respectively. Standard errors are reported in parentheses.
Table 4. Robustness check: alternative measures of the dependent variable.
DV:GI(1)(2)(3)
LCC0.109 ***0.107 ***0.092 ***
(0.032)(0.032)(0.032)
ST −0.359 *
(0.196)
LCC × ST −0.452 *
(0.266)
LT −1.169 ***
(0.308)
LCC × LT 1.235 ***
(0.376)
ControlsYesYesYes
Constant−6.491 ***−6.465 ***−6.498 ***
(0.667)(0.673)(0.661)
Firm FEYesYesYes
Year FEYesYesYes
Observations28,61628,61628,616
Adj.R20.6890.6890.689
Note: *, **, and *** indicate significance at the 10%, 5%, and 1% levels, respectively. Standard errors are reported in parentheses.
Table 5. Robustness check: sample selection and filtering.
Trimmed at 1%Trimmed at 5%
(1)(2)(3)(4)(5)(6)
LCC0.086 ***0.098 ***0.075 **0.050 *0.061 **0.047 *
(0.033)(0.034)(0.032)(0.026)(0.026)(0.025)
ST −0.287 −0.166
(0.194) (0.175)
LCC × ST −0.560 * −0.519 **
(0.297) (0.259)
LT −1.064 *** −0.607 ***
(0.265) (0.236)
LCC × LT 0.833 ** 0.509 *
(0.347) (0.309)
ControlsYesYesYesYesYesYes
Constant−7.640 ***−7.660 ***−7.689 ***−6.431 ***−6.455 ***−6.495 ***
(0.719)(0.730)(0.725)(0.648)(0.659)(0.655)
Firm FEYesYesYesYesYesYes
Year FEYesYesYesYesYesYes
Observations28,29228,29228,29227,08827,08827,088
Adj.R20.6560.6560.6560.5690.5700.570
Note: *, **, and *** indicate significance at the 10%, 5%, and 1% levels, respectively. Standard errors are reported in parentheses.
Table 6. Robustness check: controlling for confounding policies.
DV:GI(1)(2)(3)
LCC0.103 **0.080 **0.114 ***
(0.041)(0.040)(0.042)
LT −1.451 ***
(0.395)
LCC × LT 1.467 ***
(0.462)
ST −0.350
(0.285)
LCC × ST −0.551 *
(0.323)
Innocitypost0.074 *0.072 *0.071 *
(0.039)(0.039)(0.040)
CarbonTradepost−0.017−0.015−0.021
(0.068)(0.067)(0.067)
Air10post0.0420.0380.043
(0.030)(0.029)(0.030)
GreenCreditpost0.0420.0430.042
(0.041)(0.041)(0.041)
Smartcitypost−0.006−0.009−0.007
(0.065)(0.065)(0.065)
ControlsYesYesYes
Constant−7.204 ***−7.193 ***−7.173 ***
(0.901)(0.924)(0.906)
Firm FEYesYesYes
Year FEYesYesYes
Observations19,60219,60219,602
Adj.R20.7200.7210.721
Note: *, **, and *** indicate significance at the 10%, 5%, and 1% levels, respectively. Standard errors are reported in parentheses.
Table 7. Endogeneity test: controlling for baseline characteristics.
DV:GI(1)(2)(3)
LCC0.108 ***0.121 ***0.093 ***
(0.031)(0.031)(0.030)
ST −0.277
(0.205)
LCC × ST −0.591 *
(0.308)
LT −1.252 ***
(0.281)
LCC × LT 1.145 ***
(0.365)
Two Control Zones × year0.0120.0120.011
(0.008)(0.008)(0.008)
Provincial Capital × year0.0010.0010.001
(0.009)(0.010)(0.009)
Special Economic Zone × year0.001−0.0000.001
(0.006)(0.006)(0.006)
Hu Huanyong Line × year−0.019−0.019−0.020
(0.013)(0.013)(0.012)
ControlsYesYesYes
Constant8.0408.3919.773
(23.712)(23.718)(22.910)
Firm FEYesYesYes
Year FEYesYesYes
Observations28,61628,61628,616
Adj.R20.7010.7020.702
Note: *, **, and *** indicate significance at the 10%, 5%, and 1% levels, respectively. Standard errors are reported in parentheses.
Table 8. Endogeneity test: PSM-DID with nearest-neighbor matching.
DV:GI(1)(2)(3)
LCC0.099 **0.096 *0.109 *
(0.058)(0.058)(0.063)
LT −0.957 *
(0.575)
LCC × LT 1.648 **
(0.818)
ST −0.402
(0.541)
LCC × ST −1.094 *
(0.663)
ControlsYesYesYes
Constant−7.760 ***−7.802 ***−7.813 ***
(1.404)(1.404)(1.408)
Firm FEYesYesYes
Year FEYesYesYes
Observations11,37211,37211,372
Adj.R20.6890.6890.689
Note: *, **, and *** indicate significance at the 10%, 5%, and 1% levels, respectively. Standard errors are reported in parentheses.
Table 9. Endogeneity test: PSM-DID with kernel matching.
DV:GI(1)(2)(3)
LCC0.119 **0.094 *0.132 **
(0.049)(0.049)(0.052)
LT −1.320 **
(0.518)
LCC × LT 1.833 **
(0.809)
ST −0.231
(0.429)
LCC × ST −0.922 *
(0.559)
ControlsYesYesYes
Constant−7.574 ***−7.615 ***−7.632 ***
(1.096)(1.093)(1.099)
Firm FEYesYesYes
Year FEYesYesYes
Observations12,68012,68012,680
Adj.R20.6910.6920.691
Note: *, **, and *** indicate significance at the 10%, 5%, and 1% levels, respectively. Standard errors are reported in parentheses.
Table 10. Endogeneity test: PSM-DID with radius matching.
DV:GI(1)(2)(3)
LCC0.108 **0.084 *0.120 **
(0.050)(0.050)(0.054)
LT −1.261 **
(0.539)
LCC × LT 1.802 **
(0.817)
ST −0.359
(0.479)
LCC × ST −1.048 *
(0.620)
ControlsYesYesYes
Constant−7.779 ***−7.832 ***−7.833 ***
(1.168)(1.172)(1.177)
Firm FEYesYesYes
Year FEYesYesYes
Observations12,38112,38112,381
Adj.R20.6890.6890.689
Note: *, **, and *** indicate significance at the 10%, 5%, and 1% levels, respectively. Standard errors are reported in parentheses.
Table 11. Heterogeneity analysis by ownership type.
VariablesNon-SOEsSOEs
(1)
GI
(2)
SGI
(3)
StGI
(4)
GI
(5)
SGI
(6)
StGI
LCC0.0440.0480.051 *0.165 ***0.166 ***0.121 ***
(0.039)(0.032)(0.029)(0.051)(0.046)(0.043)
ControlsYesYesYesYesYesYes
Constant−9.294 ***−6.858 ***−6.910 ***−6.472 ***−5.225 ***−4.263 ***
(0.927)(0.744)(0.717)(1.069)(1.089)(0.913)
Firm FEYesYesYesYesYesYes
Year FEYesYesYesYesYesYes
Observations18,63318,63318,633998399839983
Adj.R20.6550.6230.5940.7460.7250.681
Note: *, **, and *** indicate significance at the 10%, 5%, and 1% levels, respectively. Standard errors are reported in parentheses.
Table 12. Heterogeneity analysis by firm size.
Variables(1)
GI
(2)
SGI
(3)
StGI
LCC−0.0050.006−0.001
(0.031)(0.029)(0.024)
Size_1−0.163−0.146 ***−0.117
(0.047)(0.049)(0.038)
LCC × Size_10.379 ***0.355 ***0.299 ***
(0.056)(0.050)(0.054)
ControlsYesYesYes
Constant−7.592 ***−5.549 ***−5.399 ***
(0.704)(0.640)(0.540)
Firm FEYesYesYes
Year FEYesYesYes
Observations28,61628,61628,616
Adj. R20.7030.6810.640
Note: Size_1 is a dummy variable for firm size, constructed based on the mean value of total assets of firms within the same industry-year. *, **, and *** indicate significance at the 10%, 5%, and 1% levels, respectively. Robust standard errors are reported in parentheses.
Table 13. Heterogeneity analysis by environmental regulation strength.
Variables(1)
GI
(2)
SGI
(3)
StGI
LCC0.099 **0.114 **0.078 **
(0.047)(0.046)(0.037)
ERS0.0020.0000.003
(0.022)(0.020)(0.017)
LCC × ERS0.004−0.0080.010
(0.038)(0.035)(0.032)
ControlsYesYesYes
Constant−7.921 ***−5.891 ***−5.717 ***
(0.735)(0.645)(0.570)
Firm FEYesYesYes
Year FEYesYesYes
Observations28,11228,11228,112
Adj. R20.7010.6790.638
Note: *, **, and *** indicate significance at the 10%, 5%, and 1% levels, respectively. Standard errors are reported in parentheses.
Table 14. Keyword dictionary for attention allocation.
VariableKeyword Dictionary
Attention Content Allocation (ACA)Safety production; protection; excessive emissions; ozone layer; dust removal; atmosphere; low-carbon; carbon dioxide; prevention and control; exhaust gas; waste; wastewater; solid waste; residue; particulate matter; wind energy; boiler; filtration; environmental protection; environment; recycling; methane; emission reduction; energy consumption reduction; degradation; noise reduction; energy saving; conservation; purification; sustainable development; renewable; air; garbage; wastefulness; process reengineering; greening; green; energy consumption; energy; emissions; exhaust; pollutant discharge; destruction; habitat; clean; fuel; industrial waste (three wastes); ecology; biomass; water treatment; acidic; solar energy; natural gas; soil; desulfurization; denitrification; tail gas; greenhouse gases; pollution; sewage; harmless; paperless; species; consumption; circular; soot; flue gas; liquefied gas; toxic; organic compounds; waste heat; reuse; noise; heavy metals; natural resources.
Future-Oriented Attention (ATA1)Future; in the future; subsequently; next step; will; upcoming; follow-up; foresee; likely to; thereafter.
Present-Oriented Attention (ATA2)Now; recent years; recently; current stage; existing; in recent years; nowadays; current situation; at present.
Table 15. Mechanism tests of attention content allocation and temporal allocation.
Variables(1)
GI
(2)
ACA
(3)
GI
(4)
ATA1
(5)
GI
(6)
ATA2
(7)
GI
(8)
Rel_ATA
(9)
GI
LCC0.105 ***0.001 *0.100 ***0.0000.103 ***−0.0000.103 ***0.0000.103 ***
(0.036)(0.001)(0.036)(0.000)(0.036)(0.000)(0.036)(0.000)(0.036)
ACA 5.164 ***
(0.840)
ATA1 −3.787
(2.655)
ATA2 −6.517 **
(3.145)
Rel_ATA 4.212
(3.657)
ControlsYesYesYesYesYesYesYesYesYes
Constant−7.839 ***−0.013−7.791 ***−0.004 *−7.873 ***0.000−7.857 ***−0.004 *−7.843 ***
(0.724)(0.009)(0.737)(0.002)(0.736)(0.002)(0.736)(0.002)(0.737)
Firm FEYesYesYesYesYesYesYesYesYes
Year FEYesYesYesYesYesYesYesYesYes
Observations28,61628,61628,61628,61628,61628,61628,61628,61628,616
Adj. R20.7010.6470.7040.2860.7030.2900.7030.2580.703
Note: *, **, and *** indicate significance at the 10%, 5%, and 1% levels, respectively. Standard errors are reported in parentheses.
Disclaimer/Publisher’s Note: The statements, opinions and data contained in all publications are solely those of the individual author(s) and contributor(s) and not of MDPI and/or the editor(s). MDPI and/or the editor(s) disclaim responsibility for any injury to people or property resulting from any ideas, methods, instructions or products referred to in the content.