3.2. Cadmium Content in Soils and Cacao Tissues in Cerecita and Bajada de Chanduy
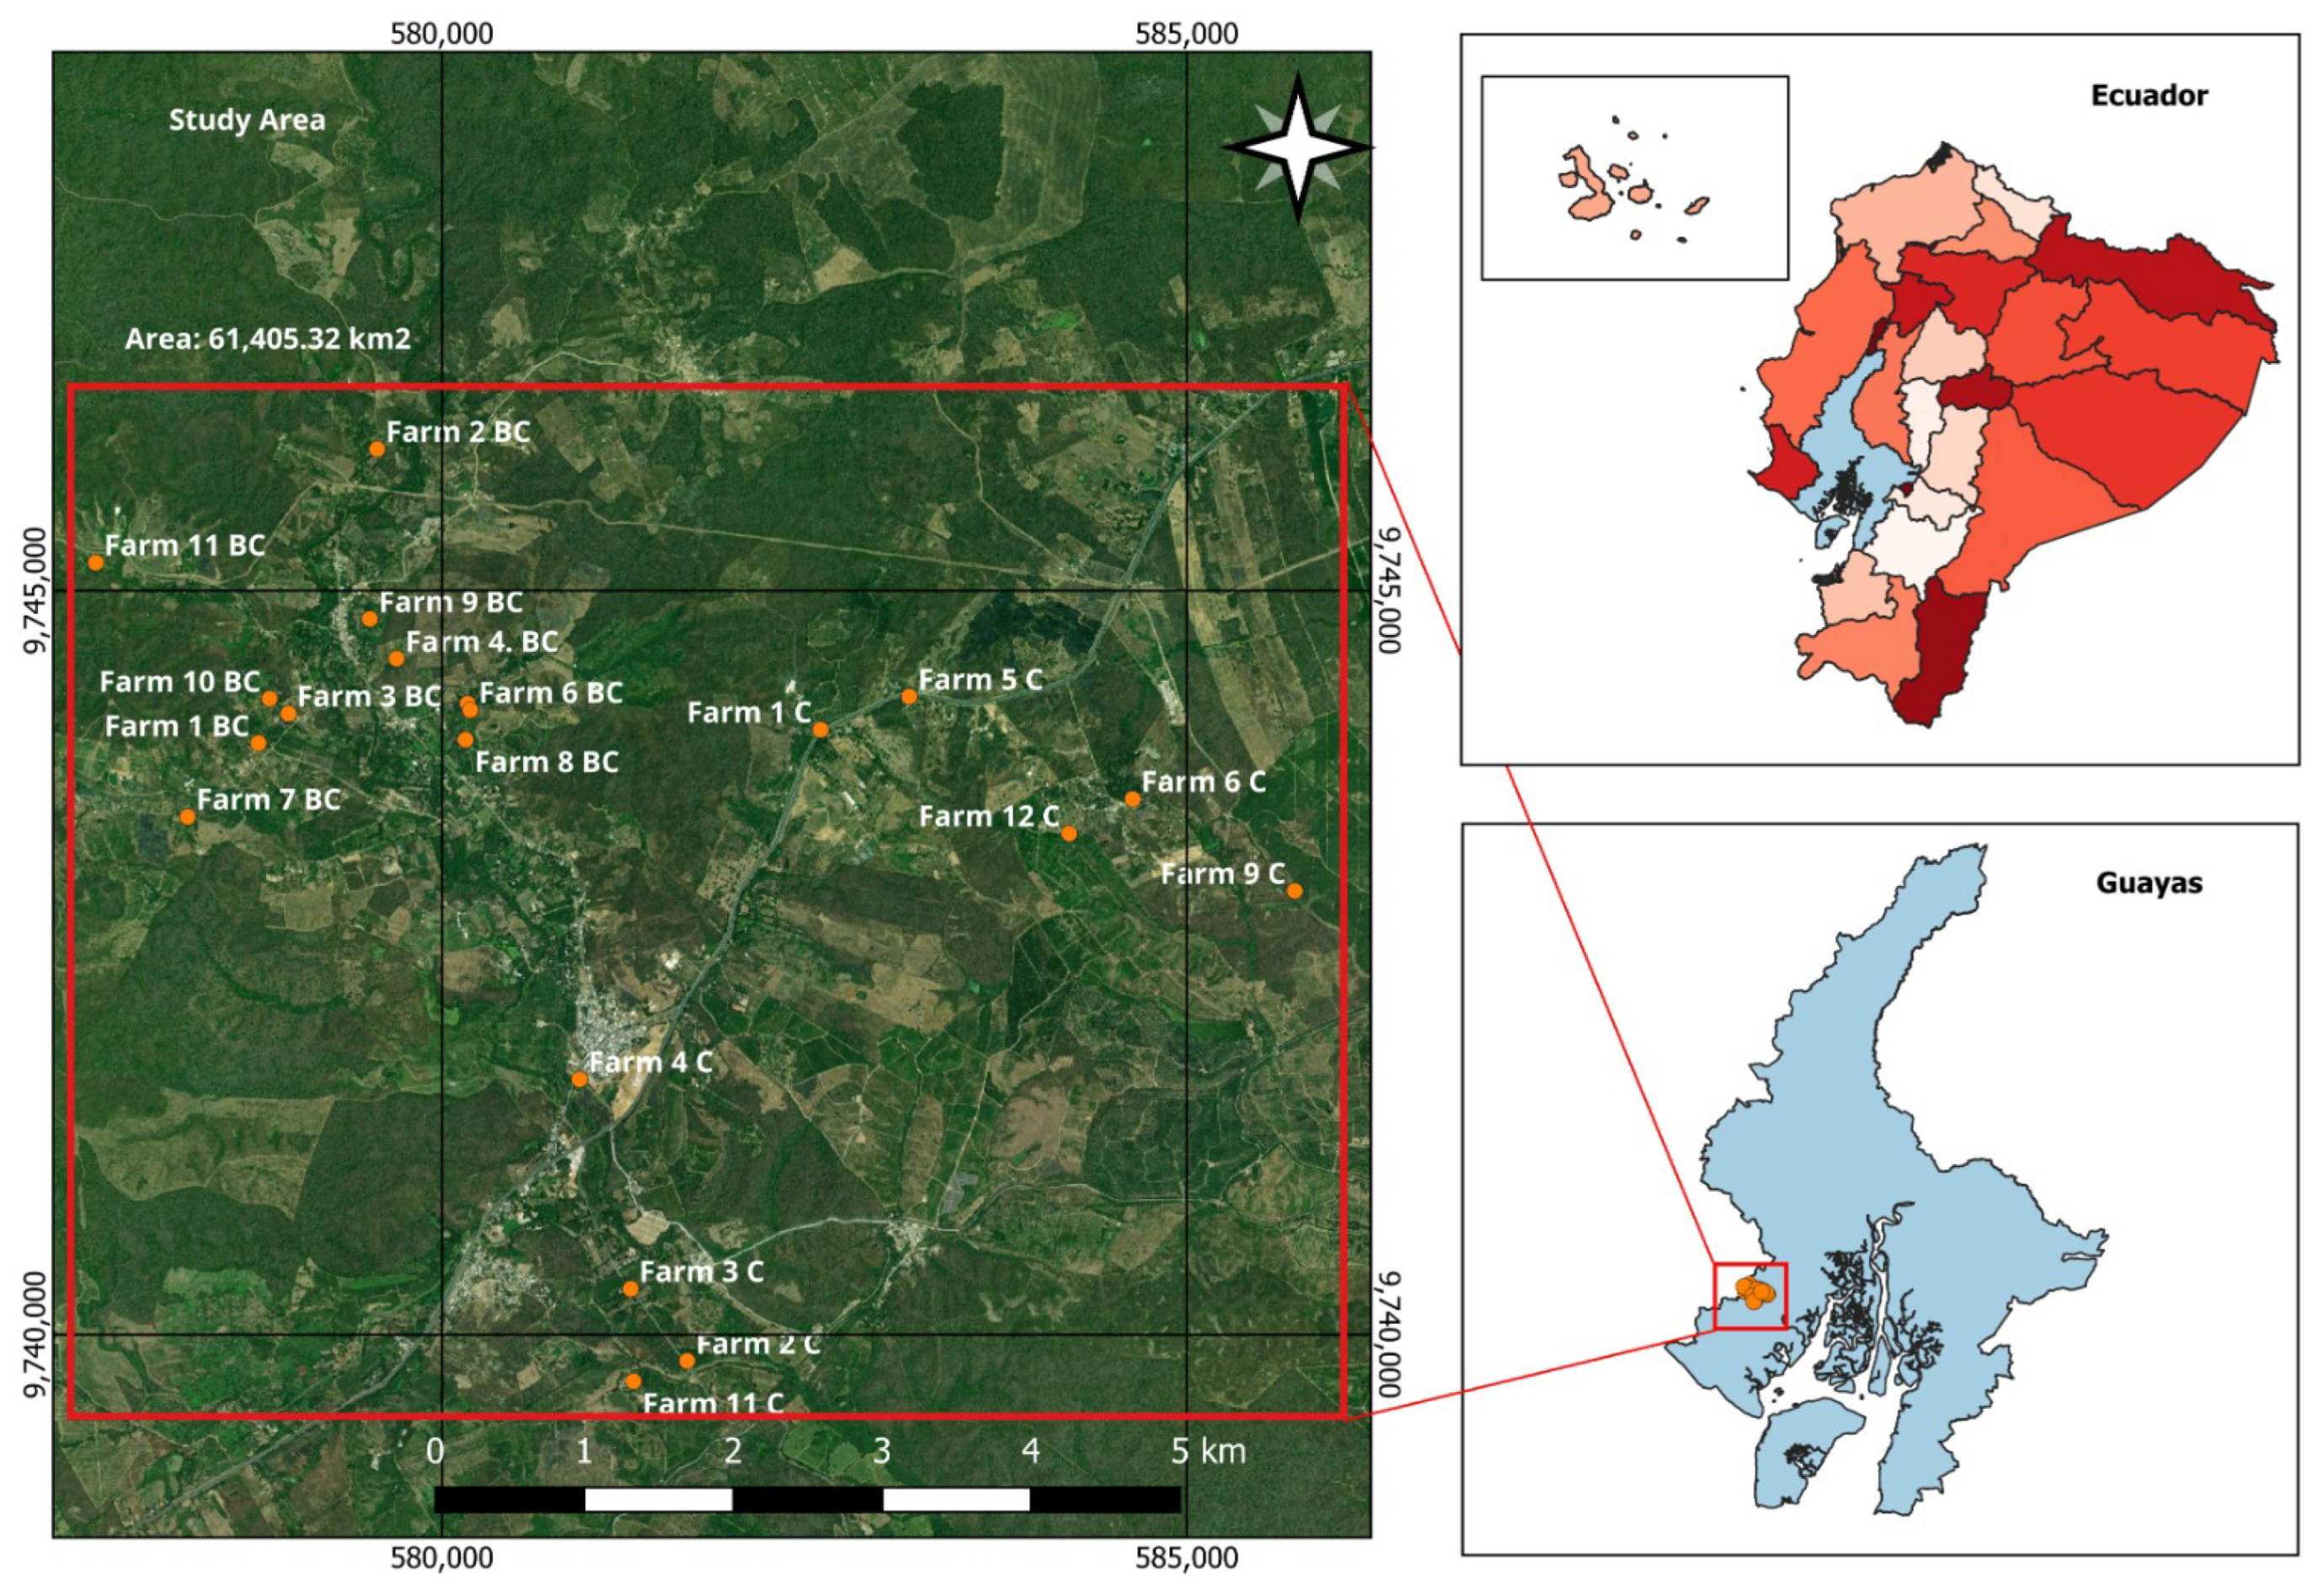
Cadmium (Cd) concentrations were analyzed in soil, cotyledon, and cacao leaves at two locations in Guayas Province: Cerecita (12 sites) and Bajada de Chanduy (11 sites) (see
Figure 2). Argüello et al. [
8] reported an average soil Cd concentration of 0.44 mg kg
−1; whereas Ecuadorian legislation establishes a maximum Cd level of 0.5 mg kg
−1 [
33]. In Cerecita, only farmers 4, 6, 10, and 11, and in Bajada de Chanduy only farmers 4, 8, and 9, were below this reference value; the remaining farms exceeded it.
In the European Union, cadmium maximum levels are established for cocoa- and chocolate-derived products rather than for raw cocoa beans. Depending on product type and cocoa content, these limits range from 0.10 to 0.80 mg kg
−1 [
8,
13,
34,
35]. In practice, a technical threshold of 0.60–0.80 mg kg
−1 is often considered to allow industry compliance with these limits [
8,
34]. Therefore, the cotyledon Cd concentrations observed in this study should not be interpreted as direct regulatory non-compliance. Instead, they indicate a potentially relevant commercial concern, particularly because many sampled farms showed bean concentrations within or above ranges that could complicate compliance in downstream cocoa products. This pattern should be interpreted in the context of the study area, which was selected as a known Cd hotspot and does not represent cacao-growing conditions across Ecuador as a whole.
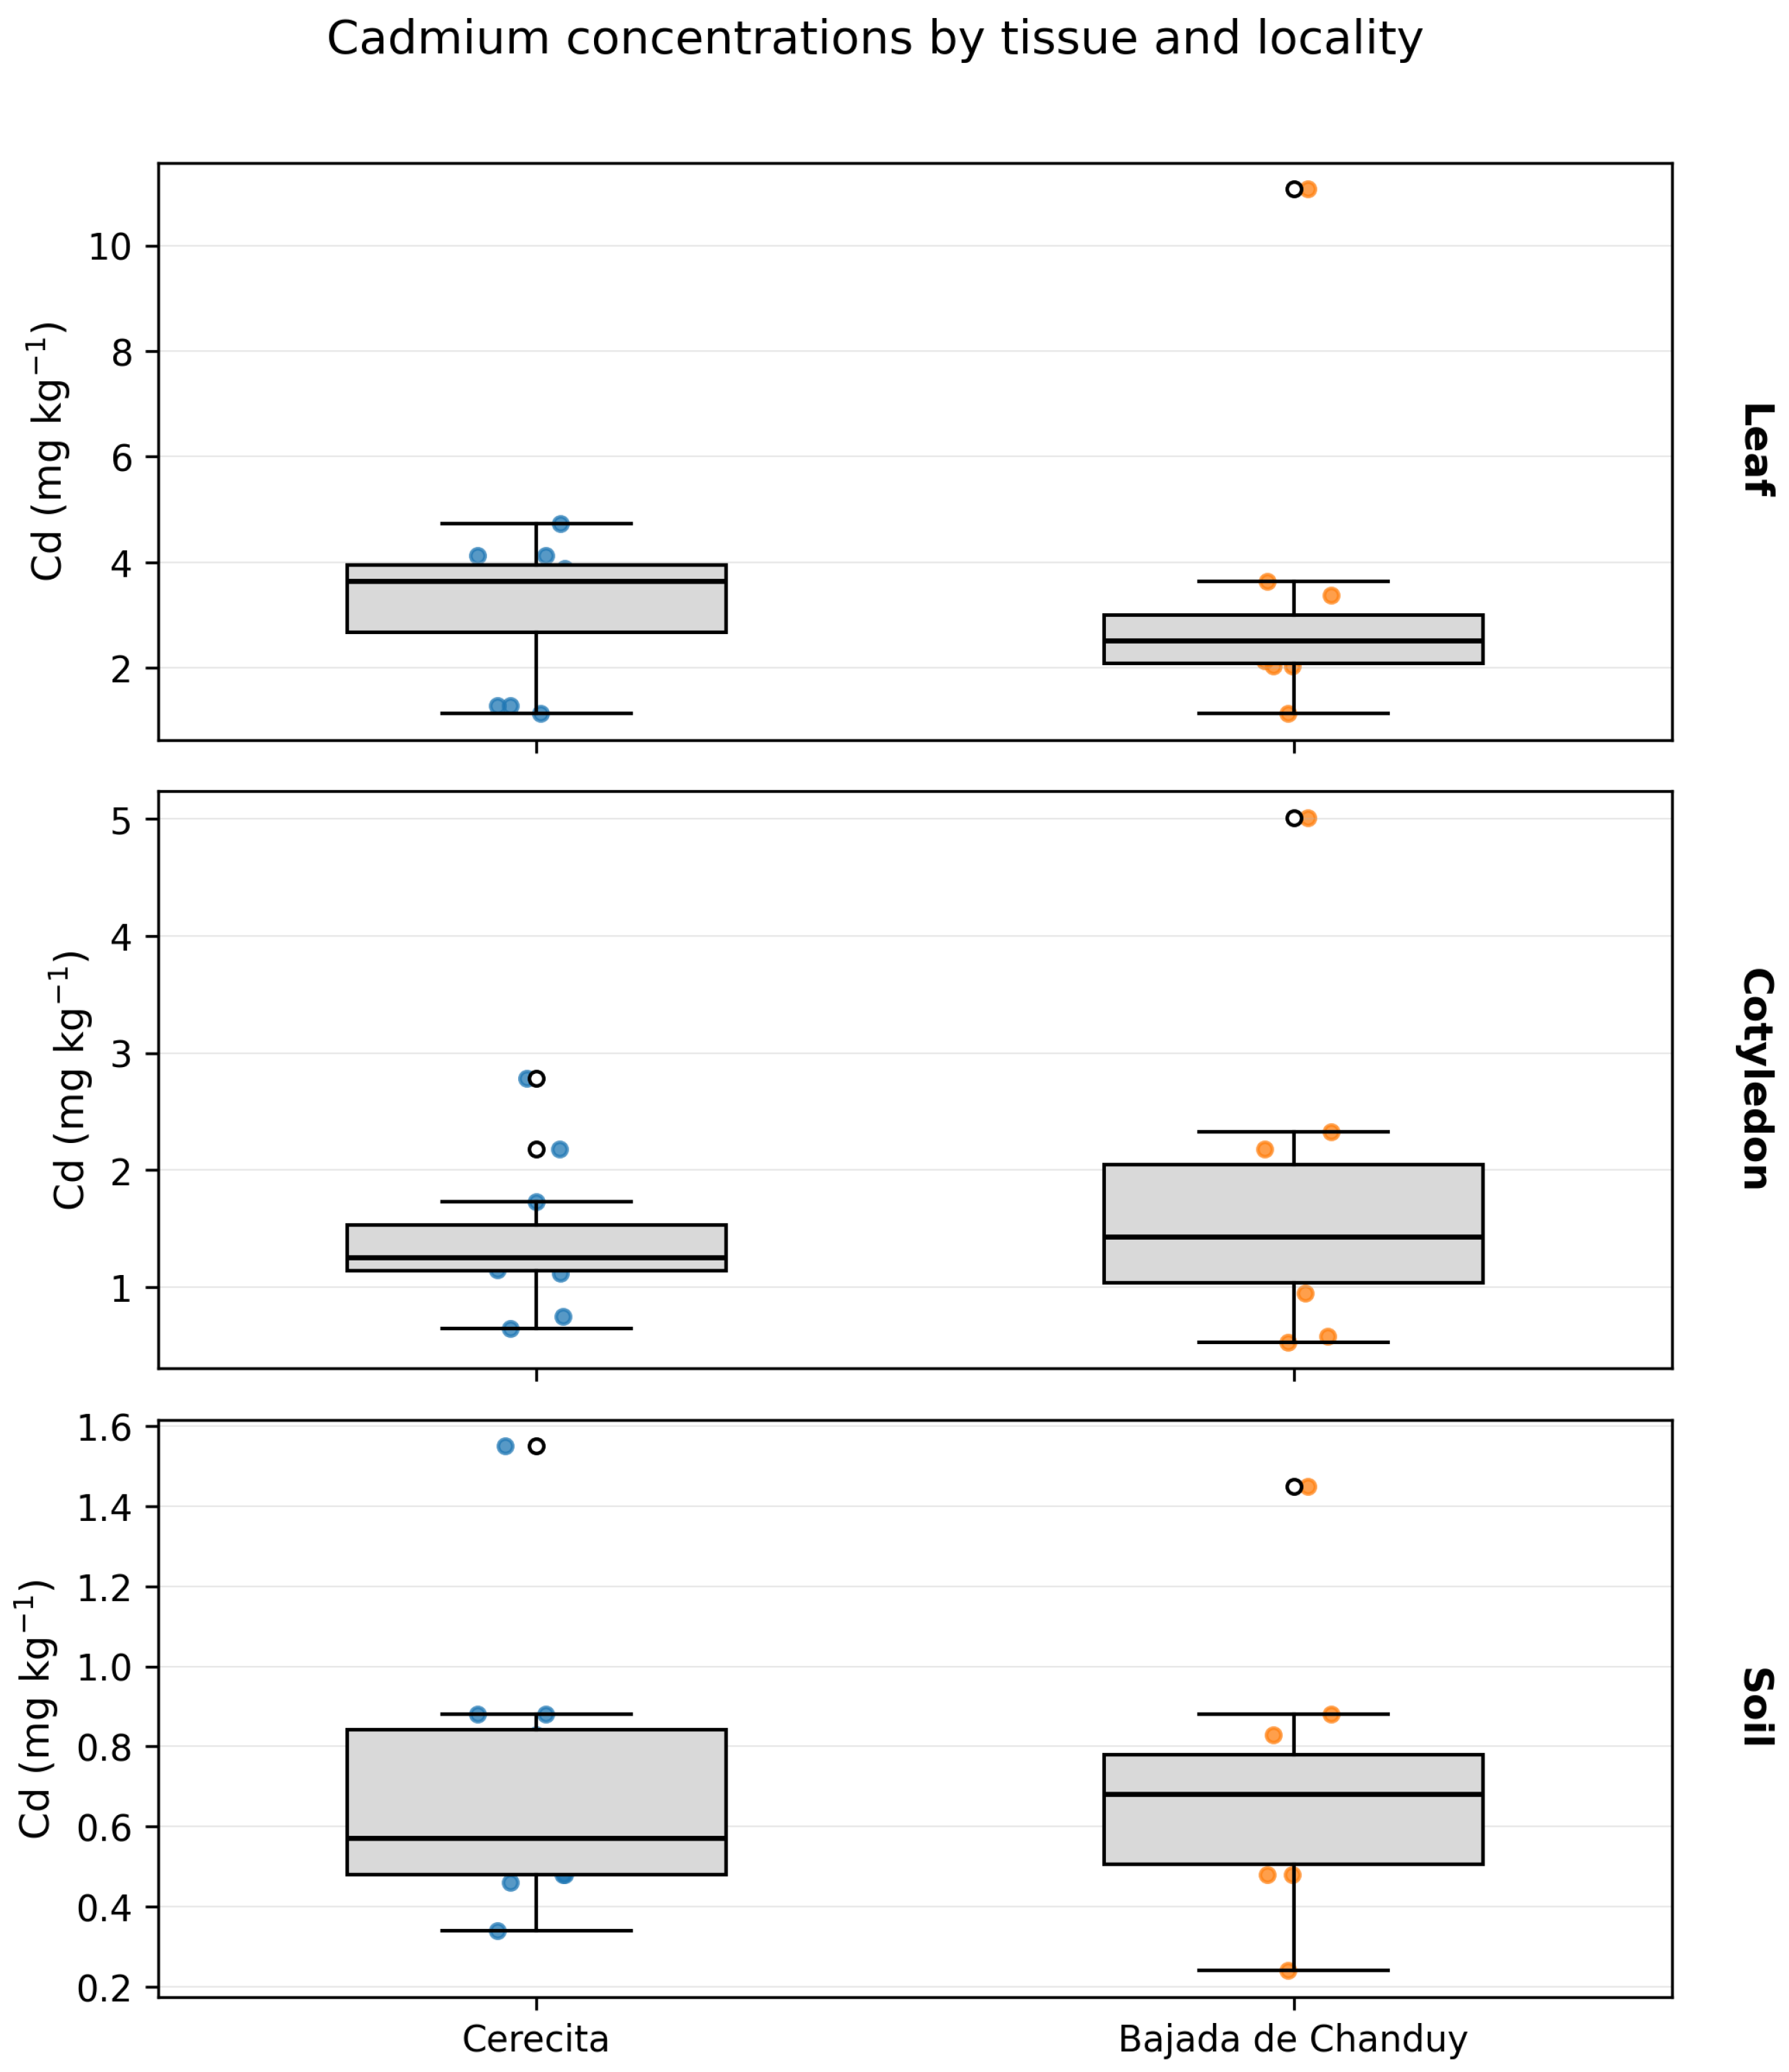
In both locations, a consistent magnitude pattern was observed across leaves, cotyledon, and soil suggesting differential Cd accumulation across plant matrices. Intra-location variability was relevant, particularly in Bajada de Chanduy, where an extreme case (farmer 3) showed high values in all three matrices (soil = 1.45 mg kg−1; cotyledon = 5.01 mg kg−1; leaves = 11.07 mg kg−1), markedly increasing the mean and dispersion of the dataset. During the interview with the farm owner, charcoal production was reported within the production unit. This activity is mentioned here as a contextual observation that could potentially contribute to local Cd inputs; however, it was not directly evaluated in this study and therefore cannot be identified as a confirmed source of contamination. Source attribution was beyond the scope of the present work, and this point should be interpreted as a possible explanation requiring further investigation.
In Guayas, the high foliar Cd concentrations (Cerecita: 3.17 ± 1.24 mg kg
−1; Bajada de Chanduy: 3.22 ± 2.69 mg kg
−1) indicate that leaves could be used as an early monitoring tool to identify farms under higher Cd pressure. However, this should not replace bean analysis, as the leaf–bean relationship may be non-linear and vary across environments [
1,
3] (see
Figure 3).
At a descriptive level (see
Table 1), Cerecita showed a median soil Cd concentration of 0.57 mg kg
−1 (IQR = 0.36) and a median leaf Cd concentration of 3.63 mg kg
−1 (IQR = 1.28). Bajada de Chanduy showed a median soil Cd concentration of 0.68 mg kg
−1 (IQR = 0.28) and a median leaf Cd concentration of 2.51 mg kg
−1 (IQR = 0.93). Because several distributions did not meet normality (Shapiro–Wilk test;
for soil and leaves in Cerecita, and for cotyledon and leaves in Bajada de Chanduy), nonparametric tests were prioritized for inference.
To assess within-locality differences among matrices under a producer-related (repeated-measures) design, the Friedman test was applied. In Cerecita, results indicated
,
, with Kendall’s
(very large effect). In Bajada de Chanduy,
,
, with Kendall’s
(very large effect). Post hoc pairwise comparisons (Wilcoxon tests with Holm adjustment) confirmed significant differences for all pairs (
Table 2), empirically supporting that foliar tissue concentrates Cd to a greater extent than cotyledon and soil.
For the between-locality comparison (Cerecita vs. Bajada de Chanduy), Mann–Whitney
U tests were applied separately for each matrix. No statistically significant differences were detected for soil (
,
), cotyledon (
,
), or leaves (
,
). Although the leaf median was higher in Cerecita, the effect size was moderate (Cliff’s
), and the statistical evidence was insufficient to conclude a systematic difference at this sample size (
Table 3).
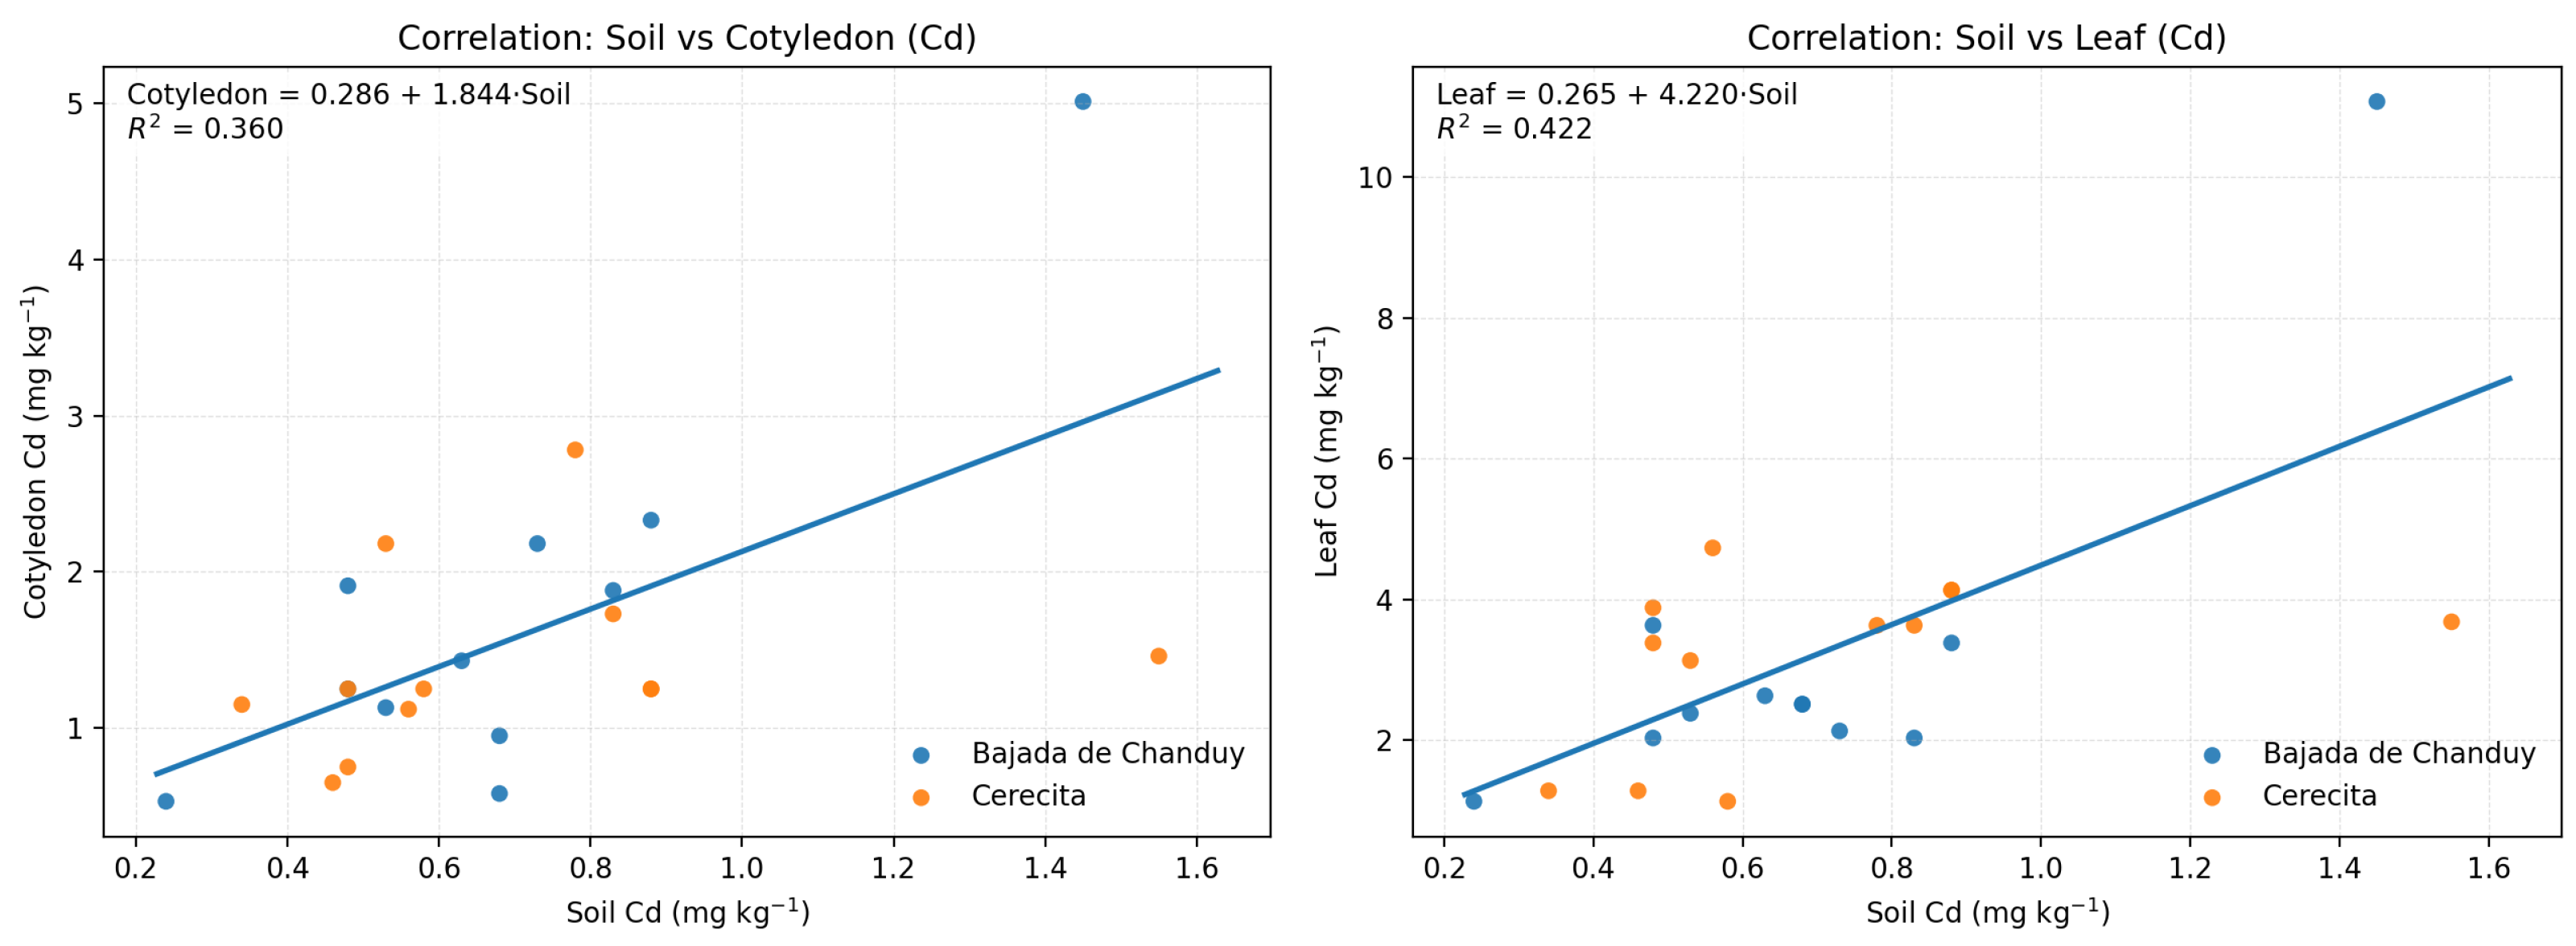
Finally, the association among matrices was examined using Spearman correlations (
Table 4). In Cerecita, soil–cotyledon (
,
) and soil–leaves (
,
) were moderate but did not reach significance at the 5% level. In Bajada de Chanduy, the soil–cotyledon correlation was significant (
,
), whereas soil–leaves was not. Given the presence of an extreme case (farmer 3), a sensitivity analysis was conducted by excluding it: correlations decreased and became non-significant (
), suggesting that part of the statistical signal is concentrated in a localized hotspot rather than reflecting a stable relationship across the whole locality.
3.3. Thematic Maps of Cadmium Concentration in Soils and Plant Tissues
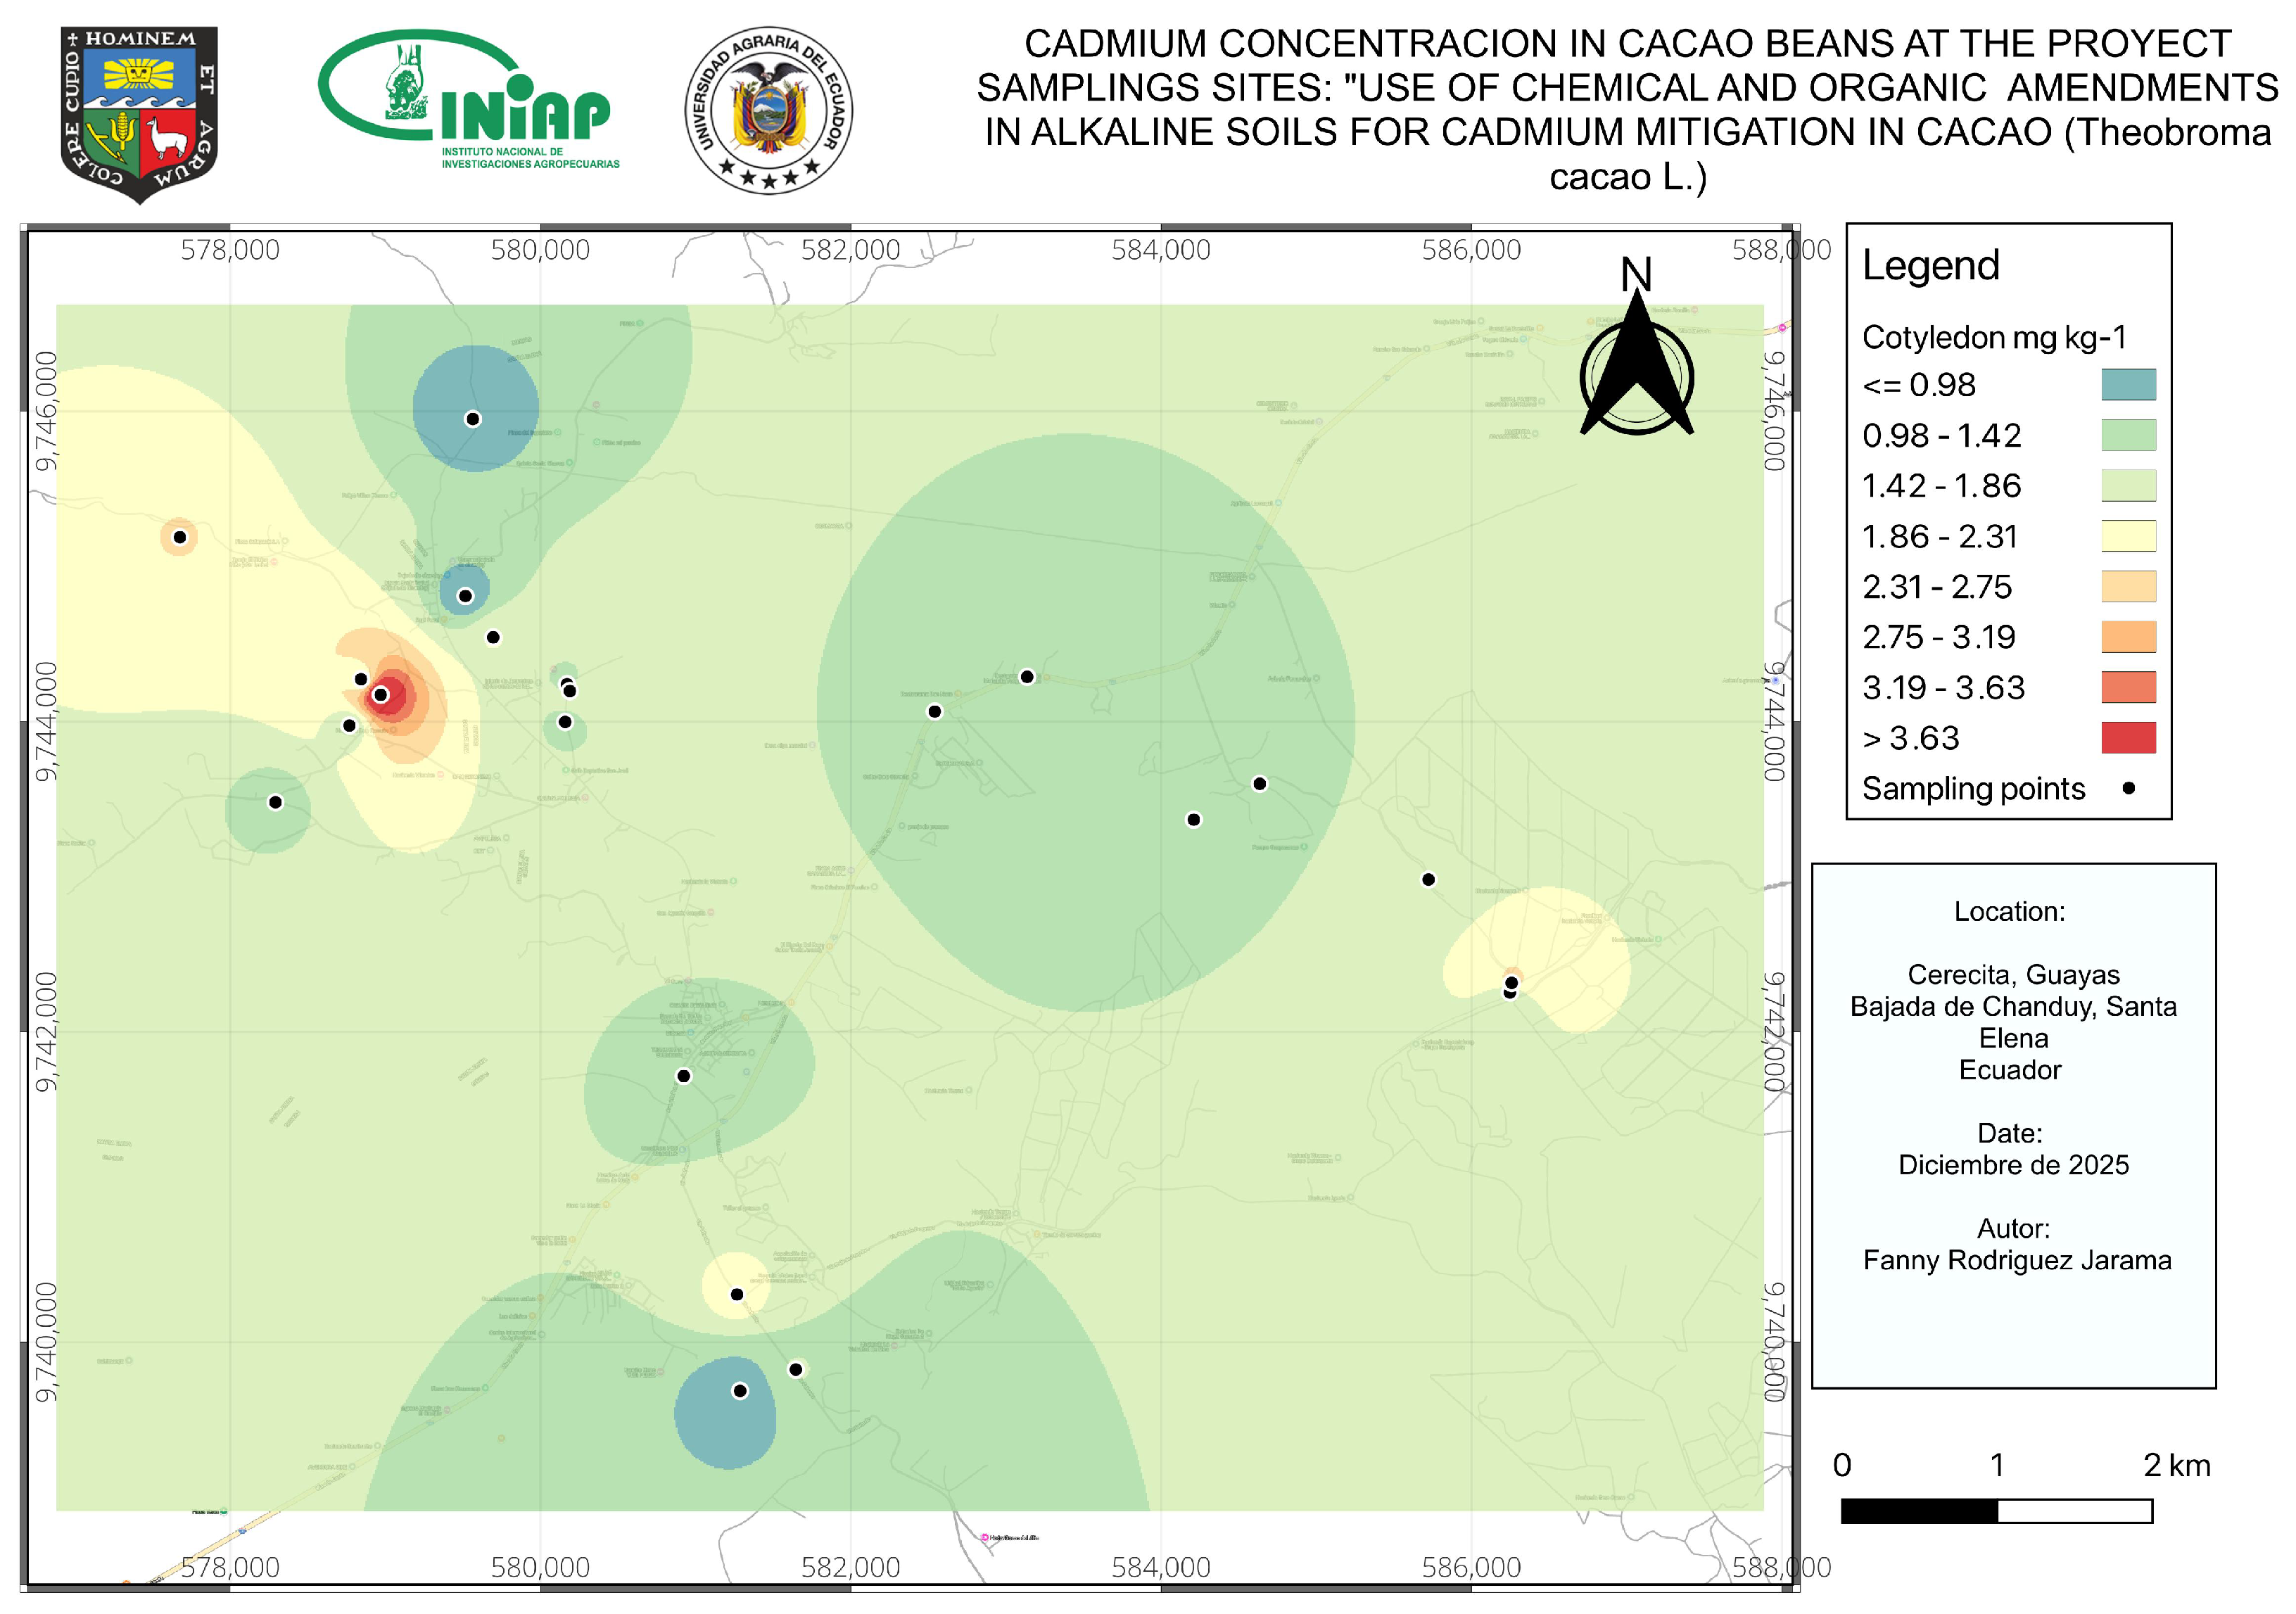
In
Figure 4, the sampling sites and Cd concentrations in beans are shown for Cerecita and Bajada de Chanduy.
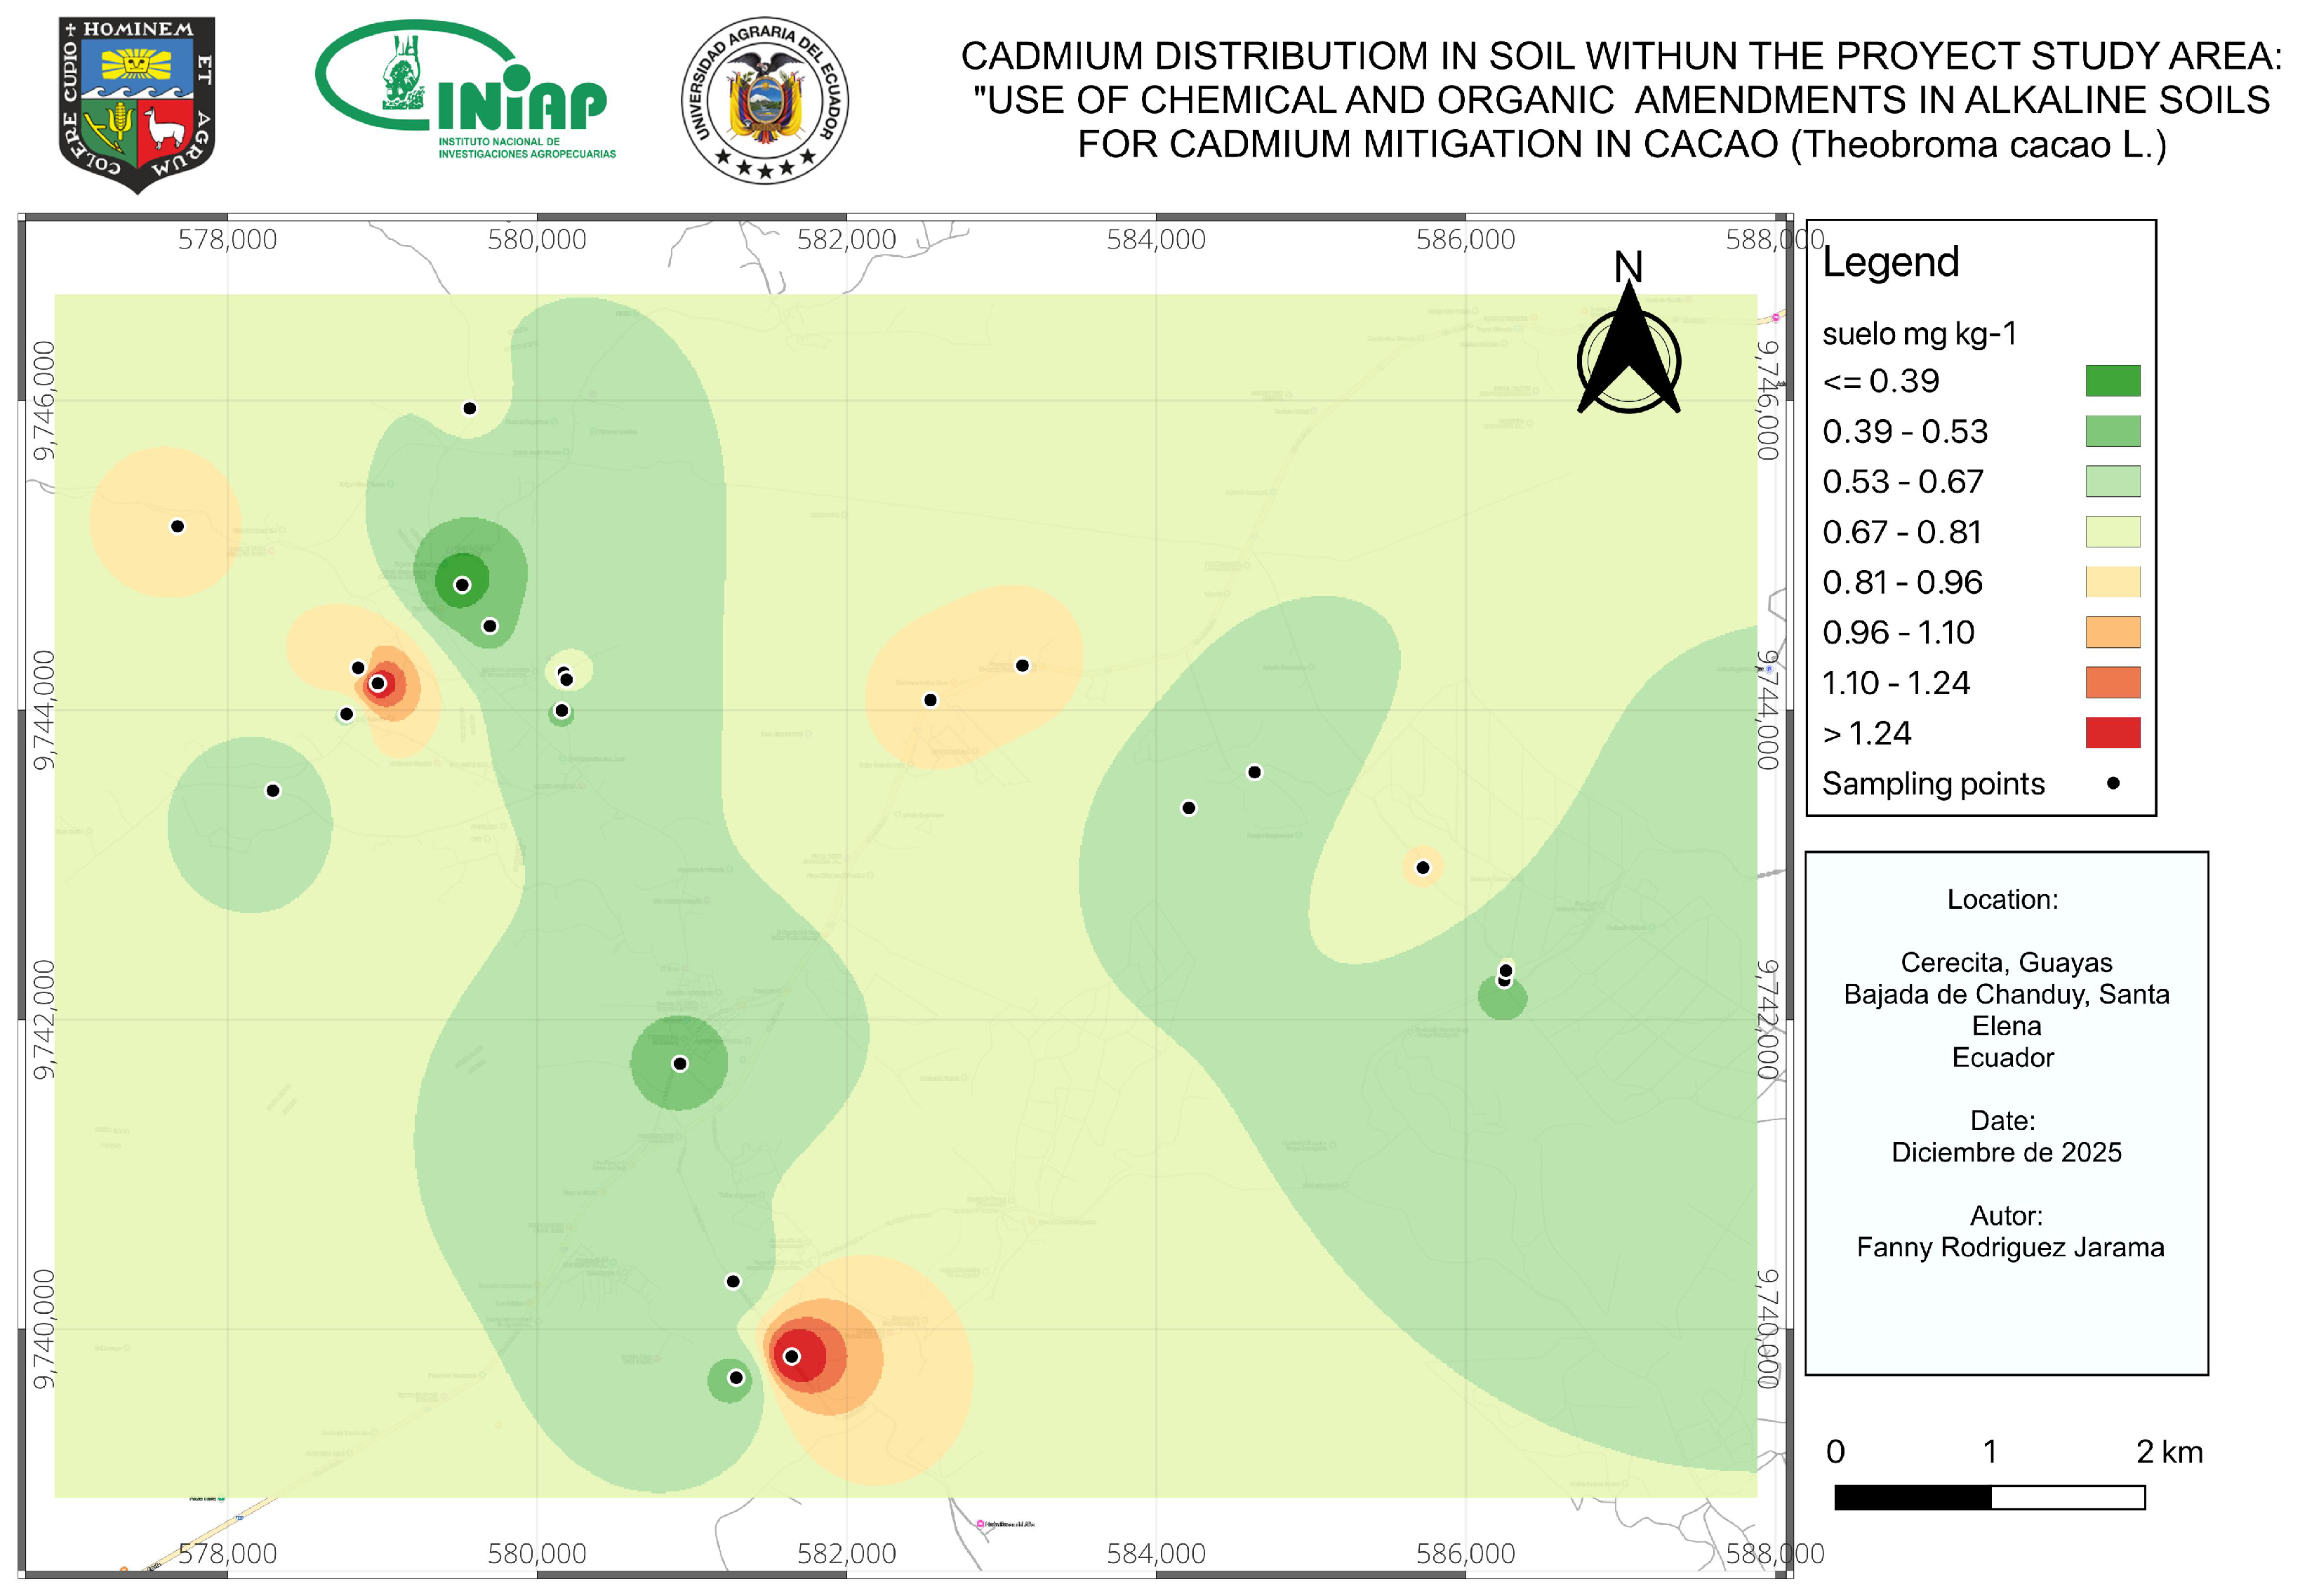
Figure 5 shows the spatial distribution of Cd in soils across the studied areas.
Maps may reflect the influence of a small number of farms with exceptional conditions rather than a stable mechanism representative of an entire locality. The literature agrees that total soil Cd is an imperfect predictor of Cd in beans, and that the bioavailable fraction for example, estimated using chemical extractants or by Diffusive Gradients in Thin Films (DGT) often better explains actual uptake [
1,
2]. Therefore, the practical contribution of the statistical analysis is twofold: it confirms that a soil bean component exists, but it also warns that efficient interventions should prioritize hotspot identification and bioavailability assessment, rather than relying exclusively on averages of total soil Cd.
The presence of extreme values, as observed in Bajada de Chanduy (Farmer 3: soil 1.45; cotyledon 5.01; leaves 11.07 mg kg
−1), suggests local processes that increase Cd load and/or availability. The reported background of activities associated with charcoal production allows proposing, as a hypothesis, a point source or local deposition that intensifies exposure within a reduced radius; however, this study does not allow causal attribution and requires verification through targeted sampling around the potential source and complementary analyses. Beyond point sources, the literature suggests several plausible and potentially coexisting routes: (i) geogenic contributions linked to parent materials and alluvial sediments which, based on our investigation, would not be the case in this area, and (ii) diffuse anthropogenic inputs associated with agricultural inputs and practices, which were evidenced here. In Peru and Honduras, for example, environments with alluvial sediments and specific soil conditions have been associated with higher concentrations even without clear evidence of industrial contamination [
1,
7]. In Ecuador, it has also been emphasized that, in addition to fertilizers, transfer to the cacao tree is modulated by soil properties and agricultural practices [
3]. In this context, additional evidence from agricultural environments indicates that legacy contamination can persist in soils and be redistributed through fine particles and dust, especially where agricultural disturbance, bare soil, and erosion-prone conditions facilitate the movement and deposition of metal-bearing material, thereby creating localized hotspots and heterogeneous exposure patterns [
36]. Likewise, nationwide evidence for cacao systems in Ecuador shows that cacao has a high affinity for Cd uptake, with soil-to-bean transfer factors ranging from 0.13 to 12.5 and a median of 1.60, supporting that even moderate soil Cd concentrations can result in comparatively high Cd accumulation in beans [
8]. This transfer is not controlled by total soil Cd alone: bean Cd increases with increasing total soil Cd and with decreasing soil pH, organic carbon, and oxalate-extractable manganese, indicating that Cd mobility and sorption processes are critical determinants of soil-to-plant and especially soil-to-bean transfer. In particular, lower pH favors Cd solubility, whereas higher organic carbon and Mn oxyhydroxides can reduce Cd bioavailability through adsorption and retention [
8]. In Guayas, the combination of high variability and the presence of outliers indicates that mechanisms are likely not unique; different farms may be dominated by geogenic factors, land-use history, local deposition processes, or soil chemical properties that favor Cd transfer, as well as diffuse anthropogenic inputs, such as those related to phosphate-based fertilization.
Table 5 presents the economic sustainability indicators disaggregated by zone, because the two areas differ in their production systems. Producers in Cerecita manage larger farms and are almost exclusively dedicated to CCN-51 cacao production. In contrast, producers in Bajada de Chanduy emerged from a Ministry of Agriculture program six years ago, which provided fine flavor cacao plants to be established in household orchards as a long-term investment. Nevertheless, during the last two years, the increase in prices for dried or wet cacao has represented a significant income for smallholders and has stimulated renewed investments, including pressurized irrigation systems, improved fertilizer sources, and increased fertilization frequency, among the most notable changes in medium and large producers in the area.
Of the 19 cocoa producers surveyed, all exhibited
; therefore, according to the methodology of Sarandón and Flores [
24] applied in this study, economic sustainability is insufficient in both localities. However, severity differed markedly: Cerecita (
) showed a mean
of 1.56, while Bajada de Chanduy (
) dropped to a mean
of 0.55, indicating critical economic vulnerability and limited capacity to buffer shocks, invest and sustain income. In parallel, Cd emerged as a cross-cutting environmental pressure, with soil Cd ranging from 0.24 to 1.45 mg kg
−1 and bean Cd from 0.53 to 5.01 mg kg
−1. Mean soil Cd was practically identical between areas (∼0.69 mg kg
−1), but bean Cd showed higher load and variability in Bajada (mean ∼1.74 mg kg
−1; maximum 5.01 mg kg
−1). This suggests that Cd is not an isolated issue affecting only a few farms but rather a territorial condition that increases market risk and compliance and/or mitigation costs. Thus, the expected economic impact depends not only on Cd levels but also on the economic capacity to respond (captured by
), with Bajada de Chanduy showing the lowest resilience to face commercial restrictions, price discounts, rejections, or the investments needed to reduce soil-to-bean Cd transfer.
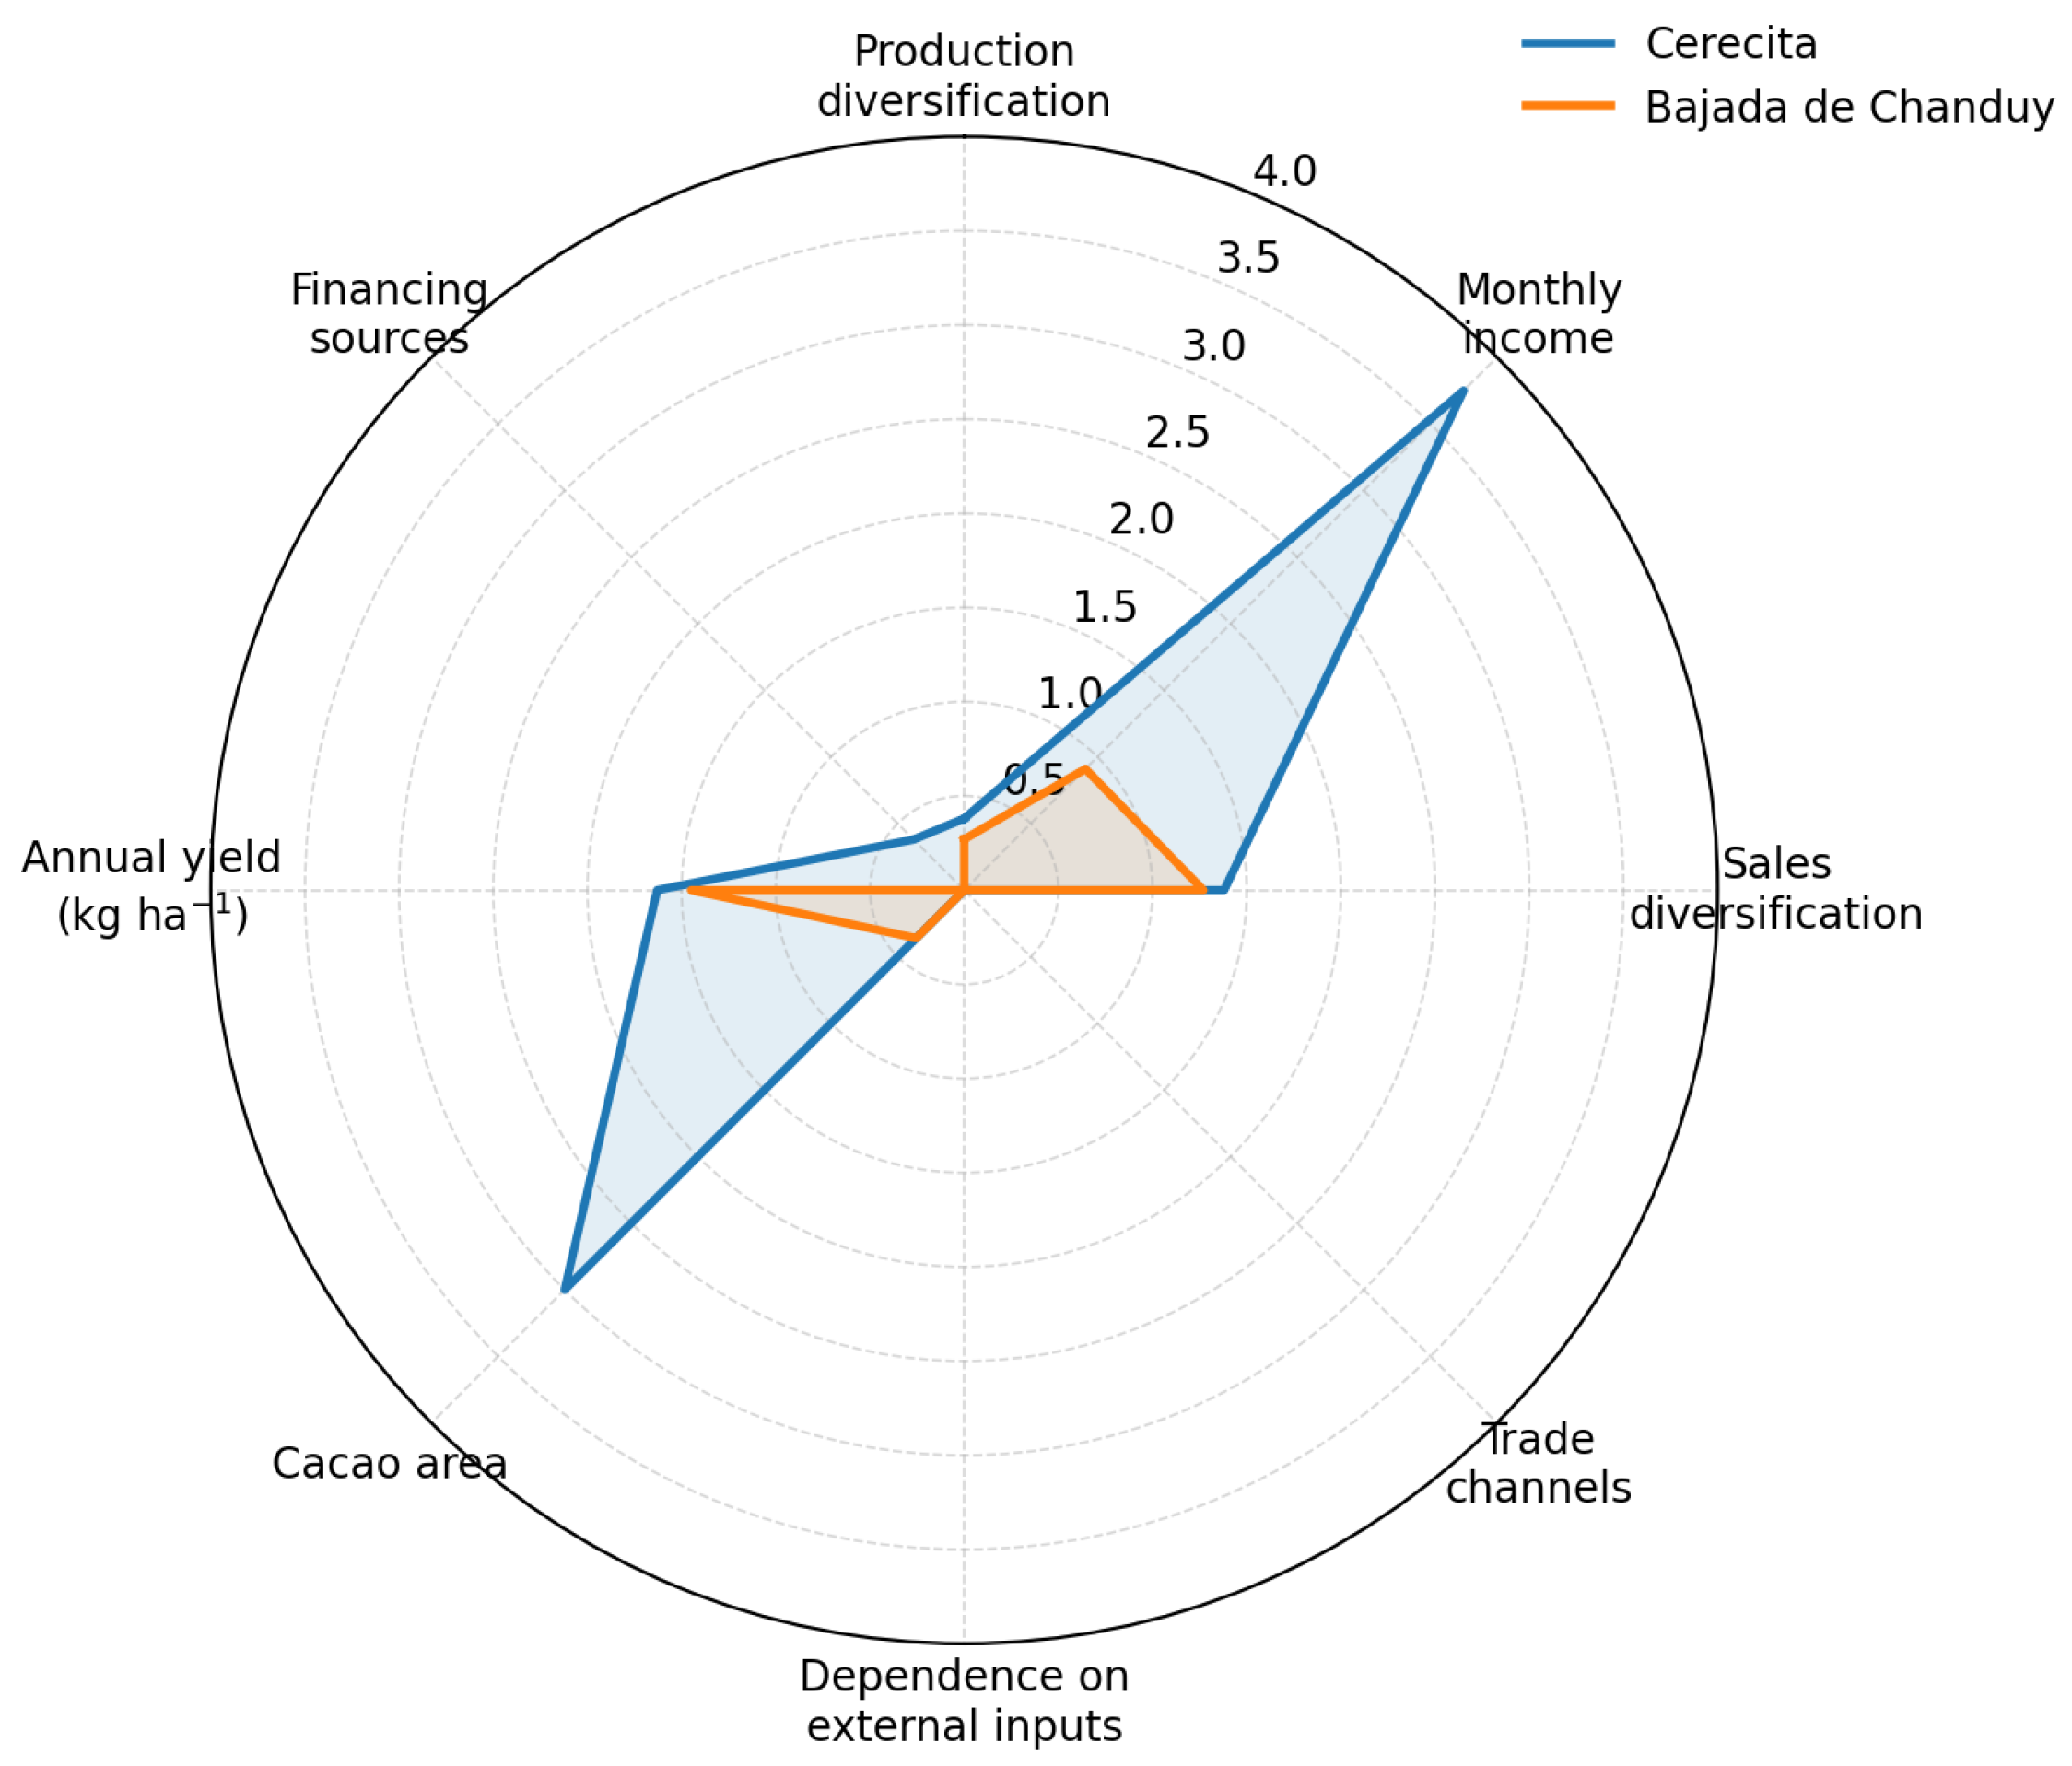
The most critical factors, as shown in
Figure 6, were the near-null diversification of production. In Cerecita, farmers mainly cultivate cacao, with only some adding one additional crop. In Bajada de Chanduy, cacao cultivation originated from government support; however, because the area is close to Guayaquil, household income largely comes from off-farm jobs in the city, Ecuador’s main economic hub. Consequently, low diversification implies fewer alternatives to offset price penalties or rejections, particularly under elevated Cd levels. Previous assessments using the same framework have shown that the economic dimension often conditions ecological and sociocultural performance due to strong interdependence among dimensions: when the economy is insufficient, management options and technological improvements become constrained [
37].
On the other hand, limited access to financing constrains the adoption of mitigation measures, including soil amendments, soil management practices, plantation renovation, varietal selection, and post-harvest improvements. When monthly income is low and unstable, as has occurred during the last two years due to fluctuations in cocoa prices, the impact of Cd becomes even more severe, because any additional cost or commercial discount can push the production system below its economic viability threshold.
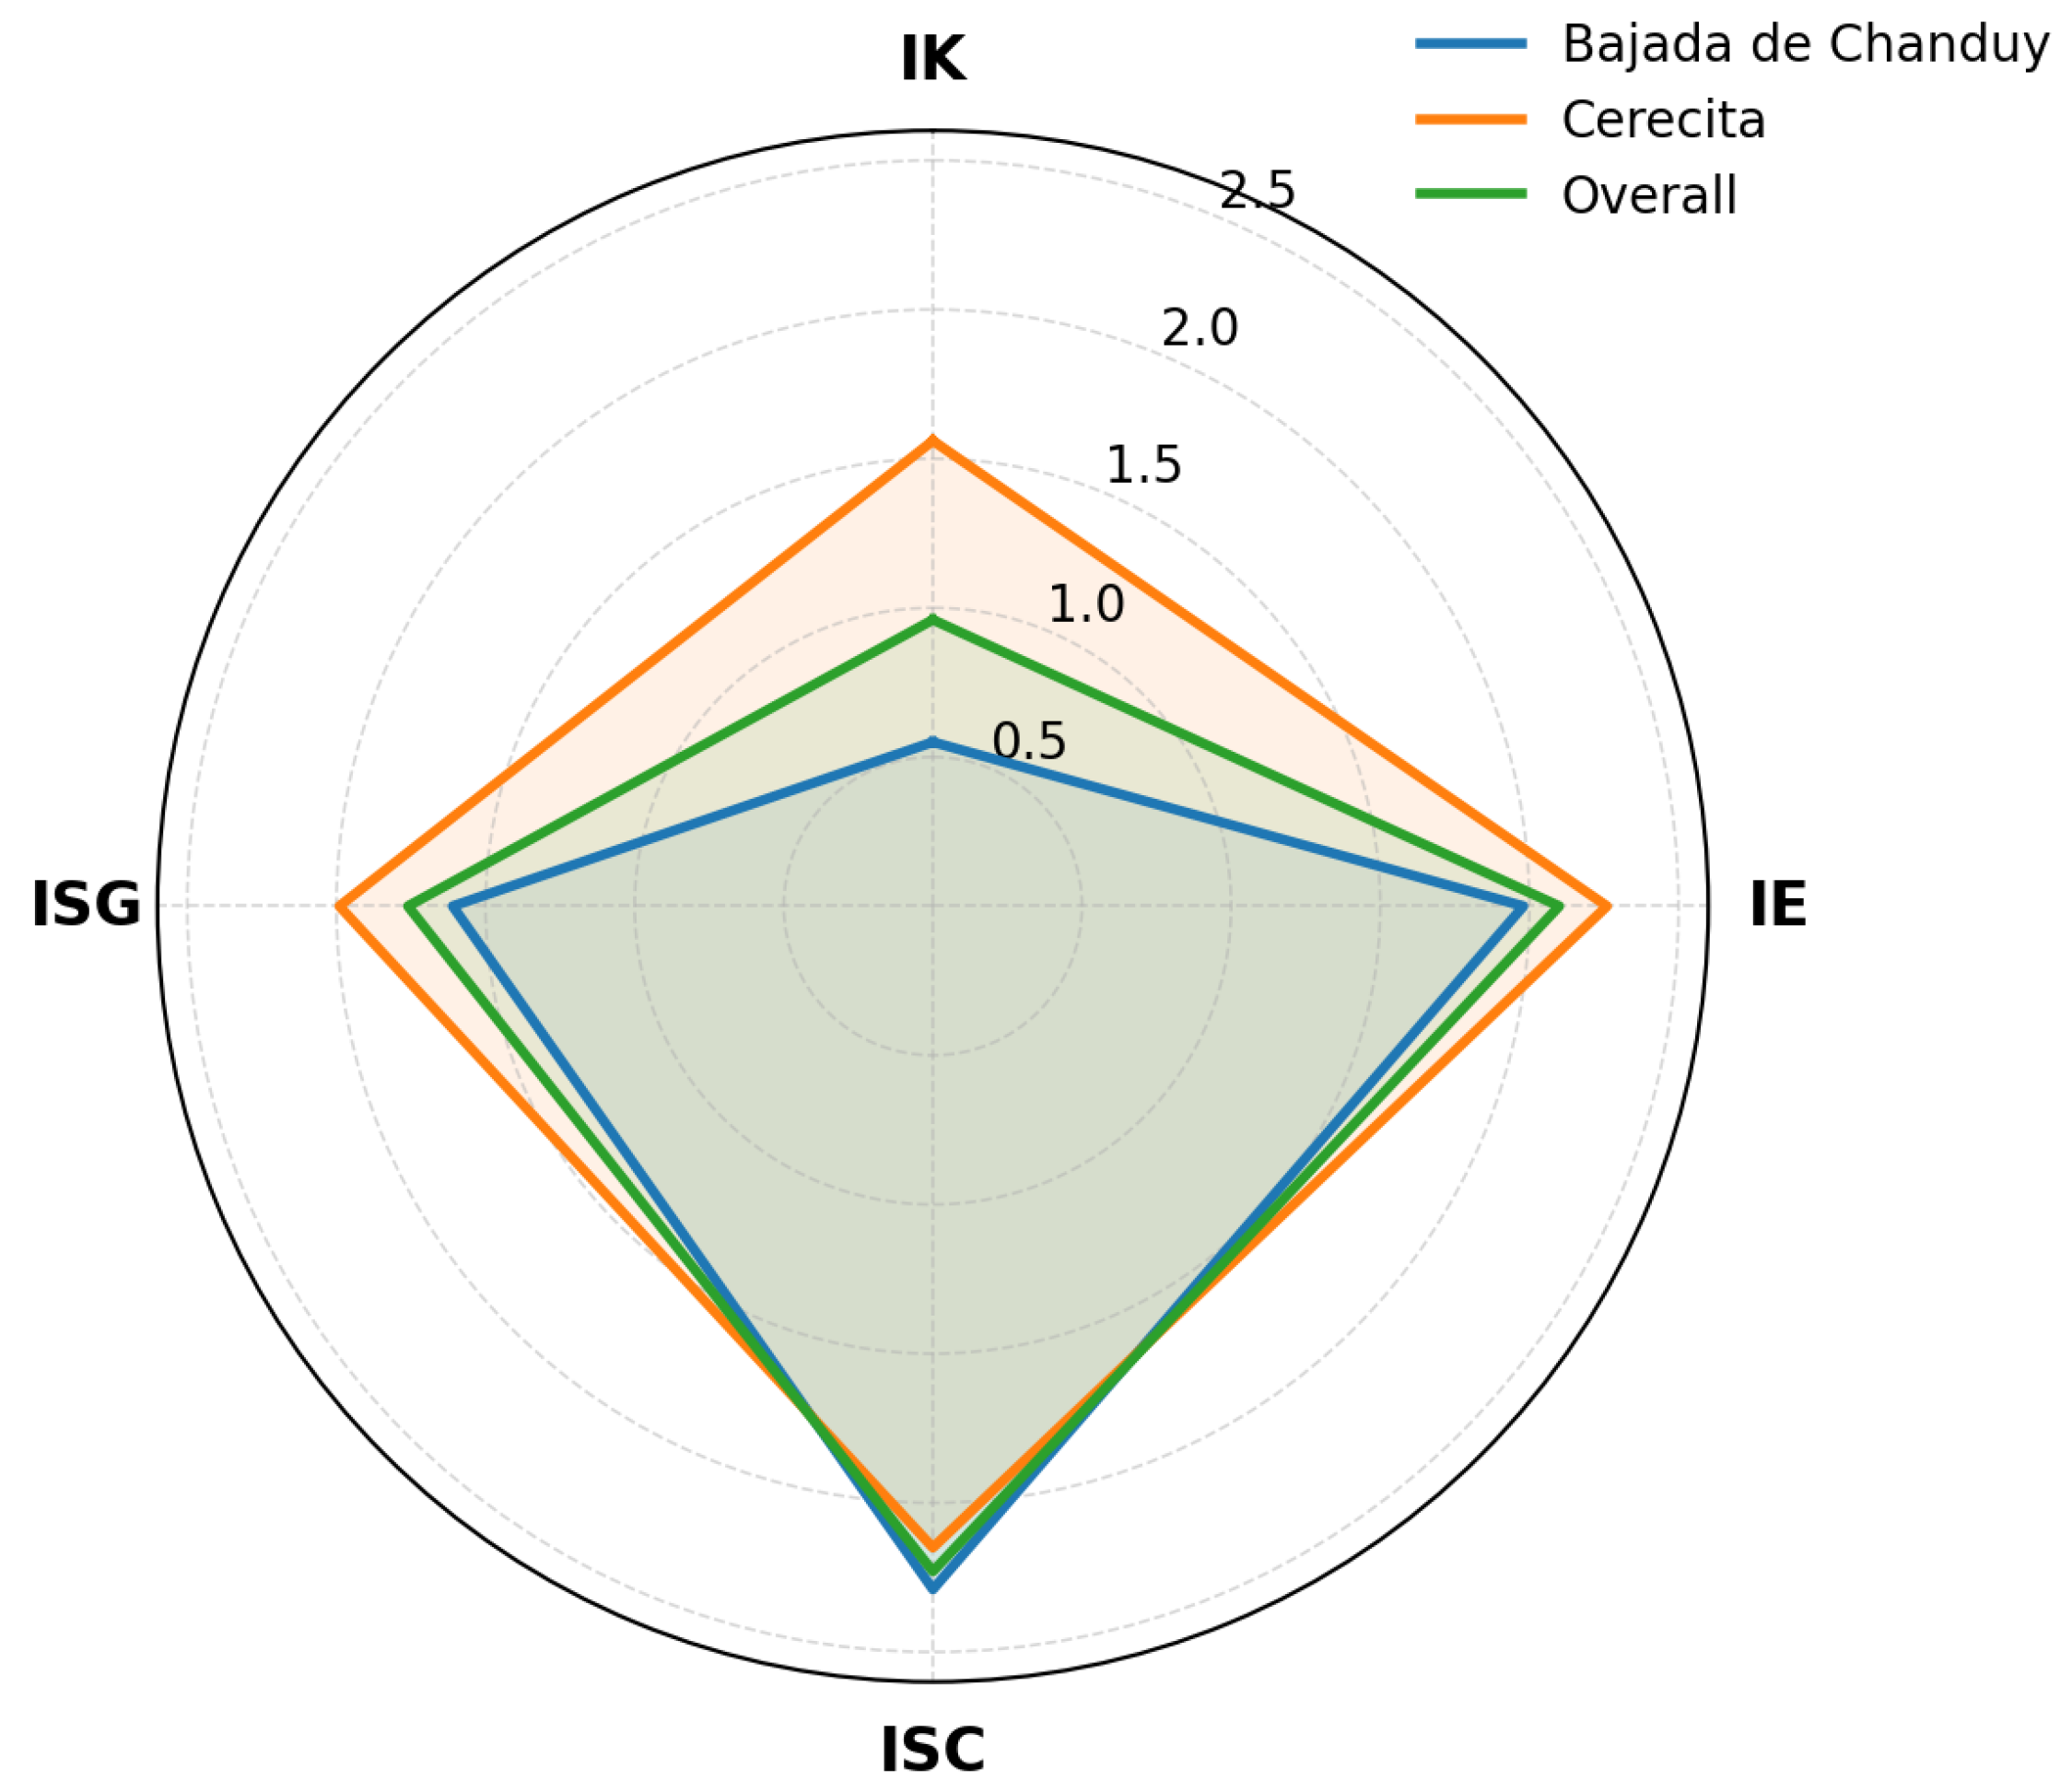
Cerecita shows a marked economic gap relative to Bajada de Chanduy, with an IK of 1.6 versus 0.6, indicating greater relative economic capacity and representing the main differentiating factor between the two locations. This contrast is explained primarily by monthly net income (0.9 vs. 0.2) and, to a lesser extent, by economic risk (0.5 vs. 0.3), whereas food self-sufficiency is low or absent in both areas. In the ecological dimension, Cerecita shows a slightly higher index (2.26) than Bajada de Chanduy (1.98), with fertilization standing out as the main difference (0.6 vs. 0.4), while other indicators, such as soil conservation, biodiversity, and phytosanitary management, are similar. In the sociocultural dimension, Bajada de Chanduy slightly exceeds Cerecita (SC of 2.29 vs. 2.15), mainly because of greater integration (0.5 vs. 0.2), although this advantage does not offset its economic constraints (see
Table 6 and
Table 7).
In both localities, ecological indicators (
) showed low and fairly homogeneous levels, such as soil-life conservation (≈
), biodiversity management (≈
), and phytosanitary management (≈
), with similar erosion-risk values (0.6 in Cerecita vs. 0.5 in Bajada de Chanduy) and a more marked difference in fertilization (0.6 vs. 0.4). Within an indicator-based assessment framework, these ecological performances suggest a limited biophysical base to sustain productivity and stability, which tends to translate into greater economic vulnerability [
24,
38,
39]. Consistently, the economic components (K) are very low, especially in Bajada de Chanduy, where net monthly income (0.2) and economic risk (0.3) are lower than in Cerecita (0.9 and 0.5, respectively), and food self-sufficiency is nearly null (0.0 vs. 0.1). Thus, even though Cd constitutes a relevant external pressure for commercialization, the results show that ecological constraints (soil, biodiversity, and nutrition) operate as a “floor” that conditions income generation, input-use efficiency, and the ability to buffer shocks, ultimately affecting
performance.
Sociocultural indicators (
) also help explain differences in
: Cerecita shows higher basic-needs satisfaction (1.0) than Bajada de Chanduy (0.7), while acceptability is similar (1.0–1.1) and integration is higher in Bajada (0.5) than in Cerecita (0.2). From sustainability and socio-ecological systems perspectives, better satisfaction of basic needs is often associated with greater room to invest, plan, and sustain management practices, thereby supporting economic viability [
24,
38]. Conversely, higher integration may reflect social capital and collective-action capacity (e.g., learning, coordination, and access to networks), with potential to reduce risks and transaction costs; however, in Bajada de Chanduy this social asset is not reflected in better economic values, likely because very low monthly income and a weak ecological base constrain the translation of social organization into productive and financial improvements [
39,
40]. Overall, the results suggest that economic sustainability depends not only on monetary variables but on the interaction between ecological conditions (which sustain production) and sociocultural conditions (which enable or constrain the adoption and persistence of strategies), consistent with the integrative logic of indicator-based methodologies. Finally, the overall sustainability index favors Cerecita (1.99) over Bajada de Chanduy (1.61), consistent with the greater weight of the economic component in the global comparison (see
Table 7 and
Figure 7).
In conceptual terms, these findings reinforce the relevance of indicator-based frameworks for decision making and intervention prioritization as proposed by Sarandón and also by participatory evaluation approaches such as MESMIS, which recommend integrating attributes of productivity, stability, resilience, adaptability, and equity through indicators tailored to the local context [
38]. Moreover, in the sustainability-assessment literature, indicators are described as “information-structuring tools” that make sustainability operational for management and public policy, particularly when territories must be compared and improvement pathways designed [
41].
Interviews were conducted anonymously with key actors in the commercialization chain (collectors) and with agroexport companies linked to the National Association of Cacao Exporters and Industrialists of Ecuador (ANECACAO). This framing is pertinent because ANECACAO defines itself as a trade association that groups and represents around 80% of exporters of cacao beans and derivatives and provides technical and statistical information services for the sector [
42]. Operationally, collectors reported receiving cacao from multiple areas and classifying it by origin; a recurrent preference was purchasing wet cacao to carry out post-harvest processing under their control, with fermentation commonly performed in jute sacks or concrete boxes. While these post-harvest decisions respond to quality standards and logistical efficiency, they concentrate process control and limit producers’ ability to capture value through differentiation a critical issue for economic sustainability when quality and sanitary risk become market attributes.
Regarding cadmium (Cd), interviewees reported a high level of general awareness of the problem, but also acknowledged irregular analytical management: verification of Cd in incoming cacao is infrequent and, when performed, is often limited to random sampling funded privately and analyzed in external laboratories. This qualitative evidence aligns with regional diagnoses indicating that, among producers and intermediaries, explicit Cd requirements are not always transferred as a purchase condition, whereas the costs of mapping, traceability, blending, and laboratory testing tend to concentrate in cooperatives and exporters [
43]. In parallel, Ecuadorian scientific literature has documented that Cd in beans can be high and spatially heterogeneous, associated with both soil properties and agronomic practices, reinforcing the risk of commercial decisions based on incomplete information [
3,
8].
In terms of foreign trade, considering that Ecuador exports globally, including to the United States, Italy, Japan, Indonesia, Malaysia, and Russia, and that ANECACAO statistics report 471 thousand tonnes exported in 2024 (about 30% to the European Union) [
42], interviewees emphasized that for cacao-bean exports there is no systematic requirement for Cd certificates at ports of departure. This perception is consistent with the European regulatory design, where maximum limits apply mainly to finished products (e.g., chocolate and cocoa powder) rather than directly to beans as a raw material, despite the bean Cd conditions compliance in the final product [
35,
44]. Exporters nevertheless reported origin-based risk-management strategies: they identify areas more likely to have elevated Cd and blend lots to adjust the shipment profile to the target market; this practice is recognized in technical guidance as an industrial response to meet Cd limits, especially when the final destination includes cocoa powder [
44,
45]. Even so, interviewees did not report recent sanctions for Cd nor explicit incentives for low Cd, suggesting that the price signal remains diffuse and that mitigation costs tend to be absorbed by the segment with greater bargaining power (export/exporting firms) rather than by producers.
From the indicator-based sustainability evaluation framework, this pattern of commercial governance has direct implications for the economic dimension (
) proposed by Sarandón and Flores [
24]: Cd functions as an exogenous risk factor that increases uncertainty of market access (economic risk), weakens net income stability, and reduces producers’ planning capacity, especially when control and traceability mechanisms are outside their reach. Looking ahead for Guayas and Santa Elena, the combination of a more demanding international environment in terms of food safety and due diligence, blending as a short term solution, and the absence of systematic national verification mechanisms could deepen territorial segmentation: “suitable” zones capturing premium destinations, and zones with elevated Cd facing implicit discounts, greater dependence on intermediaries, and pressure to adjust practices or genetic materials [
43,
45]. Critically, the interviews suggest that the main driver of this scenario is not lack of awareness but an incomplete incentive structure: while final markets set limits on processed products, coordination to manage Cd at origin (sampling, traceability, soil management, and quality differentiation) remains fragmented, shifting part of the risk toward producers and straining their economic sustainability.
In this context, it is relevant to note that the chair of ANECACAO’s board (Iván Ontaneda) highlighted that cacao exports would inject “about
$5 billion” into Ecuador’s economy, with benefits expected to reach rural areas and producers [
42].





 ,
,