Article

Research on the Impact of Environmental Regulations on Green Performance of Biosafety Laboratory Construction Projects

by
Longfei Ren
1,* and
Zhenli Wang
2
1
Fuzhou International Joint Institute, Tianjin University, Tianjin 300072, China
2
Business School, Yunnan University of Finance and Economics, Kunming 650221, China
*
Author to whom correspondence should be addressed.
Sustainability 2026, 18(11), 5409; https://doi.org/10.3390/su18115409
Submission received: 1 May 2026 / Revised: 23 May 2026 / Accepted: 24 May 2026 / Published: 28 May 2026
(This article belongs to the Section Economic and Business Aspects of Sustainability)

Abstract

Biosafety laboratory construction projects are characterized by high technical complexity, strict safety requirements, and potential environmental risks, making the improvement of their green performance essential for both biosafety governance and sustainable construction. However, existing studies have paid insufficient attention to how different types of environmental regulation influence green performance in this specialized construction context. To address this gap, this study investigates the effects of command-and-control, market-incentive, and public-participation environmental regulation on three dimensions of green performance: green process innovation, green management innovation, and environmental performance. Three hypotheses were proposed to examine these relationships. Based on 372 valid questionnaire responses from professionals and enterprises involved in biosafety laboratory construction projects in China, this study used SPSS 27.0 and AMOS 26.0 to conduct reliability and validity tests, confirmatory factor analysis, structural equation modeling, and supplementary regression analysis. The results show that command-and-control environmental regulation significantly promotes green process innovation, green management innovation, and environmental performance, with standardized path coefficients of 0.316, 0.250, and 0.200, respectively. Public-participation environmental regulation has stronger positive effects on the three dimensions, with standardized path coefficients of 0.888, 0.874, and 0.808, respectively. In contrast, market-incentive environmental regulation does not significantly affect green process innovation, green management innovation, or environmental performance. These findings indicate that mandatory regulatory requirements and public-participation mechanisms are more effective than current market-based incentives in improving the green performance of biosafety laboratory construction projects. This study enriches research on environmental regulation and green performance in specialized infrastructure projects and provides practical implications for strengthening environmental governance, public participation, and incentive policy design in biosafety laboratory construction.

1. Introduction

Environmental regulation and green performance are closely linked. This link has been studied for years in environmental economics and sustainability research [1,2]. China’s carbon goals and green lab construction make regulation more than just a rule to cut pollution. It now helps organizations to improve green innovation, use resources better, and manage sustainability [3,4]. Most studies divide regulation into three types. Command-and-control regulation uses rules like emission limits, permits, and clean production audits to set minimum standards [1,5]. Market-incentive regulation uses tools like environmental taxes, green loans, government subsidies, carbon trading, and emission rights trading to make polluters pay or guide green investment [6,7]. Public-participation regulation uses media, community input, and stakeholder pressure to shape behavior through social control and reputation [8,9]. Green performance has also changed. It used to mean only less pollution and end-of-pipe treatment. Now it includes environmental performance, green process innovation, green management innovation, and green technology innovation [1,4].
Green and sustainable construction is now an important part of the construction industry’s low-carbon transition [10]. It focuses on reducing energy use, material waste, pollution, and environmental impacts during the whole project life cycle. It also pays attention to cleaner construction processes, resource recycling, low-carbon materials, and better use of building systems [10,11]. Recent studies have discussed green technology innovation, low-carbon development, ecological efficiency, and sustainable performance in construction and related industries [10,12]. These studies show that green construction is not only about reducing emissions during building operation, but also involves material selection, process improvement, waste management, and life-cycle environmental performance [13]. However, most existing studies still focus on conventional buildings, infrastructure, or general enterprises. Less attention has been paid to specialized facilities such as biosafety laboratories. In these projects, green construction must be achieved together with biosafety control, waste treatment, ventilation safety, and environmental risk management [14,15].
Biosafety laboratories, especially BSL-2 and higher-level laboratories, are important facilities for public health, pathogen research, medical testing, and biosecurity control [14,16]. However, they are different from general buildings and common research laboratories. High-level biosafety laboratories often have high energy use, high emissions, and high environmental risks [14,17]. To keep negative pressure, pressure gradients, high air change rates, HEPA filtration, and strict waste sterilization, BSL facilities use large amounts of energy during operation [14,18]. They also produce special waste with biological risks [15,16]. Therefore, the green transition of BSL projects is not the same as normal building energy-saving or firm-level emission reduction. It must balance biosafety compliance, infection risk control, safe waste treatment, and better environmental performance [16,19]. This special setting makes BSL projects an important but still under-studied case for testing the link between environmental regulation and green performance.
Existing studies on environmental regulation and green performance mainly focus on manufacturing, heavy-polluting industries, the energy sector, and general industrial firms [2,4]. These studies show that command-and-control regulation can promote green process innovation through compliance pressure [5]. Market-incentive regulation can improve resource allocation through price signals [6,7]. Public-participation regulation can also support environmental governance through information openness and stakeholder pressure [8,9]. However, it is still unclear whether these findings can be directly applied to BSL facilities. BSL facilities are special research facilities. Many of them belong to public research systems or medical testing systems. Their green investment decisions are not fully driven by market prices, profit goals, or competition. Furthermore, the first goal of BSL facilities is biosafety. Any measure for energy saving, resource recycling, or waste reduction must meet safety and compliance requirements [14,16]. Therefore, the logic of “regulation–innovation–performance” developed in traditional firm settings may have new limits in the BSL context. Based on this background, this study aims to build a theoretical framework for analyzing environmental regulation and green performance in biosafety laboratories.
Based on the above discussion, this study addresses three research gaps. First, existing studies on environmental regulation and green performance mainly focus on manufacturing firms, heavily polluting industries, and general construction projects, while biosafety laboratory construction projects have received limited attention [2,5]. Second, the meaning of green performance in BSL construction has not been sufficiently contextualized, although these projects must balance energy saving, waste treatment, environmental risk control, and biosafety compliance [14,19]. Third, little is known about whether different environmental regulation instruments have different effects in this highly regulated and safety-sensitive project context [3,20]. Therefore, this study aims to (1) define green performance in the context of BSL construction projects; (2) examine the effects of command-and-control, market-incentive, and public-participation regulation on green process innovation, green management innovation, and environmental performance; and (3) explain why different regulatory tools may produce different outcomes in BSL construction. The novelty of this study lies in extending environmental regulation research to a specialized biosafety infrastructure context and in providing empirical evidence on the differentiated effects of regulatory instruments on multidimensional green performance. The remainder of this paper is organized as follows. Section 2 and Section 3 present the theoretical foundation, literature review, and hypotheses; Section 4 describes the materials and methods; Section 5 reports the empirical results; Section 6 discusses the findings; and Section 7 presents the conclusions, implications, limitations, and future research directions.

2. Theoretical Foundation

2.1. Conceptual Definition and Dimensional Classification of Environmental Regulation

Environmental regulation refers to a set of institutional arrangements established by governments and society to correct environmental externalities, constrain polluting behaviors, and promote green transition [21]. The existing literature commonly classifies it into three types—command-and-control, market-incentive, and public-participation regulation—based on the degree of enforceability, incentive mechanisms, and involved actors [20]. Command-and-control regulation relies primarily on administrative orders and legal standards. Key instruments include emission limits, energy consumption caps, administrative permits, environmental impact assessments, discharge permits, and mandatory clean production audits [5]. Its main strength lies in clear objectives, strong binding force, and rapid environmental improvements—making it especially suitable for high-risk areas where compliance thresholds must not be crossed. However, its drawbacks are also evident: it may raise compliance costs, limit organizational autonomy in innovation, and—when overly strict—even suppress innovation [5].
Market-incentive regulation aims to guide organizations to reduce emissions voluntarily through price signals and economic incentives [7]. Tools such as green taxes, environmental subsidies, green credit, carbon trading, and emission rights trading influence organizational behavior by changing pollution costs, financing costs, or the returns of green investment [22,23]. Compared with command-and-control regulation, market-incentive tools are more flexible and cost-efficient [24]. In theory, they allow emission reduction resources to move toward actors with lower marginal abatement costs. However, their effectiveness depends on the maturity of market mechanisms, policy enforcement capacity, and the stability of price signals [7,24]. For BSL facilities, the applicability of market-incentive tools may be limited by public research budgets and the principle of safety priority.
Public-participation regulation emphasizes information transparency, social supervision, and stakeholder involvement in environmental governance [8,9]. Media attention, community participation, supervision by environmental organizations, and public environmental demands can encourage organizations to improve their environmental behavior through reputational pressure and external accountability mechanisms [9,25]. This type of regulation usually promotes green management by reducing information asymmetry, increasing the cost of violations, and enhancing social visibility [26,27]. For BSL facilities, which involve potential biological and environmental risks, public-participation regulation has particular significance.

2.2. Conceptual Definition and Dimensional Classification of Green Performance

Green performance was initially understood mainly as an organization’s performance in pollution reduction, resource conservation, and environmental compliance, with an emphasis on a single environmental performance dimension [1,2]. With the development of research on green innovation and sustainable development, green performance has gradually evolved into a multidimensional concept that includes environmental performance, economic performance, and innovation performance [1,4]. Environmental performance is mainly reflected in lower energy consumption, reduced pollutant emissions, waste minimization, and improved resource use efficiency. Economic performance emphasizes the effects of green governance on cost savings, operational efficiency, and long-term competitiveness. Innovation performance focuses on whether an organization achieves continuous improvement through green process innovation, green product innovation, and green management innovation [12].
In manufacturing studies, green process innovation is usually reflected in the adoption of clean production technologies, energy-saving equipment, low-carbon processes, and pollution prevention technologies [10,28]. Green product innovation emphasizes improvements in product design, material selection, and life-cycle environmental impacts. Green management innovation involves environmental management systems, green supply chains, environmental information systems, and optimization of organizational decision-making processes [12]. However, in the BSL context, the measurement of green performance needs to be further contextualized. Since BSL facilities are not centered on product manufacturing, their green performance should focus more on energy efficiency during construction and operation, safe waste disposal, laboratory materials and consumables management, optimization of air handling systems, water resource utilization, environmental risk control, and coordinated management of environmental protection and biosafety [19].
Therefore, green performance in BSL facilities is not merely energy-saving performance. Green process innovation in BSL facilities may be reflected in the application of high-efficiency ventilation systems, intelligent pressure control, low-energy air filtration, energy-saving sterilization equipment, and modular construction technologies [17]. Green management innovation may be reflected in the establishment of laboratory environmental management systems, energy management standards, and waste classification and tracking systems [19,29]. Environmental performance in BSL facilities is reflected in reductions in energy consumption, improvements in waste disposal efficiency, and decreases in environmental risk, all without compromising biosafety levels [16].
In this study, “green” in the context of biosafety laboratory construction refers to project practices and outcomes that reduce energy consumption, material waste, pollutant discharge, and environmental and health risks while maintaining mandatory biosafety performance. Therefore, green performance in BSL construction is not limited to conventional energy-saving indicators. It also includes safe waste disposal, environmentally friendly material and equipment selection, environmental monitoring, biosafety-compatible process optimization, and management practices that integrate environmental protection with biosafety compliance.

2.3. Theoretical Interpretation and Controversies of the Porter Hypothesis

The Porter Hypothesis provides an important theoretical foundation for explaining the relationship between environmental regulation and green performance [30]. It argues that properly designed environmental regulation does not necessarily weaken organizational competitiveness; instead, it may stimulate an innovation-offset effect, encouraging firms to adopt more efficient production methods and thereby partially or fully offset compliance costs [31]. Subsequent studies commonly divide the Porter Hypothesis into three versions: weak, strong, and narrow. The weak version emphasizes that environmental regulation can promote green innovation; the strong version further argues that regulation-induced innovation can improve organizational performance or competitiveness; and the narrow version suggests that flexible market-incentive regulation is more conducive to innovation than rigid command-and-control regulation [1,30].
Existing empirical studies provide relatively strong support for the weak version of the Porter Hypothesis, suggesting that environmental regulation generally stimulates green patents, green process innovation, and environmental management innovation [1,5]. However, support for the strong version remains inconsistent. Some studies find that although environmental regulation can promote green innovation, the benefits generated by such innovation may not fully offset compliance costs in the short-term, nor necessarily lead to significant improvements in financial performance [32]. Moreover, the effects of different types of regulatory instruments vary considerably. Command-and-control regulation can usually promote end-of-pipe treatment and process improvement quickly, but excessive mandatory pressure may crowd out innovation resources [5]. Market-incentive regulation has the advantage of flexibility, yet its effectiveness depends on market design and price signals [6,24]. Public-participation regulation, by contrast, promotes voluntary environmental management through reputational pressure and information transparency [8,15].
For BSL facilities, the applicability of the Porter Hypothesis needs to be reconsidered. Green performance in BSL facilities is not a typical cost–benefit choice under market competition; rather, it is jointly shaped by biosafety regulations, research missions, public budgets, and social perceptions of risk [14,16]. Therefore, in the BSL context, whether environmental regulation can stimulate green innovation depends not only on regulatory intensity, but also on whether such regulation is compatible with safety compliance objectives.
Therefore, this study mainly draws on the weak version of the Porter Hypothesis, which argues that environmental regulation can stimulate green innovation [30]. In this study, this logic is examined through the effects of environmental regulation on green process innovation and green management innovation in BSL construction projects. Environmental performance is treated as another dimension of green performance rather than as a mediating or downstream outcome of green innovation. Therefore, this study does not directly test the strong version of the Porter Hypothesis, which emphasizes whether regulation-induced innovation can improve firm competitiveness or economic performance. In addition, although this study compares command-and-control, market-incentive, and public-participation regulation, it does not assume that flexible market-based instruments are necessarily more effective. Instead, it examines whether different regulatory instruments can be translated into green performance improvement under the premise of biosafety compliance.

3. Literature Review and Research Hypotheses

3.1. Research on the Relationship Between Command-and-Control Environmental Regulation and Green Performance

3.1.1. Performance Effects of Direct Regulatory Instruments

Command-and-control environmental regulation is the most traditional and binding instrument of environmental governance. A large body of research shows that direct regulatory instruments, such as emission standards, administrative permits, mandatory cleaner-production audits, and energy consumption quotas, can encourage organizations to improve their environmental behavior through explicit compliance pressure, thereby enhancing green performance [5]. However, the effect of command-and-control regulation on green performance is not simply linear. Some studies have found that there may be an inverted U-shaped relationship between regulatory intensity and green technological innovation. Overly stringent regulation may increase compliance costs and crowd out R&D resources, thus inhibiting innovation [20]. This indicates that the effectiveness of command-and-control regulation depends on regulatory intensity, enforcement methods, and the regulated entities’ capacity to absorb compliance pressure. For BSL facilities, this issue is even more prominent. High-containment laboratories must comply with strict biosafety and environmental safety standards, making command-and-control regulation indispensable for safeguarding minimum safety requirements [16]. However, if energy consumption standards, waste treatment requirements, and biosafety norms are not well coordinated, the scope for green retrofitting may also be constrained. Since BSL facilities are not production organizations centered on marketable products, their green performance is more likely to be reflected in process innovation and management innovation—such as energy-saving ventilation systems, optimization of sterilization processes, reduction in laboratory consumables, waste classification, and the construction of environmental monitoring systems—rather than in green product innovation [17,33]. Therefore, the primary function of command-and-control regulation in BSL facilities should be positioned as setting safety and environmental baselines, rather than merely forcing laboratories to undertake green process and management improvements.

3.1.2. Heterogeneity Analysis

The effect of command-and-control regulation on green performance differs across ownership types, industries, and regions. In terms of ownership, non-state-owned firms are more sensitive to command-and-control regulation than state-owned firms. Studies show that environmental regulation has a stronger positive effect on green innovation in non-state-owned firms, non-heavy-polluting industries, and large firms [34]. Industry type and regional institutions also affect this relationship. Heavy-polluting industries face stricter emission limits and closer supervision. So, they have a stronger need for green process innovation. High-tech industries have stronger technical capacity. Therefore, they can turn regulatory pressure into innovation outcomes more effectively [35,36]. Regional differences also matter. Eastern coastal regions and central and western regions differ in market development, environmental enforcement, and industrial clustering. These differences may lead to spatial variation in the effect of command-and-control regulation [37]. However, BSL facilities have special features. This is especially true for BSL-3 and BSL-4 laboratories. They must maintain high air change rates and strict pressure control. As a result, their energy use is much higher than that of conventional buildings [17]. There may be a tension between mandatory energy standards and biosafety compliance. Some energy-saving measures, such as air recirculation, may increase the risk of cross-contamination. However, overly conservative safety design can lead to energy waste.
H1. 
In biosafety laboratory construction projects, command-and-control regulation has a significant effect on green performance.

3.2. Market-Incentive Regulation and Green Performance

3.2.1. Performance Effects of Green Fiscal Policies and Financial Support

Market-incentive regulation affects organizational behavior through economic signals. Its core logic is to internalize environmental costs [6]. In this way, pollution activities face higher costs, while green investment can receive higher returns [38]. Common policy tools include green taxes, environmental subsidies, and green credit [22,23]. They also include carbon emission trading and emission rights trading [24]. Previous studies have found that government environmental subsidies can reduce the financial constraints of firms in green innovation and promote investment in green technologies [22]. Environmental taxes may inhibit innovation in the early stage because they increase compliance costs. However, when the tax burden reaches a certain level, firms may use green innovation to avoid long-term costs [39]. Green credit policies guide funds from high-pollution and high-energy-consuming projects to green projects through financing constraints, thus promoting green transformation [23,40]. For BSL facilities, however, the applicability of market-incentive regulation has clear limitations. Most high-level BSL facilities belong to public research, medical testing, or government-funded systems. Their main goal is not profit maximization. Their financing behavior and investment decisions are also not fully affected by market credit costs. Therefore, carbon trading, emission rights trading, and green credit may have weaker direct incentives for BSL facilities than for manufacturing firms. By contrast, special government funds, subsidies for energy-saving renovation, funding for green laboratory construction, and performance-based rewards based on reduced energy use and waste reduction may be more suitable for the organizational features of BSL facilities [19,29]. In other words, market-incentive tools in BSL facilities should shift from “market price-driven incentives” to “public budget incentives” and “project performance orientation”.

3.2.2. Heterogeneity of Market-Incentive Tools

Different market-incentive tools may have different effects on green performance. Subsidies can directly reduce the initial cost of green investment [20]. However, without clear performance requirements, they may lead to rent-seeking and inefficient investment. Environmental taxes can increase the cost of pollution [22]. However, if the tax rate is too low, they may not create enough pressure for innovation [23]. Green credit can improve the allocation of funds, but its effect on non-profit public institutions is often limited [41]. The effect of market-incentive tools is also shaped by ownership type, industry features, firm size, and the local institutional environment [42]. Existing studies show that green finance and environmental regulation do not always support each other in a simple way. Green finance may reduce the negative effect of command-and-control regulation on green innovation. It may also weaken the effect of some market-incentive regulation tools [42]. This means that when several policy tools are used together, they may replace each other, conflict with each other, or show weaker marginal effects. For BSL projects, this policy mix is especially important. BSL construction and operation are shaped by biosafety rules, public budgets, research management systems, and environmental policies. If green incentives do not match biosafety compliance requirements, two problems may occur. A project may have funding but still be unable to make changes. It may also have available technologies but be unwilling to use them because of safety concerns.
H2. 
In BSL construction projects, market-incentive regulation has a significant effect on green performance.

3.3. Public-Participation Regulation and Green Performance

3.3.1. Stakeholder Pressure and Voluntary Environmental Management

Public-participation regulation means that groups beyond the government—like NGOs, communities, media, and employees—also help to shape environmental outcomes. According to stakeholder theory, organizations must respond not only to government rules but also to pressure from investors, consumers, local residents, the media, environmental groups, and staff [8,26]. Studies show that such pressure can improve environmental performance. It does this by encouraging better internal green management, clearer environmental reporting, and greener daily operations [8]. Voluntary environmental management is one key way this happens. When a firm faces high public attention, it may join green certification programs or adopt green supply chain practices. This helps to protect its reputation and reduces social risk [25,43]. In BSL projects, stakeholder pressure works differently. BSLs deal with biosafety, public health, and environmental risk [16]. Their construction and operation often draw attention from nearby communities, the public, and the media. Public participation here does not mean that the public makes technical decisions. Instead, it happens through public notice in environmental impact assessments, transparent waste disposal records, and open communication about environmental risks [27]. These practices help BSLs to improve their environmental management over time.

3.3.2. Disclosure Quality and Media Oversight

Disclosure quality matters a lot. Good-quality disclosure helps stakeholders to monitor the organization, raises environmental responsibility, and leads to real improvements in green management [26]. However, some organizations use disclosure for impression management, or “greenwashing.” They highlight positive information and use certain words to appear green, even if their actual environmental performance stays the same [25,43]. Media oversight is a key part of public-participation regulation. When regulation and media attention work together, firms are more likely to make real green changes, not just write better reports [9,44]. NGOs, local residents, and media together form a social monitoring network. This network helps to fill gaps where government oversight is weak or information is missing [9]. Still, public participation does not always work well. In practice, formal processes like public comment periods, hearings, and third-party reviews in environmental impact assessments tend to have stronger effects on environmental outcomes [27]. For BSLs, media and public engagement have special importance. High-level BSLs carry potential biosafety risks, so the public naturally cares about how they manage the environment and safety. If disclosure is too low, people may lose trust and overestimate risks. If disclosure is too much, it may weaken biosafety or compromise research confidentiality.
H3. 
In BSL construction projects, public-participation regulation has a significant effect on green performance.

3.4. Literature Summary

Overall, existing studies have reached some shared views on the link between environmental regulation and green performance. Environmental regulation can promote green innovation and improve environmental performance under certain conditions. This provides support for the weak Porter Hypothesis [1]. Command-and-control standards, market-incentive policies, and public-participation mechanisms can all affect organizational costs, resource allocation, and reputation pressure. Through these channels, they may promote green process innovation, green management innovation, and better environmental governance [4]. However, different types of environmental regulation work in different ways. Their effects on green performance are also not the same. Command-and-control regulation usually creates strong short-term pressure. It can quickly promote pollution control, energy-saving renovation, and green process innovation [5]. However, if the regulation is too strict, compliance costs may reduce the resources available for other activities [14,17]. Market-incentive regulation has cost-efficiency advantages. It can guide green investment through taxes, subsidies, green credit, and trading mechanisms. However, its effect depends on policy design and on how strongly organizations respond to economic signals [22,23]. Public-participation regulation reduces information gaps through disclosure, media oversight, and stakeholder pressure [26,43]. It can also support voluntary environmental management. However, its effect depends on disclosure quality, monitoring capacity, and legal support [27].
Existing studies provide rich evidence for understanding the relationship between environmental regulation and green performance [5,35]. However, most of them focus on manufacturing firms, heavily polluting industries, and general enterprises. Less attention has been paid to BSLs, which are high-risk, energy-intensive, and highly regulated research facilities. The green performance of BSLs is not only about cost reduction, but is also a governance issue involving biosafety, environmental protection, and public health [14,16]. Theories developed in general business settings may not fully explain how BSLs respond to different types of environmental regulation under the principle of safety first. In addition, existing studies often measure green performance mainly through green process innovation or environmental performance [28]. They provide fewer multidimensional evaluation frameworks that fit the BSL context. Therefore, this study makes several contributions. It divides environmental regulation into command-and-control regulation, market-incentive regulation, and public-participation regulation. It also defines green performance as a combined outcome of green process innovation, green management innovation, and environmental performance. By integrating environmental regulation theory, the Porter Hypothesis, and green laboratory research, this study identifies the applicable boundaries and mechanisms of these three regulatory tools in the special context of BSLs. This provides a theoretical basis for later empirical analysis and policy design.

4. Materials and Methods

4.1. Research Design

This study used a quantitative research design to examine how different forms of environmental regulation affect green performance in biosafety laboratory (BSL) construction projects. BSL projects have complex requirements. In addition to traditional project goals, such as quality, cost, schedule, and construction safety, they must also meet requirements for biosafety protection, environmental risk control, waste treatment, ventilation and pressure gradient systems, and compliance with strict technical and regulatory standards. This study developed a research framework that links three types of environmental regulation with three dimensions of green performance. Environmental regulation was divided into command-and-control regulation, market-incentive regulation, and public-participation regulation. Green performance was measured through green process innovation, green management innovation, and environmental performance. Empirical data were collected through a questionnaire survey. The proposed hypotheses were then tested using reliability analysis, validity analysis, correlation analysis, structural equation modeling, and supplementary multiple linear regression analysis.

4.2. Questionnaire Design and Variable Measurement

The questionnaire used a five-point Likert scale for all items except demographic and control variables. The response options were: 1 = “strongly disagree”, 2 = “disagree”, 3 = “neutral”, 4 = “agree”, and 5 = “strongly agree”. A higher score means the respondent agreed more with the statement.
The questionnaire had four parts. The first part explained the study’s purpose and academic value. It also stated that the survey was anonymous and that all responses would be used only for research. Key terms were briefly defined at the start to help respondents understand the questions. The second part asked about the respondent’s background and their organization, including education, work experience, firm size, job title, industry type, total assets, location, and past experience with biosafety laboratory construction projects. The third part measured the main variables: environmental regulation and green performance. The fourth part thanked the respondent for their time.
The questionnaire was built in three steps. First, items were taken from existing scales used in studies on environmental regulation, green innovation, green supply chain management, environmental performance, and sustainable performance. Some wording was changed to fit the context of biosafety laboratory construction projects. Second, the draft was reviewed by the project supervisor and an expert group. They gave feedback on the structure, wording, relevance of items, length, and whether the items made sense for BSL projects. Third, a pre-test was carried out at Beijing Shijishengtong Environmental Engineering Technology Co., Ltd., Beijing, China. Fifty questionnaires were given out and all were returned. Based on the feedback and early results, some items on command-and-control regulation and environmental performance were revised to be clearer and more relevant. The final questionnaire was then used for data collection. The data were cleaned and analyzed using SPSS 27.0 and AMOS 26.0.

4.2.1. Measurement of Environmental Regulation

Command-and-control regulation refers to mandatory environmental requirements set by governments or regulatory agencies through laws, regulations, policies, technical standards, monitoring systems, and penalties. This study measured it using five items: the completeness of environmental laws and regulations, the completeness of the policy system, the independence and authority of regulatory agencies, the strictness of emission reduction and technical standards, and the severity of penalties for violations. Market-incentive regulation uses economic tools—such as subsidies, special funds, tax incentives, green credit, and pollution fees—to encourage environmental improvement. During reliability testing, the item on pollution fees was removed because its corrected item-total correlation fell below the acceptable threshold, and Cronbach’s alpha increased after its removal. The final analysis kept five items: pollution control subsidies, clean production funds, environmental governance subsidies, tax incentives, and green credit support. Public-participation regulation refers to pressure and guidance from public oversight, environmental information disclosure, environmental certification, public hearings, participation in environmental impact assessments, voluntary environmental commitments, and green technology adoption. This dimension was measured using five specific items.
The measurement items for environmental regulation are shown in Table 1.

4.2.2. Measurement of Green Performance

This study used green performance as the dependent variable. Based on previous studies and the features of biosafety laboratory construction projects, green performance was divided into three dimensions: green process innovation, green management innovation, and environmental performance. Green process innovation refers to the use of green materials, equipment, and construction methods during project implementation. Green management innovation refers to improvements in management systems, environmental monitoring systems, process design, and green management practices. Environmental performance refers to the final environmental and biosafety outcomes of the project, including better laboratory safety, higher operating efficiency, stronger protection of staff health, less waste, and lower health risks.
The measurement items for green performance are shown in Table 2.

4.2.3. Control Variables

Control variables included education level, work experience, firm size, project size, job type, industry type, location, whether the firm had undertaken biosafety laboratory construction projects before, the number of times the respondent had participated in such projects, and the respondent’s level of understanding of biosafety laboratory construction projects.
Work experience was coded as follows: 1 = three years or less, 2 = four to six years, 3 = seven to ten years, and 4 = more than ten years. Firm size was measured by the number of employees: 1 = 1–50 employees, 2 = 50–100 employees, 3 = 100–500 employees, and 4 = more than 500 employees. Project size was measured by total project value: 1 = RMB 2 million or less, 2 = RMB 2–5 million, 3 = RMB 5–10 million, and 4 = more than RMB 10 million. The number of times the respondent had participated in biosafety laboratory construction projects was coded as follows: 1 = no participation, 2 = one to three times, 3 = four to six times, 4 = seven to ten times, and 5 = more than ten times. The level of understanding of biosafety laboratory construction projects was coded as follows: 1 = very familiar, 2 = relatively familiar, 3 = generally familiar, 4 = slightly familiar, and 5 = not familiar at all.
In the supplementary regression analysis, independent-samples t-tests and one-way ANOVA were used to identify control variables that showed significant differences across the dependent variables. The selected control variables were then included in the multiple linear regression models. Categorical variables were transformed into dummy variables before the regression analysis. The results showed that the variance inflation factor values of all variables were below 2.267, which means that multicollinearity was not a serious concern.
Regional regulatory stringency was also considered. However, objective city-level or province-level regulatory stringency indicators were not available for all surveyed organizations. Therefore, location was used as a candidate control variable to reflect regional differences. Future studies could use more detailed regional regulatory data to control this factor more directly.

4.3. Data Collection and Sample Screening

The formal questionnaire survey was conducted from February to December 2024. Data were collected through both online and offline channels. Offline questionnaires were mainly distributed to partner firms and institutions of the author’s company. These included organizations involved in biosafety laboratory design, construction, environmental engineering, medical research, and laboratory operation. Online questionnaires were distributed through Wenjuanxing and Tencent Questionnaire, as well as by email, WeChat links, and online invitations.
The target respondents included employees of firms involved in biosafety laboratory construction projects, users and researchers of biosafety laboratories, employees of firms related to environmental regulation, and professionals from industries such as bioengineering, medicine, medical equipment, construction, energy supply, environmental protection, and research institutions. These respondents were selected because biosafety laboratory construction is a multidisciplinary field. It involves engineering construction, environmental assessment, medical equipment, biosafety standards, and other related areas.
In addition to the questionnaire survey, informal field interviews were conducted with several relevant project participants, including project managers, technical personnel, and laboratory users. These interviews were not used as independent quantitative data, but they helped the authors to better interpret the empirical findings and understand the practical mechanisms behind environmental regulation and green performance in biosafety laboratory construction projects.
A total of 500 questionnaires were distributed and 420 were returned, giving a response rate of 84.0%. After data screening, 372 valid questionnaires were retained, giving a valid response rate of 74.4%. Invalid questionnaires were removed based on the following criteria: questionnaires completed in less than 60 s, questionnaires with the same answer for all scale items, questionnaires with clear patterned responses, and questionnaires submitted by respondents who were not familiar with biosafety laboratory construction projects.
The response rate was calculated as the number of returned questionnaires divided by the number of distributed questionnaires, and the effective response rate was calculated as the number of valid questionnaires divided by the number of distributed questionnaires. The distribution of returned and valid questionnaires is shown in Table 3.

4.4. Sample Characteristics

The demographic characteristics of the respondents are shown in Table 4. In terms of education level, most respondents had a bachelor’s degree or higher: 46.77% held a bachelor’s degree, and 33.06% had a postgraduate degree or above. In terms of work experience, 61.0% of the respondents had three years or less of work experience, while 16.9% had more than ten years of work experience. Regarding firm size, most respondents came from small- and medium-sized enterprises. In terms of job type, technicians, junior managers, and senior managers accounted for relatively high proportions. The relative frequencies in Table 4, Table 5 and Table 6 were calculated by dividing the frequency of each category by the total number of valid responses; namely, 372.
The enterprise characteristics are detailed in Table 5. The main industries represented among the surveyed firms include bioengineering, pharmaceuticals, medical devices, construction, government agencies, non-profit organizations, and research institutions. In terms of total asset scale, the sample covers firms of various sizes—from small to large enterprises. Geographically, the majority of the enterprises are located in Eastern China, followed by those in Central and Western China.
The respondents’ relevance to biosafety laboratory construction projects is shown in Table 6. Nearly half of the surveyed firms had previously participated in biosafety laboratory construction projects. In addition, 47.6% of the respondents had participated in at least one such project. Regarding project familiarity, 93.0% of the respondents reported having some level of understanding of biosafety laboratory construction projects. This indicates that the sample was highly suitable for the topic of this study.

4.5. Data Analysis Strategy

The data were analyzed using SPSS 27.0 and AMOS 26.0. Before hypothesis testing, the dataset was screened for invalid responses, common method bias, normality, and multicollinearity. Reliability was assessed using Cronbach’s alpha coefficients and corrected item-total correlations. Exploratory factor analysis was conducted using the Kaiser–Meyer–Olkin test and Bartlett’s test of sphericity. Confirmatory factor analysis was then used to evaluate the measurement model, including model fit, standardized factor loadings, composite reliability, and average variance extracted. Pearson correlation analysis was conducted to examine the preliminary associations among the main variables. Structural equation modeling was then used to test the hypothesized relationships among the latent constructs. These methods were used in sequence because the study first needed to verify the reliability and validity of the measurement scales before testing the structural relationships among latent variables. SEM was selected because it can examine multiple relationships among latent constructs simultaneously while accounting for measurement error.
The final sample included 372 valid responses. This sample size was considered adequate for structural equation modeling because it exceeded the commonly recommended minimum sample size of 200 and provided a sufficient number of observations relative to the estimated model parameters. In addition, the number of valid observations was substantially larger than the number of observed measurement items retained in the final measurement model.
Common method bias was assessed using Harman’s single-factor test. All retained measurement items were entered into an unrotated exploratory factor analysis. The first unrotated factor explained 38.7% of the total variance, which was below the commonly used threshold of 50%. This result indicates that common method bias was unlikely to seriously distort the relationships among the main variables.
Before conducting confirmatory factor analysis and structural equation modeling, the distributional characteristics of the retained measurement items were examined. The results did not indicate severe deviation from normality. Therefore, maximum likelihood estimation was used in AMOS 26.0 for both confirmatory factor analysis and structural equation modeling. Model fit was evaluated using multiple fit indices, including χ2/df, RMSEA, GFI, AGFI, CFI, IFI, and TLI.
Finally, because market-incentive regulation was not significant in the structural equation model, supplementary multiple linear regression analysis was conducted to further examine the effects of specific market-incentive instruments. Variance inflation factors were calculated to assess multicollinearity in the regression models. The VIF values of all variables were below 2.267, indicating that multicollinearity was not a serious concern.

5. Results

Before conducting reliability, validity, and hypothesis testing, common method bias was assessed because the core variables were collected through a self-administered questionnaire. Harman’s single-factor test showed that the first unrotated factor explained 38.7% of the total variance, which was below the commonly used threshold of 50%. This indicates that common method bias was unlikely to seriously distort the relationships among the main variables. The research results are presented in the following order: reliability analysis, exploratory factor analysis, confirmatory factor analysis, correlation analysis, structural equation modeling, supplementary regression analysis, and an integrated interpretation of the empirical findings.

5.1. Reliability Analysis

As shown in Table 7, the overall Cronbach’s alpha coefficient for the environmental regulation scale was 0.912. The alpha values of its three subdimensions all exceeded the commonly accepted threshold of 0.800: 0.839 for command-and-control regulation, 0.820 for market-incentive regulation, and 0.824 for public-participation regulation. The only problematic item was ME6, whose CITC value was only 0.400, below the recommended threshold of 0.500. After deleting this item, the Cronbach’s alpha coefficient of the market-incentive regulation scale increased to 0.829. For the green performance scale, the overall Cronbach’s alpha coefficient reached 0.944, indicating extremely high reliability. The Cronbach’s alpha coefficients for green process innovation, green management innovation, and environmental performance were 0.819, 0.877, and 0.860, respectively. All CITC values were above 0.500, and no items needed to be deleted.

5.2. Exploratory Factor Analysis

For the environmental regulation scale, the KMO value was 0.924 and Bartlett’s test of sphericity was significant (χ2 = 2370.817, df = 105, p = 0.000), indicating that the data were suitable for factor analysis. The cumulative explained variance reached 60.345%, exceeding the minimum standard of 50%. At the subscale level, the KMO values for command-and-control regulation, market-incentive regulation, and public-participation regulation were 0.836, 0.851, and 0.844, respectively, and all Bartlett’s tests were significant at the p < 0.001 level. These results support the three-dimensional structure of environmental regulation.
For the green performance scale, the KMO value was 0.968, and Bartlett’s test of sphericity was also significant (χ2 = 3631.221, df = 171, p = 0.000). The cumulative explained variance reached 57.951%, indicating that the extracted factors had sufficient explanatory power. The KMO values for green process innovation, green management innovation, and environmental performance were 0.845, 0.909, and 0.910, respectively, and all Bartlett’s tests were significant at the p < 0.001 level. These results support the three-dimensional structure of green performance. The specific results are shown in Table 8 and Table 9.

5.3. Confirmatory Factor Analysis and Measurement Model Assessment

Confirmatory factor analysis is presented in Table 10. The model fit indices showed good performance: χ2/df = 1.970, RMSEA = 0.051, GFI = 0.949, AGFI = 0.927, CFI = 0.965, IFI = 0.966, and TLI = 0.957. These values indicate that the overall fit of the measurement model was satisfactory. This result confirms that the dimensional classification and indicator selection were empirically distinguishable.
Convergent validity was assessed using standardized factor loadings, squared multiple correlations, composite reliability, and average variance extracted. As shown in Table 11, the minimum standardized factor loading among the constructs was 0.649, and all composite reliability values exceeded 0.800. The AVE values ranged from 0.473 to 0.524. Although some AVE values were slightly below the recommended threshold of 0.500, the relatively high standardized factor loadings and composite reliability values indicate that the constructs still had acceptable convergent validity.

5.4. Correlation Analysis

As shown in Table 12, all correlation coefficients were positive and statistically significant at the 0.01 level. Command-and-control environmental regulation was significantly and positively correlated with green process innovation (r = 0.635), green management innovation (r = 0.607), and environmental performance (r = 0.570). Market-incentive environmental regulation was also positively correlated with the three dimensions of green performance, with coefficients ranging from 0.608 to 0.636. Public-participation environmental regulation showed the strongest positive correlations with green process innovation (r = 0.801), green management innovation (r = 0.761), and environmental performance (r = 0.714). These results provide preliminary support for the relationships among the variables. However, correlation analysis cannot determine whether each type of regulatory instrument has an independent effect after controlling for the other regulatory tools. Therefore, structural equation modeling was used for the subsequent analysis.

5.5. Structural Equation Modeling and Hypothesis Testing

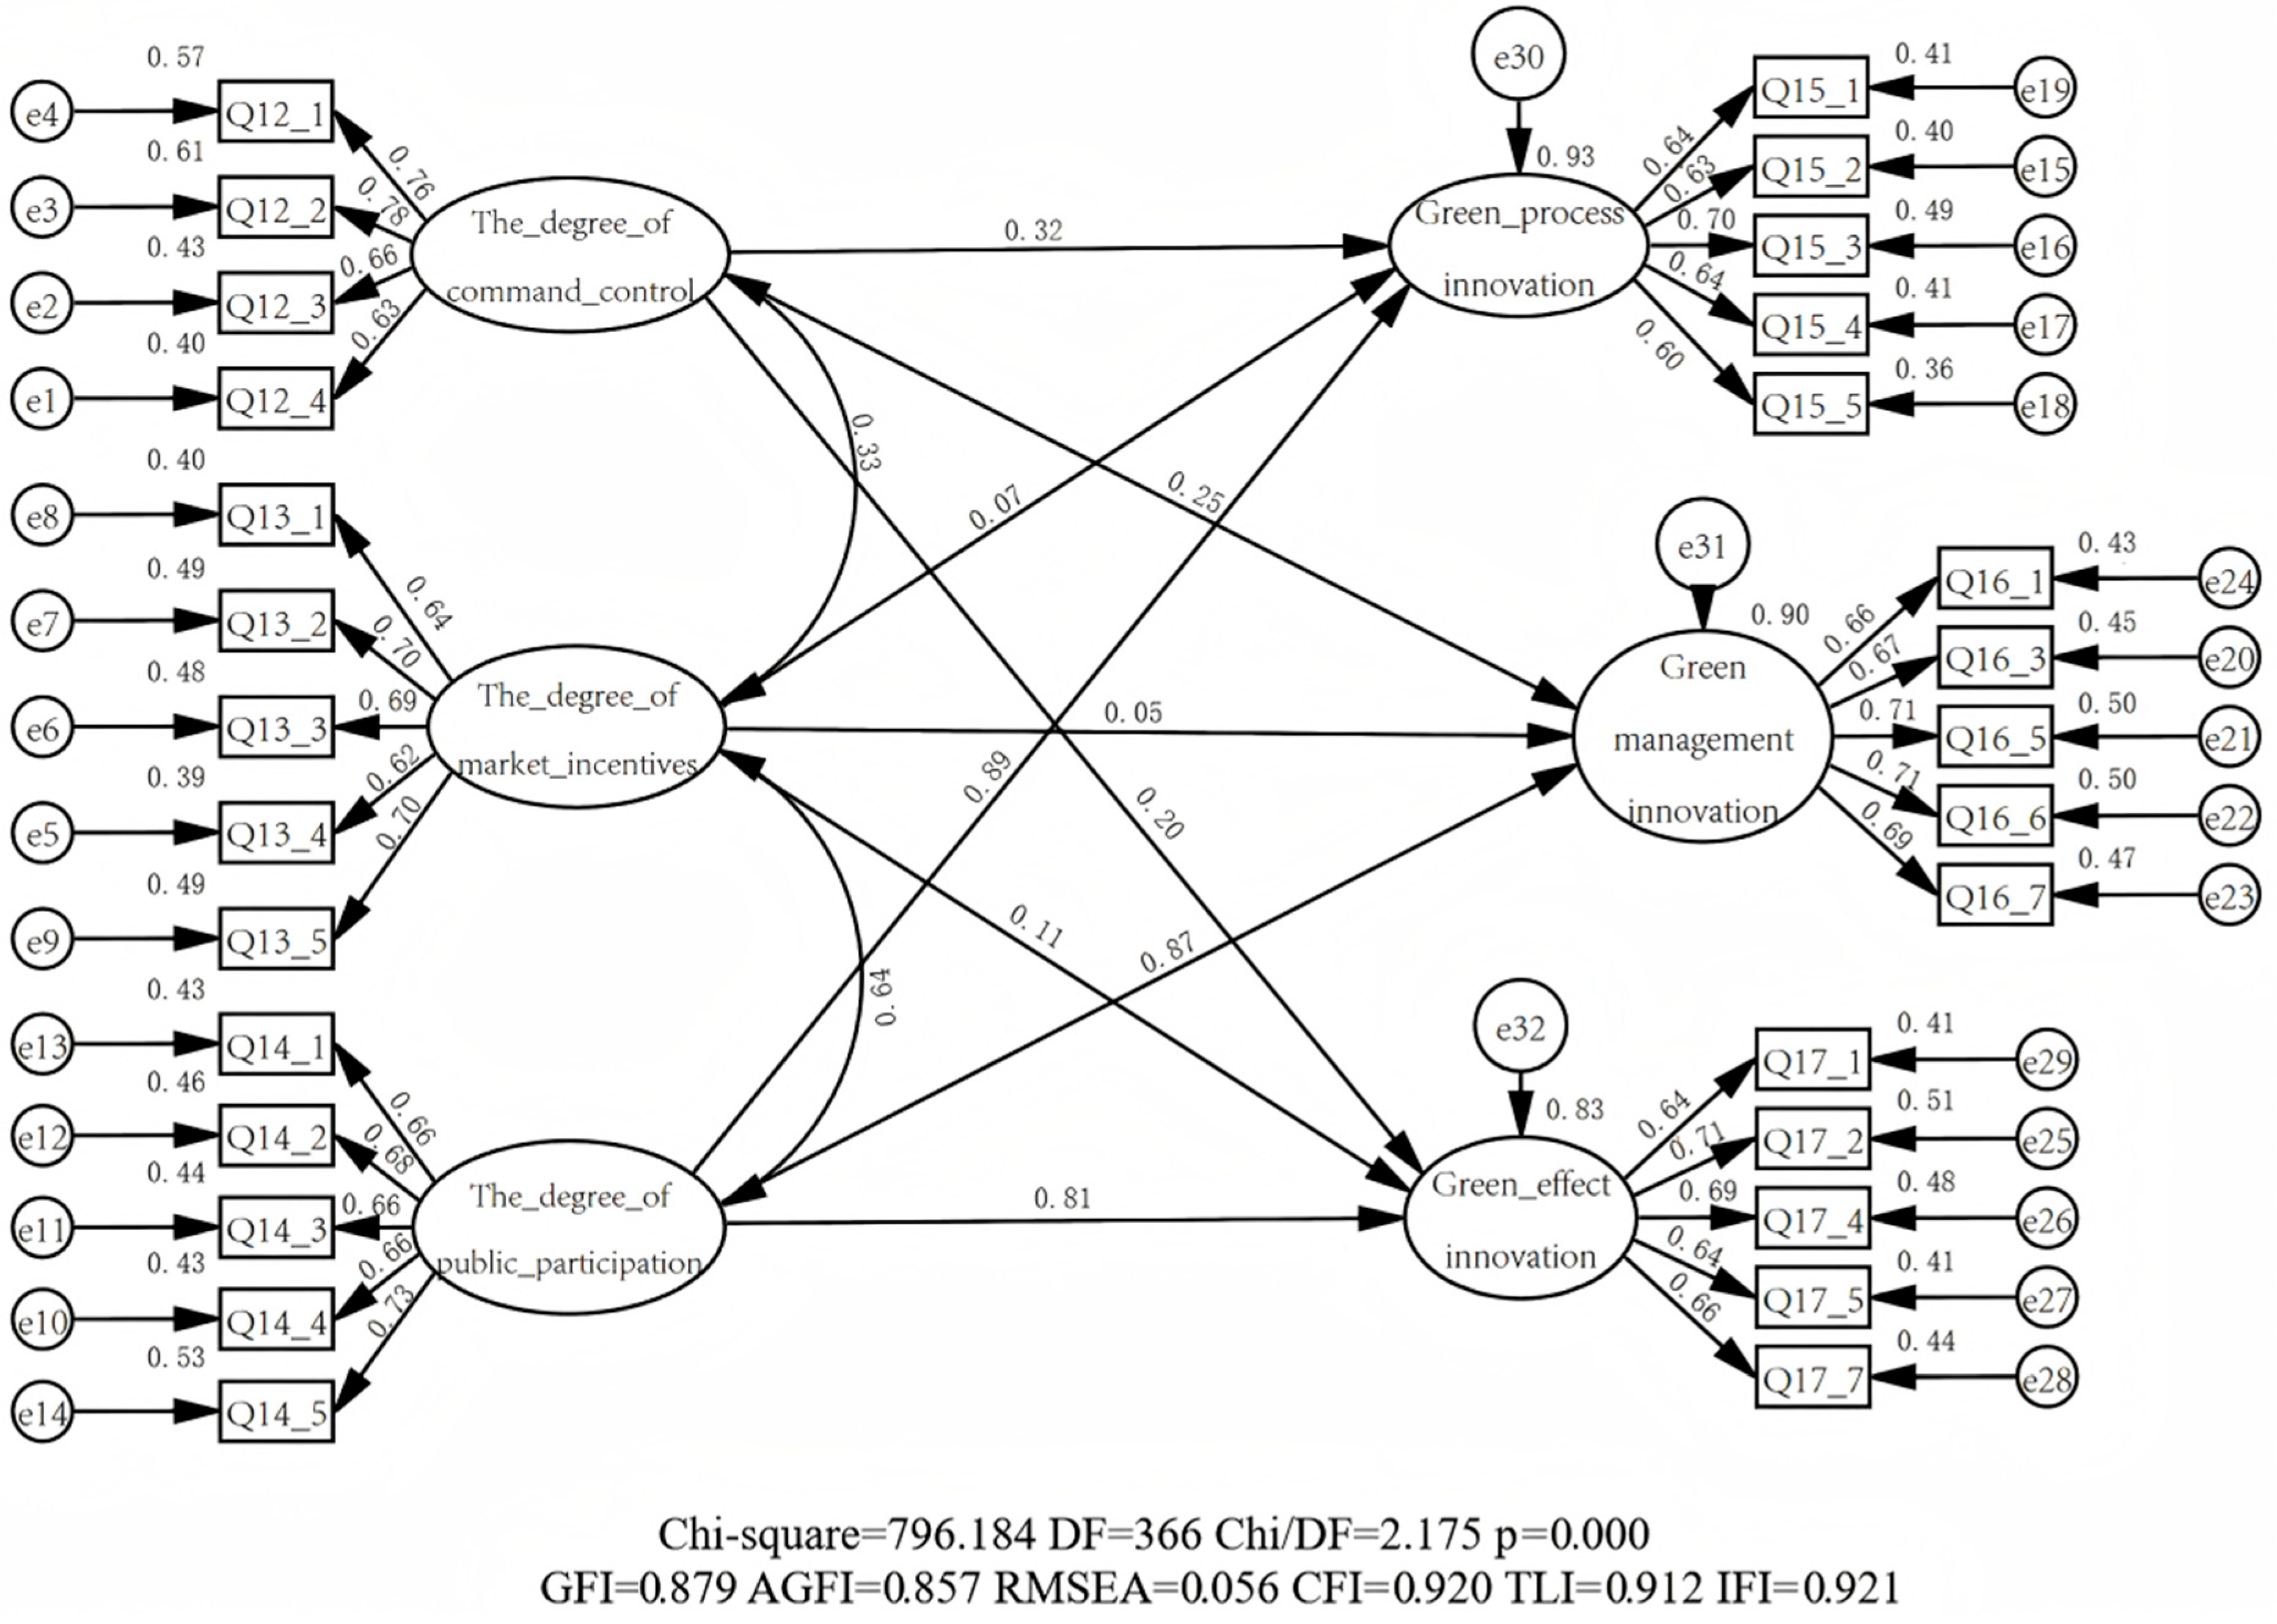
As shown in Table 13, all model fit indices were within an acceptable range: χ2/df = 2.175, RMSEA = 0.056, CFI = 0.920, IFI = 0.921, TLI = 0.912, GFI = 0.879, and AGFI = 0.857. Although GFI and AGFI were slightly below the ideal threshold of 0.900, both exceeded 0.800, while RMSEA and the incremental fit indices met widely accepted standards. Therefore, the structural model was considered suitable for hypothesis testing.
As shown in Table 14 and Figure 1, command-and-control environmental regulation had significant positive effects on green process innovation (β = 0.316, p < 0.001), green management innovation (β = 0.250, p < 0.001), and environmental performance (β = 0.200, p = 0.002), thereby strongly supporting H1. Its effect was most pronounced on green process innovation. This finding is consistent with the operational mechanism of command-and-control regulation in biosafety laboratory construction: mandatory environmental assessment, site approval, technical standards, construction supervision, emission-control requirements, and final acceptance conditions first influence project process and technical choices. Field interviews further indicated that environmental impact assessment, site adjustment, HVAC energy-saving requirements, and final acceptance standards jointly constituted binding constraints during project implementation.
Market-incentive environmental regulation did not significantly affect green process innovation (β = −0.073, p = 0.328), green management innovation (β = 0.055, p = 0.460), or environmental performance (β = 0.108, p = 0.173). Therefore, H2 was not supported. This result does not imply that economic incentive instruments are entirely ineffective; rather, it suggests that existing market-incentive tools failed to form an effective transmission mechanism in biosafety laboratory construction. In practice, biosafety laboratory projects are highly compliance-oriented: project decisions are usually dominated by technical specifications, safety requirements, institutional procurement rules, and regulatory requirements, while subsidies, cleaner production funds, tax incentives, and green credit quotas may not directly benefit design institutes, contractors, or project managers. Interview evidence also showed that the availability of special funds, tax incentives, and green credit support at the project implementation level was very limited.
Public-participation environmental regulation exerted the strongest positive effects on green process innovation (β = 0.888, p < 0.001), green management innovation (β = 0.874, p < 0.001), and environmental performance (β = 0.808, p < 0.001), thereby strongly supporting H3. Field interviews suggested that repeated environmental assessments, expert reviews, user requirements, and subsequent maintenance responsibilities encouraged project participants to adopt safer and more environmentally friendly materials, technologies, and management practices. Therefore, public-participation regulation demonstrated the strongest promoting effect across all three dimensions of green performance.

5.6. Supplementary Regression Analysis of Market-Incentive Regulation

Since market-incentive environmental regulation was not significant in the structural equation model, a supplementary multiple linear regression analysis was further conducted to explore why specific market-incentive instruments failed to produce significant effects. The study selected five retained market-incentive measures as independent variables, including pollution control subsidies, cleaner production funds, environmental governance subsidies, tax incentives, and green credit support. Green process innovation, green management innovation, and environmental performance were used as dependent variables in three separate regression models. The control variables included gender, work experience, industry category, prior organizational experience with biosafety laboratory construction projects, and the respondent’s understanding of biosafety laboratory construction projects. The three supplementary regression models were specified as follows:
y g r e e n   p r o c e s s   i n n o v a t i o n = α 0 + α 1 · x M E 1 + α 2 · x M E 2 + α 3 · x M E 3 + α 4 · x M E 4 + α 5 · x M E 5 + α 6 · x c o n t r o l + ε
y g r e e n   m a n a g e m e n t   i n n o v a t i o n = β 0 + β 1 · x M E 1 + β 2 · x M E 2 + β 3 · x M E 3 + β 4 · x M E 4 + β 5 · x M E 5 + β 6 · x c o n t r o l + ϵ
y e n v i r o n m e n t a l   p e r f o r m a n c e = γ 0 + γ 1 · x M E 1 + γ 2 · x M E 2 + γ 3 · x M E 3 + γ 4 · x M E 4 + γ 5 · x M E 5 + γ 6 · x c o n t r o l + τ
Among these, y g r e e n   p r o c e s s   i n n o v a t i o n , y g r e e n   m a n a g e m e n t   i n n o v a t i o n , and y e n v i r o n m e n t a l   p e r f o r m a n c e are dependent variables; x M E 1 , x M E 2 , x M E 3 , x M E 4 , and x M E 5 are independent variables; α 0 α 5 , β 0 β 5 , and γ 0 γ 5 are regression coefficients; ε , ϵ , and τ are error terms, representing the differences between the dependent and independent variables that cannot be explained by the independent variables in the regression equation; x c o n t r o l is the control variable, representing other variables that significantly influence the dependent variable but are not the primary focus of the study, the inclusion of which aims to eliminate interference from these variables on the research findings.
The VIF values of all regression models were below 2.267, indicating that multicollinearity was not a serious concern. To keep the tables concise, the coefficients of some control variables, including industry category, work experience, and prior organizational experience with biosafety laboratory construction projects, are not reported in Table 15, Table 16 and Table 17. These variables were included in the regression estimation. The detailed results are presented in Table 15, Table 16 and Table 17.
For green process innovation, the adjusted R2 was 0.692 and the model was statistically significant (F = 44.910, p < 0.001). Among the five market-incentive instruments, only pollution control subsidies had a significant positive effect on green process innovation (B = 0.085, β = 0.101, p = 0.007). Cleaner production funds, environmental governance subsidies, tax incentives, and green credit support did not show significant effects. This result indicates that broad or indirect fiscal policies are unlikely to effectively promote process-level green innovation in biosafety laboratory construction. Green process innovation usually needs to be closely linked to project execution, such as the selection of environmentally friendly materials, installation of safe and energy-efficient equipment, improvement of waste treatment systems, and adoption of pollution control facilities.
For green management innovation, the adjusted R2 was 0.633 and the model was statistically significant (F = 34.618, p < 0.001). Pollution control subsidies again showed a significant positive effect (B = 0.094, β = 0.107, p = 0.009), while tax incentives also had a weaker but significant positive effect (B = 0.061, β = 0.084, p = 0.037). The remaining market-incentive instruments did not reach statistical significance. This finding suggests that green management innovation is more sensitive to fiscal incentives. Tax incentives may encourage enterprises to improve internal environmental management systems, monitoring procedures, documentation, and compliance processes.
For environmental performance, the adjusted R2 was 0.579 and the model was statistically significant (F = 27.895, p < 0.001). Only pollution-control subsidies significantly improved environmental performance (B = 0.137, β = 0.165, p < 0.001). The effect of cleaner production funds was weak and insignificant (p = 0.059), while environmental governance subsidies, tax incentives, and green credit support showed no significant effects. This result indicates that the final environmental outcomes of biosafety laboratory construction depend largely on the strength of support for pollution control. Other market-based instruments did not directly act on key technical systems in biosafety laboratories, such as wastewater disinfection, exhaust gas purification, waste separation, ventilation systems, pressure gradient control, and energy-saving operation. Therefore, their overall effects were limited.

6. Discussion

This study examined how different types of environmental regulation affect green performance in biosafety laboratory construction projects. The empirical results show a clear pattern. Command-and-control regulation and public-participation regulation significantly improved green process innovation, green management innovation, and environmental performance. However, market-incentive regulation did not show a significant overall effect in the SEM results. These findings suggest that environmental regulation does not affect green performance through one single mechanism. Instead, the effect of each regulatory tool depends on whether it can be translated into project-level technical requirements, management procedures, stakeholder responsibilities, and final acceptance standards.

6.1. Interpretation of the Main Findings

6.1.1. Findings on Command-and-Control Regulation and Green Performance

The significant positive effect of command-and-control regulation shows that mandatory regulation is still an important governance tool in high-risk and technically complex construction projects. In biosafety laboratory construction projects, environmental regulation is closely linked to environmental impact assessment, site selection, ventilation systems, pressure gradient control, wastewater disinfection, waste treatment, construction supervision, and final acceptance. These requirements are not only general environmental principles; they are binding conditions that affect whether a project can be approved, built, accepted, and put into use. Therefore, command-and-control regulation improves green performance by setting minimum compliance standards. It also requires project participants to include environmental and biosafety requirements in design and construction decisions. Its effect is especially important for green process innovation, because mandatory standards directly affect the choice of materials, equipment, construction methods, waste treatment systems, and pollution control facilities. The results also show that command-and-control regulation significantly promotes green management innovation and environmental performance. Mandatory regulation changes not only technical processes but also project management practices. To meet environmental and biosafety standards, project participants must improve documentation, internal supervision, environmental monitoring, subcontractor coordination, and acceptance preparation. In this sense, command-and-control regulation is both a compliance mechanism and a project coordination mechanism. It defines the safety boundaries that designers, contractors, supervisors, and users must follow.

6.1.2. Findings on Market-Incentive Regulation and Green Performance

The insignificant effect of market-incentive regulation is one of the key findings of this study. This result shows that current market-based tools have not yet formed a strong and stable project-level transmission mechanism in biosafety laboratory construction. Fiscal incentives such as cleaner production funds, environmental governance subsidies, tax incentives, and green credit exist at the policy level, but may not fully reach contractors, design units, or project managers. Furthermore, many project decisions in biosafety laboratory construction are mainly shaped by technical standards, client requirements, procurement rules, safety codes, and final acceptance conditions. In this context, economic incentives may be too indirect. They may not be strong enough to change actual construction behavior.
The supplementary regression analysis gives a more detailed explanation for this result. Although market-incentive regulation was not significant as a whole in the SEM, pollution control subsidies consistently promoted green process innovation, green management innovation, and environmental performance in the regression analysis. This means that market-based incentives are not naturally ineffective. Their effect depends on whether they are direct, project-related, and linked to measurable environmental benefits. In biosafety laboratory construction, green improvement often requires extra investment in high-efficiency air filtration systems, wastewater disinfection systems, energy-saving HVAC systems, sealed building materials, environmental monitoring systems, and waste treatment facilities. If financial support is directly linked to these technical systems, it can reduce the cost burden of green improvement. However, if the incentives are too broad, too indirect, or only targeted at the enterprise level rather than the project level, their effect on real construction decisions will be limited. The interview results also support this finding. Project participants were more familiar with pollution control subsidies, but they knew little about other market-based tools.

6.1.3. Findings on Public-Participation Regulation and Green Performance

Public-participation regulation had the strongest positive effect on all three dimensions of green performance. It should be stressed that public participation should not only be seen as general social pressure or community protest. In this study, it includes environmental information disclosure, participation in environmental assessment, expert review, stakeholder consultation, environmental certification, user-side requirements, voluntary environmental commitments, and the active use of green technologies. These activities involve regulators, laboratory users, designers, contractors, supervisors, technical experts, and sometimes public representatives.
As shown in Table 18, the strong effect of public-participation regulation comes from its ability to bring green requirements into project decisions and construction work. Expert review and environmental assessment can identify environmental and biosafety risks at the design stage. User-side requirements can encourage contractors to use safer, more durable, and easier-to-maintain materials and systems. Environmental certification and information disclosure can create pressure from reputation and accountability. Voluntary commitments and stakeholder consultation can also push firms to go beyond minimum compliance requirements. The field interviews support this result. Expert demonstration meetings, environmental impact assessment procedures, user requirements, and later maintenance responsibilities often affect material selection, process design, and environmental management practices in biosafety laboratory construction. This helps to explain why public-participation regulation had the strongest effect among the three types of regulation in this study.

6.2. Contextual Mechanisms

To better understand the different effects of these three regulatory tools, it is necessary to consider the specific background of biosafety laboratory construction projects. These projects are different from ordinary construction projects because they combine engineering construction, environmental protection, biosafety control, laboratory operation, public health prevention, and strict regulatory compliance. During project construction, they must not only meet common goals such as quality, cost, schedule, and safety, but also meet many special requirements. These include hazardous substance control, stable airflow organization, pressure gradient maintenance, wastewater disinfection, exhaust gas filtration, hazardous waste disposal, and laboratory personnel protection. Therefore, in this context, “green performance” is not limited to energy-saving and emission reduction, but also includes environmental benefits and health risk prevention related to biosafety.
Command-and-control regulation is effective because it directly targets these technical and safety requirements. In biosafety laboratory construction, mandatory environmental and biosafety standards define the minimum acceptable conditions for project implementation. Once these requirements are included in project approval and final acceptance procedures, project participants must translate them into specific design and construction measures. Its main function is to prevent non-compliance. However, command-and-control regulation also has its own limits. This type of regulation is effective in setting minimum standards, but it may not be enough to encourage participants to actively seek improvement beyond compliance. In many cases, project participants are more likely to meet regulatory requirements than to actively look for better green solutions.
The effect of market-incentive regulation is relatively weak because many incentive tools are not fully embedded in project decision-making processes. Biosafety laboratory construction projects are usually one-off or customized projects rather than continuous production activities. The main decision-makers may include project owners, designers, contractors, supervisors, regulators, equipment suppliers, and users. In many cases, market-based measures at the enterprise level cannot be directly linked to specific project investment decisions, so they fail to produce the most direct effect. In addition, some green technologies and equipment used in biosafety laboratories are already compliance requirements. Their adoption is determined by mandatory standards rather than financial incentives. Therefore, market incentives may have limited additional influence when the required technologies must be installed regardless of subsidies, tax benefits, or green credit support. This helps explain why market-incentive regulation showed a weaker effect on green performance in this study.
Public-participation regulation plays the most important role because it closely connects technical expertise, user requirements, regulatory demands, and life-cycle responsibility. Biosafety laboratories are highly specialized facilities, and many environmental risks can only be identified by professionals with relevant technical knowledge. Expert review can judge whether the ventilation system design, pressure gradient setting, wastewater treatment plan, and waste storage scheme are reasonable. Laboratory users can provide feedback on operational safety, disinfection convenience, maintenance needs, and personnel protection measures. Regulatory agencies can assess whether construction practices comply with standards. Contractors and maintenance service providers can evaluate material durability, equipment reliability, and long-term operating costs. Through these interaction mechanisms, public-participation regulation transforms green performance from an external requirement into a shared project responsibility among different actors. It not only improves decision quality at the design and construction stages, but also strengthens accountability during later operation and maintenance. This explains why public-participation regulation has the strongest effect on green performance in biosafety laboratory construction projects.

6.3. Comparison with Previous Studies

The findings of this study are partly in line with previous studies on environmental regulation and green innovation. Command-and-control regulation had a positive effect on green process innovation, green management innovation, and environmental performance. This supports earlier research showing that mandatory environmental regulation can encourage green innovation and improve environmental outcomes through compliance pressure [4,5]. In biosafety laboratory construction projects, this effect seems to work mainly through environmental assessment, technical standards, construction supervision, and final acceptance requirements, rather than through normal market competition.
The overall effect of market-incentive regulation was not significant, which is different from some studies that found positive effects of subsidies, green credit, carbon trading, or emission trading on green innovation [22,23]. One possible reason is the special nature of BSL projects. Many decisions in these projects are affected by biosafety standards, public budgets, procurement rules, and acceptance procedures. Because of this, general market-based incentives may not directly influence green decisions at the project level.
Public-participation regulation showed a strong positive effect, which is consistent with studies on stakeholder pressure, information disclosure, and external accountability [26,43]. In this study, public participation is not limited to public supervision; it also includes expert review, participation in environmental assessment, user requirements, environmental certification, and voluntary adoption of green technologies. This result suggests that structured stakeholder participation may play an important role in improving green performance in high-risk and highly specialized infrastructure projects.

7. Conclusions

7.1. Main Findings and Contributions

According to the questionnaire data of 372 respondents and empirical testing based on Structural Equation Modeling (SEM), this research presents empirical evidence about the impacts of various regulatory measures on green performance in a special and high-risk construction industry. The results demonstrate distinct differences among the three regulatory methods. The command-and-control regulation has a significant positive effect on green process innovation, green management innovation and environmental performance, with standard coefficients of 0.316, 0.250 and 0.200, respectively. The public-participation regulation shows the greatest influence on the above three aspects, with coefficients of 0.888, 0.874 and 0.808, respectively. On the contrary, the market-incentive regulation does not have significant direct impacts. Additional regression results also indicate that only the pollution control subsidies have stable positive effects on the three dimensions of green performance, while most other market-incentive instruments are not consistently significant. These results suggest that the green governance in the construction of biosafety laboratories should not depend on a single regulatory strategy. Strict standards provide the basis for compliance, specific incentives can be effective when related to the environmental outcomes at the project level and structured public participation can reinforce the technical review, stakeholder coordination, reputational pressure and life-cycle accountability.

7.2. Theoretical Implications

This research puts forward three theoretical viewpoints. Firstly, it expands the literature on environmental regulation and green performance from ordinary industries and manufacturing sectors to the construction of biosafety laboratories, which is a special project with environmental, biosafety and public health risks. This extension indicates that the impact of environmental regulation is influenced not only by the kind of regulatory means but also by the institutional and technical features of the project background. Secondly, this study improves the definition of green performance in biosafety laboratory construction by combining green process innovation, green management innovation and environmental performance. This multi-dimensional system is more suitable for evaluating the sustainability demands of high-risk construction projects than the currently used single indicators which mainly concentrate on energy saving, pollutant elimination, waste decreasing or cost saving. Finally, this research finds a boundary condition for market-oriented regulation. The weak direct results of market-oriented regulation imply that market mechanisms may not function well in complex and strictly controlled project conditions unless they are considered in the investment decisions, technical standards, stakeholder roles and lifecycle performance assessment of the project.

7.3. Practical Implications

For government regulators, command-and-control regulation is the basic method for the construction of biosafety laboratories. Since these projects have impacts on the environment, biosafety and public health, regulations should provide clear and implementable rules for the approval, technical design, construction supervision, pollution prevention, waste management and the final acceptance. These rules should be introduced in the planning and design stages instead of being adjusted after construction problems appear. Market-oriented policies need to be revised to be more focused and project-oriented. The research shows that general economic incentives cannot automatically enhance green performance. Thus, subsidies, green credits, tax preferences and purchasing incentives should be associated with specific green technologies, pollution-reducing investments and measurable life-cycle environmental effects. In this way, market incentives can transform from broad policy indications to effective governing instruments at the project level. Public involvement regulation should also be institutionalized further. Regulations can invite environmental engineers, biosafety specialists, facility managers, users, supervisors and contractors for the technical examination, construction inspection and acceptance assessment. This kind of structured involvement can improve the feasibility of green and biosafety measures and increase responsibility throughout the life cycle. For the construction companies and project leaders, environmental regulations should not be regarded as a mere burden for compliance. Companies should incorporate the green performance requirements into the design cooperation, purchase arrangement, construction planning, subcontractor management, quality control and acceptance preparation. Digital tools like BIM-based coordination platforms can be utilized to observe energy consumption, material selection, waste production and important environmental indicators. This will help the companies to establish a green management system based on early coordination, technical integration and stakeholder cooperation.

7.4. Limitations and Future Research

The data were collected through a cross-sectional questionnaire survey, which cannot fully reflect dynamic causal relationships that change over time. The measurement of variables was mainly based on respondents’ subjective perceptions. Perceptual evaluation indicators may still differ from objective project outcomes. Biosafety laboratory construction projects include multiple stages, such as planning, design, approval, construction, acceptance, and operation. The impacts of environmental regulation may vary across these stages. Future research could combine survey data with objective indicators and adopt a longitudinal research design to examine the specific effects of different regulatory tools on green performance throughout the entire project life cycle.


Author Contributions

Conceptualization, L.R.; methodology, L.R.; software, L.R. and Z.W.; validation, Z.W.; formal analysis, L.R.; investigation, L.R.; resources, L.R.; data curation, L.R.; writing—original draft preparation, L.R.; writing—review and editing, Z.W.; visualization, L.R.; supervision, Z.W.; project administration, L.R.; funding acquisition, L.R. All authors have read and agreed to the published version of the manuscript.

Funding

This research was funded by the Yunnan Fundamental Research Projects (grant number 202301AU070089). The APC was funded by the Yunnan Fundamental Research Projects.

Institutional Review Board Statement

Ethical review and approval were waived for this study in accordance with the Chapter 3, Article 32 of the Measures for Ethical Review of Life Sciences and Medical Research Involving Humans, as the study was based solely on an anonymous and voluntary questionnaire survey involving adult participants and did not include minors, medical intervention, human biological samples, or sensitive personal data.

Informed Consent Statement

All participants were informed of the research purpose before completing the questionnaire and participated voluntarily. Implied informed consent was obtained from all respondents, and all survey data were processed anonymously.

Data Availability Statement

Data will be made available on reasonable request.

Acknowledgments

The authors would like to thank the editors and anonymous reviewers for their valuable comments and constructive suggestions, which have greatly improved the quality of this manuscript.

Conflicts of Interest

The authors declare no conflicts of interest. The funders had no role in the design of the study; in the collection, analyses, or interpretation of data; in the writing of the manuscript; or in the decision to publish the results.

References

  1. Zhang, W.; Zhu, B.; Li, Y.; Yan, D. Revisiting the Porter Hypothesis: A Multi-Country Meta-Analysis of the Relationship between Environmental Regulation and Green Innovation. Humanit. Soc. Sci. Commun. 2024, 11, 232. [Google Scholar] [CrossRef]
  2. Ramanathan, R.; He, Q.; Black, A.; Ghobadian, A.; Gallear, D. Environmental Regulations, Innovation and Firm Performance: A Revisit of the Porter Hypothesis. J. Clean. Prod. 2017, 155, 79–92. [Google Scholar] [CrossRef]
  3. Liu, J.; Zhao, M.; Zhang, C.; Ren, F. Analysis of the Influence of Heterogeneous Environmental Regulation on Green Technology Innovation. Sustainability 2023, 15, 3649. [Google Scholar] [CrossRef]
  4. Wang, M.; He, Y.; Zhou, J.; Ren, K. Evaluating the Effect of Chinese Environmental Regulation on Corporate Sustainability Performance: The Mediating Role of Green Technology Innovation. Int. J. Environ. Res. Public Health 2022, 19, 6882. [Google Scholar] [CrossRef]
  5. Tang, K.; Qiu, Y.; Zhou, D. Does Command-and-Control Regulation Promote Green Innovation Performance? Evidence from China’s Industrial Enterprises. Sci. Total Environ. 2020, 712, 136362. [Google Scholar] [CrossRef]
  6. Gayer, T.; Horowitz, J.K. Market-Based Approaches to Environmental Regulation; Now Publishers Inc.: Hanover, MA, USA, 2006. [Google Scholar]
  7. Zhou, J.; Yang, H.; Liu, Z. Market-Based Environmental Regulation and Green Transformation of Manufacturing Enterprises: Evidence from China’s SO2 Emission Trading. Sustainability 2025, 17, 10322. [Google Scholar] [CrossRef]
  8. Yu, W.; Ramanathan, R. An Empirical Examination of Stakeholder Pressures, Green Operations Practices and Environmental Performance. Int. J. Prod. Res. 2015, 53, 6390–6407. [Google Scholar] [CrossRef]
  9. Xie, J.; Abbass, K.; Li, D. Advancing Eco-Excellence: Integrating Stakeholders’ Pressures, Environmental Awareness, and Ethics for Green Innovation and Performance. J. Environ. Manag. 2024, 352, 120027. [Google Scholar] [CrossRef]
  10. Du, M.; Antunes, J.; Wanke, P.; Chen, Z. Ecological Efficiency Assessment under the Construction of Low-Carbon City: A Perspective of Green Technology Innovation. J. Environ. Plan. Manag. 2022, 65, 1727–1752. [Google Scholar] [CrossRef]
  11. Wang, C.; Lu, Y.; Dai, Y.; Wu, H.; Ma, Z. In-Situ 4D CT Analysis of Microcrack Evolution in Carbonated Fiber-Reinforced Recycled Aggregate Concrete. Cem. Concr. Compos. 2025, 163, 106161. [Google Scholar] [CrossRef]
  12. Yılmaz, M.; Bağış, M.; Saygılı, M.; Dhar, B.K. The Impact of Environmental Regulation, Green Innovation Capabilities and Sustainable Marketing Activities on Strategic Performance. Bus. Process Manag. J. 2026, 32, 1113–1139. [Google Scholar] [CrossRef]
  13. Ma, Z.; Wu, Y.; Fang, K.; Zhang, Y.; Wang, C. Developing Fully Recycled Alkali-Activated Mortar Made with Waste Concrete Fines as a Substitute for Both Binder and Sand: Multi-Properties Evaluation. Constr. Build. Mater. 2025, 477, 141323. [Google Scholar] [CrossRef]
  14. Zou, R.; Zhang, W.; Guo, J.; Zeng, X.; Yang, K.; Li, Z.; Wang, X. Energy Efficiency Analysis and Life Cycle Assessment of a Biosafety Level 4 Laboratory. Energy Build. 2025, 345, 116096. [Google Scholar] [CrossRef]
  15. Nwobi, N.L.; Anetor, G.O.; Nwobi, J.C.; Igharo, G.O.; Adeyemi, A.V.; Badrick, T.; Anetor, J.I. Waste Management and Environmental Health Impact: Sustainable Laboratory Medicine as Mitigating Response. Clin. Biochem. 2025, 139, 110985. [Google Scholar] [CrossRef]
  16. Altıntaş, F.; Koluman, A. Enhancing Biosafety and Biosecurity: Quality Management in High-Containment Laboratories. Etlik Vet. Mikrobiyol. Derg. 2024, 35, 105–112. [Google Scholar] [CrossRef]
  17. Wang, R.; Lu, Y.; Cao, G.; Chen, X.; Li, Y.; Liu, J.; Rong, G. Research on Energy-Saving Measures for High-Level Biosafety Laboratories Based on Energy Consumption Simulation. Int. J. Low-Carbon Technol. 2025, 20, 755–761. [Google Scholar] [CrossRef]
  18. Hwang, J.H.; Bum, D.; Hong, J.K. A Study on the Energy Improvement Plan of Using Passive Design with Exterior Envelopes and Renewable Energy for Bio Safety Labotratory. Korean J. Air-Cond. Refrig. Eng. 2014, 26, 491–496. [Google Scholar]
  19. Alpdemir, M.; Yurt, E.F.; Şeneş, M. Forward Steps in Green Medical Laboratory Practices for a Sustainable Future. Turk. J. Biochem. 2024, 49, 20–23. [Google Scholar] [CrossRef]
  20. Song, W.; Han, X.; Liu, Q. Patterns of Environmental Regulation and Green Innovation in China. Struct. Change Econ. Dyn. 2024, 71, 176–192. [Google Scholar] [CrossRef]
  21. Min, W. An Empirical Study on the Impact of Environmental Regulation on the Efficiency of Green Technology Innovation. E3S Web Conf. 2021, 248, 02029. [Google Scholar] [CrossRef]
  22. Jiang, Z.; Xu, C.; Zhou, J. Government Environmental Protection Subsidies, Environmental Tax Collection, and Green Innovation: Evidence from Listed Enterprises in China. Environ. Sci. Pollut. Res. 2022, 30, 4627–4641. [Google Scholar] [CrossRef]
  23. Ma, Y.; Sha, Y.; Wang, Z.; Zhang, W. The Effect of the Policy Mix of Green Credit and Government Subsidy on Environmental Innovation. Energy Econ. 2023, 118, 106512. [Google Scholar] [CrossRef]
  24. Luo, S.; Cai, X.; Qian, Q.; Xia, H. How Can Market-Based Environmental Regulation Drive Industrial Transformation Upgrading? Evidence from China’s Carbon Emissions Trading Pilot Policies. Int. Rev. Econ. Financ. 2025, 102, 104300. [Google Scholar]
  25. Zarzycka, E.; Krasodomska, J. Environmental Key Performance Indicators: The Role of Regulations and Stakeholder Influence. Environ. Syst. Decis. 2021, 41, 651–666. [Google Scholar] [CrossRef]
  26. Yang, Y.; Yang, F.; Zhao, X. The Impact of the Quality of Environmental Information Disclosure on Financial Performance: The Moderating Effect of Internal and External Stakeholders. Environ. Sci. Pollut. Res. 2022, 29, 68796–68814. [Google Scholar] [CrossRef]
  27. Xue, L.; Dong, X. Effectiveness Research on Public Participation in Environmental Governance Based on PSA Three-Tier Model. China Popul. Resour. Environ. 2010, 20, 48–54. [Google Scholar]
  28. Dahan, S.M.; Yusof, S.R.M.; Taib, M.Y. Performance Measure of Eco-Process Innovation: Insights from a Literature Review. MATEC Web Conf. 2017, 131, 04007. [Google Scholar] [CrossRef][Green Version]
  29. Jovičić, S.; Milinković, N. Strategies for Energy Conservation and Sustainability in Medical Laboratories. Crit. Rev. Clin. Lab. Sci. 2025, 62, 585–603. [Google Scholar] [CrossRef]
  30. Lanoie, P.; Laurent-Lucchetti, J.; Johnstone, N.; Ambec, S. Environmental Policy, Innovation and Performance: New Insights on the Porter Hypothesis. J. Econ. Manag. Strategy 2011, 20, 803–842. [Google Scholar] [CrossRef]
  31. Van Leeuwen, G.; Mohnen, P. Revisiting the Porter Hypothesis: An Empirical Analysis of Green Innovation for The Netherlands. Econ. Innov. New Technol. 2017, 26, 63–77. [Google Scholar] [CrossRef]
  32. Rubashkina, Y.; Galeotti, M.; Verdolini, E. Environmental Regulation and Competitiveness: Empirical Evidence on the Porter Hypothesis from European Manufacturing Sectors. Energy Policy 2015, 83, 288–300. [Google Scholar] [CrossRef]
  33. Cerda, A.; Emery, R.; Patlovich, S. Sustainability Considerations for Consumables Used in Microbiological and Biomedical Laboratories. Appl. Biosaf. 2022, 28, 55–60. [Google Scholar] [CrossRef]
  34. Wang, Y.; Cao, S.; Shah, M.H. The Impact of Carbon Information Disclosure on Firm Value: The Mediating Role of Green M&A—Evidence from China. Sustainability 2026, 18, 2225. [Google Scholar]
  35. Wei, Z. Environmental Regulation, Green Technology Innovation and Environmental Performance: An Empirical Study Based on Microdata of Heavy Polluting Enterprises. E3S Web Conf. 2024, 573, 03017. [Google Scholar] [CrossRef]
  36. Zhang, T.; Zhou, J.Y.; Hussain, R.Y.; Wang, M.; Ren, K. Research on the Cultivation of Green Competitiveness among Chinese Heavily Polluting Enterprises under Country/District Environmental Regulations. Front. Environ. Sci. 2022, 10, 955744. [Google Scholar] [CrossRef]
  37. Hong, J.K.; Park, H.J. An Analytical Study on the Prediction of Indoor Air Quality and the Reduction of Air Conditioning Load in Bio Safety Level 3 Laboratory. Korean J. Air-Cond. Refrig. Eng. 2012, 24, 813–822. [Google Scholar][Green Version]
  38. Liu, T.; Wang, L. Green-Process vs. Green-Product Innovation: The Diverse Impact of the Carbon Emission Trading System. Appl. Econ. 2025, 58, 3657–3672. [Google Scholar] [CrossRef]
  39. Li, J.; Wang, Y. How Environmental Taxation Drives Corporate Green Investment: Evidence from Innovation, Financing, and Heterogeneous Impacts of Pollution Intensity. Sustainability 2026, 18, 4733. [Google Scholar] [CrossRef]
  40. Zhou, Y.; Zhang, Z. Evaluating the Effectiveness of Green Credit Policy on Firm Transformation in China. Appl. Econ. Lett. 2025, 1–5. [Google Scholar] [CrossRef]
  41. Qu, F.; Xu, L.; Chen, Y. Can Market-Based Environmental Regulation Promote Green Technology Innovation? Evidence from China. Front. Environ. Sci. 2022, 9, 823536. [Google Scholar] [CrossRef]
  42. Fang, Y.; Shao, Z. Whether Green Finance Can Effectively Moderate the Green Technology Innovation Effect of Heterogeneous Environmental Regulation. Int. J. Environ. Res. Public Health 2022, 19, 3646. [Google Scholar] [CrossRef] [PubMed]
  43. Chowdhury, M.A.A.; Rahman, M.M.; Dey, M.; Moudud-Ul-Huq, S.; Hossain, S.A. Perceived Pressures and Motivations for Environmental Disclosures: Role of Certification. Sage Open 2023, 13, 21582440231215570. [Google Scholar] [CrossRef]
  44. Yang, Z.; Zha, X. How Do Environmental Regulation and Media Pressure Influence Greenwashing Behaviors in Chinese Manufacturing Enterprises? Sustainability 2025, 17, 5066. [Google Scholar] [CrossRef]
Figure 1. Structural equation model diagram. Note. Rectangles denote observed indicators, ellipses denote latent variables, and small circles denote measurement errors or residual terms. Single-headed arrows represent directional relationships, including factor loadings and structural paths, whereas curved double-headed arrows represent correlations between latent variables. The values shown on the arrows are standardized estimates, and the model fit indices are presented below the path diagram.
Sustainability 18 05409 g001
Table 1. Measurement items for environmental regulation.
ConstructCodeMeasurement Item
Command-and-control regulationCE1Environmental laws and regulations in this field are relatively complete.
CE2Environmental regulatory policies and systems in this field are relatively complete.
CE3Environmental regulatory authorities in this field have strong independence and authority.
CE4Emission-reduction standards, pollution-control technical standards, and production technical standards are relatively strict.
CE5Violations of environmental regulatory standards are subject to strict penalties.
Market-incentive regulationME1Pollution control subsidies have stimulated the innovation enthusiasm of the project or the enterprise.
ME2The project or enterprise has received special government funds for supporting clean production technologies.
ME3The project or enterprise can obtain government subsidies for environmental pollution treatment.
ME4The project or enterprise can obtain tax incentives for environmental governance.
ME5The project or enterprise can obtain green credit support for environmental governance.
Public-participation regulationPE1The project or enterprise discloses environmental information to the public in a timely and accurate manner, such as environmental assessment reports.
PE2The project or enterprise has obtained or is actively obtaining relevant environmental certification or ecological labels.
PE3The project or enterprise holds environmental demonstration meetings, hearings, or other forms of consultation to collect opinions from relevant organizations, experts, and the public on environmental impact assessment reports.
PE4The project or enterprise commits to environmental management agencies that it will voluntarily implement environmental protection measures beyond regulatory requirements.
PE5The project or enterprise voluntarily adopts green and environmentally friendly technologies.
Table 2. Measurement items for green performance.
ConstructCodeMeasurement Item
Green process innovationGP1Environmentally friendly materials and equipment are selected during project construction.
GP2The project emphasizes the reuse, recycling, and decomposition of materials during construction.
GP3The equipment used during construction adopts environmentally friendly designs to improve energy efficiency.
GP4The equipment and facilities used during construction can prevent harmful substances from entering the natural environment.
GP5The equipment and facilities used during construction can ensure the personal safety of users.
Green management innovationGM1The construction process is redesigned and improved to meet environmental efficiency requirements.
GM2Project members are encouraged and motivated to adopt responsible attitudes to avoid waste.
GM3Environmental safety monitoring systems are used during project construction.
GM4Project managers are highly committed to following environmentally friendly policies.
GM5Project plans are regularly reviewed and redesigned to ensure compliance with environmental standards.
GM6The project team is willing to adopt new or improved green management systems in policies and implementation.
GM7The project manager can ensure that the construction process complies with environmental policies and regulations.
Environmental performanceEP1The final deliverables of the project significantly improve the safety level of the biosafety laboratory.
EP2The final deliverables of the project significantly improve the operating efficiency of the laboratory.
EP3The final deliverables of the project significantly improve the health protection of laboratory personnel.
EP4The project significantly reduces the generation of solid waste and the discharge of polluted waste.
EP5The project significantly reduces environmental accidents and health hazards.
EP6The project significantly reduces raw material costs.
EP7The project significantly reduces energy consumption costs.
Table 3. Summary of questionnaire distribution and valid responses.
Survey MethodDistributed QuestionnairesReturned QuestionnairesResponse RateValid QuestionnairesEffective Response Rate
Online survey40035288.0%30776.75%
Offline survey1006868.0%6565.0%
Total50042084.0%37274.4%
Table 4. Demographic characteristics of respondents.
ItemCategoryFrequencyRelative Frequency
Education levelHigh school or technical secondary school and below174.57%
Junior college5815.59%
Bachelor’s degree17446.77%
Postgraduate degree and above12333.06%
Work experience3 years or less22761.0%
4–6 years5013.4%
7–10 years328.6%
More than 10 years6316.9%
Firm size1–50 employees9625.8%
50–100 employees11731.5%
100–500 employees8923.9%
More than 500 employees7018.8%
Job positionTechnical personnel11330.4%
Project manager205.4%
Grassroots manager7419.9%
Middle manager4712.6%
Senior manager9726.1%
General employee215.6%
Table 5. Enterprise characteristics.
ItemCategoryFrequencyRelative Frequency
Industry categoryBioengineering, medicine, medical equipment/instruments12032.3%
Agriculture, forestry, animal husbandry, and fishery174.6%
Mining82.2%
Manufacturing308.1%
Energy supply246.5%
Construction5815.6%
Transportation and logistics174.6%
Accommodation and catering195.1%
Government, non-profit institutions, and research institutions4612.4%
Others338.9%
Total assetsCNY 2 million or less7921.2%
CNY 2–5 million9625.8%
CNY 5–10 million8021.5%
More than CNY 10 million11731.5%
Geographical locationEastern China18950.8%
Central China10428.0%
Western China7419.9%
Hong Kong, Macao, and Taiwan30.8%
Countries other than China20.5%
Table 6. Respondents’ relevance to biosafety laboratory construction projects.
ItemCategoryFrequencyRelative Frequency
Whether the enterprise has undertaken biosafety laboratory construction projectsYes18549.7%
No18750.3%
Number of times participating in biosafety laboratory construction projectsNo participation19552.4%
1–3 times12333.1%
4–6 times4211.3%
7–10 times71.9%
More than 10 times51.3%
Understanding of biosafety laboratory construction projectsVery familiar205.4%
Relatively familiar10127.2%
Generally familiar12734.1%
Slightly familiar9826.3%
Not familiar at all267.0%
Table 7. Reliability analysis results.
ConstructRetained ItemsCronbach’s αMinimum CITCAssessment
Command-and-control regulation50.8390.604Good
Market-incentive regulation50.8200.580Good
Public-participation regulation50.8240.565Good
Environmental regulation overall150.912Excellent
Green process innovation50.8190.586Good
Green management innovation70.8770.613Good
Environmental performance70.8600.575Good
Green performance overall190.944Excellent
Table 8. KMO, Bartlett’s test, and cumulative variance explained.
Scale or DimensionKMOBartlett χ2dfp-ValueCumulative Variance Explained
Environmental regulation overall0.9242370.8171050.00060.345%
Command-and-control regulation0.836674.61910<0.00160.821%
Market-incentive regulation0.851618.36410<0.00159.525%
Public-participation regulation0.844592.99810<0.00158.685%
Green performance overall0.9683631.2211710.00057.951%
Green process innovation0.845567.19810<0.00158.035%
Green management innovation0.9091069.52321<0.00157.529%
Environmental performance0.910927.14121<0.00154.501%
Table 9. Main rotated factor loadings for environmental regulation.
DimensionItemFactor Loading
Command-and-control regulationCE10.759
CE30.750
CE50.725
CE20.725
CE40.639
Public-participation regulationPE50.781
PE10.746
PE30.682
PE40.651
PE20.572
Market-incentive regulationME50.779
ME40.753
ME20.723
ME30.715
ME10.539
Table 10. CFA model fit indices.
Fit IndexValueRecommended ThresholdAssessment
χ2/df1.970<3.000Good
RMSEA0.051<0.080Good
GFI0.949>0.900Good
AGFI0.927>0.900Good
CFI0.965>0.900Good
IFI0.966>0.900Good
TLI0.957>0.900Good
Table 11. Convergent validity results.
ConstructMinimum Standardized LoadingMinimum SMCCRAVE
Command-and-control regulation0.6490.4210.8030.506
Market-incentive regulation0.6570.4320.8310.496
Public-participation regulation0.6640.4410.8240.484
Green process innovation0.6700.4490.8180.473
Green management innovation0.6960.4840.8460.524
Environmental performance0.6640.4410.8300.494
Table 12. Pearson correlation matrix.
VariableCEMEPEGPIGMIEP
Command-and-control regulation1.000
Market-incentive regulation0.533 **1.000
Public-participation regulation0.607 **0.620 **1.000
Green process innovation0.635 **0.608 **0.801 **1.000
Green management innovation0.607 **0.636 **0.761 **0.804 **1.000
Environmental performance0.570 **0.623 **0.714 **0.772 **0.787 **1.000
Note: ** p < 0.01.
Table 13. Structural model fit indices.
Fit IndexValueRecommended ThresholdAssessment
χ2/df2.175<3.000Acceptable
RMSEA0.056<0.080Acceptable
GFI0.879>0.800Acceptable
AGFI0.857>0.800Acceptable
CFI0.920>0.900Good
IFI0.921>0.900Good
TLI0.912>0.900Good
Table 14. SEM path coefficients and hypothesis testing.
HypothesisPathStandardized Coefficientp-ValueResult
H1Command-and-control regulation → Green process innovation0.316 ***0.000Supported
Command-and-control regulation → Green management innovation0.250 ***0.000Supported
Command-and-control regulation → Environmental performance0.200 **0.002Supported
H2Market-incentive regulation → Green process innovation−0.0730.328Not supported
Market-incentive regulation → Green management innovation0.0550.460Not supported
Market-incentive regulation → Environmental performance0.1080.173Not supported
H3Public-participation regulation → Green process innovation0.888 ***0.000Supported
Public-participation regulation → Green management innovation0.874 ***0.000Supported
Public-participation regulation → Environmental performance0.808 ***0.000Supported
Note: *** p < 0.01, ** p < 0.05.
Table 15. Regression results for green process innovation.
PredictorBStandard Errorβt-Valuep-ValueVIF
Constant0.7360.1744.2320.000
ME1 Pollution control subsidy0.0850.0310.101 ***2.6960.0071.693
ME2 Clean production funds0.0390.0260.0601.4850.1381.975
ME3 Environmental governance subsidy−0.0050.028−0.007−0.1690.8661.899
ME4 Tax incentive−0.0080.026−0.012−0.3210.7491.625
ME5 Green credit support0.0300.0280.0431.0860.2781.915
Command-and-control regulation0.1950.0380.2025.1530.0001.856
Public-participation regulation0.5380.0410.56613.2670.0002.191
Gender: male−0.1330.043−0.100−3.0860.0021.270
Understanding of biosafety laboratory projects−0.0410.023−0.068−1.8410.0661.624
Adjusted R20.692
F-value44.910<0.001
Note: Dummy variables for industry category, work experience, and prior organizational experience with biosafety laboratory construction projects were included in the regression models. Their coefficients are omitted from the table to save space. VIF = variance inflation factor. *** p < 0.01.
Table 16. Regression results for green management innovation.
PredictorBStandard Errorβt-Valuep-ValueVIF
Constant0.4220.1982.1350.033
ME1 Pollution control subsidy0.0940.0360.107 ***2.6190.0091.693
ME2 Clean production funds0.0150.0300.0230.5160.6061.975
ME3 Environmental governance subsidy0.0520.0320.0711.6290.1041.899
ME4 Tax incentive0.0610.0290.084 **2.0980.0371.625
ME5 Green credit support0.0120.0310.0170.3950.6931.915
Command-and-control regulation0.1810.0430.1804.2020.0001.856
Public-participation regulation0.5040.0460.50810.9140.0002.191
Gender: male−0.0190.049−0.013−0.3780.7051.270
Understanding of biosafety laboratory projects−0.0030.026−0.005−0.1150.9091.624
Adjusted R20.633
F-value34.618<0.001
Note: Dummy variables for industry category, work experience, and prior organizational experience with biosafety laboratory construction projects were included in the regression models. Their coefficients are omitted from the table to save space. VIF = variance inflation factor. *** p < 0.01, ** p < 0.05.
Table 17. Regression results for environmental performance.
PredictorBStandard Errorβt-Valuep-ValueVIF
Constant0.8340.2024.1330.000
ME1 Pollution control subsidy0.1370.0370.165 ***3.7600.0001.693
ME2 Clean production funds0.0580.0310.0901.8980.0591.975
ME3 Environmental governance subsidy0.0350.0320.0501.0880.2771.899
ME4 Tax incentive0.0390.0300.0561.2960.1961.625
ME5 Green credit support0.0090.0320.0130.2870.7751.915
Command-and-control regulation0.1220.0440.1272.7780.0061.856
Public-participation regulation0.4080.0470.4318.6560.0002.191
Gender: male−0.0100.050−0.008−0.2090.8341.270
Work experience: 7–10 years0.1830.0890.0832.0610.0401.435
Understanding of biosafety laboratory projects0.0000.0260.0000.0030.9971.624
Adjusted R20.579
F-value27.895<0.001
Note: Dummy variables for industry category, work experience, and prior organizational experience with biosafety laboratory construction projects were included in the regression models. Their coefficients are omitted from the table to save space. VIF = variance inflation factor. *** p < 0.01.
Table 18. Interpretation of differentiated regulatory effects.
Regulation TypeEmpirical ResultMain Mechanism in Biosafety Laboratory ConstructionPractical Implication
Command-and-control regulationSignificant positive effects on all three dimensionsEnvironmental assessment, technical standards, inspections, penalties, and final acceptance function as binding constraintsEffective for establishing minimum green requirements and ensuring process compliance
Market-incentive regulationOverall effects not significant; pollution control subsidy significant in supplementary regressionsGeneral incentives have weak project-level transmission, while direct subsidies are more closely linked to pollution-control behaviorMarket instruments should be more targeted, accessible, and connected to measurable project-level environmental outcomes
Public-participation regulationStrongest positive effects on all three dimensionsExpert review, stakeholder consultation, information disclosure, certification, user requirements, and life-cycle responsibility embed green requirements into project decisionsEffective for promoting green innovation beyond minimum compliance
Disclaimer/Publisher’s Note: The statements, opinions and data contained in all publications are solely those of the individual author(s) and contributor(s) and not of MDPI and/or the editor(s). MDPI and/or the editor(s) disclaim responsibility for any injury to people or property resulting from any ideas, methods, instructions or products referred to in the content.