Article

Assessing Sustainability Awareness in Teacher Education: Validation of a Multidimensional Scale in Pakistan


Department of Philosophy, Sociology, Education and Applied Psychology (FISPPA), University of Padova, 35139 Padova, Italy
*
Authors to whom correspondence should be addressed.
Sustainability 2026, 18(11), 5398; https://doi.org/10.3390/su18115398
Submission received: 10 April 2026 / Revised: 10 May 2026 / Accepted: 18 May 2026 / Published: 27 May 2026
(This article belongs to the Section Sustainable Education and Approaches)

Abstract

Developing countries often face challenges in the effective implementation of the Sustainable Development Goals (SDGs). Within diverse sustainability discourses, a context-specific understanding of the SDGs contributes to the development of sustainability awareness (SA), reflecting individuals’ recognition of the importance of sustainability and its dimensions. Empirical evidence highlights the need for reliable and valid measures of sustainability awareness (SA) among learners in educational contexts. In response, this study reports the development and psychometric validation of the Sustainability Awareness Scale (SAS), a self-report instrument designed to assess pre-service teachers’ awareness across three dimensions: economic, environmental, and social. The scale was administered to undergraduate pre-service teachers in Bachelor of Science (Honours) in Education programs at Pakistani universities. The sample was split into two independent subsamples for exploratory factor analysis (EFA; n = 144) and confirmatory factor analysis (CFA; n = 145). EFA supported a three-factor structure, and CFA confirmed a refined 12-item model with acceptable model fit (χ2/df = 1.68, RMSEA = 0.068, SRMR = 0.056, CFI = 0.93, TLI = 0.91). Construct validity was supported by acceptable composite reliability (CR = 0.715–0.780), average variance extracted (AVE = 0.489–0.569), and heterotrait–monotrait ratio (HTMT = 0.78–0.83) values. Internal consistency was satisfactory for the full scale (α = 0.872; ω = 0.875) and acceptable for all subscales. The findings indicate that the SAS is a reliable and contextually relevant instrument for assessing SA among pre-service teachers in Pakistan. The scale offers a practical tool for evaluating and strengthening Education for Sustainable Development (ESD) initiatives and supports the design of sustainability-focused educational programs.

1. Introduction

Over time, sustainability has evolved into a central concept across multiple disciplines, expanding beyond environmental concerns to encompass an integrated framework that includes the three core sustainability dimensions: economic, environmental, and social [1]. This holistic perspective is reflected in the adoption of the 17 Sustainable Development Goals (SDGs), a globally negotiated agenda aimed at “transforming our world” [2]. Agenda 21 [3] provided the first international call for action through education for sustainable development (ESD), emphasizing three key objectives: reorienting education, enhancing public awareness, and promoting capacity building [4]. Reflecting this, SDG 4, Quality Education, particularly target 4.7, emphasizes the need to ensure that all learners acquire the knowledge and skills necessary to promote sustainable development through ESD.
The United Nations Decade of Education for Sustainable Development (UNDESD) aimed to holistically integrate sustainability principles, values, and practices into all teaching and learning processes. However, research has identified limited staff awareness and expertise, as well as curricular and pedagogical obstacles, as key factors limiting its implementation [5]. These educational initiatives raise critical questions, including how levels of sustainability awareness (SA) vary within populations and how effectively education systems contribute to the achievement of the SDGs. In this study, SA is conceptualized and operationalized as individuals’ recognition and perceived importance of sustainability-related issues across economic, environmental, and social domains, distinguishing it from factual knowledge or attitudes.
Sustainability education literature, building on earlier environmental education traditions, distinguishes awareness from deeper cognitive understanding. The Tbilisi Conference emphasized that environmental education should foster awareness as an initial level of recognition, while understanding reflects a more advanced cognitive engagement with environmental issues. This distinction aligns with [6], where knowledge is conceptualized as a structured and hierarchical cognitive domain (p. 62), and with [7], which differentiates between awareness, understanding, and competencies in sustainability learning (pp. 10–11). In contrast, attitudes refer to individuals’ evaluative beliefs and feelings toward sustainability issues, which influence their behavioral intentions [8]. Furthermore, sustainability literacy represents a broader construct encompassing the knowledge, skills, and competencies required to effectively engage with sustainability challenges [7]. While literacy integrates cognitive and practical dimensions and attitudes reflect affective orientations, awareness serves as a foundational construct that enables individuals to recognize sustainability issues and their significance. Therefore, distinguishing SA from related constructs such as knowledge, attitudes, and literacy is essential for developing precise measurement tools. The growing emphasis on sustainability initiatives within education has increased the demand for reliable and valid approaches to assessing SA [9].
Research has often focused on individual-level learning processes within higher education, where structured programs aim to foster SA [10]. Teachers play a crucial role as agents for change [11]. In this context, pre-service teachers can be regarded as future agents of change. Their position allows them to influence both current learners and future generations, a dynamic often described as a “multiplier effect” [12]. Through their professional practice and engagement with societal issues, pre-service teachers are uniquely situated to promote SA. This role also entails a responsibility to model sustainable practices in both professional and everyday contexts [13].
Empirical evidence from Asian higher education indicates gaps in teacher education programs’ capacity to embed sustainability-related concepts [14]. This regional evidence underscores the need to assess SA among pre-service teachers in Pakistan. Institutional engagement with sustainability in Pakistan remains at an early stage [15]. Pakistan faces significant and interconnected sustainability challenges, including environmental degradation, infrastructural constraints, and social inequalities, which collectively hinder sustainable development. This slow progress is often due to systemic barriers such as limited staff awareness, a lack of specialized curricula, and the persistence of traditional teaching materials [5]. It is observed that regional textbooks often neglect the environmental and economic pillars [16], creating a significant risk of a “lack of a comprehensive vision” [17], which is fundamental for developing a multidimensional SA.
At the same time, existing tools to assess SA present important conceptual and methodological limitations. In particular, many instruments assess broader constructs such as sustainability consciousness or KAB (knowledge, attitude, and behavior) rather than isolating awareness as a distinct construct [18,19]. Others focus primarily on attitudes toward sustainability [20] or lack clearly defined multidimensional structures and rigorous validation procedures [21]. Moreover, several instruments are not specifically designed for pre-service teachers and do not explicitly align with internationally recognized frameworks such as ESD [7] and the Sustainable Development Goals [2].
Taken together, these limitations highlight the need for a concise, theoretically grounded, and psychometrically validated measure of sustainability awareness tailored to pre-service teachers in Pakistan.
As shown in Table 1, previous instruments have contributed to sustainability-related assessment in Pakistan but differ from the present study in conceptual focus, target population, dimensional structure, and validation approach. Some instruments assess broader constructs such as sustainability consciousness, knowledge, attitudes, beliefs, or behavior, while others focus mainly on attitudes or environmental consciousness. In contrast, the present SAS focuses specifically on sustainability awareness as a distinct construct and operationalizes it across economic, environmental, and social dimensions. The scale is also designed for pre-service teachers and is aligned with the Triple Bottom Line framework, ESD principles, and the SDGs.
Accordingly, the present study develops and validates a concise multidimensional SAS for pre-service teachers in Pakistan. The scale contributes to the literature by offering a theoretically grounded, contextually relevant, and psychometrically tested instrument for assessing sustainability awareness and supporting Education for Sustainable Development in teacher education.

1.1. The Framework of the SAS

The theoretical framework of the SAS is grounded in the TBL, providing a comprehensive basis for operationalizing SA within an integrated and multidimensional perspective. In the context of Pakistan, sustainability challenges are complex and interconnected, highlighting the need for a holistic understanding of sustainability that simultaneously addresses economic resilience, environmental stewardship, and social equity. Accordingly, the SAS was developed to reflect these three dimensions while incorporating context-specific sustainability issues relevant to Pakistan (see Table 2).

1.2. Purpose of the Study

The purpose of this study was to develop and validate the Sustainability Awareness Scale (SAS), a multidimensional instrument grounded in sustainability frameworks and tailored to the Pakistani teacher education context. The study also examined pre-service teachers’ descriptive levels of sustainability awareness across the economic, environmental, and social dimensions. Specifically, the study addressed the following research questions:
  • RQ1. What are the descriptive levels of sustainability awareness among pre-service teachers across the economic, environmental, and social dimensions of the SAS?
  • RQ2. Is the three-dimensional structure of the SAS supported by exploratory and confirmatory factor analyses?
  • RQ3. Does the SAS demonstrate evidence of construct validity, including convergent and discriminant validity?
  • RQ4. Is the internal consistency of the SAS supported by Cronbach’s alpha and McDonald’s omega?

2. Materials and Methods

2.1. Item Development and Content Validity of the SAS

Scale development followed established guidelines for instrument development [22]. First, a comprehensive literature review was conducted to define the construct and determine the measurement objectives. Based on this conceptualization, an initial pool of 32 items was generated using the SDGs [2], the Triple Bottom Line framework [23], and previous sustainability-related studies and assessment instruments [24,25,26,27]. These items were reviewed and adapted to reflect Pakistan’s context, and three additional items were developed to capture context-specific sustainability challenges. The initial pool was designed to cover the three dimensions of SA: economic, environmental, and social. To ensure alignment with the construct, the items were reformulated from knowledge-based and normative statements into awareness-oriented expressions, capturing respondents’ recognition and perceived importance of sustainability issues rather than factual recall.
Content validity was assessed through expert evaluation. Three experts in ESD and teacher education participated, all holding doctoral-level qualifications and experience in sustainability education, curriculum development, and educational research. The experts evaluated each item in terms of relevance, clarity, and conceptual alignment using a 4-point rating scale ranging from 1 (not relevant) to 4 (highly relevant), following recommended practices for content validity assessment. Items were assessed for their appropriateness in representing SA within the defined dimensions. Items receiving lower relevance ratings were reviewed and excluded based on expert consensus.
Based on this evaluation, seven items were removed. Of the remaining 25 items, 17 were rated as highly relevant, five as quite relevant, and three were revised based on expert feedback. Using the Content Validity Index (CVI), item-level evaluations informed the overall scale-level CVI (S-CVI/Ave = 0.88), exceeding the recommended threshold of 0.80 and indicating satisfactory content validity. Following revision and expert consensus, all 25 items were retained for empirical testing. The questionnaire was administered in English, the medium of instruction in higher education in Pakistan. Minor wording adjustments were made to ensure clarity and comprehension. Following empirical testing, EFA initially supported a three-factor structure, and subsequent CFA refinement resulted in the final 12-item SAS representing economic, environmental, and social SA (see Table 3). The final SAS is a self-report instrument using a five-point Likert scale ranging from “strongly disagree” to “strongly agree”. The final 12-item Sustainability Awareness Scale is provided in Appendix A.

2.2. Participants and Procedure

A total of 289 undergraduate pre-service teachers enrolled in Bachelor of Science (Honours) in Education programs across multiple universities in Pakistan participated in the study. Participants were selected using purposive sampling because the study specifically targeted pre-service teachers as the intended population for validating the Sustainability Awareness Scale. Data were collected over a period of nine months using an online Google Forms questionnaire. Participation was voluntary, and respondents were informed about the purpose of the study, anonymity, and confidentiality before completing the questionnaire.
The total sample was randomly divided into two independent subsamples. One subsample (n = 144) was used for exploratory factor analysis (EFA), while the second subsample (n = 145) was used for confirmatory factor analysis (CFA). This split-sample approach enabled cross-validation of the factor structure and reduced the risk of overfitting. The EFA subsample (n = 144) yielded a participant-to-item ratio of approximately 5.7:1 for the initial 25-item pool. Although some methodological guidelines recommend more conservative ratios, psychometric literature suggests that ratios close to 5:1 may still produce stable and interpretable factor solutions when factor loadings, communalities, and factor structure are adequate [28,29]. Descriptive statistics were calculated using the full sample (n= 289), while factor analyses were conducted on the respective subsamples. No formal sustainability-related teaching intervention was conducted during the data collection period.

2.3. Ethical Considerations

Participation in the study was voluntary, and informed consent was obtained from all participants prior to data collection. Participants were informed about the purpose of the study and assured of the anonymity and confidentiality of their responses. The study involved minimal risk and adhered to standard ethical guidelines for survey-based research.

2.4. Data Analysis

IBM SPSS Statistics version 27.0 (IBM Corp., Armonk, NY, USA) was used for initial data preparation and random splitting of the sample into two independent subsamples for exploratory and confirmatory factor analyses. Jamovi version 2.7 (The jamovi project, Sydney, Australia) was used to conduct the statistical analyses. Data were screened before analysis to identify incomplete responses. Prior to factor analysis, the suitability of the data was assessed using the Kaiser–Meyer–Olkin (KMO) measure of sampling adequacy and Bartlett’s test of sphericity.
EFA was conducted using the minimum residual extraction method with oblimin rotation to examine the underlying factor structure of the scale. The number of factors retained was determined using parallel analysis together with inspection of the scree plot, as parallel analysis is considered a more robust and empirically supported method for factor retention than relying solely on the Kaiser eigenvalue-greater-than-one criterion [30,31]. An oblique rotation method was considered theoretically appropriate because economic, environmental, and social sustainability awareness represent conceptually interrelated dimensions of overall sustainability awareness rather than entirely independent constructs.
CFA was conducted to validate the measurement model using the diagonally weighted least squares (DWLS) estimator with robust standard errors based on polychoric correlations, as the SAS items were measured using ordinal Likert-type response categories. This estimator was selected because it is appropriate for ordinal indicators and moderate sample sizes in relatively parsimonious CFA models.
Internal consistency was assessed using Cronbach’s alpha and McDonald’s omega. In addition, descriptive statistics were computed using means and standard deviations to summarize sustainability awareness levels, while convergent and discriminant validity were evaluated using composite reliability (CR), average variance extracted (AVE), and the heterotrait–monotrait ratio (HTMT). Cases with substantial missing data, defined as more than 20%, were excluded. The remaining missing values were minimal and handled using pairwise deletion.

3. Results

3.1. Descriptive Statistics

To address RQ1, descriptive statistics for the SAS items were calculated using the full sample (n = 289), as presented in Table 4.
Overall, the descriptive findings suggest relatively high self-reported levels of SA across the three dimensions. For the economic dimension, item means ranged from 4.03 to 4.26, with an overall mean of 4.18, suggesting relatively high recognition of economic sustainability concepts. Similarly, the environmental dimension showed high awareness, with item means ranging from 3.87 to 4.20 and an overall mean of 4.08. The comparatively lower mean for one item indicates slightly less agreement on specific environmental aspects, although overall awareness remained high. For the social dimension, item means ranged from 4.06 to 4.36, with an overall mean of 4.16, reflecting relatively high recognition of social sustainability issues among participants.

3.2. Exploratory Factor Analysis

RQ2 examined the suitability of the data for EFA and the underlying factor structure of the SAS. The Kaiser–Meyer–Olkin (KMO) measure and Bartlett’s test of sphericity were conducted. The KMO value of 0.850 indicates meritorious sampling adequacy, and Bartlett’s test of sphericity was significant (χ2 = 646, df = 120, p < 0.001), confirming that the data were appropriate for factor analysis [32].
The EFA results initially supported a three-factor structure with 15 retained items based on acceptable factor loadings (≥0.45), cross-loadings, conceptual consistency, and interpretability of the factor structure. The 15-item solution was then evaluated through CFA for further model refinement. During this process, three items were removed after considering their statistical performance and contribution to the overall measurement model, including factor loadings, construct reliability, convergent validity, and discriminant validity. This refinement resulted in the final 12-item SAS. Therefore, Table 5 reports the rotated factor loadings for the final 12 items retained after CFA refinement.
The final 12 items represented three dimensions: economic sustainability awareness, environmental sustainability awareness, and social sustainability awareness, with four items retained for each dimension.
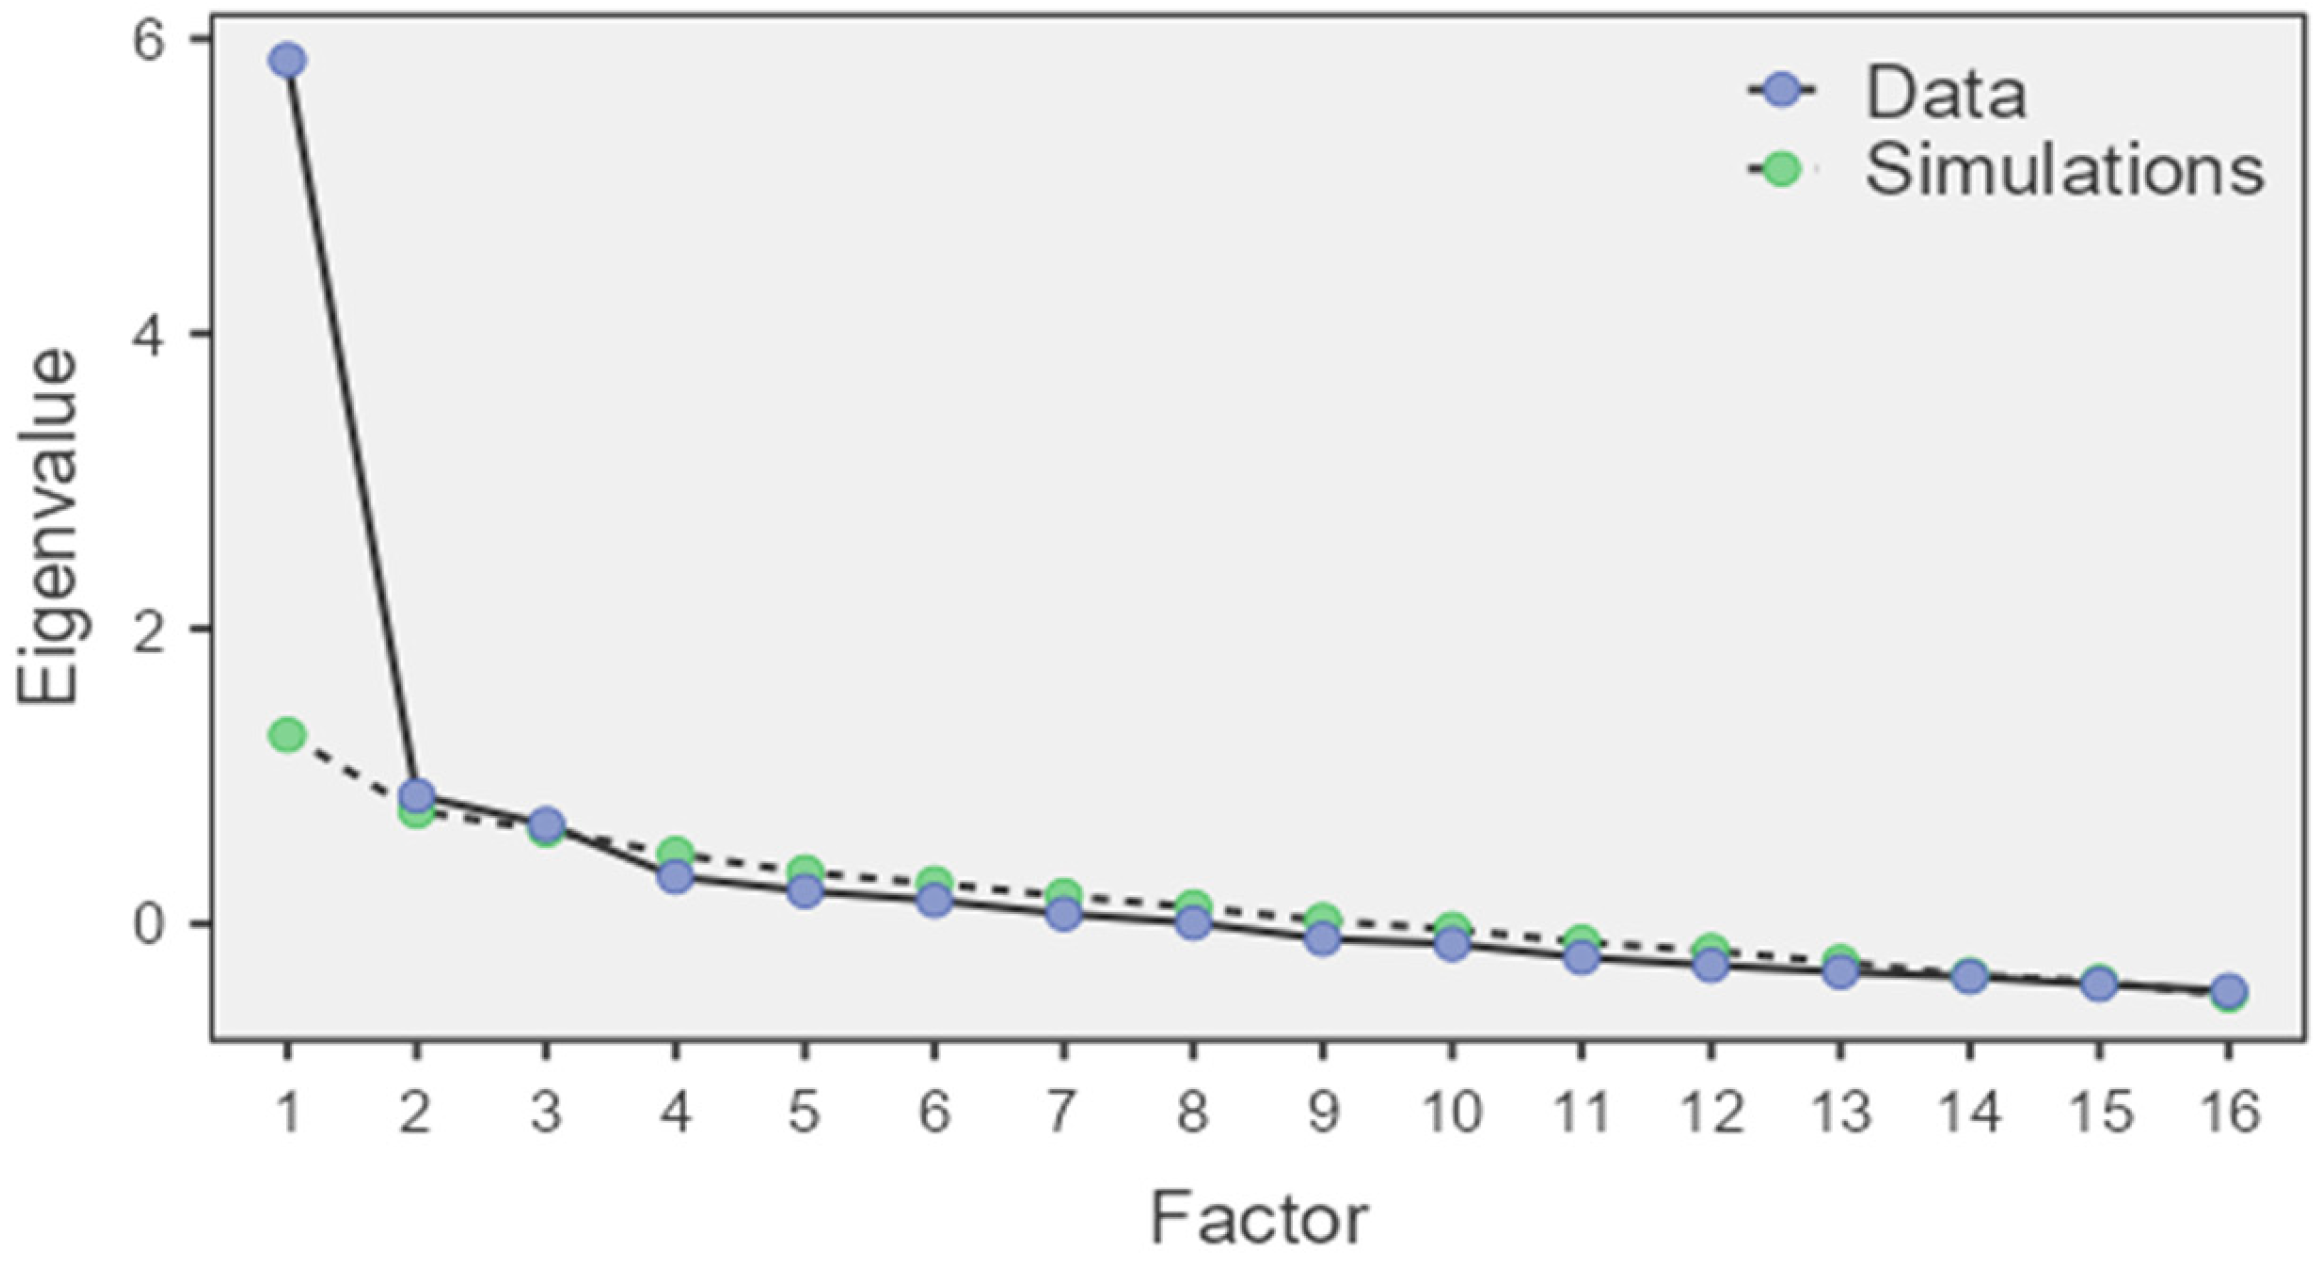
The scree plot is presented in Figure 1. The plot shows eigenvalues for each factor, with blue circles for observed data and green circles for simulated data. The inflection after the third factor and the eigenvalue = 1 cutoff suggest retaining three factors.
The minimum residual extraction method with oblimin rotation was used. Inter-factor correlations ranged from 0.347 to 0.475, supporting the appropriateness of using an oblique rotation method and indicating moderate relationships among the sustainability awareness dimensions. The number of factors to retain was determined through parallel analysis, which supported a three-factor solution. Factor loadings ranged from 0.451 to 0.842, and items with loadings below 0.45 were excluded. The three factors explained 48.9% of the total variance. Factor loadings, descriptive statistics, percentage of variance explained, and reliability coefficients are presented in Table 6.

3.3. Confirmatory Factor Analysis

To further address RQ2, the factor structure identified through EFA was validated using CFA on an independent subsample (n = 145). Given the ordinal nature of the data, CFA was conducted using the diagonally weighted least squares (DWLS) estimator with robust standard errors based on polychoric correlations, which is considered appropriate for ordinal indicators and moderate sample sizes [33]. DWLS was selected because it provides stable and efficient estimation for ordinal CFA in relatively parsimonious models.
The initial CFA model was specified based on the 15-item structure obtained from EFA. During model refinement, three items were removed after considering their statistical performance and contribution to the overall measurement model, including standardized factor loadings, construct reliability, convergent validity, and discriminant validity. The final model comprised 12 observed variables loading onto three latent constructs representing economic, environmental, and social sustainability awareness. The final model corresponded to a participant-to-item ratio of approximately 12:1 and included 62 free parameters. The model converged successfully after 31 iterations, supporting the adequacy and stability of the specified CFA model.
Model fit was evaluated using multiple indices following recommended guidelines [34,35]. The CFA model presented in Table 7 demonstrated acceptable overall model fit: χ2(51) = 85.8, p = 0.002, χ2/df = 1.68, CFI = 0.93, TLI = 0.91, SRMR = 0.056, and RMSEA = 0.068, 90% CI [0.042, 0.093]. Although the RMSEA value slightly exceeded the more conservative 0.06 criterion, the overall pattern of fit indices fell within commonly accepted thresholds for applied social science research. In particular, the CFI and TLI values exceeded the recommended 0.90 threshold, and SRMR remained below 0.08, supporting acceptable model fit.
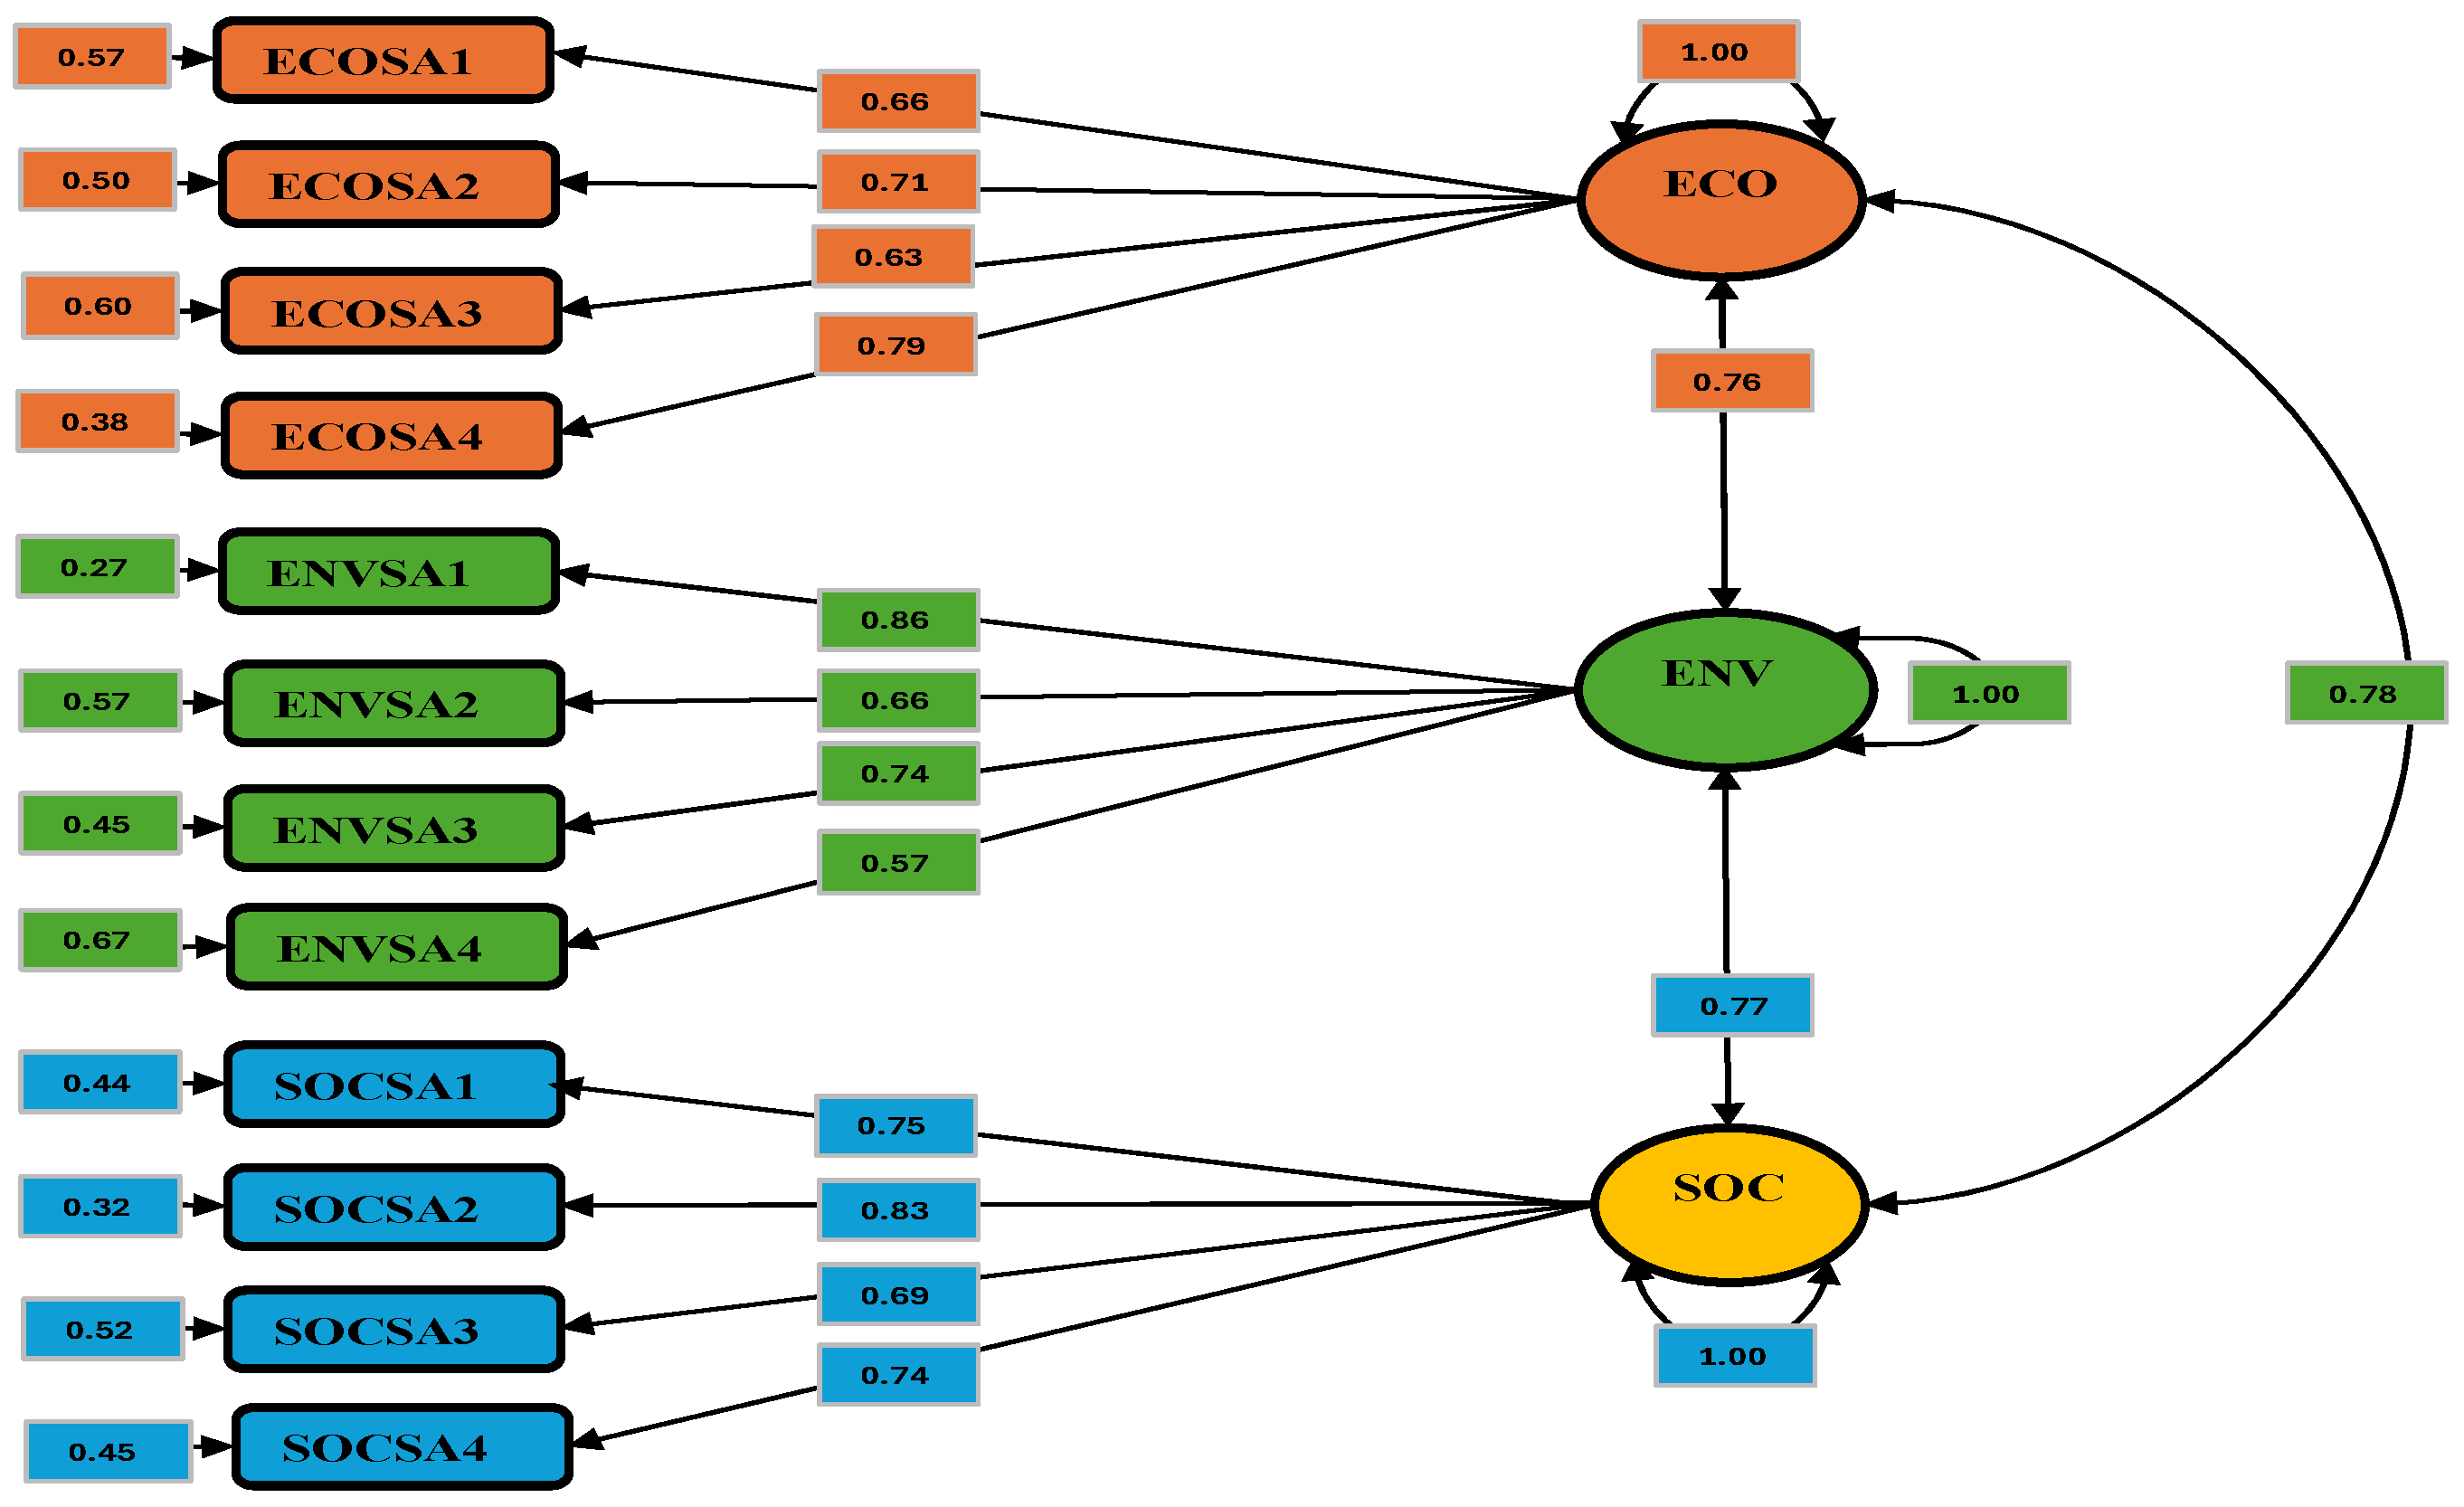
Figure 2 shows the CFA path diagram with three latent constructs: Economic (ECO), Environmental (ENV), and Social (SOC), and their observed indicators.
Standardized factor loadings for the final model ranged from 0.518 to 0.795 (see Table 8). All standardized loadings were statistically significant at p < 0.001 and exceeded the recommended minimum threshold of 0.50, indicating acceptable relationships between the observed indicators and their respective latent constructs [32].

3.4. Construct Validity

To address RQ3, construct validity was evaluated using the CFA model based on the CFA subsample (n = 145), employing composite reliability (CR), average variance extracted (AVE), and the heterotrait–monotrait ratio (HTMT), following recommended practices in scale validation studies.

3.4.1. Convergent Validity

Convergent validity was assessed using AVE and CR. CR values ranged from 0.715 to 0.780, indicating satisfactory internal consistency across the constructs. The AVE values for the economic, environmental, and social dimensions were 0.489, 0.508, and 0.569, respectively. Although the AVE value for the economic dimension was marginally below the recommended threshold of 0.50 [36], convergent validity was considered acceptable because composite reliability exceeded the recommended threshold of 0.70, and the retained items demonstrated theoretically meaningful contributions to the construct [32]. Similar approaches have also been reported in previous SEM-based studies, where constructs with lower AVE values were retained due to acceptable reliability and theoretical relevance [37,38]. Therefore, the retained items were kept to maintain the conceptual breadth and content validity of the construct (see Table 9).

3.4.2. Discriminant Validity

Discriminant validity was assessed using the heterotrait–monotrait ratio (HTMT) based on polychoric correlations, which are appropriate for ordinal data [39]. As shown in Table 10, HTMT values ranged from 0.78 to 0.83, remaining below the conservative threshold of 0.85 [40], thereby supporting acceptable discriminant validity among the three constructs.
Discriminant validity was further evaluated using latent factor correlations. As shown in Table 11, the latent correlations supported the theoretical relatedness of the sustainability awareness dimensions while remaining sufficiently distinct when interpreted together with the HTMT results.

3.5. Reliability Analysis of the SAS

To address RQ4, reliability was assessed using Cronbach’s alpha and McDonald’s omega coefficients. Reliability analysis was conducted on the final 12-item SAS using the full sample (n = 289).
As shown in Table 12, the full scale demonstrated good internal consistency, with Cronbach’s alpha (α = 0.872) and McDonald’s omega (ω = 0.875), both exceeding the recommended threshold of 0.70 [32,41]. At the subscale level, Cronbach’s alpha values ranged from 0.726 to 0.741, while McDonald’s omega coefficients ranged from 0.729 to 0.742, indicating acceptable internal consistency across the sustainability awareness dimensions [32,42].

4. Discussion

The present study contributes to research on Education for Sustainable Development (ESD) by developing and validating a multidimensional instrument for assessing sustainability awareness (SA) among pre-service teachers in Pakistan. The findings provide evidence supporting the reliability, validity, and three-dimensional structure of the SAS, encompassing economic, environmental, and social dimensions. Collectively, these results indicate that SA among pre-service teachers can be measured using a psychometrically sound and contextually relevant scale suitable for educational assessment and research settings.
With respect to the economic dimension, the high levels of awareness suggest that participants recognized the role of poverty reduction, local economic activity, infrastructure, and innovation in supporting sustainable development. This may partly reflect the socio-economic realities of Pakistan, where issues such as unemployment, economic instability, and infrastructural constraints are prominent. These contextual factors may contribute to awareness of economic sustainability issues through lived experiences and societal exposure. The findings align with the Triple Bottom Line framework, which emphasizes the integration of economic processes within sustainable development.
Similarly, the environmental dimension demonstrated strong awareness, particularly regarding climate change, waste management, population growth, and pollution. This may reflect the increasing global and national attention given to environmental challenges, particularly in countries such as Pakistan that are vulnerable to climate-related impacts. The slightly lower mean observed for pollution-related items suggests that certain environmental aspects may not be uniformly recognized. These findings are consistent with prior studies indicating that environmental awareness often receives greater attention because of its visibility and global relevance.
The social dimension also revealed strong levels of awareness, particularly in relation to human rights, gender equality, education, and community well-being. These findings suggest that pre-service teachers recognized the importance of social equity and inclusivity as core components of sustainability. The relatively high awareness of gender equality and human rights may reflect increased societal and educational discourse around social justice issues. Awareness of infectious disease management may also have been influenced by recent global health developments, which have heightened public understanding of health-related sustainability challenges.
Although the results indicate relatively high self-reported levels of sustainability awareness across economic, environmental, and social dimensions, these findings should be interpreted cautiously. Awareness is an important foundation for sustainability-oriented learning, but it does not necessarily reflect deep conceptual understanding, positive attitudes, sustainability competence, or actual sustainability-related behavior. In teacher education, this distinction is particularly important because pre-service teachers may recognize the relevance of issues such as poverty reduction, environmental protection, social equity, and community well-being without being fully prepared to translate this recognition into classroom practice or pedagogical decision-making. The high awareness levels may partly reflect increased global, national, and educational attention to sustainability; however, they should not be interpreted as evidence of demonstrated teaching competence or behavioral engagement. Therefore, the findings are best understood as evidence of perceived recognition of sustainability issues, rather than direct evidence of sustainability-related practice or competence.
The study further makes a methodological contribution by providing a concise, multidimensional, and psychometrically tested instrument for measuring sustainability awareness. The EFA initially supported a three-factor structure, which was further evaluated and refined through CFA. The refinement of the scale to a final 12-item model reflects a balance between parsimony and conceptual coverage. Reliability estimates, including Cronbach’s alpha and McDonald’s omega, indicated satisfactory internal consistency across the full scale and acceptable reliability across subscales. Evidence of construct validity was also supported through factor loadings, composite reliability, AVE values, HTMT results, and latent factor correlations. Although the AVE value for the economic dimension was slightly below the recommended threshold, it was retained because composite reliability was acceptable, and the items were theoretically meaningful for representing economic sustainability awareness.
Theoretically, the SAS contributes to sustainability education research by clarifying sustainability awareness as a construct distinct from knowledge, attitudes, and sustainability literacy. By grounding the scale in the Triple Bottom Line framework, ESD principles, and the SDGs, the study supports a multidimensional conceptualization of sustainability awareness across economic, environmental, and social domains. This provides a measurement foundation for future research examining how awareness relates to attitudes, behavioral intentions, pedagogical practices, and sustainability literacy.
Practically, the SAS offers teacher education institutions a concise and validated tool for assessing pre-service teachers’ sustainability awareness. The scale may help identify areas where awareness is strong or comparatively weaker, inform curriculum development, evaluate ESD-related initiatives, and support the integration of sustainability topics into teacher education programs. In the Pakistani context, where sustainability education remains developing, the SAS may help institutions monitor awareness-building efforts and design targeted educational interventions. At the same time, teacher education programs should move beyond awareness-raising by providing opportunities for critical reflection, curriculum integration, and practice-oriented engagement with sustainability issues.
Despite its contributions, the study has several limitations. The sample was restricted to pre-service teachers in Pakistan, which may limit the generalizability of the findings to other educational, cultural, or national contexts. The study also relied on self-reported data collected from a single source using a cross-sectional design, which may introduce social desirability bias and the possibility of common method bias. Although procedural steps such as voluntary participation, anonymity, confidentiality, and clear item wording were used to reduce response bias, no formal statistical test for common method bias was conducted. In addition, the study did not include behavioral or nomological validation; therefore, the SAS should be interpreted as a measure of sustainability awareness rather than direct evidence of sustainability-related behavior, pedagogical competence, or classroom implementation.
Several methodological limitations should also be acknowledged. Although sample adequacy was supported through participant-to-item ratios, acceptable model fit, and successful DWLS estimation, a formal a priori power analysis was not conducted prior to data collection. Measurement invariance across gender, institutional, and regional groups was not examined due to subgroup sample-size limitations. Future studies should assess configural, metric, and scalar invariance using larger and more diverse samples. Future research should also compare the three-factor model with alternative one-factor, two-factor, and hierarchical models to further examine the structural robustness of the SAS. Additional sensitivity analyses, including formal outlier diagnostics and robustness checks of item-removal decisions, should also be considered in future validation studies.
Future research could extend the present study by applying the SAS across diverse populations and cultural contexts, conducting longitudinal studies, and examining whether sustainability awareness predicts attitudes, behavioral intentions, sustainability-related behaviors, and ESD-related teaching practices. Such work would help establish the explanatory and predictive utility of the SAS beyond initial psychometric validation.
In conclusion, the SAS developed in this study represents a meaningful contribution to assessment literature in ESD. By providing a reliable, valid, and contextually grounded instrument, the study supports efforts to strengthen teacher education and promote sustainable development in Pakistan and beyond.

Author Contributions

A.W.: Conceptualization, methodology, data curation, formal analysis, investigation, writing—original draft preparation. M.F.: Data curation, investigation, literature review, writing—review and editing. M.B.: Supervision, methodology, validation, writing—review and editing. All authors have read and agreed to the published version of the manuscript.

Funding

This research received no external funding.

Data Availability Statement

The data supporting the findings of this study are not publicly available due to privacy and ethical restrictions. However, anonymized data may be made available from the corresponding author upon reasonable request.

Acknowledgments

The authors acknowledge the support of the University of Padua, Padua, Italy.

Conflicts of Interest

The authors declare no conflicts of interest.

Appendix A

Table A1. Sustainability Awareness Scale (SAS) response format and items.
I am aware that:1
Strongly Disagree
2
Disagree
3
Neutral
4
Agree
5
Strongly Agree
(1)
Reducing poverty contributes to long-term economic growth
12345
(2)
Local businesses contribute to employment and economic sustainability
12345
(3)
Reliable infrastructure contributes to sustainable economic growth
12345
(4)
Innovation and technology contribute to economic productivity
12345
(5)
Human activities contribute to changes in the atmosphere and climate system
12345
(6)
Reducing household and industrial waste contributes to environmental sustainability
12345
(7)
Urbanization and population growth contribute to resource depletion and ecosystem degradation
12345
(8)
Preventing and managing pollution contributes to environmental sustainability
12345
(9)
Protecting human rights and promoting social equity contribute to social sustainability
12345
(10)
Equal opportunities for all genders contribute to social sustainability
12345
(11)
Inclusive, quality education contributes to social sustainability
12345
(12)
Managing major infectious diseases contributes to community well-being and stability
12345

References

  1. Moschis, G.P.; Mathur, A.; Shannon, R. Toward Achieving Sustainable Food Consumption: Insights from the Life Course Paradigm. Sustainability 2020, 12, 5359. [Google Scholar] [CrossRef]
  2. United Nations. Transforming Our World: The 2030 Agenda for Sustainable Development; United Nations: New York, NY, USA, 2015. [Google Scholar]
  3. United Nations. Agenda 21: Programme of Action for Sustainable Development. In Proceedings of the United Nations Conference on Environment and Development, Rio de Janeiro, Brazil, 3–14 June 1992; Available online: https://www.un.org/esa/dsd/agenda21/Agenda%2021.pdf (accessed on 26 March 2026).
  4. Biasutti, M.; Frate, S. A Validity and Reliability Study of the Attitudes toward Sustainable Development Scale. Environ. Educ. Res. 2017, 23, 214–230. [Google Scholar] [CrossRef]
  5. Biasutti, M.; De Baz, T.; Alshawa, H. Assessing the Infusion of Sustainability Principles into University Curricula. J. Teach. Educ. Sustain. 2016, 18, 21–40. [Google Scholar] [CrossRef]
  6. Bloom, B.S.; Engelhart, M.D.; Furst, E.J.; Hill, W.H.; Krathwohl, D.R. Handbook I: Cognitive Domain; David McKay: New York, NY, USA, 1956; pp. 483–498. [Google Scholar]
  7. United Nations Educational, Scientific and Cultural Organization (UNESCO). Education for Sustainable Development Goals: Learning Objectives; United Nations Educational, Scientific and Cultural Organization: Paris, France, 2017. [Google Scholar] [CrossRef]
  8. Ajzen, I. The Theory of Planned Behavior. Organ. Behav. Hum. Decis. Process. 1991, 50, 179–211. [Google Scholar] [CrossRef]
  9. Lad, N.; Akerlof, K.L. Assessing Campus Sustainability Literacy and Culture: How Are Universities Doing It and to What End? Front. Sustain. 2022, 3, 927294. [Google Scholar] [CrossRef]
  10. Bardy, R.; Rubens, A.; Eberle, P. Building Intellectual Capital for Sustainable Development: Combining Local Wisdom and Advanced Knowledge. Electron. J. Knowl. Manag. 2017, 15, 159. [Google Scholar]
  11. Biasutti, M.; Makrakis, V.; Concina, E.; Frate, S. Educating Academic Staff to Reorient Curricula in ESD. Int. J. Sustain. High. Educ. 2018, 19, 179–196. [Google Scholar] [CrossRef]
  12. Kadji-Beltrán, C. Enhancing Sustainability Teaching Competence in Preschool Teacher Education Using Living Labs. Sustainability 2024, 16, 2781. [Google Scholar] [CrossRef]
  13. Kahriman-Pamuk, D.; Pramling Samuelsson, I. Nurturing Sustainability in Toddlerhood: Investigating Preschool Teachers’ Views and Daily Practices in a Swedish Preschool. Children 2024, 11, 1412. [Google Scholar] [CrossRef]
  14. Makrakis, V.; Biasutti, M.; Kostoulas-Makrakis, N.; Ghazali, M.; Othman, W.; Ali, M.; Mavrantonaki, K. ICT-Enabled Education for Sustainability Justice in South East Asian Universities. Sustainability 2024, 16, 4049. [Google Scholar] [CrossRef]
  15. Geok, T.K.; Shah, A.; Goh, G.G.G.; Zeb, A. The Links between Sustainability Dimensions and Green Campus Initiatives in Mountain Universities. J. Infrastruct. Policy Dev. 2024, 8, 7653. [Google Scholar] [CrossRef]
  16. Jamil, M.; Mehmood, W.; Aslam, A. Sustainability Education in Pakistan: A Qualitative Content Analysis of the 10th Grade Pakistan Studies Textbook. Voyag. J. Educ. Stud. 2024, 4, 80–95. [Google Scholar] [CrossRef]
  17. Biasutti, M. An Intensive Programme on Education for Sustainable Development: The Participants’ Experience. Environ. Educ. Res. 2015, 21, 734–752. [Google Scholar] [CrossRef]
  18. Kalsoom, Q.; Khanam, A.; Quraishi, U. Sustainability Consciousness of Pre-Service Teachers in Pakistan. Int. J. Sustain. High. Educ. 2017, 18, 1090–1107. [Google Scholar] [CrossRef]
  19. Zeeshan, M.; Qureshi, N. Development of a Scale to Measure Environmental Consciousness of Pre-Service Teachers in Punjab, Pakistan. J. Soc. Sci. Res. 2023, 3, 768–781. Available online: https://jssr.com.pk/index.php/jssr/article/download/199/172/1743 (accessed on 2 April 2026). [CrossRef]
  20. Nousheen, A.; Zai, S.A.Y.; Waseem, M.; Khan, S.A. Education for Sustainable Development (ESD): Effects of Sustainability Education on Pre-Service Teachers’ Attitude towards Sustainable Development (SD). J. Clean. Prod. 2020, 250, 119537. [Google Scholar] [CrossRef]
  21. Malik, M.N.; Khan, H.H.; Chofreh, A.G.; Goni, F.A.; Klemeš, J.J.; Alotaibi, Y. Investigating Students’ Sustainability Awareness and the Curriculum of Technology Education in Pakistan. Sustainability 2019, 11, 2651. [Google Scholar] [CrossRef]
  22. DeVellis, R.F.; Thorpe, C.T. Scale Development: Theory and Applications; SAGE Publications: Thousand Oaks, CA, USA, 2021. [Google Scholar]
  23. Jeurissen, R. John Elkington, Cannibals with Forks: The Triple Bottom Line of 21st Century Business. J. Bus. Ethics 2000, 23, 229–231. [Google Scholar] [CrossRef]
  24. Chen, C.; An, Q.; Zheng, L.; Guan, C. Sustainability Literacy: Assessment of Knowingness, Attitude, and Behavior Regarding Sustainable Development among Students in China. Sustainability 2022, 14, 9486. [Google Scholar] [CrossRef]
  25. Kuehl, C.; Sparks, A.C.; Hodges, H.; Smith, E.R.A.N. Exploring Sustainability Literacy: Developing and Assessing a Bottom-up Measure of What Students Know about Sustainability. Front. Sustain. 2023, 4, 1167041. [Google Scholar] [CrossRef]
  26. Michalos, A.C.; Creech, H.; Swayze, N.; Kahlke, M.; Buckler, C.; Rempel, K. Measuring Knowledge, Attitudes and Behaviors Concerning Sustainable Development among Tenth Grade Students in Manitoba. Soc. Indic. Res. 2012, 106, 213–238. [Google Scholar] [CrossRef]
  27. Afroz, N.; Ilham, Z. Assessment of Knowledge, Attitude and Practice of University Students towards Sustainable Development Goals (SDGs). J. Indones. Sustain. Dev. Plan. 2020, 1, 31–44. [Google Scholar] [CrossRef]
  28. MacCallum, R.C.; Widaman, K.F.; Zhang, S.; Hong, S. Sample Size in Factor Analysis. Psychol. Methods 1999, 4, 84. [Google Scholar] [CrossRef]
  29. Mundfrom, D.J.; Shaw, D.G.; Ke, T.L. Minimum Sample Size Recommendations for Conducting Factor Analyses. Int. J. Test. 2005, 5, 159–168. [Google Scholar] [CrossRef]
  30. Horn, J.L. A Rationale and Test for the Number of Factors in Factor Analysis. Psychometrika 1965, 30, 179–185. [Google Scholar] [CrossRef]
  31. Hayton, J.C.; Allen, D.G.; Scarpello, V. Factor Retention Decisions in Exploratory Factor Analysis: A Tutorial on Parallel Analysis. Organ. Res. Methods 2004, 7, 191–205. [Google Scholar] [CrossRef]
  32. Hair, J.F.; Black, W.C.; Babin, B.J.; Anderson, R.E.; Tatham, R.L. Multivariate Data Analysis; Pearson Education: Upper Saddle River, NJ, USA, 2019; ISBN 978-1-4737-5654-0. [Google Scholar]
  33. Li, C.H. The Performance of ML, DWLS, and ULS Estimation with Robust Corrections in Structural Equation Models with Ordinal Variables. Psychol. Methods 2016, 21, 369. [Google Scholar] [CrossRef]
  34. Hu, L.T.; Bentler, P.M. Cutoff Criteria for Fit Indexes in Covariance Structure Analysis: Conventional Criteria versus New Alternatives. Struct. Equ. Model. Multidiscip. J. 1999, 6, 1–55. [Google Scholar] [CrossRef]
  35. Marsh, H.W.; Hau, K.-T.; Wen, Z. In Search of Golden Rules: Comment on Hypothesis-Testing Approaches to Setting Cutoff Values for Fit Indexes and Dangers in Overgeneralizing Hu and Bentler’s (1999) Findings. Struct. Equ. Model. Multidiscip. J. 2004, 11, 320–341. [Google Scholar] [CrossRef]
  36. Fornell, C.; Larcker, D.F. Evaluating Structural Equation Models with Unobservable Variables and Measurement Error. J. Mark. Res. 1981, 18, 39–50. [Google Scholar] [CrossRef]
  37. Mia, M.M.; Zayed, N.M.; Islam, K.M.A.; Nitsenko, V.; Matusevych, T.; Mordous, I. The Strategy of Factors Influencing Learning Satisfaction Explored by First and Second-Order Structural Equation Modeling (SEM). Inventions 2022, 7, 59. [Google Scholar] [CrossRef]
  38. Gonzaga-Domider, K.; Dalayap, R.H., Jr. Structural Equation Modelling of Students’ Difficulties in General Mathematics. Int. J. Res. Innov. Soc. Sci. 2025, 9, 2667–2694. [Google Scholar] [CrossRef]
  39. Flora, D.B.; Curran, P.J. An Empirical Evaluation of Alternative Methods of Estimation for Confirmatory Factor Analysis with Ordinal Data. Psychol. Methods 2004, 9, 466. [Google Scholar] [CrossRef]
  40. Henseler, J.; Ringle, C.M.; Sarstedt, M. A New Criterion for Assessing Discriminant Validity in Variance-Based Structural Equation Modeling. J. Acad. Mark. Sci. 2015, 43, 115–135. [Google Scholar] [CrossRef]
  41. Nunnally, J.C.; Bernstein, I.H. Psychometric Theory, 3rd ed.; McGraw-Hill: New York, NY, USA, 1994; ISBN 0070474656. [Google Scholar]
  42. Hayes, A.F.; Coutts, J.J. Use Omega Rather than Cronbach’s Alpha for Estimating Reliability. Commun. Methods Meas. 2020, 14, 1–24. [Google Scholar] [CrossRef]
Figure 1. Scree plot.
Sustainability 18 05398 g001
Figure 2. Path diagram of the CFA model of the SAS.
Sustainability 18 05398 g002
Table 1. Positioning of the SAS among Pakistani sustainability-related instruments.
StudyConstructSampleItems/DimensionsValidationKey Focus or Distinction
[18]Sustainability consciousness (KAB)Pre-service teachers 50; Env/Soc/EcoLimitedAssesses broader sustainability consciousness through KAB dimensions
[21]Sustainability awarenessTech students14; no defined dimensionsFace/content onlyFocuses on sustainability awareness among technology students
[20]Attitudes toward SDPre-service teachers20; Env/Eco/Soc/EduValidatedFocuses on attitudes toward sustainable development
[19]Environmental consciousness (K, A, beliefs, practices)Pre-service teachers64; 5 dimensionsEFA onlyExamines environmental consciousness among pre-service teachers
Present studySustainability awarenessPre-service teachers12; Env/Eco/SocEFA + CFA + validity + reliability (α, ω)Short, validated, multidimensional, SDG-aligned, teacher-specific
Table 2. Definitions and topics of SAS constructs.
ConstructConceptual DefinitionsKey Topics
Economic
dimension
Refers to economic processes that support sustainable growth, including employment, infrastructure, and productivity within long-term sustainability goals.Poverty reduction, local businesses and employment, reliable infrastructure, innovation and productivity
Environmental dimensionFocuses on the protection and responsible management of natural resources and ecosystems, including human impacts on climate and environmental sustainability.Climate change and human impact, waste reduction, population growth and resource depletion, pollution management
Social
dimension
Emphasizes equity, human rights, education, and well-being, promoting inclusive and just societies aligned with sustainable development goals.Human rights, gender equality, quality education, community well-being, infectious disease management
Table 3. Phases of SAS item development and content validity evaluation.
StageNumber of ItemsEvaluation OutcomeDecision
Initial item pool32Developed from SDGs, literature, and existing scalesSent for expert review
Expert screening 32 → 25Seven items rated not relevantRemoved
Content validity25S-CVI/Ave = 0.88Supported
Final items for survey25Consensus among experts after revisionRetained for EFA
Final SAS12Clear three-factor structureRetained in SAS
Table 4. Descriptive statistics of SAS (n = 289).
DimensionItemM (SD)
EconomicECO14.26 (0.76)
ECO24.28 (0.75)
ECO34.03 (0.80)
ECO44.18 (0.82)
Overall Mean4.18 (0.59)
EnvironmentalENV14.18 (0.84)
ENV24.08 (0.78)
ENV34.20 (0.80)
ENV43.87 (0.89)
Overall Mean4.08 (0.61)
SocialSOC14.14 (0.75)
SOC24.36 (0.78)
SOC34.06 (0.83)
SOC44.08 (0.96)
Overall Mean4.16 (0.62)
Table 5. Rotated factor matrix for the final 12 retained SAS items.
Factors
Item CodeSAS Items I Am Aware That:M (SD)123
ECOSA1Reducing poverty contributes to long-term economic growth4.27 (0.81)0.578
ECOSA2Local businesses contribute to employment and economic sustainability4.26 (0.84)0.842
ECOSA3Reliable infrastructure contributes to sustainable economic growth3.99 (0.86)0.451
ECOSA4Innovation and technology contribute to economic productivity4.19 (0.85)0.680
ENVSA1Human activities contribute to changes in the atmosphere and climate system4.18 (0.77) 0.502
ENVSA2Reducing household and industrial waste contributes to environmental sustainability4.06 (0.80) 0.668
ENVSA3Urbanization and population growth contribute to resource depletion and ecosystem degradation4.30 (0.77) 0.573
ENVSA4Preventing and managing pollution contributes to environmental sustainability3.91 (0.91) 0.603
SOCSA1Protecting human rights and promoting social equity contribute to social sustainability4.13 (0.80) 0.597
SOCSA2Equal opportunities for all genders contribute to social sustainability4.29 (0.81) 0.567
SOCSA3Inclusive, quality education contributes to social sustainability4.14 (0.81) 0.515
SOCSA4Managing major infectious diseases contributes to community well-being and stability4.07 (1.0) 0.510
Factors: (1) economic; (2) social; (3) environmental.
Table 6. EFA factor statistics and reliability estimates (n = 144).
(SAS)
Factors
M (SD)SS Loading% VarianceCronbach’s αMcDonald’s ω
Economic Sustainability4.19 (0.61)2.9918.70.8250.827
Environment Sustainability4.11 (0.59)2.5415.90.7600.762
Social Sustainability4.15 (0.61)2.2914.30.7480.754
Total4.18 (0.51) 48.90.8970.900
Table 7. Goodness-of-fit indices for the CFA model of the SAS.
ModelNχ2(df)pχ2/dfRMSEA90% CI RMSEASRMRCFITLI
CFA14585.8 (51)0.0021.680.068[0.042, 0.093]0.0560.930.91
Table 8. Standardized loadings, standard errors, and significance levels for the CFA model of SAS.
ConstructItemStand. LoadingsSEzp
EconomicECOSA10.5760.05806.51<0.001
ECOSA20.6120.06627.25<0.001
ECOSA30.6440.07217.32<0.001
ECOSA40.7660.06329.64<0.001
EnvironmentalENVSA10.7950.067510.08<0.001
ENVSA20.5180.07365.93<0.001
ENVSA30.6610.06358.00<0.001
ENVSA40.5300.08035.75<0.001
SocialSOCSA10.6810.06338.04<0.001
SOCSA20.7420.06569.47<0.001
SOCSA30.6500.06857.90<0.001
SOCSA40.6920.08257.93<0.001
Table 9. Convergent validity of the SAS.
ConstructCRAVE
Economic0.7150.489
Environmental0.7370.508
Social0.7800.569
Table 10. Discriminant validity (HTMT) of the SAS.
Construct PairsHTMT
Eco-Env0.78
Eco-Soc0.83
Env-Soc0.81
Table 11. Latent factor correlations for the CFA model of the SAS.
ConstructsEconomicEnvironmentalSocial
Economic1.0000.7350.773
Environmental0.7351.0000.765
Social0.7730.7651.000
Table 12. Reliability of the SAS (n = 289).
DimensionCronbach’s Alpha αMcDonald’s Omega ω
Economic awareness0.7410.742
Environmental awareness0.7260.729
Social awareness0.7380.742
Full Scale0.8720.875
Disclaimer/Publisher’s Note: The statements, opinions and data contained in all publications are solely those of the individual author(s) and contributor(s) and not of MDPI and/or the editor(s). MDPI and/or the editor(s) disclaim responsibility for any injury to people or property resulting from any ideas, methods, instructions or products referred to in the content.