Article

Research on Windbreak and Sand-Fixing Ecosystem Service Flow for Ecological Sustainability Based on the HYSPLIT Model—A Case Study of Northern Hebei Mountainous Area

1
Key Laboratory of Coupling Process and Effect of Natural Resources Elements, Ministry of Natural Resources, Beijing 100055, China
2
Integrated Natural Resources Survey Center, China Geological Survey, Beijing 100055, China
3
School of Artificial Intelligence, China University of Geosciences, Beijing 100083, China
*
Author to whom correspondence should be addressed.
Sustainability 2026, 18(11), 5327; https://doi.org/10.3390/su18115327
Submission received: 1 March 2026 / Revised: 21 April 2026 / Accepted: 14 May 2026 / Published: 25 May 2026

Abstract

As a core and priority region of the Beijing-Tianjin Sandstorm Source Control Project, the mountainous area of northern Hebei plays a critical role in restraining desertification and ensuring the ecological security and sustainable development of the capital region. To reveal the ecosystem service flow mechanism of windbreak and sand fixation and support regional ecological sustainability, this study first used the Revised Wind Erosion Equation (RWEQ) to evaluate the spatial distribution of windbreak and sand-fixation services in northern Hebei mountainous area. Then, the HYSPLIT model was applied to simulate the spatial flow paths, identify the radiation scope, and quantify the radiation intensity of these ecosystem services. The results reflect the modeled patterns under given assumptions rather than fully verified actual ecosystem service supply. In 2024, the total amount of windbreak and sand-fixation service in the study area reached 10.3553 × 10⁶ tons. Sand-dust weather mainly occurred in spring and autumn, accounting for 39.23% and 33.46% of the total, respectively. The spatial flow paths were dominated by the northwest pathway (43.01%) and west pathway (38.17%). The total radiation scope of windbreak and sand-fixation services was 396.16 × 10⁴ km2, among which 342.96 × 10⁴ km2 was within the study area, accounting for 86.57%. The average service density was 21.06 kg/hm2. The service density along flow paths decreased with increasing transport distance, while the radiation scope expanded with the increase in trajectory frequency. Spatially, the sand-fixation material density showed a circular decreasing trend from the center to the periphery of the study area. This study clarifies the flow characteristics and radiation benefits of windbreak and sand-fixation ecosystem services, which can provide a scientific basis for regional ecological protection, ecosystem service management, and the promotion of regional ecological sustainability.

1. Introduction

Regions with low vegetation coverage, high desertification sensitivity, and severe land desertification are prone to sand-dust weather and even sandstorms. When a sandstorm strikes, sand and dust diffuse along the transmission path, resulting in a large amount of sand and dust suspended in the atmosphere, which causes air pollution. This not only endangers human physical and mental health but also leads to huge economic losses. Windbreak and sand-fixation service refers to the role of vegetation in ecosystems in inhibiting sand and dust emission and fixing surface soil, thereby reducing the frequency and harm of sand-dust weather [1]. The core of windbreak and sand-fixation service flow is the correlation between the effective flow of windbreak and sand-fixation services and the degree of mutual influence between supply areas and benefit areas [2].
At present, commonly used models for particle trajectory simulation include the Weather Research and Forecasting (WRF) model [3], the Global Environmental Multiscale (GEM) model [4], the Community Multiscale Air Quality (CMAQ) model [5], and the HYSPLIT model [6]. Among these models, the WRF, GEM, and CMAQ models have stringent requirements for simulation data and yield high-precision simulation results, but they are characterized by high operational difficulty and thus are not suitable for research on the diffusion of ecosystem services (e.g., windbreak and sand-fixation) mediated by gas [7]. In contrast, the HYSPLIT model features relatively simple operation and strong practicality [8]. In recent years, to more efficiently investigate issues such as harmful gas and sand-dust diffusion, researchers have conducted secondary development on the HYSPLIT model to develop the Trajectory module, which has been widely applied in diffusion studies of various pollutants [9,10], such as sand dust [6,11], PM2.5 [12]. Notably, the HYSPLIT model can not only realize source tracing analysis of sand-dust particles but also accurately determine the transmission distance and direction of sand-dust particles and pollutants in the atmosphere [13].
By combining the RWEQ and HYSPLIT models, this study achieves a breakthrough in wind prevention and sand-fixation services from “quantity assessment” to “flow simulation”, and accurately identifies the service radiation scope and differences among beneficiary areas. However, these results are modeled indicative patterns rather than empirically validated facts. Some limitations remain: simplified treatment of certain underlying surface factors during model simulation may cause slight deviations between simulated trajectories and actual conditions; differential impacts of vegetation types and coverage on sand-fixing service flows were not considered. Future research can integrate high-resolution remote sensing data and field monitoring to optimize model parameters, and conduct spatiotemporal dynamic analyses of sand-fixing services to further reveal their driving mechanisms.
The mountainous region of northern Hebei is the core area of the ecological barrier in the Beijing–Tianjin–Hebei region and is located in the key area of the Beijing-Tianjin Sandstorm Source Control Project, playing an irreplaceable role in curbing the expansion of desertified land and safeguarding the ecological security of the capital. In recent years, the Chinese government has significantly improved the vegetation coverage in this region through ecological projects such as the Three-North Program [14]. However, under the combined influence of climate change and human activities, some local areas still face problems such as intensified wind erosion and complex sand-dust transmission paths. Especially against the background of the “Beijing-Tianjin-Hebei Coordinated Development” strategy and the “dual carbon” goals, how to quantify the spatial radiation effect of windbreak and sand-fixation services and accurately identify priority areas for ecological protection has become a key scientific issue for optimizing the regional ecological compensation mechanism and implementing the “Master Plan for Major Projects of Protection and Restoration of National Important Ecosystems”. Taking the ecosystem of the mountainous region of northern Hebei as the research object, this study used the HYSPLIT model to simulate the forward air mass trajectories within 72 h under the condition that the wind speed in the study area was greater than the sand-driving wind speed. The purpose is to identify the radiation scope of windbreak and sand-fixation services and quantify their radiation effects, so as to provide a scientific basis for the formulation of regional ecological compensation policies and the industrial structure layout in the downwind areas [15,16].

2. Study Area and Research Methods

2.1. Study Area

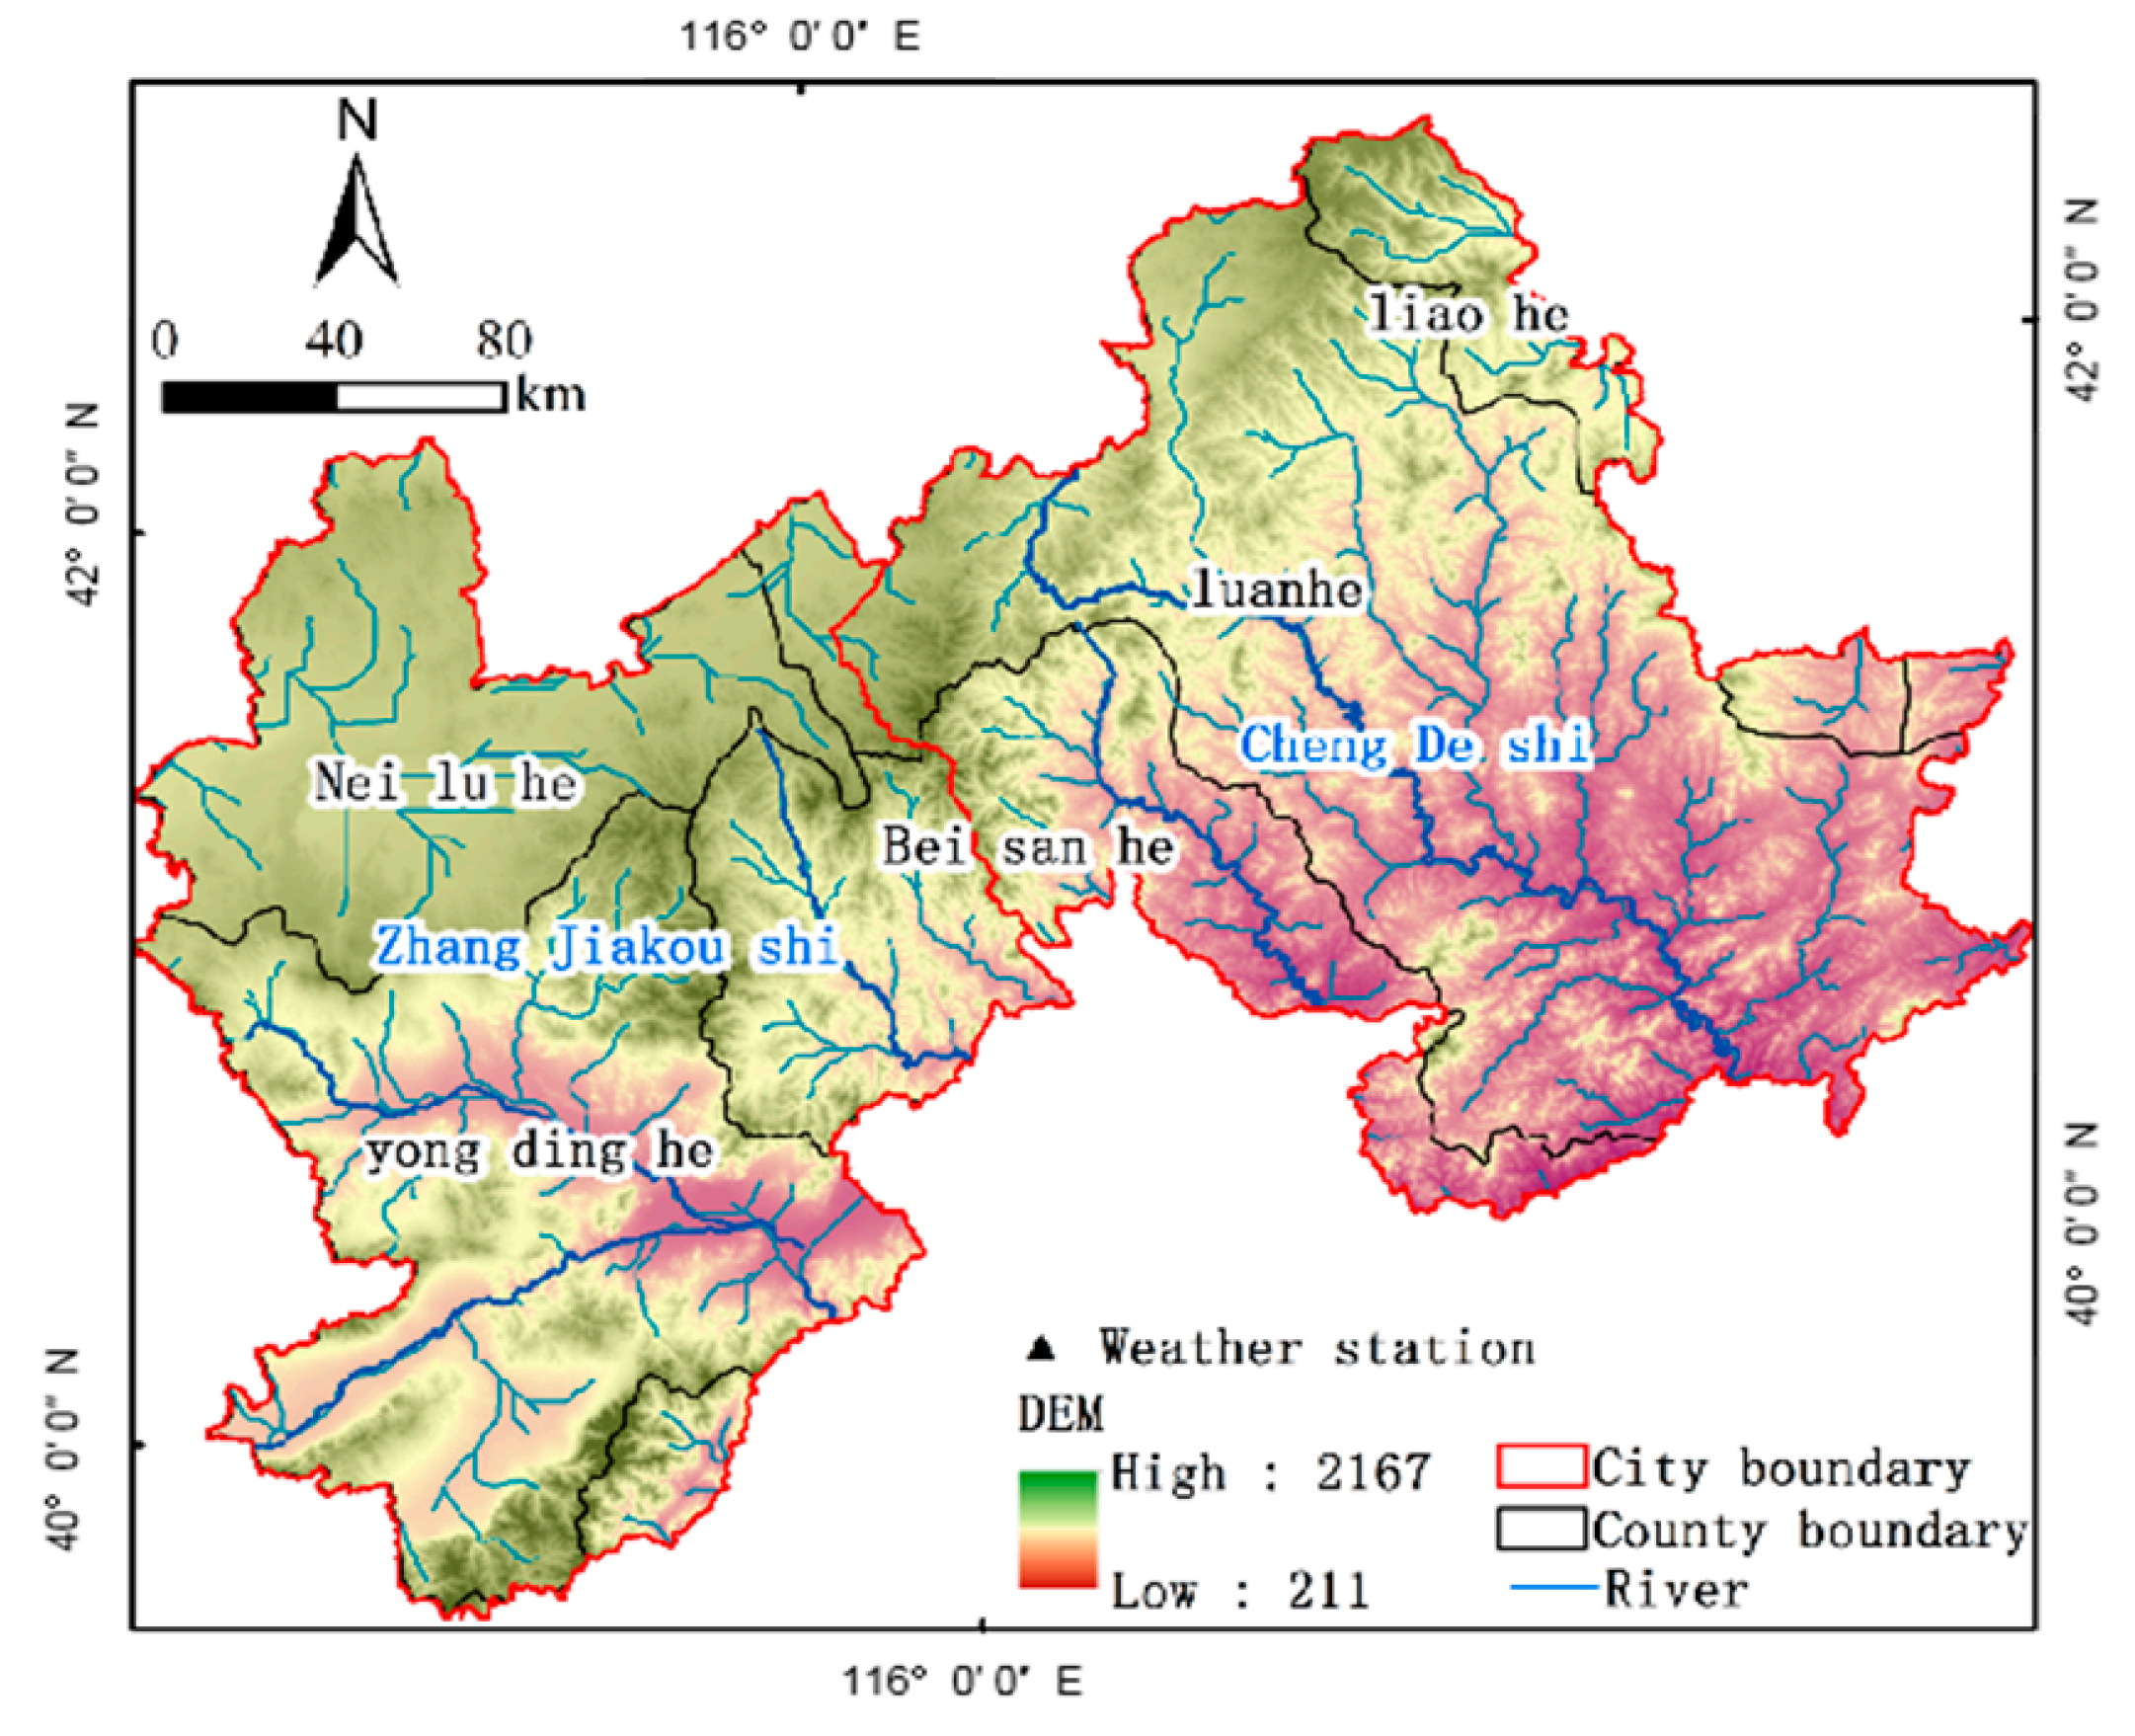
Zhangjiakou City and Chengde City (“northern Hebei region”) are located in northern Hebei Province, with geographical coordinates ranging from 113°50′ E to 119°15′ E and 39°18′ N to 42°37′ N (Figure 1). They are situated in the forest–steppe transition zone and adjacent to the agro-pastoral ecotone. The terrain of this region decreases stepwise from northwest to southeast, with three landform types: Bashang Plateau, northern Hebei Mountains, and loess hills in northwestern Hebei [17,18]. It belongs to a temperate continental monsoon climate zone with distinct four seasons [18]. The annual average precipitation in the Bashang Plateau area is 300–400 mm, and the annual average evaporation is 1400–1700 mm; the annual average precipitation in the mountainous area south of the Bashang Plateau is 430–600 mm, and the annual average temperature is 5–9 °C. There are five major river systems in Zhangjiakou City, namely the Yongding River, Chaobai River, Daqing River, Luan River, and inland rivers, while four major river systems (Luan River, North Three Rivers including Chaobai River, Bai River, and Jiyun River, Liao River, and Daling River) are distributed in Chengde City [19].
The northern Hebei region is located at the intersection of three major ecological functional zones in the capital ecological circle, namely water supply, windbreak and sand-fixation, and soil and water conservation, with extremely important ecological location [20,21,22,23,24]. As the upper wind and upper water area of the Beijing–Tianjin region, it serves as an important ecological barrier for maintaining the ecological security of the capital. Its unique geographical location and climatic characteristics further consolidate its role as a natural ecological barrier for Beijing and Tianjin, enabling it to undertake the core functions of maintaining regional ecological security and windbreak and sand-fixation [18].

2.2. Data Sources

The data required for this study include land use, meteorological, topographic vegetation and reanalysis data. The sources and specific contents of various types of data are as follows (Table 1): Land use data were obtained from the Earth Resource Data Cloud Platform (http://www.gis5g.com/), adopting a secondary classification system, including 6 first-level categories and 25 second-level categories, with a resolution of 1000 m. Due to objective constraints such as the integrity of site observations, data quality control, and consistency of the study period, this study only uses meteorological data for the single year of 2024. Both elevation and vegetation data have a resolution of 250 m in 2024 and are also derived from the Earth Resource Data Cloud Platform. Wind speed data were acquired from the National Meteorological Science Data Center (https://data.cma.cn/ (accessed on 28 February 2026)), which are the 10 min maximum wind speed data per hour from 1 January to 31 December 2024, with a time interval of 3 h. NCEP reanalysis data were obtained from the Air Resources Laboratory of the National Oceanic and Atmospheric Administration (NOAA), which are the 6-hourly GDAS data from January 2024 to January 2025, with a spatial resolution of 1° × 1°.

2.3. Research Methods

This study integrated the RWEQ model and the HYSPLIT forward model to systematically simulate the flow trajectories of windbreak and sand-fixation services in the northern Hebei region.

2.3.1. RWEQ Model

The RWEQ model comprehensively considers multiple influencing factors such as climate, soil, vegetation and can realize dynamic and quantitative evaluation of soil wind erosion in the study area [19]. Formula as follows:
  SL   =   2 z S 2 Q max   ×   e ( z / s ) 2
Q max = 109.8   ×   ( WF   ×   EF   ×   SCF   ×   K   ×   C )
s = 150.71   ×   ( WF   ×   EF   ×   SCF   ×   K   ×   C ) 0.3711
SR = 2 z Sr 2 Q max   ×   e ( z / s ) 2
Q rmax = 109.8   ×   ( WF   ×   EF   ×   SCF   ×   K )
sr = 150.71   ×   ( WF   ×   EF   ×   SCF   ×   K ) 0.3711
G = SR SL
In the formulas, SL is the wind erosion amount (kg/m2); Q max is the maximum sand transport capacity of wind (kg/m); S is the length of key plots (m); SR is the potential wind erosion amount (kg/m2); Q rmax is the potential maximum and transport capacity of wind (kg/m); Sr is the potential length of key plots (m); G is the mass of windbreak and sand-fixation materials (kg/m2); z is the calculated downwind distance (m), which is set to 50 m in this study; WF is the climate factor (kg/m); EF is the soil erodibility factor; SCF is the soil crust factor; K′ is the soil roughness factor; C is the vegetation factor.
(1)
WF
w s f = v 2 × ( v 2 v 1 ) 2 × d p m
WF = wsf   ×   ( ρ / g )   ×   soilw   ×   snowd
In the formula, WF is the climate factor; wsf is the wind force factor; ρ is the air density; g is the gravitational acceleration; snowd is the snow cover factor (number of days without snow cover/total number of study days), and a snow cover depth of less than 2.54 cm is considered as no snow cover. v 2 is the monthly average wind speed; v 1 is the sand-driving wind speed, set to 6 m/s in this study. dpm is the number of days per month when the wind speed exceeds the sand-driving wind speed [19]. For the wind speed data used in the RWEQ model, the method adopted is to combine the wind speed data from meteorological stations with the interpolation software ANUSPLIN 4.1 to obtain the grid data of wind speed.
(2)
SCF
The soil crust factor (SCF) refers to the resistance of the soil crust to wind erosion under specific soil physicochemical conditions [19].
E F = ( 29.09 + 0.31 Sa + 0.17 Si + 0.33 Sa / cL 2.59 OM 0.95 CaCO 3 ) × 100
SCF = 1 / ( 1 + 0.0066 ( cl ) 2 + 0.021 ( OM ) 2 )
Among them, Sa is the soil sand content; Si is the soil silt content; cl is the clay content; OM is the organic matter content; CaCO3 is the calcium carbonate content; all of which are calculated based on the HWSD soil data.
(3)
C
With reference to relevant literature [16], this study adopted NDVI to calculate the vegetation factor; the formula is as follows:
C = e 0.0483 ( NDVI     NDVI min NDVI max     NDVI min )
In the formula, NDVI ,   NDVI min ,   NDVI max represent the actual value, minimum value, and maximum value, respectively.
(4)
K′
K′ = cos α
In the formula, α represents the slope gradient, which is calculated based on DEM data. Meanwhile, the windbreak and sand-fixation retention rate F was adopted to characterize the sand-fixation contribution rate of the ecosystem; the formula is as follows:
F   =   G SR

2.3.2. HYSPLIT Model

The HYSPLIT model assumes that particles such as sand and dust in the atmosphere move with air mass trajectories, and defines the movement displacement of sand and dust particle trajectories as their line integral in time and space [6,7,23]. Taking meteorological monitoring stations as the starting positions of trajectories, the core calculation steps are divided into two position estimations; the formula is as follows:
First Estimated Position:
p ( t   +   Δ t ) = p ( t ) + V ( p , t ) × Δ t
Final Position:
  p ( t   +   Δ t )   =   p ( t )   +   0.5   ×   [ V ( p , t )   +   V ( p , t   +   Δ t ) ]   ×   Δ t
In the formula, p ( t ) is the initial position of sand-dust particles; V ( p , t ) is the velocity vector of sand-dust particles when they start moving from the initial position; Δ t is the integral time step; V ( p , t   +   Δ t ) is the line vector of the first estimated position of sand-dust particles [6,16]. Although the integral time step will change, the product of the time step and the maximum velocity (Vmax) of sand-dust particle transmission needs to be lower than the data grid cell (Lg) [6,25]. The formula is as follows:
V max   ×   Δ t   <   L g
The vertical meteorological data need to define the coordinate system according to the terrain; the formula is as follows:
σ = Z top Z msl Z top     Z gl
Among them: Ztop represents the top coordinate of sand-dust particle trajectory simulation; Zgl represents the terrain height; Zmsl represents the minimum coordinate of particle trajectory simulation.
In the HYSPLIT forward trajectory simulation, the sand-dust particle simulation height and forward trajectory movement time parameters directly affect the accuracy of trajectory simulation [26]. Studies have shown that long-distance transport of pollutants in the atmosphere mostly occurs at 300 m above urban areas, while short-distance transport mostly occurs below 100 m [27]. Therefore, this study selected 300 m as the particle simulation height, which can not only represent the characteristics of the surface layer but also reflect the law of long-distance pollutant transport [28,29]. Meanwhile, drawing on the experience of previous studies, the air flow trajectory was simulated for 3 days (72 h) to reflect the transport characteristics of pollutants in the study area.

2.3.3. Simulation and Scope Identification of Windbreak and Sand-Fixation Flow Paths

To truly reflect the spatial flow paths and overall status of windbreak and sand-fixation services in the northern Hebei region, this study selected monitoring data from 6 meteorological stations in the northern Hebei region, namely Weichang, Fengning, Yangyuan, Zhangbei, Guyuan, Shangyi, as the starting points of sand-dust paths. Combined with NCEP reanalysis data, the HYSPLIT model was used to simulate the forward diffusion trajectories of air masses within 72 h when the wind speed at each station was greater than the sand-driving wind speed. The simulated trajectories of the 6 meteorological stations were superimposed as the overall movement trajectory of the windbreak and sand-fixation services of the ecosystem in the northern Hebei region.
Based on this, using the HYSPLIT model, the Trajectory module of Meteoinfo 3.6 software, and the NCEP reanalysis data provided by NOAA, the forward trajectories of sand and dust within 72 h under the sand-driving conditions in the study area were simulated. The distribution frequency of sand and dust transport pathways within the grid serves as an indicative measure of the extent to which the beneficiary population within this area benefits from windbreak and sand-fixation services. A higher distribution frequency of wind-sand trajectories signifies more pathways through which wind-sand flows pass, indicating greater ecosystem service benefits.
PSCF i = L i L
In the formula, PSCF i is the sand-dust path distribution frequency of i grid; L i is the number of paths passing through i grid; L is the total number of sand-dust paths at the starting points. This study assumes that under the conditions of bare surface and no windbreak and sand-fixation function, sand and dust flow naturally with the air flow, and all areas passed by its trajectory are the benefit areas of windbreak and sand-fixation services.
When the number of trajectories in a certain grid is small, the simulation results have great uncertainty [30]. With reference to relevant studies, when the number of trajectory endpoints (Li) in a grid is less than three times the average number of trajectory endpoints of all grids in the study area [31,32,33,34,35], a weight function (Wi) was adopted to reduce the uncertainty of the research results; the formula is as follows:
W i = { 1.00 ,   80   <   L i   0.70 ,   20   <   L i     80 0.42 ,   10   <   L i     20 0.05 ,   L i     10 }
Based on the weight function, the Potential Source Contribution Function (PSCF) was weighted and calculated to obtain the Weighted Potential Source Contribution Value (WPSCF). The formula is as follows:
WPSCF i   =   PSCF i   ×   W i
A larger WPSCF i value indicates a higher concentration of sand-dust particles in the grid and a greater impact on the particulate matter concentration at the monitoring points. This study conducted a spatial interpolation analysis of air flow paths for windbreak and sand-fixation services, and associated air mass trajectories with dust transport pathways by integrating WPSCF values, thereby quantifying potential ecosystem service flows under hypothetical conditions.

2.3.4. Estimation of Service Material Quantity for Windbreak and Sand Consolidation

The distribution frequency of sand trajectories is considered to be positively correlated with the amount of sand carried. The estimation of windbreak and sand-fixation mass can be based on the distribution frequency of sand movement trajectories: first calculate the trajectory distribution frequency at the grid scale, and then allocate the mass according to the area proportion [6,7]. Therefore, the higher the distribution frequency of the flow path of windbreak and sand-fixation services, the greater the corresponding material flow [8]. The calculation formula for the windbreak and sand-fixation mass is as follows:
P L i   =   G   ×   WPSCF i
where P L i is the total windbreak and sand-fixation mass fixed on grid unit i in the benefit area (kg/m2); G is the total windbreak and sand-fixation service mass [6,7,8]. The regions covered by air mass trajectories were gridded, and a trajectory frequency distribution map with a grid resolution of 0.25° × 0.25° was finally generated [6].

3. Results and Analysis

3.1. Spatial Distribution Pattern of Windbreak and Sand-Fixation Services

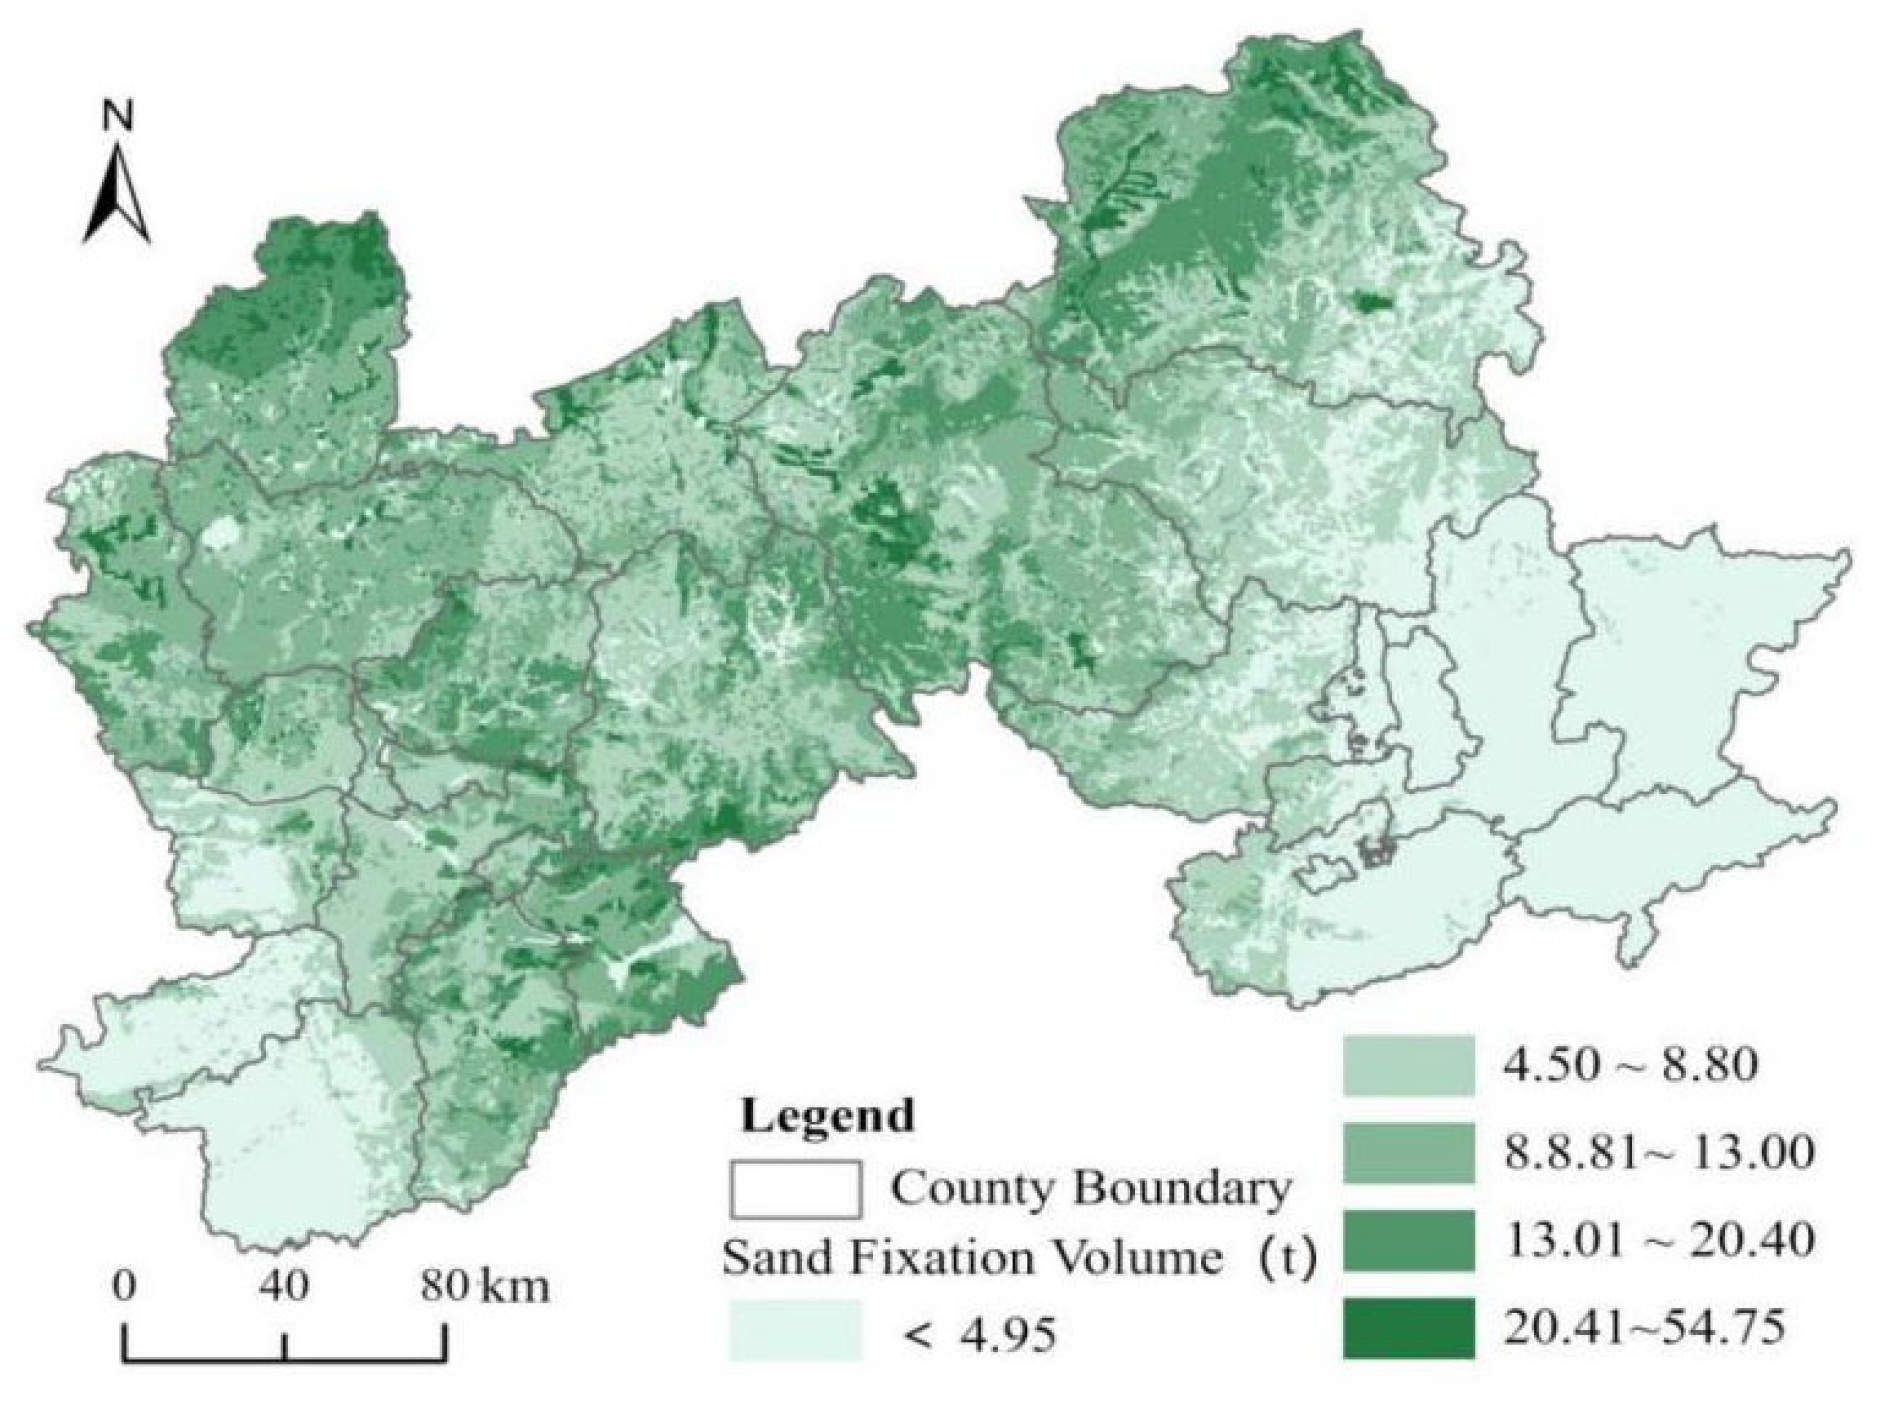
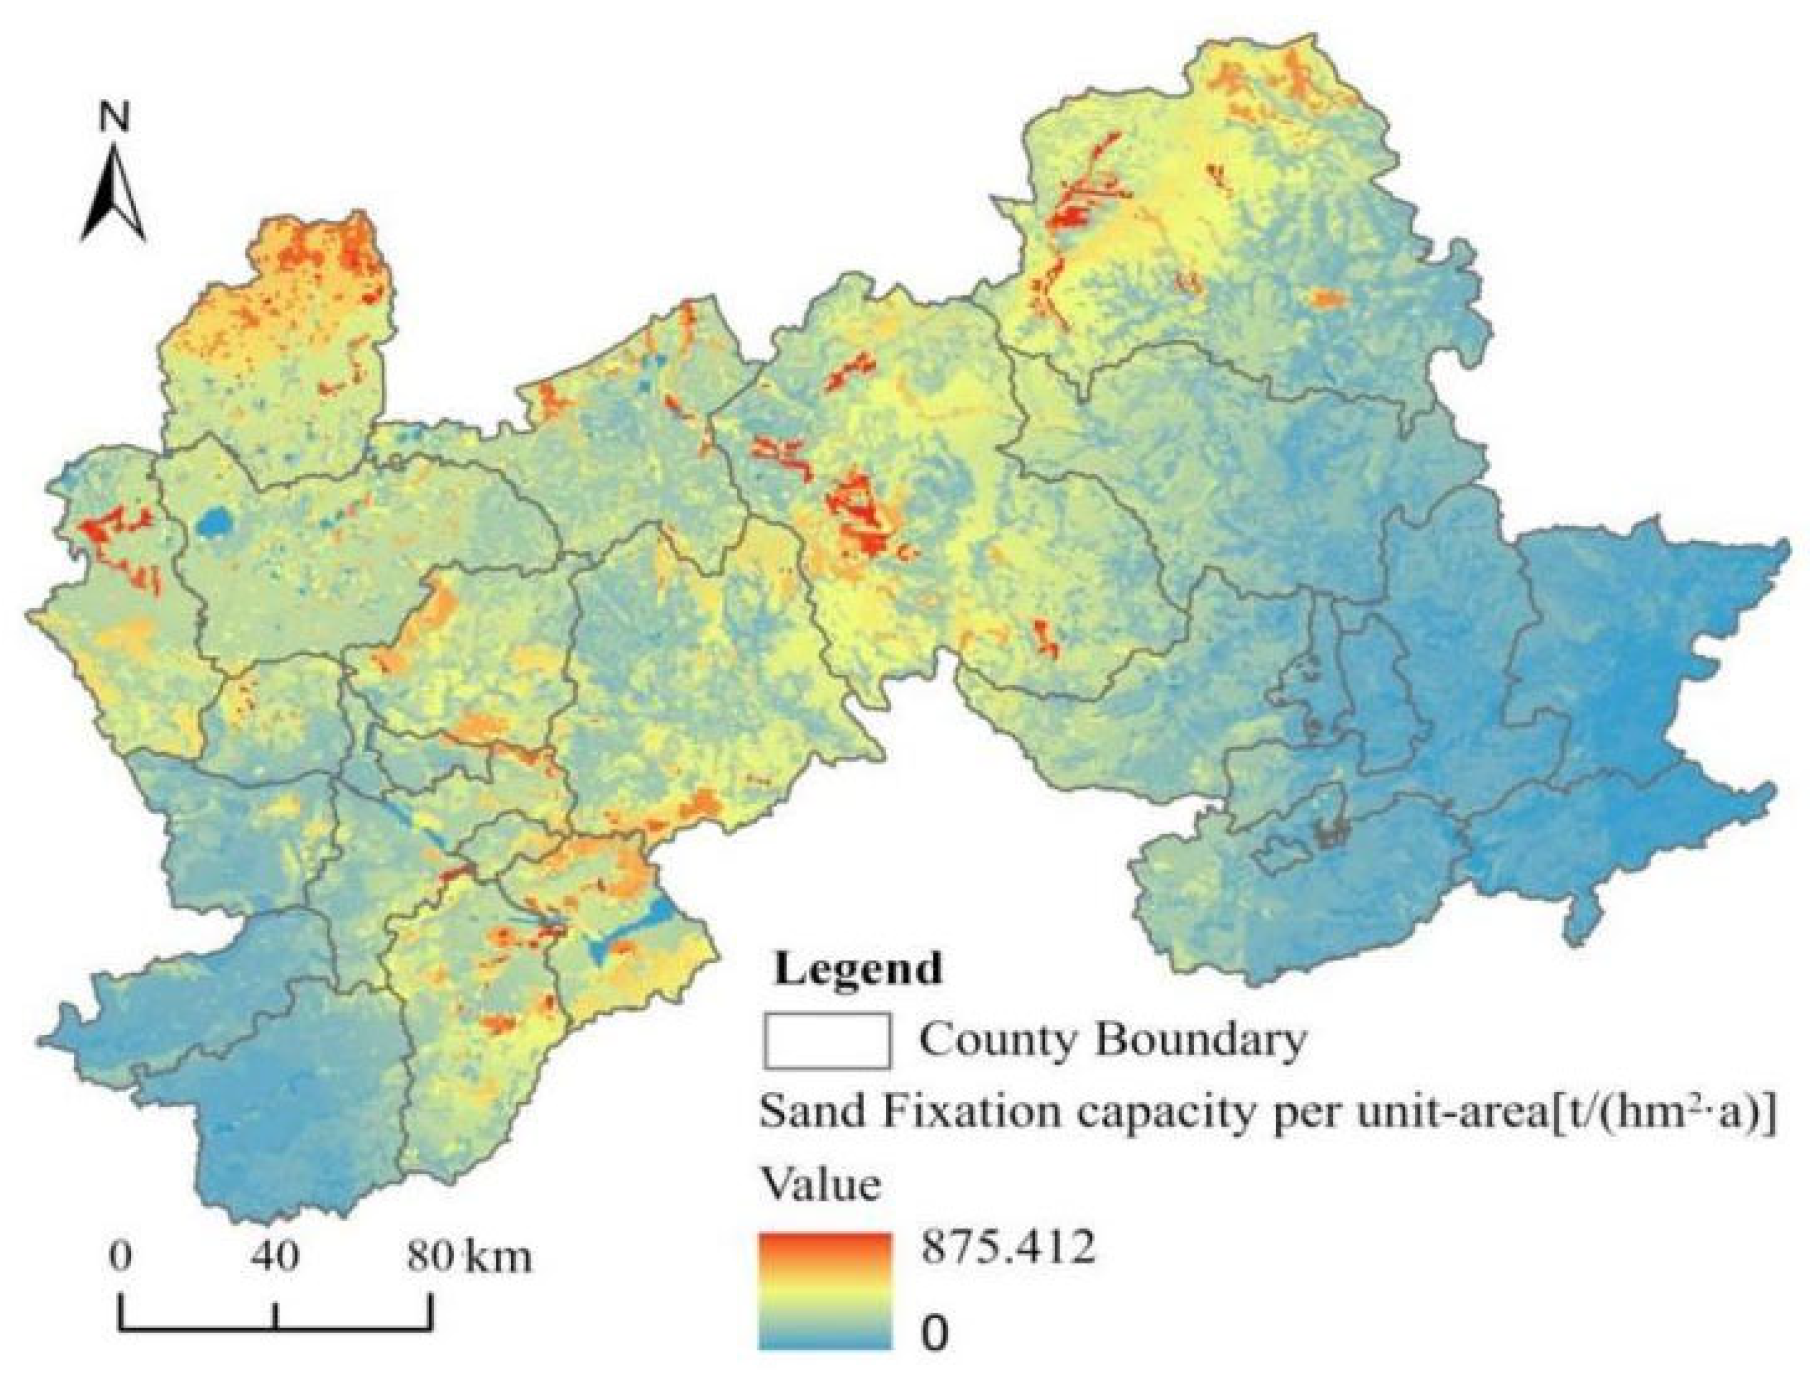
The RWEQ model was used to quantitatively estimate the windbreak and sand-fixation function in the city of Zhangjiakou and Chengde (Figure 2 and Figure 3). These are modeled spatial patterns under given assumptions. The results showed that the total windbreak and sand-fixation amount in the study area reached 1035.53 × 104 t in 2024, with the per unit area windbreak and sand-fixation amount of 1.36 t/hm2. From the perspective of the total windbreak and sand-fixation amount at the county scale, Fengning County ranked first with 155.53 × 10⁴ t, followed by Weichang County (152.78 × 10⁴ t), Chicheng County (85.91 × 10⁴ t), and Kangbao County (79.02 × 10⁴ t). Qiaodong District, Qiaoxi District, Shuangqiao District, Shuangluan District, and Yingshouyingzi District had the lowest windbreak and sand-fixation amounts, which were 5.14 × 10⁴ t, 2.84 × 10⁴ t, 2.69 × 10⁴ t, 2.38 × 10⁴ t, and 0.73 × 10⁴ t, respectively. In terms of spatial distribution characteristics, the overall windbreak and sand-fixation capacity of Zhangjiakou and Chengde presented a pattern of “higher in the Yanshan Mountains and the northwest, and lower in the southwest and southeast”. The local high-value areas were mainly concentrated near the Luan River, Chaobai River, Liao River, Daling River, and inland river basins. These areas had abundant water sources and good vegetation irrigation conditions, which could effectively block the movement of sand and dust; thus, the windbreak and sand-fixation capacity was significantly higher than that of the surrounding areas.

3.2. Simulation of Windbreak and Sand-Fixation Service Flow Paths

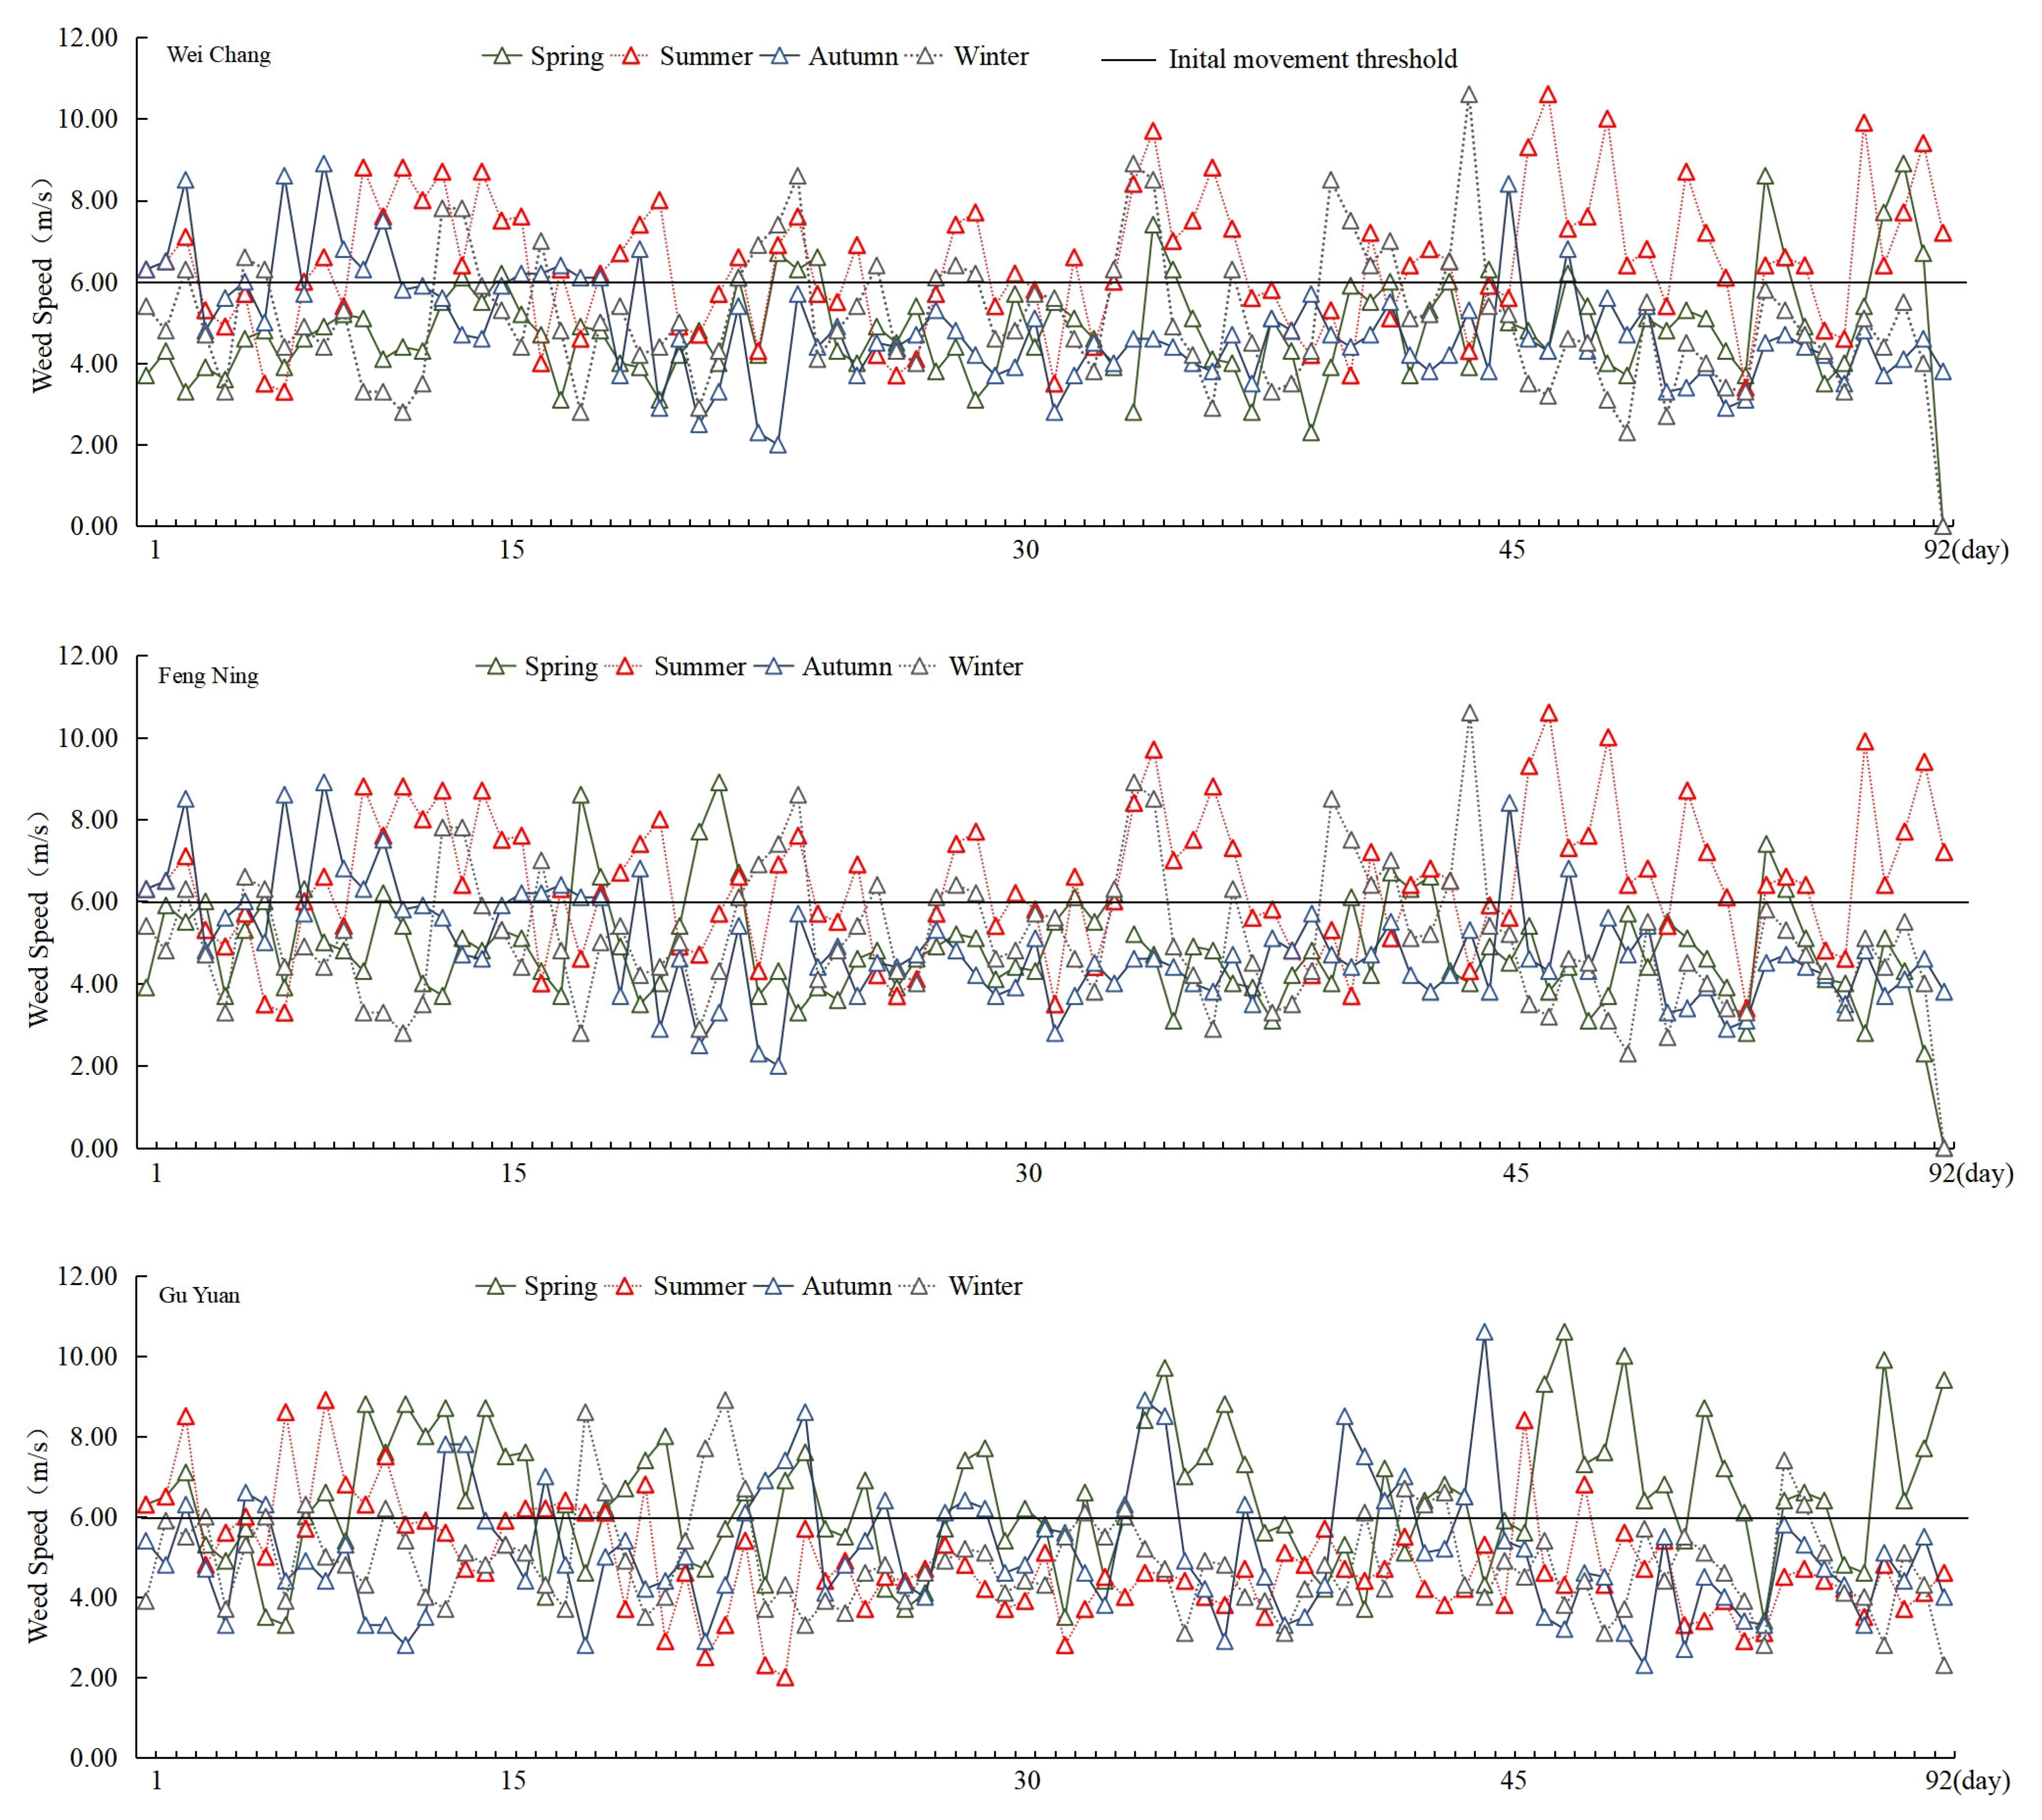
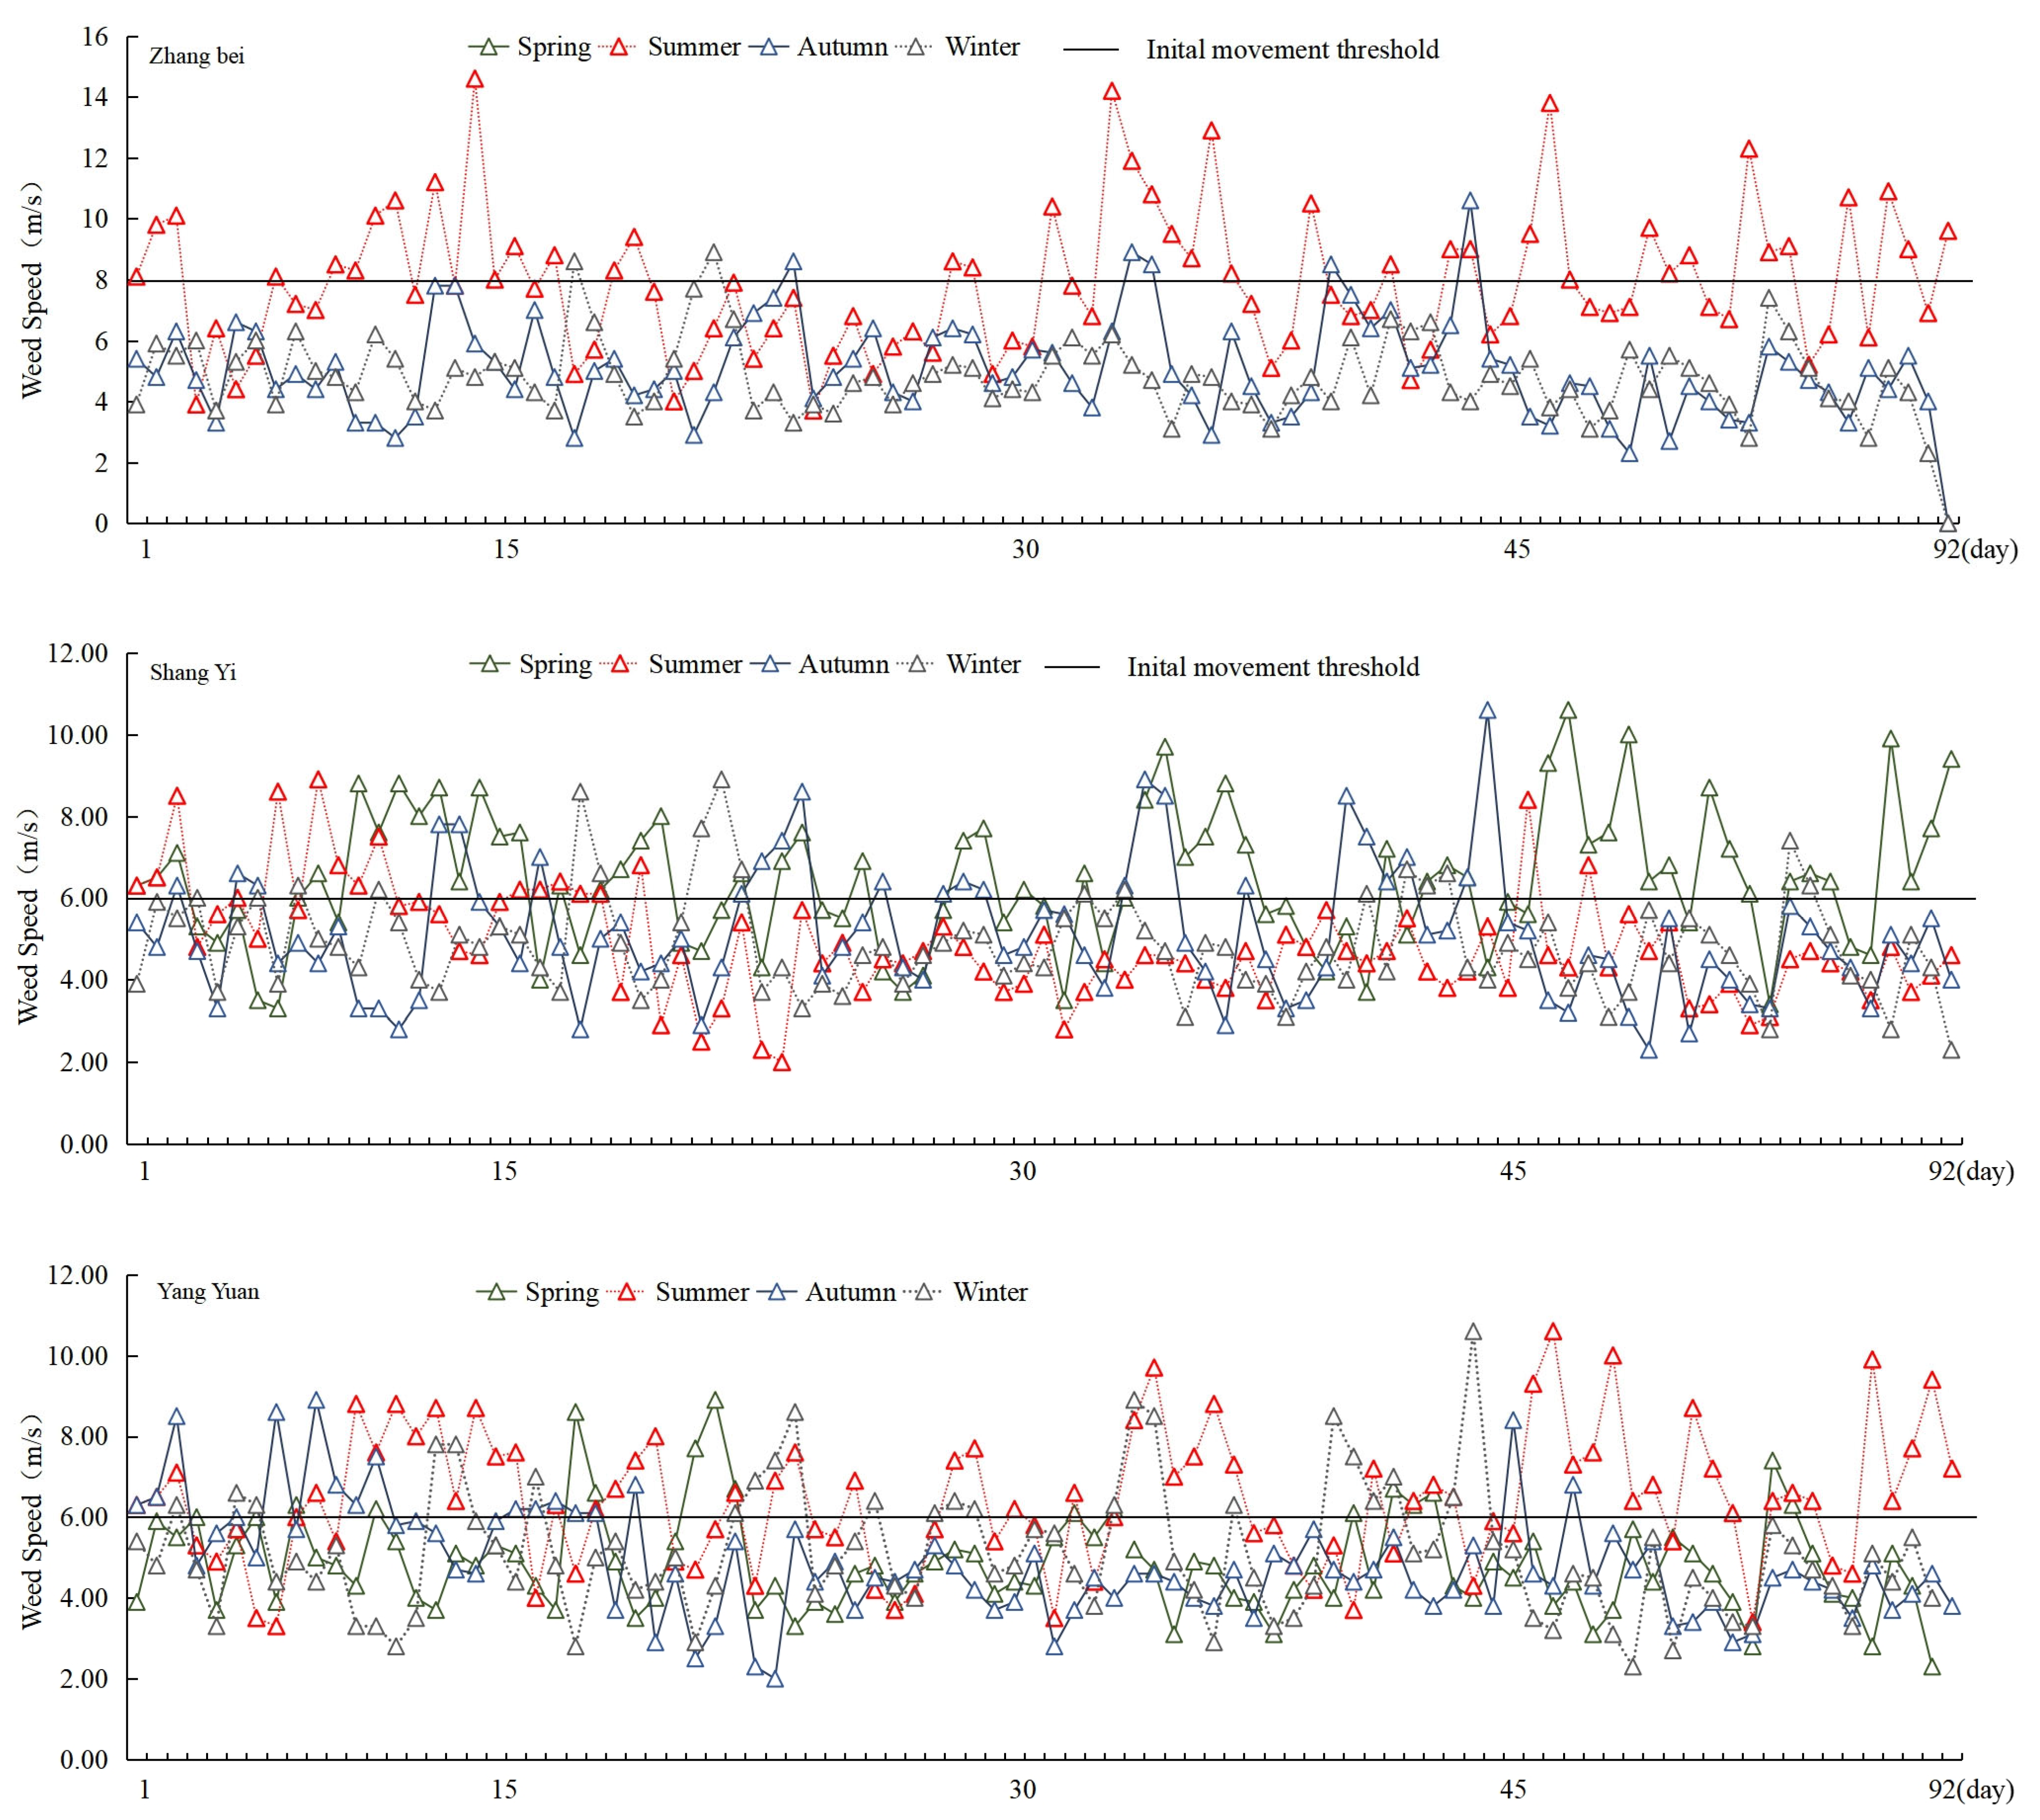
Based on the monitoring data statistics from the China Meteorological Data Network, the 3-hourly wind speed observation records of Weichang Station, Fengning Station, Guyuan Station, Zhangbei Station, Shangyi Station, and Yangyuan Station in 2024 were 2448, 2357, 2338, 2459, 2454, and 2449, respectively. The daily average wind speeds at each station were 1.89 m/s, 2.91 m/s, 2.34 m/s, 3.84 m/s, 2.39 m/s, and 2.47 m/s in turn; the daily maximum wind speeds were 9.54 m/s, 15.03 m/s, 14.31 m/s, 18.18 m/s, 15.21 m/s, and 13.14 m/s, respectively; the number of wind speed records exceeding the sand-driving wind speed (≥6 m/s) was 103, 264, 167, 239, 203, and 177, respectively (Figure 4).
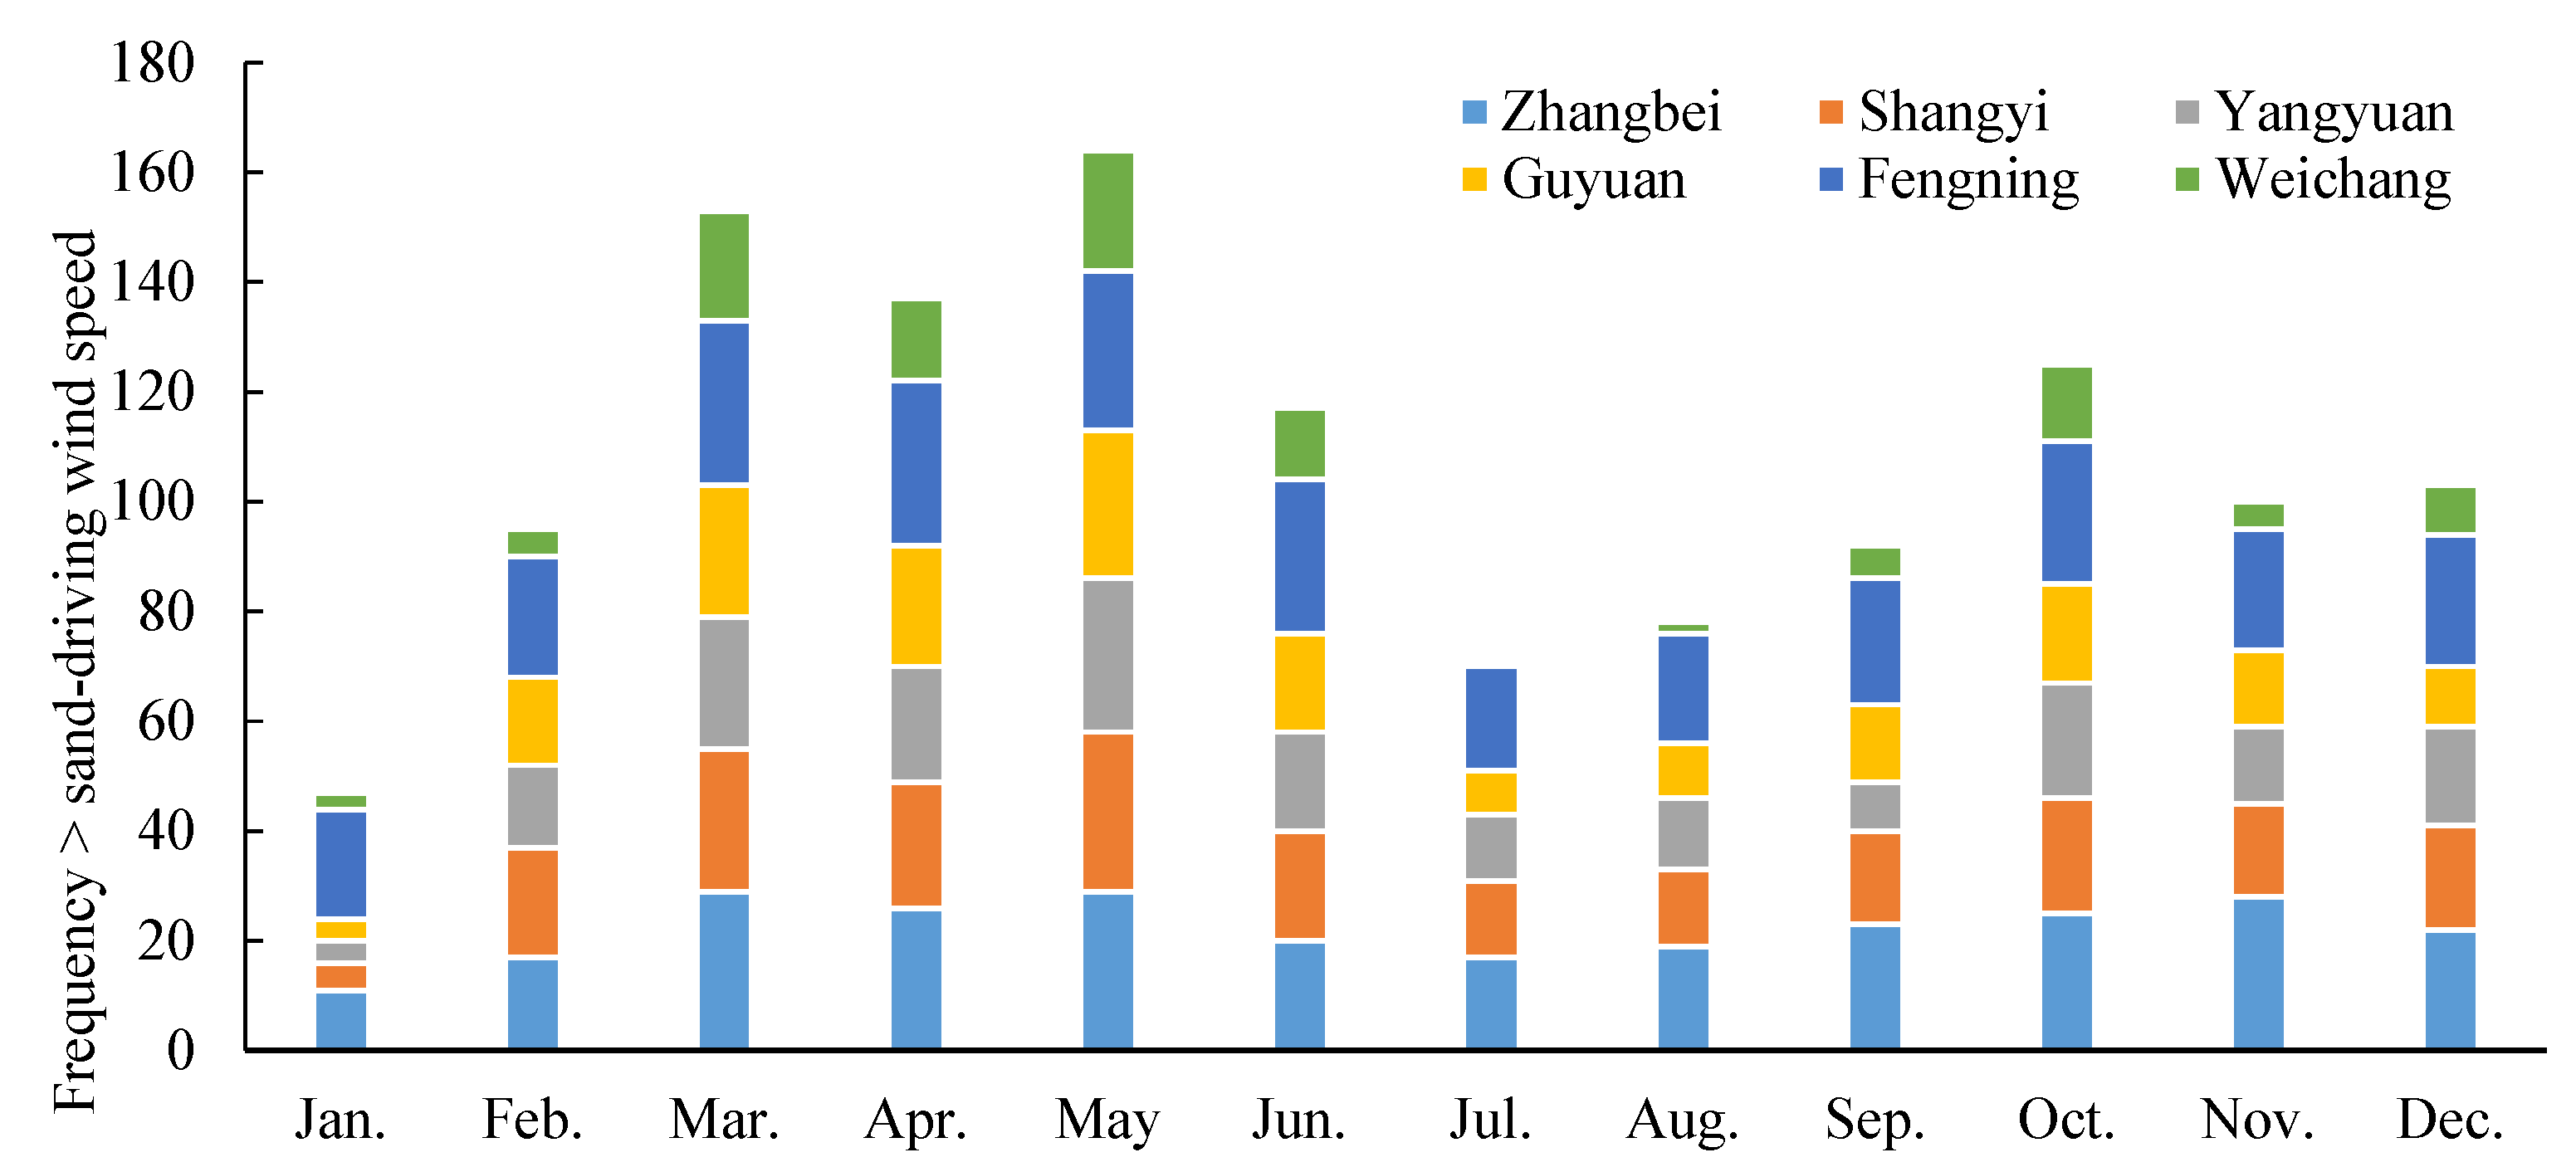
Comprehensive analysis of the wind speed data from the six stations showed that a total of 14,505 3-hourly wind speed observation records were obtained in 2024, of which 1153 records exceeded the sand-driving wind speed, corresponding to 1153 sand-dust transmission paths (Figure 5). There were differences in the temporal distribution of sand-driving wind speed at each station: the sand-driving wind speed at Zhangbei Station was mainly concentrated in March–May and October–November; at Shangyi Station, Yangyuan Station, and Weichang Station, it was mainly concentrated in March–May and October; at Guyuan Station and Fengning Station, it was mainly concentrated in March–June. Overall, the sand-driving wind speed in the northern Hebei region mainly occurred in March–June and October–November, among which the frequency of sand-driving wind speed was the highest in spring (March–May). The occurrence frequencies of sand-dust transmission paths in spring and autumn accounted for 39.23% and 33.46% of the total annual paths, respectively.

3.3. Radiation Effect of Windbreak and Sand-Fixation Spatial Flow Trajectories

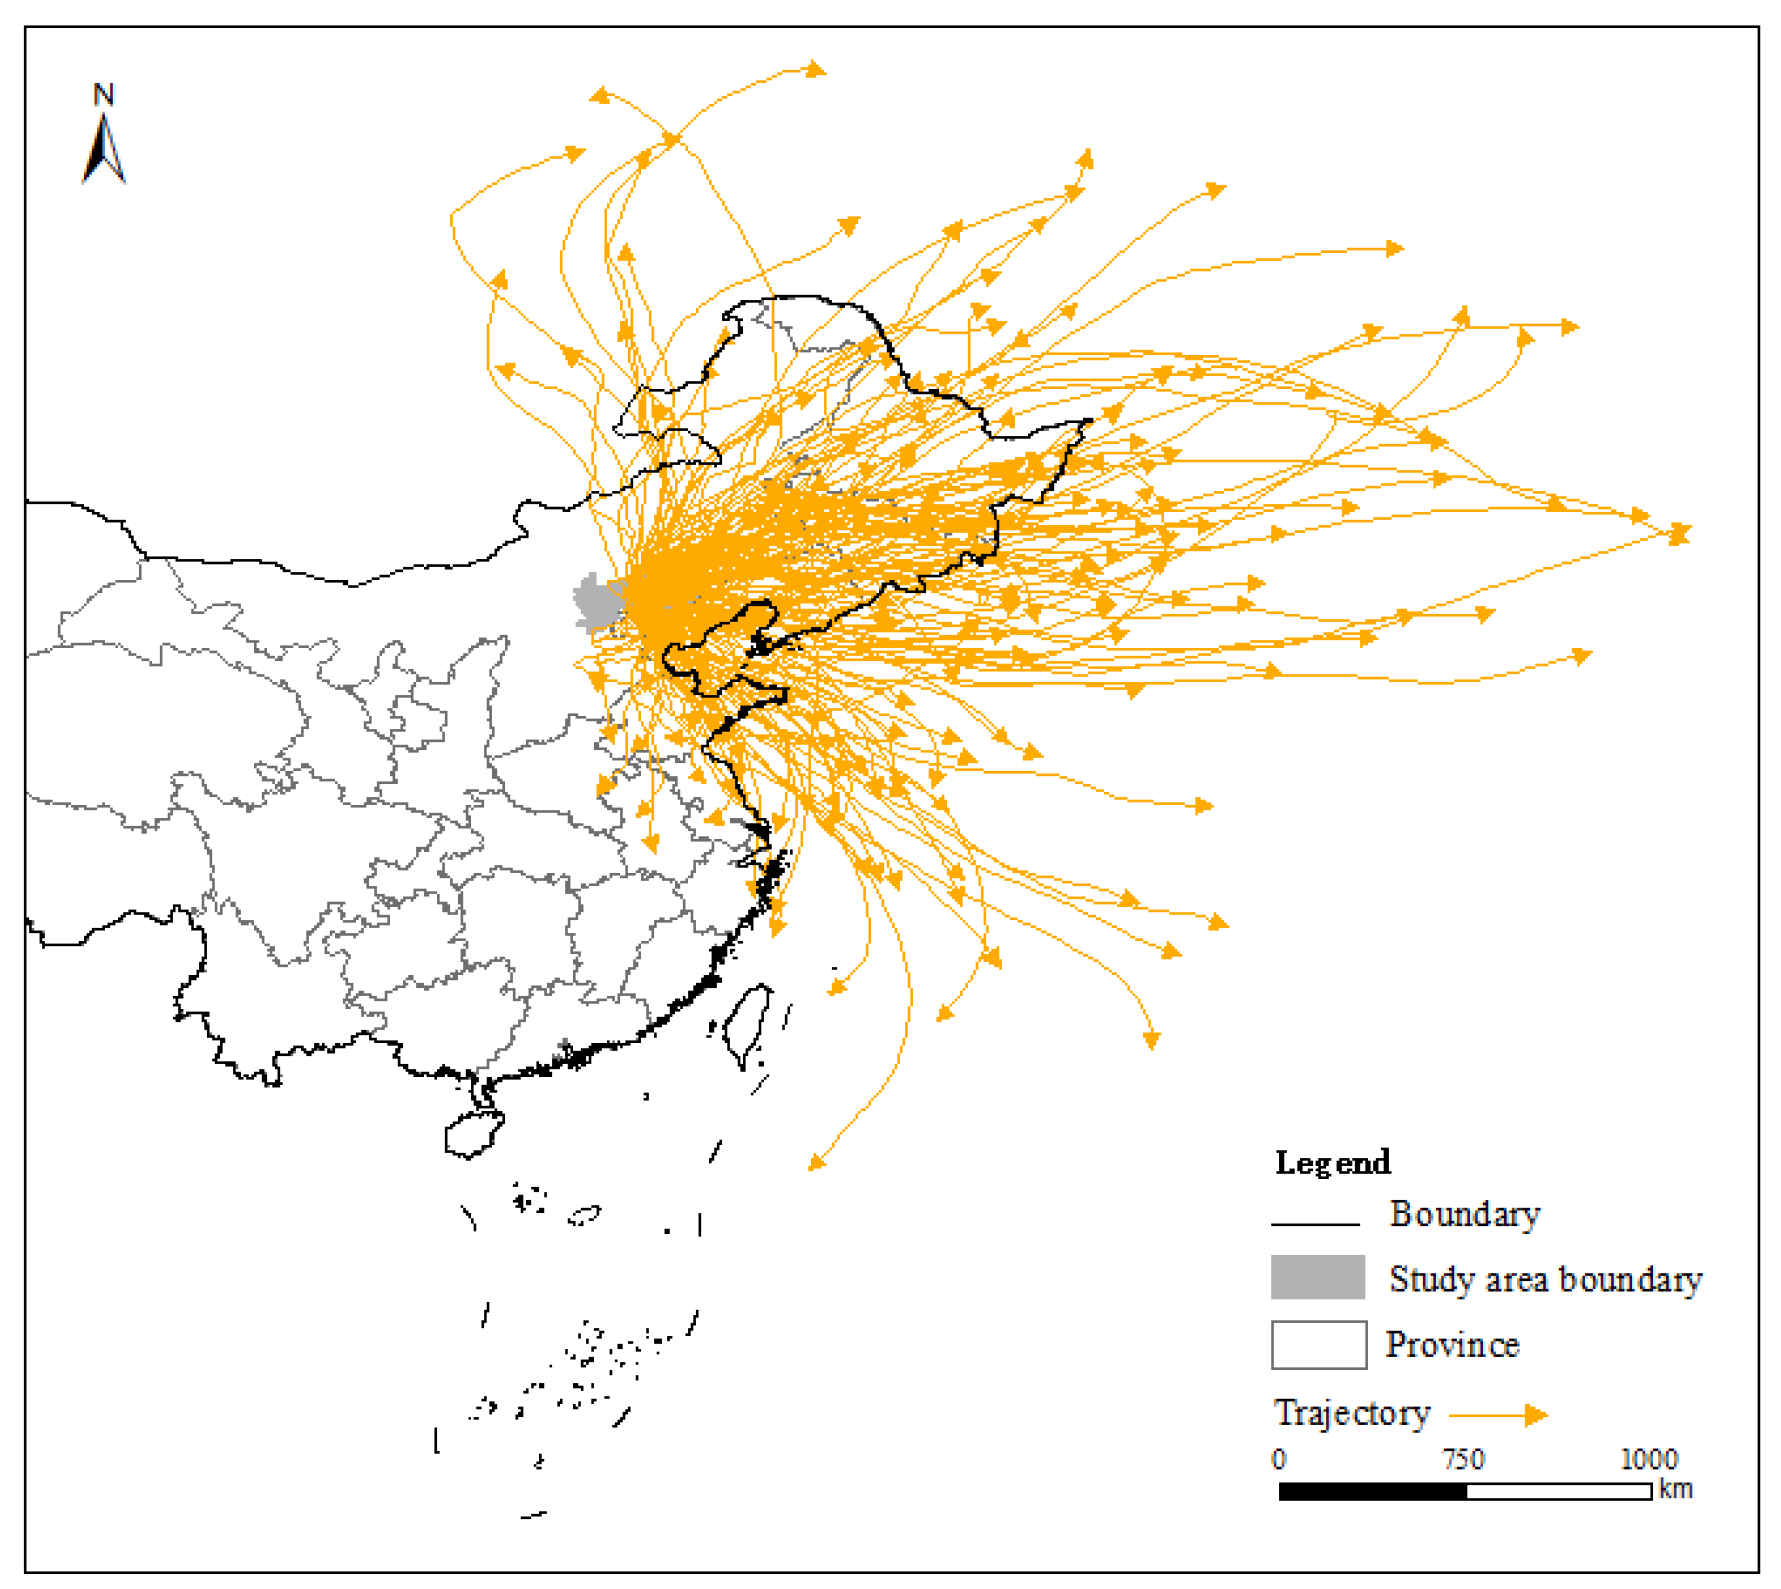
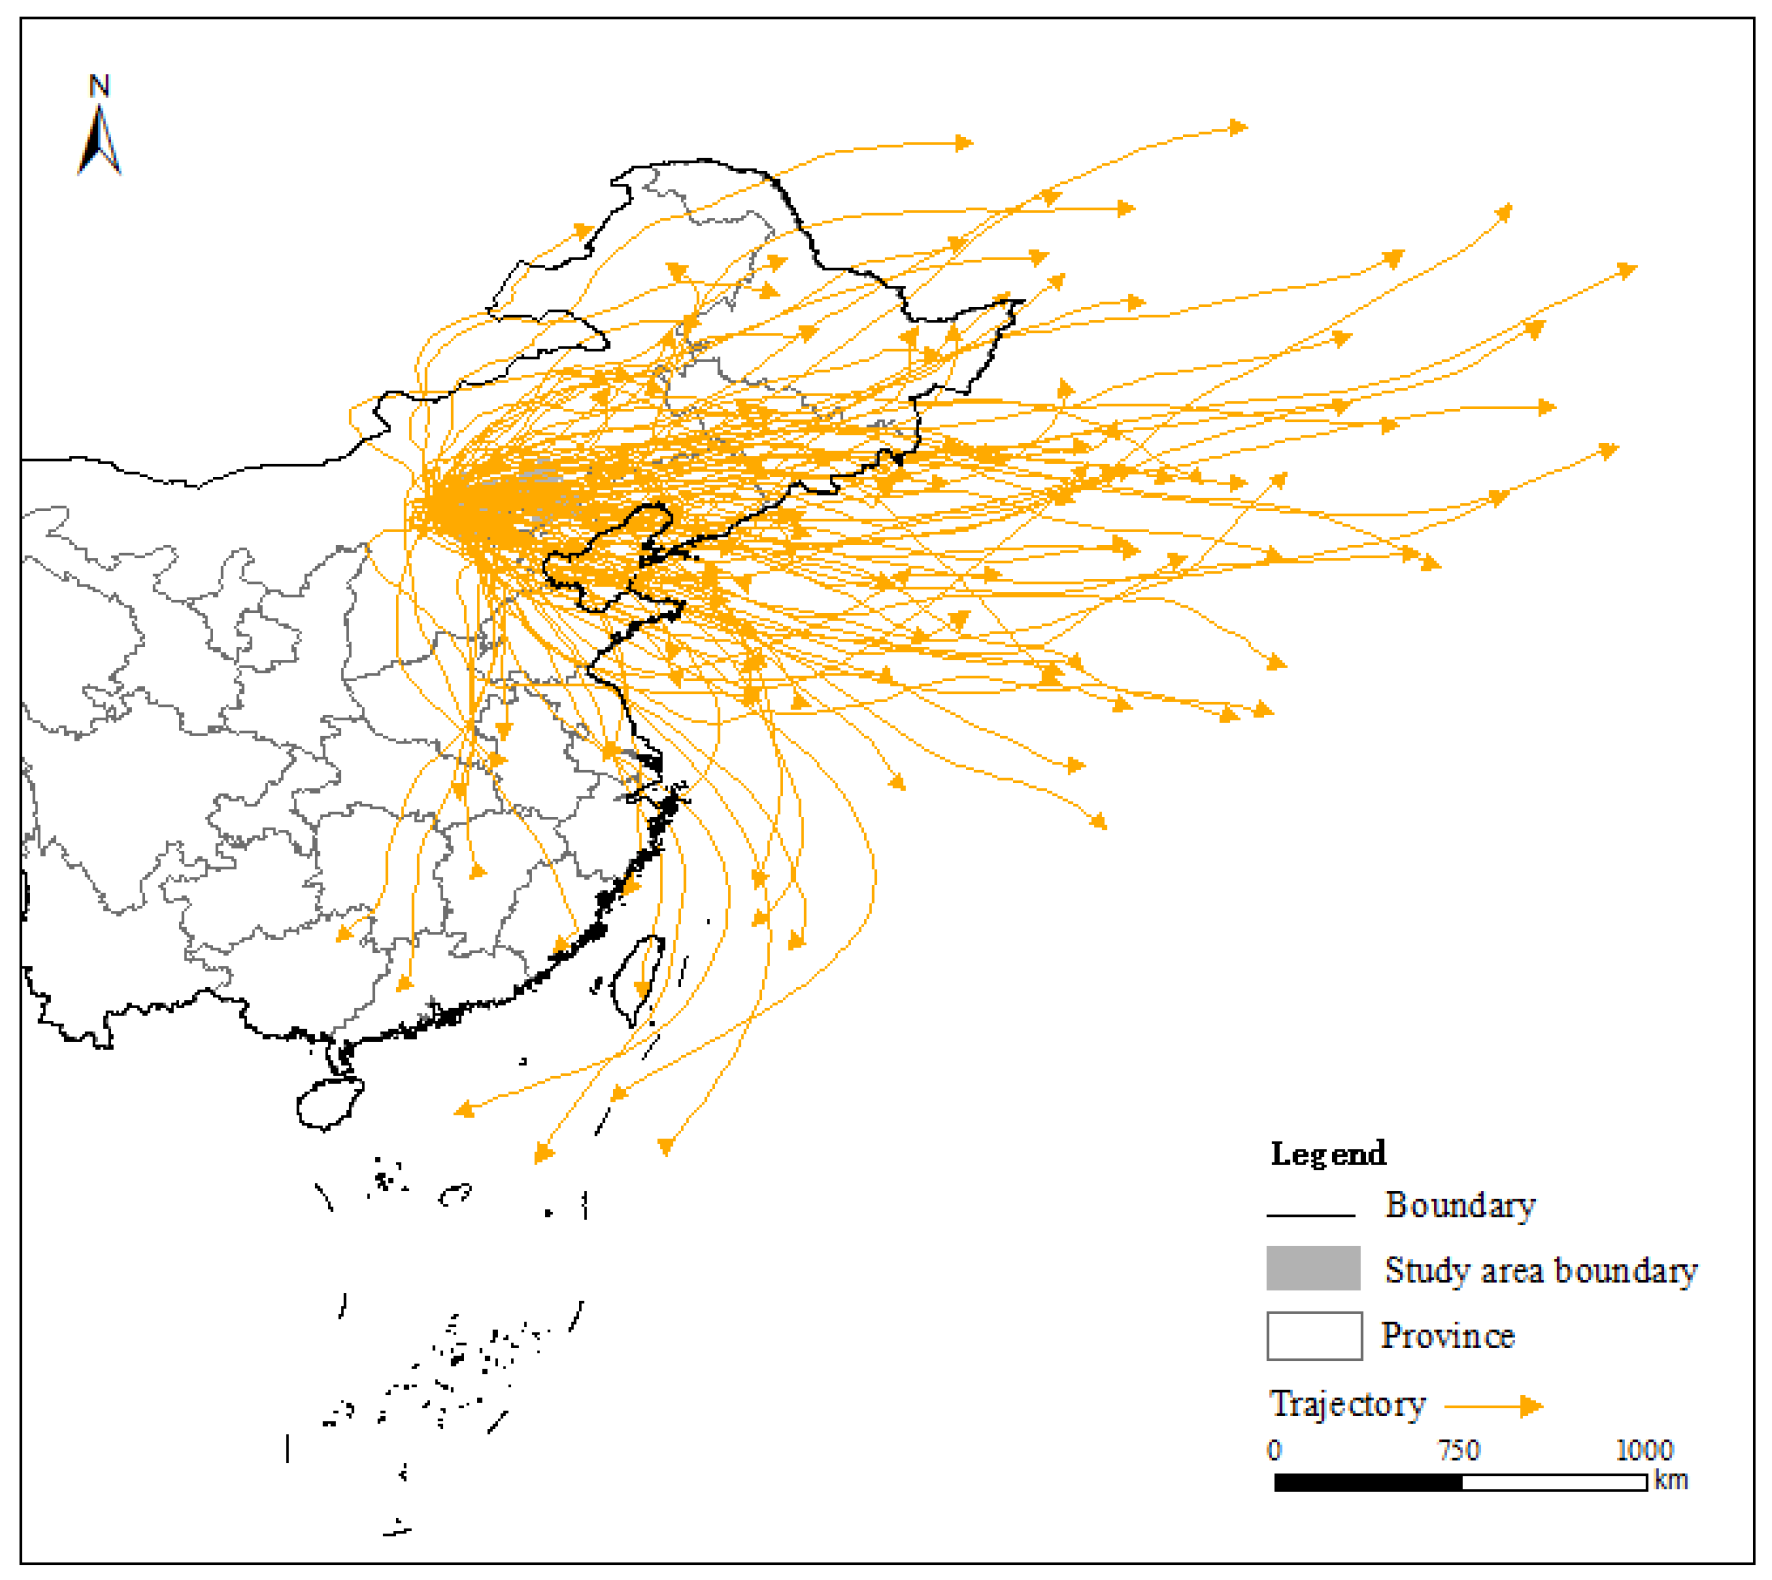
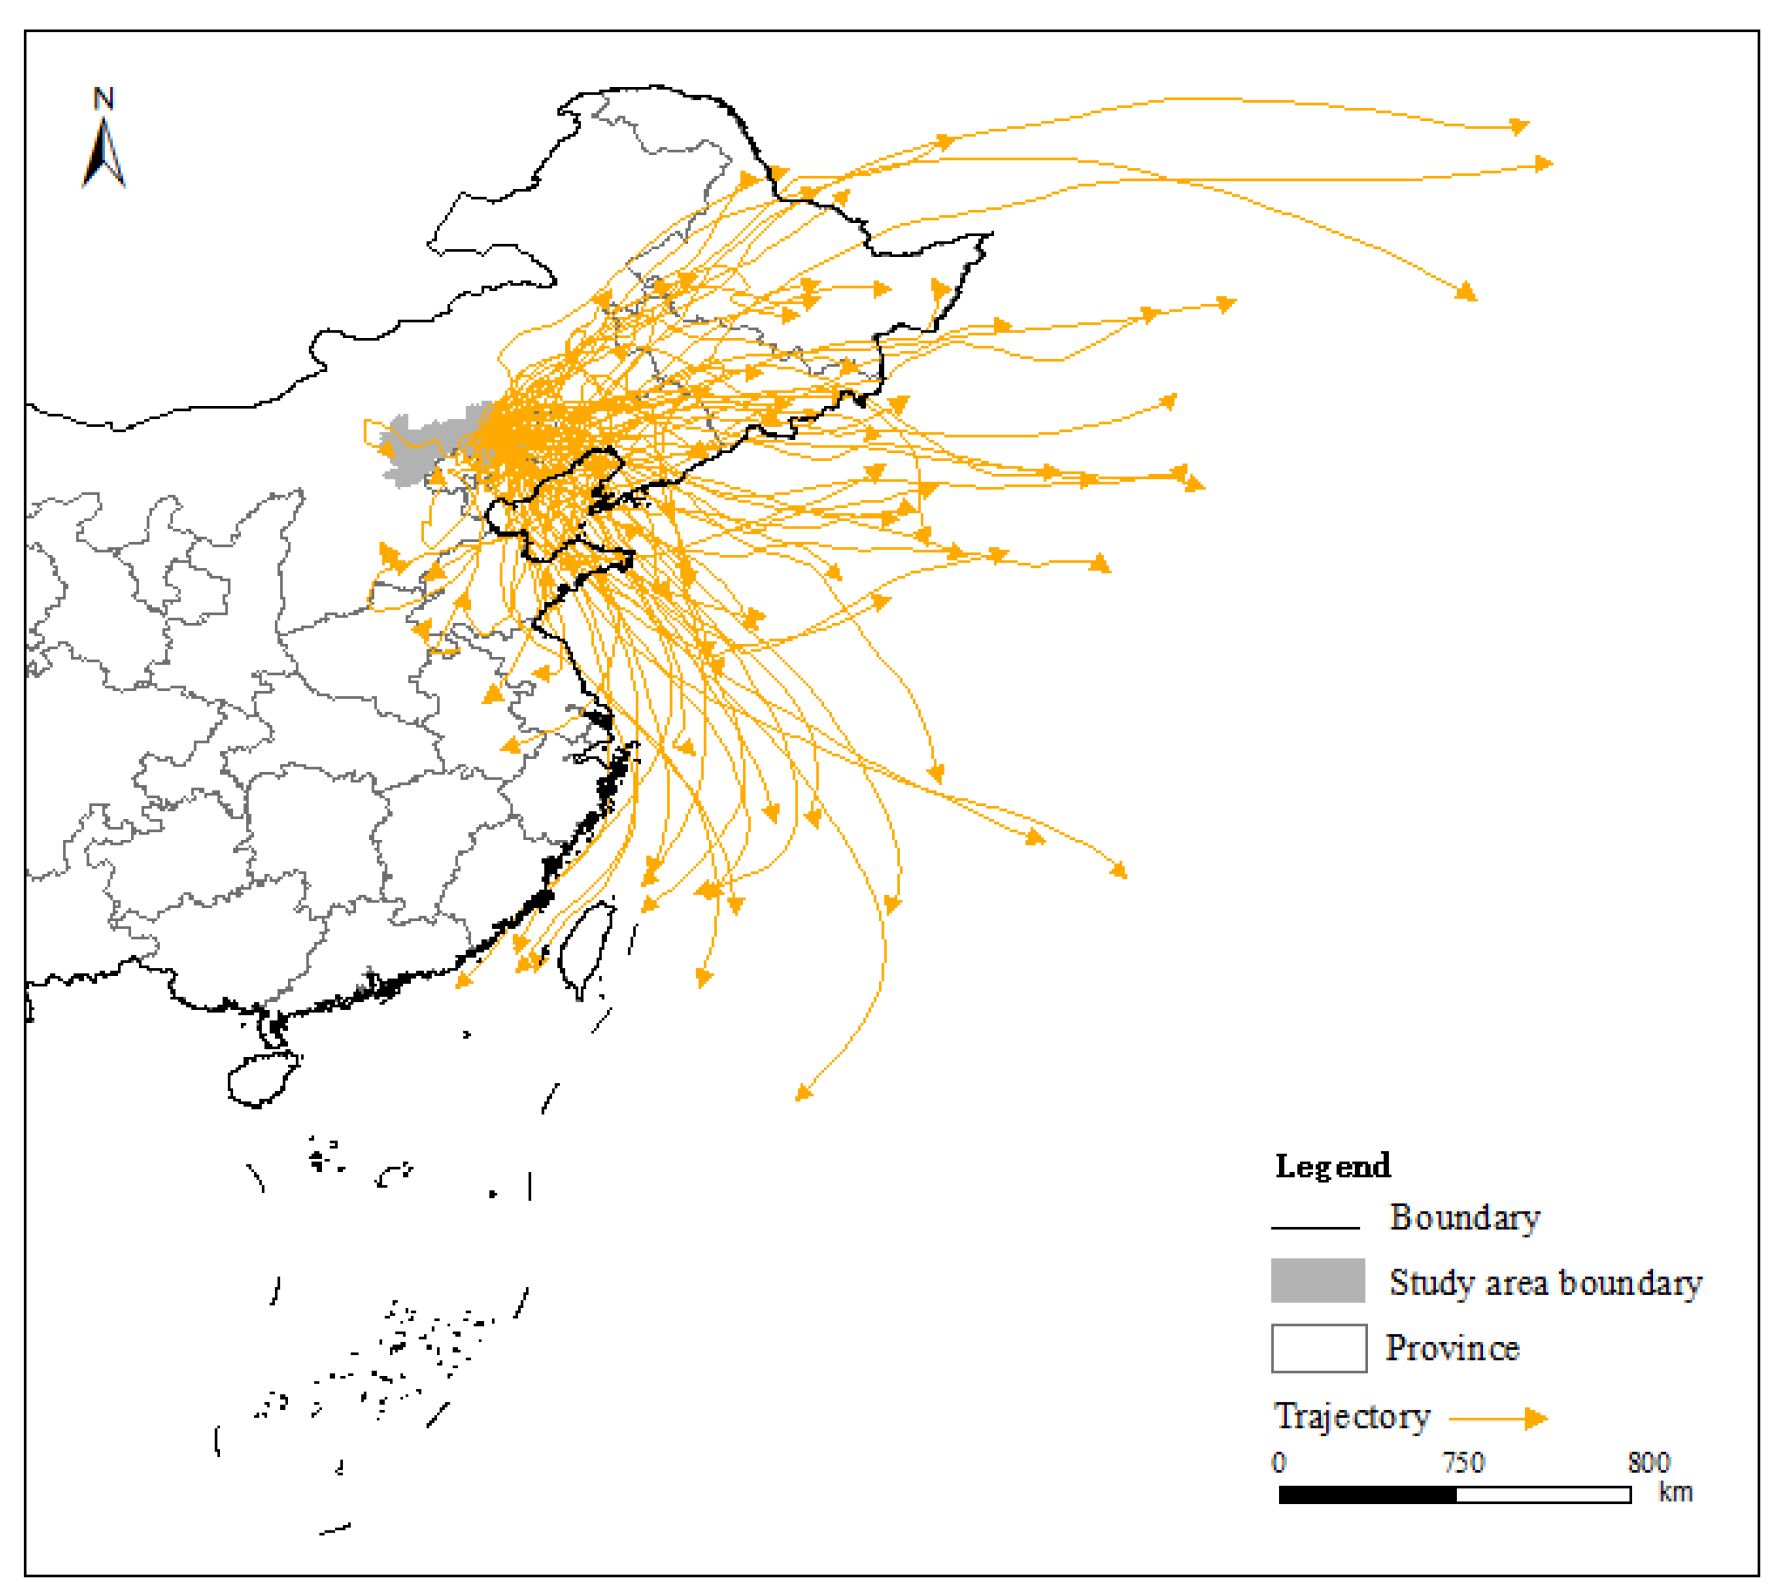
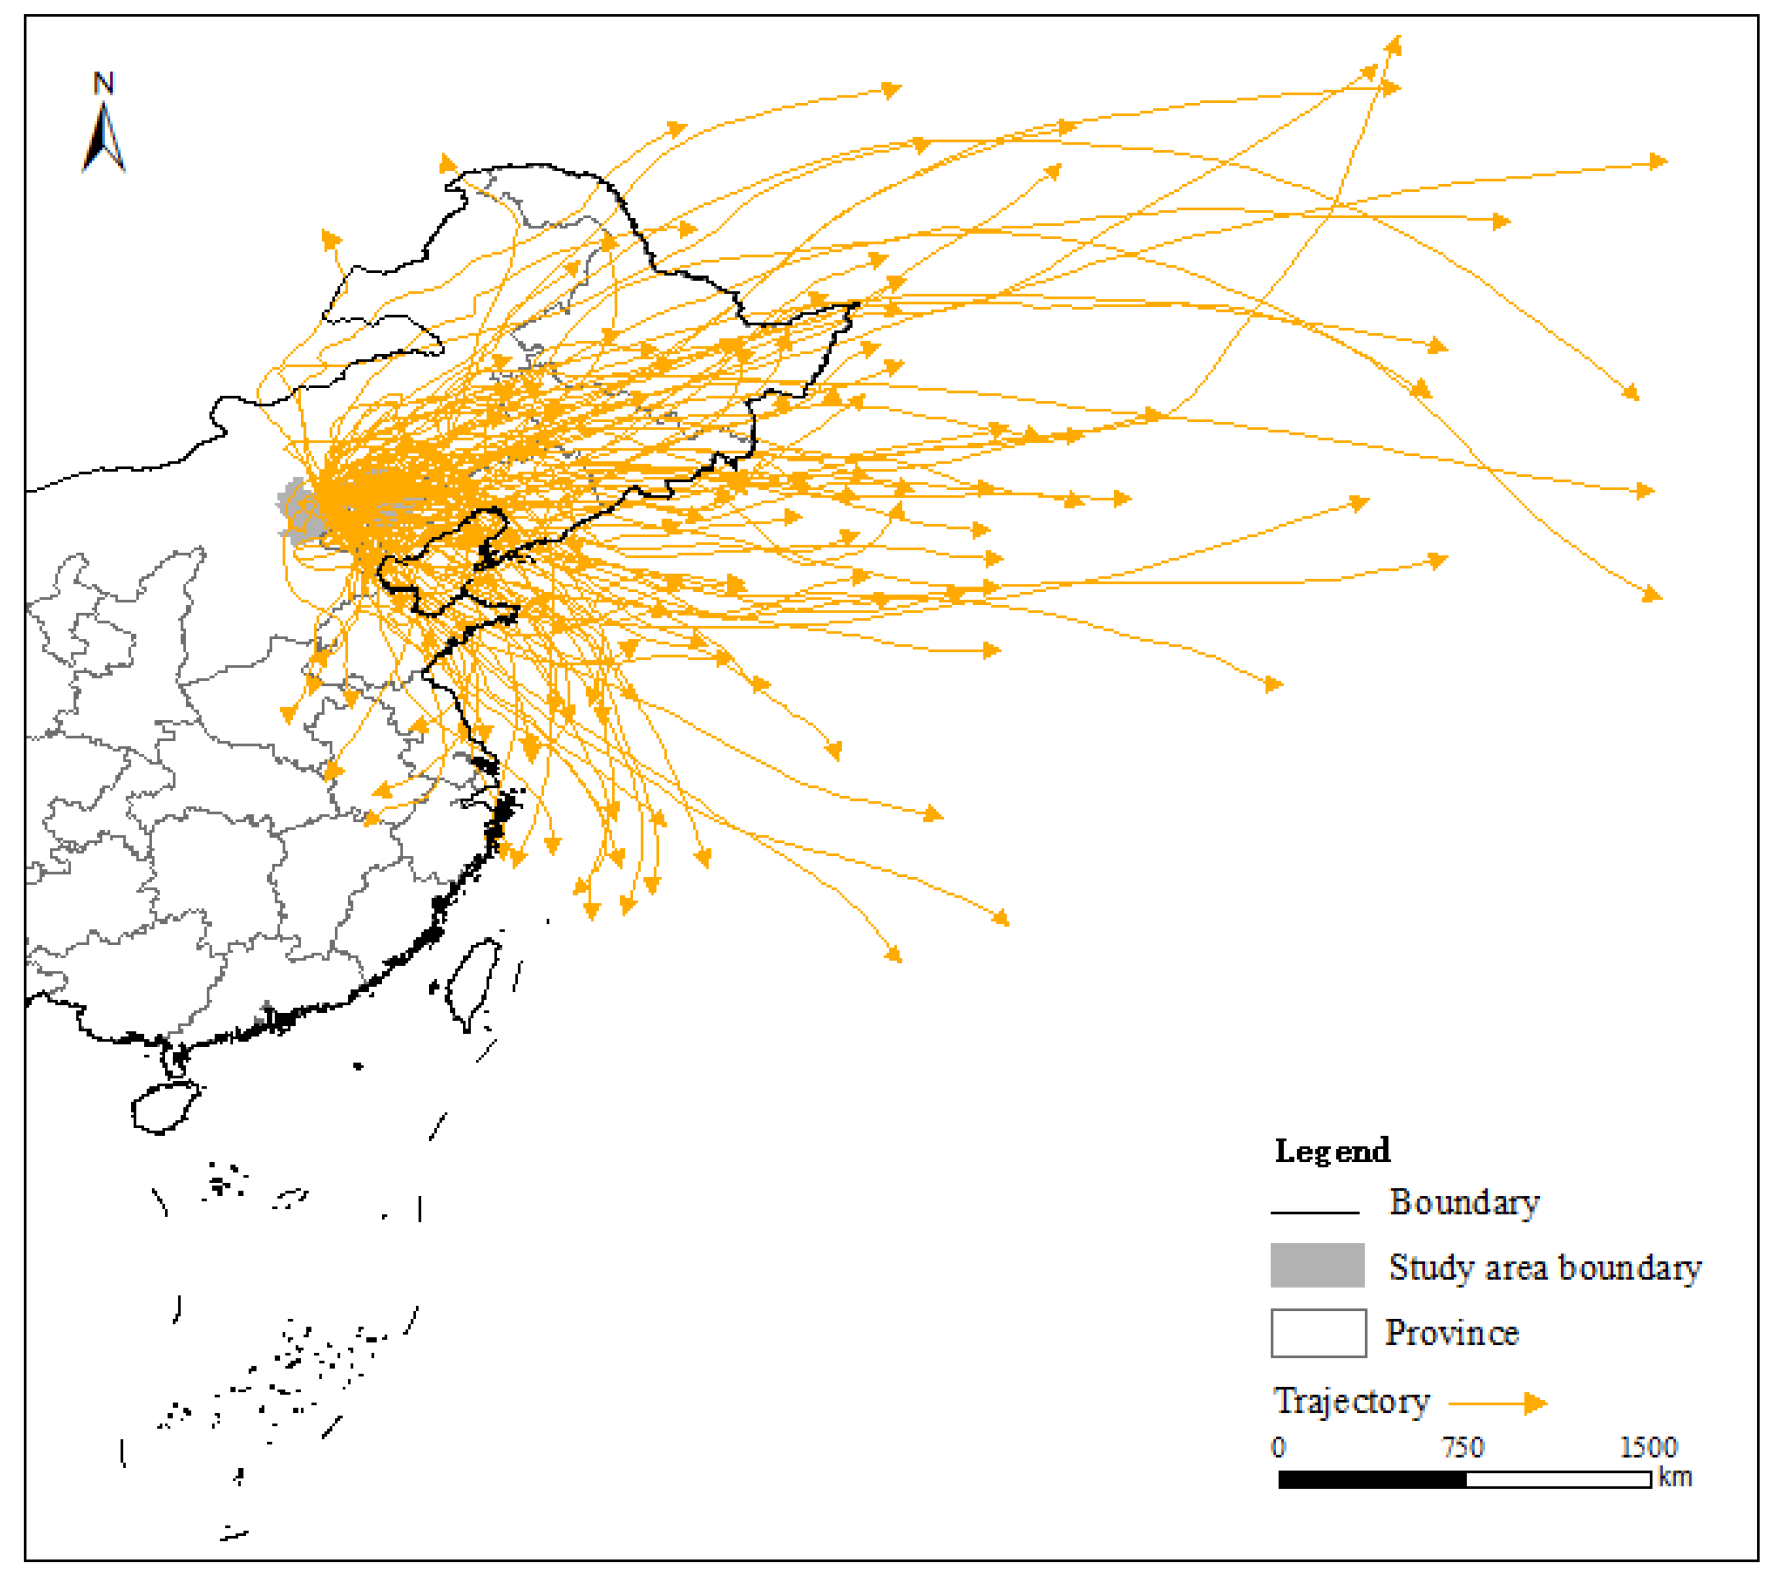
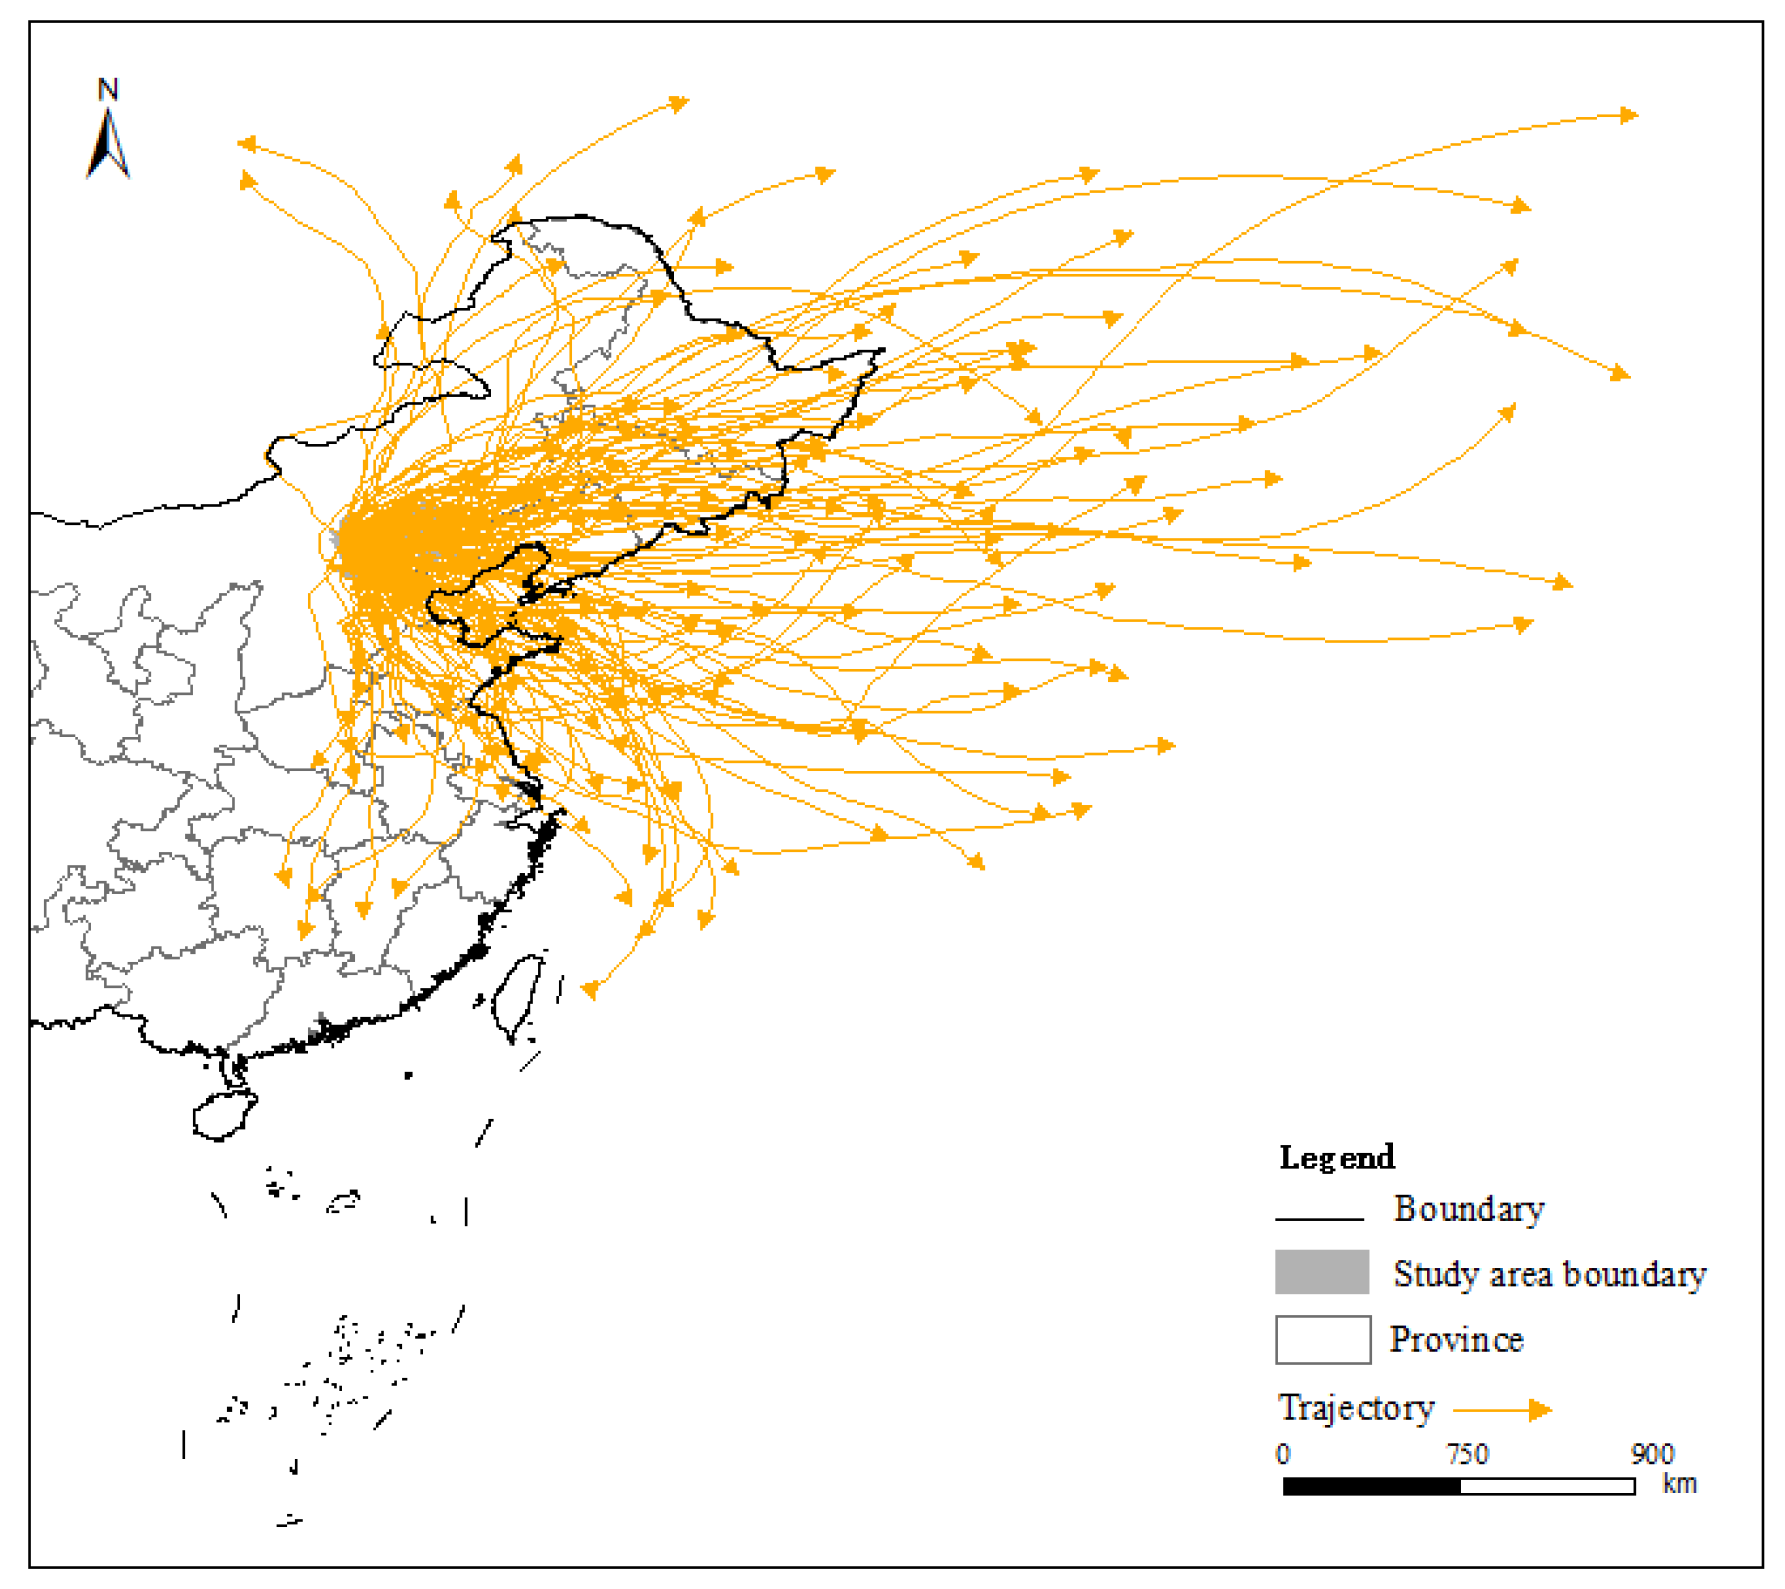
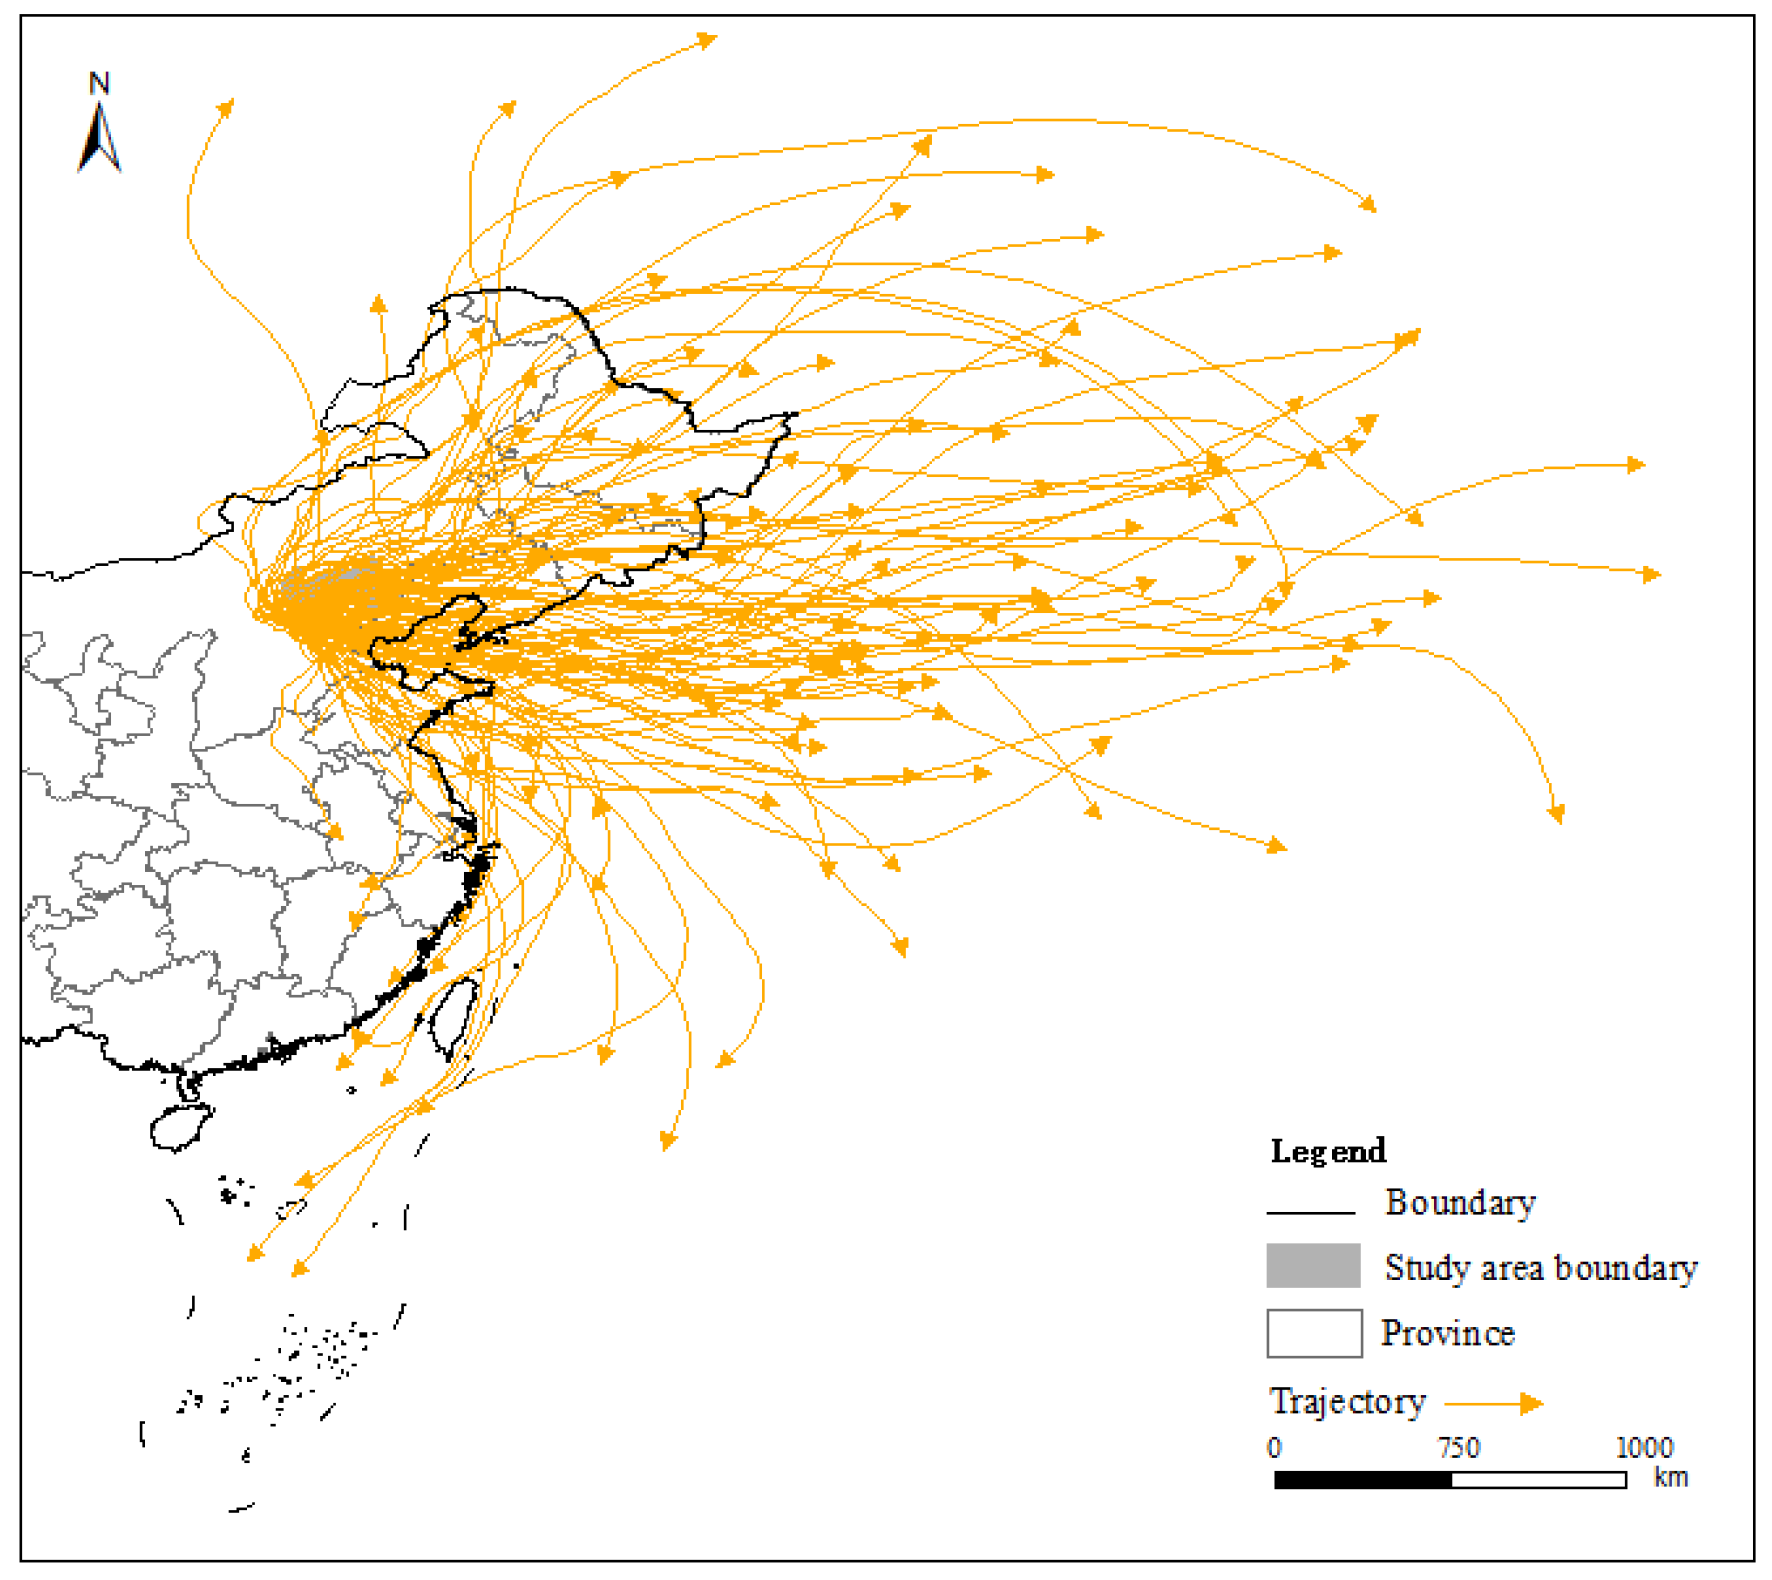
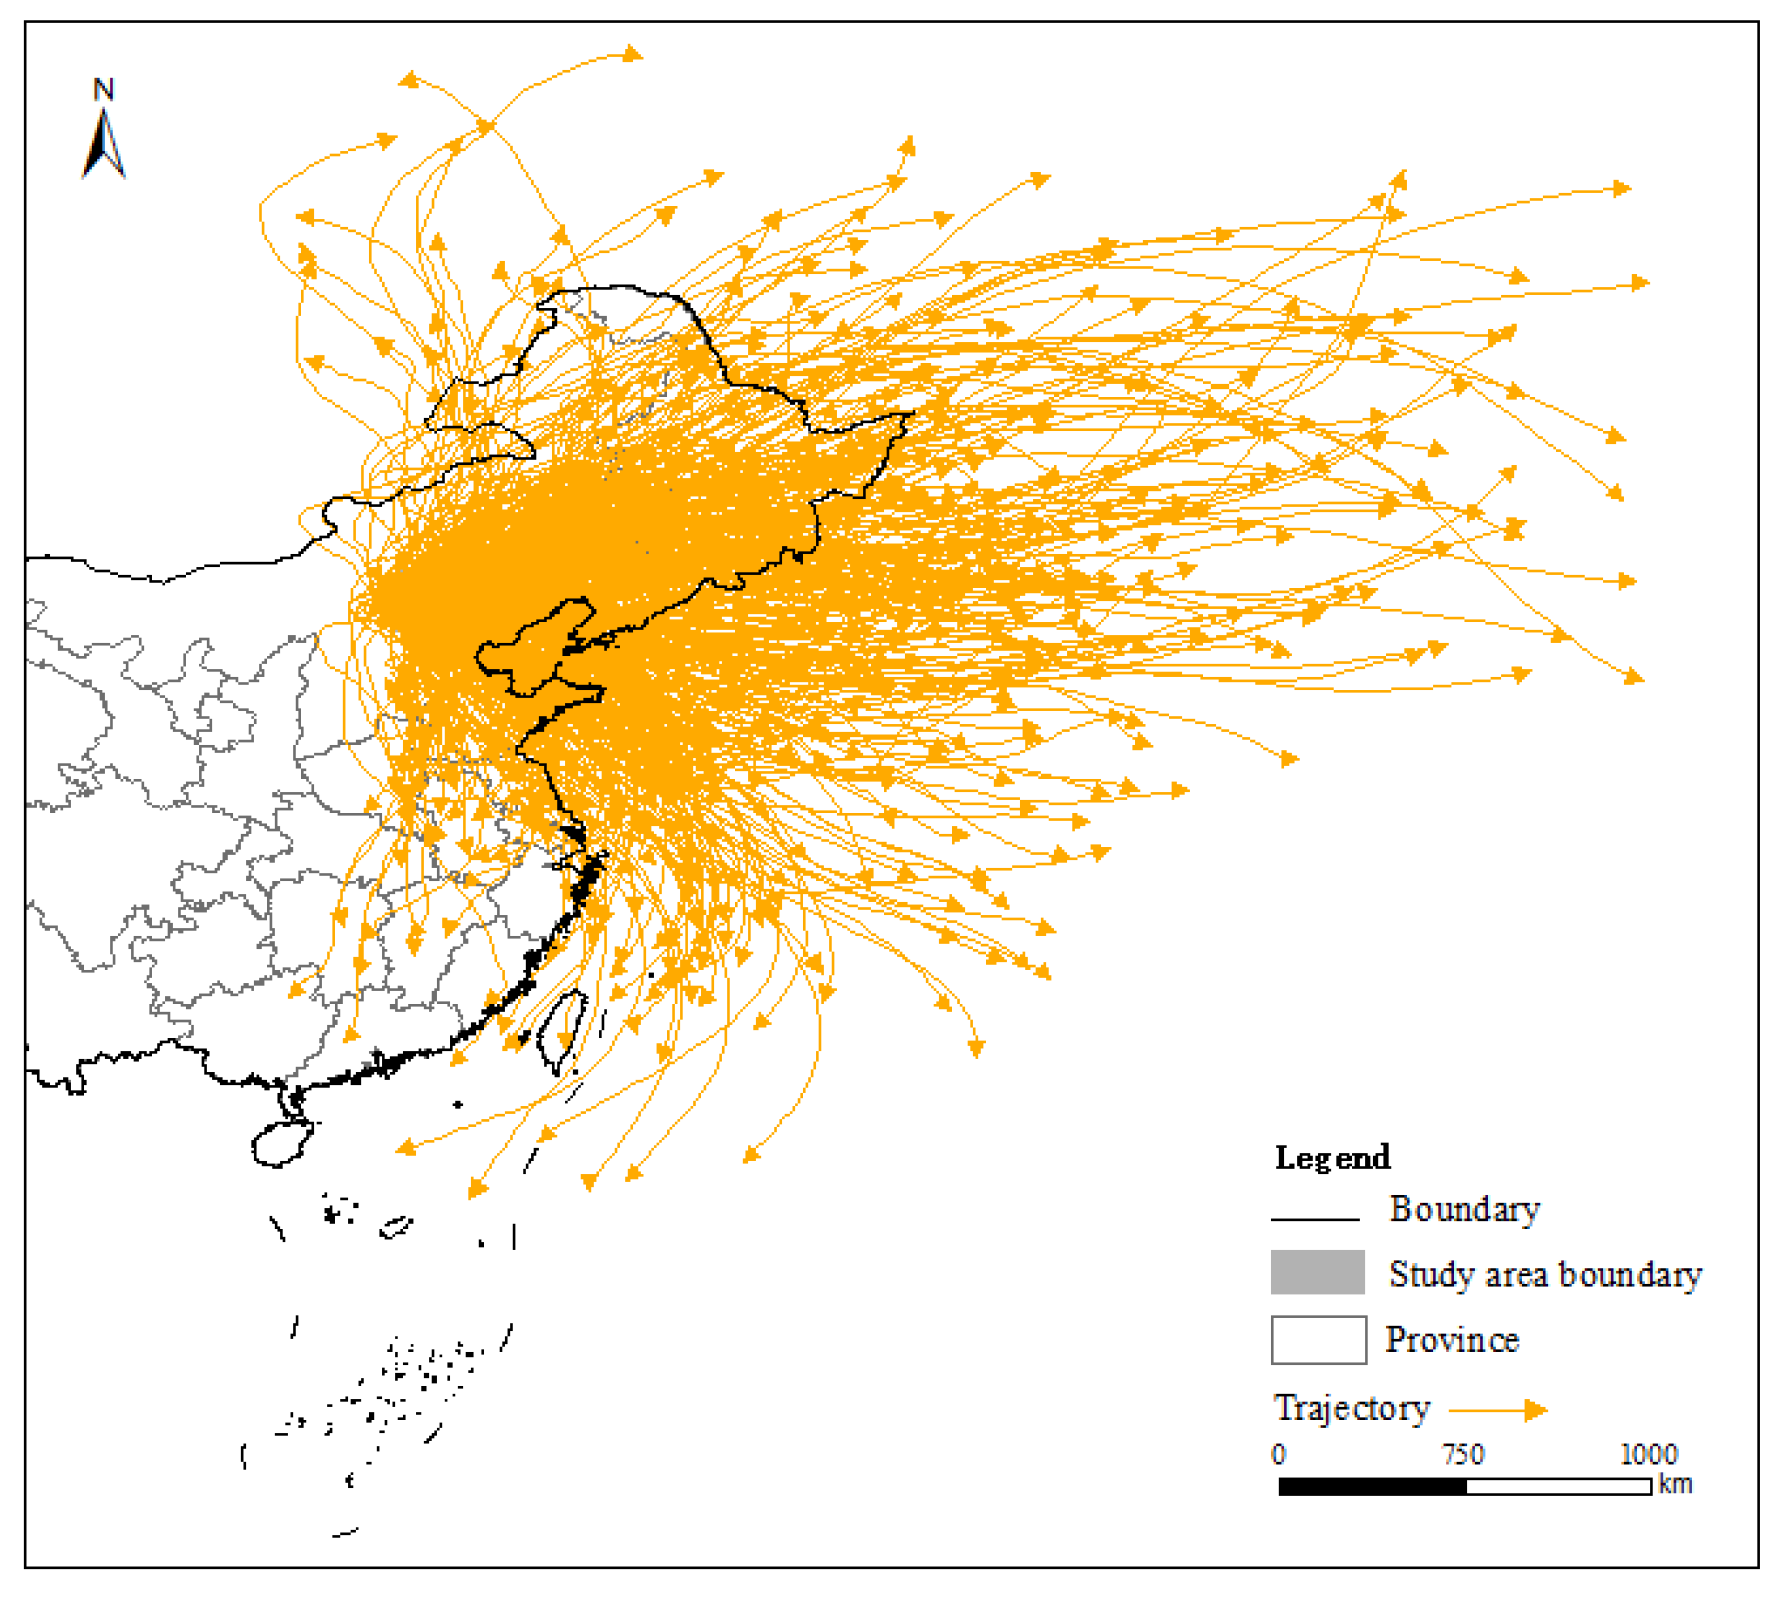
The results of HYSPLIT model simulation combined with cluster analysis showed that among the sand-dust paths at the six stations (Weichang, Fengning, Guyuan, Shangyi, Zhangbei, and Yangyuan), the proportion of the northwest path was 46.30%, 42.45%, 30.50%, 45.77%, 42.34%, and 50.67%, respectively; the proportion of the west path was 36.42%, 36.71%, 41.61%, 36.99%, 45.20%, and 32.09%, respectively; the proportion of the north path was 14.87%, 17.78%, 23.63%, 13.98%, 9.45%, and 13.94%, respectively (Figure 6, Figure 7, Figure 8, Figure 9, Figure 10, Figure 11 and Figure 12).
From the perspective of the overall pattern of spatial flow paths of windbreak and sand-fixation services, the main potential impact areas include Korea, Japan, Mongolia, and Russia. The domestic potential paths mainly through Liaoning, Jilin, Heilongjiang, Inner Mongolia, Shandong, central and southern Hebei, Jiangsu, and Shanghai, while there were fewer sand-dust path trajectories in provinces such as Shanxi, Henan, Hubei, Jiangxi, Hunan, and Fujian. Overall, the windbreak and sand-fixation services in the northern Hebei region had a significant ecological impact on the surrounding bordering countries.
The density of sand-dust flow trajectories decreased significantly with the increase in transmission distance, and the spatial flow trajectories of windbreak and sand-fixation function showed obvious spatial proximity characteristics. Cluster analysis of the overall windbreak and sand-fixation spatial flow paths in the northern Hebei region showed that the northwest path accounted for 43.01%, followed by the west path (38.17%), and the north path accounted for 15.61%.
Note: Spatial flow trajectories are simulated based on the HYSPLIT model, with simulation conditions set to when the wind speed exceeds the critical threshold for sandstorm initiation during that period.

3.4. Radiation Scope and Material Amount of Windbreak and Sand-Fixation Services

The material flow of windbreak and sand-fixation services refers to the modeled amount of windbreak and sand-fixation generated under vegetation cover. Under the effect of these modeled services, the sand and dust are hypothetically fixed in the source area, thereby avoiding potential damage to the benefit area.
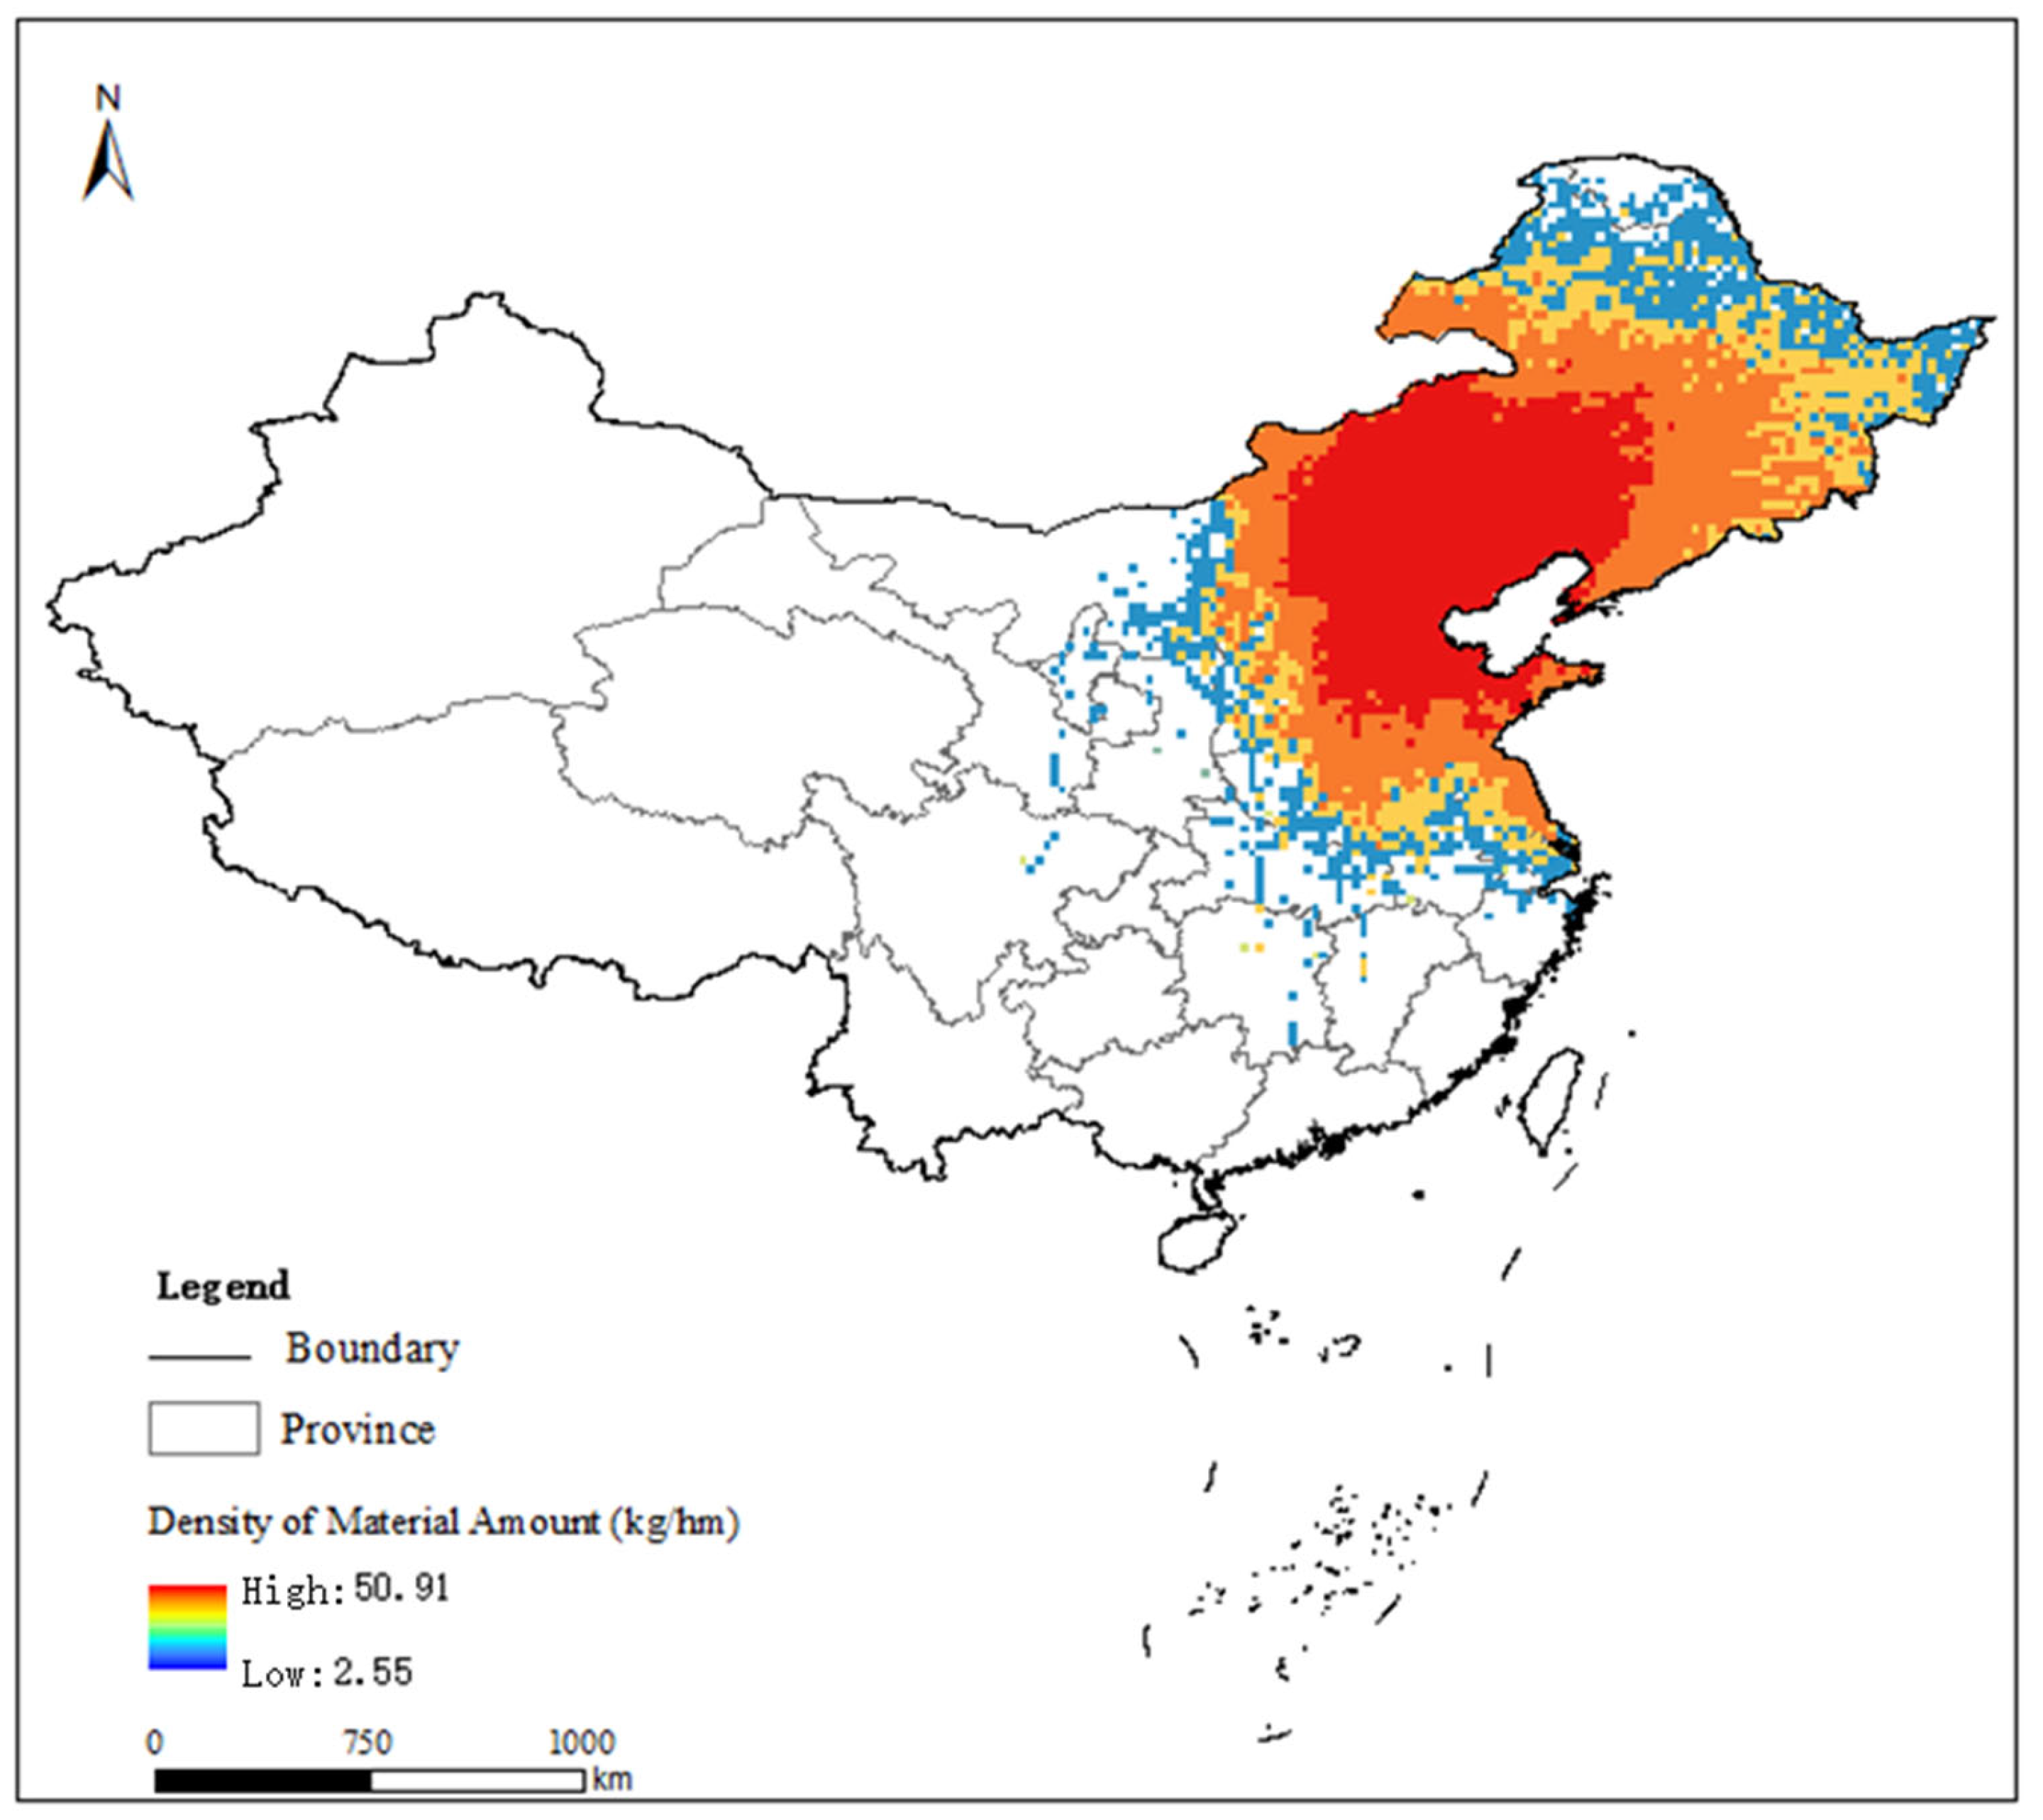
The modeled total spatial radiation area was 396.16 × 10⁴ km2, with 342.96 × 10⁴ km2 within China (86.57%). The average modeled material density was 21.06 kg/hm2. The material density shows a circular decreasing trend outward from the study area center. In terms of the spatial distribution of the radiation scope, except for the Bohai Sea, the domestic radiation area covered 18 provinces (cities) from near to far, including Inner Mongolia, Hebei, Shandong, Heilongjiang, Jilin, Liaoning, Shanxi, Henan, Jiangsu, Anhui, Beijing, Tianjin, Shaanxi, Hubei, Shanghai, Zhejiang, Hunan, and Jiangxi. The overseas radiation area mainly included the Democratic People’s Republic of Korea, Mongolia, and southeastern Russia (Figure 13).
Trajectory frequency analysis based on WPSCF showed that the area with a windbreak and sand-fixation flow trajectory passing frequency greater than 80% was 85.97 × 10⁴ km2, mainly distributed in Beijing and Tianjin; the area with a frequency of 60%~80% was 115.00 × 10⁴ km2, mainly distributed in Inner Mongolia, southwestern Hebei, western Hebei, and northern Shandong; the area with a frequency of 40%~60% was 26.69 × 10⁴ km2, mainly distributed in eastern Inner Mongolia, western Liaoning, and southern Hebei; the area with a frequency of 30%~40% was 59.37 × 10⁴ km2, and the area with a frequency less than 30% was 55.93 × 10⁴ km2. The radiation scope of windbreak and sand-fixation services expanded with the increase in flow trajectory frequency. In 2024, the material quantity of the spatial flow of windbreak and sand-fixation services in Zhangjiakou and Chengde was 1035.53 × 104 t, with an average material quantity density of 0.88 t/hm2; among them, the material quantity flowing through China was 933.22 × 10⁴ t, accounting for 90.12% of the total material quantity.
There were significant spatial differences in the material quantity and density of windbreak and sand-fixation among various domestic beneficiary provinces (Table 2). In terms of material quantity, Inner Mongolia (298.63 × 10⁴ t) and Hebei (122.01 × 10⁴ t) were significantly higher than other provinces, both exceeding 120.01 × 10⁴ t; the material quantities of Shandong, Heilongjiang, Jilin, and Liaoning ranged from 80.66 × 10⁴ t to 85.72 × 10⁴ t; those of Shanxi, Henan, and Jiangsu ranged from 30.68 × 10⁴ t to 50.08 × 10⁴ t; those of Anhui, Beijing, and Tianjin ranged from 10.96 × 10⁴ t to 19.87 × 10⁴ t; those of Shaanxi, Hubei, and Shanghai ranged from 1.99 × 10⁴ t to 6.14 × 10⁴ t; those of Zhejiang, Hunan, and Jiangxi ranged from 0.47 × 10⁴ t to 0.70 × 10⁴ t; Ningxia, Gansu, Sichuan, Taiwan, and Guangdong had the lowest material quantities, ranging from 0.02 × 10⁻³ t to 0.23 × 10⁴ t.
The average material quantity density of windbreak and sand-fixation in the domestic beneficiary areas of Zhangjiakou and Chengde was 21.06 kg/hm2. Among them, the densities of Tianjin, Beijing, and Hebei were all greater than 50.00 kg/hm2, which were high-value areas; those of Liaoning, Shandong, Jilin, and Inner Mongolia ranged from 34.67 kg/hm2 to 44.44 kg/hm2; those of Shanxi, Henan, and Jiangsu ranged from 23.95 kg/hm2 to 29.29 kg/hm2; those of Heilongjiang, Anhui, Shanghai, and Shaanxi ranged from 11.70 kg/hm2 to 18.38 kg/hm2; and the densities of the remaining provinces were all less than 8.00 kg/hm2.
The amount of windbreak and sand-fixation service provided by the mountainous area of northern Hebei to its internal beneficiary areas is closely related to the area of those zones. The greater the inflow of sand-fixing materials, the stronger the windbreak and sand-fixation security capacity obtained by the beneficiary areas. Although the total amount of windbreak and sand-fixation materials in Beijing, Tianjin and Hebei is not high, their density is significantly elevated. Moreover, the density of windbreak and sand-fixation materials shows a gradual outward decline in a zonal pattern centered on the mountainous area of northern Hebei.
In addition, the spatial flow path of windbreak and sand-fixation materials is highly consistent with the natural transport path of sandstorms in northern Hebei. This indicates that the improvement of ecological quality in the mountainous area of northern Hebei can effectively reduce the probability of wind-sand weather in downwind areas, and the effect on the prevention and control of sand-dust weather is more significant in provinces with a higher inflow of sand materials.

4. Discussion

Hunshandake sandy land to the north of the mountainous area in northern Hebei is one of the four windy sandy lands in northern China [36,37]. In the National Major Function Oriented Zoning Plan (2014–2020), 19 counties including Kangbao, Shangyi, and Zhangbei were designated as part of the Otindag Desertification Control Ecological Function Zone. Due to its unique geographical location, the mountainous area of northern Hebei effectively blocks sandstorms from transporting toward Beijing and Tianjin, serving as a natural ecological barrier for Beijing–Tianjin and even North China.
Previous studies show that 62 dust events induced by external sources affected the Beijing–Tianjin region from 1980 to 2005. Among them, the northern path and northwestern path accounted for 27.40% and 40.30% of the total frequency, respectively, and the combined influence of the northwestern and northern paths accounted for 24.20% [38]. Wind prevention and sand fixation are among the core ecological functions of ecosystems in arid and semi-arid regions [39,40,41]. Relevant research indicates that when wind-blown sand passes through oases to farmland, wind speed can be reduced by 70% and sand transport rate by 96% [42], demonstrating the significant effect of vegetation in wind prevention and sand fixation.
In this study, the HYSPLIT model was used to simulate the forward trajectories of sand-fixing ecosystem services. All results are modeled indicative patterns and have not been independently validated. The results reveal a total of 1153 sand transport paths in the region, with 42.19% occurring in spring. Cluster analysis shows that the northwestern and western paths account for 43.88% and 38.95%, respectively, which is highly consistent with the natural transport paths of spring dust storms in the Otindag Sandy Land [37]. When studying the sand-fixing function of the grassland ecological function zone at the northern foot of the Yinshan Mountains using the HYSPLIT model, Xiao [7] found that dust activities associated with sand-fixing services mainly occurred in spring, with flow paths extending mainly eastward and southeastward. Based on surface meteorological data from 1980 to 2005, Zhang [38] concluded that dust storms in Beijing mainly occur in spring, and the main sand transport paths affecting Beijing–Tianjin are the northern, western, and northwestern paths. Using backward trajectory simulation of dust particles via HYSPLIT, Yin [43] identified three major dust paths influencing Beijing–Tianjin: the northern path from the Otindag Sandy Land through the Heihe Valley to Beijing; the northwestern path from Zhurihe in Inner Mongolia through Zhangjiakou and the Yanghe Valley to Beijing–Tianjin; and the western path from the Sanggan River through the Yongding River Valley to Beijing–Tianjin.
Geographically, six major wind gaps are distributed in Huai’an, Wanquan, Zhangbei, Chongli, Chicheng, and Fengning in northern Hebei. When the northwest monsoon prevails, sand and dust advance toward Beijing–Tianjin through these wind gaps and canyon channels formed by river systems. Nine major river systems in northern Hebei serve as the main transport corridors for external sand and dust. Forests and grasslands on both sides of the rivers block sand transport, resulting in the formation of five major sand beaches [43,44]. At present, the sand-fixing forests in the Bashang area of northern Hebei have not only effectively alleviated local farmland desertification but also successfully blocked the invasion of northern sandstorms into Beijing–Tianjin. The region has thus transformed from a dust storm enhancement zone to a blocking zone, becoming an indispensable ecological barrier for Beijing–Tianjin and North China.
By combining the RWEQ and HYSPLIT models, this study achieves a breakthrough in wind prevention and sand-fixation services from “quantity assessment” to “flow simulation”. However, the simulation framework has not been independently validated; all outputs are indicative modeled patterns under the adopted assumptions, not verified realized ecosystem service delivery or direct evidence for ecological compensation prioritization. Limitations include lack of independent field validation, simplified vegetation effects, and omission of atmospheric stratification impacts. Future work will strengthen validation and parameter optimization. Such as (1) this study did not conduct quantitative comparative validation against specific dust storm observations in 2024, nor did it have independent field measurements to verify the simulated ranges and material concentrations; (2) differential impacts of vegetation types and coverage on sand-fixing service flows were not considered; (3) only the occurrence conditions of saline-alkali dust storms were considered, namely sufficient sand sources and persistent strong winds, while the effect of atmospheric stratification stability on dust transport and diffusion was neglected. This may lead to overestimation of the frequency and intensity of dust events and reduce the accuracy of transport range delineation. (4) The dust transport paths at observation sites were simulated to determine the impact scope, but the simulation results lack validation. Future research can integrate high-resolution remote sensing data and field monitoring to optimize model parameters, and conduct spatiotemporal dynamic analyses of sand-fixing services to further reveal their driving mechanisms.

5. Conclusions

Taking the mountainous area of northern Hebei as the research object, this study systematically evaluated modeled indicative patterns of wind prevention and sand-fixation services, simulated flow paths, identify the radiation scope, and quantify modeled radiation effects. The main conclusions are as follows:
The temporal and path distribution characteristics of sand and dust weather in the mountainous area of northern Hebei are significant. Sand and dust weather with wind speed greater than the sand-driving wind speed mainly occurs in spring (March to May), accounting for 39.23% of the total annual sand and dust events, followed by autumn (33.46%). The spatial flow trajectories of sand and dust are dominated by the northwestern path (43.01%), followed by the western path (38.17%). Most trajectories spread from the study area to the west, northwest, and north, and the density of flow paths gradually decreases with the increase in transmission distance.
The spatial radiation scope of wind prevention and sand-fixation services in the mountainous area of northern Hebei reaches 396.16 × 10⁴ km2, of which the internal radiation area is 342.96 × 10⁴ km2, accounting for 86.57% of the total radiation area. The external radiation mainly covers the Democratic People’s Republic of Korea, Mongolia, and southeastern Russia, and the internal radiation covers 18 provinces (cities) in China. Trajectory frequency analysis based on WPSCF shows that areas with trajectory frequency greater than 80% are mainly distributed in Beijing and Tianjin, and the radiation scope expands with the increase in flow trajectory frequency, reflecting the spatial proximity characteristics of wind prevention and sand-fixation services.
In 2024, the material quantity of spatial flow of wind prevention and sand-fixation services in the mountainous area of northern Hebei was 1035.53 × 104 t, with an average density of 21.06 kg/hm2. Among them, the internal material quantity was 933.22 × 10⁴ t, accounting for 90.12% of the total material quantity. Among the internal beneficiary provinces, Inner Mongolia and Hebei had the highest material quantity of wind prevention and sand-fixation, while Tianjin, Beijing, and Hebei had significantly higher material quantity density. Moreover, the material quantity density of wind prevention and sand fixation decreased outward in a circular pattern with the mountainous area of northern Hebei as the center. The spatial flow paths of wind prevention and sand fixation materials are highly consistent with the natural transmission paths of sandstorms, indicating that the improvement of the ecological environment in the mountainous area of northern Hebei can effectively reduce the probability of sand and dust weather in the downwind areas.
As the core area of the ecological barrier for Beijing and Tianjin, the mountainous area of northern Hebei plays an irreplaceable role in ensuring the ecological security of Beijing, Tianjin, and North China. These modeled results can provide supportive information for regional ecological compensation priority-setting, but should not be regarded as direct or verified evidence. The study supports ecological protection layout and sand source control projects under the Beijing-Tianjin-Hebei Coordinated Development strategy.

Author Contributions

Conceptualization, X.L. and C.Z.; Methodology, R.L. and P.Z.; Software, R.L.; Formal analysis, R.L., G.W. and M.M.; Resources, R.L.; Writing—original draft, R.L.; Writing—review & editing, R.L. and H.L.; Funding acquisition, X.L. All authors have read and agreed to the published version of the manuscript.

Funding

This research was funded by the China geological survey project (No. DD202607102701); construction of comprehensive full-parameter observation for typical ecosystems in Xinjiang (No. 2021xjkk140104), The authors would also like to thank all those who contributed to this research and the authors cited in this paper.

Institutional Review Board Statement

Not applicable.

Informed Consent Statement

Not applicable.

Data Availability Statement

The original contributions presented in this study are included in the article. Further inquiries can be directed to the corresponding author.

Conflicts of Interest

The authors declare no conflict of interest.

References

  1. Han, Y.W.; Gao, X.T.; Gao, J.X. Typical ecosystem services and evaluation indicator system of significant eco-function areas. Ecol. Environ. Sci. 2010, 19, 2986–2992. [Google Scholar]
  2. Zhang, B.; Wang, S.; Li, Q.; Xie, G. Regional correlation degree derived from the sand-fixing service spatial flow, A case study of the Beijing-Tianjin sandstorm control engineering area. Resour. Sci. 2020, 42, 969–979. [Google Scholar] [CrossRef]
  3. Ben, B.Z.; Clare, M.C.A.; Magnusson, L.; Gascón, E.; Maier-Gerber, M.; Janoušek, M.; Rodwell, M.; Pinault, F.; Dramsch, J.S.; Lang, S.T.K.; et al. The rise of data-driven weather forecasting, A first statistical assessment of machine learning-based weather forecasts in an operational like context. Bull. Am. Meteorol. Soc. 2024, 105, E864–E883. [Google Scholar] [CrossRef]
  4. Qaddouri, A.; Lee, V. The Canadian global environmental multiscale model on the Yin-Yang grid system. Q. J. R. Meteorol. Soc. 2011, 137, 1913–1926. [Google Scholar] [CrossRef]
  5. Yang, Q.X.; Gu, Y.; Zou, C.; Xu, D.; Wang, L.; Ye, X.; Yang, Y.; Huang, X. Temporal variation and spatial scale dependency of the trade-offs and synergies among multiple ecosystem services in the Taihu Lake Basin of China. Sci. Total Environ. 2019, 651, 218–229. [Google Scholar]
  6. Xu, J. Research on Spatial Flow of Ecosystem Services—A Case Study of Ningxia Hui Autonomous Region. Ph.D. Thesis, University of Chinese Academy of Sciences, Beijing, China, 2019. [Google Scholar]
  7. Xiao, Y.; Xie, G.D.; Zeng, L. Identifying the benefit areas of wind erosion prevention in the key ecological function area of grassland at the northern foot of Yinshan Mountain. J. Nat. Resour. 2018, 33, 1742–1754. [Google Scholar]
  8. Xie, H.M.; Ren, F.M.; Li, G.P. Role of supper typhoon danas in the extreme precipitation caused by severe typhoon fitow. Meteorol. Mon. 2016, 42, 156–165. [Google Scholar]
  9. Valizadeh, B.; Heydarizade, Y.; Tayebi, J.; Rezaie, M.R. A simulation to assess the probability of the spread of radioactive materials from the zaporizhzhia nuclear power plant using the HYSPLIT model. Pollution 2024, 10, 595–605. [Google Scholar]
  10. Shirgholami, M. Identifying trajectories and sources of dust events in Yazd province using HYSPLIT model and remote sensing data. J. Arid Biome 2023, 13, 35–52. [Google Scholar]
  11. Odabasi, A.T. HYSPLIT in Simulating the Atmospheric Dispersion of Hazardous Aerosols, A Case Study in St. Louis, Missouri. Ph.D. Thesis, Missouri University of Science and Technology, Rolla, MO, USA, 2024. [Google Scholar]
  12. Shayesteh, K.; Gharibi, S.; Parsimehr, M. Routing dust storms using suspended particulates concentration and meteorological models in Hamadan Province. J. Geogr. Environ. Hazards 2022, 11, 185–200. [Google Scholar]
  13. Chavan, A.; Bokade, V.; Lataye, D.H. Seasonal dispersion and trajectory-based source assessment of particulate air pollutants, an integrated monitoring and HYSPLIT modeling approach. Environ. Monit. Assess. 2026, 198, 203. [Google Scholar] [CrossRef]
  14. Lu, Q.; Xiao, C.L.; Bao, Y.S.; Cui, M.C.; Cao, X.M.; Que, X.E.; Yang, L.; Cui, G.P. Implementation path and strategic planning of winning the battle of “Three-North” and reconstructing “New Three-North”. Bull. Chin. Acad. Sci. 2023, 38, 956–965. [Google Scholar]
  15. Wang, G.; Zhang, H.Y. Spatial flow and radiation effect of sand-fixing service in Northwestern Liaoning Province. J. Ecol. Rural Environ. 2023, 39, 52–59. [Google Scholar]
  16. Zhang, H.Y. Evaluation on the Service Function of Windbreak and Sand Fixation and Its Radiation Effect in Northwestern Liaoning Province. Ph.D. Thesis, Liaoning Normal University, Dalian, China, 2023. [Google Scholar]
  17. Li, Q.X.; Zhang, B.; Shi, Y.T. Key ecosystem services and their regional flow in Zhangjiakou-Chengde region. J. Ecol. Rural Environ. 2017, 33, 38–46. [Google Scholar]
  18. Liu, R.; Niu, X.; Wang, B. Forest landscape changes and driving forces analysis based on LUCC remote sensing images in Zhangjiakou-Chengde area. Terr. Ecosyst. Conserv. 2022, 2, 91–99. [Google Scholar]
  19. Xu, J.; Xiao, Y.; Xie, G.D.; Wang, Y.Y. Assessment of wind erosion prevention service and its beneficiary areas identification of national key ecological function zone of windbreak and sand fixation type in China. Acta Ecol. Sin. 2019, 39, 5857–5873. [Google Scholar] [CrossRef]
  20. Zheng, J.T.; Jin, X.M.; Li, Q.; Yin, X.L.; Jin, A.F. Driving factors analysis of surface soil moisture variation in Zhangjiakou-Chengde district based on geodetector. Hydrogeol. Eng. Geol. 2024, 51, 204–214. [Google Scholar]
  21. Shao, Z.J.; Liu, L.; Wang, T. Source Analysis of Main Rivers’pollutants of the upper reaches of Yongding River in Zhangjiakou Area. Environ. Pollut. Control 2020, 42, 204–211. [Google Scholar]
  22. Huang, J.; Fan, J.H.; He, X.R. InVest-Model based evaluation of water conservation function in Zhangjiakou Area, China. Mt. Res. 2021, 39, 327–337. [Google Scholar]
  23. Fryrear, D.W.; Bilbro, J.D.; Saleh, A.; Schomberg, H. RWEQ, Improved wind erosion technology. J. Soil Water Conserv. 2000, 52, 183–189. [Google Scholar] [CrossRef]
  24. Yu, X.M.; Cao, L. A review of the lagrangian diffudion model for atomspheric pollution. Environ. Eng. 2020, 38, 145–153. [Google Scholar]
  25. Liu, H.F.; Wang, K.Q. Ionic composition of precipitation and its correlation with Gaseous Pollutants in Representative Rural Areas of Liaoning. J. Meteorol. Environ. 2011, 27, 62–68. [Google Scholar]
  26. Wang, F.; Chen, D.S.; Cheng, S.Y. Impacts of air pollutant transport based on air trajectory clustering. Res. Environ. Sci. 2009, 22, 637–642. [Google Scholar]
  27. Deng, X.J.; Huang, J.; Wu, D. Analyses on the typical atmospheric pollution processes in Shenzhen area. China Environ. Sci. 2006, 26, 7–11. [Google Scholar]
  28. Suresh, V.; Gopalakrishnan, R. Tutorial, Langevin dynamics methods for aerosol particle trajectory simulations and collision rate constant modeling. J. Aerosol Sci. 2021, 155, 105746. [Google Scholar] [CrossRef]
  29. Maammar, M.; Touhami, S.; Rezoug, M.; Daioui, K.; Dascalescu, L.; Medles, K. Experimental study and numerical simulation of particles trajectories in a flexible electrode type electrostatic separator. J. Physic Conf. Ser. 2024, 2702, 012018. [Google Scholar] [CrossRef]
  30. Deng, M.J.; Yan, Y.L.; Hu, D.M. Analysis of dust weather pollution characteristics and transmission paths in Changzhi, China. China Environ. Sci. 2020, 40, 4275–4283. [Google Scholar]
  31. Polissar, A.V.; Hopke, P.K.; Harris, J.M. Source regions for atmospheric aerosol measured at barrow, Alaska. Environ. Sci. Technol. 2001, 35, 4214–4226. [Google Scholar] [CrossRef]
  32. Liu, N.; Yu, Y.; Chen, J.B.; He, J.J.; Zhao, S.P. A study on potential sources and transportation pathways of PM10 in spring in Lanzhou. Trans. Atmos. Sci. 2012, 35, 477–486. (In Chinese) [Google Scholar]
  33. Chen, C.; Wen, T.X.; An, J.L.; Wang, Y.S. Characteristic of air pollutants in Tianjin before, during and after the Beijing Military Parade in 2015. Chin. J. Environ. Eng. 2017, 11, 5446–5456. [Google Scholar]
  34. Huang, J.; Liao, B.T.; Wang, C.L.; Deng, X.J.; Shen, Z.Q.; Tang, J.; Lan, J. Analysis of the characteristics and potential source contribution of PM2.5 pollution in Guangzhou. Environ. Sci. Technol. 2019, 42, 109–118. [Google Scholar]
  35. Huang, M.D.; Xiao, Y.; Qin, K.Y. Spatiotemporal dynamics and drivers of wind erosion prevention service in Otindag from 1980 to 2018. Acta Ecol. Sin. 2022, 42, 7612–7629. [Google Scholar] [CrossRef]
  36. Wang, G.L.; Lu, D.R.; You, L. Analyses of climatic charactersistics on Hunshandake dust storn. Clim. Environ. Res. 2002, 7, 433–439. [Google Scholar]
  37. Yue, P.; Niu, S.J.; Liu, X.Y. Dust Emission and transmission during Spring Sand-dust Storm in Hunshandake Sand-land. J. Desert Res. 2008, 28, 227–230. [Google Scholar]
  38. Zhagn, Z.G.; Gao, Q.X.; Jiao, M.Y. Analysis on source locations and transportation paths of sand-dusts affecting Beijing. Res. Environ. Sci. 2007, 20, 21–27. [Google Scholar]
  39. Syrbe, R.U.; Walz, U. Spatial indicators for the assessment of ecosystem services, Providing benefiting and connecting areas and landscape metrics. Ecol. Indic. 2012, 21, 80–88. [Google Scholar] [CrossRef]
  40. Halim, A.; Normaniza, O. The effects of plant density of melastoma malabathricum on the erosion rate of slope soil at different slope orientations. Int. J. Sediment Res. 2015, 30, 131–141. [Google Scholar] [CrossRef]
  41. Borrelli, P.; Lugato, E.; Montanarella, L.; Panagos, P. A new assessment of soil loss due to wind erosion in European agricultural soils using a quantitative spatially distributed modelling approach. Land Degrad. Dev. 2017, 28, 335–344. [Google Scholar] [CrossRef]
  42. Yin, X.H.; Shi, S.Y.; Zhang, M.Y. Change characteristic of Beijing dust weather and its sand-dust source areas. Plateau Meteorol. 2007, 26, 1039–1044. [Google Scholar]
  43. Guo, Y.C. Impacts of climate change on water resources and desertification in Hebei Province. Hebei Water Resour. Hydropower Eng. 2004, 1, 25–26. [Google Scholar]
  44. Gu, S.P. Problems and countermeasures for the ecological environment governance in the Beijing-Tianjin sandstorm source region. Soil Water Conserv. Sci. Technol. Shanxi 2008, 1, 36–38. [Google Scholar]
Figure 1. General situation of the study area.
Sustainability 18 05327 g001
Figure 2. Spatial distribution of windbreak and sand-fixation amount in the study area.
Sustainability 18 05327 g002
Figure 3. Spatial distribution of per unit area windbreak and sand-fixation amount.
Sustainability 18 05327 g003
Figure 4. Maximum daily wind speed (m/s) at each station by season. Note: The dashed line indicates the sand-driving wind speed threshold (6 m/s).
Sustainability 18 05327 g004aSustainability 18 05327 g004b
Figure 5. Frequency of wind speed records exceeding the sand-driving threshold.
Sustainability 18 05327 g005
Figure 6. Windbreak and sand-fixation spatial flow trajectories of Weichang.
Sustainability 18 05327 g006
Figure 7. Windbreak and sand-fixation spatial flow trajectories of Fengning.
Sustainability 18 05327 g007
Figure 8. Windbreak and sand-fixation spatial flow trajectories of Guyuan.
Sustainability 18 05327 g008
Figure 9. Windbreak and sand-fixation spatial flow trajectories of Zhangbei.
Sustainability 18 05327 g009
Figure 10. Windbreak and sand-fixation spatial flow trajectories of Shangyi.
Sustainability 18 05327 g010
Figure 11. Windbreak and sand-fixation spatial flow trajectories of Yangyua.
Sustainability 18 05327 g011
Figure 12. Flow trajectories of the windbreak and sand-fixation service.
Sustainability 18 05327 g012
Figure 13. Spatial flow range of windbreak and sand-fixation functions in Zhangcheng.
Sustainability 18 05327 g013
Table 1. Data source.
Data TypeSourceContent
Land use typehttp://www.gis5g.com/1000 m resolution
Elevation data250 m resolution
Windspeed datahttp://data.cma.cn/2024 hourly 10 min maximum wind speed
NCEP reanalysis datahttps://www.ready.noaa.gov/archives.php (accessed on 28 February 2026)January 2024–January 2025, 3 h interval
meteorological datahttps://data.cma.cn/1 January~31 December 2024 Within the day interval, Maximum wind speed data for 10 min within 1 h.
Table 2. The material amount and density of windbreak and sand-fixation service in benefiting provinces.
ProvinceMaterial Amount (×104 t)Density of Material Amount (kg/hm2)
Inner Mongolia298.6334.67
Hebei122.0150.29
Shandong85.72 44.14
Heilongjiang83.72 18.38
Jilin82.17 35.45
Liaoning80.66 44.44
Shanxi50.08 29.29
Henan41.54 25.54
Jiangsu30.68 23.95
Anhui19.87 16.95
Beijing14.15 50.91
Tianjin10.96 50.91
Shaanxi6.14 11.70
Hubei2.51 4.59
Shanghai1.99 12.54
Zhejiang0.70 2.76
Hunan0.64 5.90
Jiangxi0.47 7.65
Ningxia0.23 2.55
Gansu0.16 2.55
Sichuan0.14 4.18
Taiwan0.02 2.55
Guangdong0.02 2.55
Note: It is arranged according to the descending order of the flow of windbreak and sand-fixing service material in the provinces.
Disclaimer/Publisher’s Note: The statements, opinions and data contained in all publications are solely those of the individual author(s) and contributor(s) and not of MDPI and/or the editor(s). MDPI and/or the editor(s) disclaim responsibility for any injury to people or property resulting from any ideas, methods, instructions or products referred to in the content.