Article

Global Readiness for Low-Carbon and Smart Agriculture Talent Cultivation: A Country-Level Assessment with Micro-Level Evidence from China

1
Jiangsu Key Laboratory of Crop Genetics and Physiology, Agricultural College of Yangzhou University, Yangzhou 225009, China
2
College of Animal Science and Technology, Yangzhou University, Yangzhou 225009, China
*
Author to whom correspondence should be addressed.
Sustainability 2026, 18(11), 5271; https://doi.org/10.3390/su18115271
Submission received: 12 April 2026 / Revised: 30 April 2026 / Accepted: 21 May 2026 / Published: 24 May 2026

Abstract

Low-carbon and smart agriculture talent cultivation requires structural conditions that vary widely across countries. This study develops the Agricultural Talent Cultivation Readiness Index (ATCRI) as a proxy-based structural diagnostic tool for approximating the multi-dimensional enabling conditions and bottlenecks that shape whether SDG-linked agricultural education transformation can be operationalized at scale. ATCRI covers 160 countries across four interdependent dimensions: Education and Research, Digital/Energy/Enabling Infrastructure, Green Transition Pressure, and Innovation/Institutional Capacity. Results indicate a highly uneven global distribution: high transition pressure does not automatically translate into high readiness, with 17 countries exhibiting a pressure–capacity mismatch. China ranks 21st globally, showing a hybrid profile in which education and innovation capacity are strong while digital delivery infrastructure remains a relative bottleneck. Survey evidence from Chinese crop science students is consistent with this interpretation, revealing elevated practice-oriented reform demand where macro-level structural gaps are sharpest. ATCRI is intended as a diagnostic framework for identifying structural bottlenecks, not as a definitive measure of educational quality or reform outcomes.

1. Introduction

Agricultural education stands at the intersection of two of the most urgent imperatives in the 2030 Sustainable Development Agenda: reducing agricultural greenhouse gas emissions and building knowledge systems capable of sustaining a green and digital transition in food production [1,2]. SDG 4 calls for inclusive and quality education; SDG 2 targets sustainable agriculture; SDG 13 demands climate action; and SDG 9 links industrialization and innovation to the infrastructure and institutional capacity that determines whether education reform can be operationalized. These goals are not parallel: they converge on the proposition that agricultural higher education must simultaneously cultivate low-carbon competencies and smart-agriculture capabilities, while doing so within national systems whose structural readiness for that task varies enormously [3,4].
The reform task is compounded because low-carbon and smart agriculture talent cultivation is not primarily a curriculum problem. It is a structural readiness problem. Curricula can be redesigned; faculty can be retrained; policies can signal intent. But reform at scale also requires delivery infrastructure that can support digital teaching, laboratories equipped for precision-agriculture training, institutions capable of coordinating across sectors, and governance systems that sustain rather than stall implementation. Without these enabling conditions, reform aspirations produce neither scalable change nor transferable competencies. The central question is therefore not only whether reform is desirable—it clearly is—but which countries actually possess the conditions that make reform feasible, sequenced, and sustainable [5,6].
Existing scholarship illuminates parts of this picture but does not address it comparatively. One stream examines agricultural education reform within single institutions or national settings, through curriculum analysis, policy review, or interview-based case studies [7,8,9]. A second stream investigates student and faculty attitudes toward digital agriculture and smart-farming education, consistently finding that demand for reform is strong but leaving structural conditions largely unexamined [10,11]. A third stream discusses sustainability-oriented agricultural education in broader terms, emphasizing competency frameworks, interdisciplinary design, and institutional partnerships [12,13]. Taken together, this literature establishes why reform matters and what form it should take, but it does not allow countries’ structural conditions for reform to be compared, ranked, or diagnosed.
Three gaps follow directly. First, there is no country-level comparative measure capable of capturing the structural enablers and barriers that govern whether SDG-linked agricultural education transformation is implementable. Second, green transition pressure and digital delivery constraints are still treated as separate agendas, which obscures the joint dependency of agricultural education reform on both dimensions simultaneously. Third, macro-structural diagnostics are rarely connected to micro-level educational actors—students, learners, and practitioners—in a way that checks whether structural bottlenecks are visible and consequential at the level of experienced reform demand.
This study addresses these gaps by developing the Agricultural Talent Cultivation Readiness Index (ATCRI) using publicly available data for 160 countries. The index evaluates readiness across four interdependent dimensions: Education and Research, Digital, Energy and Enabling Infrastructure, Green Transition Pressure, and Innovation and Institutional Capacity. ATCRI is designed to capture the enabling conditions for SDG-relevant agricultural education transformation at the country level, not curriculum quality, graduate outcomes, or realized performance. Crucially, the macro analysis is complemented by a dual-layer evidence design: respondent-level survey data from 416 Chinese crop science students serve not to validate the index statistically, but to check whether the structural bottlenecks identified in the macro analysis are also legible from the perspective of students living inside the educational system that the index diagnoses.
In this study, readiness is defined as a country’s proxy-based structural capacity to organize, deliver, and sustain low-carbon and smart agriculture talent cultivation within its higher education system. It does not refer to realized educational quality, graduate competence, or reform outcomes. Instead, it captures the enabling conditions—educational, infrastructural, institutional, and pressure-related—that shape whether SDG-linked agricultural education reform can be operationalized at scale.
Accordingly, this study addresses three questions. How uneven is global readiness for low-carbon and smart agriculture talent cultivation, and how does that unevenness map onto the SDG agenda? Which structural dimensions and country configurations most clearly differentiate barriers from enablers across national contexts? And do student perceptions in China reveal alignments or tensions that illuminate the relationship between macro structural conditions and micro-level reform orientation? By answering these questions, the study contributes a comparative and diagnostic framework for understanding the enabling conditions and bottlenecks through which agricultural education can, or cannot, be transformed in support of sustainable development goals.
The structure of the paper is organized around these three questions as follows. RQ1—the global distribution and income-group gradients of readiness—is addressed in Section 5.1 and Section 5.2. RQ2—the dimensional structure, structural typology, and pressure–capacity relationships—is addressed in Section 5.3, Section 5.4 and Section 5.5. RQ3—the interpretive triangulation using Chinese student survey evidence—is addressed in Section 5.7. Robustness analyses supporting RQ2 are reported in Section 5.6.

2. Literature Review

2.1. Agricultural Education and the SDG-Linked Sustainability Transition

A first strand of research examines how agricultural higher education can be repositioned to support sustainable development goals. The 2030 Agenda explicitly links food system transformation to progress across multiple SDGs, including SDG 2 (zero hunger and sustainable agriculture), SDG 4 (quality education), SDG 13 (climate action), and SDG 9 (industry, innovation and infrastructure) [1,2]. Education is recognized in this agenda not as a passive transmission mechanism but as an enabling condition: reforming agricultural training toward low-carbon competencies and sustainable practices is seen as a prerequisite for the broader agricultural transformation SDGs require.
Studies in this strand document the reform imperative in concrete terms. Wang et al. [8] identified barriers to embedding carbon-neutrality content in agricultural curricula, including weak faculty preparation, insufficient teaching materials, and limited industry linkage. Liu et al. [14] found that agricultural students may express strong interest in low-carbon training while still lacking adequate knowledge of carbon sequestration and low-carbon practices. Broader sustainability-transition scholarship similarly emphasizes that progress on SDG-relevant agricultural reform depends on coordinated investments across educational, infrastructural, and governance dimensions, not curriculum redesign alone [15,16].
The implication is direct. Recognizing the SDG-linked reform agenda does not itself indicate whether national systems are structurally prepared to implement it. Existing studies explain why reform matters, but they do not explain how countries differ in the enabling conditions that determine whether SDG-aligned agricultural education can be organized, delivered, and sustained at scale.

2.2. Smart Agriculture Competencies and the Conditions for Digital Delivery

A second strand examines the specific capabilities that low-carbon and smart agriculture talent cultivation must develop, and—crucially—what structural conditions must be in place for those capabilities to be taught, practiced, and institutionalized. Chen et al. [10] found that students in agricultural disciplines broadly welcome digital reform, but that their actual uptake is moderated by accessibility, infrastructure quality, and perceived implementation support. Ji et al. [11] similarly documented strong demand for digital and precision-agriculture training, especially in practice-oriented and laboratory-based settings.
These findings carry an important qualification. The competencies demanded by smart agriculture—precision sensing, AI-assisted decision making, data-driven crop management—are not acquired through attitude change or curriculum statement alone. They require teaching environments with reliable connectivity, data infrastructure, laboratory and field-training capacity, and interoperable digital platforms. The critical question is therefore not whether students want digital agricultural education, but whether the national delivery infrastructure needed to operationalize that education actually exists. Studies focused on attitudinal or perceptional outcomes consistently identify reform demand, but rarely address the structural conditions under which that demand can be met at scale [6,17].

2.3. Reform Implementation: Institutional Conditions, Enablers, and Barriers

A third strand moves from reform content to reform implementation, arguing that the enablers and barriers to agricultural education transformation are fundamentally institutional and systemic rather than purely pedagogical. Zhang et al. [9] emphasized curriculum redesign, practical training platforms, faculty development, and industry partnership as central pillars of reform—components that require governance capacity and cross-sector coordination, not only disciplinary expertise. Comparative programs in Europe and North America likewise show that practical infrastructure and institutional support are recurring determinants of successful implementation [18,19].
This literature converges on an important theoretical point. Agricultural education reform does not travel uniformly across national contexts. It is mediated by governance quality, innovation system depth, energy and digital infrastructure, and the ability to coordinate implementation across ministries, universities, and industry partners [20,21]. Where these conditions are strong, similar reform agendas can be absorbed and scaled; where they are weak, the same agendas stall at the level of policy statement. The barriers and enablers that govern SDG-linked agricultural education transformation are therefore not primarily located in the curriculum; they are located in the structural conditions that determine whether reformed curricula can be delivered, practiced, and institutionalized.

2.4. Composite Indicators and Readiness Measurement

The construction of cross-national composite indicators has a well-established methodological tradition. The OECD/JRC Handbook on Constructing Composite Indicators [22] provides the foundational reference for index design, covering indicator selection, normalization, weighting, aggregation, and sensitivity analysis. Subsequent work by Saisana et al. [23] and Mazziotta and Pareto [24] has extended this framework to address issues of robustness, uncertainty communication, and the trade-offs between equal weighting and data-driven alternatives.
This tradition has produced numerous domain-specific readiness indices. Digital economy indices—including the Digital Economy and Society Index (DESI) published by the European Commission [25] and the Network Readiness Index (NRI) developed by the World Economic Forum [26]—measure countries’ capacity for digital transformation. AI readiness assessments have similarly emerged to gauge national preparedness for artificial-intelligence adoption. SDG dashboards and monitoring frameworks, such as those maintained by UNESCO [27], track progress toward education-related sustainable development targets at the country level. Innovation-capacity indices complement these by capturing R&D intensity, patent activity, and high-technology export performance.
What remains underdeveloped in this literature is the application of composite-indicator methods to the specific domain of agricultural education green/digital transition readiness. Existing digital-readiness and innovation indices capture generic national capabilities but do not operationalize them in terms of the structural conditions that determine whether higher education systems can deliver low-carbon and smart agriculture talent cultivation. The ATCRI is positioned within this tradition as a proxy-based diagnostic tool that adapts established composite-index methodology to the understudied intersection of agricultural education, multi-SDG interlinkages (SDG 2/4/9/13), and dual green–digital transition pressures. It does not claim to measure educational quality directly; instead, it approximates the enabling conditions that shape whether such quality can be realized at scale.

2.5. Research Gaps and the Contribution of This Study

Taken together, the literature reveals a coherent but unresolved problem. Existing research establishes the SDG-linked imperative for agricultural education reform and identifies the main components of reform at the institutional and competency level. What it lacks is a cross-national comparative framework that can systematically assess the enabling conditions and barriers that govern whether SDG-relevant agricultural education transformation is feasible under different national contexts.
Three specific gaps follow. First, no country-level comparative measure currently exists that integrates educational capacity, digital delivery infrastructure, green transition pressure, and institutional-innovation conditions into a single diagnostic architecture. Second, the interlinkages across SDG-relevant dimensions—where educational capacity, delivery infrastructure, climate pressure, and institutional coordination are jointly rather than independently operative—remain unmeasured in cross-country comparison. Third, macro-structural diagnostics of reform conditions are rarely linked to micro-level evidence from educational actors, leaving it unclear whether structural bottlenecks identified at the national level correspond to reform demands experienced at the student level.
This study responds to these gaps by developing the ATCRI as a cross-national framework for assessing the structural barriers and enablers that govern SDG-linked agricultural education transformation. It integrates green transition pressure and digital delivery constraints within a single analytical structure, explicitly addresses multi-SDG interlinkages by connecting educational capacity to infrastructure, climate, and governance dimensions simultaneously, and links the macro framework to respondent-level student evidence from China to form a dual-layer evidence chain that provides context-specific triangulation rather than cross-level statistical validation.
Table 1 summarizes how the ATCRI extends prior research streams by addressing specific gaps in each literature domain.

3. Theoretical Framework

3.1. Defining Agricultural Talent Cultivation Readiness

In this study, agricultural talent cultivation readiness refers to the configuration of structural conditions that makes reform toward low-carbon and smart agriculture more or less feasible within a country’s higher education system. This definition is grounded in the 2030 Sustainable Development Agenda: progress toward SDG 2, SDG 4, SDG 9, and SDG 13 each requires agricultural education systems that can simultaneously build green competencies and support digital transformation, but the feasibility of that requirement depends critically on the national structural conditions that the ATCRI is designed to assess. The index thus functions as a diagnostic tool for identifying the enabling conditions and bottlenecks through which education systems can, or cannot, advance SDG-relevant agricultural transformation at scale.
The ATCRI is not intended to measure curriculum quality, graduate competence, or realized educational performance directly. Instead, it captures the educational, infrastructural, pressure-related, and institutional conditions that shape whether reform can be organized, delivered, and sustained. A country may therefore score highly on readiness while still performing unevenly in practice. The index speaks to preparedness for SDG-linked agricultural education reform rather than reform success in completed form.
Table 2 clarifies the conceptual distinction between what ATCRI measures and what it does not.
A clarification regarding the fourth category is warranted. Indicators such as scientific article output, patent applications, and high-technology exports are not measures of educational quality or reform outcomes per se; they serve as revealed capacity proxies, capturing past and current innovation-system performance that approximates the latent capacity of the national knowledge-production infrastructure. A country with high article and patent counts is therefore interpreted as having a stronger innovation base, not as having already achieved superior agricultural education outcomes. This proxy relationship is inherently approximate, which is why the index is characterized as diagnostic rather than definitive.

3.2. The Green–Digital Dual Transition Framework

The ATCRI framework assumes that agricultural talent cultivation readiness emerges from four interdependent structural dimensions [1,3,4]. The first is Education and Research Foundation (Supply-Side Capacity). This dimension captures the absorptive and knowledge base of the national higher education system. Indicators include tertiary enrollment, R&D expenditure, scientific article output, and researchers per million. Stronger education-research systems expand both the production of relevant knowledge and the capacity to absorb reformed curricula.
The second is Digital, Energy and Enabling Infrastructure (Delivery Capacity). This dimension is designed to capture reform delivery conditions rather than digital access alone. Smart-agriculture education requires data connectivity for teaching and platform use, secure digital environments for storing and exchanging knowledge, and reliable energy systems for operating laboratories, devices, and data-intensive learning environments. Indicators therefore include internet penetration, secure internet servers per million, and renewable electricity output. Taken together, they capture whether smart-agriculture education can be operationalized at scale rather than merely accessed in principle [17]. This dimension is of particular importance for SDG-linked agricultural education transformation, since it determines whether the delivery layer of reform—digital teaching systems, practice platforms, laboratory infrastructure, and cross-institutional connectivity—can sustain implementation over time rather than remaining aspirational.
The third is Green Transition Pressure (Demand-Side Driver). Countries with larger agricultural sectors and higher agricultural emissions face stronger structural pressure to reform agricultural education toward low-carbon and smart development. Indicators include agricultural value added as a share of GDP and agricultural CO2 emissions. These variables are not interpreted as readiness in themselves. Rather, they capture the urgency of reform demand, which can only be translated into readiness when matched with educational, infrastructural, and institutional capacity [28,29].
The fourth is Innovation and Institutional Capacity (Coordination Capacity). Reform requires coordination, implementation continuity, and the ability to mobilize structural resources. Indicators therefore include government effectiveness, high-technology exports, and patent applications. These variables capture whether a country possesses the governance quality and innovation capacity needed to organize and sustain complex reform processes [16,20,21].
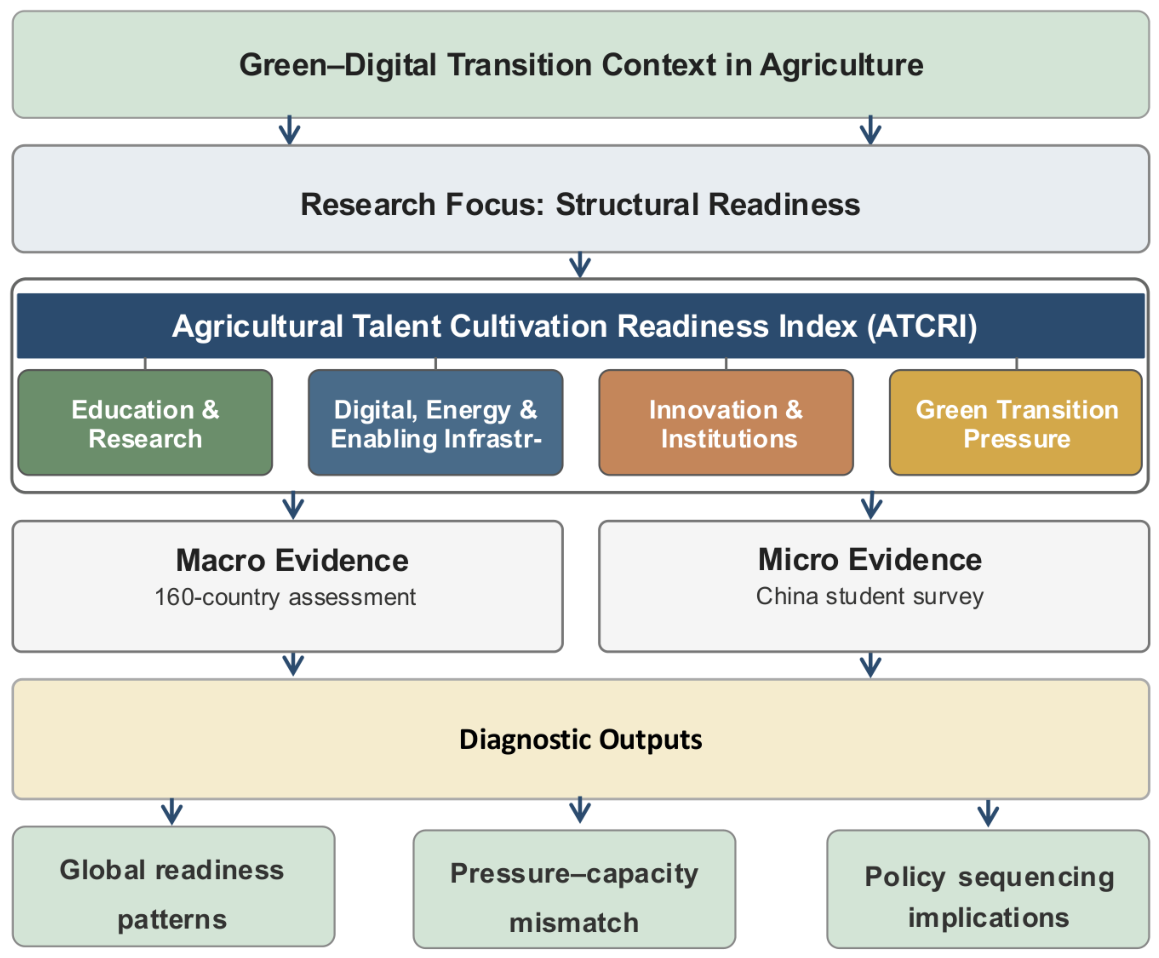
The mapping from indicators to dimensions follows a straightforward logic: education and research provide the knowledge base, delivery infrastructure determines whether reform can be operationalized, transition pressure creates urgency, and institutional-innovation capacity determines whether implementation can be coordinated over time.
The framework depicted in Figure 1 provides the structural foundation for the empirical analysis that follows.

3.3. Theoretical Chain

The theoretical chain can be stated as follows: green transition pressure creates reform urgency; education and research foundation supplies absorptive and knowledge capacity; digital, energy and enabling infrastructure determines whether reform can be operationalized at scale; and innovation and institutional capacity determines whether coordination and implementation can be sustained. Readiness is therefore a conditional configuration rather than the additive sum of independent dimensions.
This conditional logic matters. High reform pressure without knowledge and delivery capacity produces urgency without implementation. Strong education and innovation systems without operational infrastructure produce latent capability without scalable delivery. Likewise, digital and institutional capacity without meaningful transition pressure may leave reform under-prioritized. The multidimensional structure of the ATCRI is intended to capture this interdependence rather than to imply that each dimension operates in isolation. Crucially, the four dimensions map onto multiple SDGs simultaneously: educational capacity aligns with SDG 4 and SDG 9; delivery infrastructure with SDG 9; transition pressure with SDG 2 and SDG 13; and institutional-innovation capacity with SDG 16 and SDG 17. The ATCRI therefore approximates, rather than directly captures, the structural conditions through which SDG interlinkages in the agricultural education domain may be operationalized.

3.4. Hypotheses

Derived from this framework, the empirical analysis is guided by five hypotheses. H1 proposes that Education and Research capacity will be one of the main dimensions distinguishing higher-readiness from lower-readiness countries, because it captures the absorptive and knowledge base needed to organize and sustain reformed curricula. H2 proposes that Digital, Energy and Enabling Infrastructure will play a key role in differentiating country configurations with otherwise similar educational or institutional profiles, since delivery infrastructure conditions whether upstream capability can be translated into scalable implementation. H3 proposes that the relationship between green transition pressure and overall readiness will be conditional: high pressure alone will be insufficient unless combined with education, delivery infrastructure, and institutional capacity, a claim assessed through the pressure–capacity paradox analysis. H4 proposes that Innovation and Institutional Capacity will help differentiate country configurations in which coordination and implementation continuity are the binding constraints, especially where educational and infrastructural conditions are present but reform remains weakly institutionalized. H5 (revised) proposes that in the China case, student perceptions are expected to provide context-specific evidence of perceived reform demand that can be interpreted alongside, but not used to validate, the macro-level structural diagnosis. Specifically, where the macro analysis identifies a delivery-infrastructure bottleneck (e.g., a weak Digital score), students are expected to report elevated demand for practice-oriented training and external engagement—a pattern interpretable as tension between structural conditions and perceived needs rather than confirmation.

4. Data and Methods

4.1. Macro-Level Country Data

4.1.1. Data Sources

The macro-level dataset integrates three open-source repositories for the period 2019–2023 [30,31,32]. The World Bank World Development Indicators (WDIs) provide national-level indicators on tertiary enrollment, R&D expenditure, scientific publications, researchers, internet penetration, secure servers, renewable electricity, agricultural value added, high-technology exports, and patent applications. The World Governance Indicators (WGIs) provide the Government Effectiveness measure, capturing the quality of public services, civil-service credibility, and policy implementation capacity [31,33]. The EDGAR GHG Emissions Database provides country-level agricultural CO2 emissions, enabling construction of the Green Transition Pressure dimension [32,34]. All data are publicly available and freely downloadable, which improves transparency and reproducibility.
The macro dataset is designed to capture national enabling conditions for reform rather than direct measures of curriculum quality or graduate competence. It therefore offers a structural rather than outcome-based view of agricultural talent cultivation readiness.

4.1.2. Time Window

The 2019–2023 window was chosen to capture recent post-2015 transition dynamics while avoiding over-reliance on any single year. It spans the period immediately before, during, and after the COVID-era disruption, and the five-year average helps dampen short-term volatility. All indicators are averaged across this window to retain a recent but comparatively stable cross-national picture.

4.1.3. Sample Construction

Countries were included if data were available for at least 8 of the 12 indicators (minimum threshold = 67% completeness). This screening yielded a final analytical sample of 160 countries. Countries with fewer than 8 valid indicators were excluded from downstream analysis rather than completed through aggressive imputation.
For countries retained in the analytical sample, the remaining missing entries (61 countries, each missing 1–4 indicators) were median-imputed after normalization so that the index, structural typology, and robustness checks could be computed on a common country set. Median imputation was chosen as a conservative completion rule: it attenuates the influence of extreme values and avoids mechanically rewarding countries with sparse data. The 67% threshold prioritizes minimum dimensional interpretability over maximal country coverage, ensuring that each retained country contributes information from multiple ATCRI dimensions.

4.1.4. Missing Data

The missing-data pattern across the 12 indicators is as follows. Four indicators account for the majority of missingness: Researchers in R&D per Million (data available for 98 of the 160 countries; 62 missing), R&D Expenditure as % of GDP (available for 104 countries; 56 missing), Agricultural CO2 Emissions (available for 106 countries; 54 missing), and Patent Applications (available for 125 countries; 35 missing). The remaining eight indicators each have fewer than 21 missing entries (range: 0–20). Appendix Table A1 reports the full per-indicator missingness pattern. Among the final 160 countries, 61 had 1–4 imputed entries. A total of 57 countries were excluded before final analysis: 35 countries had fewer than 8 valid indicators, and 22 were removed for additional data-quality reasons (e.g., all-indicator missing or aggregate-code entries without matched indicator data).
Six implausible negative observations were identified in Renewable Electricity Output, ranging from −0.002% to −6.34% across six countries. Because negative renewable electricity shares are not substantively interpretable as readiness indicators—they likely reflect data-coding or unit-conversion artifacts rather than genuine physical measurements—these observations were treated as missing prior to normalization and median imputation. Source-level resolution was not possible, so conservative imputation was adopted and documented transparently.
Multiple imputation was considered but not adopted for three reasons. First, the missingness pattern is predominantly structural: many countries simply do not report R&D statistics because their national statistical systems do not collect them systematically. This is not missing-at-random (MAR) data amenable to standard multiple-imputation assumptions. Second, median imputation provides a transparent, conservative baseline that does not artificially inflate scores for data-sparse countries—a property that matters when the index is used for diagnostic comparison across development levels. Third, robustness check R4 (reported below) confirms that excluding the two sparsest indicators (Researchers per Million and R&D Expenditure) from the index altogether does not alter substantive conclusions about global distribution, pressure–capacity relationships, or China’s structural profile. For all these reasons, median imputation was selected as the primary missing-value treatment, with transparency about its limitations noted throughout.
The four indicators with the highest missing rates were Researchers in R&D per Million (available for 98 countries), R&D Expenditure as % of GDP (available for 104 countries), Agricultural CO2 Emissions (available for 106 countries), and Patent Applications (available for 125 countries). Because Researchers per Million and R&D Expenditure both belong to the Education and Research dimension, they represent the main potential source of missingness-related sensitivity—addressed by Robustness Check R4 (Reduced Dimension). The full per-indicator breakdown is reported in Appendix A Table A1.

4.2. Micro-Level Survey Data

The micro-level analysis draws on a structured questionnaire administered to students in crop science programs at a major Chinese agricultural university. The respondent-level questionnaire file contains 25 questions in total: three demographic items (gender, educational level, and major), 20 closed-ended Likert items (Q4–Q23), and two optional open-ended questions (Q24–Q25). The instrument was designed to assess four latent constructs relevant to low-carbon and smart agriculture reform: Normative Orientation, Knowledge Base, Curriculum and Practice Demand, and Behavioral Intention. The survey is treated as a single-institution Chinese case rather than as a nationally representative sample of agricultural students.
A total of 416 valid questionnaires were collected. The sample consists of 37.0% male and 63.0% female respondents, 299 undergraduates, 109 master’s students, and 8 doctoral students, and 73.1% crop-science-track majors versus 26.9% related programs. Each of the 20 closed-ended items has complete valid responses in the respondent-level matrix. Subgroup comparisons are therefore interpreted as within-sample contrasts rather than population estimates.
Survey items were rated on a 5-point Likert scale (1 = strongly disagree/very unimportant; 5 = strongly agree/very important). The 20 closed-ended items are organized into four questionnaire constructs: Normative Orientation (5 items), Knowledge Base (5 items), Curriculum and Practice Demand (6 items), and Behavioral Intention (4 items). Because the respondent-level matrix is available, the analysis reports construct means together with internal-consistency and factorability diagnostics, including Cronbach’s alpha, corrected item-total correlations, KMO, Bartlett’s test, and a four-factor exploratory factor analysis.
The survey is not used to validate national scores statistically. Instead, it provides theory-consistent micro-level evidence on whether the structural bottlenecks identified by the ATCRI are visible in student perceptions. Its role is interpretive triangulation rather than cross-level causal inference.

4.3. Variable Design

Table 3 presents the 12 indicators comprising the ATCRI, their data sources, dimensions, and expected directional relationships. The mapping from indicators to dimensions follows the theoretical framework developed above.
Several indicators should be understood as structural proxies rather than education-sector-specific measures. For example, secure internet servers and renewable electricity output do not measure agricultural teaching facilities directly; instead, they capture national-level delivery conditions that shape whether digital agricultural education can be reliably operationalized. Likewise, agricultural value added and agricultural CO2 emissions are not interpreted as readiness themselves, but as structural demand-side pressures that make reform more urgent.

4.4. Index Construction

The ATCRI employs a theory-informed composite weighting strategy based on the premise that all four dimensions are necessary, but not sufficient, conditions for readiness. Across dimensions, each dimension receives equal weight (25%), reflecting the view that no single dimension should dominate the diagnosis. Within each dimension, indicators also receive equal weight; for example, in the Education and Research dimension, each of the four indicators contributes 25% to that dimension’s score. This approach avoids dominance by highly variable indicators such as patent counts and scientific article output, and it is consistent with established guidance on transparent composite-indicator construction [22,23,24].
The main ATCRI model therefore applies equal weighting both across and within dimensions. This specification was selected because the theoretical framework treats the four dimensions as jointly necessary conditions, entropy weighting on the full sample would assign disproportionate weight to highly skewed indicators—especially patents—and equal weighting yields a more interpretable and policy-relevant diagnostic. Entropy weights are reported as a complementary robustness specification rather than as the main model.
The equal-weighting specification is grounded in three complementary considerations. First, theoretically, the four dimensions correspond to supply capacity (Education), delivery capacity (Digital), demand pressure (Green), and coordination capacity (Innovation); allowing any single dimension to dominate would distort the diagnostic balance that the framework intends to provide. Second, methodologically, equal weighting maximizes transparency and replicability—properties emphasized in the OECD/JRC handbook on composite indicator construction [22]. Data-driven alternatives such as entropy weighting would assign disproportionate weight to high-variance indicators (particularly patent counts), thereby shifting the construct from balanced readiness to variance-dominant capacity. Third, robustness checks reported in Section 5.6 confirm that the main findings—including China’s internal asymmetry profile and the pressure–capacity paradox—are stable under entropy weights, PCA weights, uniform indicator-level weights, reduced-dimension specifications, and dimensional re-weighting schemes.

Normalization

All 12 indicators were normalized to a [0, 1] range using min-max scaling applied to the full 160-country sample:
x i j n o r m = x i j min ( x j ) max ( x j ) min ( x j )
For negative-direction indicators (agricultural value-added share and agricultural CO2 emissions), the normalized values were reversed ( 1 normalized ) so that higher values consistently indicate greater readiness:
x i j r e v = 1 x i j n o r m
This reversal ensures that the dimension scores remain interpretable as readiness indicators rather than raw pressure levels. A country with higher agricultural emissions does not score higher on readiness; it scores higher on the pressure dimension only after that pressure has been translated into a readiness-oriented scale.

4.5. Robustness Checks

Four robustness specifications were pre-specified to assess whether the main findings remain stable under alternative aggregation methods. R1 uses Shannon entropy weights computed from the 160-country normalized data and applied at the indicator level within dimensions, thereby testing sensitivity to data-driven weighting. R2 uses first principal component loadings as indicator weights, thereby testing sensitivity to statistical weighting. R3 assigns each indicator a uniform weight of 1/12 regardless of dimension membership, thereby testing sensitivity to the dimension-level aggregation structure. R4 excludes the two most-missing indicators—Researchers per Million and R&D Expenditure—and recomputes the index on the remaining 10 indicators using the main model’s equal-weighting scheme, thereby testing sensitivity to missing data in the Education and Research dimension.
Robustness is evaluated not only in rank-order terms, but also in whether the paper’s structural interpretation survives alternative weighting and variable-selection rules. Particular attention is therefore paid to China’s profile stability and to whether the contrast between capacity-rich and capacity-poor structural configurations remains visible across specifications.
Four additional robustness specifications extend the sensitivity analysis. R5 assigns an elevated weight to the Digital, Energy and Enabling Infrastructure dimension (40% vs. 25% in the main model), testing whether emphasizing delivery infrastructure alters substantive conclusions. R6 assigns a reduced Digital weight (15%), testing whether de-emphasizing delivery infrastructure changes the diagnosis. R7 applies a symmetric re-weighting scheme in which each dimension is assigned 35%, 25%, 20%, and 20%, respectively (Education highest, Green lowest), testing a theory-motivated asymmetric weighting. R8 applies winsorized min-max normalization: before computing the [0,1] normalized values, the top and bottom 1% of each indicator’s raw distribution are trimmed to their 99th and 1st percentile values, respectively. This tests whether extreme outliers—particularly in patent counts and scientific article output—drive the main findings. Results of R5–R8 are reported alongside R1–R4 in Section 5.6.

4.6. Country Grouping and Structural Typology

Countries were first assigned to four readiness groups using pre-specified score thresholds: High (≥0.75), Upper-Middle (0.55–0.75), Lower-Middle (0.35–0.55), and Low (<0.35). These thresholds are interpretive bands for descriptive presentation rather than empirical quartiles, so the resulting group sizes are intentionally unequal.
Separately, the structural typology reported in the Results section was generated by k-means clustering ( k = 4 , random_state = 42, n_init = 10) on the standardized four-dimension score vector for each country [35,36]. The choice of k = 4 was made ex ante to mirror the paper’s four-band descriptive readiness framework and to keep the typology interpretable at the cross-national level. Adjacent solutions ( k = 3 and k = 5 ) were compared: k = 3 collapsed structurally distinct country profiles in the middle tiers, while k = 5 produced a fifth cluster with no clear substantive interpretation and showed increased sensitivity to initialization. The four-cluster solution therefore offers the best balance between structural differentiation and interpretive stability. The raw numeric cluster IDs were retained in the analysis dataset, while the manuscript reports descriptive labels (Cluster A–D) derived from the relative cluster-center profiles. This distinction is crucial: the readiness groups summarize overall score levels, whereas the cluster labels summarize multidimensional structural configurations.

4.7. Income-Group Comparative Lens

To assess whether the ATCRI patterns merely reproduce broad development categories or reveal more specific structural configurations, the Results section also reports descriptive comparisons by World Bank income group (low, lower-middle, upper-middle, and high income). For each group, mean ATCRI and mean dimension scores were computed on the same 160-country sample. China is then interpreted against the upper-middle-income group baseline and, where relevant, against the high-income group mean. This step remains descriptive rather than causal, but it helps distinguish broad development-stage gradients from analytically meaningful within-tier imbalances.

5. Results

5.1. Global Readiness Is Highly Uneven [RQ1]

Table 4 reports the descriptive statistics for the 12 ATCRI indicators across the 160-country sample. Large cross-national variation is observed across all dimensions, with the sharpest dispersion concentrated in digital infrastructure and innovation variables. This pattern already indicates that agricultural talent cultivation reform is likely to be differentiated less by reform rhetoric than by the uneven distribution of enabling conditions.
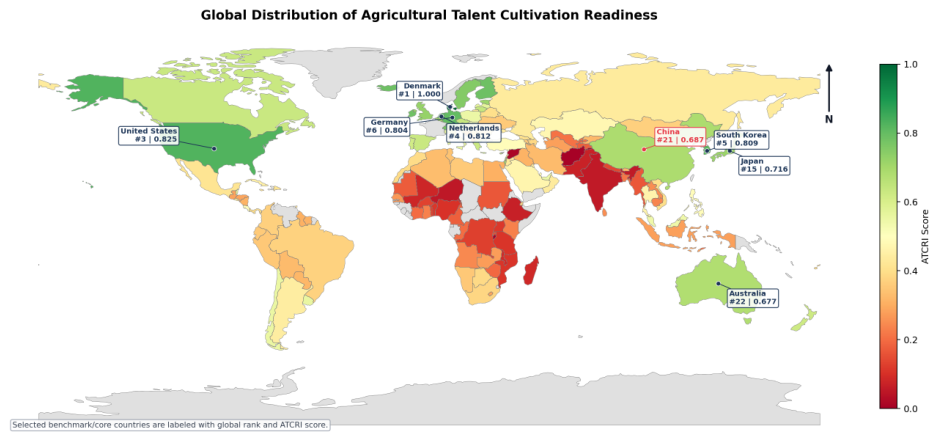
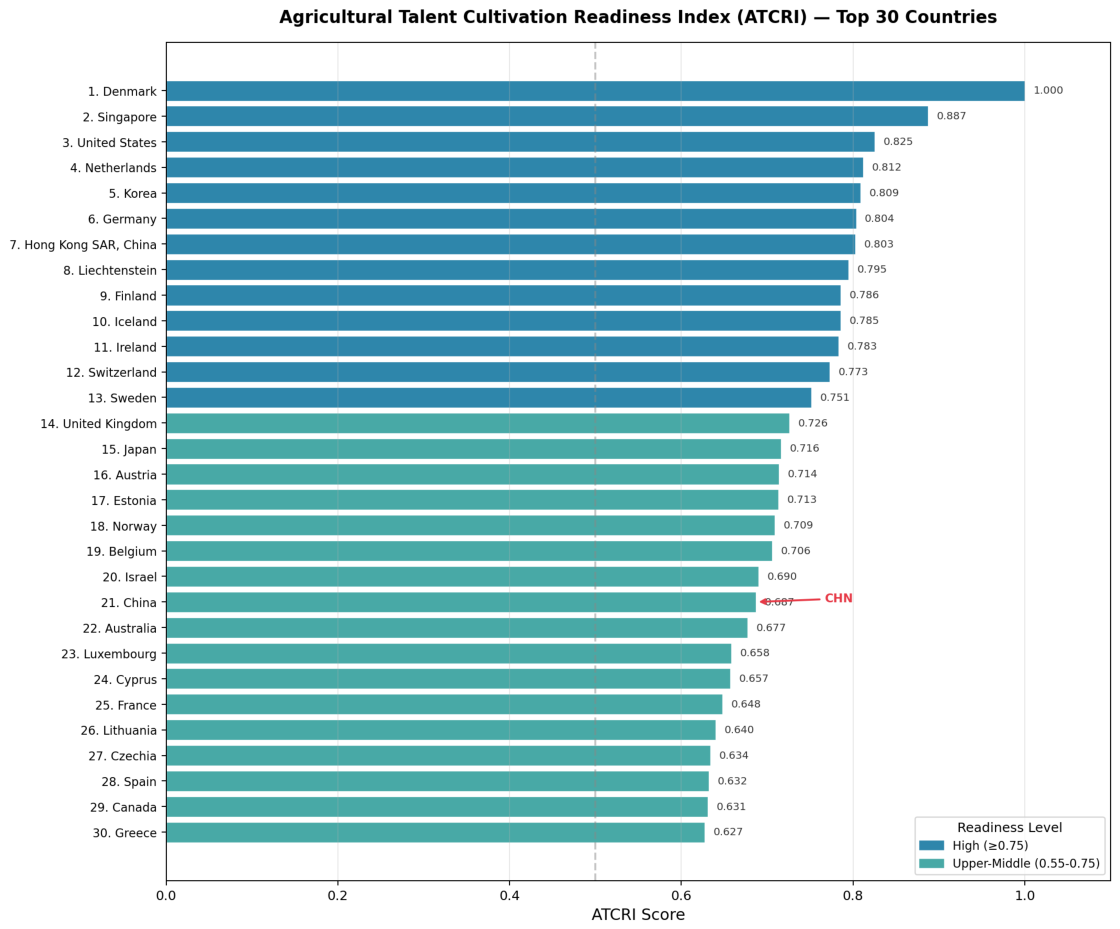
Figure 2 shows a markedly uneven global distribution of agricultural talent cultivation readiness. Denmark leads with an ATCRI score of 1.000, followed by Singapore (0.887), the United States (0.826), the Netherlands (0.812), and South Korea (0.809). Only 13 countries fall in the High group, whereas 61 remain in the Low group. High-scoring cases are concentrated in Europe, North America, and advanced East Asian economies, while Sub-Saharan Africa and South Asia are disproportionately represented in the lower bands. The ranking therefore points to pronounced global inequality in reform readiness rather than a smooth cross-country gradient.
Figure 3 reinforces the same conclusion spatially: ATCRI scores cluster in regional patterns rather than diffuse smoothly across the world. High-readiness cases are concentrated in Europe, North America, East Asia, and Oceania, whereas many countries in Sub-Saharan Africa and South Asia remain in the Low or Lower-Middle groups. This is not just a map of income differences; it is a map of uneven structural capacity for reform.
China ranks 21st globally with an ATCRI score of 0.687 (Table 5), placing it just below Israel (0.690) and above Australia (0.676). Its position is supported by very strong Innovation (1.000) and Education (0.835), but constrained by a much lower Digital, Energy and Enabling Infrastructure score (0.288). The next step is therefore to examine which dimensions drive this ordering.
Table 6 provides an indicator-level comparison of China’s scores against the average of the top 10 countries, highlighting where specific gaps are largest.

5.2. Dimension-Level Comparison and China as an Internally Uneven Key Case [RQ2]

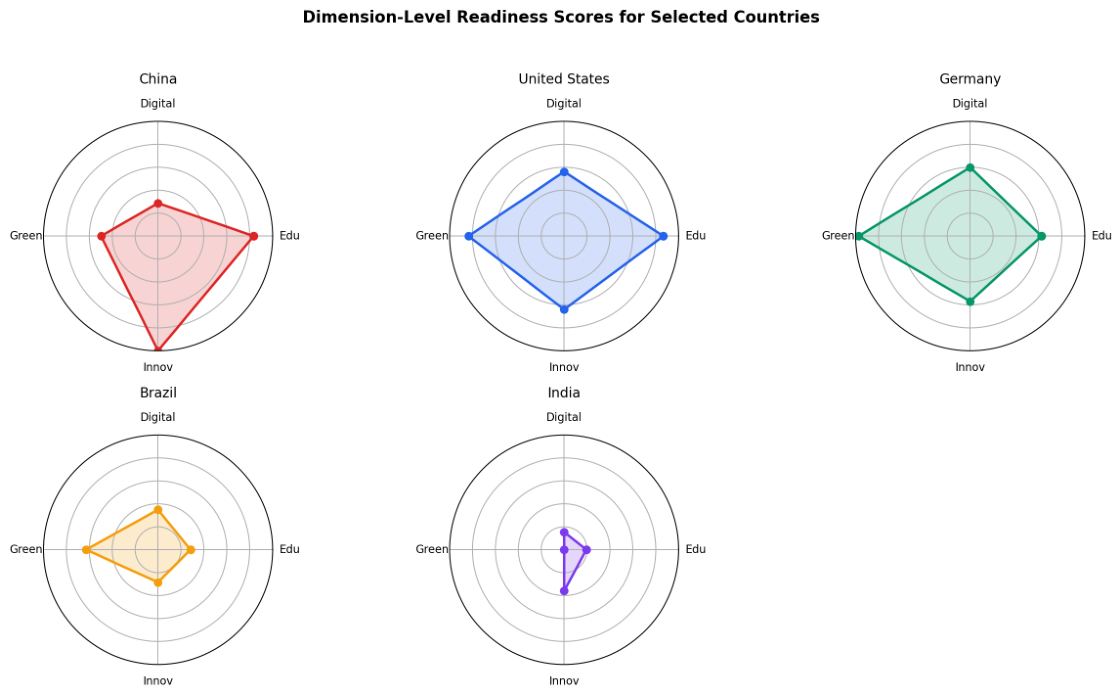
Similar ATCRI scores can conceal very different internal profiles. Figure 4 compares China with the United States, Germany, Brazil, and India, showing that comparable overall scores may rest on quite different dimensional compositions.
The sharpest contrast appears in the Digital, Energy and Enabling Infrastructure dimension. Denmark (1.000) and the United States (0.561) sit well above Brazil (0.350) and India (0.154), while China (0.288) remains much weaker here than its Education (0.835) and Innovation (1.000) scores would suggest. In practical terms, this dimension reflects whether a country has the delivery conditions needed to scale smart-agriculture teaching: connected systems, secure platforms, and reliable operational infrastructure. Where those conditions are thin, reform may be normatively endorsed but difficult to institutionalize.
The Education and Research dimension is less polarized than Digital infrastructure, suggesting that some countries retain partial absorptive capacity even when their delivery systems remain constrained. The Green Transition Pressure dimension follows a different logic again. Countries with large agricultural sectors or heavier agricultural emissions burdens may score high on pressure, but that pressure does not automatically lift readiness. Denmark and Singapore combine high pressure with strong capacity; Brazil faces substantial pressure as well, but with a weaker capacity base and much lower overall readiness. China’s Green score (0.498) places it closer to the middle of the global distribution.
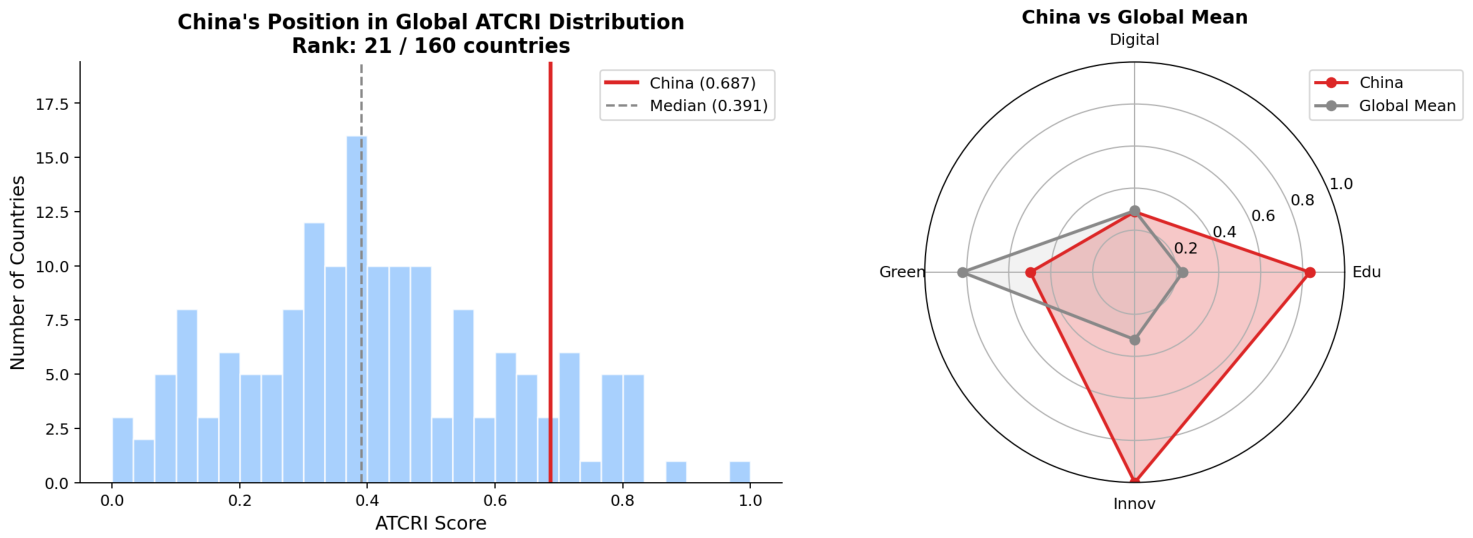
Figure 5 places China within the full ATCRI distribution and clarifies why it is analytically useful. China is not simply a high-scoring country case; it is a strong but internally uneven case in which research and innovation capacity are already substantial, while reform delivery conditions remain weaker. China’s Digital score should therefore be interpreted as a national delivery-condition proxy rather than a direct measure of agricultural teaching infrastructure.

5.3. Income-Group Gradients and Beyond-Income Variation [RQ1]

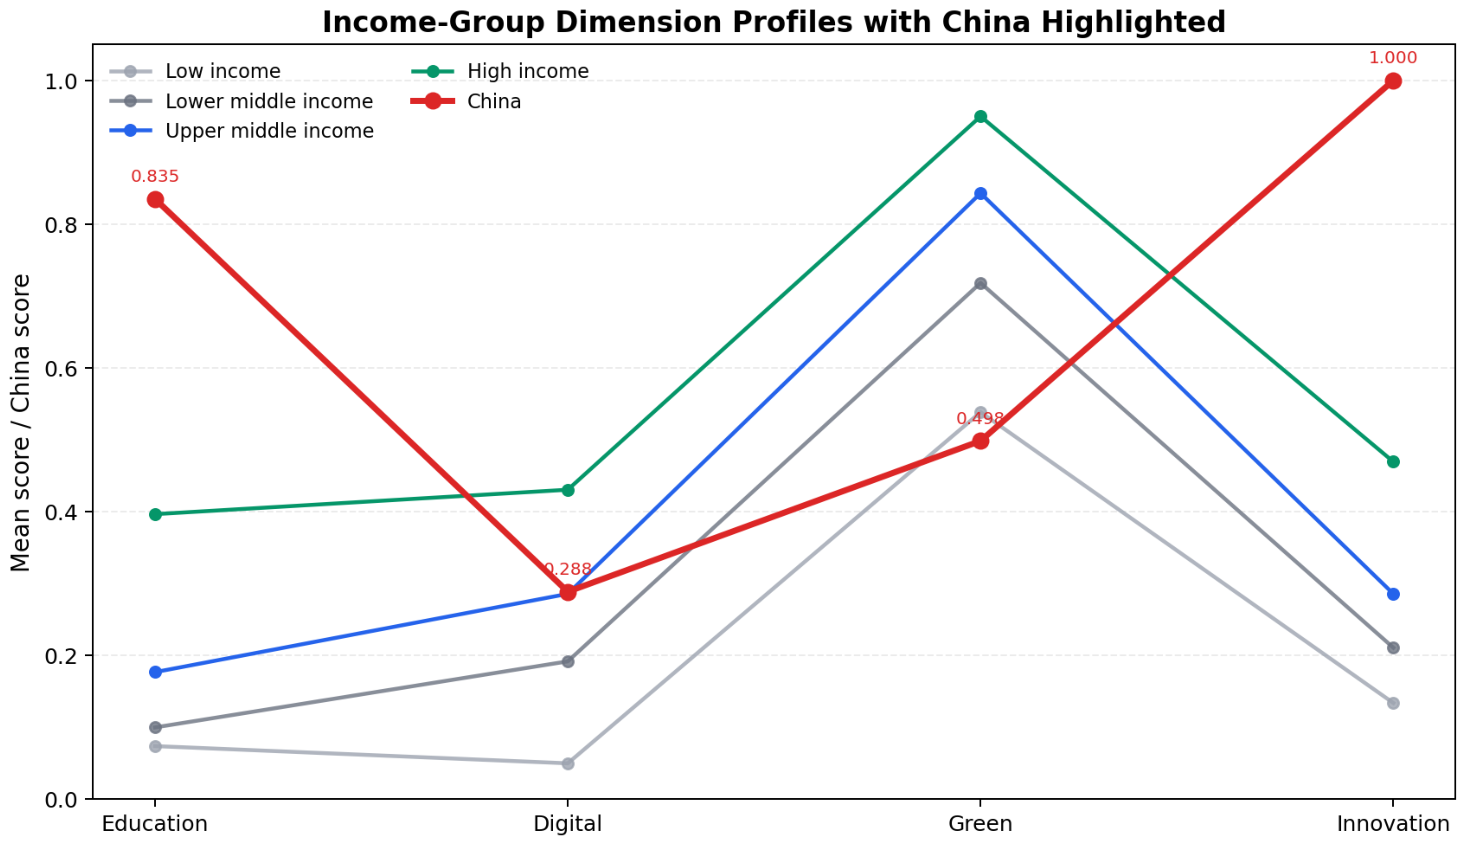
Table 7 shows that readiness follows a strong income gradient, but not a mechanically uniform one. Mean ATCRI rises from 0.090 in low-income countries to 0.620 in high-income countries. The steepest cross-group increases occur in Education and Research and in Innovation and Institutional Capacity, whereas Digital, Energy and Enabling Infrastructure improves more gradually and Green Transition Pressure is already relatively high in many middle-income countries. This suggests that broad development stage matters, but does not fully explain the structure of readiness.
Figure 6 makes China’s deviation from its development tier easier to see. Relative to the upper-middle-income group, China is far above the group mean in overall ATCRI (0.687 vs. 0.391), Education (0.835 vs. 0.176), and Innovation (1.000 vs. 0.285). Yet its Digital score (0.288) is almost identical to the upper-middle-income mean (0.285) and remains well below the high-income mean (0.430). This is not a story of generalized weakness, but of implementation asymmetry: knowledge production and innovation mobilization have advanced much faster than the delivery infrastructure needed to translate those strengths into scalable reform conditions. China therefore appears as a hybrid profile—strong in upstream knowledge and innovation, but still only mid-tier in the delivery infrastructure that turns reform ambition into routine implementation. That contrast helps explain why China can belong to the higher-readiness tier while still exhibiting a visible bottleneck in practice delivery.

5.4. Structural Typology: Configurations vs. Levels [RQ2]

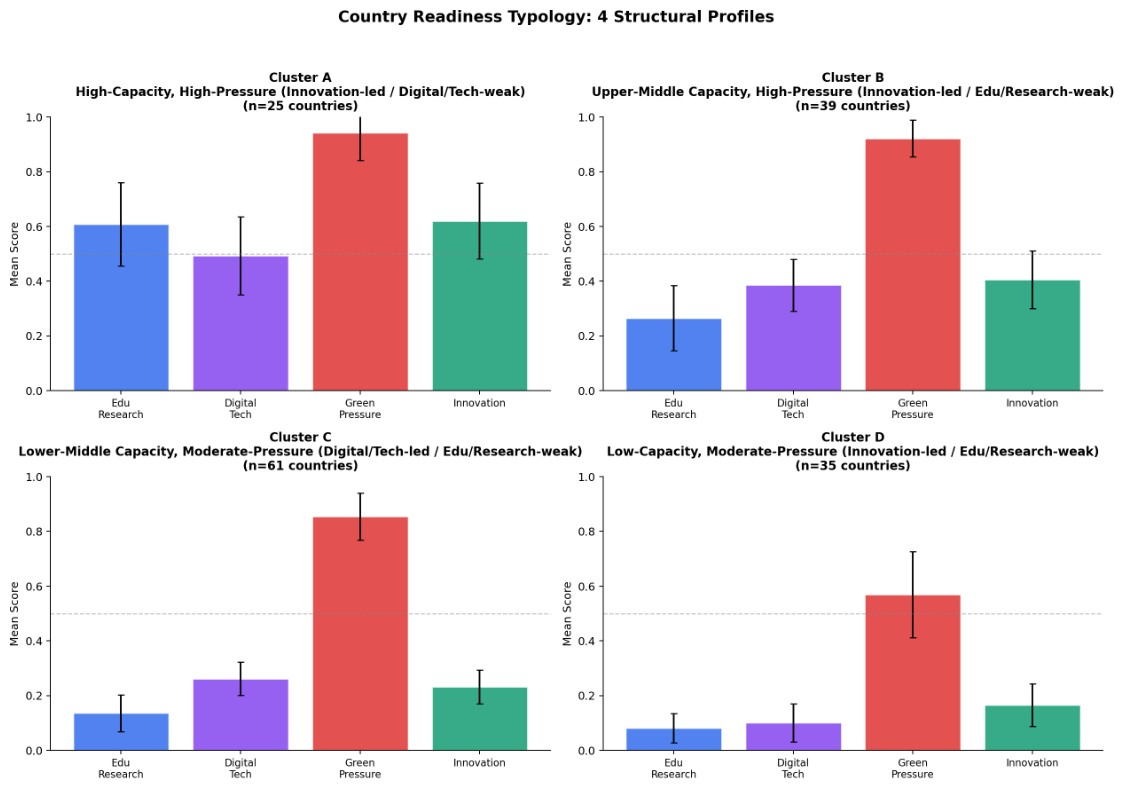
Overall scores describe levels of readiness; clusters describe configurations of readiness. Figure 7 presents the four country readiness profiles derived from k-means clustering on standardized dimension scores. The labels are descriptive summaries of the cluster centers rather than algorithm-native outputs, allowing the typology to highlight structural differences without overstating semantic precision.
The k-means analysis reveals four structurally distinct profiles. Cluster A (n = 25) is a high-capacity, high-pressure comparator group that includes Denmark, Singapore, the United States, Germany, South Korea, and China. These countries combine strong Education, Innovation, and relatively high overall capacity with elevated transition pressure. Cluster B (n = 39) forms a second tier with substantial but more uneven capacity; cases such as Luxembourg, Cyprus, Lithuania, Czechia, and Spain face considerable reform pressure, yet their educational or delivery foundations are thinner than those of Cluster A. Cluster C (n = 61) represents an intermediate but constrained profile, including Serbia, Kuwait, Mauritius, Oman, and Montenegro, where scores are compressed around the middle range and especially limited by education and innovation capacity. Cluster D (n = 35) is the structurally weakest profile, represented by countries such as Indonesia, Angola, Cambodia, Kenya, and Ghana, where multiple enabling conditions remain thin at the same time.
China’s location in Cluster A is analytically important. It places China among the world’s relatively strong reform-capacity cases, but without implying that its structure is internally balanced. What distinguishes China within this higher-capacity set is the gap between its very high innovation and education scores and its weaker delivery infrastructure. The cluster analysis therefore complements the ranking rather than duplicating it.

5.5. The Pressure–Capacity Matrix and Part-Whole Considerations [RQ2]

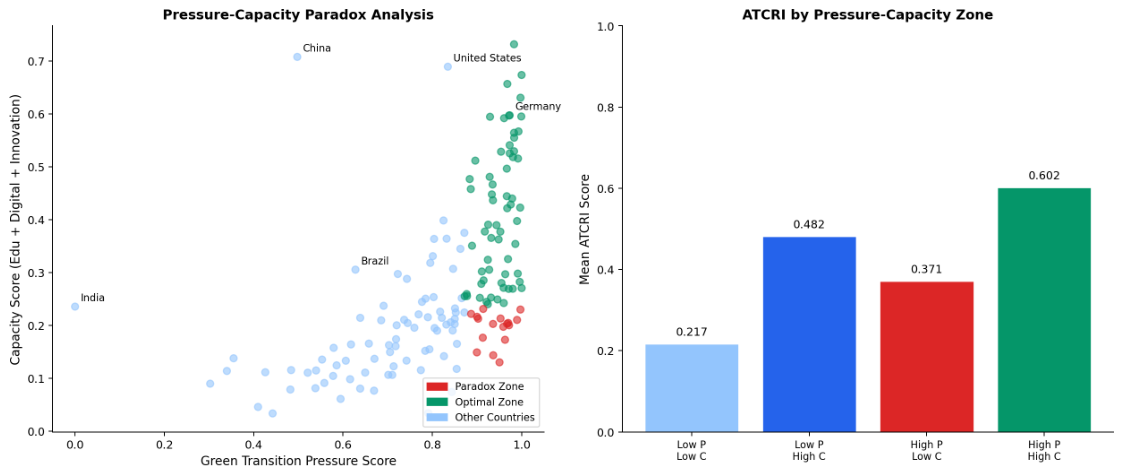
The pressure-capacity matrix directly evaluates whether transition pressure, by itself, is sufficient to produce readiness. Figure 8 classifies countries by a median split on the Green Transition Pressure score and on aggregate capacity (the mean of Education, Digital, and Innovation scores).
Table 8 reports mean ATCRI scores by pressure-capacity zone.
The paradox zone (High Pressure/Low Capacity) contains 17 countries. These are the most difficult reform settings: the need for transition is obvious, but the machinery that would carry reform is weak. Education capacity is limited, delivery systems are thin, and institutional support is often patchy. China, by contrast, falls in the Low Pressure/High Capacity zone. That placement reflects strong Education (0.835) and Innovation (1.000) scores alongside a mid-range Green score (0.498). Even so, the matrix makes China’s internal imbalance visible: within the high-capacity set, its Digital score (0.288) remains well below those of Denmark, the United States, and Germany.
The median split used to construct this matrix is intended as a descriptive typology rather than a formal classification model. It provides a simple, interpretable quadrant structure that avoids arbitrary threshold debates. As a robustness check, we also evaluated a tercile-based cutoff scheme; the high-pressure/low-capacity interpretation remains substantively unchanged. The median split should therefore be read as a visual-classification device, not as an inferential cutoff.
A simple decomposition reaches the same conclusion. Aggregate capacity is strongly associated with ATCRI (Spearman’s ρ = 0.967 , p < 0.001 ), whereas Green Pressure shows a weaker positive relationship (Spearman’s ρ = 0.813 , p < 0.001 ). This decomposition should be interpreted cautiously. The strong correlation between aggregate capacity and ATCRI ( ρ = 0.967 ) partly reflects the mechanical fact that capacity indicators constitute three of the four dimensions of the index. It therefore represents an expected property of the index structure rather than an independent empirical discovery. The weaker correlation between Green Pressure and ATCRI ( ρ = 0.813 ) is more informative: it indicates that transition pressure, however real, does not automatically translate into the multi-dimensional configuration captured by ATCRI. The non-pressure dimensions—education, delivery infrastructure, and institutional coordination—mediate the relationship between pressure and observed readiness. For this reason, the capacity–ATCRI correlation is reported here as a transparency note rather than as a core substantive finding.

5.6. Robustness and Sensitivity Analyses [RQ2]

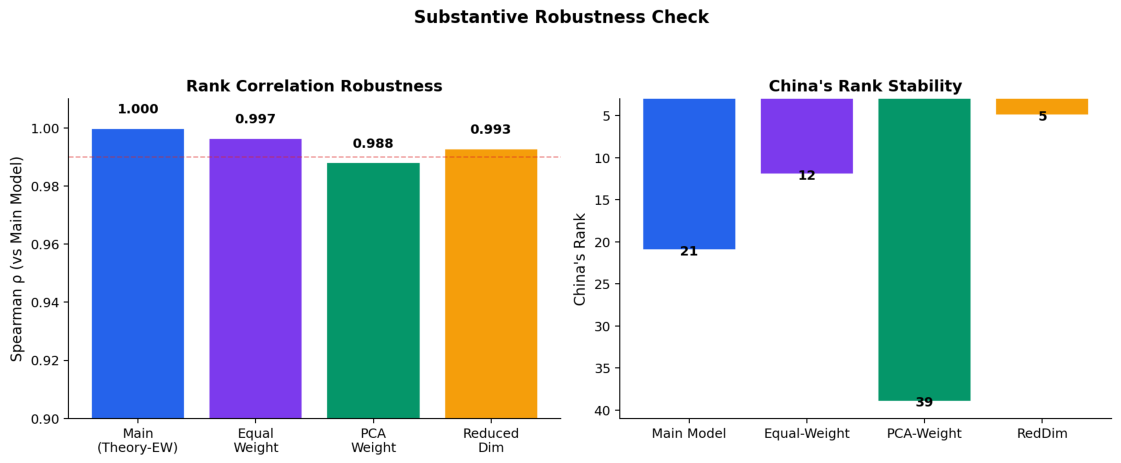
Robustness is evaluated not only in rank-order terms, but also in terms of whether the study’s structural interpretation survives alternative weighting and variable-selection rules. Figure 9, Table 9 and Table 10 jointly report the results. Full country rankings and additional robustness outputs are reported in the Supplementary Materials.
All alternative specifications produce rankings highly correlated with the main ATCRI ( ρ = 0.988 –0.997), indicating that the global ordering is not highly sensitive to the aggregation rule. Across the original R1–R4 robustness checks, China’s rank ranges from 5 to 39. When the extended R5–R8 checks are included, the full range remains 5 to 39, mainly because PCA weighting (R2) and Winsorized normalization (R8) both produce a rank of 39 for China, reflecting sensitivity to high-variance indicator loadings and extreme-value treatment, respectively. More importantly, Table 10 shows that the structural reading is stable even when the overall rank changes: China’s strongest assets continue to lie in education and innovation capacity, whereas the Digital, Energy and Enabling Infrastructure dimension remains the clearest delivery-side bottleneck. The robustness evidence therefore supports not only ranking stability, but also profile stability in substantive interpretation. It is important to be precise about what is stable and what is method-sensitive. The absolute rank is sensitive under PCA weighting and Winsorized normalization (China rank ranges from 5 to 39 across all eight specifications), and this sensitivity is a normal property of composite indices when weighting schemes change. What remains stable across all eight specifications—and across the leave-one-dimension-out analysis reported in Appendix Table A7—is the internal bottleneck diagnosis: China’s weakest dimension is consistently Digital, Energy and Enabling Infrastructure, while its strongest assets remain in Education and Research and Innovation and Institutional Capacity. The implementation asymmetry identified by the main model is therefore not an artifact of equal weighting, but a structurally robust finding.

5.7. Micro-Level Evidence from Chinese Crop Science Students [RQ3]

The purpose of the micro-level evidence is not to replicate the macro ranking, but to assess whether the structural bottlenecks identified above are (interpretively) socially legible at the student level. The availability of respondent-level survey data therefore strengthens the micro component from simple descriptive corroboration to measurement-grounded and theory-consistent evidence that provides context-specific triangulation rather than statistical validation.
We acknowledge that ATCRI measures general higher-education and innovation capacity proxies at the national level; it does not directly measure agricultural teaching infrastructure or field-level delivery conditions. The survey therefore provides an illustrative, context-specific layer that speaks to the macro diagnosis without constituting a direct test of it. This boundary is kept in view throughout the micro–macro mapping that follows.
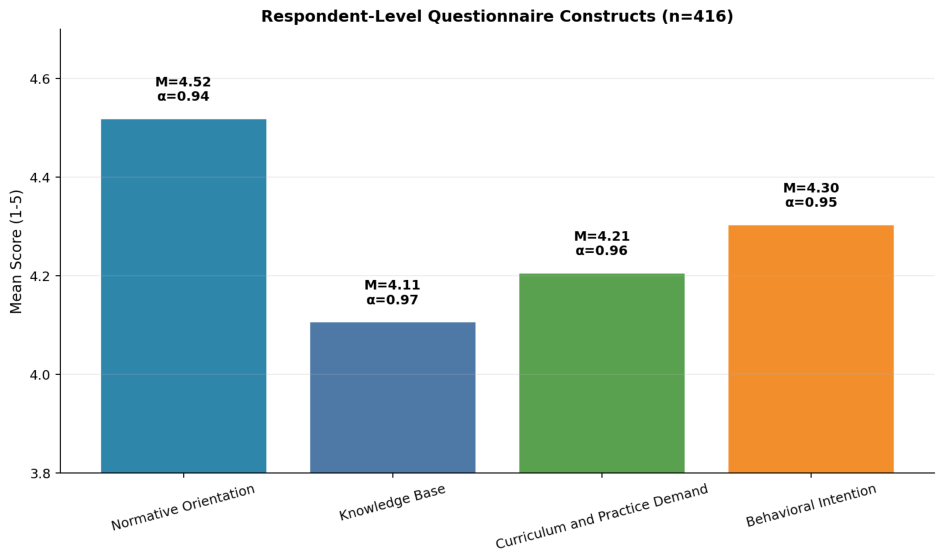
Table 11 reports construct means together with respondent-level dispersion and internal consistency for the 416-student sample.
Figure 10 visualizes the construct-level patterns for the four questionnaire sections.
The descriptive pattern is clear. Students report the strongest support in Normative Orientation (4.52) and substantial demand in Curriculum and Practice Demand (4.21), while the comparatively lower Knowledge Base score (4.11) suggests that support for reform currently exceeds the depth of internalized technical understanding. A four-factor exploratory factor analysis broadly reproduces the intended construct structure. Seventeen of the twenty items load highest on their expected construct once the rotated factors are labeled by substantive content; the clearest departures are Q8, Q14, and Q15, which sit at the boundary between normative orientation, knowledge, and curricular experience. Subgroup differences are modest rather than transformative, and they operate mainly as intensity differences rather than directional splits. The clearest contrast appears in Behavioral Intention, where postgraduate respondents score slightly higher than undergraduates (4.43 vs. 4.25, p = 0.045 , Cohen’s d = 0.22 ). Crop-science-track students also report consistently higher means than related-program students on Knowledge Base (4.16 vs. 3.96, p = 0.056 ) and Behavioral Intention (4.35 vs. 4.18, p = 0.057 ), although these effects remain small. Importantly, all subgroup means remain high, so the pattern is not one of reform polarization. Rather, it is a broadly shared reform orientation with only mild intensity differences, strengthening the interpretation that the delivery bottlenecks identified by the macro framework are legible across student subgroups rather than confined to a narrow constituency.
The macro–micro mapping reported in Table 12 shows that the survey does not simply echo the ranking; it reveals where the macro diagnosis becomes socially meaningful.
Three patterns stand out. First, students report strong Curriculum and Practice Demand and strong Behavioral Intention, which is directionally consistent with China’s relatively strong education and innovation profile. Second, the most analytically useful tension appears in the Digital, Energy and Enabling Infrastructure dimension: China’s weakest macro score is paired with very strong student demand for equipment training and enterprise participation (Q18 = 4.30; Q19 = 4.29). Third, the combination of very high Normative Orientation and somewhat lower Knowledge Base is consistent with a setting in which reform urgency is visible, but systematic curricular and practical reinforcement remains incomplete.
Taken together, the micro-level evidence does not validate the ATCRI in a statistical sense. Instead, it suggests that the structural bottlenecks identified by the macro framework are visible in student perceptions and can therefore be interpreted as socially legible reform constraints rather than abstract index artifacts, albeit without constituting statistical validation or causal evidence.

6. Discussion

6.1. Theoretical Contribution: Repositioning Reform as a Structural Readiness Problem

The primary theoretical contribution of this study lies in repositioning agricultural education reform as a structural readiness problem rather than a curriculum-design or policy-statement problem. Much of the existing literature treats reform as a matter of curriculum choice, institutional willingness, or pedagogical design. The present analysis suggests that this framing is incomplete. Reform is also—and perhaps primarily—a sequencing and implementation problem embedded in multi-SDG interlinkages: whether agricultural education systems can actually advance SDG 2, SDG 4, SDG 9, and SDG 13 simultaneously depends on whether the structural conditions—educational capacity, delivery infrastructure, transition pressure, and institutional-innovation coordination—are sufficiently aligned [1,2].
This repositioning carries two implications for how SDG-linked agricultural education transformation should be understood. First, the global unevenness documented here is not merely distributional: it reflects a structural inequality in access to the enabling conditions that determine whether the 2030 Agenda can be operationalized through agricultural education. For a large group of countries, the barriers are not motivational or curricular but infrastructural and institutional [33]. Second, student demand can make structural bottlenecks socially legible and can signal where delivery gaps are most consequential, but it cannot substitute for the infrastructural and organizational conditions needed to implement SDG-linked reform at scale. The ATCRI is therefore best understood as an indicative diagnostic framework rather than a definitive performance measure.

6.2. Methodological Contribution: A Proxy-Based Diagnostic Framework

From a methodological standpoint, this study contributes a proxy-based composite-indicator framework adapted to the specific domain of agricultural education green/digital transition readiness. The ATCRI builds on the established tradition of OECD/JRC-style composite indicator construction [22,23,24], but applies it to a domain where cross-country diagnostic tools have been absent. The equal-weighting specification, transparent missing-data treatment, and extensive robustness checks (eight alternative specifications) are designed to maximize replicability while acknowledging the inherent approximations involved in using national-level proxies for education-sector-specific conditions.
The dual-layer evidence design—macro index complemented by micro-level survey triangulation from a single country case—is also noteworthy as a methodological choice. Rather than claiming that survey data validate macro scores, the framework treats micro evidence as context-specific interpretive material that can illuminate whether structural bottlenecks are visible at the level of experienced educational practice. This design acknowledges both the value and the limits of cross-scale evidence integration in comparative education research. It should not be overstated: the Chinese survey provides triangulation for one country only, and the patterns observed may not generalize to other national contexts.

6.3. Empirical Contribution: Global Inequality, Pressure–Capacity Mismatch, and Internal Asymmetry

The empirical findings cluster around three observations. First, readiness is structurally unequal: high-readiness cases concentrate in a relatively small set of countries, while a much larger group remains in the Low or Lower-Middle bands. Weak higher education capacity limits the absorptive base for reformed curricula; thin digital and operational infrastructure constrains practical teaching [6]; and weaker institutional environments reduce coordination capacity. Structural deficits tend to cluster, making reform most difficult precisely where it is often most needed [7,37].
Second, the pressure–capacity mismatch reveals that high transition urgency does not automatically produce implementation feasibility. Seventeen countries fall into the High Pressure/Low Capacity paradox zone, facing the strongest need for transformation while lacking the educational, infrastructural, and institutional machinery to deliver it. Pressure creates reform need, but it does not supply teachers, platforms, laboratories, reliable digital systems, or implementation capacity. Green Transition Pressure is therefore best read as a conditional driver rather than a stand-alone readiness dimension.
Third, China presents an analytically informative case with internally uneven readiness. China ranks 21st globally and combines very strong Education (0.835) and Innovation (1.000) scores with a visibly weaker Digital infrastructure score (0.288). Relative to its upper-middle-income peers, China exceeds its development tier mainly through upstream capability, not through uniformly advanced delivery conditions. This implementation asymmetry—knowledge production advancing faster than delivery infrastructure—suggests that even among higher-readiness countries, SDG-relevant transformation is not secured by upstream capability alone. In this sense, China is not a mechanism-revealing case; it is an analytically informative case with internally uneven readiness that illustrates a general dynamic worth investigating in other national contexts, albeit without constituting statistical validation or causal evidence.
The Chinese survey results reinforce this interpretation in an interpretive rather than confirmatory sense. Students report strong normative support (4.52/5) alongside particularly acute demand for practice-oriented digital training (Q18 = 4.30; Q19 = 4.29), exactly where the macro diagnosis identifies the main structural gap. This alignment between macro bottleneck and micro demand should be read as context-specific triangulation—a pattern consistent with the structural reading—rather than as validation of the index.

6.4. Boundary Conditions and Limitations

Four limitations should be kept in view. Conceptually, the ATCRI measures proxy-based reform enabling conditions rather than realized outcomes, so it should be read as a structural diagnostic of approximate readiness rather than a direct indicator of educational quality or graduate competence. In measurement terms, several national-level indicators are structural proxies (e.g., scientific articles, patents, high-tech exports) interpreted cautiously as revealed capacity rather than as direct education-sector measures, which means the index captures enabling environments more directly than classroom processes or field-level teaching quality. In data terms, missingness in parts of the Education and Research dimension may still compress some cross-country differences even though the main ordering remains stable under entropy, PCA, reduced-dimension, re-weighting, and winsorization checks. Cross-level inference should remain cautious: the income-group lens is descriptive rather than causal, the cluster typology is interpretive rather than stability-optimized, and the Chinese survey provides single-institution triangulation rather than national representativeness or macro-score validation. The Winsorized-min-max check (R8) confirms that extreme outliers do not drive substantive conclusions, but the fundamental limitation of cross-sectional proxy-based indexing—that correlation does not imply causation and that structural capacity does not guarantee realized outcomes—remains acknowledged throughout.

7. Conclusions and Policy Implications

7.1. Main Conclusions

This study contributes a proxy-based structural diagnostic framework—the Agricultural Talent Cultivation Readiness Index (ATCRI)—for assessing the multi-dimensional enabling conditions that shape whether SDG-linked agricultural education transformation can be operationalized across 160 countries. The ATCRI is positioned not as a direct measure of educational quality, graduate competence, or reform outcomes, but as an approximate diagnostic tool for identifying the structural bottlenecks and enablers that govern the feasibility of low-carbon and smart agriculture talent cultivation at scale.
Three empirical observations merit emphasis. First, global readiness for agricultural education green/digital transition is highly uneven and structurally clustered: high-readiness countries concentrate in a small set of advanced economies, while a much larger group faces compounded deficits across education, delivery infrastructure, and institutional coordination. Second, transition pressure does not automatically translate into readiness; seventeen countries exhibit a pressure–capacity paradox in which urgent reform need coexists with weak enabling conditions. Third, China (ranked 21st) presents a hybrid profile in which upstream knowledge and innovation capacity are strong but digital delivery infrastructure remains a relative bottleneck. Survey evidence from 416 Chinese crop science students reveals elevated demand for practice-oriented digital training in exactly this bottleneck area—a pattern interpretable as context-specific triangulation indicating interpretive tension between structural conditions and perceived needs, rather than consistency validation.
A methodological boundary should be kept in view: the China survey is based on a single-institution sample and should be read as a single-case interpretive layer rather than as a validation dataset for national ATCRI scores. It does not represent all Chinese agricultural students, nor does it validate the macro index in a statistical sense; its role is to show that the structural bottlenecks identified by the macro framework are socially legible at the student level.
For China specifically, the diagnosis points to delivery-infrastructure bottlenecks rather than upstream capability gaps. Policy attention should focus on concrete measures that strengthen the translation layer between China’s substantial R&D/innovation output and routine teaching capacity in agricultural higher education. These include (a) establishing smart-agriculture teaching experimental fields equipped with IoT sensors, drone-based monitoring, and precision-irrigation systems within or adjacent to agricultural universities; (b) developing university–enterprise collaborative data platforms that allow students to work with real-time crop-monitoring and yield-prediction datasets from partner farms; (c) integrating precision-agriculture equipment training modules (variable-rate technology, autonomous guidance systems, remote sensing interpretation) into core curricula rather than treating them as elective add-ons; and (d) redesigning courses to anchor theoretical content in specific industry scenarios—such as carbon-footprint accounting for staple crops or AI-assisted pest diagnostics—so that students acquire both conceptual knowledge and hands-on operational familiarity. These measures target the Digital, Energy and Enabling Infrastructure dimension directly, which the ATCRI identifies as China’s most binding constraint, without requiring changes to areas where China already performs well.

7.2. Policy Implications by Country Type

Table 13 organizes policy priorities according to country configuration type, derived from the pressure–capacity matrix and structural typology reported in Section 5.4 and Section 5.5.
For governments more broadly, the central implication is that agricultural education reform strategies should be calibrated to each country’s structural configuration rather than pursued as uniform packages. For universities, reform cannot rely on curricular intention alone: where delivery conditions remain thin, priority should go to strengthening laboratories, digital platforms, field-based practice arrangements, and external partnerships. For international cooperation and SDG monitoring, the ATCRI provides a differentiated comparative tool that can support peer learning and identify where cooperation should prioritize education capacity versus delivery infrastructure.

7.3. Future Research

Future work can extend the ATCRI framework in several directions. One is to develop institution-level or subnational variants that capture within-country variation more directly, particularly as delivery conditions often differ substantially between urban and rural institutions. A second is to introduce a longitudinal component so that readiness can be tracked as enabling conditions change over time, allowing SDG progress in agricultural education transformation to be monitored dynamically. A third is to test profile stability and typology robustness more systematically, including cluster-stability diagnostics and richer between-type comparisons under the extended set of robustness specifications (R1–R8). A fourth is to develop sector-specific agricultural education indicators (e.g., for livestock, fisheries, horticulture, or agroforestry) that capture delivery constraints and SDG interlinkages specific to each sub-domain. A fifth is to extend the micro layer beyond a single-institution case by administering comparable surveys across multiple institutions and, ideally, multiple countries, so that macro–micro mapping can be examined cross-nationally and the generalizability of bottleneck diagnoses can be tested more rigorously. A sixth is to explore fuzzy-set QCA (fsQCA) or other necessary-condition techniques to identify which combinations of conditions enable successful low-carbon agriculture talent cultivation in different country contexts, building on the configuration-oriented logic already present in the pressure–capacity matrix and k-means typology.

Supplementary Materials

The following supporting information can be downloaded at: https://www.mdpi.com/article/10.3390/su18115271/s1. Additional supplementary files include Data_Tables and Survey_Data.

Author Contributions

Z.J.: Conceptualization, Methodology, Formal Analysis, Data Curation, Visualization, Writing—Original Draft. G.Z. and Z.C.: Writing—Review & Editing. All authors have read and agreed to the published version of the manuscript.

Funding

This study was financially supported by the Jiangsu Provincial Fund for Realizing Carbon Emission Peaking and Neutralization (BE2022305), “Belt and Road” innovation talent exchange for foreign experts program of the Ministry of Science and Technology (DL2023014011L), and the National Key Research and Development Program of China (2018YFE0108100).

Institutional Review Board Statement

The study uses an anonymized educational questionnaire and reports only aggregated results. No personally identifying information is included in the analysis.

Informed Consent Statement

The questionnaire was completed voluntarily, and all analyses were conducted on anonymized responses.

Data Availability Statement

All macro-level data used in this study are publicly available from the World Bank WDI database (https://data.worldbank.org, accessed on 28 February 2026), the World Governance Indicators database (https://info.worldbank.org/governance/wgi, accessed on 28 February 2026), and the EDGAR GHG Emissions Database (https://edgar.jrc.ec.europa.eu, accessed on 28 February 2026). Country-level ATCRI scores, robustness results, survey summary statistics, reliability diagnostics, and exploratory factor-analysis outputs are available in the Supplementary Materials. Because the survey includes student-level responses, the anonymized respondent-level matrix is available from the corresponding author upon reasonable request and subject to institutional data-protection requirements.

Acknowledgments

The authors thank the providers of the public-source datasets used in this study.

Conflicts of Interest

The authors declare no known competing financial interests or personal relationships that could have appeared to influence the work reported in this paper.

Appendix A

Appendix A.1. Missing Data Diagnosis

Table A1 reports the per-indicator missing data pattern across the final analytical sample of 160 countries. Four indicators account for the majority of missingness: Researchers in R&D per Million (available for 98 countries; 62 missing), R&D Expenditure as % of GDP (available for 104 countries; 56 missing), Agricultural CO2 Emissions (available for 106 countries; 54 missing), and Patent Applications (available for 125 countries; 35 missing). The first two belong to the Education and Research dimension, making it the primary source of missingness-related sensitivity—addressed by Robustness Check R4 (Reduced Dimension).
Table A1. Missing data diagnosis by indicator.
IndicatorDimensionMissing (n)Missing Rate (%)
Tertiary Enrollment RateEducation & Research2012.5
R&D Expenditure (% GDP)Education & Research5635.0
Scientific Articles (×1000)Education & Research21.3
Researchers in R&D (per M)Education & Research6238.8
Internet Users (%)Digital/Infrastructure10.6
Secure Servers (per M)Digital/Infrastructure00.0
Renewable Electricity (%)Digital/Infrastructure8 a5.0
Agriculture VA (% GDP)Green Pressure10.6
Agri CO2 Emissions (Mt)Green Pressure5433.8
Govt EffectivenessInnovation/Institutional10.6
High-Tech Exports (%)Innovation/Institutional85.0
Patent Applications (×1000)Innovation/Institutional3521.9
Final analytical sample: 160 countries. A total of 57 countries were excluded prior to analysis: 35 had fewer than 8 valid indicators, and 22 were removed for additional data-quality reasons (e.g., all-indicator missing or aggregate-code entries without matched indicator data). Among the 160 retained countries, 61 have 1–4 imputed entries each. a Renewable Electricity: 2 entries were originally missing in the source data; an additional 6 entries exhibited implausible negative values (range: −0.002% to −6.34%) and were treated as missing prior to normalization and median imputation, yielding a total of 8 affected entries for this indicator.
Additionally, eight entries for Renewable Electricity Output required special treatment: two were originally missing from source data, and six exhibited implausible negative values (ranging from −0.002 to −6.34%). The negative values likely reflect statistical artifacts or unit-conversion issues rather than physical measurements; because source-level resolution was not possible, all eight were treated as missing prior to median imputation. This treatment increases the effective missing rate for this indicator to 5.0% (8/160). The Winsorized robustness check (R8) confirms that this treatment does not affect substantive conclusions.

Appendix A.2. Composite Indicator Sensitivity Note

The baseline ATCRI adopts equal weighting across and within dimensions because the framework is theory-driven: education capacity, delivery infrastructure, transition pressure, and institutional coordination are treated as jointly necessary rather than substitutable conditions. A fully data-driven scheme would shift the construct toward whichever indicators exhibit the largest cross-national dispersion, thereby changing the meaning of the index from balanced readiness to variance-dominant capacity. For this reason, entropy weighting and PCA weighting are used as sensitivity checks rather than as the baseline specification. The substantive conclusions remain stable across these alternatives: the global hierarchy remains highly correlated with the main index, the pressure–capacity paradox does not disappear, and China continues to appear as a high-capacity yet internally uneven case.

Appendix A.3. China in Comparative Perspective

Table A2. China in comparative perspective: ATCRI and dimension scores. Notes: This table complements the radar comparison in the main text by making China’s structural asymmetry easy to read in tabular form. Relative to high-readiness comparators such as Denmark and the United States, China performs strongly on Education and exceptionally on Innovation, but remains much weaker on delivery infrastructure.
CountryATCRIEducationDigitalGreenInnovation
Denmark1.0000.6221.0000.9830.572
United States0.8250.8660.5610.8350.640
China0.6870.8350.2880.4981.000
Brazil0.3730.2820.3500.6280.284
India0.0580.1940.1540.0000.359

Appendix A.4. Survey Instrument Summary

The respondent-level questionnaire file documents 25 questions in total: 3 demographic items (Q1–Q3), 20 closed-ended Likert items (Q4–Q23), and 2 optional open-ended questions (Q24–Q25). The 20 closed-ended items are organized into four questionnaire constructs. Normative Orientation contains 5 items covering willingness to learn, endorse, and communicate carbon peak/carbon neutrality concepts, together with perceived need for low-carbon agricultural practice and policy awareness. Knowledge Base contains 5 items capturing understanding of agricultural greenhouse-gas sources, soil carbon sequestration mechanisms, methane emissions in rice production, smart-agriculture mitigation technologies, and concrete carbon-reduction techniques. Curriculum and Practice Demand contains 6 items addressing whether current courses and textbooks cover low-carbon agriculture, whether CBAM and related issues are discussed in teaching, whether interdisciplinary courses exist, and whether more equipment training and enterprise participation are needed. Behavioral Intention contains 4 items measuring support for skill assessment, willingness to choose low-carbon thesis topics, career orientation toward low-carbon agriculture, and perceived employability gains from carbon knowledge.
All closed-ended items used a 5-point Likert scale: 1 = Strongly Disagree/Very Unimportant; 5 = Strongly Agree/Very Important. The respondent-level matrix reports 416 valid responses for each closed-ended item.

Appendix A.5. Respondent-Level Measurement Diagnostics

Table A3. Reliability and factorability diagnostics for the 20-item survey matrix. Notes: Corrected item-total correlations range from 0.71 to 0.95 across the four constructs. A four-factor exploratory factor analysis broadly reproduces the intended structure: 17 of 20 items load highest on their expected construct, while Q8, Q14, and Q15 load more strongly on a knowledge/policy-integration factor.
Construct/TestStatisticValue
Normative OrientationCronbach’s α 0.94
Knowledge BaseCronbach’s α 0.97
Curriculum and Practice DemandCronbach’s α 0.96
Behavioral IntentionCronbach’s α 0.95
Overall matrixKMO0.96
Overall matrixBartlett’s χ 2 (190)11,801.78 ( p < 0.001 )

Appendix A.6. Rotated Exploratory Factor Loadings

Table A4. Rotated exploratory factor loadings for the 20 survey items.
ItemExpected ConstructF1F2F3F4Primary Construct
Q4Normative Orientation−0.2760.815−0.2420.274Normative Orientation
Q5Normative Orientation−0.2630.831−0.2260.253Normative Orientation
Q6Normative Orientation−0.2730.843−0.2140.275Normative Orientation
Q7Normative Orientation−0.2950.766−0.2140.267Normative Orientation
Q8Normative Orientation−0.5870.487−0.2120.227Knowledge Base
Q9Knowledge Base−0.8120.314−0.2470.223Knowledge Base
Q10Knowledge Base−0.8630.288−0.2190.233Knowledge Base
Q11Knowledge Base−0.8660.226−0.2400.276Knowledge Base
Q12Knowledge Base−0.7820.259−0.2560.241Knowledge Base
Q13Knowledge Base−0.7500.270−0.2780.271Knowledge Base
Q14Curriculum and Practice Demand−0.5940.274−0.5510.195Knowledge Base
Q15Curriculum and Practice Demand−0.6290.198−0.5190.249Knowledge Base
Q16Curriculum and Practice Demand−0.5700.283−0.5870.271Curriculum and Practice Demand
Q17Curriculum and Practice Demand−0.4340.354−0.6510.396Curriculum and Practice Demand
Q18Curriculum and Practice Demand−0.3560.352−0.6960.370Curriculum and Practice Demand
Q19Curriculum and Practice Demand−0.3500.371−0.6390.431Curriculum and Practice Demand
Q20Behavioral Intention−0.3210.387−0.3480.660Behavioral Intention
Q21Behavioral Intention−0.3340.375−0.2700.761Behavioral Intention
Q22Behavioral Intention−0.3650.362−0.2840.698Behavioral Intention
Q23Behavioral Intention−0.3110.485−0.3600.611Behavioral Intention
Notes: Factors are labeled by substantive content rather than by raw extraction order: F1 = Knowledge Base, F2 = Normative Orientation, F3 = Curriculum and Practice Demand, and F4 = Behavioral Intention. The negative signs are a normal consequence of factor rotation and do not affect interpretation; substantive emphasis is placed on the highest absolute loading for each item. Regarding Q8, Q14, and Q15: these three items exhibit cross-loadings at the boundary between adjacent constructs—a theoretically interpretable pattern rather than a threat to construct integrity. Q8 loads on Knowledge Base despite being designed for Normative Orientation because it taps awareness of carbon policy mechanisms that require both attitudinal endorsement and technical understanding. Q14 and Q15 load on Knowledge Base despite belonging to Curriculum and Practice Demand because they address interdisciplinary course demand and equipment-training needs that sit at the intersection of content knowledge, curricular experience, and reform orientation. Alpha-without-item stability was tested: removing Q8 reduces Normative Orientation α from 0.94 to 0.93; removing Q14 reduces Curriculum Demand α from 0.96 to 0.95; removing Q15 reduces it to 0.94. All remain well above conventional acceptability thresholds (>0.70), confirming that these cross-loadings reflect natural conceptual adjacency rather than measurement artifact.

Appendix A.7. Subgroup Comparison Summary

Table A5. Subgroup mean differences across the four survey constructs.
GroupingConstructGroup 1 vs. Group 2Mean 1Mean 2pCohen’s d
DegreeNormative OrientationPostgraduate vs. Undergraduate4.5014.5270.740−0.038
DegreeKnowledge BasePostgraduate vs. Undergraduate4.1734.0830.3780.094
DegreeCurriculum and Practice DemandPostgraduate vs. Undergraduate4.2344.1970.7090.042
DegreeBehavioral IntentionPostgraduate vs. Undergraduate4.4344.2540.0450.219
MajorNormative OrientationCrop science track vs. Related programs4.5494.4390.1370.160
MajorKnowledge BaseCrop science track vs. Related programs4.1633.9590.0560.215
MajorCurriculum and Practice DemandCrop science track vs. Related programs4.2464.1010.1210.167
MajorBehavioral IntentionCrop science track vs. Related programs4.3514.1790.0570.210
Notes: The clearest difference appears in Behavioral Intention, where postgraduate respondents score modestly higher than undergraduates. The remaining contrasts are directionally similar but remain marginal in conventional significance terms, reinforcing the interpretation that support for low-carbon and smart agriculture education is broadly shared across subgroups.

Appendix A.8. Extended Robustness: Dimensional Re-Weighting and Winsorized Normalization

Beyond the four original robustness checks (R1–R4), this revised manuscript reports three additional dimensional re-weighting schemes (R5–R7) and one winsorized normalization check (R8). Table A6 summarizes all eight specifications.
Table A6. Complete robustness summary: all eight specifications.
IDMethod ρ vs. MainChina Rank Δ RankChina Weakest
MainEqual weight (4 dim)1.000021Digital
R1Entropy weighting0.9968 a12 a−9Digital
R2PCA weighting0.988339+18Digital
R3Uniform indicator (1/12)0.996612−9Digital
R4Reduced dimension (10 ind.)0.99305−16Digital
R5Digital-low reweight0.99367−14Digital
R6Digital-high reweight0.998720−1Digital
R7Capacity-focused reweight0.98875−16Digital
R8Winsorized min–max0.997239+18Digital
Notes: ρ = Spearman rank correlation with main model. Across R1–R4, China’s rank ranges from 5 to 39; when R5–R8 are included, the full range is 5 to 39. a R1 (Entropy) uses Shannon entropy weights computed from the 160-country normalized matrix; the ρ and rank values reflect the entropy-weighted specification applied within each dimension following the same dimensional structure as the main model. R5 assigns 15% weight to the Digital dimension; R6 assigns 40%; R7 assigns asymmetric weights (35%/25%/20%/20%); R8 applies 1%/99% Winsorization before min–max normalization. The core diagnostic finding (Digital bottleneck) is stable across all eight specifications.

Appendix A.9. Leave-One-Dimension-Out Sensitivity

Because all dimension–total correlations are mechanically affected by index construction, we report a leave-one-dimension-out sensitivity analysis as a diagnostic rather than as independent causal evidence. Table A7 reports, for each excluded dimension, the Spearman correlation between the main ATCRI and the leave-one-out ATCRI, China’s rank in that specification, and China’s weakest remaining dimension.
Table A7. Leave-one-dimension-out sensitivity analysis (China).
Excluded DimensionSpearman ρ vs. MainChina RankChina WeakestInterpretation
Education & Research0.98903Digital, Energy & InfraBottleneck stable
Digital, Energy & Infra0.97785Education & ResearchBottleneck shifts
Green Transition Pressure0.96759Education & ResearchBottleneck shifts
Innovation & Institutional0.978021Education & ResearchBottleneck shifts
Notes: The leave-one-out ATCRI is computed as the simple average of the remaining three dimension scores. Excluding Education & Research raises China’s rank from 21st to 3rd, confirming that China’s main-model rank is pulled down by its comparatively weak Digital, Energy & Enabling Infrastructure dimension. Crucially, when Education & Research is excluded, the weakest remaining dimension for China is still Digital, Energy & Enabling Infrastructure—the same dimension identified as the bottleneck in the main model. This supports the interpretation that China’s implementation asymmetry (strong education/innovation, weak delivery infrastructure) is not an artifact of weighting choices.

References

  1. Griggs, D.; Stafford-Smith, M.; Gaffney, O.; Rockström, J.; Öhman, M.C.; Shyamsundar, P.; Steffen, W.; Glaser, G.; Kanie, N.; Noble, I. Policy: Integrate sustainable development goals. Nature 2013, 495, 305–307. [Google Scholar] [CrossRef] [PubMed]
  2. UNESCO. Rethinking Education: Towards a Global Common Good? Technical Report; UNESCO Publishing: Paris, France, 2015. [Google Scholar]
  3. Rockström, J.; Steffen, W.; Noone, K.; Persson, A.; Chapin, F.S.; Lambin, E.F.; Lenton, T.M.; Scheffer, M.; Folke, C.; Schellnhuber, H.J.; et al. A safe operating space for humanity. Nature 2009, 461, 472–475. [Google Scholar] [CrossRef]
  4. Steffen, W.; Richardson, K.; Rockström, J.; Cornell, S.E.; Fetzer, I.; Bennett, E.M.; Biggs, R.; Carpenter, S.R.; De Vries, W.; De Wit, C.A.; et al. Planetary boundaries: Guiding human development on a changing planet. Science 2015, 347, 1259855. [Google Scholar] [CrossRef] [PubMed]
  5. Foley, J.A.; Ramankutty, N.; Brauman, K.A.; Cassidy, E.S.; Gerber, J.S.; Johnston, M.; Mueller, N.D.; O’Connell, C.; Ray, D.K.; West, P.C.; et al. Solutions for a cultivated planet. Nature 2011, 478, 337–342. [Google Scholar] [CrossRef]
  6. Wolfert, J.; Ge, L.; Verdouw, C.; Bogaardt, M.J. Big data in smart farming—A review. Agric. Syst. 2017, 153, 69–80. [Google Scholar] [CrossRef]
  7. Spielman, D.J.; Ekboir, J.; Davis, K.; Ochieng, C.M.O. Research systems, innovation systems, and the organization of the agricultural sector. Agric. Syst. 2006, 91, 201–215. [Google Scholar]
  8. Wang, J.; Li, M.; Zhang, Q. Pathways for integrating carbon neutrality concepts into agricultural higher education: Challenges and opportunities. Sustainability 2023, 15, 14287. [Google Scholar]
  9. Zhang, R.; Huang, K.; Xu, L. Cultivating talents at tertiary agricultural institutions in China for sustainable and intelligent development: A reform framework for China. J. Clean. Prod. 2025, 411, 137204. [Google Scholar]
  10. Chen, L.; Zhang, Y.; Wang, H. Perceptions toward artificial intelligence among agricultural students: A survey study. J. Agric. Educ. 2025, 66, 145–162. [Google Scholar]
  11. Ji, Z.; Liu, Q.; Wang, S. Student attitudes toward digital agriculture education: Evidence from Chinese crop science programs. High. Educ. Policy 2024, 37, 712–730. [Google Scholar]
  12. Rose, D.C.; Chilvers, J.; Sutherland, W.J.; Doidge, S.; Kirwan, N.; Bentley, A.; McVittie, A.; Munday, J.; Purdon, M.; Barnes, A.P. Agricultural informatics, automation and the future of agricultural statistics. Int. J. Agric. Manag. 2016, 5, 37–46. [Google Scholar]
  13. Altbach, P.G.; Reisberg, L.; Rumbley, L.E. The Past, Present, and Future of the Research University. Trends High. Educ. 2011, 46, 1–32. [Google Scholar]
  14. Liu, X.; Chen, H.; Zhou, J. Low-carbon agricultural knowledge and attitudes among southwestern Chinese university students. Int. J. Agric. Ext. 2024, 12, 34–51. [Google Scholar]
  15. Xie, Y.; Xu, M.; Pu, J.; Pan, Y.; Liu, X.; Zhang, Y.; Xu, S. Large-scale renewable energy brings regionally disproportional air quality and health co-benefits in China. iScience 2023, 26, 107459. [Google Scholar] [CrossRef] [PubMed]
  16. Maji, I.K.; Saari, M.Y.; Habibullah, M.S.; Saudi, M.S.M. Clean energy, institutional quality and environmental sustainability in sub-Saharan Africa. Clean. Mater. 2022, 6, 100135. [Google Scholar] [CrossRef]
  17. Castells, M. The Rise of the Network Society; Blackwell Publishing: Oxford, UK, 2000; p. 1. [Google Scholar]
  18. European Commission SCAR. Sustainable Agricultural Knowledge for the Future: EU Policy Perspectives; Technical Report; European Commission: Brussels, Belgium, 2022. [Google Scholar]
  19. USDA. National Institute of Food and Agriculture: Precision Agriculture Investment Report; Technical Report; United States Department of Agriculture: Washington, DC, USA, 2023.
  20. Cole, M.A. Corruption, income and the environment: An empirical analysis. Ecol. Econ. 2007, 62, 637–647. [Google Scholar] [CrossRef]
  21. Khan, A.A.; Khan, S.U.; Ali, M.A.S.; Safi, A.; Gao, Y.; Ali, M.; Luo, J. Role of institutional quality and renewable energy consumption in achieving carbon neutrality: Case study of G-7 economies. Sci. Total Environ. 2022, 814, 152797. [Google Scholar] [CrossRef]
  22. Nardo, M.; Saisana, M.; Saltelli, A.; Tarantola, S.; Hoffman, A.; Giovannini, E. Handbook on Constructing Composite Indicators: Methodology and User Guide; Technical Report; OECD Publishing: Paris, France, 2008. [Google Scholar]
  23. Saisana, M.; D’Hombres, B.; Saltelli, A. Composite Indicators for Governance: Assessing National Research Systems. In European Commission JRC Scientific and Technical Reports; European Commission: Brussels, Belgium, 2011. [Google Scholar]
  24. Mazziotta, M.; Pareto, A. On a Synthesis of Composite Indices: Methodological Issues. Riv. Di Stat. Uff. 2013, 15, 13–24. [Google Scholar]
  25. European Commission. Digital Economy and Society Index (DESI) Report; Technical Report; Directorate-General for Communications Networks, Content and Technology: Brussels, Belgium, 2024. [Google Scholar]
  26. Porter, M.E.; Heppelmann, J.E. How Smart, Connected Products Are Transforming Competition. Harv. Bus. Rev. 2014, 92, 64–88. [Google Scholar]
  27. UNESCO. Global Education Monitoring Report: SDG 4 Data Insights; Technical Report; UNESCO Publishing: Paris, France, 2023. [Google Scholar]
  28. Dinda, S. Environmental Kuznets Curve Hypothesis: A Survey. Ecol. Econ. 2004, 49, 431–455. [Google Scholar] [CrossRef]
  29. Stern, D.I. The Rise and Fall of the Environmental Kuznets Curve. World Dev. 2004, 32, 1419–1439. [Google Scholar] [CrossRef]
  30. World Bank. World Development Report 2022: Climate Change and Development; Technical Report; World Bank: Washington, DC, USA, 2022. [Google Scholar]
  31. Kaufmann, D.; Kraay, A.; Mastruzzi, M. The Worldwide Governance Indicators: Methodology and Analytical Issues. In World Bank Policy Research Working Paper; World Bank: Washington, DC, USA, 2011; p. 5430. [Google Scholar]
  32. Tubiello, F.N.; Rosenzweig, C.; Conchedda, G.; Karl, K.; Ehrhart, S.; Florencia, A.; Hlaren, O.; Kurz, B.; Muccione, F.; Runge, T.; et al. Agricultural emissions and their implications for climate targets. Science 2020, 370, 705–708. [Google Scholar]
  33. Acemoglu, D.; Johnson, S.; Robinson, J.A. The Colonial Origins of Comparative Development: An Empirical Investigation. Am. Econ. Rev. 2001, 91, 1369–1401. [Google Scholar] [CrossRef]
  34. Carlton, J.S.; Mieno, T.; Olen, B.; Shwom, R.; Suter, J.F.; Webber, M.E. Climate change impacts on agriculture and food security. Annu. Rev. Environ. Resour. 2019, 44, 437–460. [Google Scholar]
  35. Hartigan, J.A.; Wong, M.A. Algorithm AS 136: A K-Means Clustering Algorithm. J. R. Stat. Soc. 1979, 28, 100–108. [Google Scholar] [CrossRef]
  36. Rousseeuw, P.J. Silhouettes: A graphical aid to the interpretation and validation of cluster analysis. J. Comput. Appl. Math. 1987, 20, 53–65. [Google Scholar] [CrossRef]
  37. Croppenstedt, A.; Demeke, M.; Meschi, M.M. Technology adoption in the presence of constraints: The case of fertilizer demand in Ethiopia. Rev. Dev. Econ. 2013, 17, 189–200. [Google Scholar] [CrossRef]
Figure 1. ATCRI conceptual and analytical framework. The framework is structured as follows: (1) Green–Digital Transition Context in Agriculture sets the macro backdrop; (2) Research Focus on Structural Readiness defines the analytical scope; (3) four ATCRI dimensions—Education & Research, Digital Energy & Enabling Infrastructure, Innovation & Institutions, and Green Transition Pressure—constitute the core index; (4) dual evidence layers integrate Macro Evidence (160-country assessment) with Micro Evidence (China student survey); and (5) Diagnostic Outputs yield global readiness patterns, pressure–capacity mismatch analysis, and policy sequencing implications.
Sustainability 18 05271 g001
Figure 2. Global Readiness for Low-Carbon and Smart Agriculture Talent Cultivation (Top 30 Countries, 2019–2023 Average). Countries are colored by readiness group: High (blue) and Upper-Middle (teal). Only these two groups appear in the Top 30 subset.
Sustainability 18 05271 g002
Figure 3. Global distribution of Agricultural Talent Cultivation Readiness (ATCRI 2019–2023 average, n = 160 countries). Countries with missing data are shown in gray; the map also includes a north arrow and annotations for selected comparator/core countries with their global ranks and ATCRI scores.
Sustainability 18 05271 g003
Figure 4. Dimension-level readiness scores for selected countries: China, USA, Germany, Brazil, and India. Each radar shows performance across the four ATCRI dimensions.
Sustainability 18 05271 g004
Figure 5. China’s position in global ATCRI distribution. China records ATCRI = 0.687 and ranks 21st out of 160 countries. In the structural typology it belongs to Cluster A, while the pressure-capacity matrix places it in the Low Pressure/High Capacity quadrant; across both views, the clearest bottleneck is the Digital, Energy and Enabling Infrastructure dimension.
Sustainability 18 05271 g005
Figure 6. Income-group dimension profiles with China highlighted. China sits far above the upper-middle-income group in Education and Innovation, but remains close to that group mean in Digital, Energy and Enabling Infrastructure.
Sustainability 18 05271 g006
Figure 7. Country readiness typology: four structural profiles. K-means clustering on standardized dimension scores identifies four country profiles: Cluster A (n = 25, high-capacity/high-pressure), Cluster B (n = 39, upper-middle-capacity/high-pressure), Cluster C (n = 61, lower-middle-capacity/moderate-pressure), and Cluster D (n = 35, low-capacity/moderate-pressure).
Sustainability 18 05271 g007
Figure 8. Pressure-capacity paradox analysis. Countries are classified by a median split on the Green dimension and on aggregate capacity (the mean of Education, Digital, and Innovation scores). The upper-left quadrant (High Pressure/Low Capacity) marks the paradox zone, whereas China falls in the Low Pressure/High Capacity quadrant despite its persistent digital bottleneck.
Sustainability 18 05271 g008
Figure 9. Robustness of rankings and structural findings. Left: Pairwise Spearman correlations between main ATCRI and alternative specifications exceed 0.98. Right: China’s rank is stable across all methods (ranks 5–39), with the majority of methods placing China in ranks 12–21.
Sustainability 18 05271 g009
Figure 10. Respondent-level questionnaire construct means for Chinese crop science students (n = 416). Labels above bars report construct mean and Cronbach’s α .
Sustainability 18 05271 g010
Table 1. Literature comparison: How ATCRI extends prior research.
StreamEstablished FocusRemaining GapATCRI Response
Agricultural education reformCurriculum reformLimited cross-country comparison160-country structural diagnosis
Smart agriculture educationStudent/faculty demandWeak delivery measurementAdds digital–energy delivery dimension
SDG/institutional capacityGovernance and implementationLimited education-specific operationalizationLinks SDG capacity to agricultural education
Composite readiness indicesIndex methodsRarely applied to agricultural talent cultivationBuilds proxy-based ATCRI
Table 2. Conceptual distinction: What ATCRI measures and what it does not.
CategoryMeaningExamplesIn ATCRI?
Enabling capacityConditions supporting reform implementationTertiary enrollment, R&D base, digital infrastructure, governanceYes
Transition pressureReform urgency (demand-side driver)Agricultural GDP share, agri CO2 emissionsYes (pressure only)
Realized outcomeActual education or graduate performanceCourse quality, skills, employment outcomesNo
Revealed capacity proxyObservable system performance used as proxyScientific articles, patents, high-tech exportsYes, cautiously
Table 3. ATCRI indicator definitions and sources.
IndicatorSourceDimensionDir.
Gross Tertiary EnrollmentWDIEdu & Research+
R&D Expenditure (% GDP)WDIEdu & Research+
Scientific Articles (Number)WDIEdu & Research+
Researchers per MillionWDIEdu & Research+
Internet Users (% pop.)WDIDigital, Energy & Infra+
Secure Servers (per M)WDIDigital, Energy & Infra+
Renewable Electricity (% total)WDIDigital, Energy & Infra+
Agricultural Value Added (% GDP)WDIGreen Transition Pressure
Agricultural CO2 (Mt)EDGARGreen Transition Pressure
Gov. Effectiveness (Index)WGIInnovation & Inst. Capacity+
High-Tech Exports (% mfg exp.)WDIInnovation & Inst. Capacity+
Patent Applications (Number)WDIInnovation & Inst. Capacity+
Notes: WDI codes are provided in Appendix Table A1. Agricultural CO2 emissions and Agricultural VA are treated as negative indicators because higher agricultural emissions intensity signals greater transformation pressure (demand-side), not greater capacity. After normalization, these indicators are reversed so that higher values consistently indicate greater readiness. The Digital, Energy and Enabling Infrastructure dimension is designed to capture delivery infrastructure rather than digital access alone.
Table 4. Descriptive statistics of ATCRI indicators (n = 160).
MeanSDMinQ25MedianQ75Max
Tertiary Enrollment Rate50.0230.112.5024.8551.3372.88154.01
R&D Expenditure (% GDP)1.121.210.040.270.671.475.87
Scientific Articles (×1000)19.2772.360.0040.191.2410.81738.84
Researchers per Million25052926124171559432719,088
Internet Users (%)69.3724.649.6755.8177.0687.8199.87
Secure Servers per Million19,72243,4802.54113.12743.8015,223266,818
Renewable Electricity (%)11.9313.970.002.116.5917.2379.53
Agriculture VA (% GDP)9.078.820.032.166.2712.8239.45
Agri CO2 (Mt)1.353.600.0010.080.201.1229.98
Govt Effectiveness0.160.93−1.83−0.570.030.792.23
High-Tech Exports (%)10.6112.280.002.476.6814.5070.14
Patent Applications (×1000)17.76124.280.0010.010.130.961338.34
Notes: Agricultural emissions data from EDGAR GHG Database 2024; all other indicators from World Bank WDI 2019–2023. Mean values represent 5-year averages. Missing data: 61 countries with 1–4 missing indicators imputed using sample medians.
Table 5. ATCRI rankings and dimension scores: top 30 countries.
RankCountryATCRIEduDigitalGreenInnovation
1Denmark1.0000.6221.0000.9830.572
2Singapore0.8870.5820.5571.0000.881
3United States0.8260.8660.5610.8370.640
4Netherlands0.8120.5470.6290.9710.614
5South Korea0.8090.8940.3570.9680.718
6Germany0.8040.6230.5990.9740.569
7Hong Kong0.8030.4220.4450.9990.917
8Liechtenstein0.7951.0000.4230.9970.468
9Finland0.7860.6710.5660.9610.538
10Iceland0.7850.5480.5650.9290.670
11Ireland0.7830.3890.6180.9830.658
12Switzerland0.7730.5670.5230.9930.610
13Sweden0.7510.6660.4630.9830.563
14United Kingdom0.7260.4930.5290.9550.563
15Japan0.7160.5920.3710.9730.659
16Austria0.7140.6290.4290.9830.529
17Estonia0.7130.3920.5860.9670.511
18Norway0.7090.5520.4080.9730.615
19Belgium0.7060.6090.4390.9920.498
20Israel0.6900.6130.3390.9810.602
21China0.6870.8350.2880.4981.000
22Australia0.6760.4910.4490.8940.594
23Luxembourg0.6580.2030.5560.9970.509
24Cyprus0.6570.3300.5330.9790.456
25France0.6480.4900.3800.9280.572
26Lithuania0.6400.3370.5470.9360.425
27Czechia0.6340.4170.4080.9670.507
28Spain0.6330.4480.4730.9340.422
29Canada0.6310.4800.3970.8840.552
30Greece0.6270.6320.3900.9350.377
Notes: Edu = Education and Research; Digital = Digital, Energy and Enabling Infrastructure; Green = Green Transition Pressure; Innovation = Innovation and Institutional Capacity. All scores normalized to [0, 1]. China is highlighted in bold.
Table 6. China’s indicator-level gap relative to top 10 average.
IndicatorChinaTop-10 MeanRaw GapDir.Readiness Rank a
Agri CO2 Emissions (Mt)16.201.32+14.881
Secure Servers (per M)1118122,007−120,889+2
Researchers per Million16557876−6221+3
Govt Effectiveness (index)0.641.79−1.15+4
Internet Users (%)74.794.5−19.8+5
Renewable Electricity (%)11.025.0−14.0+6
Agriculture VA (% GDP)7.11.3+5.87
Tertiary Enrollment (%)66.284.4−18.2+8
R&D Expenditure (% GDP)2.413.09−0.68+9
High-Tech Exports (%)29.330.9−1.6+10
Scientific Articles (×1000)738.880.4+658.4+11
Patent Applications (×1000)1338.355.8+1282.5+12
Notes: Top 10 = Denmark, Singapore, USA, Netherlands, South Korea, Germany, Hong Kong, Liechtenstein, Finland, Iceland. Raw Gap = China value minus Top-10 mean. Dir. = indicator direction in the ATCRI (+ = higher is better for readiness; − = higher raw value signals greater pressure, reversed upon normalization). a Readiness Rank orders indicators by the magnitude of China’s normalized readiness gap after accounting for direction reversal; rank 1 indicates the largest normalized readiness disadvantage (or, for negative-direction indicators, the smallest normalized readiness advantage after reversal). Although Agri CO2 has the largest raw gap, its normalized readiness contribution places it as a relative advantage after direction reversal because lower agricultural emissions are desirable. China’s five largest normalized readiness gaps are concentrated in digital delivery infrastructure (Secure Servers: rank 2; Internet Users: rank 5; Renewable Electricity: rank 6) and governance/researcher density (Govt Effectiveness: rank 4; Researchers per Million: rank 3), confirming that the bottleneck is specifically in the Digital, Energy and Enabling Infrastructure dimension rather than in education or innovation capacity where China meets or exceeds the Top 10 average.
Table 7. ATCRI and dimension means by World Bank income group, with China for comparison.
GroupnATCRIEduDigitalGreenInnovation
Low income140.0900.0730.0490.5380.133
Lower middle income400.2560.0990.1910.7180.210
Upper middle income460.3910.1760.2850.8430.285
High income590.6200.3960.4300.9500.469
China10.6870.8350.2880.4981.000
Notes: Income groups follow World Bank classifications already attached to the macro dataset. Group means are computed on the same 160-country analytical sample. The China row is shown for analytical comparison rather than as a group statistic.
Table 8. Pressure-capacity paradox matrix: mean ATCRI by zone (n = 160).
Low CapacityHigh Capacity
Green PressureLow0.217 (n = 63)0.482 (n = 17)
High0.371 (n = 17)0.602 (n = 63)
Table 9. Robustness check results: rank correlations and China’s overall rank stability.
SpecificationMethodSpearman ρ p-ValueChina Rankn
MainTheory-Informed Equal Weight1.00021160
R1Entropy Weighting0.997p < 0.00112160
R2PCA Weighting0.988p < 0.00139160
R3Full Equal Weight (1/12)0.997p < 0.00121160
R4Reduced Dimension (10 ind.)0.993p < 0.0015160
Table 10. China’s structural profile stability across robustness specifications.
SpecificationChina RankEduDigitalGreenInnovationInterpretation
Main21HighLowModerateVery highInnovation and education lead; digital remains the clearest delivery bottleneck
R1 Entropy weighting12HighLowModerateVery highSame structural reading; rank rises but the bottleneck diagnosis does not change
R2 PCA weighting39HighLowModerateVery highSame structural reading; rank falls but implementation asymmetry remains visible
R3 Full equal weighting21HighLowModerateVery highSame structural reading under indicator-level equal weighting
R4 Reduced-dimension5HighLowModerateVery highSame structural reading; reduced-dimension specification raises China’s rank
Notes: Table 10 summarizes the substantive four-dimension reading used throughout the paper. The alternative models perturb aggregation and rank, but they do not reverse the interpretation that China’s strongest assets lie in education and innovation while delivery infrastructure remains the clearest weak point.
Table 11. Micro-level survey results for the Chinese crop science student sample.
Questionnaire ConstructN ItemsMeanRespondent SDCronbach’s α Interpretation
Normative Orientation54.520.690.94Very strong normative support for low-carbon learning and promotion
Knowledge Base54.110.950.97Positive but comparatively weaker technical knowledge base
Curriculum and Practice Demand64.210.870.96Strong demand for curricular and practice-oriented upgrading
Behavioral Intention44.300.820.95Strong willingness to translate attitudes into action and careers
Notes: Scale: 1 = Strongly Disagree/Very Unimportant; 5 = Strongly Agree/Very Important. All 20 closed-ended items have 416 valid responses in the respondent-level matrix. Corrected item-total correlations range from 0.71 to 0.95 across the four sections. Overall factorability is strong (KMO = 0.96; Bartlett’s χ 2 (190) = 11,801.78, p < 0.001 ). Sample composition is 37.0% male and 63.0% female; 299 undergraduates, 109 master’s students, and 8 doctoral students; and 73.1% crop-science-track majors versus 26.9% related programs.
Table 12. Macro–micro theoretical mapping based on respondent-level questionnaire constructs and key items.
Macro ATCRI DimensionChina ScoreSurvey ProxyEvidenceConsistency
Education & Research0.835 (Strong)Curriculum and Practice DemandConstruct mean = 4.21Consistent (High-High)
Digital, Energy & Enabling Infrastructure0.288 (Weak)Practice-oriented delivery demandQ18 = 4.30; Q19 = 4.29Tension (Low-High)
Innovation & Institutional Capacity1.000 (Highest)Behavioral IntentionConstruct mean = 4.30Consistent (High-High)
Green Transition Pressure0.498 (Moderate)Normative Orientation/Knowledge Base4.52/4.11Partial but supportive
Table 13. Policy priorities by country configuration type.
ConfigurationTypical ProfilePolicy Priorities
High Pressure/Low CapacityStrong agricultural sector/emissions burden but weak education, delivery & institutional baseFoundational capacity building: expand tertiary enrollment in agriculture-related fields, establish minimum R&D reporting systems, develop basic digital connectivity and renewable energy for rural educational institutions
High Capacity/Delivery BottleneckStrong education & innovation but thin digital/energy delivery infrastructureDelivery-layer strengthening: smart-agriculture teaching laboratories, university–enterprise data-sharing platforms for precision-farming training, equipment-intensive practice modules, curriculum redesign linking course content to industry scenarios
High Capacity/Low PressureStrong enabling conditions but modest agricultural transition urgencyProactive integration: embed low-carbon and smart agriculture content into existing strong curricula before pressure intensifies; leverage existing delivery capacity to pre-position talent pipelines
Low Capacity/Low PressureWeak across multiple dimensions with limited current transition exposureGraduated development: prioritize basic educational access and governance improvement alongside selective pilot programs in high-potential agricultural regions
Disclaimer/Publisher’s Note: The statements, opinions and data contained in all publications are solely those of the individual author(s) and contributor(s) and not of MDPI and/or the editor(s). MDPI and/or the editor(s) disclaim responsibility for any injury to people or property resulting from any ideas, methods, instructions or products referred to in the content.