Article

A Preliminary Data-Driven Competency Mapping Study for Modular Construction Designers: Exploratory Korean Validation Using Bayesian BWM and Fuzzy DEMATEL


1
Department of Smart City Engineering, Hanyang University, Ansan-si 15588, Republic of Korea
2
Department of Architectural Engineering, Hanyang University ERICA, Ansan-si 15588, Republic of Korea
3
Center for AI Technology in Construction, Hanyang University ERICA, Ansan-si 15588, Republic of Korea
*
Authors to whom correspondence should be addressed.
Sustainability 2026, 18(10), 5212; https://doi.org/10.3390/su18105212
Submission received: 22 April 2026 / Revised: 16 May 2026 / Accepted: 18 May 2026 / Published: 21 May 2026
(This article belongs to the Section Green Building)

Abstract

Modular construction advances sustainability and is reshaping designer competencies, making workforce development critical to industry transition. Existing competency models rely mainly on expert interviews and Delphi methods, offering limited quantitative evidence on role-specific labor-market demands, causal relationships among competencies, or experience-based perceptual differences. This study presents a preliminary, data-driven competency-mapping study for modular construction designers by integrating BERTopic, Ward clustering, CVR, Bayesian BWM, and Fuzzy DEMATEL. Applied to 243 job postings from six countries, the text-mining stage identifies a candidate competency structure of 3 domains, 9 categories, and 36 performance statements. This candidate structure was then examined through an exploratory survey of 30 Korean respondents. The results suggest that Codes and Compliance represents the most clearly recognized high-consensus competency area within this local validation sample, whereas Modular Construction shows an indicative experience-related divergence in perceived causal position. Given the small and uneven subgroup sample and the formative state of Korea’s modular construction industry, the findings should be interpreted as preliminary evidence rather than as a validated competency framework or a confirmed expert–novice model. The study contributes a reproducible mixed-method workflow, a candidate competency map, and an illustrative maturity prototype for future validation and refinement.

1. Introduction

1.1. Background and Research Gap

The global construction industry faces multiple interrelated challenges, including low productivity, shortages of skilled labor, and increasing pressure to reduce carbon emissions [1,2,3,4,5]. In this context, modular construction has gained attention as an alternative approach that can reduce project duration, minimize waste, improve quality, and enhance on-site safety through off-site manufacturing [6,7,8,9]. McKinsey [10] reported that modular construction can reduce schedules by 20–50% and costs by up to 20% compared with conventional on-site methods, while Fortune Business Insights [11] projected market growth from USD 84.4 billion in 2023 to USD 131.5 billion by 2030 (6.5% CAGR).
Despite growing industrial interest, limited designer competency remains a major barrier to the adoption of modular construction [12]. Design in modular construction fundamentally differs from conventional practice and requires integrated technical competencies encompassing manufacturing, transportation, and interface constraints, as well as Design for Manufacture and Assembly (DfMA) [13,14,15,16]. Despite the recognized importance of designer competency, systematic identification of the competencies required for modular construction designers remains limited [12,17].
Existing competency research has three major limitations. First, competency identification is often subjective, as most studies rely on qualitative approaches such as literature reviews, the Delphi method, and expert interviews, making them susceptible to interpretation bias and limited in reflecting rapidly changing industry demands [18,19]. Second, previous studies often suffer from role mixing due to an overly broad definition of “modular construction designers,” leading to the inclusion or dilution of non-design competencies [18,20]. This issue is further exacerbated in job-posting-based text mining studies, where the use of broad corpora results in corpus contamination that dilutes role-specific competencies [21]. Third, existing studies are limited in the structuring and evaluation of identified competencies, particularly lacking in systematic structuring, validity verification, and integrated analysis of their importance and interrelationships [18,19,22].
As a result, competencies identified in existing studies have not been sufficiently extended into applicable frameworks, as such applications require systematic structuring and validation [23]. To address these limitations, this study adopts a data-driven job-posting approach, constructs a designer-specific corpus to mitigate role mixing, and develops a structured competency framework for systematic analysis and practical application [24].

1.2. Research Objectives and Contributions

Accordingly, this study adopts a data-driven and expert-informed approach to develop a preliminary competency framework for modular construction designers. Specifically, this study (1) constructs a designer-specific job-posting corpus and derives competency topics through semantic text mining, (2) hierarchically structures the identified competencies into domains, categories, and performance statements, (3) examines their perceived validity, importance, and causal relationships through an integrated survey, and (4) compares expert and non-expert perceptions as exploratory evidence of possible cognitive differences in an emerging modular construction market.
The contribution of this study lies in the integration of four elements. First, it develops a designer-specific competency framework from international labor-market data, thereby reducing the role-mixing problem found in broader construction or BIM competency studies. Second, it links data-driven extraction with expert validation through a mixed-method workflow combining BERTopic, Ward clustering, CVR, Bayesian BWM, and Fuzzy DEMATEL. Third, it introduces the expert-novice comparison as an analytical lens for understanding how modular construction experience may shape competency priorities and perceived causal structures. Fourth, it proposes a conceptual competency maturity model as an interpretive synthesis for future curriculum and workforce-development research. Given the small Korean validation panel, these contributions are positioned as preliminary and exploratory rather than as a finalized global competency standard.

2. Literature Review

As the construction industry undergoes industrialized production and digital transformation, there is an increasing need to define job-specific competencies more precisely [25]. In modular construction, in particular, decisions made during the design stage directly determine manufacturability, assemblability, project duration, quality, and on-site efficiency [26,27,28]. As a result, modular construction designers are expected to possess integrated competencies related to manufacturing constraints, interface coordination, supply chain integration, and digital information use [17,29,30].
Goulding et al. [13] framed the expansion of off-site construction as a transformation in production, organization, supply chains, and workforce systems, illustrating the broader direction of industrial change. Wuni and Shen [14] systematically reviewed the success factors of modular integrated construction projects and emphasized the importance of design–production integration and information management. However, these studies focus on industrial or project-level factors and do not empirically identify competencies required for modular construction designers.
Gao et al. [17] synthesized the DfMA literature in the construction sector and showed that changes in the role of designers are closely associated with design–production integration, as design processes are being reconfigured to simultaneously account for manufacturability and assimilability, highlighting the growing importance of integrating design and production considerations. However, the study relied primarily on a literature review, limiting its ability to provide empirical evidence on competencies derived from actual job-related data.
Bao et al. [31] identified key enablers of DfMA implementation using a literature review, case analysis, and semi-structured interviews, highlighting the importance of early collaboration and supply chain integration. However, the study does not provide validated competency structures or assess their relative importance. Tan et al. [29] examined digitally enabled DfMA from the perspective of product and process modularity and argued that designers must be capable of integratively managing digital information, interface coordination, and manufacturing knowledge. However, as a single-case study, it does not offer a generalized job-level competency structure.
Although DfMA-related studies highlight expanding designer roles in design–production integration and collaboration [32,33], they do not empirically identify or structure the competencies underlying this shift. Accordingly, Uhm et al. [20] analyzed BIM-related jobs and competencies using online job postings and systematized job types and competency elements through social network analysis and O*NET-based classification. However, reliance on term extraction and broad-level BIM job classification limits the study’s ability to capture the contextual meaning and boundaries of specific roles. Li et al. [21] demonstrated methodological advancement by applying a structural topic model (STM) to jointly analyze competency topics and covariate effects. However, because the analysis was confined to general BIM roles, it does not adequately explain complex roles such as modular construction designers.
Fundamentally, job posting data make it difficult to clearly distinguish job boundaries due to role mixing and the unstructured nature of the text [20,21]. In addition, conventional LDA-based topic models are limited in capturing contextual meaning in short, unstructured texts [34,35]. BERTopic addresses these limitations by leveraging transformer-based embeddings to better capture contextual and semantic information in short texts [36,37]. Accordingly, analyzing modular construction designer roles requires a designer-centric corpus, rigorous job filtering, and a BERTopic-based approach.
Competencies for modular construction designer roles should be understood as an interconnected structure rather than isolated keywords or topics [18,19]. Succar et al. [18] proposed a BIM competency framework by synthesizing the literature and prior studies on BIM competency and maturity, thereby providing a theoretical basis for understanding competencies as a structured system. However, the study remained at the conceptual level and gave limited attention to the hierarchical organization and validation of competencies derived from actual industry data.
Zhang et al. [19] combined the Delphi method with ISM–MICMAC to analyze the hierarchical structure and influence relationships among competencies, thereby highlighting the need for systematic structuring. However, the study addressed the construction industry as a whole, which limits its ability to reflect the specificity of particular job roles. Therefore, in the case of modular construction designer roles, the identified competencies should be understood not as isolated items but as an interrelated structure and should be systematically organized [18,19].
A practically applicable competency framework should present not only the relative importance of competencies but also their influence relationships and causal structure [19]. Multi-criteria decision-making methods such as AHP, ANP, and DEMATEL have been widely used for competency evaluation [38,39,40,41]. AHP is useful for deriving weights based on a hierarchical structure, but it assumes independence among evaluation criteria [40,42,43], ANP relaxes this assumption, but its comparison structure is complex and imposes a high response burden [38]. DEMATEL is effective in identifying influence relationships and causal structures among factors, but it is limited by the subjectivity inherent in expert judgments of relationship strength [39,44]. Therefore, competency analysis requires an integrated approach that considers validity assessment, importance evaluation, and influence relationships among competencies [45].
Fuzzy DEMATEL converts expert linguistic judgments into fuzzy values, enabling a more realistic analysis of influence relationships among complex factors [46]. Mirhosseini et al. [22] applied fuzzy DEMATEL-ANP to BIM leadership competencies and jointly analyzed cause–effect relationships and relative importance among competencies, empirically demonstrating that BIM competencies exhibit an interactive structure. Patel et al. [47] applied fuzzy DEMATEL to the critical success factors (CSFs) for BIM software selection and identified the causal structure among factors, confirming the usefulness of the method for decision-making problems in the construction sector. Although these studies confirmed the applicability of Fuzzy DEMATEL in BIM and construction, they were limited to BIM leadership or software selection; direct analyses of interrelationships among modular construction designer competencies remain scarce.
Rezaei [48,49] proposed and extended the Best–Worst Method (BWM), demonstrating that consistent weights can be derived with a reduced number of pairwise comparisons. However, the standard BWM is based on a deterministic approach that treats expert judgments as single-point values, limiting its ability to incorporate the opinions of multiple experts and the associated uncertainty. To address this limitation, the Bayesian BWM proposed by Mohammadi and Rezaei [50] offers a group decision-making model that probabilistically integrates the preferences of multiple experts while accounting for uncertainty, making it more suitable for competency importance analysis. However, although Bayesian BWM is effective for estimating relative importance, it does not directly capture the direction of influence or the causal structure among competencies. These aspects therefore need to be complemented by Fuzzy DEMATEL.
The existing literature reveals three key limitations. First, while studies on modular construction and DfMA have highlighted the changing role of designers and the importance of design–production integration, they have not empirically identified the competencies required for specific job roles. Second, data-driven competency studies have demonstrated the potential of labor market data, but they have not sufficiently controlled for role mixing and corpus contamination and remain limited in capturing contextual meaning. Third, existing approaches to competency structuring and evaluation have not integrated data-driven derivation with hierarchical validation, importance analysis, and influence relationship analysis within a unified framework.
In modular construction designer competency research, job-specific competency derivation, hierarchical structuring and validation, importance analysis, and influence relationship analysis must be sequentially connected. Because no single approach can fully achieve these objectives, this study uses a designer-centric corpus and rigorous job filtering, then sequentially performs BERTopic-based derivation, hierarchical structuring, and content validity assessment before integrating Bayesian BWM and Fuzzy DEMATEL to analyze competency importance and interrelationships (Table 1).

3. Research Methodologies

This chapter describes the theoretical foundations and rationale for the five methods adopted in this research: (1) BERTopic, (2) Ward hierarchical clustering, (3) the Content Validity Ratio (CVR), (4) Bayesian BWM, and (5) Fuzzy DEMATEL. Among them, BERTopic, Ward clustering, Bayesian BWM, and Fuzzy DEMATEL correspond to Semantic Topic Mining, Hierarchical Structuring, Uncertainty-Aware Weighting, and Causal Mapping, respectively, while CVR provides consensus validation. Together, these methods extract topics from text, structure them hierarchically, and validate the framework through respondent evaluation across consensus, importance, and causal structure.

3.1. BERTopic Topic Modeling

BERTopic [37] is a neural topic modeling technique that extracts semantically coherent topics using pre-trained transformer embeddings. Unlike conventional word co-occurrence-based topic models [51], BERTopic clusters heterogeneous expressions of the same concept into a single topic, making it suitable for short, domain-specific texts. It comprises Sentence-BERT (SBERT) [36] embedding, Uniform Manifold Approximation and Projection (UMAP) [52] dimensionality reduction, Hierarchical Density-Based Spatial Clustering of Applications with Noise (HDBSCAN) [53] clustering, and c-TF-IDF topic representation. The c-TF-IDF (class-based Term Frequency–Inverse Document Frequency) weight is defined as follows:
W t , c = t f t , c · l o g 1 A t f t
where W t , c = c-TF-IDF weight of term t in cluster c ; t f t , c = in-cluster frequency; A = average words per cluster; and t f t = total corpus frequency, respectively. Topic quality is evaluated using topic coherence [54] and topic diversity [55].

3.2. Ward Hierarchical Clustering

Ward hierarchical clustering [56] is an agglomerative method that minimizes the increase in within-cluster variance at each merge. Compared with Single or Average Linkage, Ward’s method produces more balanced hierarchies and is adopted as the standard hierarchical option in BERTopic [37], particularly for balanced inputs such as c-TF-IDF vectors. The Ward distance between clusters A and B is defined as follows:
d W ( C i , C j ) = n i · n j n i + n j x ˉ i x ˉ j 2
where n A , n B = number of elements; and c A , c B = centroid vectors, respectively. The optimal number of clusters k is determined based on the silhouette coefficient [57] and the interpretive validity of the dendrogram.

3.3. Content Validity Ratio (CVR)

The Content Validity Ratio (CVR) [58] quantifies panel consensus on content validity and has been widely used to validate competency assessments in medicine, education, and human resource management [59]. CVR is calculated as follows:
C V R = n e N / 2 N / 2
where n e = respondents rating an item as “Essential”; and N = total respondents, respectively. Significance thresholds depend on sample size N and significance level α , and were recalculated by Ayre and Scally [60] using exact binomial testing.

3.4. Bayesian Best–Worst Method (BWM)

Bayesian BWM [50] is a probabilistic extension of the BWM [50] that enables robust weight estimation for small respondent groups and quantifies uncertainty through credible intervals. BWM requires only two pairwise comparisons, substantially fewer than the Analytic Hierarchy Process (AHP) [50].
Respondents identify the Best ( B ) and Worst ( W ) criteria and construct Best-to-Others (BO) and Others-to-Worst (OW) vectors on a 1–9 scale. The optimal weight vector w * is obtained by solving:
m i n   m a x j w B w j a B j w j w W a j W s . t . j = 1 n w j = 1 , w j 0 j
where w B , w W = Best/Worst weights; and a B j , a j W = BO/OW preferences, respectively. The Bayesian extension models these vectors as likelihoods with a Dirichlet prior and estimates the posterior via Markov Chain Monte Carlo (MCMC) sampling [50]. Consistency is evaluated using the Consistency Ratio (CR), with thresholds from Rezaei [48] and Liang et al. [61].

3.5. Fuzzy DEMATEL

Fuzzy DEMATEL [46] extends the Decision-Making Trial and Evaluation Laboratory (DEMATEL) [39] by representing respondent judgments as Triangular Fuzzy Numbers (TFNs) to quantify direct and indirect influence among factors and classify them as causes or effects [62].
Respondents rate influence on a 5-point linguistic scale (NI, VL, L, H, VH), which is converted into TFNs as listed in Table 2. The fuzzy direct-relation matrices from n respondents are averaged into Z ~ , defuzzified into a crisp matrix Z via the Converting Fuzzy data into Crisp Scores (CFCS) method [63], and normalized as follows:
X = s · Z , s = m a x 1 i n j = 1 n z i j 1
T = X ( I X ) 1
D i = j = 1 n t i j , R i = j = 1 n t j i
where T = total-relation matrix capturing direct and indirect effects; D i = total influence exerted by factor i ; and R i = total influence received, respectively. Prominence ( D + R ) indicates overall importance, while Relation ( D R ) indicates causal position: positive values denote cause factors and negative values denote effect factors.

4. Competency Framework Development and Survey Design

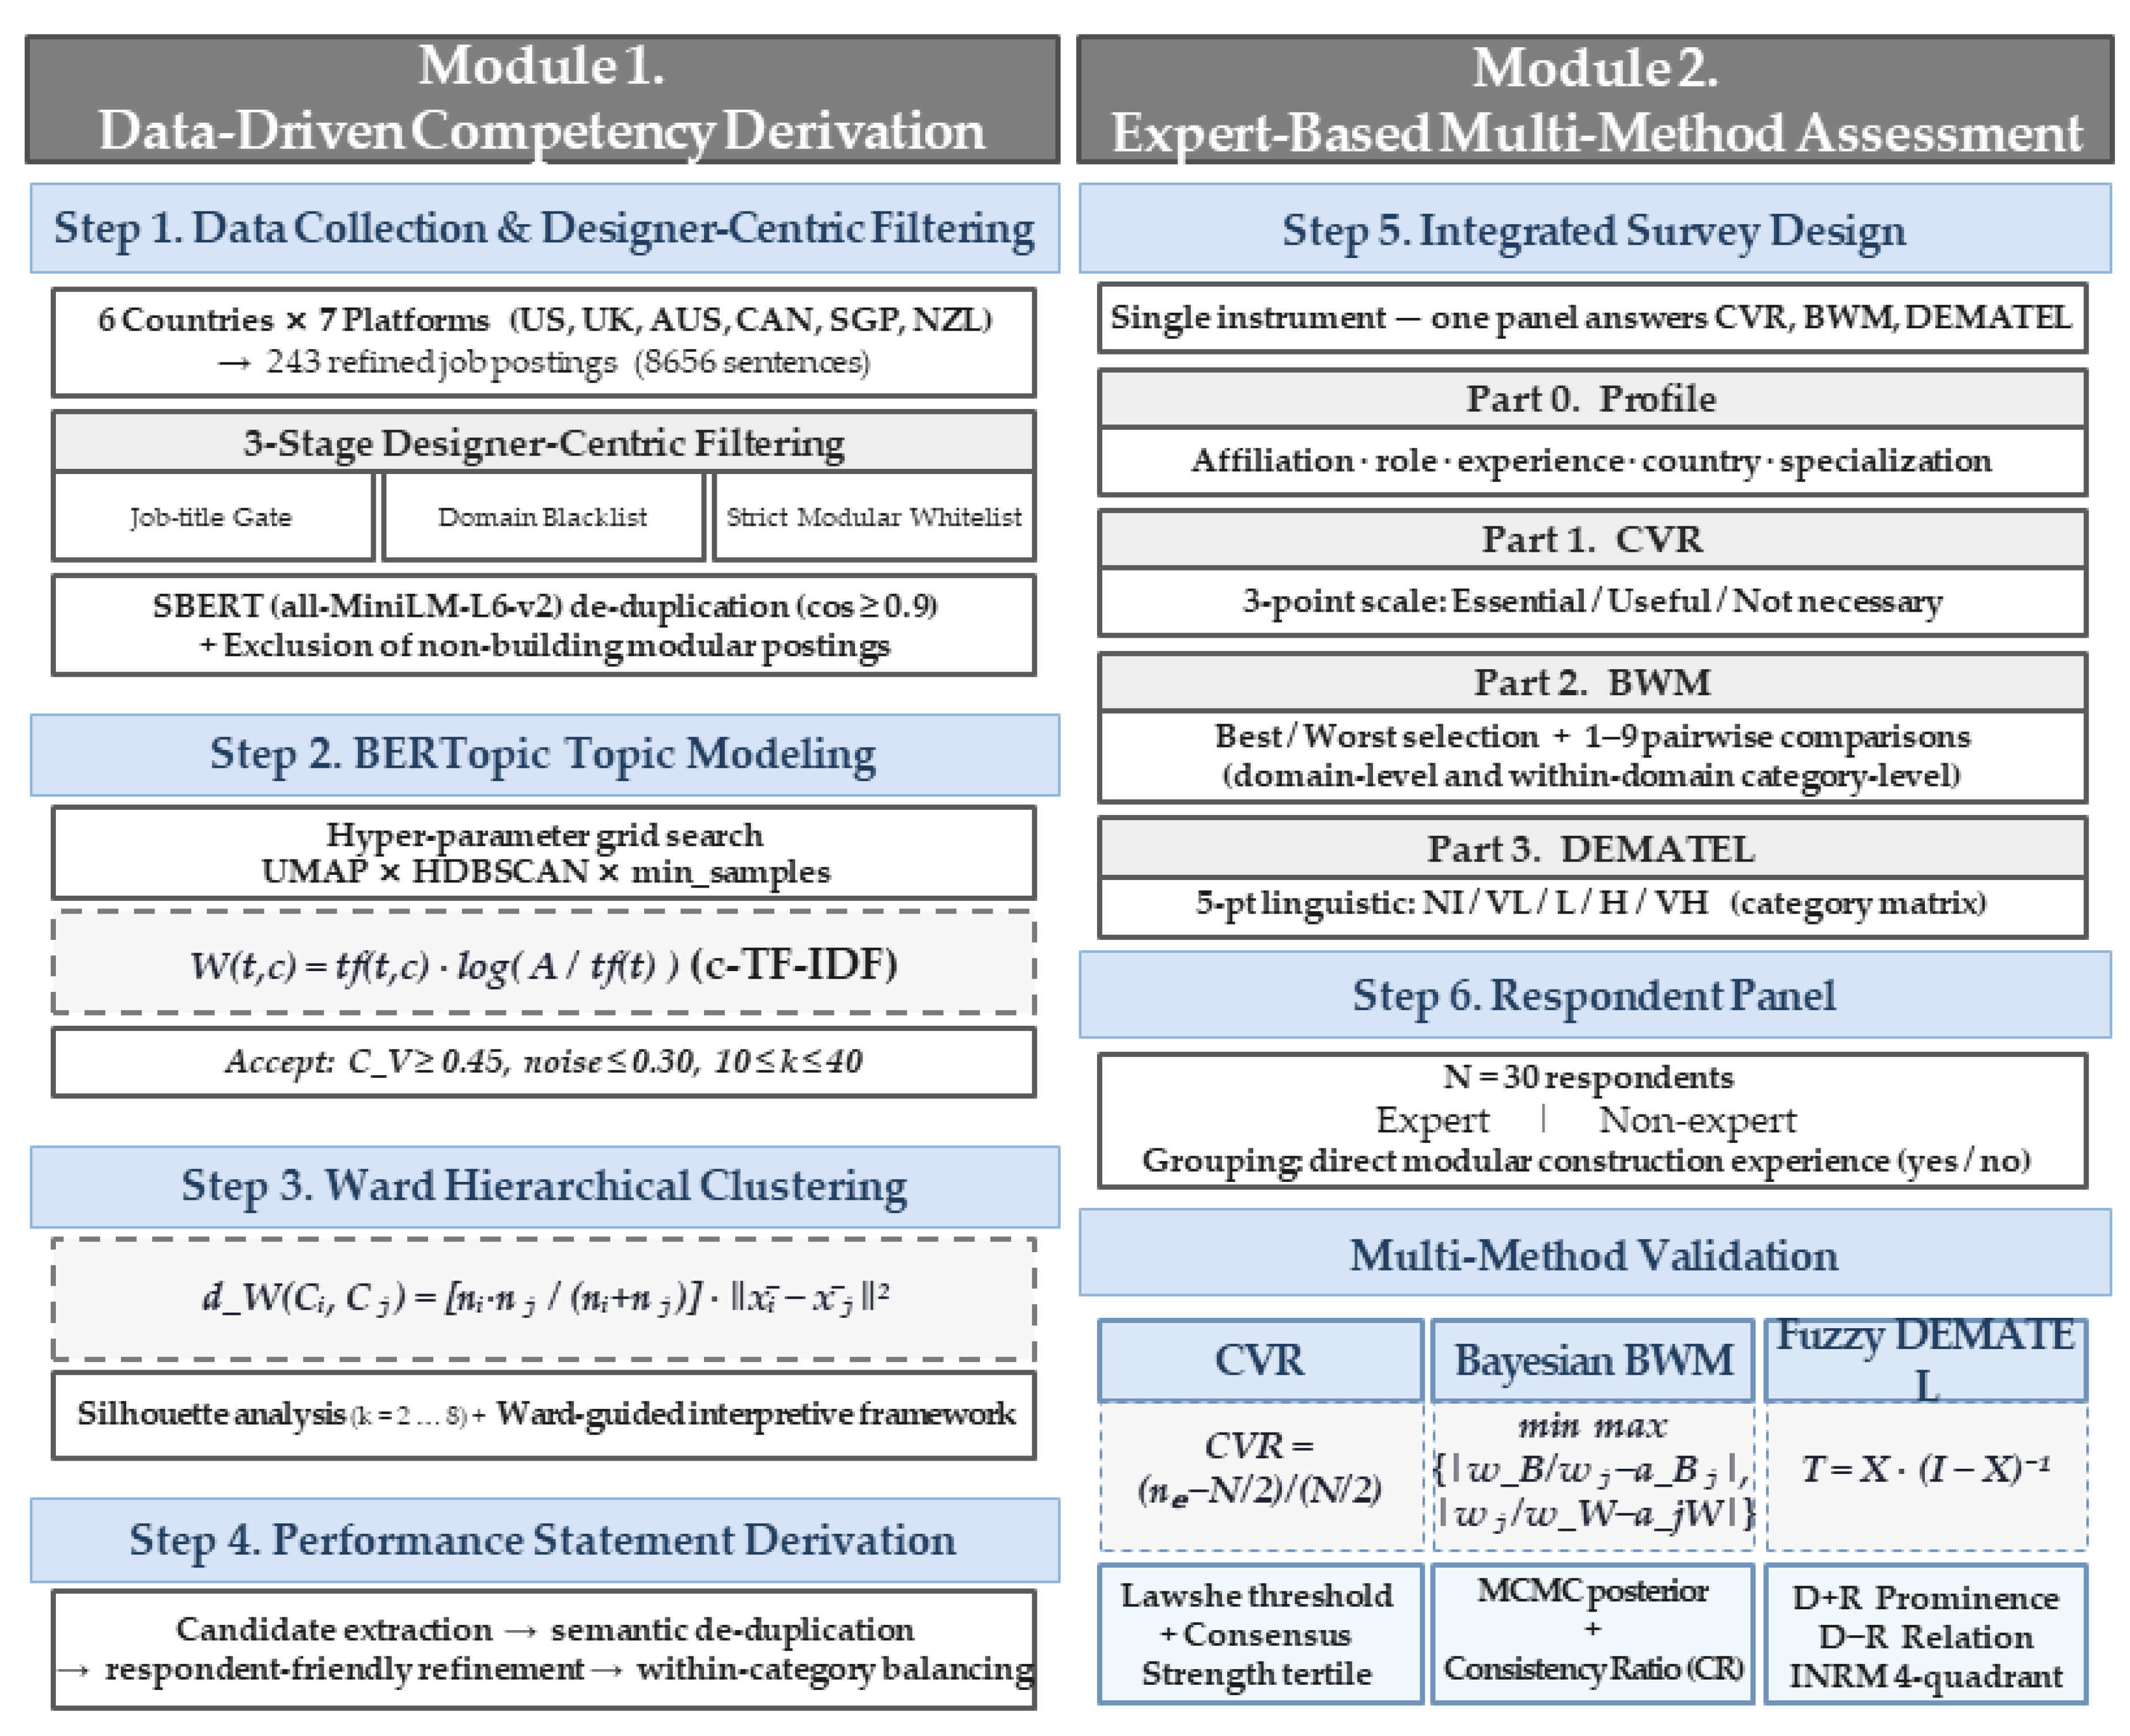
Figure 1 presents the integrated research framework that combines the five methods described in Section 3 to derive and examine a preliminary competency structure for modular construction designers. It consists of two modules. Module 1 (Data-Driven Competency Derivation) derives the competency structure from the job-posting corpus through four stages: data collection and cleaning (Section 4.1), BERTopic topic modeling (Section 4.2), Ward hierarchical clustering (Section 4.3), and performance statement derivation (Section 4.4). Module 2 (Expert-Based Multi-Method Assessment) examines the candidate competency structure through an integrated survey (Section 4.5) and respondent panel (Section 4.6) that simultaneously deploy CVR, Bayesian BWM, and Fuzzy DEMATEL. Bayesian BWM serves as the primary analysis, while CVR and Fuzzy DEMATEL serve as supplementary analyses to reduce single-method bias and ensure robustness. Table 3 presents the inputs, procedures, and outputs of the two modules.

4.1. Data Collection and Designer-Centric Filtering

Modular construction job postings were collected between February and March 2026 from seven platforms (Adzuna, Reed, LinkedIn, Seek, Indeed, SimplyHired, and MyCareersFuture) across six English-speaking countries with active modular markets (USA, UK, Australia, Canada, Singapore, and New Zealand), using official REST APIs and structured web scraping in compliance with each platform’s rate limit and robots.txt policies. Search queries combined modular-industry terms (modular, prefab, offsite, DfMA, volumetric) with design-role terms (designer, architect, BIM, CAD).
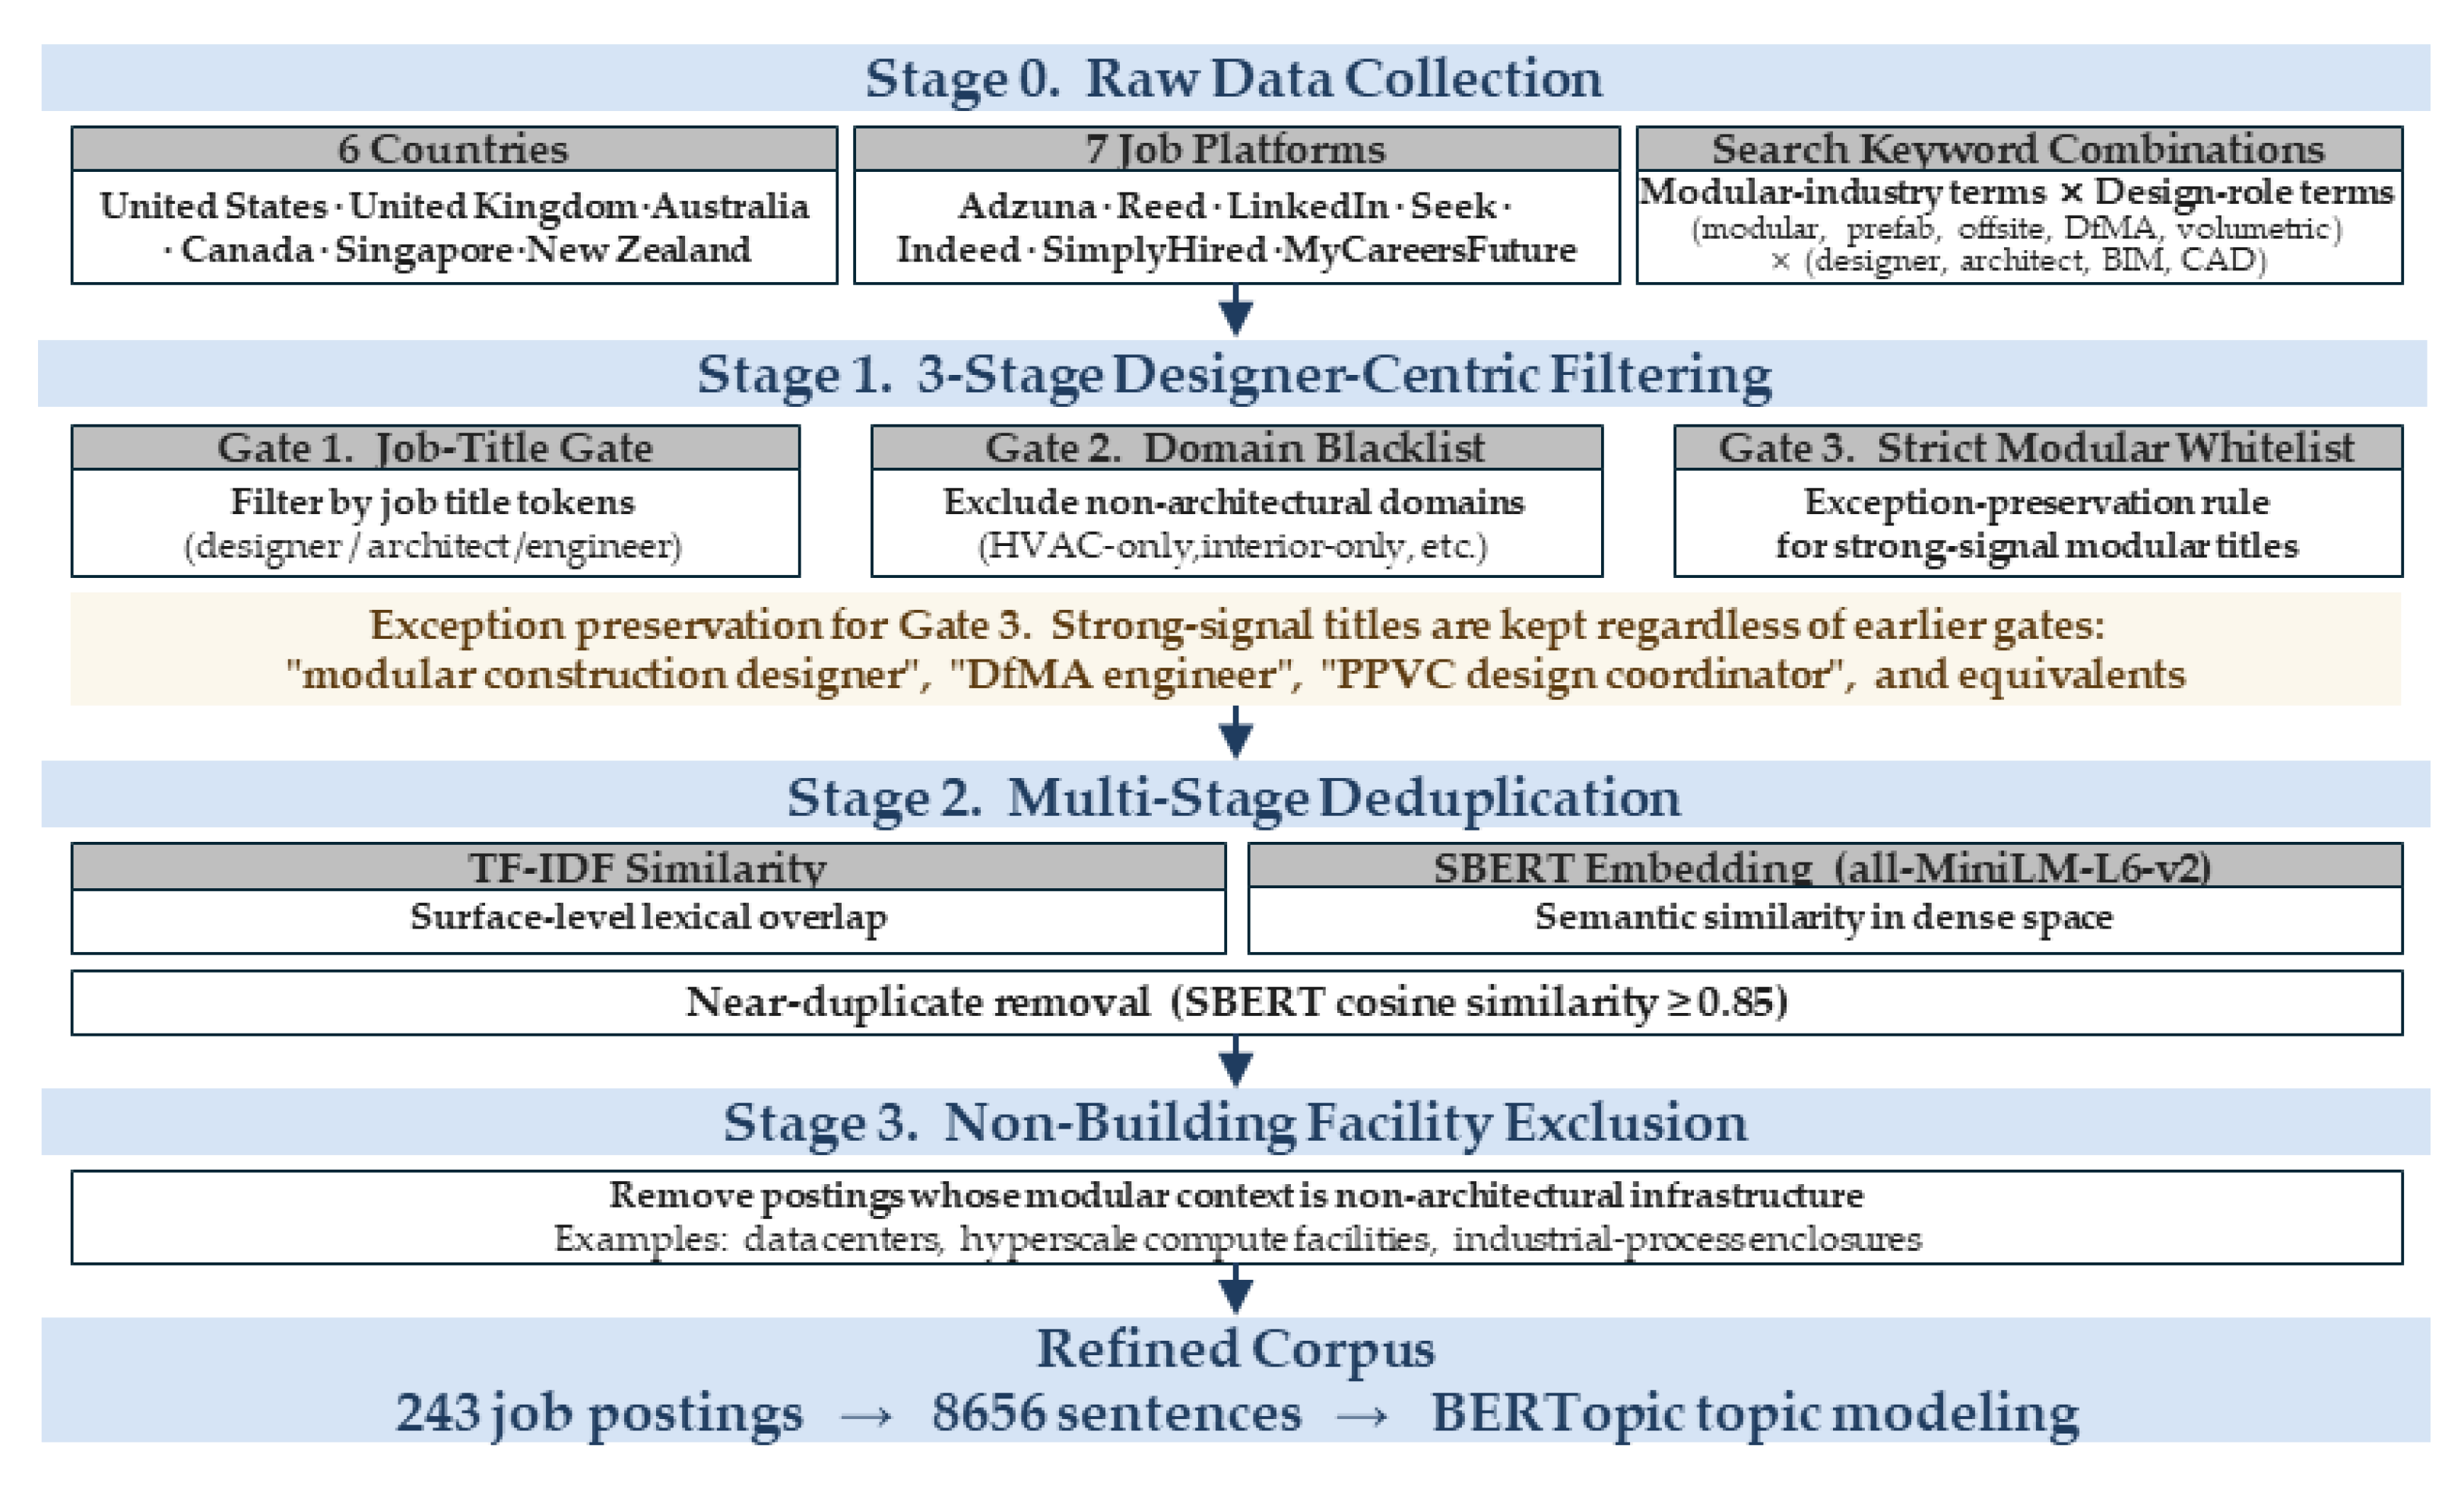
A multi-layered filtering pipeline was then applied (Figure 2): (1) three-stage designer filtering (job title gate, domain blacklist, and modular whitelist); (2) TF-IDF- and SBERT-based deduplication at a cosine similarity threshold of 0.85; and (3) exclusion of non-building facilities. The whitelist preserved strong-signal titles such as “modular construction designer” and “DfMA engineer”. After filtering, 243 postings were segmented into 8656 sentences as input for BERTopic modeling. To improve the auditability of corpus construction, the filtering process was documented in greater detail. Table 4 reports the number of postings retained and removed at each filtering stage, together with the main reason for removal. The initial corpus was first screened through a job-title gate to retain design-oriented positions. A domain blacklist then removed postings primarily related to sales, general project management, site supervision, manufacturing labor, procurement, or administrative roles. A modular whitelist retained postings with explicit modular, off-site, prefabrication, DfMA, or volumetric construction relevance. Finally, TF-IDF and SBERT similarity checks were used to remove duplicate or near-duplicate postings, and non-building facility postings were excluded. Representative examples of included and excluded postings are provided in Appendix A.

4.2. BERTopic Topic Modeling Application

BERTopic was applied to the 8656 sentences constructed in Section 4.1. While job-posting BERTopic analysis has been adopted in labor-market competency studies [64,65], to the authors’ knowledge, no prior study has applied it to the modular construction designer domain.
The all-MiniLM-L6-v2 model (384 dimensions) [36,37] was used for sentence embedding. Because topic quality is sensitive to UMAP and HDBSCAN hyperparameters [65], a grid search over four hyperparameters was conducted (Table 5), with ranges initialized from BERTopic defaults [37] and UMAP/HDBSCAN recommendations [52,53] and adjusted for the corpus size based on pilot runs. UMAP cosine distance with min_dist = 0, and HDBSCAN Excess of Mass (EOM) selection, were fixed across all combinations.
The resulting 144 models were evaluated by topic coherence ( C V ) and topic diversity. The acceptance criteria were: (1) C V 0.45 [54]; (2) noise ratio ≤ 30% [53]; and (3) 10 ≤ k ≤ 40, outside which domain structuring is infeasible or interpretability degrades. The selected configuration is reported in Section 5.1. Because the predefined noise threshold was used as a practical screening criterion rather than an absolute validity boundary, configurations close to the threshold were also reviewed for semantic stability. Sensitivity was examined by comparing adjacent hyperparameter configurations in terms of topic coherence, topic diversity, number of topics, and the interpretability of representative sentences. Repeated runs using the same embedding data produced consistent competency-related topic structures, suggesting that the selected configuration was not an incidental result of a single run. Noise and excluded topics were further reviewed qualitatively to assess whether potentially relevant designer competency statements were being systematically lost.
Topics directly relevant to designer competencies were selected by two criteria: representative keywords showing design-role relevance, and representative sentences framed as competency descriptions. Topics on benefits, application procedures, qualifications, and company culture were excluded.

4.3. Domain Identification Through Ward Hierarchical Clustering

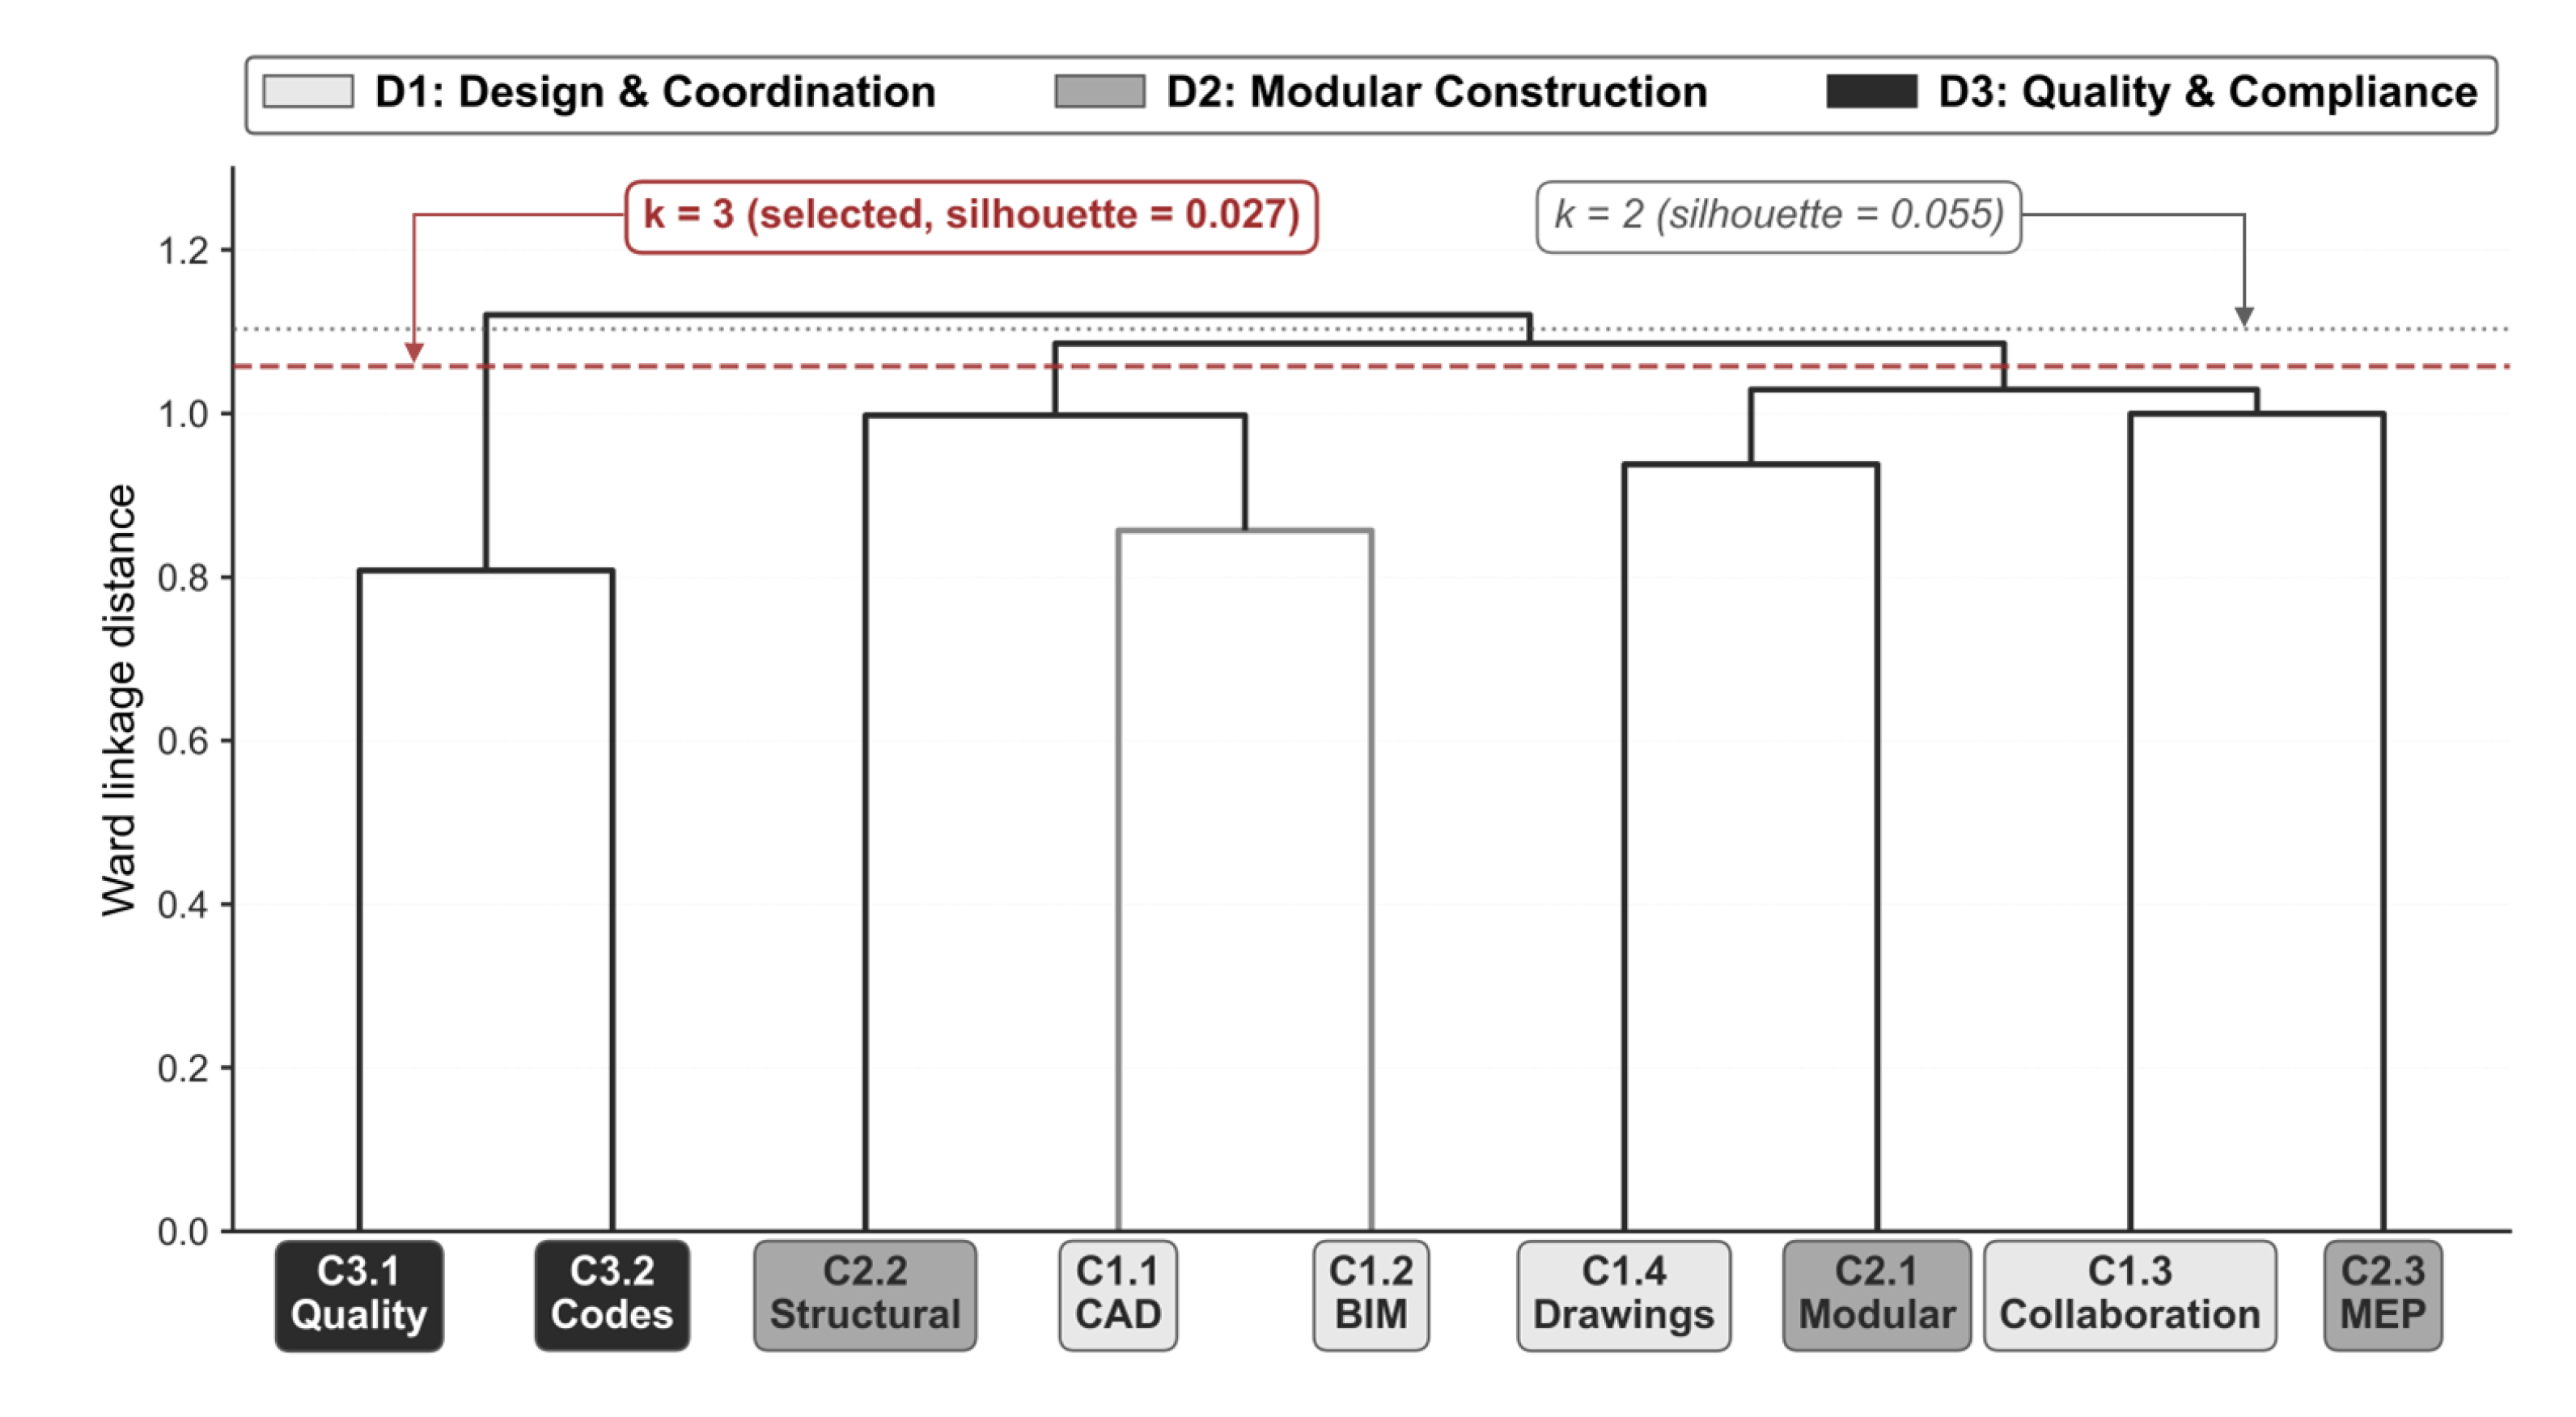
Ward hierarchical clustering was applied to the nine valid topics selected in Section 4.2 to derive higher-level domains. Each of the nine valid topics was designated as a category, and Ward clustering operated only at the category-to-domain level. The unnormalized c-TF-IDF vector of each topic was used as input [37], and Ward linkage was computed using the Euclidean distance metric.
The optimal number of clusters k was determined from the silhouette coefficient [9] and dendrogram merge-distance changes. Ward first split the nine categories at the highest merge distance, separating {C3.1 Quality & Standards, C3.2 Codes & Compliance} from the remaining seven. Preserving this split, sub-cluster signals among the remaining seven and domain expertise were combined—a Ward-guided interpretive framework—to form three domains: D1 Design Tools & Coordination, D2 Modular Construction Engineering, and D3 Quality & Regulatory Compliance. Domain names followed shared within-domain category meaning and general modular competency classifications. Clustering metrics, the branching structure, and naming rationale are reported in Section 5.1.
The Ward clustering results were interpreted cautiously because only nine competency topics were clustered at the category-to-domain level. With such a small number of semantically adjacent topics, silhouette coefficients were expected to be low and were therefore used as diagnostic evidence rather than as the sole selection rule. Robustness was checked by comparing candidate k = 2–5 solutions and reviewing whether the resulting branches remained consistent with category labels, representative topic content, and modular construction design logic. The final domain structure prioritized three criteria jointly: avoidance of extreme cluster imbalance, consistency with dendrogram branching, and semantic interpretability from the perspective of modular construction design practice.

4.4. Performance Statement Derivation

Four performance statements (PSs) were derived for each of the nine categories, yielding 36 PSs that complete the competency framework of three domains, nine categories, and 36 PSs. The derivation procedure consisted of four steps.
(1) Candidate extraction. Representative sentences with the highest c-TF-IDF scores were extracted from each category. (2) Semantic deduplication. SBERT-based semantic similarity was used to remove redundant candidates and to retain sentences covering diverse aspects of the category. (3) Respondent-oriented refinement. While preserving the semantic core, the selected sentences were refined with modular construction context (e.g., specific tools, procedures, and standards) to improve respondent evaluability. (4) Within-category balancing. The four PSs per category were adjusted to cover the category’s competency scope evenly, avoiding single-aspect bias.
Table 6 presents a representative PS for each of the nine categories. The full list of 36 PSs is provided in Table A2 (Appendix B) and serves as the Part 1 (CVR) evaluation items of the integrated survey described in Section 4.5.

4.5. Integrated Survey Design

An integrated survey was designed to collect data for CVR, BWM, and DEMATEL simultaneously from a single instrument. This design mitigates respondent fatigue and response inconsistency that arise when the three analyses are conducted separately and enables the same respondent’s judgments to be analyzed consistently across content validity, relative importance, and causal structure. The survey was produced in Word format, distributed via email, and organized into four parts (Table 7).
Part 2 (BWM) was conducted hierarchically at the domain level (across D1, D2, and D3) and at the category level (within each domain). Part 3 (DEMATEL) was applied only at the category level [39,46] for two reasons: (1) pairwise influence evaluations grow from 72 cells at the category level (n = 9) to 1260 cells at the PS level (n = 36), imposing an unrealistic respondent burden; and (2) the causal analysis in this study targets domain–category structural relationships rather than PS-level interactions. Linguistic responses on the 5-point scale were converted to TFNs as defined in Table 2 (Section 3.5), and the analysis is reported in Section 5.

4.6. Composition of the Respondent Panel

The integrated survey was distributed to professionals in the Korean modular construction sector, yielding 30 valid responses. Respondents were classified into an Expert group (n = 9) and a Non-expert group (n = 21) using direct modular construction involvement as the operational criterion. Specifically, respondents were classified as Experts when they had participated in modular construction projects or modular-specific design tasks, such as modular unit design, BIM/model coordination for off-site construction, fabrication-oriented design coordination, or regulatory/design review for modular projects. These task examples identify the role basis used for classification; however, because the survey did not collect a separate role-by-respondent task log, the Expert group should be interpreted as a direct-exposure group rather than a fully stratified expert panel. Respondents without direct modular construction project experience were classified as Non-experts.
This classification reflects the formative stage of the Korean modular construction industry, where professionals with long modular-specific careers remain limited. Among the nine Expert respondents, only one had more than 10 years of modular construction experience, while eight had less than three years. Therefore, the term “Expert” in this study should be understood as an operational category based on direct project involvement, not as a claim of long-tenured or internationally representative expertise. This limitation may affect the reliability of subgroup comparisons, and the Expert-Non-expert results are interpreted as indicative perceptual patterns rather than statistically generalizable group differences. Completeness of the demographic information and all four survey parts was verified for every respondent, and all 30 responses were used in the analysis. Respondent demographics are presented in Table 8.

5. Results

This chapter reports the empirical results of the research framework, focusing on numerical findings. Throughout the chapter, D denotes Domain and C denotes Category; for example, C2.1 refers to the first category of Domain 2. Section 5.1 presents the topic extraction and domain structuring results, and Section 5.2, Section 5.3 and Section 5.4 present the CVR, Bayesian BWM, and Fuzzy DEMATEL results, respectively. The integrated interpretation of these analyses, the proposed Preliminary Competency Maturity Model (CMM), and the academic and practical implications are discussed in Section 6.

5.1. BERTopic Topic Modeling and Ward Clustering Results

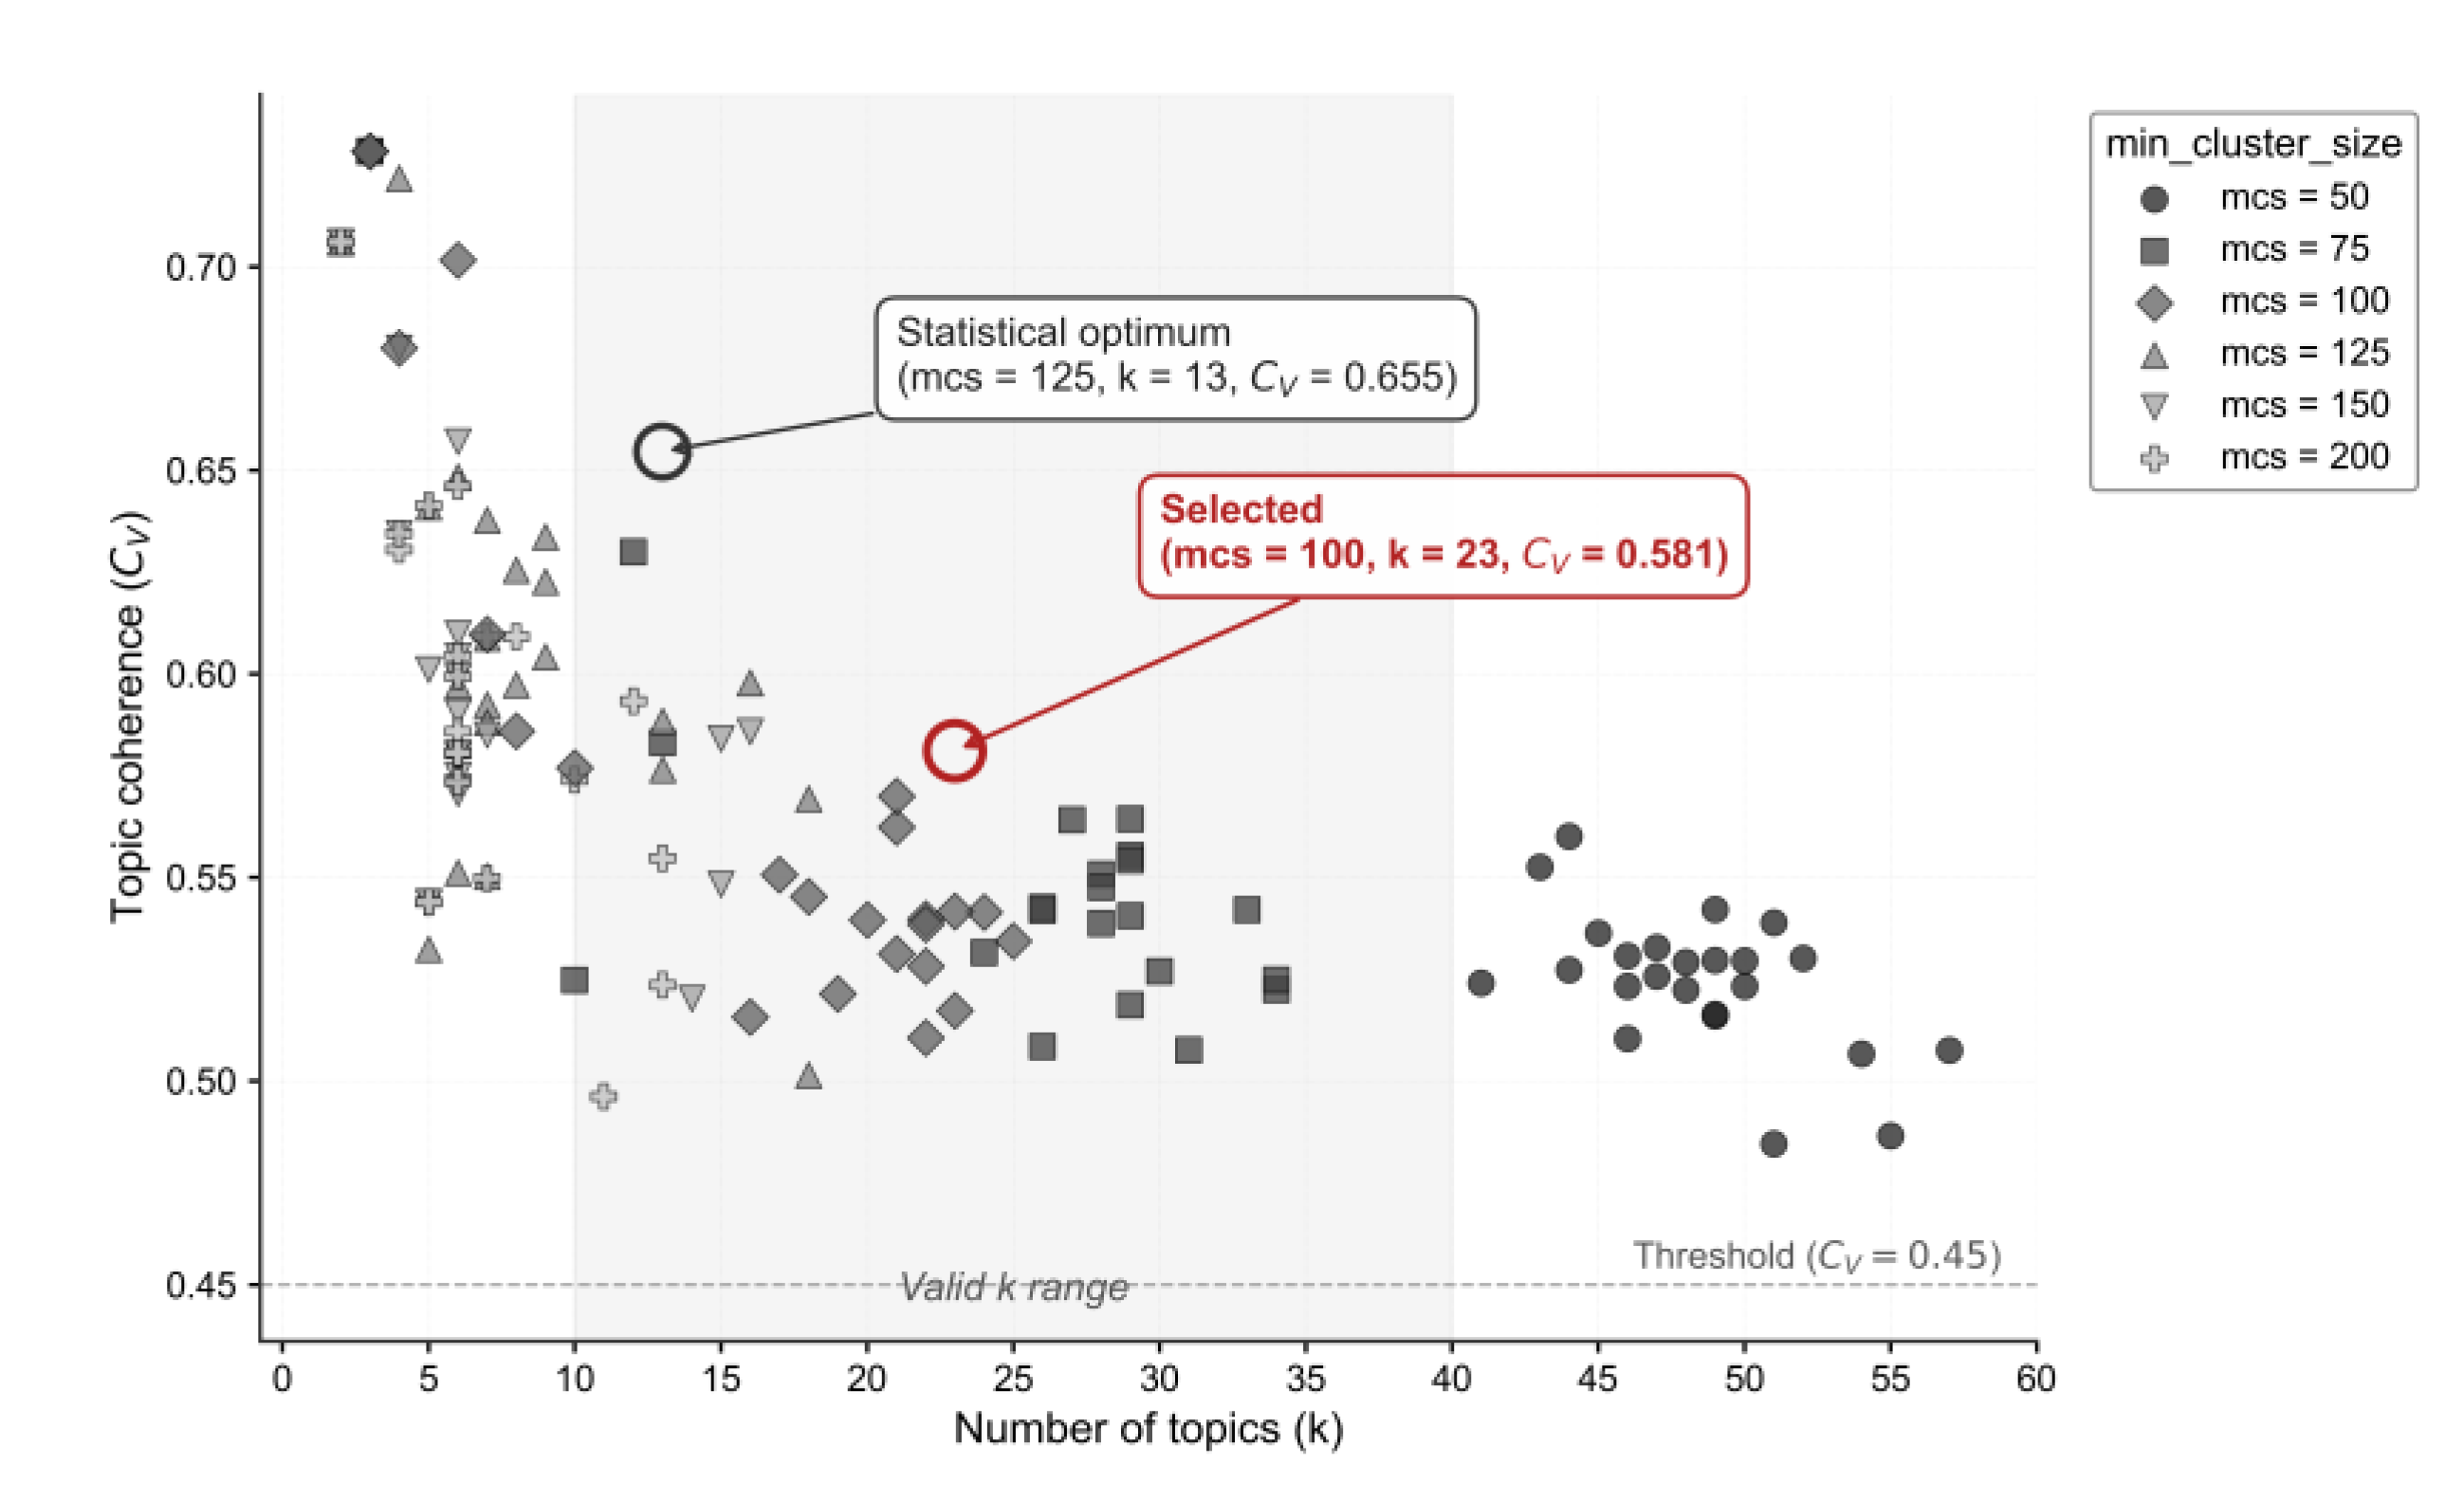
A grid search over 144 hyperparameter combinations was conducted (Figure 3). Among configurations meeting the acceptance criteria (Section 4.2), the highest topic coherence was achieved at mcs = 125 (C_V = 0.655, k = 13). However, after excluding non-competency topics (e.g., benefits, application procedures, and qualifications), only 6–7 competency-related topics remained, providing insufficient granularity for modular construction designer competencies.
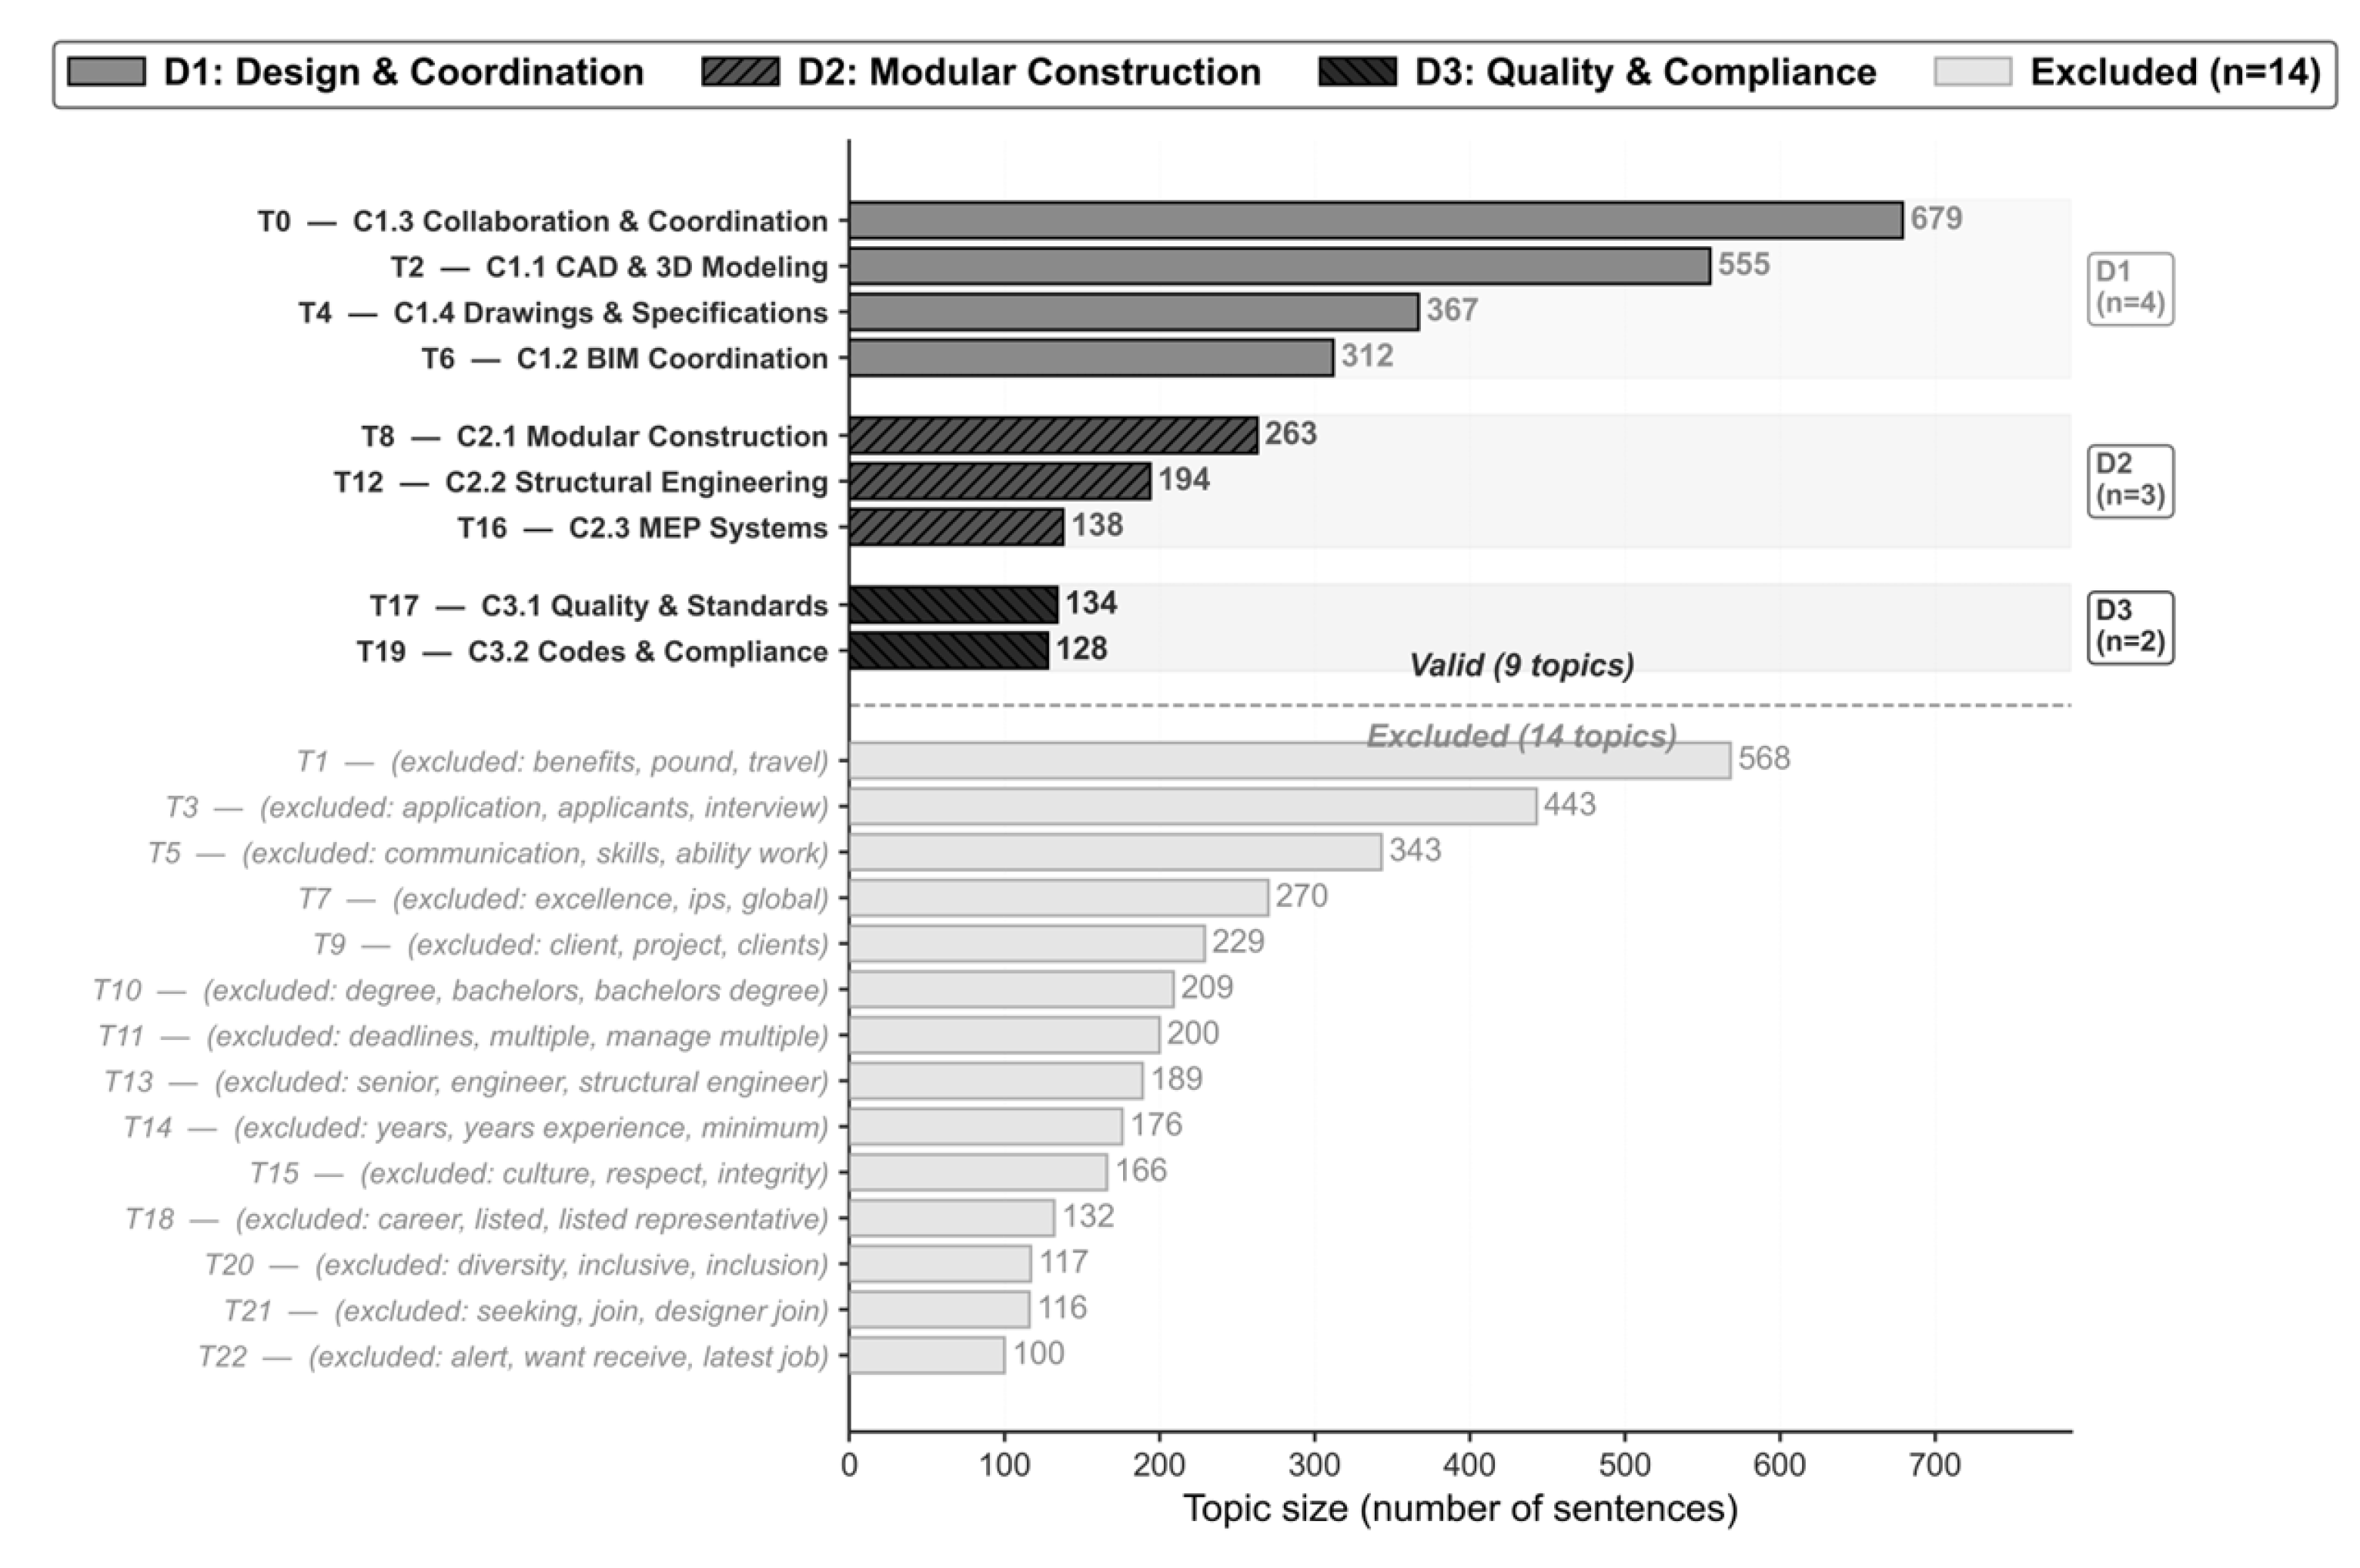
Accordingly, mcs = 100 was selected to balance coherence and granularity, as it yielded the most stable coherence in the k = 20–25 range. The final configuration (n_neighbors = 7, n_components = 5, mcs = 100, min_samples = 3) produced 23 topics (C_V = 0.581, topic diversity = 0.974). The noise ratio was 30.36% (2628/8656 sentences), slightly exceeding the predefined 30% threshold. This configuration was retained because adjacent configurations that satisfied the threshold produced either lower competency granularity or a less interpretable topic set. Repeated runs on the same embedding data produced stable topic structures, and qualitative review indicated that most noise sentences concerned generic job-advertisement content, company descriptions, benefits, or broad qualification language rather than specific designer competency statements. Nevertheless, because noise sentences were not used to construct performance statements, the framework may underrepresent competencies expressed through diffuse, general, or weakly clustered wording; this limitation should be considered in future validation. Applying the two selection criteria in Section 4.2, nine valid topics were identified, each containing 128–879 sentences and together covering approximately 32% (2770/8656) of the corpus. The 14 excluded topics concerned non-competency content and were not used to construct performance statements (Figure 4).
Ward hierarchical clustering on the nine topics’ c-TF-IDF vectors produced a three-domain structure (Figure 5). Silhouette coefficients for k = 2 through k = 5 are presented in Table 9. The coefficient was highest at k = 2 (0.055) but yielded a severely unbalanced 1:9.6 split (262 vs. 2508 sentences). At k = 3, the coefficient decreased to 0.027 but produced a balanced 4–3–2 structure, with D3 separating at the first branch (Ward distance ≈ 1.05) and D1/D2 at the second (≈1.0).
D3 (Quality & Regulatory Compliance) comprised C3.1 Quality & Standards and C3.2 Codes & Compliance, while the remaining seven categories were divided into D1 (Design Tools & Coordination, C1.1–C1.4) and D2 (Modular Construction Engineering, C2.1–C2.3) based on sub-cluster signals and domain expertise. Sentence shares were 69% (1913), 21% (595), and 10% (262) for D1, D2, and D3, respectively. The silhouette coefficients were low across all candidate k values, indicating weak statistical separation among the nine semantically related competency categories. Therefore, the clustering result should not be interpreted as a purely statistical taxonomy. The k = 3 solution was selected because it provided the most defensible balance between numerical diagnostics and substantive interpretation: k = 2 had the highest silhouette coefficient but produced an extreme 2-7 split, while k = 3 preserved the first dendrogram separation of regulatory/quality categories and yielded a balanced and interpretable 4-3-2 domain structure.

5.2. Results of the CVR Analysis

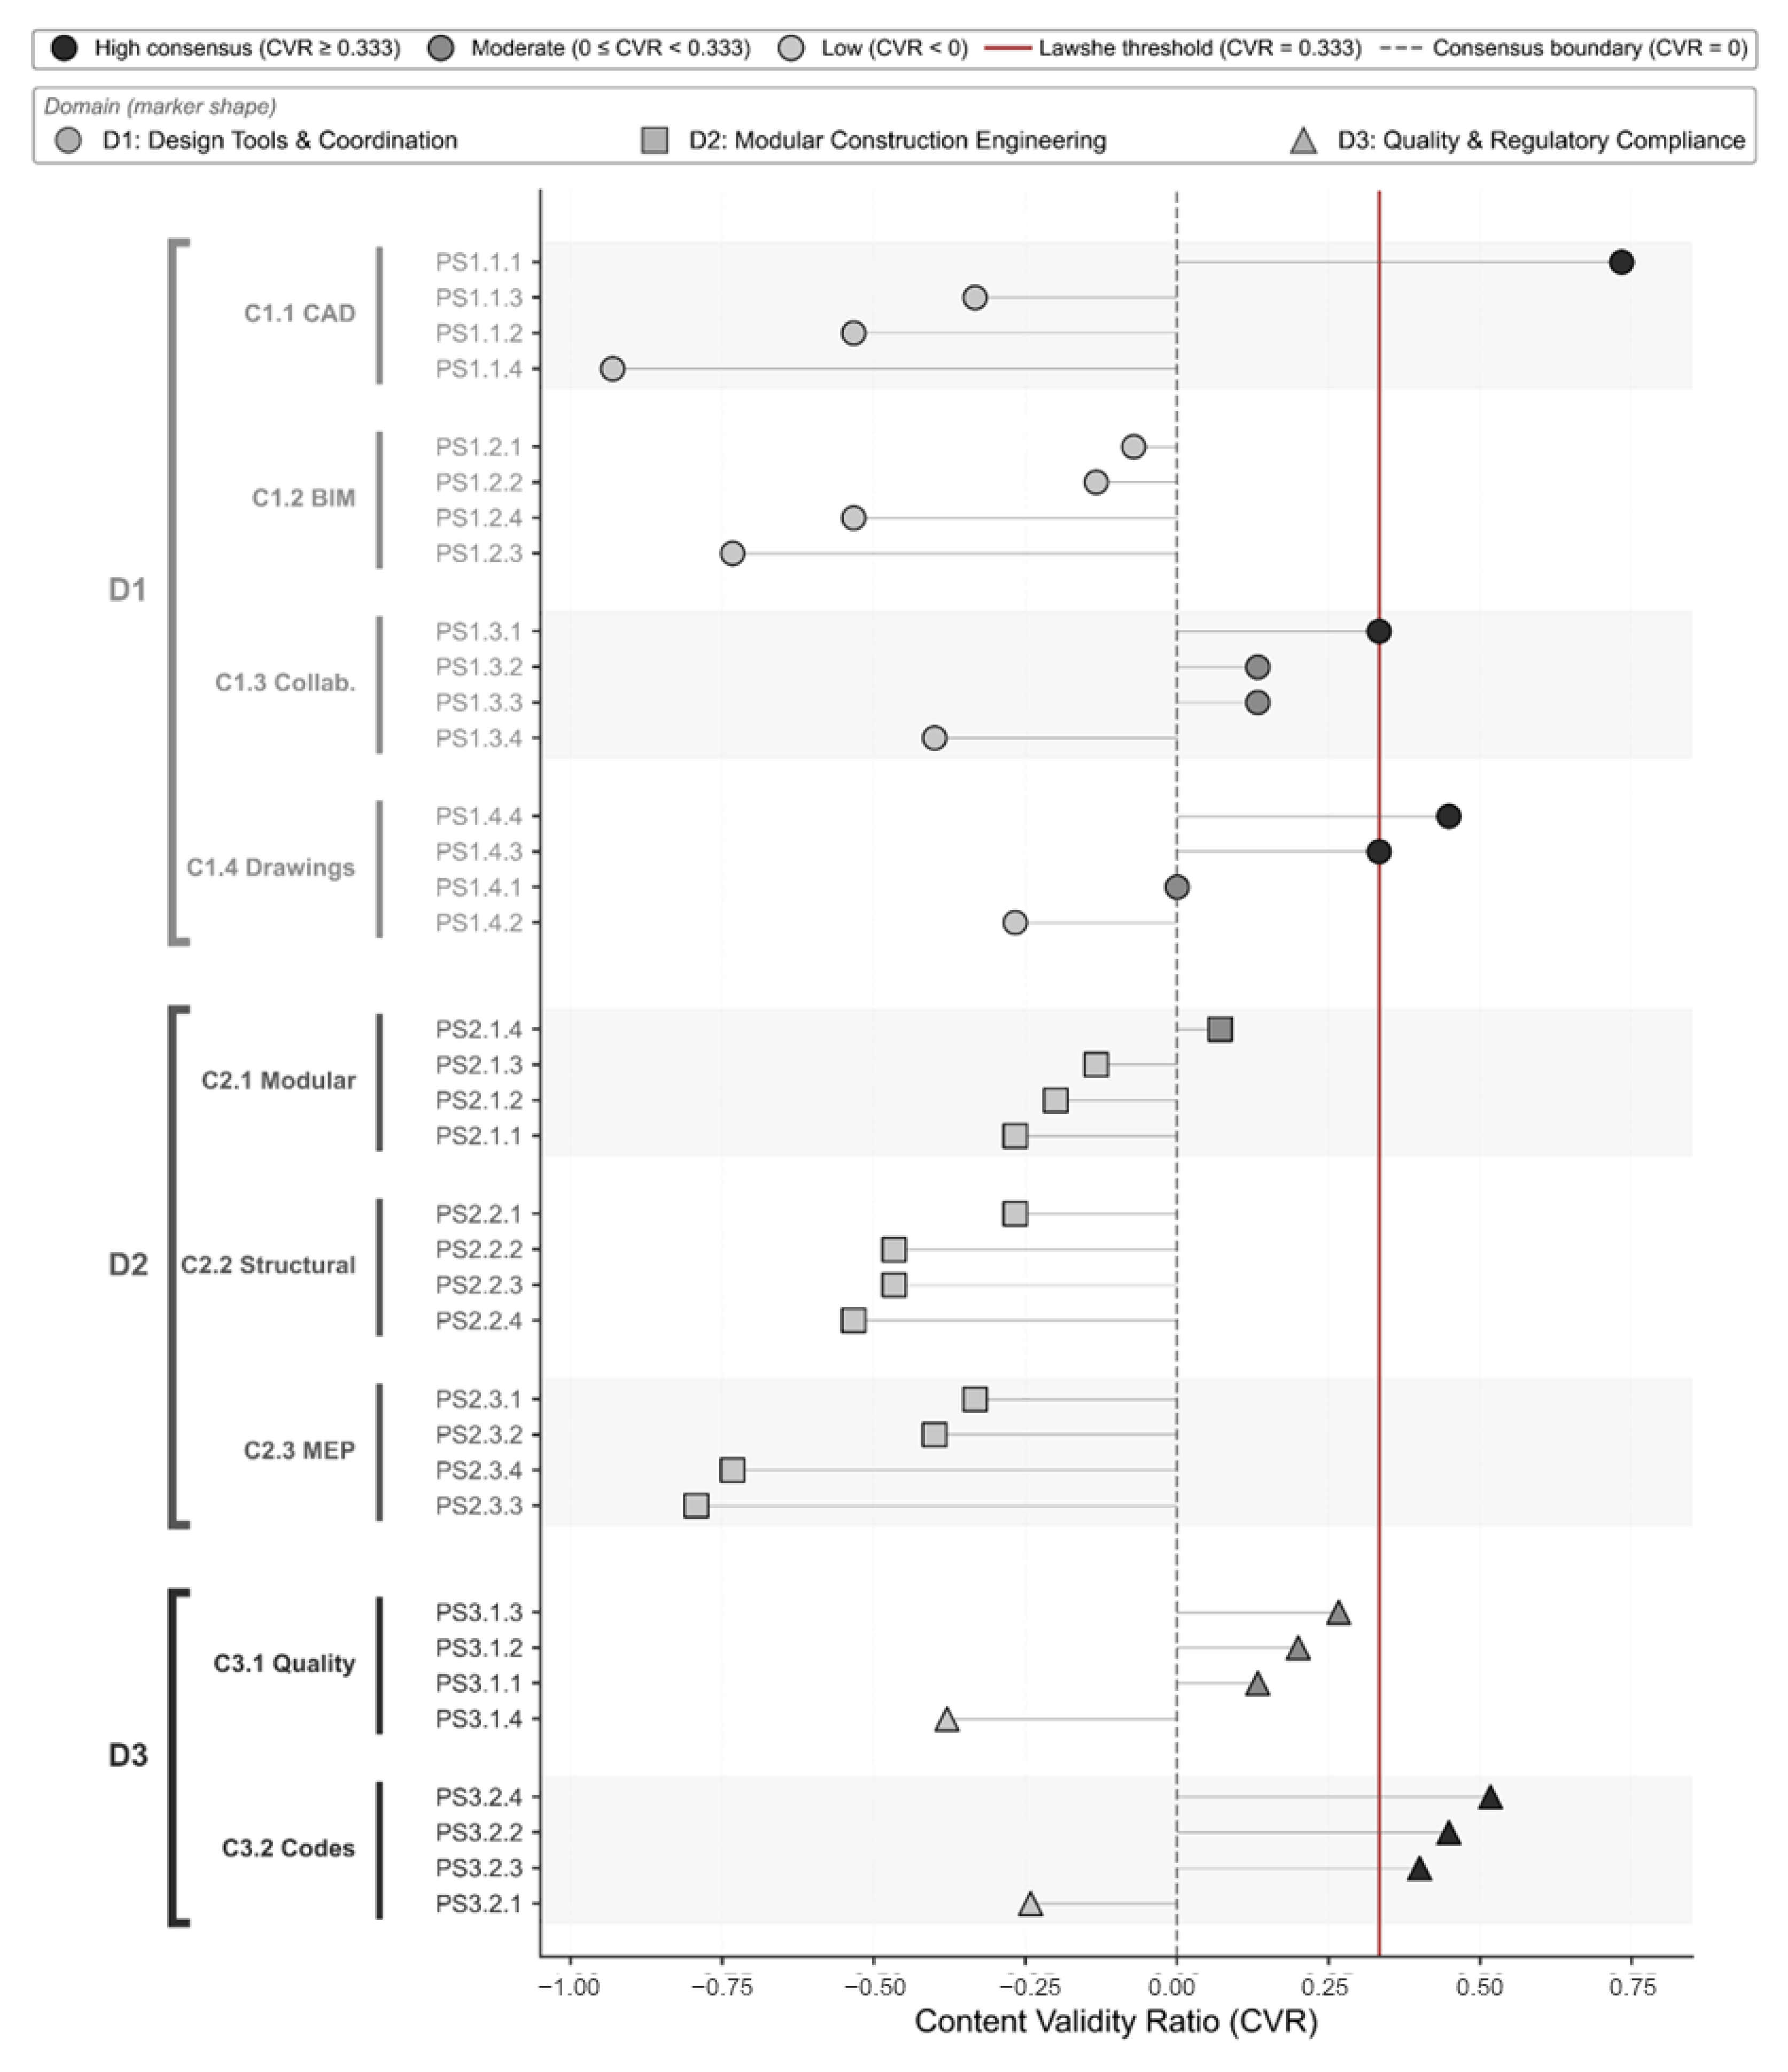
This section reports the CVR results for the 36 performance statements. Based on the standard Lawshe threshold (0.333 for N = 30 at α = 0.05; Ayre and Scally [60]), 7 of the 36 items (19.4%) exceeded the threshold. Applying the Consensus Strength tripartite classification (Section 3.3; Wilson et al. [59]) yielded 7 High (19.4%), 7 Moderate (19.4%), and 22 Low (61.1%) items (Figure 6). The individual CVR values and consensus strength classifications for all 36 PSs are provided in Table A2 (Appendix B). The low pass rate indicates that the 36 performance statements should be treated as a preliminary competency pool rather than as a fully established set of validated standards. Within this pool, the framework distinguishes the 7 high-consensus items that exceeded the Lawshe threshold from the remaining 29 candidate items, which require rewording, refinement, and further validation before they can be regarded as established competency standards. Low CVR values may reflect the formative state of modular construction in Korea, but they may also indicate that some statements were too broad, contained terminology that respondents interpreted differently, or did not fully correspond to the design tasks currently performed in Korean practice. In addition, because no separate cognitive interview or follow-up validation was conducted to confirm how respondents interpreted each statement, survey design limitations should also be considered. For this reason, the CVR results are used to identify the current level of consensus and to guide future refinement of performance statements, rather than to eliminate all low-consensus items from subsequent exploratory analyses.
Domain-level mean CVRs and category-level distributions are presented in Table 10. D3 had a mean CVR of +0.168, the only positive value among the three domains, with C3.2 Codes & Compliance showing the highest value at +0.281. D2 had a mean CVR of −0.388, with all three categories showing negative values: C2.1 Modular Construction (−0.165), C2.2 Structural (−0.433), and C2.3 MEP (−0.565). D1 had a mean CVR of −0.114, with C1.4 Drawings (+0.129) and C1.3 Collaboration (+0.050) showing positive values, while C1.1 CAD (−0.266) and C1.2 BIM (−0.368) showed negative values.

5.3. Bayesian BWM Analysis Results

Consistency ratio (CR) pass rates and Bayesian posterior-based weights by respondent group are presented in Table 11. At the domain level, the weights for D1, D2, and D3 were 0.412, 0.326, and 0.262, respectively. However, D1 showed low CR pass rates in both the Expert and Non-expert groups (0/9 and 2/21, respectively), and category-level weights were therefore computed only for D2 and D3, where acceptable consistency was achieved. Within D2, the weights for C2.1, C2.2, and C2.3 were 0.448, 0.372, and 0.180, respectively, and within D3, the weights for C3.2 and C3.1 were 0.577 and 0.423, respectively.
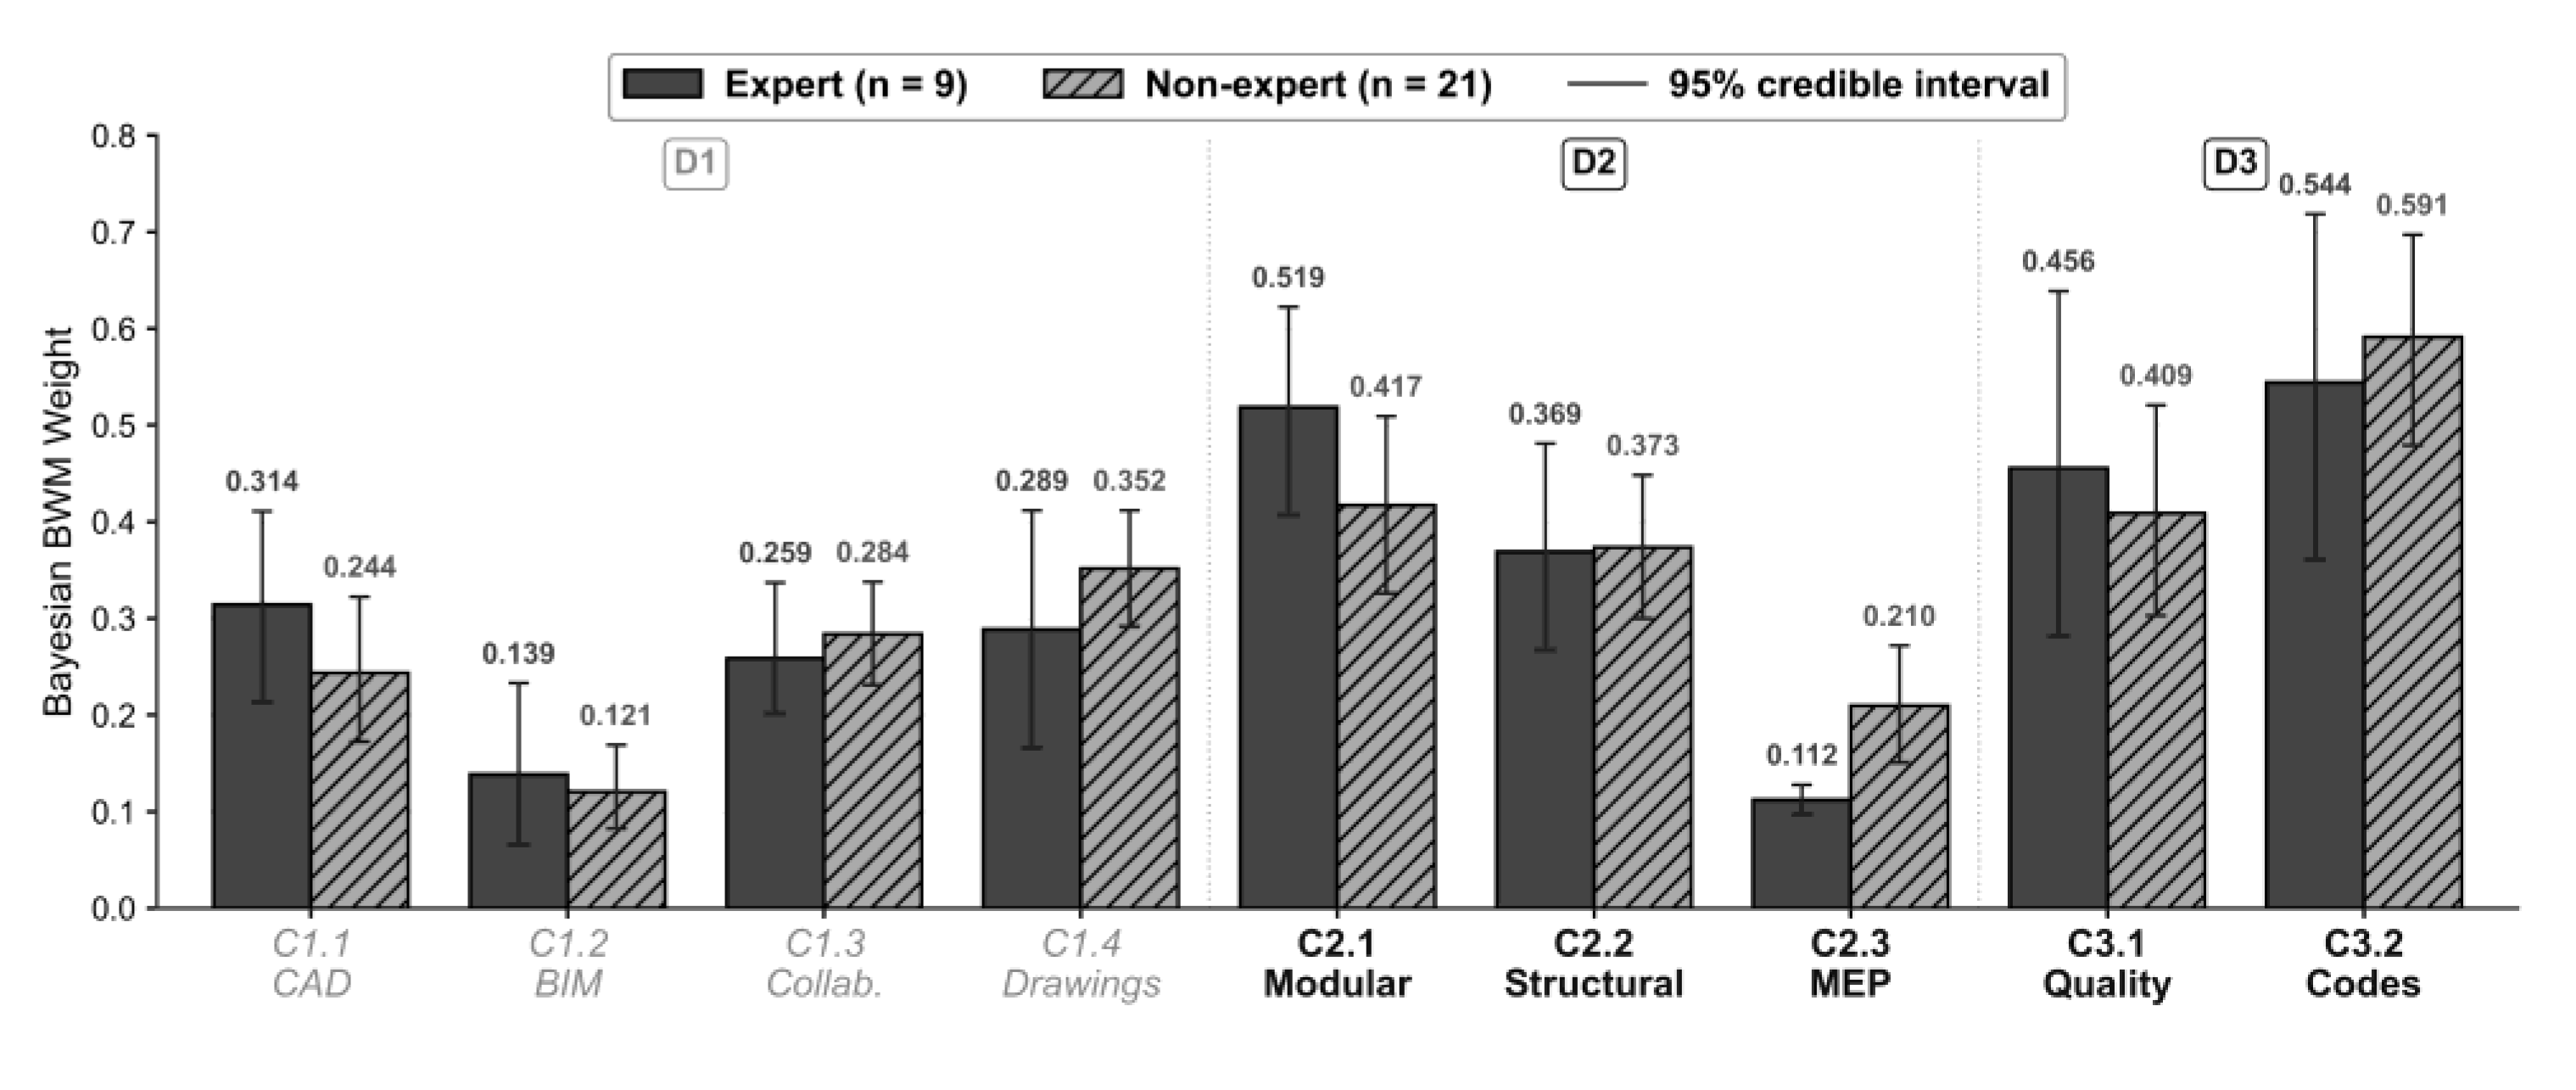
Between-group comparison showed that the weight of C2.1 differed by approximately 24% between groups, with 0.519 in the Expert group and 0.417 in the Non-expert group (Figure 7). Both groups ranked C2.1 as the top category within D2.

5.4. Fuzzy DEMATEL: Supplementary Causal Analysis

This section reports the Fuzzy DEMATEL results as a supplementary causal analysis complementing the Bayesian BWM.

5.4.1. Overall Causal Structure

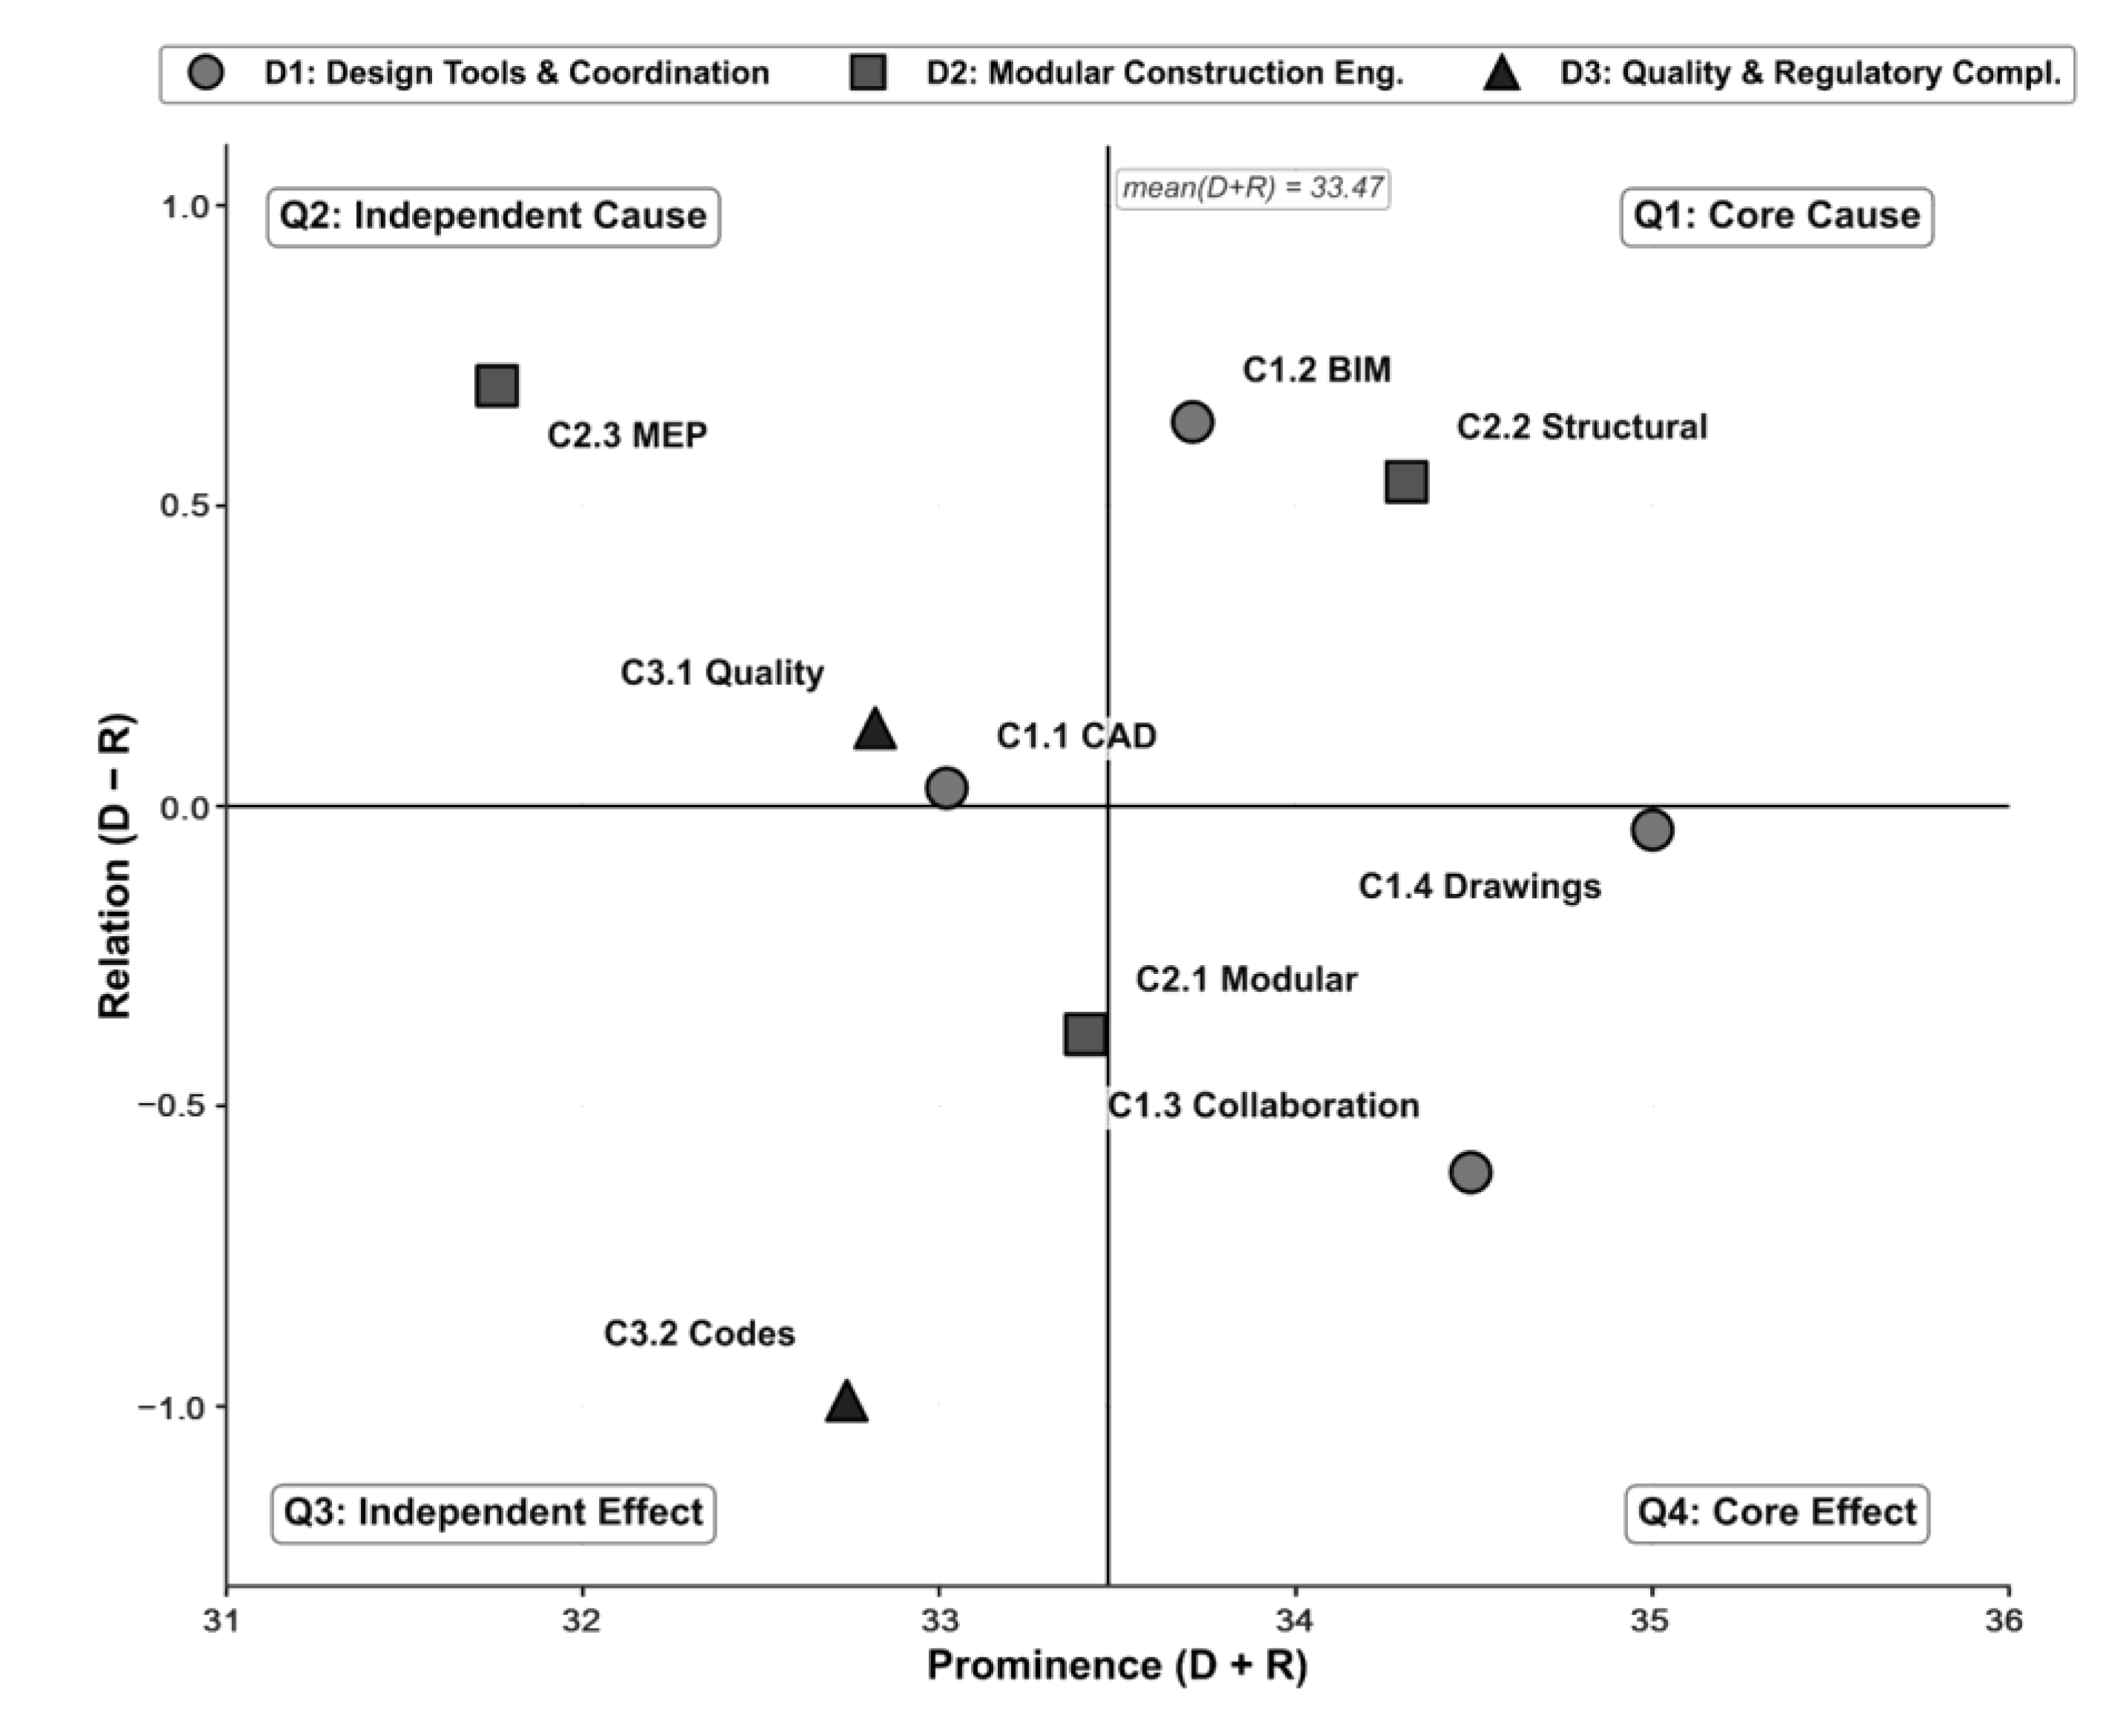
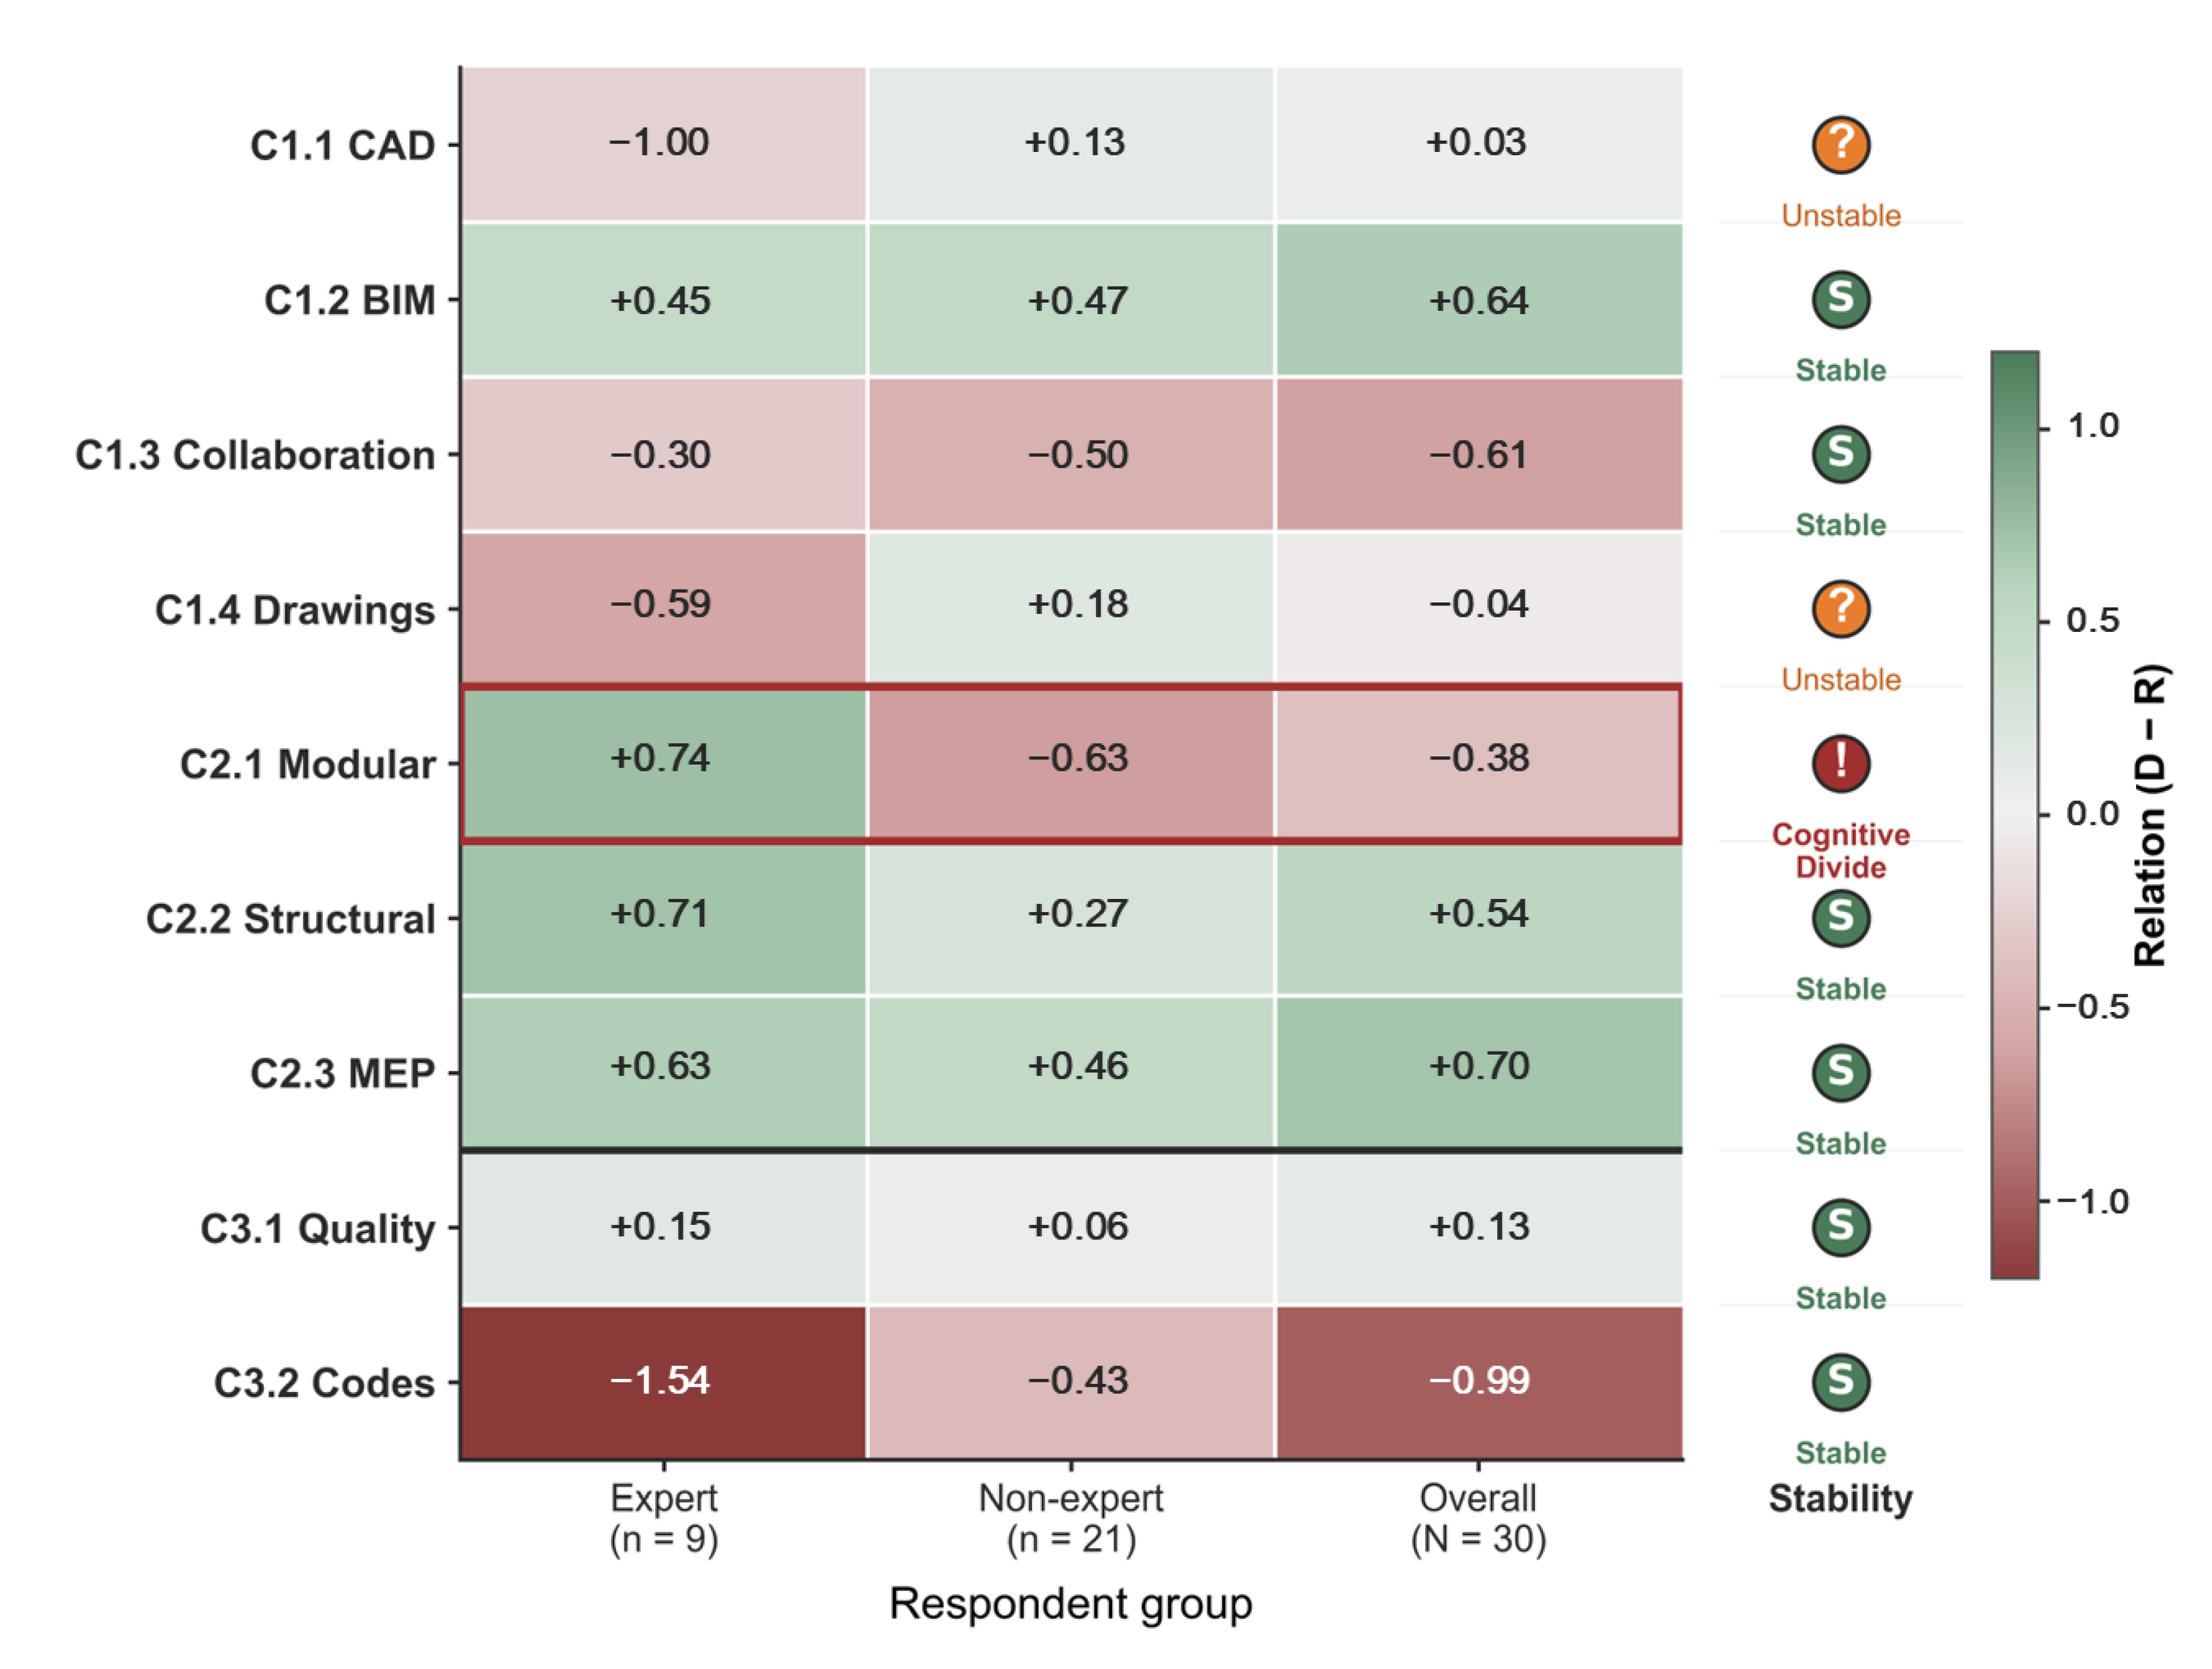
The prominence (D + R) and relation (D−R) values for the nine categories based on the full respondent set (N = 30) are presented in Table 12 and the INRM visualization—formed by the D + R mean line (33.47) and the D−R = 0 baseline—is presented in Figure 8. The cause group (D−R > 0) comprised five categories, in descending order: C2.3 MEP (+0.70), C1.2 BIM (+0.64), C2.2 Structural (+0.54), C3.1 Quality (+0.13), and C1.1 CAD (+0.03). The effect group (D−R < 0) comprised four categories: C1.4 Drawings (−0.04), C2.1 Modular (−0.38), C1.3 Collaboration (−0.61), and C3.2 Codes (−0.99). Among the nine categories, C3.2 was classified as the strongest effect factor (D−R = −0.99).

5.4.2. Comparison of Cognitive Structures Between Expert and Non-Expert Groups

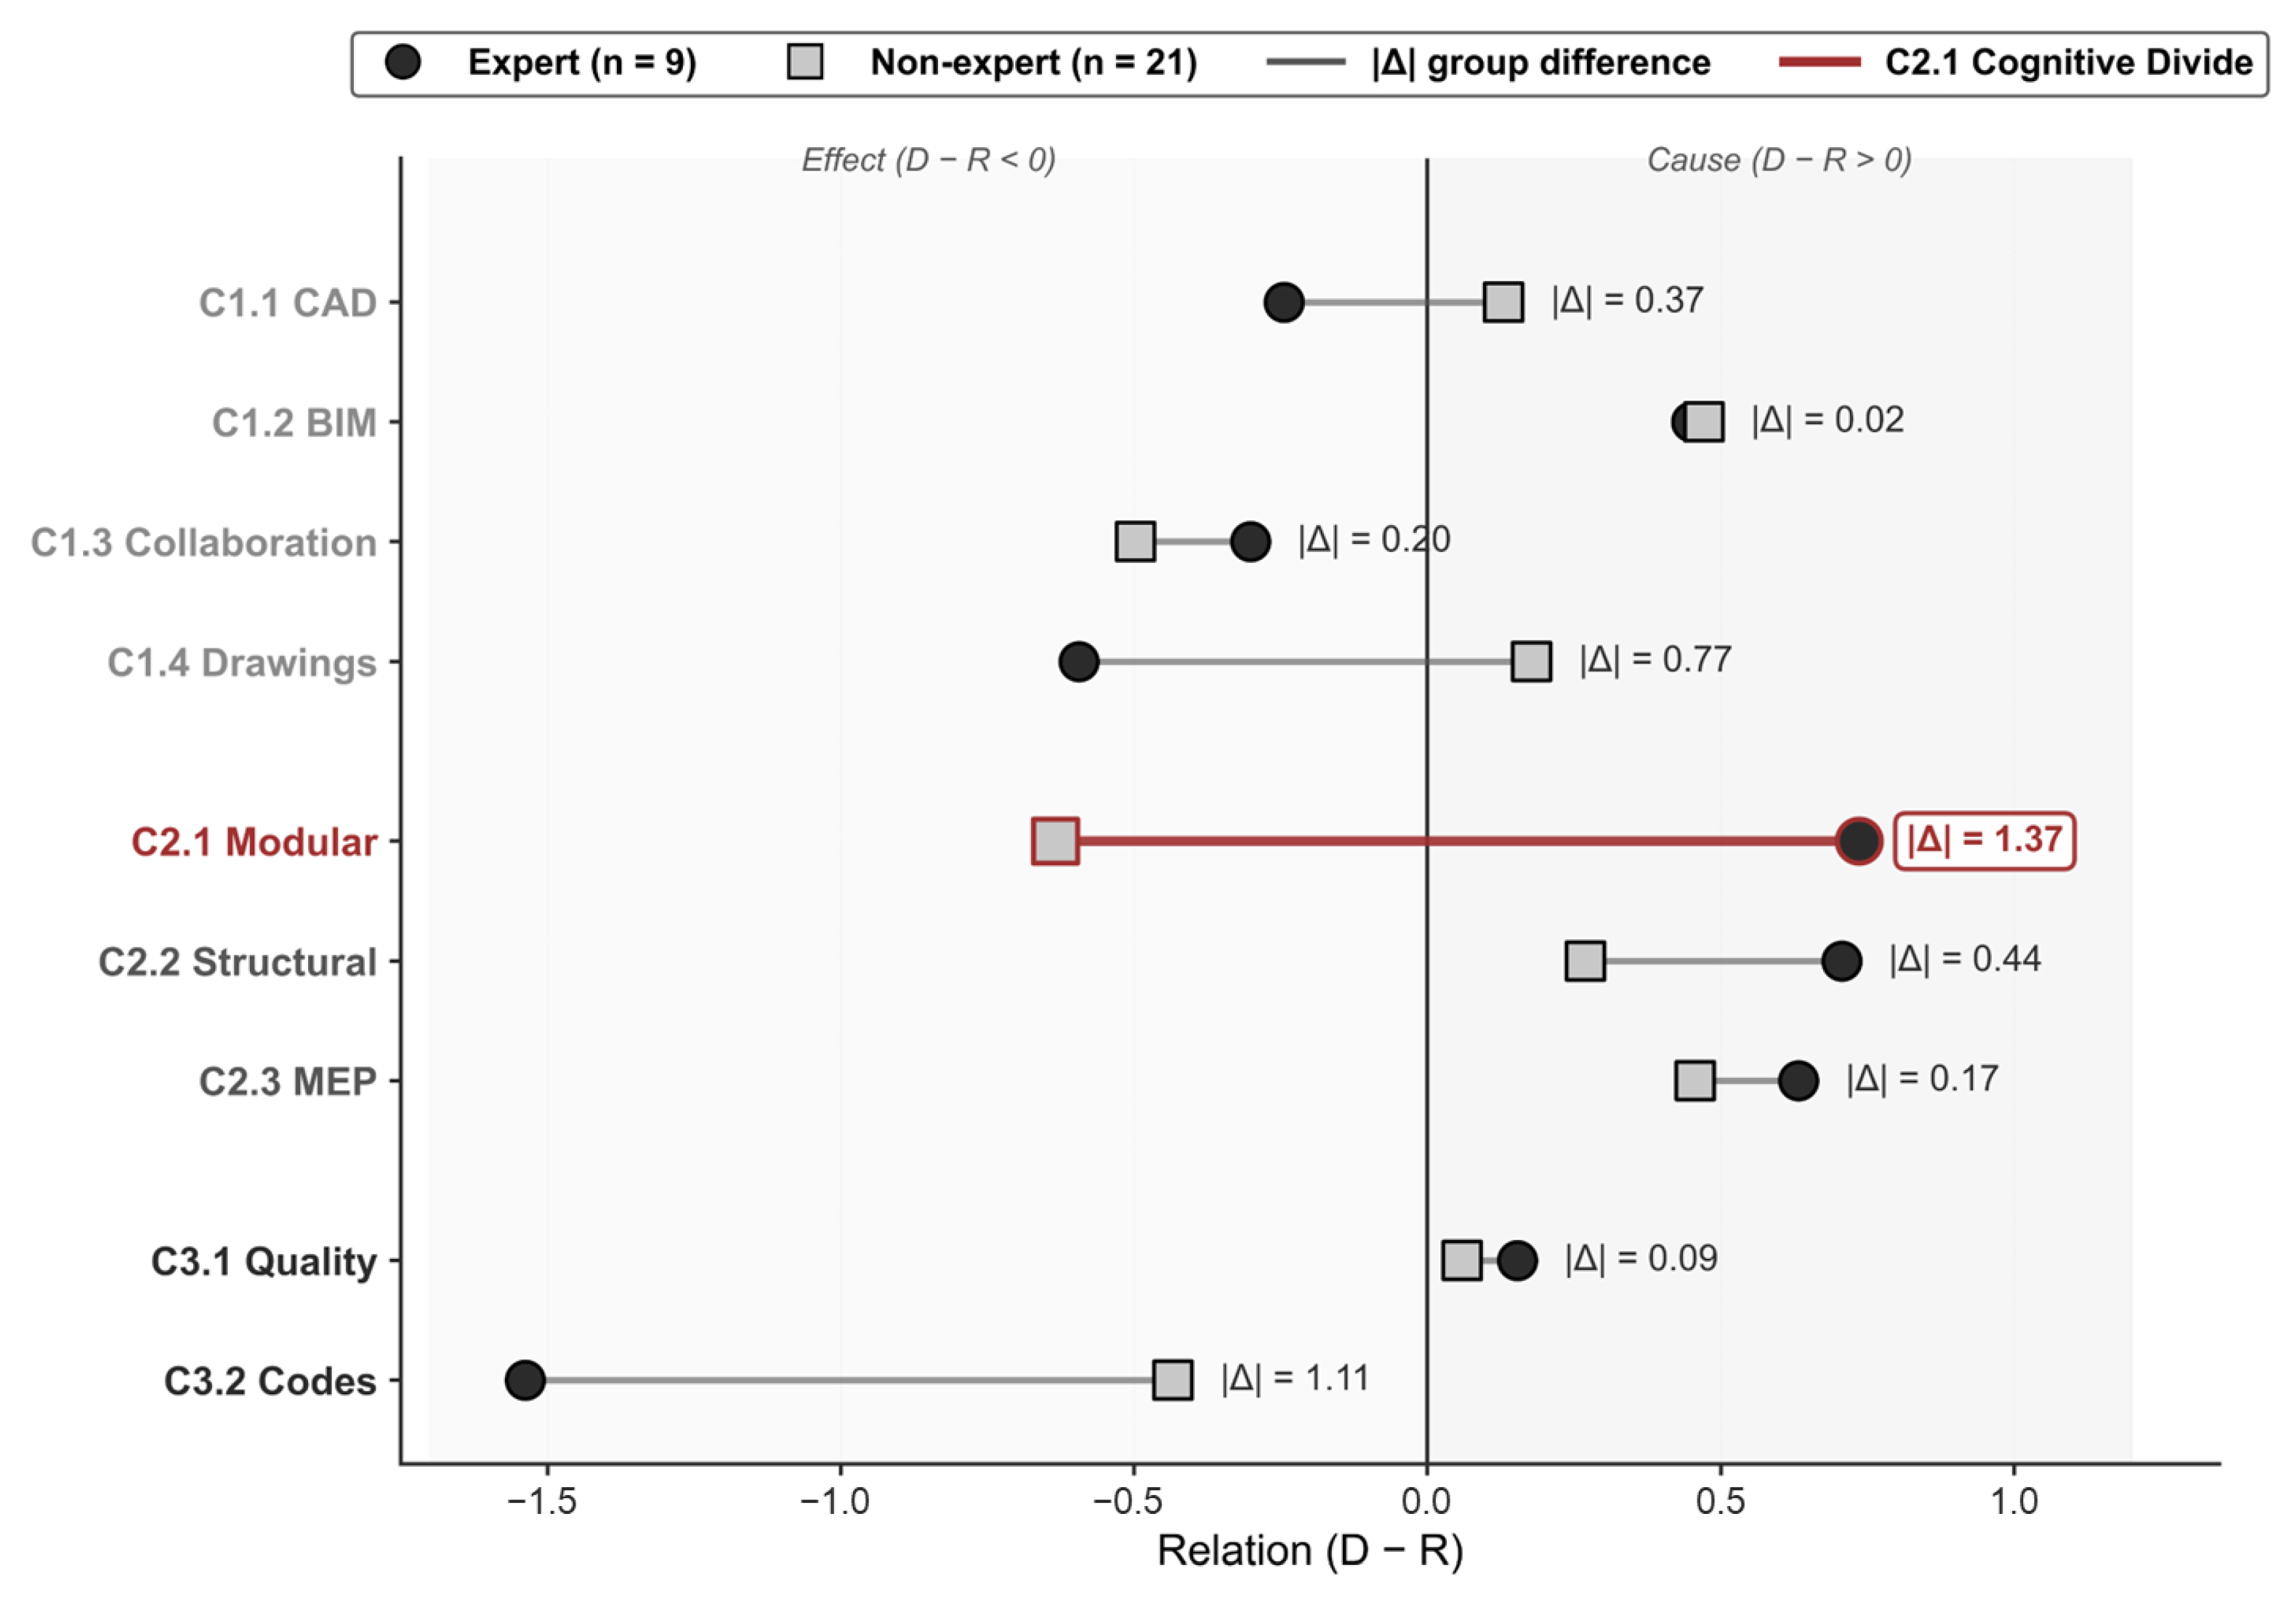
Relation (D−R) values and causal classifications for the Expert (n = 9) and Non-expert (n = 21) groups are presented in Table 13 and Figure 9. Six of the nine categories–C1.2 BIM, C1.3 Collaboration, C2.2 Structural, C2.3 MEP, C3.1 Quality, and C3.2 Codes–retained the same classification across both groups, while three categories–C1.1 CAD, C1.4 Drawings, and C2.1 Modular–showed divergent classifications. The largest divergence was observed at C2.1, with a D−R of + 0.736 (Cause) in the Expert group and −0.634 (Effect) in the Non-expert group, corresponding to a between-group difference of |Δ| = 1.37.
The stability of causal classifications across the three respondent sets (Expert, Non-expert, and Overall) is presented in Table 13 and Figure 10. Six categories retained the same classification across all three sets, while C1.1, C1.4, and C2.1 changed classification depending on the set. C2.1 showed the greatest instability, with its classification reversed between the Expert and Non-expert groups.

6. Discussion

This chapter presents the interpretation and integrated discussion of the CVR, Bayesian BWM, and Fuzzy DEMATEL results reported in Section 5. Section 6.1, Section 6.2 and Section 6.3 interpret the results of each method, Section 6.4 provides an integrated interpretation across the three analyses, Section 6.5 presents the Preliminary Competency Maturity Model (CMM), and Section 6.6 discusses the academic and practical implications.

6.1. Interpretation of CVR Results

Only 7 of the 36 performance statements (19.4%) exceeded the standard Lawshe threshold. This result should be interpreted cautiously. It suggests that a limited number of designer competencies have reached clear consensus among Korean respondents, but it does not necessarily mean that the remaining competencies are irrelevant. Four explanations are plausible and may coexist. First, Korea’s modular construction industry remains at a formative stage, so common expectations for modular designers are still developing. Second, several performance statements may have been too broad or may have combined multiple task elements, reducing respondent agreement. Third, some terminology derived from international job postings may not have been fully aligned with the terminology used in Korean design practice. Fourth, survey-design limitations may have affected the results because respondents’ interpretation of each performance statement was not verified through separate cognitive interviews or follow-up validation.
At the domain level, D3 was the only domain with a positive mean CVR (+0.168), while D1 (−0.114) and D2 (−0.388) showed negative means. This pattern indicates that perceptions have converged more clearly for regulatory compliance and quality-related competencies than for modular-specific engineering competencies. In particular, C3.2 Codes & Compliance recorded the strongest consensus (+0.281), suggesting that regulatory compliance is widely recognized as essential for modular designers. In contrast, the absence of consensus observed at C2.1 Modular Construction (−0.165, Low) should be interpreted as an unresolved competency area: respondents recognized its importance in later analyses, but did not yet share a stable understanding of the specific performance statements that define it.
The low-CVR items were retained in the framework for two reasons. First, they represent candidate competencies derived from international labor-market data and may become more salient as modular construction practice matures. Second, the subsequent Bayesian BWM and Fuzzy DEMATEL analyses operate at the category level and are intended to examine relative priority and causal position, not to certify every performance statement as a validated standard. Therefore, the framework should be read as a preliminary and refinable competency structure.

6.2. Interpretation of Bayesian BWM Weights

The Bayesian BWM analysis showed that D3 had the highest CR pass rate in both groups, a pattern consistent with the CVR results in Section 6.1, and suggesting that regulatory compliance competency operates as a stable judgment criterion regardless of experience level. Within D2, C2.1 received the highest weight at 0.448, indicating that integrated modular-specific design competency is prioritized over traditional building engineering competencies (C2.2 Structural: 0.372; C2.3 MEP: 0.180). Within D3, C3.2 was weighted approximately 1.4 times higher than C3.1 (0.577 vs. 0.423), revealing a perception structure in which codes and compliance take precedence over quality standards even within the regulatory domain.
In the between-group comparison, the Expert group weighted C2.1 approximately 24% higher than the Non-expert group (0.519 vs. 0.417). Although both groups ranked C2.1 as the top category within D2, the strength of this relative primacy differed according to modular experience. This weight gap suggests a possible structural difference in how the two groups perceive modular construction competency, which is jointly interpreted in Section 6.4 together with the cognitive structure differences observed in the DEMATEL analysis (Section 6.3).

6.3. Interpretation of Fuzzy DEMATEL Results

The cause–effect structure described in Section 5.4.1 is interpreted by INRM quadrant. C1.2 BIM and C2.2 Structural lie in Q1 Core Cause, with both high D + R and high D−R, indicating that they broadly drive the performance of other competencies as core driver competencies. C2.3 MEP, C3.1 Quality, and C1.1 CAD lie in Q2 Independent Cause, with below-average D + R, indicating that they exert limited system-wide interaction but independently influence other competencies as foundational competencies. C1.3 Collaboration and C1.4 Drawings lie in Q4 Core Effect, with above-average D + R, indicating that they converge the influences of other competencies as outcome-indicator competencies. Notably, C3.2 Codes are classified as the strongest effect factor in Q3 Independent Effect (D−R = −0.99), suggesting that codes and compliance, despite limited system-wide interaction, operate as an outcome in which all design activities ultimately converge.
In the Expert-Non-expert comparison, the classification reversal at C2.1 (Expert +0.736 Cause vs. Non-expert −0.634 Effect, |Delta| = 1.37) suggests a possible difference in how respondents with and without direct modular project involvement perceive the systemic position of modular construction competency. This study treats this pattern only as an indicative, experience-related perceptual divergence that requires future validation, not as a confirmed expert–novice cognitive divide, because the Expert group is small, unevenly sized relative to the Non-expert group, and operationally defined by project involvement rather than by long tenure. Experts tended to perceive C2.1 as a driver that shapes other design competencies, whereas Non-experts tended to perceive it as an outcome of existing building-design competencies. This possible cognitive difference is consistent with the BWM weight gap at C2.1 (Expert 0.519 vs. Non-expert 0.417) observed in Section 6.2.
Classification stability across the three respondent sets yielded six Stable categories and three Unstable categories (C1.1, C1.4, and C2.1), with the classification reversal at C2.1 identified as the largest instability. Given the limited sample size, this result should be interpreted as exploratory evidence of experience-related perceptual divergence rather than definitive proof of a generalizable expert-novice distinction.

6.4. Integrated Interpretation

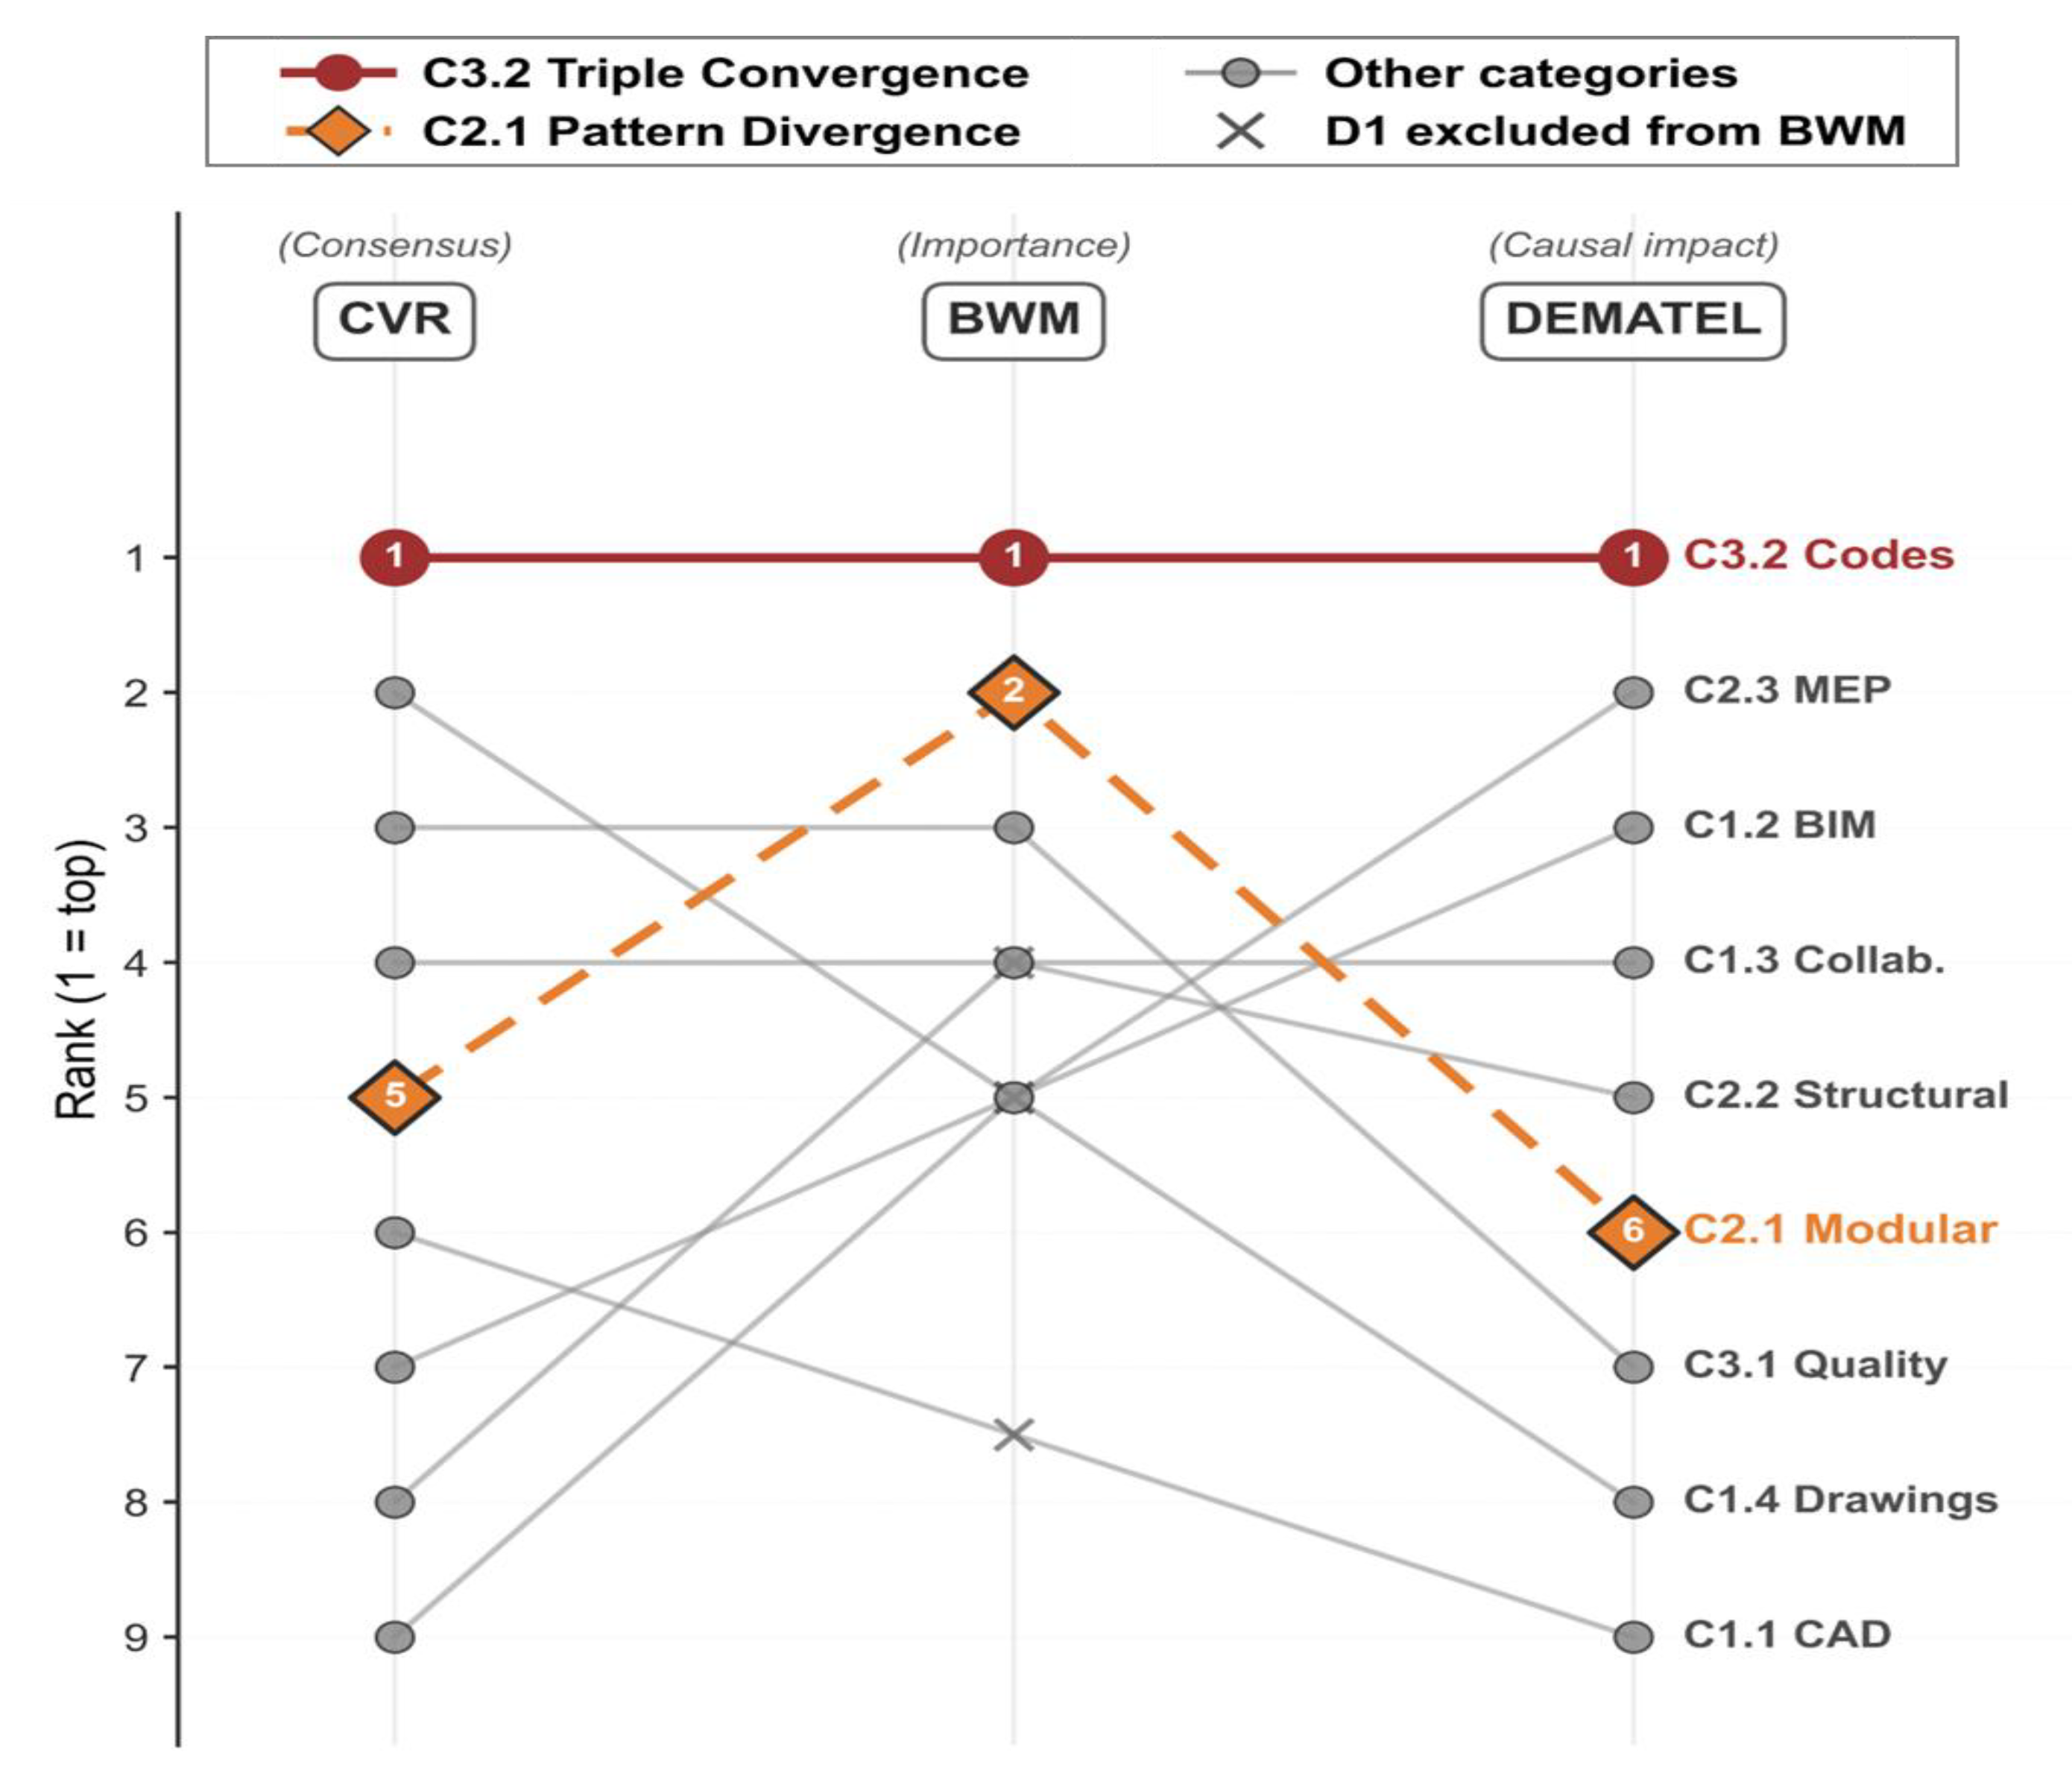
The results of the CVR (Section 5.2), Bayesian BWM (Section 5.3), and Fuzzy DEMATEL (Section 5.4) analyses are integrated into two core patterns (Figure 11). Figure 11 visualizes the cross-method convergence and divergence across all nine categories in an integrated matrix.
First, codes and compliance (C3.2) exhibited a triple convergence pattern, showing consistently strong results across all three analyses. C3.2 converged as the strongest consensus in the CVR analysis (+0.281), the highest weight within D3 in the BWM analysis (0.577), and the strongest effect factor in the DEMATEL analysis (D−R = −0.99). The convergence of respondent consensus, relative importance, and causal position on the same category indicates that C3.2 represents the most stable core competency area within the framework. Notably, its classification as the strongest effect factor in the Q3 Independent Effect quadrant suggests that regulatory competency functions less as an independent learning target and more as a maturity indicator manifested through mastery of other design competencies.
Second, modular construction (C2.1) exhibited pattern divergence instead of convergence across the three analyses. C2.1 showed no consensus in CVR (−0.165, Low), the highest weight within D2 in BWM (0.448), and a cognitive divide of |Δ| = 1.37 between Expert and Non-expert respondents in DEMATEL. This pattern–absence of consensus, high importance, and cognitive structure systematically differentiated by respondent experience level–indicates that C2.1 is a formative competency whose importance is acknowledged but whose essence has not yet been commonly understood.
The two patterns provide complementary evidence. The triple convergence at C3.2 supports the internal robustness of the framework and the methodological triangulation effect, while the pattern divergence at C2.1 shows that the three-dimensional evaluation of the same competency can diverge in accordance with the formative characteristics of the industry. These results provide the basis for the Preliminary CMM proposed in Section 6.5.

6.5. Conceptual Proposal for a Preliminary Competency Maturity Model (CMM)

Building on the interpretations in Section 6.1, Section 6.2, Section 6.3 and Section 6.4, this study proposes a conceptual preliminary Competency Maturity Model (CMM) for modular construction designers. The model adopts the five-stage structure of SEI CMMI (Paulk et al., 1993) [66], but the mapping is exploratory and rests on the combined interpretation of CVR consensus strength, Bayesian BWM weights, and Fuzzy DEMATEL INRM quadrant positions. Therefore, the CMM should be understood as a conceptual proposal and illustrative prototype constructed from nine competency categories and 30 Korean respondents, not as a validated model ready for direct certification or organizational assessment.
The stage assignment follows an interpretive maturity logic rather than a statistical cutoff. Categories associated with general design tools and coordination functions are placed at earlier stages because they represent enabling capabilities needed before modular-specific integration can be performed. Modular construction (C2.1) is placed at the intermediate Level 3 transition point because it combines high BWM priority within D2 with the largest Expert-Non-expert DEMATEL reversal, indicating that direct project involvement may change whether respondents perceive modular competency as an outcome or as a driver. Quality and regulatory categories are placed at more advanced stages because they depend on the cumulative integration of design, fabrication, and compliance knowledge. Codes and Compliance (C3.2) is placed at the highest stage because it shows the strongest cross-method convergence, but this placement should be read as a hypothesis for future validation rather than a confirmed developmental sequence.
The mapping logic rests on a complementary integration in which Bayesian BWM discriminates the relative priority of each stage, the Fuzzy DEMATEL INRM quadrant discriminates the causal ordering between stages, and CVR consensus strength discriminates the degree of consensus formed through the industry’s developmental process. The Mapped Categories and Primary Evidence columns of Table 14 present the specific application results of this mapping logic.
The two core patterns derived in Section 6.4 provide the basis for placement at the intermediate and highest stages. Modular construction (C2.1) is placed at Level 3 (Defined), reflecting its highest weight within D2 in the BWM analysis (0.448) and its status as the category with the greatest Expert–Non-expert cognitive divide (Expert + 0.736 vs. Non-expert −0.634, |Δ| = 1.37). This stage is interpreted as the critical inflection point at which the cognitive transition from Non-expert to Expert occurs, corresponding to the boundary at which the understanding of the essence of modular construction competency shifts from outcome to driver. Codes and compliance (C3.2) is placed at Level 5 (Optimized), reflecting its triple convergence pattern across all three analyses and its classification as the strongest effect factor in the DEMATEL Q3 Independent Effect quadrant. Regulatory competency operates as a final maturity indicator that emerges naturally through mastery of other design competencies rather than as an independent learning target, and is placed at the highest stage reached after a designer cumulatively acquires the competencies of lower stages. However, as the model constitutes an illustrative prototype constructed from the responses of 30 Korean respondents, the precise competency thresholds at each stage, the associated assessment instruments, and the transition conditions between stages should be refined through an expanded sample and multi-national validation.
For practical operationalization, the model would require measurable behavioral indicators, assessment rubrics, and threshold scores for each stage. Organizations could use the current version as a diagnostic starting point for sequencing training: foundational CAD, BIM, structural, and MEP capabilities can be addressed in early stages; modular-specific integration and quality coordination can be emphasized in intermediate stages; and code-compliance judgment can be developed through review-based mentoring and project-based assessment. Educational institutions could use the model to organize curricula from general design tools toward modular-specific coordination and regulatory integration. However, these applications require further validation through industry case studies, longitudinal training data, and multi-national expert panels.

6.6. Academic and Practical Implications

This study makes three academic contributions within an explicitly preliminary scope. First, it establishes an integrated analytical workflow that combines Semantic Topic Mining (BERTopic), Hierarchical Structuring (Ward), Uncertainty-Aware Weighting (Bayesian BWM), and Causal Mapping (Fuzzy DEMATEL), with CVR providing consensus validation. Second, it develops a designer-specific competency framework from international job-posting data and examines it through a Korean validation panel, thereby making the global-local scope of the framework explicit. Third, it introduces an indicative, experience-related perceptual divergence as an exploratory analytical dimension, suggesting that direct modular project involvement may shape how practitioners understand the priority and causal role of modular-specific competencies; this pattern requires confirmation through larger and better-balanced expert and non-expert samples.
The practical implications should also be interpreted cautiously. The derived framework of 3 domains, 9 categories, and 36 performance statements can serve as a candidate tool for recruitment evaluation, curriculum design, and workforce development policy, but it should not yet be treated as a finalized competency standard. Because the empirical design combines an international job-posting corpus with a Korean validation panel, the framework should be interpreted as globally derived but locally validated. The job postings from six countries capture cross-national labor-market language for modular design roles, whereas the Korean survey reflects perceptions in a domestic market where modular delivery is still emerging and direct project experience remains limited. This difference may affect the salience of competencies: regulatory and quality competencies may be interpreted through country-specific code systems, while modular integration and DfMA-related competencies may depend on local procurement routes, manufacturing capacity, professional role boundaries, and the maturity of off-site supply chains. Therefore, the Korean validation results indicate how international competency signals are currently understood in Korea, not universal agreement across all countries in the corpus. Based on the indicative cognitive divide identified in this study, industry associations and educational institutions may design experience-centered training programs incorporating mentoring and on-the-job training (OJT), particularly around the Level 3 transition stage. The conceptual CMM can serve as a starting point for future designer certification systems and curriculum standardization, provided that it is further validated with larger and more diverse samples.

7. Conclusions

In recent years, the diffusion of modular construction has rapidly reshaped the competencies required of building-oriented modular designers. However, existing competency models rely on single-method approaches based on expert interviews or the Delphi method, and have limited ability to quantitatively identify the causal relationships among competencies or the perceptual differences arising from industry experience.
To address these limitations, this research derived a data-driven competency framework consisting of 3 domains, 9 categories, and 36 performance statements by applying BERTopic and Ward hierarchical clustering to 243 job postings collected from seven platforms across six countries. This candidate competency structure was then examined through an exploratory survey of 30 Korean respondents (9 experts and 21 non-experts), using Bayesian BWM as the primary method and CVR and Fuzzy DEMATEL as supplementary analyses.
The results suggest two preliminary patterns. First, C3.2 Codes & Compliance showed the clearest convergence across CVR, Bayesian BWM, and Fuzzy DEMATEL (+0.281, 0.577, and −0.99, respectively), indicating that it is the most clearly recognized high-consensus competency area within the Korean validation sample. Second, the three analyses did not align for C2.1 Modular Construction, where a difference of 1.37 in the net causal effect (D−R) was observed between the expert and non-expert groups. However, because the Expert group was small and operationally defined by direct modular project involvement, this pattern should be interpreted only as indicative evidence of experience-related perceptual divergence, not as confirmation of a generalizable expert–novice cognitive divide.
This research contributes to the study of modular construction workforce competency in two respects. Academically, this research presents an analytical workflow that integrates Semantic Topic Mining, Hierarchical Structuring, Uncertainty-Aware Weighting, and Causal Mapping, and introduces an indicative, experience-related perceptual divergence as an exploratory analytical dimension that requires future validation. Practically, the derived framework can serve as a basis for recruitment evaluation, curriculum design, and workforce development policy, and the Preliminary CMM proposed as an illustrative prototype can be used as a starting point for designer certification systems and curriculum standardization.
However, this research has several limitations. First, the final sample of N = 30 is suitable for exploratory multi-method analysis but is insufficient for statistical generalization, especially for subgroup comparison between 9 Experts and 21 Non-experts. The panel should not be interpreted as representative of the full modular construction workforce because all respondents were from Korea and the sample was concentrated in design-oriented backgrounds: 29 of the 30 respondents were affiliated with design firms and 28 majored in architectural design. Second, all respondents were from Korea, whereas the job-posting corpus was collected from six countries. Therefore, the results reflect a globally derived but locally interpreted framework, and Korean perceptions should not be generalized directly to all countries represented in the corpus. Country-specific differences in building codes, approval processes, procurement systems, modular market maturity, professional role boundaries, and terminology may shape how designers understand each competency. Third, the Expert group was operationally defined by direct modular project involvement, and only one of the nine Experts had more than 10 years of modular construction experience. This reflects the limited maturity of the Korean modular industry but also constrains the reliability of expert-based comparison. F Fourth, only 7 of the 36 performance statements exceeded the Lawshe threshold; these can currently be regarded as high-consensus items, whereas the remaining 29 should be interpreted as candidate competencies requiring rewording, refinement, and validation with larger and more diverse panels. Because no separate cognitive interview or follow-up validation was conducted to confirm how respondents interpreted each statement, survey design limitations should also be considered. Fifth, the BERTopic noise ratio slightly exceeded the predefined threshold and the Ward silhouette coefficients were low, so the topic and domain structures should be interpreted as semantically guided rather than purely statistically determined. Sixth, the proposed CMM remains a conceptual prototype; quantitative thresholds, assessment instruments, transition conditions, and alternative mappings should be tested through expanded samples, cross-national panels, and organizational case studies. Nevertheless, this research is expected to provide a meaningful basis for workforce 690 development policy in the formative-stage modular construction industry and for building the human infrastructure required for the transition to sustainable construction.

Author Contributions

Conceptualization, W.K., S.M., N.K. and Y.A.; methodology, W.K. and S.M.; software, W.K. and S.M.; validation, H.K., N.K. and Y.A.; formal analysis, W.K. and S.M.; investigation, W.K. and H.K.; resources, N.K. and Y.A.; data curation, W.K. and S.M.; writing—original draft preparation, W.K. and S.M.; writing—review and editing, S.M., N.K. and Y.A.; visualization, W.K. and S.M.; supervision, N.K. and Y.A.; project administration, S.M. and N.K.; funding acquisition, N.K. and Y.A. All authors have read and agreed to the published version of the manuscript.

Funding

This work is supported by the Korea Agency for Infrastructure Technology Advancement (KAIA) grant funded by the Ministry of Land, Infrastructure and Transport (Grant No. 2610000525).

Institutional Review Board Statement

Not applicable.

Informed Consent Statement

Not applicable.

Data Availability Statement

The data presented in this study are available on request from the corresponding author due to confidentiality agreements with the project contractor.

Conflicts of Interest

The authors declare no conflicts of interest.

Appendix A

Table A1 provides representative examples of included and excluded job postings at each stage of the corpus construction pipeline described in Section 4.1.
Table A1. Representative postings removed at each stage of the filtering pipeline. Posting titles are paraphrased to preserve source-platform anonymity.
CaseJob Title (Paraphrased)CountryRemoved atReason
1“Workshop Technician–Entry Level”AUStep 0No designer-relevant keyword in title
2“Carpenter Helper”CAStep 0Trade role, no design responsibility
3“Senior Mechanical Design Engineer (Defence)”UKStep 1JD contains defence–out-of-scope industry
4“Senior Content Designer (ecommerce/fashion)”UKStep 1Title matches creative design industry
5“Residential Building Designer”AUStep 2No modular-construction keyword
6“Design Manager–Modular Healthcare Buildings”UKStep 2JD below 100-word substantive-content threshold
7“Senior Designer” (near-duplicate, cosine 0.92)USStep 4SBERT cosine ≥ 0.85 against existing record
8“Data Center Architect”USStep 5Title contains data center; JD data-center count exceeds modular count

Appendix B

Table A2 lists the 36 performance statements derived in Section 4.4, with their individual CVR values and Consensus Strength classifications based on responses from 30 Korean modular construction professionals (Expert n = 9; Non-expert n = 21).
Table A2. Complete list of 36 performance statements with CVR values and consensus strength classifications.
DomainCategoryPS IDPerformance StatementCVRConsensus
D1 Design Tools & CoordinationC1.1 CAD & 3D ModelingPS1.1.1Is able to create accurate 3D models, detailed drawings, and technical documents using CAD software such as AutoCAD and SolidWorks+0.733HIGH
PS1.1.2Is able to design and develop mechanical equipment and system layouts in accordance with project briefs−0.533LOW
PS1.1.3Is able to perform design work using CAD-based computer-aided drafting and design tools and software−0.333LOW
PS1.1.4Is able to utilize diverse CAD software including parametric design tools such as Rhino 3D and Grasshopper−0.931LOW
C1.2 BIM CoordinationPS1.2.1Is able to create, manage, and coordinate multidisciplinary design models using BIM software−0.071LOW
PS1.2.2Is able to manage BIM processes to ensure model accuracy and consistency and to facilitate interdisciplinary collaboration−0.133LOW
PS1.2.3Is able to chair regular coordination meetings using 3D models and communicate design change and cost implications−0.733LOW
PS1.2.4Is able to develop and maintain project-specific custom BIM libraries (e.g., Revit families) tailored to design requirements−0.533LOW
C1.3 Collaboration & CoordinationPS1.3.1Is able to collaborate with engineering, production, and project teams to ensure design feasibility and accuracy+0.333HIGH
PS1.3.2Is able to coordinate with engineering, production, and sales teams to resolve design or construction-related issues+0.133MODERATE
PS1.3.3Is able to collaborate with other designers and departments to ensure clarity and completeness of specifications+0.133MODERATE
PS1.3.4Is able to exchange feedback with internal fabrication teams to improve connection details and develop custom components−0.400LOW
C1.4 Drawings & SpecificationsPS1.4.1Is able to prepare fabrication drawings including dimensions, notes, bills of materials, and construction details0.000MODERATE
PS1.4.2Is able to prepare detailed drawings of components and assemblies based on layout and design drawings−0.267LOW
PS1.4.3Is able to produce comprehensive construction drawings that conform to in-house standards and client specifications+0.333HIGH
PS1.4.4Is able to coordinate with design and production managers to reflect drawing requirements and update drawings as needed+0.448HIGH
D2 Modular Construction EngineeringC2.1 Modular ConstructionPS2.1.1Is able to perform design work in prefabrication or modular construction environments−0.333LOW
PS2.1.2Is able to execute design, coordination, and fabrication of custom modular residential projects from concept through manufacturing−0.267LOW
PS2.1.3Is able to address diverse development types including single-family, multi-family, and modular/prefabricated projects−0.133LOW
PS2.1.4Is able to develop detailed designs of modular building units with accuracy and efficiency+0.071MODERATE
C2.2 Structural EngineeringPS2.2.1Is able to perform structural analysis and design of buildings, supporting structures, and equipment foundations−0.267LOW
PS2.2.2Is able to design building envelopes that meet structural, thermal, and aesthetic performance requirements−0.467LOW
PS2.2.3Is able to coordinate, develop, and optimize structural fabrication information for delivery to factory and field teams−0.467LOW
PS2.2.4Is able to apply best practices in structural engineering to enhance the safety and reliability of facilities−0.533LOW
C2.3 MEP SystemsPS2.3.1Is able to design MEP systems in compliance with regulatory codes, standards, and project requirements−0.333LOW
PS2.3.2Is able to support MEP projects in modular environments from concept through fabrication, including drawings and code compliance−0.400LOW
PS2.3.3Is able to specify, design, and integrate modular electrical solutions such as E-Houses, substations, and MV/LV skids−0.793LOW
PS2.3.4Is able to coordinate electrical prefabrication with construction workflows and support layout deliverables and commissioning documentation−0.733LOW
D3 Quality & Regulatory ComplianceC3.1 Quality & StandardsPS3.1.1Is able to thoroughly review design deliverables to verify conformance to specifications and quality standards+0.133MODERATE
PS3.1.2Is able to ensure that designs meet functionality, manufacturability, quality, safety, and regulatory requirements+0.200MODERATE
PS3.1.3Is able to prepare and review design deliverables in accordance with codes, standards, contractual obligations, and in-house criteria+0.267MODERATE
PS3.1.4Is able to perform quality inspections on model elements to verify standards compliance and readiness for coordination/delivery−0.379LOW
C3.2 Codes & CompliancePS3.2.1Is able to understand and apply international structural design codes (e.g., IBC, ASCE 7, AISC, Eurocode) to design work−0.241LOW
PS3.2.2Is able to research and interpret building codes and structural standards and apply them to modular design work+0.448HIGH
PS3.2.3Is able to interpret and apply multi-jurisdictional building codes, accessibility standards, and regulatory requirements+0.400HIGH
PS3.2.4Is able to verify that all modular building designs comply with building codes, structural standards, and industry regulations+0.517HIGH
Notes: PS = Performance Statement; CVR = Content Validity Ratio. Bold values indicate PS above the Lawshe threshold (CVR ≥ 0.333 for N = 30). Consensus strength: HIGH (CVR ≥ 0.333), MODERATE (0 ≤ CVR < 0.333), LOW (CVR < 0). Of the 36 PS, 7 achieved HIGH consensus, 7 MODERATE, and 22 LOW. Category-level mean CVR values are reported in Section 5.2 and Figure 6.

Appendix C

Table A3 presents the detailed demographic profile of the 30 respondents.
Table A3. Detailed demographic profile of the respondent panel (N = 30).
AttributeCategoryExpert
(n = 9)
Non-Expert
(n = 21)
Total
(N = 30)
Modular construction experience10+ years101
<3 years808
None02121
Total design experience20+ years224
15–20 years224
10–15 years123
5–10 years077
<5 years4812
Current positionDirector/Executive235
Senior Manager358
Manager/Engineer31316
Junior Staff101
Organization typeA/E design firm82129
Construction/contractor101
Primary specializationArchitectural design72128
Structural engineering101
BIM/digital design101
Country of practiceRepublic of Korea92130
Notes: All values are verified against individual Part 0 survey responses (30 docx files parsed via python-docx). The Expert–Non-expert stratification follows the modular-experience criterion described in Section 4.6. Where multiple specializations were selected (4 respondents), the first-listed response was used for tabulation. All 30 respondents were based in the Republic of Korea, reflecting the geographic scope of this validation study. The predominance of A/E design firm affiliation (29/30) and architectural design specialization (28/30) reflects the recruitment pool and is discussed as a limitation in Section 7.

References

  1. Chen, L.; Huang, L.; Hua, J.; Chen, Z.; Wei, L.; Osman, A.I.; Fawzy, S.; Rooney, D.W.; Dong, L.; Yap, P.-S. Green Construction for Low-Carbon Cities: A Review. Environ. Chem. Lett. 2023, 21, 1627–1657. [Google Scholar] [CrossRef]
  2. De Wolf, C.; Pomponi, F.; Moncaster, A. Measuring Embodied Carbon Dioxide Equivalent of Buildings: A Review and Critique of Current Industry Practice. Energy Build. 2017, 140, 68–80. [Google Scholar] [CrossRef]
  3. Juricic, B.B.; Galic, M.; Marenjak, S. Review of the Construction Labour Demand and Shortages in the EU. Buildings 2021, 11, 17. [Google Scholar] [CrossRef]
  4. Kim, S.; Chang, S.; Castro-Lacouture, D. Dynamic Modeling for Analyzing Impacts of Skilled Labor Shortage on Construction Project Management. J. Manag. Eng. 2020, 36, 04019035. [Google Scholar] [CrossRef]
  5. Sanni-Anibire, M.O.; Mohamad Zin, R.; Olatunji, S.O. Causes of Delay in the Global Construction Industry: A Meta Analytical Review. Int. J. Constr. Manag. 2022, 22, 1395–1407. [Google Scholar] [CrossRef]
  6. Ahn, S.; Crouch, L.; Kim, T.W.; Rameezdeen, R. Comparison of Worker Safety Risks between Onsite and Offsite Construction Methods: A Site Management Perspective. J. Constr. Eng. Manag. 2020, 146, 05020010. [Google Scholar] [CrossRef]
  7. Generalova, E.M.; Generalov, V.P.; Kuznetsova, A.A. Modular Buildings in Modern Construction. Procedia Eng. 2016, 153, 167–172. [Google Scholar] [CrossRef]
  8. Lee, J.; Hyun, H. Multiple Modular Building Construction Project Scheduling Using Genetic Algorithms. J. Constr. Eng. Manag. 2019, 145, 04018116. [Google Scholar] [CrossRef]
  9. Ly, D.H.; Nguyen, T.D.H.N.; Jang, H.; Kim, B.; Ahn, Y.; Kwon, N. Developing a Life Cycle Assessment-Based Framework for Module-Based Impact Distribution in Adaptive Reuse of Modular Buildings. J. Build. Eng. 2025, 112, 113703. [Google Scholar] [CrossRef]
  10. McKinsey. Modular Construction: From Projects to Products. Available online: https://www.mckinsey.com/capabilities/operations/our-insights/modular-construction-from-projects-to-products?utm_source=chatgpt.com (accessed on 21 April 2026).
  11. Insights, F.B. Modular Construction Market Size [2023–2030] Worth $131.58 Billion by 2030. Exhibiting CAGR of 6.5%. Available online: https://www.globenewswire.com/news-release/2023/07/19/2707066/0/en/Modular-Construction-Market-Size-2023-2030-worth-131-58-Billion-by-2030-Exhibiting-CAGR-of-6-5.html (accessed on 21 April 2026).
  12. Wuni, I.Y.; Shen, G.Q.; Antwi-Afari, M.F. Exploring the Design Risk Factors for Modular Integrated Construction Projects. Constr. Innov. Inf. Process Manag. 2021, 23, 213–228. [Google Scholar] [CrossRef]
  13. Goulding, J.S.; Pour Rahimian, F.; Arif, M.; Sharp, M.D. New Offsite Production and Business Models in Construction: Priorities for the Future Research Agenda. Archit. Eng. Des. Manag. 2015, 11, 163–184. [Google Scholar] [CrossRef]
  14. Wuni, I.Y.; Shen, G.Q. Critical Success Factors for Modular Integrated Construction Projects: A Review. Build. Res. Inf. 2020, 48, 763–784. [Google Scholar] [CrossRef]
  15. Alwisy, A.; Al-Hussein, M.; Al-Jibouri, S.H. BIM Approach for Automated Drafting and Design for Modular Construction Manufacturing. In Computing in Civil Engineering; ASCE: Reston, VA, USA, 2012; pp. 221–228. [Google Scholar] [CrossRef]
  16. Yang, Y.; Pan, M.; Pan, W.; Zhang, Z. Sources of Uncertainties in Offsite Logistics of Modular Construction for High-Rise Building Projects. J. Manag. Eng. 2021, 37, 04021011. [Google Scholar] [CrossRef]
  17. Gao, S.; Jin, R.; Lu, W. Design for Manufacture and Assembly in Construction: A Review. Build. Res. Inf. 2020, 48, 538–550. [Google Scholar] [CrossRef]
  18. Succar, B.; Sher, W.; Williams, A. An Integrated Approach to BIM Competency Assessment, Acquisition and Application. Autom. Constr. 2013, 35, 174–189. [Google Scholar] [CrossRef]
  19. Zhang, P.; Ma, S.-G.; Zhao, Y.-N.; Cao, X.-Y. Analyzing Core Competencies and Correlation Paths of Emerging Engineering Talent in the Construction Industry—An Integrated ISM–MICMAC Approach. Sustainability 2023, 15, 16011. [Google Scholar] [CrossRef]
  20. Uhm, M.; Lee, G.; Jeon, B. An Analysis of BIM Jobs and Competencies Based on the Use of Terms in the Industry. Autom. Constr. 2017, 81, 67–98. [Google Scholar] [CrossRef]
  21. Li, J.; Yang, M.; Liu, C.; Li, A.; Guo, B. Listen to the Companies: Exploring BIM Job Competency Requirements by Text Mining of Recruitment Information in China. J. Constr. Eng. Manag. 2023, 149, 04023076. [Google Scholar] [CrossRef]
  22. Mirhosseini, S.A.; Mavi, R.K.; Mavi, N.K.; Abbasnejad, B.; Rayani, F. Interrelations among Leadership Competencies of BIM Leaders: A Fuzzy DEMATEL-ANP Approach. Sustainability 2020, 12, 7830. [Google Scholar] [CrossRef]
  23. Kwon, N.; Cho, J.; Lee, H.-S.; Yoon, I.; Park, M. Compensation Cost Estimation Model for Construction Noise Claims Using Case-Based Reasoning. J. Constr. Eng. Manag. 2019, 145, 04019047. [Google Scholar] [CrossRef]
  24. Kwon, N.; Park, M.; Lee, H.-S.; Ahn, J.; Kim, S. Construction Noise Prediction Model Based on Case-Based Reasoning in the Preconstruction Phase. J. Constr. Eng. Manag. 2017, 143, 04017008. [Google Scholar] [CrossRef]
  25. Ly, D.H.; Le, Q.H.; Hoang Nhat Nguyen, T.D.; Ahn, Y.; Kim, K.; Kwon, N. Advancing Modular Construction through Circular Economy: Insights from Semi-Automated PRISMA Analysis and Topic Modeling. J. Build. Eng. 2024, 98, 111232. [Google Scholar] [CrossRef]
  26. Tan, T.; Lu, W.; Tan, G.; Xue, F.; Chen, K.; Xu, J.; Wang, J.; Gao, S. Construction-Oriented Design for Manufacture and Assembly Guidelines. J. Constr. Eng. Manag. 2020, 146, 04020085. [Google Scholar] [CrossRef]
  27. Anvari, B.; Angeloudis, P.; Ochieng, W.Y. A Multi-Objective GA-Based Optimisation for Holistic Manufacturing, Transportation and Assembly of Precast Construction. Autom. Constr. 2016, 71, 226–241. [Google Scholar] [CrossRef]
  28. Innella, F.; Arashpour, M.; Bai, Y. Lean Methodologies and Techniques for Modular Construction: Chronological and Critical Review. J. Constr. Eng. Manag. 2019, 145, 04019076. [Google Scholar] [CrossRef]
  29. Tan, T.; Mills, G.; Papadonikolaki, E.; Li, B.; Huang, J. Digital-Enabled Design for Manufacture and Assembly (DfMA) in Offsite Construction: A Modularity Perspective for the Product and Process Integration. Archit. Eng. Des. Manag. 2023, 19, 267–282. [Google Scholar] [CrossRef]
  30. Yang, Y.; Pan, W.; Pan, M. Manufacturing of Modular Buildings: A Literature Review. In 2017 Modular and Offsite Construction Summit & the 2nd International Symposium on Industrialized Construction Technology, Shanghai, China, 10–12 November 2017; Tongji University: Shanghai, China; University of Alberta: Edmonton, AB, USA; Modular Building Institute: Charlottesville, VA, USA, 2017; Available online: https://scispace.com/papers/manufacturing-of-modular-buildings-a-literature-review-t6edxlswav (accessed on 12 April 2026).[Green Version]
  31. Bao, Z.; Laovisutthichai, V.; Tan, T.; Wang, Q.; Lu, W. Design for Manufacture and Assembly (DfMA) Enablers for Offsite Interior Design and Construction. Build. Res. Inf. 2022, 50, 325–338. [Google Scholar] [CrossRef]
  32. Langston, C.; Zhang, W. DfMA: Towards an Integrated Strategy for a More Productive and Sustainable Construction Industry in Australia. Sustainability 2021, 13, 9219. [Google Scholar] [CrossRef]
  33. Dong, D.; Zou, Y.; Pan, H.; Zhou, G.; Feng, Y.; Tang, Y. DFMA-Oriented Modular and Parametric Design and Secondary Splitting of Vertical PC Components. Sci. Rep. 2023, 13, 3457. [Google Scholar] [CrossRef]
  34. Qiang, J.; Qian, Z.; Li, Y.; Yuan, Y.; Wu, X. Short Text Topic Modeling Techniques, Applications, and Performance: A Survey. IEEE Trans. Knowl. Data Eng. 2022, 34, 1427–1445. [Google Scholar] [CrossRef]
  35. Yan, X.; Guo, J.; Lan, Y.; Cheng, X. A Biterm Topic Model for Short Texts. In Proceedings of the 22nd International Conference on World Wide Web; Association for Computing Machinery: New York, NY, USA, 2013; pp. 1445–1456. [Google Scholar]
  36. Reimers, N.; Gurevych, I. Sentence-BERT: Sentence Embeddings Using Siamese BERT-Networks. In Proceedings of the 2019 Conference on Empirical Methods in Natural Language Processing and the 9th International Joint Conference on Natural Language Processing (EMNLP-IJCNLP); Association for Computational Linguistics: Hong Kong, China, 2019; pp. 3982–3992. [Google Scholar]
  37. Grootendorst, M. BERTopic: Neural Topic Modeling with a Class-Based TF-IDF Procedure. arXiv 2022, arXiv:2203.05794. [Google Scholar] [CrossRef]
  38. Saaty, T.L. The Modern Science of Multicriteria Decision Making and Its Practical Applications: The AHP/ANP Approach. Oper. Res. 2013, 61, 1069–1257. [Google Scholar] [CrossRef]
  39. Si, S.-L.; You, X.-Y.; Liu, H.-C.; Zhang, P. DEMATEL Technique: A Systematic Review of the State-of-the-Art Literature on Methodologies and Applications. Math. Probl. Eng. 2018, 2018, 3696457. [Google Scholar] [CrossRef]
  40. Ishizaka, A.; Labib, A. Analytic Hierarchy Process and Expert Choice: Benefits and Limitations. OR Insight 2009, 22, 201–220. [Google Scholar] [CrossRef]
  41. Moon, H.; Mirmotalebi, S.; Jang, Y.; Ahn, Y.; Kwon, N. Risk Evaluation of Radioactive Concrete Structure Decommissioning in Nuclear Power Plants Using Fuzzy-AHP. Buildings 2024, 14, 1536. [Google Scholar] [CrossRef]
  42. Analytic Hierarchy Process (AHP). In A Handbook on Multi-Attribute Decision-Making Methods; John Wiley & Sons, Ltd.: Hoboken, NJ, USA, 2021; pp. 25–42.
  43. Kang, D.; Lee, E.; Ahn, Y.; Kwon, N. Deriving the Importance of Defects in Multi-Unit Residential Buildings Using the Analytic Hierarchy Process Method. Buildings 2024, 14, 4028. [Google Scholar] [CrossRef]
  44. Falatoonitoosi, E.; Leman, Z.; Sorooshian, S. Decision-Making Trial and Evaluation Laboratory. Res. J. Appl. Sci. Eng. Technol. 2013, 5, 3476–3480. [Google Scholar] [CrossRef]
  45. Park, S.; Kwon, N.; Ahn, Y. Forecasting Repair Schedule for Building Components Based on Case-Based Reasoning and Fuzzy-AHP. Sustainability 2019, 11, 7181. [Google Scholar] [CrossRef]
  46. Chang, B.; Chang, C.-W.; Wu, C.-H. Fuzzy DEMATEL Method for Developing Supplier Selection Criteria. Expert Syst. Appl. 2011, 38, 1850–1858. [Google Scholar] [CrossRef]
  47. Patel, T.; Bapat, H.; Patel, D.; Walt, J.D. van der Identification of Critical Success Factors (CSFs) of BIM Software Selection: A Combined Approach of FCM and Fuzzy DEMATEL. Buildings 2021, 11, 311. [Google Scholar] [CrossRef]
  48. Rezaei, J. Best-Worst Multi-Criteria Decision-Making Method. Omega 2015, 53, 49–57. [Google Scholar] [CrossRef]
  49. Rezaei, J. Best-Worst Multi-Criteria Decision-Making Method: Some Properties and a Linear Model. Omega 2016, 64, 126–130. [Google Scholar] [CrossRef]
  50. Mohammadi, M.; Rezaei, J. Bayesian Best-Worst Method: A Probabilistic Group Decision Making Model. Omega 2020, 96, 102075. [Google Scholar] [CrossRef]
  51. Abdelrazek, A.; Eid, Y.; Gawish, E.; Medhat, W.; Hassan Yousef, A. Topic Modeling Algorithms and Applications: A Survey. Inf. Syst. 2023, 112, 102131. [Google Scholar] [CrossRef]
  52. McInnes, L.; Healy, J.; Melville, J. UMAP: Uniform Manifold Approximation and Projection for Dimension Reduction. arXiv 2018, arXiv:1802.03426. [Google Scholar] [CrossRef]
  53. Campello, R.J.G.B.; Moulavi, D.; Sander, J. Density-Based Clustering Based on Hierarchical Density Estimates. In Proceedings of the Pacific-Asia Conference on Knowledge Discovery and Data Mining (PAKDD); Springer: Gold Coast, NCW, Australia, 2013; pp. 160–172. [Google Scholar]
  54. Röder, M.; Both, A.; Hinneburg, A. Exploring the Space of Topic Coherence Measures. In Eighth ACM International Conference on Web Search and Data Mining (WSDM), Shanghai, China, 2–6 February 2015; Association for Computing Machinery: New York, NY, USA, 2015; pp. 399–408. [Google Scholar]
  55. Dieng, A.B.; Ruiz, F.J.R.; Blei, D.M. Topic Modeling in Embedding Spaces. Trans. Assoc. Comput. Linguist. 2020, 8, 439–453. [Google Scholar] [CrossRef]
  56. Ward, J.H., Jr. Hierarchical Grouping to Optimize an Objective Function. J. Am. Stat. Assoc. 1963, 58, 236–244. [Google Scholar] [CrossRef]
  57. Rousseeuw, P.J. Silhouettes: A Graphical Aid to the Interpretation and Validation of Cluster Analysis. J. Comput. Appl. Math. 1987, 20, 53–65. [Google Scholar] [CrossRef]
  58. Lawshe, C.H. A Quantitative Approach to Content Validity. Pers. Psychol. 1975, 28, 563–575. [Google Scholar] [CrossRef]
  59. Wilson, F.R.; Pan, W.; Schumsky, D.A. Recalculation of the Critical Values for Lawshe’s Content Validity Ratio. Meas. Eval. Couns. Dev. 2012, 45, 197–210. [Google Scholar] [CrossRef]
  60. Ayre, C.; Scally, A.J. Critical Values for Lawshe’s Content Validity Ratio: Revisiting the Original Methods of Calculation. Meas. Eval. Couns. Dev. 2014, 47, 79–86. [Google Scholar] [CrossRef]
  61. Liang, F.; Brunelli, M.; Rezaei, J. Consistency Issues in the Best Worst Method: Measurements and Thresholds. Omega 2020, 96, 102175. [Google Scholar] [CrossRef]
  62. Wu, W.-W.; Lee, Y.-T. Developing Global Managers’ Competencies Using the Fuzzy DEMATEL Method. Expert Syst. Appl. 2007, 32, 499–507. [Google Scholar] [CrossRef]
  63. Opricovic, S.; Tzeng, G.-H. Defuzzification within a Multicriteria Decision Model. Int. J. Uncertain. Fuzziness Knowl. Based Syst. 2003, 11, 635–652. [Google Scholar] [CrossRef]
  64. Gurcan, F.; Soylu, A.; Khan, A.Q. Towards a Sustainable Workforce in Big Data Analytics: Skill Requirements Analysis from Online Job Postings Using Neural Topic Modeling. Sustainability 2025, 17, 9293. [Google Scholar] [CrossRef]
  65. Ao, Z.; Horváth, G.; Sheng, C.; Song, Y.; Sun, Y. Skill Requirements in Job Advertisements: A Comparison of Skill-Categorization Methods Based on Wage Regressions. Inf. Process. Manag. 2023, 60, 103185. [Google Scholar] [CrossRef]
  66. Paulk, M.C.; Curtis, B.; Chrissis, M.B.; Weber, C.V. Capability Maturity Model, Version 1.1. IEEE Softw. 1993, 10, 18–27. [Google Scholar] [CrossRef]
Figure 1. Research Framework.
Sustainability 18 05212 g001
Figure 2. Multi-stage data refinement pipeline for designer-centric corpus construction.
Sustainability 18 05212 g002
Figure 3. BERTopic hyperparameter grid search results across 144 parameter combinations.
Sustainability 18 05212 g003
Figure 4. Topic selection results from BERTopic with domain assignments.
Sustainability 18 05212 g004
Figure 5. Ward dendrogram of 9 valid topics with three-domain structure.
Sustainability 18 05212 g005
Figure 6. CVR forest plot of 36 performance statements grouped by competency category.
Sustainability 18 05212 g006
Figure 7. Bayesian BWM weight comparison between Expert and Non-expert groups.
Sustainability 18 05212 g007
Figure 8. Influential Network Relation Map (INRM) of 9 competency categories from Fuzzy DEMATEL.
Sustainability 18 05212 g008
Figure 9. Fuzzy DEMATEL prominence-relation comparison between Expert and Non-expert groups.
Sustainability 18 05212 g009
Figure 10. Stability heatmap of cause-effect classification across three respondent sets for 9 competency categories.
Sustainability 18 05212 g010
Figure 11. Cross-method convergence heatmap of 9 competency categories across CVR, Bayesian BWM, and Fuzzy DEMATEL.
Sustainability 18 05212 g011
Table 1. Identification of Methodologies and Research Gaps in Previous Studies.
CategoryStudyPrimary FocusEvidence Type/
Data Source
MethodologyKey OutcomesMain Limitation &
Research Gap
A1A2A3A4A5
Semantic text
analysis
Grootendorst
[37]
BERTopic neural topic modelingMethod paperxxxxDemonstrated semantically coherent topic extractionNo corpus control or
downstream validation
Uhm et al.
[20]
BIM job, competency analysis based on job postingsJob postings + SNA/O*NETxxxIdentified BIM job types and competency elementsBIM-general;
role-mixing remains
Li et al.
[21]
BIM competencies from recruitment textsJob postings + STMxxxExtracted competency topics and covariate effectsNot modular-specific;
no hierarchy
Structural modeling
& validation
Succar et al.
[18]
BIM competency framework developmentConceptual framework/
literature synthesis
xxxxProposed a structured BIM competency frameworkFramework-based,
not data-driven
Zhang et al.
[19]
Core competencies and paths in constructionDelphi + ISM-MICMACxxxxDeveloped hierarchical competency structure and influence pathsNot data-driven;
no uncertainty modeling
Importance weighting
& causal analysis
Rezaei
[48]
Proposal of the Best–Worst Method (BWM)Method paperxxxxxEfficient weighting with fewer comparisonsNo uncertainty or
causal analysis
Mohammadi &
Rezaei [50]
Bayesian extension of BWMMethod paperxxxxProbabilistic group weightingNo causal structure
analysis
Chang et al.
[46]
Fuzzy DEMATEL procedure
development
Method paper/supplier
selection application
xxxxFuzzy DEMATEL for causal analysis under uncertaintyNot linked to competency derivation
Mirhosseini
et al. [22]
BIM leadership
competencies
Expert survey + fuzzy
DEMATEL-ANP
xxxImportance & cause-effect analysisNo text-based extraction or hierarchy
Note 1: A1 = Data-driven extraction, A2 = Semantic topic mining, A3 = Hierarchical structuring, A4 = Uncertainty-aware weighting, A5 = Causal mapping. Note 2: ✓ = addressed, △ = partially addressed, x = not addressed.
Table 2. Linguistic scale and corresponding triangular fuzzy numbers for Fuzzy DEMATEL influence assessment.
Linguistic TermAbbreviationTriangular Fuzzy Number (l, m, u)
No influenceNI(0.00, 0.00, 0.25)
Very low influenceVL(0.00, 0.25, 0.50)
Low influenceL(0.25, 0.50, 0.75)
High influenceH(0.50, 0.75, 1.00)
Very high influenceVH(0.75, 1.00, 1.00)
Note: TFNs are converted from linguistic responses and defuzzified via the CFCS method Opricovic & Tzeng [63] for subsequent matrix operations.
Table 3. Structure of the integrated research framework by module and stage.
ModuleStepProcedureInputOutput
Module 1
Data-Driven Competency Derivation
M1.1Data collection and refinement (Section 4.1)Raw job postingsRefined corpus
M1.2BERTopic topic modeling
(Section 4.2)
Refined corpus
(8656 sentences)
Latent topics
M1.3Ward hierarchical clustering
(Section 4.3)
Valid topicsDomain–category hierarchy
M1.4Performance statement derivation
(Section 4.4)
Categories + representative sentencesSet of performance statements
Module 2
Expert-Based Multi-Method Assessment
M2.1Integrated survey design
(Section 4.5)
Performance statements + categoriesIntegrated survey instrument
M2.2Respondent panel composition (Section 4.6)Integrated surveyResponse data
(N = 30)
M2.3Multi-method validation
(Section 5)
Response dataConsensus strength, weights, causal structure
Table 4. Number of postings retained and removed at each filtering stage of the corpus construction pipeline.
StepFilterRetainedRemovedMain Reason for Removal
0Job-title gate512014,733No designer-relevant keyword in title
1Domain blacklist4818302Out-of-scope industries (defense, IT, creative-design, etc.)
2Modular ∩ Design whitelist2774541No modular-construction signal or JD < 100 substantive words
3Exact-match deduplication25027Duplicate (job_id, title, company)
4SBERT semantic deduplication2501966Near-duplicate (cosine ≥ 0.85)
5Non-building facility filter2437Data-center, hyperscale, or crypto-mining facility
Note: ∩ denotes set intersection (postings matching both Group A modular-construction keywords and Group B design-role keywords). Step 2 breakdown of 4541 removals: JD word-count below 100 after equal-opportunity-statement stripping = 3585 (78.9%); A∩B keyword-pair failure = 956 (21.1%).
Table 5. Hyperparameter grid search ranges for BERTopic topic modeling.
ComponentHyperparameterDescriptionSearch Range
UMAPn_neighborsLocal vs. global structure balance5, 7, 10, 15
n_componentsReduced dimensionality of embeddings3, 5
HDBSCANmin_cluster_sizeMinimum cluster size for density-based clustering50, 75, 100, 125, 150, 200
min_samplesCore point determination criterion1, 3, 5
Table 6. Representative performance statement for each of the nine competency categories.
DomainCategoryRepresentative Performance Statement
D1C1.1CAD & 3D ModelingIs able to create 2D/3D design models, detailed drawings, and technical documents using design software such as Revit and AutoCAD
C1.2BIM CoordinationIs able to create, manage, and coordinate multidisciplinary design models using BIM software
C1.3Collaboration & CoordinationIs able to collaborate with engineering, production, and project teams to ensure design feasibility and accuracy
C1.4Drawings & SpecificationsIs able to coordinate with design and production managers to update drawings
D2C2.1Modular ConstructionIs able to develop detailed designs of modular building units with accuracy and efficiency
C2.2Structural EngineeringIs able to perform structural analysis and design of buildings and their supporting structures
C2.3MEP SystemsIs able to design MEP systems in compliance with regulatory codes and project requirements
D3C3.1Quality & StandardsIs able to prepare and review design deliverables in accordance with codes, standards, contractual obligations, and in-house criteria
C3.2Codes & ComplianceIs able to verify that all modular building designs comply with building codes, structural standards, and industry regulations
Note: Each category’s representative PS shows the highest within-category CVR score (Section 5.2). Full 36 PS list: Appendix B.
Table 7. Composition of the integrated survey instrument across the four parts.
PartAnalysisContentResponse Format
Part 0-Respondent profileAffiliation, position, total experience, modular experience, specialization, country
Part 1CVRContent validity assessment of 36 performance statements3-point scale (Essential/Useful but not essential/Not necessary)
Part 2BWMWeight assessment for domains and categoriesBest/Worst selection + 1–9 pairwise comparison
Part 3DEMATELInfluence relationships among categories5-point linguistic scale (NI/VL/L/H/VH)
Table 8. Demographic characteristics of the respondent panel (N = 30).
CharacteristicExpert ( n = 9)Non-Expert ( n = 21)Total ( N = 30)
Modular
experience
<3 years8-8
≥10 years1-1
None-2121
Total
experience
<5 years347
5–15 years31114
≥15 years369
CountryRepublic of Korea 100%Republic of Korea 100%Republic of Korea 100%
Table 9. Silhouette coefficients and domain composition for Ward hierarchical clustering ( k = 2–5).
k SilhouetteDomain CompositionInterpretive Adequacy
20.0552-7 (extreme imbalance)Low
30.0274-3-2 (balanced)Highest
40.0264-2-2-1Moderate
50.024-Low
Table 10. Category-level CVR results and Consensus Strength distribution (N = 30).
Category n Mean CVRPassHighModerateLow
C1.1 CAD & 3D Modeling4−0.2661/4103
C1.2 BIM Coordination4−0.3680/4004
C1.3 Collaboration & Coordination4+0.0501/4121
C1.4 Drawings & Specifications4+0.1292/4211
D1 Subtotal16−0.1144/16439
C2.1 Modular Construction4−0.1650/4013
C2.2 Structural Engineering4−0.4330/4004
C2.3 MEP Systems4−0.5650/4004
D2 Subtotal12−0.3880/120111
C3.1 Quality & Standards4+0.0550/4031
C3.2 Codes & Compliance4+0.2813/4301
D3 Subtotal8+0.1683/8332
Total36-7/367722
Note: Pass = number of PS exceeding Lawshe threshold (0.333). Consensus Strength tertiles: High ≥ 0.333, Moderate 0 ≤ CVR < 0.333, Low < 0 (Section 3.3). Bold: domain subtotals and the strongest category (C3.2).
Table 11. Bayesian BWM consistency ratio pass rates and weights at the domain and category levels.
LevelDomainCR Pass
(Overall)
CR Pass
(Expert, n = 9)
CR Pass
(Non-Expert, n = 21)
WeightRank
DomainD1 Design Tools & Coordination 12/30 (7%)0/9 (0%)2/21 (10%)0.412 11
D2 Modular Construction Engineering6/30 (20%)4/9 (44%)2/21 (10%)0.3262
D3 Quality & Regulatory Compliance21/30 (72%)9/9 (100%)9/21 (43%)0.2623
Category
(D2)
C2.1 Modular Construction---0.4481
C2.2 Structural Engineering---0.3722
C2.3 MEP Systems---0.1803
Category
(D3)
C3.2 Codes & Compliance---0.5771
C3.1 Quality & Standards---0.4232
Note: R < 0.10 = pass (Rezaei, [48]). Weights = posterior means from Bayesian BWM (CR-consistent responses); domain weights and within-domain category weights each sum to 1.0. Bold = highest at each level. 1 D1 category-level weights excluded due to insufficient CR-consistent responses; the D1 domain-level weight is reported for completeness but is not interpreted in the category analysis.
Table 12. Prominence and relation values of 9 competency categories from Fuzzy DEMATEL.
CategoryD + RD−RTypeQuadrant
C1.1 CAD & 3D Modeling33.02+0.03CauseQ2 Independent Cause
C1.2 BIM Coordination33.71+0.64CauseQ1 Core Cause
C1.3 Collaboration & Coordination34.49−0.61EffectQ4 Core Effect
C1.4 Drawings & Specifications35.00−0.04EffectQ4 Core Effect
C2.1 Modular Construction33.41−0.38EffectQ3 Independent Effect
C2.2 Structural Engineering34.31+0.54CauseQ1 Core Cause
C2.3 MEP Systems31.76+0.70CauseQ2 Independent Cause
C3.1 Quality & Standards32.82+0.13CauseQ2 Independent Cause
C3.2 Codes & Compliance32.74−0.99EffectQ3 Independent Effect
Table 13. Comparison of causal classification between Expert and Non-expert groups for 9 competency categories.
CategoryExpert
(n = 9) D−R
Non-Expert
(n = 21) D−R
Overall (N = 30) D−RExpert TypeNon-Expert TypeStability
C1.1 CAD & 3D Modeling−0.24+0.13+0.03EffectCauseUnstable
C1.2 BIM Coordination+0.45+0.47+0.64CauseCauseStable
C1.3 Collaboration & Coordination−0.30−0.50−0.61EffectEffectStable
C1.4 Drawings & Specifications−0.59+0.18−0.04EffectCauseUnstable
C2.1 Modular Construction+0.736−0.634−0.38CauseEffectExperience-Divergent
C2.2 Structural Engineering+0.71+0.27+0.54CauseCauseStable
C2.3 MEP Systems+0.63+0.46+0.70CauseCauseStable
C3.1 Quality & Standards+0.15+0.06+0.13CauseCauseStable
C3.2 Codes & Compliance−1.54−0.43−0.99EffectEffectStable
Table 14. Preliminary Competency Maturity Model for building-oriented modular construction designers.
LevelDesignationLevel DescriptionMapped CategoriesPrimary Evidence
1InitialRecognizes modular concepts; performs general building designC1.1 CAD, C2.3 MEPDEMATEL Q2 Independent Cause
2BasicPerforms foundational design in modular environmentsC1.2 BIM, C2.2 StructuralDEMATEL Q1 Core Cause
3DefinedIntegrates modular-specific tools and processes systematicallyC2.1 Modular, C3.1 QualityBWM highest in D2/D3; Cognitive Divide
4ManagedManages quality quantitatively; coordinates multi-disciplinary integrationC1.3 Collaboration, C1.4 DrawingsDEMATEL Q4 Core Effect
5OptimizedEstablishes industry standards and mentors across organizationsC3.2 CodesTriple Convergence (CVR · BWM · DEMATEL)
Disclaimer/Publisher’s Note: The statements, opinions and data contained in all publications are solely those of the individual author(s) and contributor(s) and not of MDPI and/or the editor(s). MDPI and/or the editor(s) disclaim responsibility for any injury to people or property resulting from any ideas, methods, instructions or products referred to in the content.