1. Introduction
The transition to sustainability represents one of the most complex governance challenges of the 21st century. Unlike previous global initiatives, the current process of decarbonisation, circular economy development, and achievement of the Sustainable Development Goals (SDGs) requires a coordinated transformation in the behaviour of multiple interdependent stakeholders: governments, firms, households, and civil society [
1,
2]. In the European Union, this challenge is formally embedded in ambitious policy frameworks such as the 2030 Agenda and the European Green Deal. Nevertheless, despite these frameworks, available evidence points to persistent institutional divisions, uneven transition speeds across countries and stakeholder domains, and a possible structural slowdown in progress after 2019 [
3,
4]. The EU thus constitutes a critical empirical laboratory for examining whether sustainability transitions unfold as a single convergence process or as multiple, differentiated trajectories shaped by institutional lock-in and stakeholder heterogeneity.
Most quantitative assessments of sustainability in the EU focus either on aggregate indicators (such as the SDG Index or the ecological footprint) or on individual environmental dimensions (such as greenhouse gas emissions, renewable energy, or ecological footprint convergence) [
5,
6,
7]. These approaches do not allow for the roles of different stakeholder groups to be distinguished and complicate the empirical linkage with established theoretical frameworks, such as the multi-level perspective (MLP), stakeholder governance, and convergence/club convergence. A gap therefore emerges between the available informational base and the theoretical frameworks that would be needed to interpret it.
The present study addresses this gap by constructing a stakeholder-differentiated composite sustainability framework for all 27 EU Member States over the period of 2015–2024 in order to capture a decade that combines a phase of accelerated policy ambition with two major shocks (the COVID-19 pandemic and the 2022 energy and geopolitical crises), making it a natural window for examining how sustainability trajectories evolve under changing pressures. Four stakeholder-specific indices are constructed: the Government Sustainability Index (GSI), based on government expenditure on environmental protection (% of GDP) as a proxy for policy effort; the Environmental Sustainability Index (ESI), expressed through the share of renewable energy, the circular material use rate, and inverted greenhouse gas emissions per capita as biophysical outcomes; the Population Sustainability Index (PSI), using the SDG Index score as a proxy for social and institutional performance; and the Business Sustainability Index (BSI), constructed from the same biophysical indicators as ESI but interpreted through the lens of corporate and production behaviour, given the limited availability of harmonised firm-level ESG data at the EU-27 level [
1,
8,
9,
10]. These four indices are aggregated into a Composite Sustainability Index (CSI). The analysis covers a balanced panel of 270 country-year observations and draws on harmonised data from Eurostat, the European Environment Agency, and the Sustainable Development Report. The empirical strategy applies K-means clustering, compound annual growth rates (CAGRs), and correlation analysis, complemented by a robustness module testing alternative weighting schemes, z-score normalisation, and ±10% perturbations of the underlying indicators.
The analysis is designed as a structured, primarily descriptive and comparative mapping of stakeholder-specific trajectories and their aggregation rather than as a causal econometric model. Four pattern-oriented research hypotheses (H1–H4) are formulated, linking expected empirical regularities to the theoretical frameworks discussed in
Section 2. H1 concerns whether governments lead the early phases of the transition, with GSI increases preceding and correlating with subsequent ESI improvements. H2 examines whether EU Member States cluster into stable sustainability tiers consistent with club convergence and institutional lock-in. H3 tests whether a structural slowdown is detectable after 2019 across all indices and tiers. H4 addresses whether these patterns are robust to alternative methodological specifications [
6,
11,
12,
13,
14,
15,
16].
The results reveal four relatively stable sustainability tiers with limited inter-tier mobility, an S-curve-type relationship between initial sustainability levels and subsequent growth, a consistent hierarchy of stakeholder response speeds (ESI > GSI > PSI), and a structural slowdown after 2019. These patterns remain robust across alternative specifications and imply that EU sustainability transitions follow multiple, tier-structured trajectories shaped by institutional lock-in rather than converging toward a single equilibrium. The remainder of the article is organised as follows.
Section 2 reviews the relevant literature and develops the four research hypotheses.
Section 3 describes the data, index construction, and robustness design.
Section 4 presents the empirical results.
Section 5 discusses the theoretical and governance implications.
Section 6 summarises the main contributions, policy implications, and directions for future research.
2. Literature Review
2.1. Socio-Technical Transitions and the Multi-Level Perspective
The transition to sustainability in the scientific literature is considered a complex and multifaceted problem that involves qualitative transformations in complex systems such as technologies, institutions, consumer practices, cultural understandings, and a broad spectrum of additional factors of essential importance. It is far more than a simplistic understanding of technological change and rather represents a manifestation of a complex socio-technical transition [
1,
2,
17]. Based on this understanding, the multi-level perspective (MLP) approach has been developed, which requires a clear distinction between: niches (spaces for radical innovations), regimes (stabilized socio-technical configurations that structure dominant practices), and socio-technical landscapes (macro-trends and exogenous shocks such as climate change, global crises, or pandemics).
Such transitions usually occur under conditions of landscape-level pressure and niche-level innovation. The emergence of such pressure destabilizes regimes and opens windows for reconfiguration [
17,
18]. In itself, such pressure may generate incentives for resistance. Incumbent actors may oppose transitions or reconfigure them. They may exploit their dominant position in their relationships with other stakeholders by creating multiple “transition pathways” rather than following a single trajectory. This position is widely represented in the contemporary economic literature [
2,
19,
20], while numerous examples confirming it in practice have also been presented. At the same time, a growing body of work emphasises that these pathways are uneven across sectors and countries and that power relations, institutional lock-in, and policy mixes can sustain differentiated regimes over long periods rather than pushing all systems towards a single low carbon equilibrium. These dynamics directly motivate H1 (government leadership in early transition phases) and H3 (structural slowdown), both of which are rooted in MLP concepts of regime reconfiguration and plateau effects when regimes reach a new equilibrium.
Placed in the context of sustainability in the EU, such an application of the MLP allows for a specific interpretation of the individual constructed indices. GSI captures policies and governance arrangements at the regime level [
1,
8,
9,
10]. ESI and BSI reflect regime outcomes and niche absorption (renewable energy sources, circularity, and emissions). PSI captures the social embedding of transitions in lifestyles, social outcomes, and the quality of institutions.
2.2. Stakeholder Governance, ESG, and Sustainability Performance
The literature on stakeholder governance has progressively expanded beyond shareholder-centric views of organisations toward a relational understanding in which firms, governments, and civil society interact as networks of interdependent actors [
11,
12]. In sustainability governance, stakeholder models are increasingly focused on decision-making issues. Such decisions usually directly affect matters related to stakeholders, ESG disclosure and accountability, and the role of stakeholders in shaping corporate and political behaviour [
21,
22].
Corporate environmental performance and disclosure are associated with stakeholder pressure and the institutional context [
22,
23,
24,
25]. Nevertheless, large-scale cross-national analyses for the EU that provide a sufficiently strong linkage between social performance (PSI), corporate sustainability (BSI), and government efforts (GSI) are still relatively rare. This gap motivates H2, which examines whether PSI correlates more strongly with BSI than with GSI—a relationship that would be expected if stakeholder governance and ESG co-movement mediate population outcomes more directly than public expenditures alone.
In addition to the MLP, the literature on stakeholder governance underlines the role of multiple interacting actor groups—governments, businesses, civil society, and households—in shaping sustainability transitions. This strand of research stresses that sustainability policies are implemented in contexts of fragmented authority, competing interests, and varying capacities across stakeholders. Recent contributions highlight that stakeholders do not move at the same speed: technological and infrastructural changes can be accelerated by policy and investment, while changes in social norms, consumption practices, and institutional cultures are often slower and more conflictual.
While Geels and Roberts and Nosan [
1,
2,
26] emphasise that regime actors (particularly governments and incumbents) can slow or redirect niche innovations, Markard et al. [
27] show that the pace and direction of transformation depend critically on how different actor groups interact and whether their strategies are complementary or conflictual. Truffer et al. [
28] extend this by demonstrating that in cross-national settings, the absence of coordinated stakeholder action tends to produce fragmented trajectories rather than convergent paths.
However, most empirical applications of stakeholder governance remain qualitative or case-based, focusing on specific sectors, cities, or policy processes. Systematic, cross-country quantitative assessments that differentiate the trajectories of key stakeholder domains are still rare. This limits the ability to assess whether stakeholder responses in the EU evolve in a coordinated or multi-speed fashion across Member States and how this interacts with institutional lock-in and convergence dynamics.
2.3. Convergence, Club Convergence, and Sustainability Tiers
The literature on convergence and club convergence is widely applied to examine whether countries approach similar levels of environmental and sustainability performance, or whether they cluster into distinct groups with different long-run equilibria. Evidence from studies covering the EU points consistently to the latter: global convergence of environmental indicators is limited; convergence clubs form among groups of countries with similar trajectories; and income, technology, and institutional quality structure membership in these clubs [
6,
13].
Evidence for the formation of such clubs can be found, for example, in club convergence in greenhouse gas emissions and the share of renewable energy in the EU. Empirical analyses identify multiple such formations, grouping together countries with similar trajectories and factor determinants [
29]. This club-formation logic underlies H2: the construction of CSI-based sustainability tiers is expected to reveal stable clubs consistent with different institutional regimes rather than a single convergence path.
The literature on convergence and club convergence has devoted considerable attention to whether countries converge towards similar levels of income, emissions, or sustainability indicators, or whether they cluster into distinct groups (“clubs”) with different long-run equilibria. In the environmental field, studies have identified multiple convergence clubs in indicators such as ecological footprint, emissions, or environmental quality within the EU and beyond, suggesting persistent structural differences.
Institutional economics and political science add a complementary perspective through the concepts of path dependence and institutional lock-in [
14,
15,
16]. Once certain institutional architectures, policy styles, and socio-technical regimes are established, they tend to reproduce themselves and constrain the range and speed of possible changes. This implies that even under common supranational frameworks, such as EU climate and energy policies, Member States may remain locked into distinct trajectories, forming relatively stable clubs rather than converging toward a single equilibrium.
Despite this rich literature, empirical work that simultaneously considers club convergence, institutional lock-in, and stakeholder-differentiated trajectories remains limited. Most convergence studies focus on aggregate environmental or socio-economic indicators, providing little insight into how different stakeholder domains contribute to or resist convergence processes.
2.4. Institutional Lock-In, Path Dependence, and Governance Constraints
In the literature devoted to the economics of institutions, the role of path dependence and institutional lock-in in shaping long-term trajectories is emphasized. On this issue, there exists a sufficiently broad theoretical and applied policy foundation of studies [
14,
15,
16].
According to these studies, lock-in may result from the independent or combined influence of resource dependence (investments embedded in infrastructure that cannot be efficiently recycled), normative determinants (values, norms, and expectations), or cognitive factors (mental models and paradigms characteristic of different countries or regions) [
14,
15,
16].
Based on such determinants, institutional lock-in emerges, understood as a stable regime. Its stability is expressed in the fact that once the corresponding regime is established, the effectiveness of new policies becomes constrained. The fixed state becomes so strong that it may lead to a slowdown in the diffusion of innovations and to the creation of convergence clubs of institutions and outcomes (because of which regional lock-ins, environmental performance clubs, and other similar formations emerge).
In the context of the EU, Lenschow et al. [
8] and other related studies provide additional evidence supporting the view that the legacy of earlier environmental policies and governance architectures continues to structure what is politically and institutionally possible. These are the so-called “inherited policies” (practices and understandings) that hinder transformative systemic change even in the implementation of ambitious programs such as the European Green Deal. In this sense, the slowdown hypothesis (H3) appears entirely logical. In essence, it represents a scenario in which the initial effects are exhausted through the easier results (investments), while deeper institutional lock-ins hinder further progress, consistent with S-curve dynamics and EKC-type models [
2,
7].
2.5. Composite Indices: Methodological Foundations and Stakeholder Gaps
Composite indices are now routine for tackling multidimensional topics like sustainability and governance, especially across EU studies [
29,
30]. Take the SDG Index, for instance [
31]: it leans on PCA to boil down complexity, but that can obscure straightforward policy targets, like hitting 100% renewables or net-zero emissions [
32,
33]. Min–max scaling, which is used here, keeps things readable and benchmark-friendly. Equal weights get flak for glossing over correlations [
34], but they beat opaque expert judgments, a point the OECD/JRC handbook hammers home [
29]. Geometric means, popular in some ESG work [
35], crack down on imbalances but do not fit when you are just tracking overall progress.
Recent works in Sustainability show how varied this gets. Pagliacci et al. [
36] went PCA for Italy’s regional SDG scores and flagged huge sensitivity to what you include; Łukasiak and Mackiewicz [
37] pushed DEA for EU environmental efficiency, spotting trade-offs that linear averages miss. In our case a min–max equal-weight setup prioritises stable rankings and EU-wide comparability, mirroring Eurostat’s SDG tracking [
38]. But robustness is non-negotiable: OECD urges checking weights, z-score alternatives, and ±10% tweaks to see if rankings or clusters hold up [
29,
39]. Skip that, and you are gambling that your results are real [
30].
Still, EU sustainability indices have a glaring hole—stakeholder breakdown. The SDG Index [
31], EPI [
40], and ecological footprint [
41] mash social, economic, and environmental bits into one blob, without teasing out who’s driving what—governments pushing policy, firms grinding emissions, or population-level shifts. Sectoral takes can be found [
35,
36] but nothing harmonised across all 27 EU states from 2015 to 2024 with clear stakeholder lenses [
33,
37]. This blocks testing stakeholder governance or MLP ideas, where actors move at different clips [
2].
Here, GSI tracks government push, ESI environmental results, PSI social/institutional stuff, and BSI production-side angles, rolled into CSI. It slots right into transition theory while sticking to OECD transparency rules [
29]—filling the space between lumpy SDG rankings and niche sector dives.
2.6. Synthesis and Research Gaps
Bringing these strands together, three gaps become visible. First, while the multi-level perspective and stakeholder governance theory emphasises heterogeneous actor roles and multi-speed transitions, most quantitative indicators used in the EU do not differentiate stakeholder domains. Second, convergence and club convergence studies document persistent groupings of countries but typically use aggregate sustainability or environmental measures, making it difficult to see how stakeholder-specific trajectories map onto these clubs. Third, composite indices are widely used and methodologically sophisticated, yet they are rarely constructed in a way that allows for a direct reading of stakeholder roles.
A systematic review of the available literature confirms that harmonised, stakeholder-differentiated composite indices explicitly mapping government effort, environmental outcomes, social performance, and business behaviour across all EU-27 Member States over a comparable time horizon are not currently available. Existing indices either aggregate these dimensions into a single score [
5,
6,
7,
29,
42] or are constructed for specific sectors, countries, or shorter time windows [
23,
24,
25]. This absence constitutes the direct empirical motivation for constructing GSI, ESI, PSI, BSI, and CSI in the present study.
The present study addresses these gaps by constructing a stakeholder-differentiated composite sustainability framework for the EU-27 countries over 2015–2024. The four indices GSI, ESI, PSI, and BS capture government efforts, environmental outcomes, social/population outcomes, and business-related environmental performance, respectively, and are aggregated into a Composite Sustainability Index (CSI). This design enables a systematic, cross-country analysis of how stakeholder domains evolve relative to each other, how they underpin stable sustainability tiers (clubs), and how they relate to S-shaped level–growth patterns and the observed post-2019 slowdown. In this sense, the study does not seek to propose a “better” index in a universal sense but to provide a transparent, stakeholder-structured template that can be aligned with transition theory, stakeholder governance, and the convergence/lock-in literature.
On this basis, four pattern-oriented research hypotheses (H1–H4) are formulated, linking the expected empirical patterns to the theoretical frameworks discussed. These hypotheses are descriptive in nature: they structure expectations about trajectories, tiers, and robustness rather than claiming causal identification.
3. Methodology and Data
3.1. Overall Analytical Design
The empirical strategy is designed as a structured, primarily descriptive and comparative mapping of stakeholder-specific sustainability trajectories and their aggregation into a composite index rather than as a causal econometric model. The analysis tracks how four stakeholder-related indices and a composite index evolve over 2015–2024 for the EU-27 countries, how they form relatively stable sustainability tiers, and how their growth patterns relate to each other and to the observed post-2019 slowdown. In this sense, the study focuses on identifying robust empirical patterns that are consistent with theoretically informed expectations, without claiming formal causal identification.
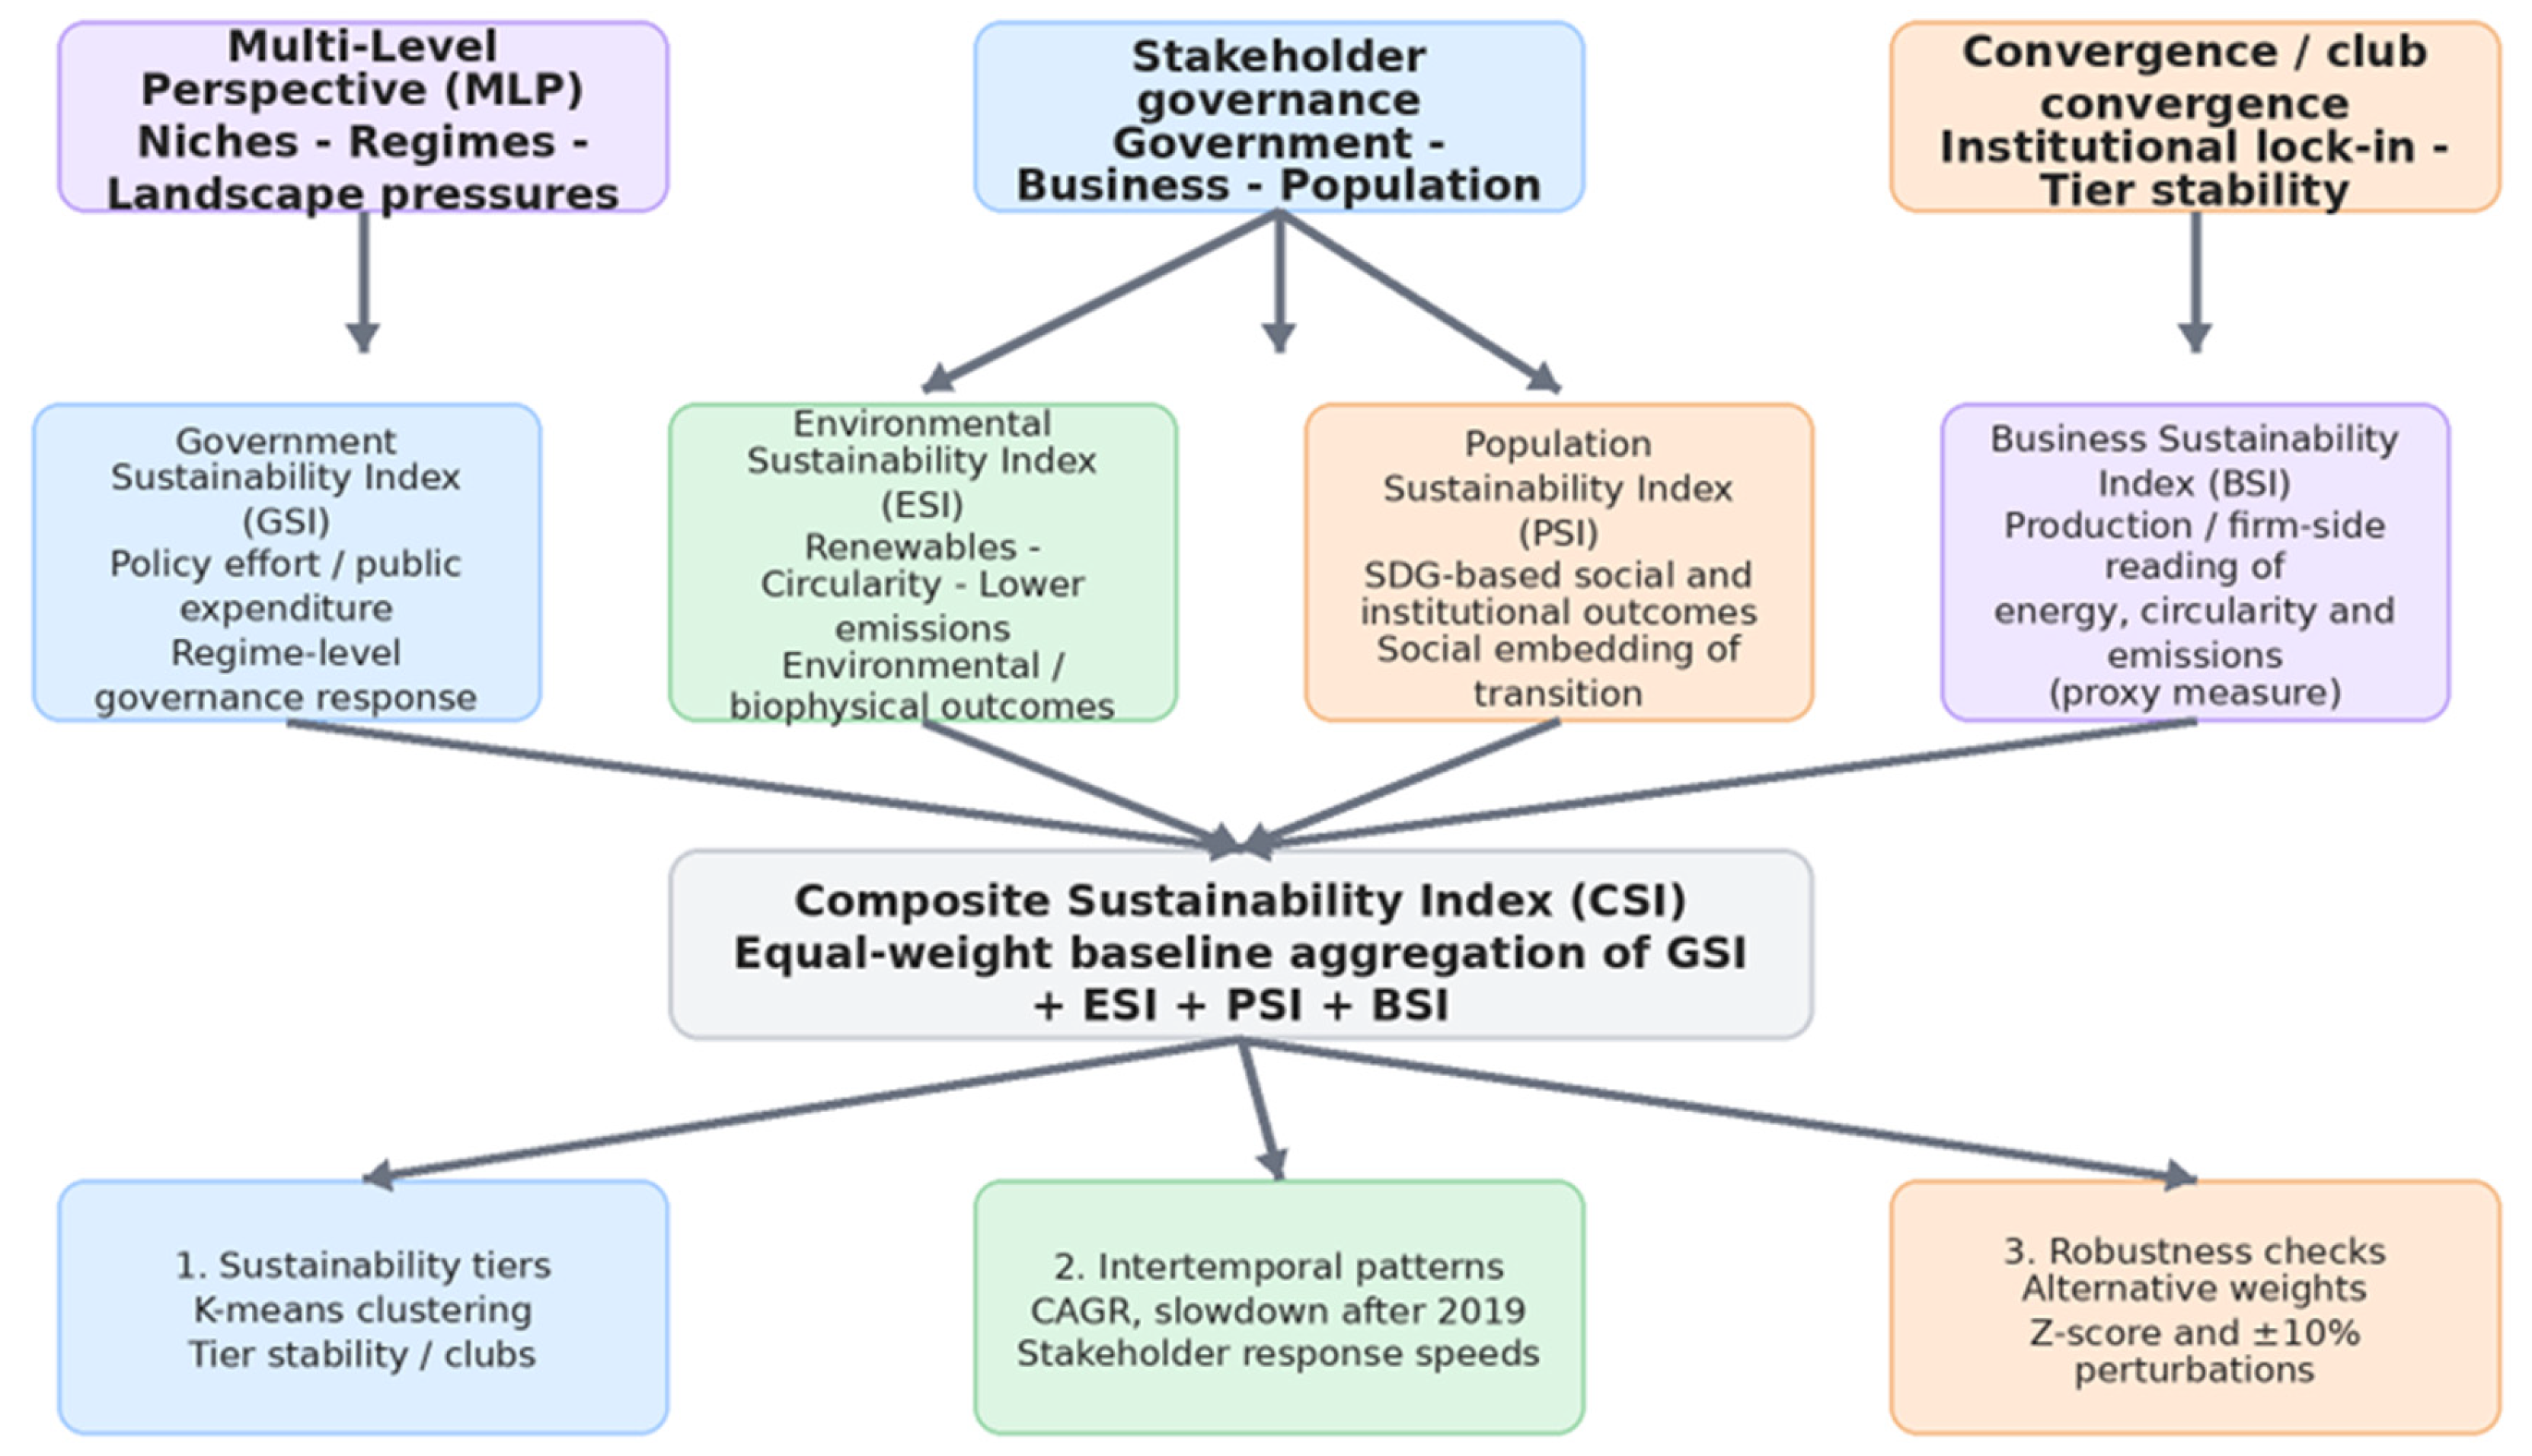
The conceptual logic of the study is summarised in
Figure 1. It is grounded in established theoretical frameworks, including the multi-level perspective, stakeholder governance, club convergence, and institutional lock-in. On this basis, the framework distinguishes four stakeholder domains, which are mapped onto harmonised EU indicators: the Government Sustainability Index (GSI), Environmental Sustainability Index (ESI), Population Sustainability Index (PSI), and Business Sustainability Index (BSI). These indices are interpreted as four complementary stakeholder domains: government policy effort (GSI), environmental/biophysical outcomes (ESI), social and institutional outcomes for the population (PSI), and production and business-related environmental performance (BSI), understood as a conservative proxy given current data limitation.
The resulting indices are then combined into a Composite Sustainability Index (CSI) under a baseline equal-weighting scheme. This constitutes the core of the study, around which the empirical analysis is organised into three main modules: identification of relatively stable sustainability tiers (clubs) through clustering; examination of intertemporal trajectories and slowdown using growth rates and level–growth relationships; and a robustness module.
3.2. Data Sources and Coverage
The indices are based on harmonised annual data for the EU-27 countries over the period of 2015–2024. The main data sources are Eurostat, the European Environment Agency (EEA), and the Sustainable Development Report (SDG Index). Eurostat serves as the official statistical office of the European Union and compiles comparable and quality-controlled statistics from national statistical institutes according to common European and international standards. For this study, the following Eurostat series are used: government expenditure on environmental protection (% of GDP); renewable energy shares; circular material use rates; and greenhouse gas emission footprints or related emission indicators. These series are constructed using consistent methodologies, are regularly updated, and cover all Member States, which ensures cross-country comparability. The EEA provides complementary methodological notes and indicator interpretations, while the SDG Index offers a composite measure of social and environmental performance.
Each individual indicator is briefly described below in terms of content, basic calculation logic, and limitations in order to avoid treating them as “black-box” values.
The population of the study consists of all 27 EU Member States. No countries are excluded. The analysis covers the period of 2015–2024, yielding a balanced panel of 270 country-year observations (27 countries * 10 years). All five indicators are drawn from publicly accessible, harmonised EU databases: Eurostat (government environmental expenditure, renewable energy shares, circular material use rates, and greenhouse gas emissions), the European Environment Agency (complementary indicator notes), and the Sustainable Development Report (SDG Index score). Isolated one-year gaps at the country level are linearly interpolated; country-year observations with missing data in more than one indicator in a given year are excluded from the index for that year. In practice, this exclusion affects a negligible number of observations, and the effective panel remains complete for all 27 Member States across the full period.
These indicators jointly reflect government policy efforts, environmental outcomes, circularity, emission intensity, and SDG-based social performance. Their harmonised construction under the European statistical framework ensures cross-country methodological comparability.
Government expenditure on environmental protection (% of GDP) captures public spending on environmental protection functions relative to total economic output. It is compiled according to COFOG classifications and reflects policy efforts but does not directly measure effectiveness or the quality of implemented measures [
43,
44].
Renewable energy share measures the proportion of energy consumption from renewable sources; it captures decarbonisation progress but can be affected by weather variability and methodological revisions [
45,
46];
Circular material use rate expresses the share of secondary (recycled) materials in overall material use, providing a proxy for circularity; it is sensitive to changes in construction and industrial cycles [
47,
48];
Greenhouse gas emissions per capita (or footprint) measure the climate impact associated with production and/or consumption; inverted values are used in the index to reflect higher sustainability with lower emissions [
49,
50,
51];
The SDG Index score aggregates multiple social, economic, and environmental indicators into a single measure of performance relative to the Sustainable Development Goals; it is broad in scope but inherently composite and subject to its own weighting and indicator choices [
4].
These indicators together provide a pragmatic, although not exhaustive, representation of the main sustainability dimensions relevant for a stakeholder-differentiated analysis. Their known limitations—such as the absence of direct firm-level ESG data and the breadth of the SDG Index—are acknowledged as methodological constraints rather than ignored.
It should be noted that in constructing the panel dataset, only years with complete information for all five indicators are included. Isolated one-year gaps at the country level are linearly interpolated. In addition, when structural gaps of the type “country–year” exist in more than one indicator, the observation is excluded from the construction of the index for the respective year. This approach is adopted in accordance with established practices for the reproducibility of SDGs and composite indices [
5,
52].
3.3. Indicator Selection and Stakeholder Mapping
The composite indices in the present study are deliberately constructed through simple and transparent transformations (normalisation, arithmetic averaging, and standard growth rates). Highly parameterized econometric specifications that would unnecessarily complicate the methodology and/or the logic of the analysis are intentionally avoided. This choice reflects a modelling philosophy articulated by Box, according to which “since all models are wrong, the scientist cannot obtain a ‘correct’ one by excessive elaboration. On the contrary… he should seek an economical description of natural phenomena,” and “the ability to devise simple but evocative models is the hallmark of the great scientist” [
53].
In the context of sustainability assessment within the EU, it is widely acknowledged that data uncertainty, structural heterogeneity, and institutional complexity are substantial. Therefore, in order to identify robust empirical regularities, simplified index formulas are employed. This contributes to making the assumptions clearly visible and facilitates reproducibility. At the same time, this index definition reduces the risk that results depend on the choice of highly sensitive functional forms. The achieved simplified approach also corresponds to the broader principle often attributed to Einstein that analytical frameworks should be “as simple as possible, but not simpler” [
54]. In this way, the analysis focuses on the minimum structure necessary to capture stakeholder-differentiated trajectories, convergence clubs, and robustness properties. The resulting findings remain as analytically “clean” as possible rather than being “hidden” behind unnecessary mathematical complexity.
For each year and country, the underlying indicators are first scaled to the interval using min–max normalisation. This facilitates aggregation and comparability across indicators with different units. The four stakeholder indices are then constructed as follows:
GSI is based on government environmental expenditure (% of GDP) and is interpreted as a proxy for governmental policy efforts and fiscal prioritisation of environmental protection [
55,
56];
ESI combines the renewable energy share, circular material use rate, and inverted greenhouse gas emissions per capita into a single measure of environmental/biophysical outcomes [
29,
43,
44,
45,
46,
47,
48];
PSI uses the SDG Index score as a summary measure of social and environmental performance of the population, reflecting social outcomes, institutions, and distributive dimensions [
4,
52];
BSI is constructed from the same three biophysical indicators as ESI (renewable energy, circularity, and inverted emissions) but explicitly interpreted through the lens of corporate and production behaviour, given that firms and production systems are key drivers of energy mix, material use, and emissions. Due to the lack of harmonised firm-level ESG data for all EU-27 countries over the full period, this is treated as a conservative proxy rather than a perfect measure of business sustainability [
23,
56].
This implies that ESI and BSI share a common empirical base but differ in interpretation: ESI reflects the state of the environment as an outcome, while BSI reads the same outcome from a production and firm-side perspective. This design is explicitly acknowledged as a data-driven compromise and is discussed as a limitation and priority for future refinement.
The Composite Sustainability Index (CSI) is defined as an aggregate of the four stakeholder indices. In the baseline specification, equal weights are assigned to GSI, ESI, PSI, and BSI. This parsimonious choice follows OECD/JRC guidance for composite indicators in situations where no widely accepted empirical or normative weighting scheme exists and aims to avoid introducing additional subjectivity through ad hoc expert weights. To assess the sensitivity of results to this choice, the robustness module implements alternative weighting schemes, including government-heavy, environment-heavy, and PCA-based weights.
Thus, the baseline weights should be read as a transparent modelling convention rather than a claim about the “true” relative importance of stakeholder domains. The robustness results show that the main qualitative findings, tier structure, S-curve level–growth patterns, and stakeholder response hierarchy, are stable across reasonable variations in weights.
In constructing the indicators, an important clarification should be made. Although the Environmental Sustainability Index (ESI) and the Business Sustainability Index (BSI) are constructed from the same three environmental outcome indicators (shares of renewable energy, circular material use rates, and inverted greenhouse gas emissions per capita), they perform analytically different functions within the stakeholder model. ESI is interpreted as a measure of the state of the environment, capturing the overall biophysical performance of national socio-technical systems. In contrast, BSI uses the same outcome indicators as proxies for production and firm behaviour, recognizing that the energy mix, circularity, and emission intensity are strongly influenced by corporate investment and operational decisions.
This dual interpretation is consistent with multi-stakeholder designs of environmental indices in which a common set of indicators is interpreted through different stakeholder lenses (for example, macro-level welfare versus firm-level contributions). In this way, the distribution of responsibilities and impacts among stakeholders can be examined. In practice, harmonized EU-wide data on firm-level ESG performance covering all 27 countries are largely unavailable. Under these circumstances, the use of shared environmental outcome indicators as a conservative proxy simultaneously for environmental conditions (ESI) and business behaviour (BSI) allows for both stakeholder completeness and methodological transparency to be maintained. The limitations of this choice are explicitly discussed again in the Discussion Section of the present article.
Despite their constructive simplicity, the indices are designed to map directly onto the pattern-oriented research hypotheses formulated in
Section 2.6. GSI captures the government effort dimension relevant to H1; CSI-based clustering provides the empirical basis for H2; CAGR comparisons across sub-periods allow for an evaluation of H3; and the robustness module tests whether the main patterns survive under alternative specifications (H4). This direct correspondence between index design and research expectations is a deliberate feature of the analytical framework.
3.4. Baseline Normalisation and Index Construction
3.4.1. Baseline Min–Max Normalisation
The use of min–max normalisation is a common practice when working with the SDG Index [
4,
51]. This technique is used to transform all indicators onto a 0–100 scale. This normalisation tool ensures comparability between different units, and within the analysis, it is applied to each indicator,
xi,t (country,
i; year,
t), where the normalised score
si,t is as follows:
where
xmin and
xmax are policy-relevant thresholds, for example, 0 for emissions, 100% for renewable energy, and achievable upper limits for circularity. In cases where explicit targets are not available, these minimum and maximum boundaries are represented by the observed minimum and maximum values for the EU-27 countries over the period of 2015–2024. The approach used is not novel and has already been applied by other authors in a similar context [
4,
49].
For greenhouse gas emissions per capita, the indicator is first inverted, so that lower emissions produce higher scores. This is done through the following transformation:
after which
is normalised using the same min–max formula [
4,
49,
52].
3.4.2. Stakeholder Indices Under Baseline Specification
The individual indices capturing the performance of each of the examined stakeholders are calculated using the following formula specification:
Note: the construction of BSI is the same arithmetic mean as ESI but with a different interpretation related to business performance.
The use of equal-weighting coefficients reflects the normative assumption of equal importance of all stakeholder dimensions. This assumption is also consistent with the practice of the SDG Index, while simultaneously providing a basis for robustness tests of the results [
29,
42].
3.5. Analytical Procedures and Robustness Design
Although robustness testing is implemented as an integral part of the empirical analysis rather than as a purely methodological pre-specification, its design is described in this section to ensure full transparency and replicability of the pre-registered analytical choices, in line with good practice for composite index construction [
10,
29,
42,
57].
The present article implements a dedicated robustness testing module following good practices in the literature on composite indicators [
10,
29,
42,
57]. The module is structured around three dimensions: alternative weighting schemes, alternative normalisation, and ±10% perturbations of individual indicators. For each scenario, the rank correlations of CSI, the stability of tier membership, and the persistence of key descriptive patterns (tiers, level–growth relationship, stakeholder speed hierarchy, and post-2019 slowdown) are assessed.
The main analytical steps are: (1) index computation and descriptive statistics: Stakeholder indices (GSI, ESI, PSI, and BSI) and CSI are computed for each country and year, and time profiles are used to examine trajectories over 2015–2024; (2) K-means clustering: This is applied to time-averaged CSI scores to identify sustainability tiers, with cluster stability examined across years; (3) growth patterns and correlations: CAGRs are calculated for each index over 2015–2019, 2019–2024, and 2015–2024 by tier, and simple correlations between initial CSI levels and subsequent growth are used to characterise S-curve dynamics; and (4) robustness checks: These are as described above.
For each scenario, rank correlations of CSI, the stability of tier membership, and the persistence of key descriptive patterns (tiers, level–growth relationship, stakeholder speed hierarchy, and post-2019 slowdown) are assessed. The purpose is to verify that the core empirical story is not an artefact of a narrow set of methodological choices but remains visible under a range of reasonable specifications.
3.5.1. Alternative Weighting Schemes
As alternative weighting schemes, in addition to the baseline equal weighting in ESI/BSI and CSI, the following variants are considered:
Policy-biased weighting (Gov-heavy CSI): Greater weight is assigned to government efforts. This construction uses the following weighting scheme:
Outcome-biased weighting (Env-heavy CSI): In this case, greater weight is assigned to biophysical environmental outcomes, with the following weighting scheme:
Data-oriented weighting (PCA-informed CSI): In this case, Principal Component Analysis (PCA) is applied to the normalised GSI, ESI, PSI, and BSI in order to test stability. The loadings of the first principal component, normalised so that their sum equals 1, are used as PCA-based weights [
29].
After calculating the results under each of the applied weighting schemes, the country rankings, tier memberships, and CAGR values under each scheme are compared with those obtained under the baseline equal-weight CSI. In this way, a quantitative assessment of the sensitivity and stability of the results is achieved.
3.5.2. Alternative Normalisation: Z-Score vs. Min–Max
Z-score normalisation is less sensitive to extreme values compared to min–max normalisation and is recommended for asymmetric distributions [
42]. Here we also apply an alternative calculation of the indices, this time using z-score (standardization) normalisation according to the following formula:
where
μx and
σx are the mean value and standard deviation of each indicator for the EU-27 countries over the period of 2015–2024. It should be noted that as in the baseline specification, the emission indicator is inverted prior to standardization.
After applying the z-score normalisation, the indices GSI, ESI, PSI, BSI, and CSI are calculated again. The resulting indices and the baseline indices are then compared through:
Rank correlations of CSI between min–max and z-score normalisation;
Stability of sustainability tiers;
Tier–growth patterns (S-curve).
3.5.3. ±10% Perturbation Sensitivity
Conducting a perturbation-based robustness analysis of the constructed indices [
10,
29] represents only part of the sensitivity tests used. In addition, a one-factor-at-a-time ±10% perturbation is applied to each individual indicator, while the others are held constant. This is implemented by generating a perturbed series for each indicator (for example, greenhouse gas emissions) through the following:
After this procedure, all indices are recalculated again using the normalised results for these perturbed values. The quantitative evaluation of sensitivity is assessed through Spearman rank correlations of CSI and membership in sustainability tiers between the baseline and perturbed scenarios [
42,
57].
3.5.4. K-Means Clustering for Identifying Sustainability Tiers
Clustering groups countries with similar average CSI values over the period of 2015–2024 into four tiers. This allows for the identification of structured differences between states associated with club convergence and institutional lock-in. The underlying logic is that countries do not move randomly along the path toward sustainability. Instead, they form stable “clubs” with similar characteristics. The implementation of K-means clustering allows for the classification of countries to be demonstrated as systematic rather than arbitrary.
For the purposes of the analysis, K-means clustering is performed using the Euclidean distance on time-averaged CSI scores (2015–2024). In this way, four sustainability tiers are identified, consistent with evidence from club convergence studies [
6,
9,
10]. The stability of tier membership is then tested under alternative CSI specifications (as described in
Section 3.4).
3.5.5. Compound Annual Growth Rate (CAGR)
CAGR measures the average annual rate of change of each index over different periods (2015–2019, 2019–2024, and the overall period). This test allows for the assessment of the pace and timing of sustainability transitions.
In the context of the present analysis, for example, H1 assumes that governments lead the early phases of the transition (GSI). If this is indeed the case, CAGR should show higher values for GSI before ESI. Furthermore, this test allows for a direct verification of the structural slowdown hypothesis (H3). This can be achieved by comparing CAGR before and after 2019.
In practical terms, CAGR is calculated for each index and country for the period of 2015–2024 and for the sub-periods of 2015–2019 and 2019–2024, according to the following formula:
where
p represents the period, and
np is its length in years.
As noted above, this approach allows for testing of:
3.5.6. Tier–Growth Correlations (S-Curve Tests)
The presence of S-curve dynamics is considered a characteristic feature of sustainability transitions. This implies that countries with high initial tiers grow more slowly, while countries with lower tiers exhibit faster growth as they approach a new equilibrium.
To test for S-curve dynamics in the present analysis, Pearson and Spearman correlations are calculated between the initial tier of CSI and the subsequent CAGR. This test is crucial for identifying structural regularities and for linking the results to club convergence theory and EKC/S-curve dynamics [
7,
58].
The empirical verification in this case expands the theoretical foundation and strengthens the significance of practical observations. In applied terms, Pearson and Spearman correlations are calculated between initial CSI tiers (2015 or the average of 2015–2016) and subsequent CAGRs, both overall and by tiers.
3.5.7. Integration of Robustness Through Repetition of Analyses Across Scenarios
To integrate all analytical tests, the clustering, CAGR, and tier–growth correlation analyses are repeated for all robustness scenarios (alternative weights, normalisation methods, and ±10% perturbations).
In this way, the sensitivity of the results to methodological choices is evaluated. The structure of the overall analysis makes it possible to verify whether the main conclusions are stable and reliable. This is particularly important in a context where the examined variables have heterogeneous characteristics, ranging from stakeholder hierarchies and structural tiers to the dynamics of sustainable growth.
The set of conducted tests ensures the methodological reliability and validity of the research results. In practice, it demonstrates that the findings are not random or dependent on a specific choice of parameters but are methodologically grounded and empirically validated.
3.6. Limitations and Blind Spots
Despite following established practices for composite indices, the approach has several limitations that are explicitly acknowledged. First, the choice of indicators and weights is inherently normative and data-driven; alternative, equally plausible choices could be made, although robustness tests suggest that they would not overturn the main qualitative patterns. Second, the use of outcome indicators as proxies for stakeholder behaviour (especially in the case of BSI) reflects current data constraints and may blur the distinction between environmental state and actor contributions. Third, the SDG Index, while rich, is itself a composite measure with its own weighting and indicator choices, which are inherited here without modification. Fourth, the analysis is descriptive rather than causal: it identifies robust patterns in trajectories, tiers, and growth relationships but does not estimate causal effects or perform formal hypothesis testing through panel regressions. Finally, the ±10% perturbation tests capture moderate measurement errors and data revisions but do not simulate radical regime-changing shocks, which would require additional scenario-based approaches.
4. Results
4.1. Stakeholder Trajectories and Descriptive Patterns (H1 and H3)
The descriptive analysis of the results for all indices (related to the respective stakeholder groups—GSI, ESI, PSI, BSI, and the composite CSI) indicates an overall increase during the period of 2015–2024. This applies to all countries included in the sample. It should be noted, however, that this average dynamic manifests in different ways and at varying speeds. This is not a simple mechanical parallel growth. A kind of “stratification” of the trajectories is observed. For instance, some indices rise sharply and then slow down, others move steadily over the period, while a third group almost “stalls” after a certain point. This difference becomes particularly evident when the overall period is divided into two sub-intervals—before and after 2019. The year 2019 is precisely the point at which the dynamics visibly change direction. In line with the expectations from the multi-level perspective, the trajectories do not form a single uniform “transition path” but rather a set of multi-speed movements across distinct regime configurations (tiers).
GSI exhibits moderate growth during 2015–2019, especially in Tier 1 and Tier 2 countries, where government environmental expenditure as a share of GDP increases earlier or in parallel with improvements in ESI. This pattern is consistent with H1 in the sense that in higher tiers, governments tend to assume a leading role as regime actors, using fiscal efforts to destabilise carbon-intensive configurations and open space for renewable and circular options. After 2019, however, GSI growth slows down or flattens in many countries, suggesting fiscal and political constraints and possible “policy fatigue” [
59].
The fastest-growing index on average across the EU-27 countries is the ESI. It captures the effect of expanding renewable energy sources, improving the circular use of materials, and the gradual decline in emission intensity. This acceleration, however, is not without limits. In MLP terms, this can be read as a phase in which niche and regime innovations in energy and material systems diffuse relatively quickly under policy and market pressure. Similar to the government indices, a noticeable slowdown is observed after 2019, likely reflecting the exhaustion of “easy” technological improvements and the emergence of new barriers. In practice, such a conclusion is entirely consistent with other studies on the topic in the scientific literature [
51].
To identify socio-institutional changes, the PSI was constructed and calculated based on the SDG Index. Its variation across countries and periods is relatively smooth, including in both sub-periods. Such dynamics confirm that social structures, health systems, and institutional quality evolve more slowly [
4]. These social spheres are more inertial, and thus, sharp surges or significant declines are logically absent. PSI shows the slowest and smoothest trajectory: its gains are smaller and less differentiated across sub-periods and tiers. This suggests that social and institutional outcomes (captured by the SDG-based PSI) adjust more slowly than environmental outcomes and governmental efforts, in line with the idea that deep changes in norms, institutions, and social structures require longer horizons and more cumulative pressure.
The BSI effectively duplicates the ESI, as in this version of the study both indices are derived from the same group of environmental performance indicators. The distinction between them is conceptual: the BSI “interprets” environmental outcomes through the lens of business and production practices, while the ESI reflects the state of the environment itself. Numerically, this means that their trajectories are identical, but in interpretive terms, they allow for a separate discussion of the role of firms and of the overall environmental outcome. However, when read through the stakeholder lens, BSI emphasises the production and business side of these environmental outcomes. The strong growth of BSI in the pre-2019 period indicates that firms and production systems respond relatively quickly to policy, price, and technological signals, while the slowdown after 2019 suggests that further decarbonisation and circularity require more profound reconfiguration of business models and infrastructures.
These dynamic patterns over the period partially support H1. In many countries, the GSI began to increase slightly earlier or approximately in parallel with the ESI during the sub-period of 2015–2019. This can be explained by the presence of a preliminary policy response, followed by a period of “catching up” on the part of actual environmental results. Nevertheless, the relationship of “who leads whom” is not uniform across all tiers and becomes noticeably blurred after 2019. In some cases, environmental outcomes continue to improve while fiscal efforts stabilize; in others, the two lines almost diverge. In other words, in higher tiers, government effort (GSI) often precedes or closely accompanies the acceleration of environmental outcomes (ESI/BSI), while in some lower tier countries improvements in ESI/BSI occur with weaker or delayed increases in GSI, pointing to a stronger role of EU-level and market pressures than of domestic fiscal activism. PSI adjusts more slowly everywhere, reinforcing the idea of a multi-speed transition across stakeholder domains.
The main characteristics of the dynamic changes in the calculated indices are presented in the following
Table 1.
4.2. Sustainability Tiers and Institutional Immobility (H2)
To identify the tiers of sustainability, K-means clustering was performed on the CSI (with min–max normalisation and equal weights). As a result, four distinct tiers clearly emerge. It should be noted that the resulting grouping is not a random statistical construct. The formed sustainability tiers exhibit logic both in terms of geography and institutional history (see
Table 2). In this structure, the Scandinavian and Western countries in Tier 1 demonstrate the best performance. The Southern and Central European states are grouped in Tiers 2–3, showing similar characteristics. The final Tier 4 encompasses the “catching-up” countries—the Eastern European states. This configuration corresponds to already-established patterns from the literature on club convergence in emissions and indicators related to the Sustainable Development Goals [
6,
9,
10].
Within each of the tiers, there is, of course, internal movement. Thus, for example, the values of ESI and GSI vary substantially across individual countries. With regard to the dynamics of change in the individual indicators, however, it is particularly important to note that membership in a given tier practically does not change over the study period of 2015–2024. If a strict definition of “sustained change” is applied (for instance, at least three consecutive years in another tier), no country exhibits a persistent shift between different tiers. This highly static behaviour supports H2 and is expected in the context of the concepts of lock-in and path dependence in institutional and socio-technical regimes. According to these concepts, once formed, a given combination of institutions, technologies, and behavioural norms tends to remain exceptionally stable over time [
3,
8,
14,
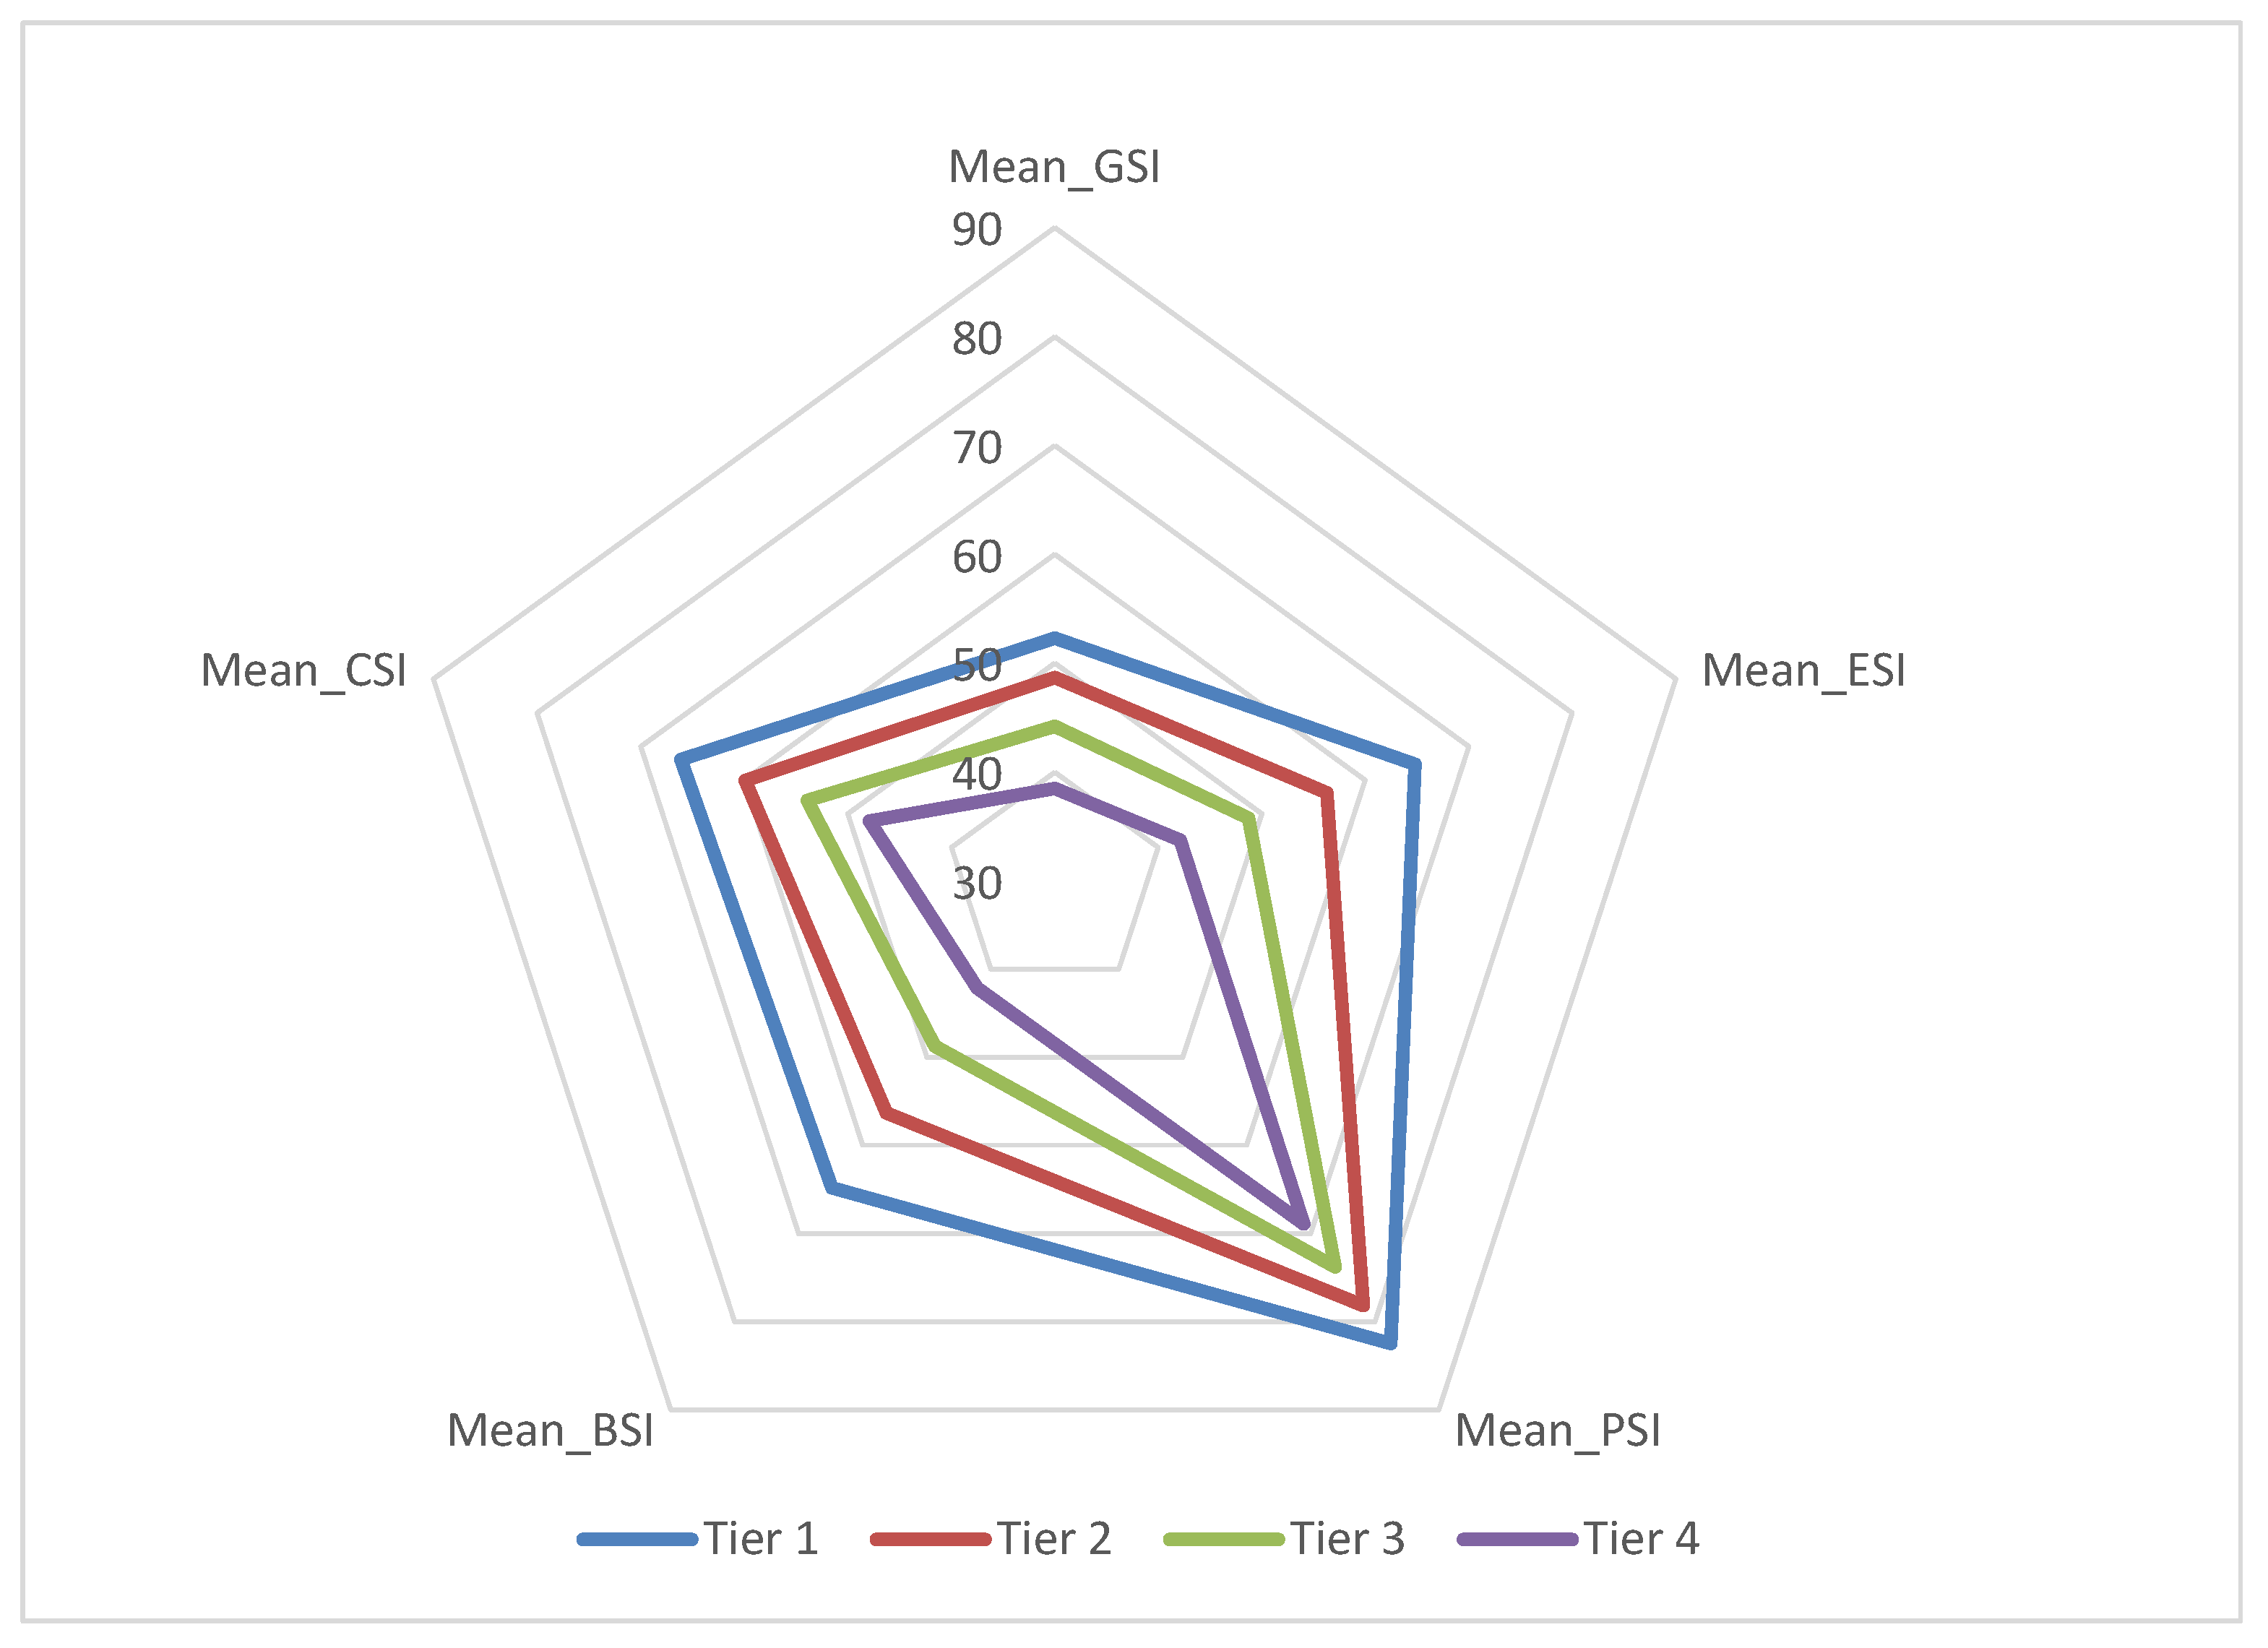
15]. In this way, the ordering of the tier “centroids” remains stable, with Tier 1 consistently dominating in terms of average CSI, followed by Tier 2, Tier 3, and finally Tier 4 (see
Figure 2). A stable hierarchy thus emerges that is not disrupted by short-term shocks and cycles.
These patterns can be illustrated more concretely through the behaviour of individual countries within each tier. A typical Tier 1 country is Sweden, which combines very high initial CSI levels with relatively modest subsequent growth. This profile is consistent with a “mature” low-carbon regime in which most low-hanging improvements have already been implemented and additional progress requires more complex and costly transformations. Spain, in turn, is representative of Tier 3. It starts from intermediate CSI levels and demonstrates noticeable, but not spectacular, catch-up, with stakeholder signals that are more mixed and uneven across domains. A typical Tier 4 country is Bulgaria, which begins the period with very low CSI values but records relatively high growth rates without closing the gap to Tier 1. This persistent lagging reflects enduring structural differences, including the legacy of economic transition and more limited institutional capacities.
Summarizing, the clustering identifies four sustainability tiers with a clear ordering of average CSI values and a characteristic regional and historical composition. High-income Northern and Western countries form Tier 1, Southern and some Central states occupy Tiers 2–3, while Eastern and catching-up economies are concentrated in Tier 4. In MLP terms, these tiers can be seen as distinct regime configurations with different degrees of alignment between technologies, institutions, and stakeholder coalitions.
Crucially, tier membership is almost entirely stable over 2015–2024: no country exhibits a sustained upward or downward shift when stability is defined as at least three consecutive years in a different tier. This institutional immobility provides strong support for H2 and is consistent with path dependence and lock-in: once a country is embedded in a particular combination of socio-technical regime, institutional architecture, and stakeholder power balance, it tends to remain there despite common EU-level landscape pressures. Within tiers, ESI and GSI levels vary, but the ordering of tier centroids (Tier 1 > Tier 2 > Tier 3 > Tier 4) remains robust.
The MLP interpretation by stakeholder reveals the following:
In Tier 1, regimes are high performing but relatively rigid: government, business, and population outcomes are all strong, yet further improvements are incremental and face diminishing returns.
In Tier 2–3, regimes show mixed alignment: government and environmental domains often move ahead of social outcomes, with stakeholder responses more unevenly coordinated.
In Tier 4, regimes are characterised by lower baseline performance but faster growth, reflecting both catch up and the persistence of structural constraints linked to economic transition and institutional capacity.
These results can also be illustrated through specific behavioural patterns at the level of individual countries. Sweden, as a typical Tier 1 country, exhibits very high initial CSI values and relatively modest subsequent progress—behaviour characteristic of a stable, mature, low-carbon regime in which the measures delivering rapid and visible results have already been implemented and each additional step requires greater effort and higher costs. Spain, a typical Tier 3 country, starts with moderate CSI levels and demonstrates moderate catch-up, with mixed signals across stakeholder dimensions. Bulgaria, as a representative Tier 4 country, begins from extremely low CSI levels but records relatively high growth rates over the period; despite this progress, it does not manage to close the gap with Tier 1 countries, reflecting persistent structural differences and institutional constraints.
These patterns are consistent with club convergence results in environmental and SDG-related indicators and support the view that EU sustainability transitions unfold across multiple, relatively locked-in regime configurations rather than converging to a single equilibrium.
4.3. Stakeholder Response Speeds and S-Curve Dynamics (H1 and H3)
Using compound annual growth rates (CAGRs), it is possible to clearly assess the “hierarchy of speeds” among the indices. The corresponding data are presented in
Table 3. The environmental index ESI, across all tiers, exhibits the highest average CAGR values during the initial sub-period (2015–2019). This pattern effectively reflects the accelerated deployment of renewable capacities, improvements in circularity, and the gradual reduction in emission intensity (which is, in fact, also predetermined by the construction of the index itself). From an MLP standpoint, this suggests a phase of accelerated regime adjustment in the environmental/production domain, where niche innovations and policy incentives have already penetrated mainstream energy and material systems.
GSI grows more moderately and shows greater cross-country dispersion: some countries significantly increase environmental budgets, while others remain almost flat. This indicates that government effort is a necessary but not sufficient driver, and that fiscal and political capacities differ across regime configurations. PSI shows the smallest CAGRs, fairly similar across tiers, highlighting the slow pace of change in social, institutional, and distributive dimensions. CSI, as an aggregate index, reflects intermediate growth patterns.
The GSI grows at a relatively moderate pace and exhibits greater cross-country differentiation, reflecting heterogeneous political priorities and fiscal constraints. The PSI is the slowest changing of all indicators, with the lowest CAGR values across all tiers, consistent with the tendency of social, institutional, and distributive dimensions to adjust gradually rather than shift abruptly between regimes. The aggregate CSI averages these component behaviours, yielding moderate and intermediate growth relative to the individual indices.
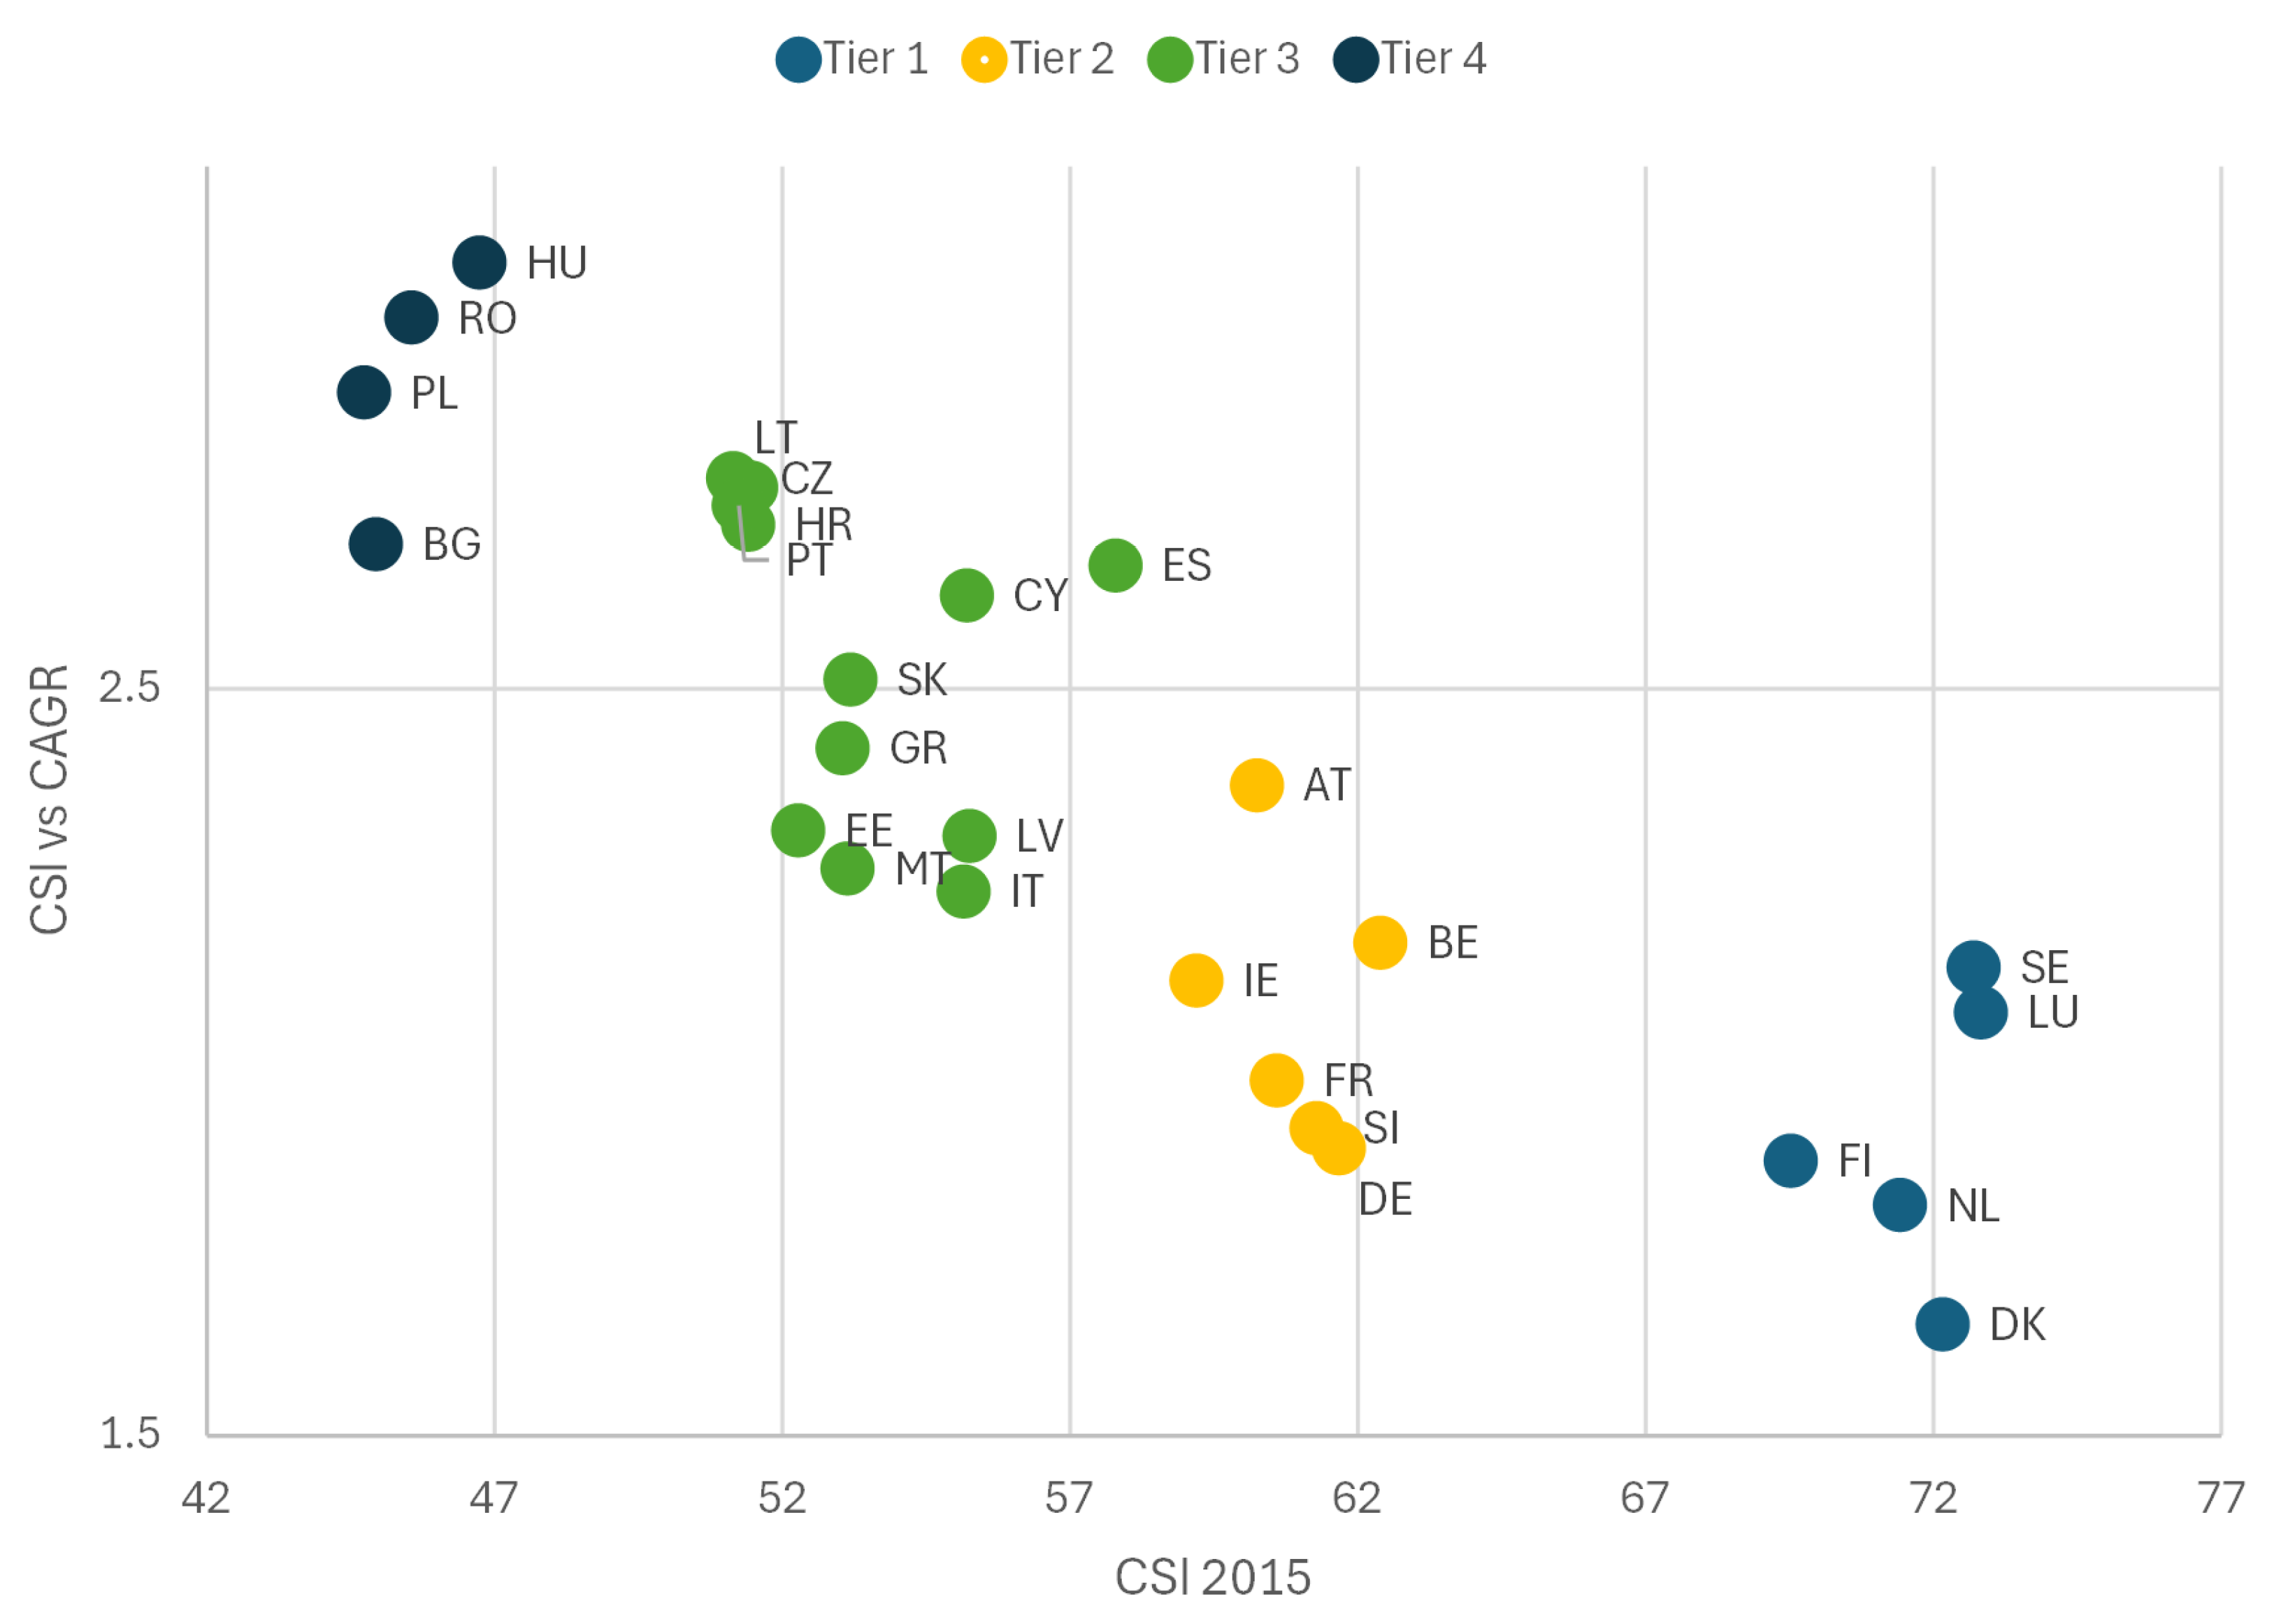
Across all tiers and indices, average growth rates are lower after 2019, confirming H3. This structural deceleration is consistent with established findings in the literature: early “low-hanging” improvements are rapidly harvested in the first sub-period, while later progress requires more complex, contested, and costly transformations. The correlation analysis between the initial CSI level (2015) and subsequent CAGR (2015–2024) reveals strong negative relationships, particularly for Tiers 3 and 4—countries starting from lower sustainability levels grow faster, while leaders advance more slowly. This is an expression of a classic S-curve pattern analogous to EKC dynamics and is also visible in
Figure 3.
Comparing 2015–2019 with 2019–2024 confirms H3: for all indices (GSI, ESI, PSI, BSI, and CSI) and across all tiers, CAGRs are systematically lower after 2019. This structural deceleration is consistent with the idea that early phases of the transition exploit low-hanging efficiency gains, while subsequent phases face rising marginal costs, more entrenched institutional constraints, and the disruptive effects of shocks such as the pandemic and the energy crisis.
The correlations between initial CSI (2015) and subsequent CSI CAGRs (2015–2024) are strongly negative, especially in Tiers 3 and 4. This S-curve-type pattern implies that countries with higher starting sustainability levels grow more slowly, while those starting from lower levels grow faster but do not fully catch up, in line with Environmental Kuznets-type dynamics for composite sustainability.
Each stakeholder starts from a different initial level and moves at a different pace. As a result, the outcomes make it possible to “read” the S-curve differently for each of them.
For governments (GSI), countries in the higher tiers typically already have high initial index values. This means that a significant share of the easy, “obvious” policy steps and budget increases has already been implemented. For this group of countries, additional growth is more limited and slower. In such cases, the system is closer to the plateau of the S-curve. In countries located in the lower tiers, the situation is at the opposite extreme. These countries have more room for rapid expansion of government efforts, but this potential faces a number of challenges. At least within the context of this model, such challenges are assumed to stem from factors such as fiscal constraints, administrative capacity, and political risks. All of these substantially hinder the achievement of “accelerated catch-up.”
With regard to the environment and business (ESI and BSI), the fastest initial growth is observed precisely in the lower tiers. There, energy and material systems are catching up in terms of renewable sources, energy efficiency, and the circular economy. All these conditions shift the index upward toward the steeper part of the S-curve. Nevertheless, even at such high growth rates, full convergence with leading countries is not achieved. Differences in financing, infrastructure, technology, as well as institutions clearly persist and gradually “flatten” the curve.
For the population/social sphere (PSI), the S-curve is much less pronounced. Social convergence proceeds more slowly and smoothly. It involves changes in the quality of institutional performance, the effectiveness of social services, progress in reducing inequalities, and improvements in overall well-being. All of these processes respond less strongly to short-term shocks and even to intensive policy measures. This is because they require long-term accumulation of trust and transformation of social capital. Therefore, the social component remains more inert and lags behind the more rapidly evolving environmental and technological dimensions.
Overall, these findings provide descriptive support for H1 (partial government leadership in early phases) and strong support for H3 (structural slowdown) and align with the MLP notion of transitions moving from acceleration to plateau phases as regimes stabilise at new configurations.
4.4. Robustness Checks for Composite Index Construction (H4)
To assess the stability of the composite indices in the empirical model with respect to specific methodological choices, a set of robustness tests was applied (see
Section 3.4 of this article). The overall outcome of their application supports the view that all estimates related to the structure of the tiers, the S-curve relationship between tier and growth, and the hierarchy of stakeholder reactions remain stable across all scenarios. This general finding fully corroborates the initial H4. A summary of the results of these robustness tests is presented in
Table 4.
4.4.1. Alternative Weighting Schemes Results
When comparing equal weights, Gov-heavy, Env-heavy, and PCA-based weights, several important regularities emerge. First, country rankings by CSI under the different schemes are highly correlated, with Spearman ρ exceeding 0.95 for all years. This implies that the global ordering changes very little as a result of modifying the weighting scheme. Another important finding is that tier membership is very stable. This follows from the observation that even under extreme Gov-heavy or Env-heavy weights, at most 2–3 countries “jump” to an adjacent tier, while no drastic movements from Tier 4 to Tier 1 (or vice versa) are observed at all. Finally, the ordering of CAGRs by tiers and indices is also preserved. The ESI remains the fastest-growing index in 2015–2019, and the post-2019 slowdown continues to be evident. This type of robustness is consistent with the literature on composite indices [
29,
42,
60], which suggests that weights within a reasonable range primarily affect fine-grained rankings rather than the overall structure of groups and leaders. This is fully in line with H4 of the present study. Importantly, the stakeholder response hierarchy (ESI > GSI > PSI) and the post-2019 slowdown remain clearly visible across all weighting scenarios, indicating that the multi-speed stakeholder dynamics are not an artefact of a particular weighting choice.
4.4.2. Z-Score vs. Min–Max Normalisation
The general descriptive conclusions drawn above do not change when a different normalisation method is applied. Recomputing the indices using z-score normalisation instead of min–max does not alter the overall picture. CSI rankings under the two normalisation methods exhibit a very high correlation (ρ > 0.97), and the tier structure is practically replicated. This is particularly true for the four identified tiers, which emerge in the same way, with at most one “borderline” country switching between Tier 2 and Tier 3. The S-curve pattern describing the relationship between initial tier and growth is also preserved. A careful inspection of the data shows that regression coefficients and intercepts change slightly, but the sign and strength of the relationship remain stable. Here too, the findings are consistent with other studies, which indicate that for well-behaved indicators, the choice of normalisation is secondary compared with the choice of weights [
29,
42].
4.4.3. ±10% Perturbation Sensitivity Results
The final robustness test likewise yields no surprises. In the sensitivity tests with ±10% perturbations applied to individual indicator series, the composite CSI responds moderately. The average absolute change is below 2 points on a 0–100 scale. Rankings relative to the baseline specification remain highly correlated (ρ > 0.95), and tier membership is almost unchanged, with fewer than 5% of observations switching tiers and these shifts limited to adjacent tiers. The CAGR estimates and the ordering of reaction speeds (ESI > GSI > PSI) are practically unaffected, and the previously formulated observations and conclusions remain fully valid. This stability indicates that the indices are not particularly sensitive to realistic measurement errors, data revisions, or noise, again in line with other analyses of perturbation sensitivity in composite indices [
29,
57]. The stakeholder speed hierarchy and the deceleration after 2019 are virtually unaffected.
The combined outcome of the three groups of tests supports the claim that the main empirical findings are not a “product” of a specific technical configuration but instead reflect stable structures in the data. Consequently, the obtained results do not depend on technical adjustments to the design of the empirical model.
4.5. Temporal Dynamics and Governance Interpretation
The overall conclusion from the analysis is that the pace of sustainability progress in the EU has slowed after 2019. The additional checks provided by the robustness tests indicate that this deceleration does not disappear when weights or normalisation are changed, or when moderate noise is introduced into the data. The leading countries continue to perform well in absolute terms but enter a phase of slower and more demanding improvements. In turn, the catching-up countries accelerate their progress in implementing green policies, yet the gap in tiers remains visible. Taken together, these observations should prompt clear changes in how the governance of the sustainability transition is conceived.
From an MLP and governance perspective, this robustness is important: it suggests that the identification of multiple sustainability regimes (tiers); the S-curve catch-up pattern; and the differentiated speeds of government, business/environment, and population domains are structural features of the EU sustainability landscape, not products of narrow methodological assumptions.
Relying solely on the expansion of existing policies and funding is clearly not a sufficiently well-founded approach. The results suggest that without deeper changes in the institutional architecture, coordination mechanisms among stakeholders, and incentives for businesses and households, the EU risks remaining “locked” in a slow-moving regime. Building on this core insight, the next section, Discussion, presents arguments for this position grounded in the theory of socio-technical transitions, stakeholder governance, and institutional lock-in. The specific policy recommendations, aimed at differentiated strategies by tiers and actors, are provided in the Discussion of this article.
5. Discussion
5.1. Interpreting Findings in Light of H1–H4
It would be overly simplistic to conclude that the analysis provides an unambiguous and categorical answer to the hypotheses formulated at the beginning of the article. In reality, the empirical results delineate a more complex picture in which a binary “confirmation/rejection” framework is not applicable. Overall, H1 receives partial support, H2 is strongly confirmed, and H3 and H4 find convincing empirical corroboration. This kind of non-equivocal pattern is itself meaningful, as it indicates that not all elements of the sustainability transition in the EU follow the same mechanism or logic. Taken together, these findings suggest that EU sustainability transitions follow multiple, tier-structured trajectories, shaped by differentiated stakeholder roles and institutional lock-in, rather than a single path of smooth convergence.
According to Geels’s multi-level perspective (MLP), policies and public investments can “destabilize” carbon-intensive socio-technical regimes and open up niches for renewable and circular technologies [
2,
17]. The results of the present study, however, show that the temporal profiles of GSI and ESI in many countries in Tier 1 and Tier 2 are such that government environmental expenditures increase during 2015–2019. This occurs in parallel with, or slightly ahead of, the marked improvements captured by the ESI. In this sense, these findings are well aligned with leading MLP studies that emphasize the role of the state as a key actor in the early phases of the transition. At the same time, in some Tier 3–4 countries, a mirror image is observed, whereby ESI growth precedes visible increases in GSI. This suggests that EU-level regulations, autonomous market dynamics, and falling costs of clean technologies can drive environmental outcomes even when national budgets remain relatively inert. These are “externally driven” improvements that correspond to observations about the influence of supranational frameworks and “landscape” pressures in transition studies [
2,
17]. They also confirm that not all change proceeds through a classical model of strong state leadership.
This ambivalence prevents us from treating H1 (governments lead the early phases of the transition) as fully confirmed. At best, its confirmation is only partial. In practice, governments do play a leading role in a number of cases, but the GSI is not a universal “dynamic engine”. Government expenditures on sustainable development are only one of several levels at the regime tier. The joint influence of multiple factors clearly plays a crucial role in shaping ESI trajectories, including EU regulatory standards, price signals, technological dynamics, and likely several other drivers. So, the time profiles of GSI and ESI show that in many Tier 1 and Tier 2 countries, government environmental expenditure increases during 2015–2019, in parallel with, or slightly ahead of, improvements in ESI. This pattern is consistent with the idea that regime actors (national governments in this case) can play a leading role in destabilising carbon-intensive socio-technical regimes and opening windows for niche innovations, as suggested by the multi-level perspective (MLP). At the same time, in a number of Tier 3–4 countries, ESI growth outpaces visible increases in GSI, indicating that EU-level regulations, market forces, and declining technology costs can drive environmental outcomes even when national budgets adjust more slowly. This mixed evidence means that H1 is only partially supported: governmental budgets are an important, but not exclusive, regime lever, and their leadership role depends on tier-specific capacities and constraints.
The hypothesis of club convergence and institutional lock-in (H2) receives much stronger support. Clustering on the CSI identifies four stable tiers of sustainability with virtually zero mobility between them during the entire 2015–2024 period. This grouping is fully consistent with the logic of the club convergence literature [
9,
10]. The core idea is that countries do not “merge” into a single group but rather form distinct clubs with different long-run equilibria. In the empirical model and clustering implemented in this article, such clubs are indeed identified. Moreover, they do not differ substantially from the convergence clubs found for ecological footprint and emissions in the EU, which also highlight persistent differences in institutional quality, technological structure, and political styles [
9,
61]. In MLP terms, these tiers can be interpreted as distinct regime configurations that absorb landscape-level pressures (e.g., EU Green Deal and global climate agenda) in different ways without collapsing into a single homogeneous regime. The stability of tier membership aligns with theories of path dependence and lock-in: existing institutional architectures, policy styles, and stakeholder coalitions limit how quickly and how far countries can move, even under shared EU rules. This finding suggests that EU sustainability transitions are better understood as a set of parallel regime trajectories embedded in different institutional contexts rather than as a uniform convergence process.
From the perspective of institutional theory, the stability of tiers and the absence of “jumps” upward or downward also point to consistency with the concepts of path dependence and institutional lock-in [
3,
14,
15]. In broad terms, these views hold that once established, institutional architectures, coalitions, and regimes exhibit strong inertia and constrain both the pace and direction of change. In this regard, the results fully confirm previous research.
The evidence for H3 (structural slowdown) is sufficiently strong to allow for an unambiguous assessment. The CAGR for all indices is systematically lower in 2019–2024 than in 2015–2019 across all tiers. This deceleration is consistent with S-shaped transition dynamics: initial phases deliver rapid gains from efficiency improvements and technology diffusion, while later phases require more complex, contested, and costly transformations in infrastructures, markets, and institutions. It is also compatible with post-2019 shocks related to the pandemic, economic slowdown, and energy/geopolitical crises. So that strains public finances and tests the resilience of existing regimes. Moreover, this analytical pattern remains stable under alternative weights, different normalisation methods, and ±10% perturbations. This indicates that the underlying drivers are structural factors rather than purely cyclical fluctuations. Consequently, the need emerges for a policy focused on model variables related to rising marginal decarbonization costs, the exhaustion of “easy” measures, institutional fatigue, and post-COVID shocks. This dynamic is fully consistent with intuitive expectations derived from S-shaped transition curves and with the Environmental Kuznets Curve (EKC) literature, which describes phase-differentiated relationships between economic growth and environmental indicators [
7,
46]. Although the specific approach applied here does not directly reproduce a classic income-based EKC, the correspondence is conceptual: initial improvements can be rapid, while subsequent steps require deeper and politically more demanding changes.
Regarding the hypothesis on the robustness of the main patterns (H4), it too is convincingly confirmed. Variations in weights, normalisation methods, and input values have minimal impact on the core analytical results related to the tier structure, the negative relationship between initial tier and growth, and the ordering of reaction speeds among different stakeholder groups. In this sense, this increases confidence that the observed patterns reflect structural features of EU sustainability trajectories rather than artefacts of specific index construction choices.
5.2. Theoretical Implications for Transition and Governance Research
The results obtained naturally steer the discussion toward several key theoretical debates on sustainability transitions and governance within the EU. The first concerns the persistence of tiers and the S-curve relationship between initial tier and growth. In our case, the answer is that socio-technical transitions unfold along multiple pathways rather than a single convergent trajectory. Distinct groups of countries emerge, with clustering positioning them in relatively stable configurations: high-performing but slow-moving regimes, low-performing systems with relatively rapid yet still insufficient progress, and a balanced group of countries with intermediate performance and catching-up growth. In MLP language, the EU appears not as one unified regime but as a set of regime configurations (tiers) that respond differently to the same landscape pressures (such as global climate goals, EU legislation, crises, etc.) and that remain separated by institutional and structural boundaries. High-tier regimes are high performing but slow moving; mid-tier regimes exhibit mixed performance and catch up; low-tier regimes show faster growth but remain distant from the frontier. This multi-path pattern resonates with extensions of the MLP that emphasise contested transition pathways, power relations, and asymmetric capacities across actors and contexts.
The scientific literature documents such multiple transition pathways, highlighting the role of power, conflict, and politics in diverse regime configurations [
2,
18]. This provides good comparability and coherence between the findings of this study and existing elaborations of the MLP. There is no contradiction with the core logic of the MLP; rather, the results offer a concrete specification for a context often treated as “institutionally unified”, as is the case with the EU.
The relative speeds of GSI, ESI/BSI, and PSI underline a multi-speed transition across stakeholder domains. Environmental and business-related outcomes (ESI and BSI) react fastest; government effort (GSI) is more moderate and uneven; and social and institutional outcomes (PSI) are slowest. From a stakeholder governance perspective, this suggests that technological and infrastructural aspects of regimes can be reconfigured more quickly than social norms, institutional arrangements, and distributive outcomes, even when governments actively support the transition. It also questions linear narratives in which social acceptance and behaviour are expected to follow automatically from technological and policy change.
These country examples are not intended as full case studies, but they help anchor the abstract tier structure in concrete regional and historical contexts. For Eastern Europe, faster growth from low baselines is closely linked to the legacy of post-socialist economic transition and the gradual absorption of EU integration incentives. For Western and Northern Europe, the combination of high starting performance and slower subsequent growth is more consistent with “plateau” effects in mature regimes, where further gains depend on deep infrastructural changes rather than incremental adjustments.
And as one more thing, the robustness of tier structures and S-curve dynamics under alternative index specifications strengthens the argument that institutional lock-in is not a marginal or model-dependent feature but a central constraint shaping sustainability trajectories. Even when composite metrics are perturbed, countries remain in almost the same relative positions, indicating that measurement debates, while important, do not erase underlying institutional stratification. For governance research, this implies that discussions about “better indicators” should be complemented by more direct engagement with the structural and political–economic factors that keep countries in different sustainability regimes.
The overarching conclusion supports the view that institutional and structural heterogeneity continues to generate persistent differentiation [
2,
3,
61]. On the one hand, this confirms more critical readings of transitions that emphasize configurational differences and asymmetries between “core” and “periphery” within broader policy frameworks. On the other hand, these findings do not resonate with studies that assume common regulations and targets will automatically push countries onto similar trajectories (for example, the European Green Deal as a framework for a shared “green” course [
3]). Instead, the empirical evidence obtained here suggests that such an expectation is not borne out.
Another theme that warrants deeper discussion concerns the relative speeds of GSI, ESI, and PSI, and the presence of a multi-speed transition across stakeholder domains. Numerous studies show that technological and infrastructural change can accelerate relatively quickly when appropriate policies and investments are in place, whereas shifts in norms, practices, and social structures proceed more slowly and are often more conflictual [
2,
19,
62]. As a result, it is often assumed that environmental outcomes (ESI/BSI) react fastest, governmental efforts (GSI) more slowly and unevenly, and socio-institutional dimensions (PSI) slowest. According to our results, however, social acceptance and behaviour do not “automatically” follow technological and policy changes. Evidence for this lies in the fact that social indicators remain more inertial even when the ESI improves markedly.
As already noted, the literature treats composite indicators simultaneously as analytical tools and as objects of political “lobbying”. It underscores the position that every metric embodies a particular institutional reality that cannot be “smoothed out” through purely methodological adjustments [
29,
42,
60]. In this respect, the study clearly demonstrates the stability of the tiers and the S-curve. This has been tested under alternative weights and different normalisation methods, and it consistently leads to the conclusion that institutional lock-in is a structural condition rather than a peripheral or model-dependent artifact. Even when composite indices are “shaken” by changing weights or normalisation, countries remain in almost the same relative positions. In the context of governance-oriented research, this implies that debates about the “correct” metric should not overshadow the more difficult question of transforming underlying institutional and political–economic structures.
5.3. Governance Interpretation and Stakeholder Relations
The differentiation of stakeholders within governance processes raises the question of how responsibilities and capacities are distributed across governments, business, and the public. Governments can play a leading role in the early phases of the transition, especially in high-capacity regimes, as also suggested by the partially confirmed H1. At the same time, once a certain tier of ESI has been reached, further progress appears increasingly less sensitive to marginal increases in GSI. From a financial perspective, this pattern points to diminishing returns on fiscal spending and indicates that the “burden” gradually shifts from government action toward behavioural and corporate change [
2,
19]. Governments perform an income-redistribution function, and when they prioritize specific policies, they effectively reallocate fiscal revenues (i.e., resources collected from households and firms) toward priority expenditures. This mechanism goes a long way toward explaining how the “burden” is transferred, even if its manifestation is delayed over time.
As a result, from a governance standpoint, the stakeholder-differentiated indices reveal tensions in how responsibilities and capacities are distributed among governments, businesses, and population. The partial support for H1 indicates that governments can and often do play a leading role in early phases of the transition, especially in high-capacity regimes, but their fiscal and institutional limits become visible as transitions deepen. Once a certain level of environmental performance is reached, additional progress appears less sensitive to marginal increases in GSI alone, suggesting diminishing returns to purely fiscal instruments and a growing need for structural reforms and coordinated stakeholder action.
The testing of H2 and the relative alignment among PSI, BSI, and CSI raises additional questions about stakeholder-based governance. While PSI often correlates more closely with ESI/BSI than with GSI, the results of the analysis do not support the simplified thesis that “citizens and business are ahead while governments lag behind”. Instead, the picture is one of joint movement with asymmetries: in higher tiers, societal and business outcomes tend to be closely integrated with public policy, reflecting coordinated regimes where stakeholder coalitions support the transition. In lower tiers, environmental improvements may be driven more by EU-level frameworks and external pressures than by strong domestic stakeholder coalitions, with PSI and GSI adjusting more slowly.
A stakeholder-specific reading of the governance patterns reveals the following:
Government (GSI): This is a regime actor with strong influence in high tiers but constrained in lower tiers by fiscal, administrative, and political factors;
Business/Production (BSI): This is responsive to policy and market signals, capable of rapid improvements when incentives are aligned but potentially slowed by long-lived assets and sectoral lock-ins;
Population/Society (PSI): This is a slow-moving domain where changes in social outcomes, institutions, and distribution require sustained effort and support from both governments and businesses.
Overall, the findings portray EU sustainability governance as a multi-level, multi-stakeholder system in which roles and speeds are differentiated by tier. Understanding where and how stakeholder coalitions form or fail to form within each regime configuration appears as important as tracking aggregate indicators if the goal is to accelerate and equalise transitions across the European Union.
Countries with high social and business profiles appear to be well integrated with public policy, suggesting a pattern of joint movement with asymmetries rather than straightforward misalignment. At lower tiers, however, environmental outcomes often seem to be driven more by external frameworks (for example, EU standards and financial flows) than by internal stakeholder coalitions. This points to the view that the main catalyst of the transition lies not so much in internal conviction about the benefits and value of sustainable development as in external incentives, or a manifestation of a kind of “imported” transition.
Ultimately, sustainability governance in the EU emerges as a multi-stakeholder regime in which roles and speeds are strongly differentiated across tiers. An analogy can be drawn with the MLP distinction between niche, regime, and landscape: here, internal “regime configurations” become visible. In some coalitions, there is a strong triangle of state–business–society, while in others there is a predominantly vertical dependence on a supranational framework. From a scientific standpoint, mapping these coalitions may prove just as important as tracking the indicators themselves.
5.4. Methodological Reflections and Limitations in Light of Robustness (H4)
Although the comments made so far regarding the robustness tests have focused on confirming the validity of the study’s findings, they also invite several constructive qualifications. For example, regardless of whether equal, Gov-heavy, Env-heavy, or PCA-based weighting schemes are used, the underlying normative question is not fully resolved. Each set of weights implicitly “says” something about which dimension is more important. Composite indices are simultaneously analytical and political instruments [
29,
42,
60]. In this sense, the debate cannot be settled solely through the application of alternative technical solutions. For transition and governance research, this is encouraging. It suggests that diagnoses of institutional immobility, tier-structured trajectories, and structural slowdown are not fragile artefacts of index construction but resilient features visible under multiple reasonable specifications.
Further issues arise from the fact that outcome indicators are used as proxies for business behaviour (BSI), and the broad SDG Index serves as an aggregate measure of “population sustainability”. Normalisation via z-scores corrects some distributional features but does not address such “deeper” conceptual questions. These choices represent an unavoidable compromise given the absence of homogeneous firm-level ESG data and detailed social micro-data for all countries [
63,
64,
65]. One important agenda for future work thus emerges. One of the most significant limitations of the stakeholder framework is that the Business Sustainability Index (BSI) is empirically approximated using the same environmental outcome indicators that underpin the Environmental Sustainability Index (ESI). This means that ESI and BSI are not empirically independent constructs but rather alternative interpretations of a shared block of outcome indicators. The advantage of this choice is that it preserves a conceptually symmetric stakeholder architecture (government, environment, population, and business), which is useful for theorizing governance interactions and stakeholder synergies. At the same time, it is a serious limitation because the BSI still does not capture the full richness of corporate ESG practices (for example, disclosure quality, governance structures, or social performance) [
66,
67]. These practices are explicitly emphasized in the ESG and stakeholder literature [
68,
69], yet in the current index design they are not adequately reflected. For this reason, an important expectation for future research is to complement outcome-oriented proxies with harmonized firm-level ESG indicators. This would help disentangle environmental conditions from business behaviour while preserving the multi-stakeholder perspective.
At the same time, the robustness tests highlight several constraints. All weighting schemes, including PCA-based ones, remain ultimately normative or model dependent and cannot fully resolve debates about the “true” importance of different dimensions. The use of outcome indicators as proxies for stakeholder behaviour, especially in the case of BSI, which shares its empirical base with ESI, reflects data limitations and may blur the distinction between environmental state and actor contributions. Z-score normalisation addresses some distributional issues but does not solve deeper measurement challenges such as the breadth of the SDG Index or the absence of harmonized firm-level ESG data. The ±10% perturbation tests focus on moderate changes and cannot simulate regime-changing shocks or structural breaks.
Despite these limitations, the combination of a coherent, theory-informed index design and systematic robustness testing offers a balanced framework for quantifying sustainability trajectories and institutional inertia in the EU-27 countries. It provides a platform on which more detailed causal and sectoral studies can be built rather than a definitive end point in measuring stakeholder sustainability.
5.5. Methodological Contributions to Composite Index Literature
This study’s CSI setup adds three concrete pieces to the composite index puzzle. It shows that min–max equal weights (based on knocked for PCA/DEA fans [
33,
37]) hold up fine under OECD robustness drills [
29,
39]. The tiers, S-curves, and ESI > GSI > PSI order stay rock-solid (ρ > 0.97) through weight swaps, z-scores, and ±10% shakes, giving real patterns [
32].
Also, stakeholder splits fix a blind spot in EU indices: SDG/EPI scores rank well but hide actor roles key to governance and MLP [
30,
31]. Splitting GSI/ESI/PSI/BSI yet keeping CSI bridges raw benchmarking to why-it-matters stakeholder stories, which were missing till now [
35,
36].
The third but not least, we treat robustness as a core analysis, not a footnote. A 90–98% tier lock-in and steady hierarchies match OECD sensitivity calls [
29], dodging fragility gripes [
34]. The recipe, stakeholder map plus full checks, is ready for copy-pasting in EU transition work, especially sans firm ESG data [
38].
6. Conclusions
The research presented in this article shows that the transition to sustainability among the EU-27 countries possesses the characteristics of a multi-speed process. These different speeds create stable tiers of development and distinct catch-up trajectories among the states. The interaction between the different stakeholder domains—government, business/environment, and population—confirms the presence of structural blockages and institutional inertia, in line with the notion of regime lock-in in the MLP. In this context, the environmental dimensions (ESI/BSI) respond more rapidly than the governmental (GSI) and social (PSI) dimensions. A clear slowdown in the transition to sustainability is observed in the period after 2019, across all tiers and indices. This points to the vulnerability of the transition to external shocks and to rising marginal costs and institutional constraints as regimes approach new equilibria.
For conducting the analysis, indices for governments, businesses, the population, and the environment are distinguished. This composite index approach may be regarded as a tool for integrating the multi-level perspective on sustainability into a quantitative framework. In addition, this allows for direct comparability between individual countries, which significantly improves the analytical relevance of the indicators. The enhancement achieved through the combination of cluster analysis, growth rates, and a results-robustness module enables the assessment of structural changes over time. Importantly, the persistence of sustainability tiers, the S-curve level–growth relationship, and the multi-speed stakeholder hierarchy remain visible under alternative index specifications, reinforcing the conclusion that they reflect structural features of EU sustainability regimes.
In purely practical and applied terms, the results contribute to improving the process of political decision-making. It is clear that more targeted support for the slower groups of countries and better coordination of actions among key stakeholders are necessary. High-tier countries face challenges of diminishing returns and deep lock-in in hard-to-abate sectors, while mid- and low-tier countries require capacity building, infrastructure investment, and institutional strengthening to escape their current clubs. This is not merely a recommendation but a vital necessity if the EU wishes to maintain its leading position in the global transition toward sustainability. So, any serious strategy for accelerating and equalizing sustainability transitions across the European Union will have to acknowledge the existence of multiple regime configurations, differentiated stakeholder capacities, and structural slowdown, and design policies that are sensitive to these realities rather than assuming a uniform starting point and trajectory.