1. Introduction
As the urban rail transit networks continue to grow in scale and complexity, there is an increasing demand for enhanced operational and management. During daily operations, these networks are exposed to a variety of risks, including equipment and facility failures, extreme weather conditions, natural disasters, fires, terrorist attacks, and other unexpected incidents [
1,
2,
3]. Such events can lead to performance degradation or even partial network collapse. Stations with varying levels of importance have vastly different impacts on the rail transit network once damaged. During the operation of rail transit, turnback stations often play a critical role in train reversal, and once they fail, all stations within the turnback section will typically be affected. As of July 2022, Chengdu has operated 12 metro lines, with a total line length of about 518 km, 282 stations, 46 interchanges, and 19 turnback sections. will typically be affected. Therefore, it is essential to identify the importance of rail transit stations during operation and prioritize the protection of stations with high importance rankings [
4,
5,
6]. The identification results provide a theoretical basis for targeted protection, emergency response planning, and resource allocation, thereby enhancing operational safety, reliability, and service quality of urban rail transit systems.
Existing studies on critical station identification methods can generally be classified into static indicator evaluation methods and dynamic indicator evaluation methods [
7,
8,
9]. Static identification methods usually take a single indicator or the weighted value of multiple indicators as the evaluation basis. By calculating topological network indicators such as degree and betweenness centrality to rank stations, these methods are characterized by simple computation. However, they only evaluate individual stations independently, and thus cannot reflect the cascading effects of turnback stations when the network is disrupted, nor can they capture passenger characteristics. Dynamic identification methods, in contrast, simulate station failures by removing nodes from the network and evaluating the resulting impact on network performance [
10], which makes them more consistent with real-world disruption scenarios. However, these methods still predominantly focus on node-level failure and lack consideration of operational constraints such as train turnback arrangements, thereby limiting their ability to represent failure propagation in actual rail transit systems.
In the indicator system for critical station identification, existing studies primarily select evaluation indicators from three aspects: network topology characteristics, network connectivity, and passenger travel service. First, network topology characteristics describe the mathematical structure of rail transit networks and the connection relationships between nodes and edges, reflecting the organizational form of stations and lines, and have therefore been widely used as a basis for identifying key stations [
11,
12,
13]. Second, network connectivity [
14,
15,
16] refers to the connectivity status between stations (nodes) and lines (edges) in the rail transportation network, which reflects the accessibility between stations in the whole network and is directly related to the overall function of the network. Finally, from a service oriented perspective, passenger travel service focuses on the role of stations in meeting travel demand and providing efficient, convenient, and reliable services, emphasizing indicators related to service capacity and operational efficiency [
17]. In addition, recent studies have further highlighted the integration of spatial data and explainable analytics into transportation system evaluation. For example, Lee [
18] introduced an explainable DEA model that decomposes OD-level contributions using game-theoretic concepts, offering deeper insights into system efficiency mechanisms, whereas Alemdar and Yılmaz [
19] proposed a GIS-based multi-source data fusion framework to identify high-risk nodes under flooding scenarios.
Accordingly, static indicator evaluation methods mainly rely on indicators such as node degree [
20], connectivity [
21], the passenger load of stations [
22,
23,
24], while dynamic indicator evaluation methods typically include network efficiency loss and maximum connected subgraph loss [
25,
26], network accessibility [
27,
28,
29], passenger travel time [
30,
31,
32], network passenger transportation [
33,
34] and other indicators. From the practical perspective of network operation, dynamic station identification methods can better reflect the actual impact on the network after unexpected events.
Although these studies have effectively captured key structural and functional characteristics of rail transit networks, most existing approaches still rely on simplified failure assumptions, focusing primarily on individual station removal and overlooking the operational dependencies among stations. As a result, they are unable to capture the section-level impact scope induced by operational adjustments, which may lead to an underestimation of critical stations in real-world rail transit operations. In practice, the impact scope of disruptions is determined not only by network topology but also by operational constraints such as turnback arrangements. Station attributes, such as station type, operational function, and scale, further influence the severity of failure impacts, but remain insufficiently considered in existing studies [
35].
In addition, the operation of urban rail transit networks is fundamentally based on train operations. When a bidirectional operational interruption occurs at a station, transit authorities typically adjust train operation patterns according to the layout of stations with turnback or folding functions within the network. Such adjustments may indirectly force multiple upstream or downstream stations to withdraw from service, even though they are not directly affected by the initial failure [
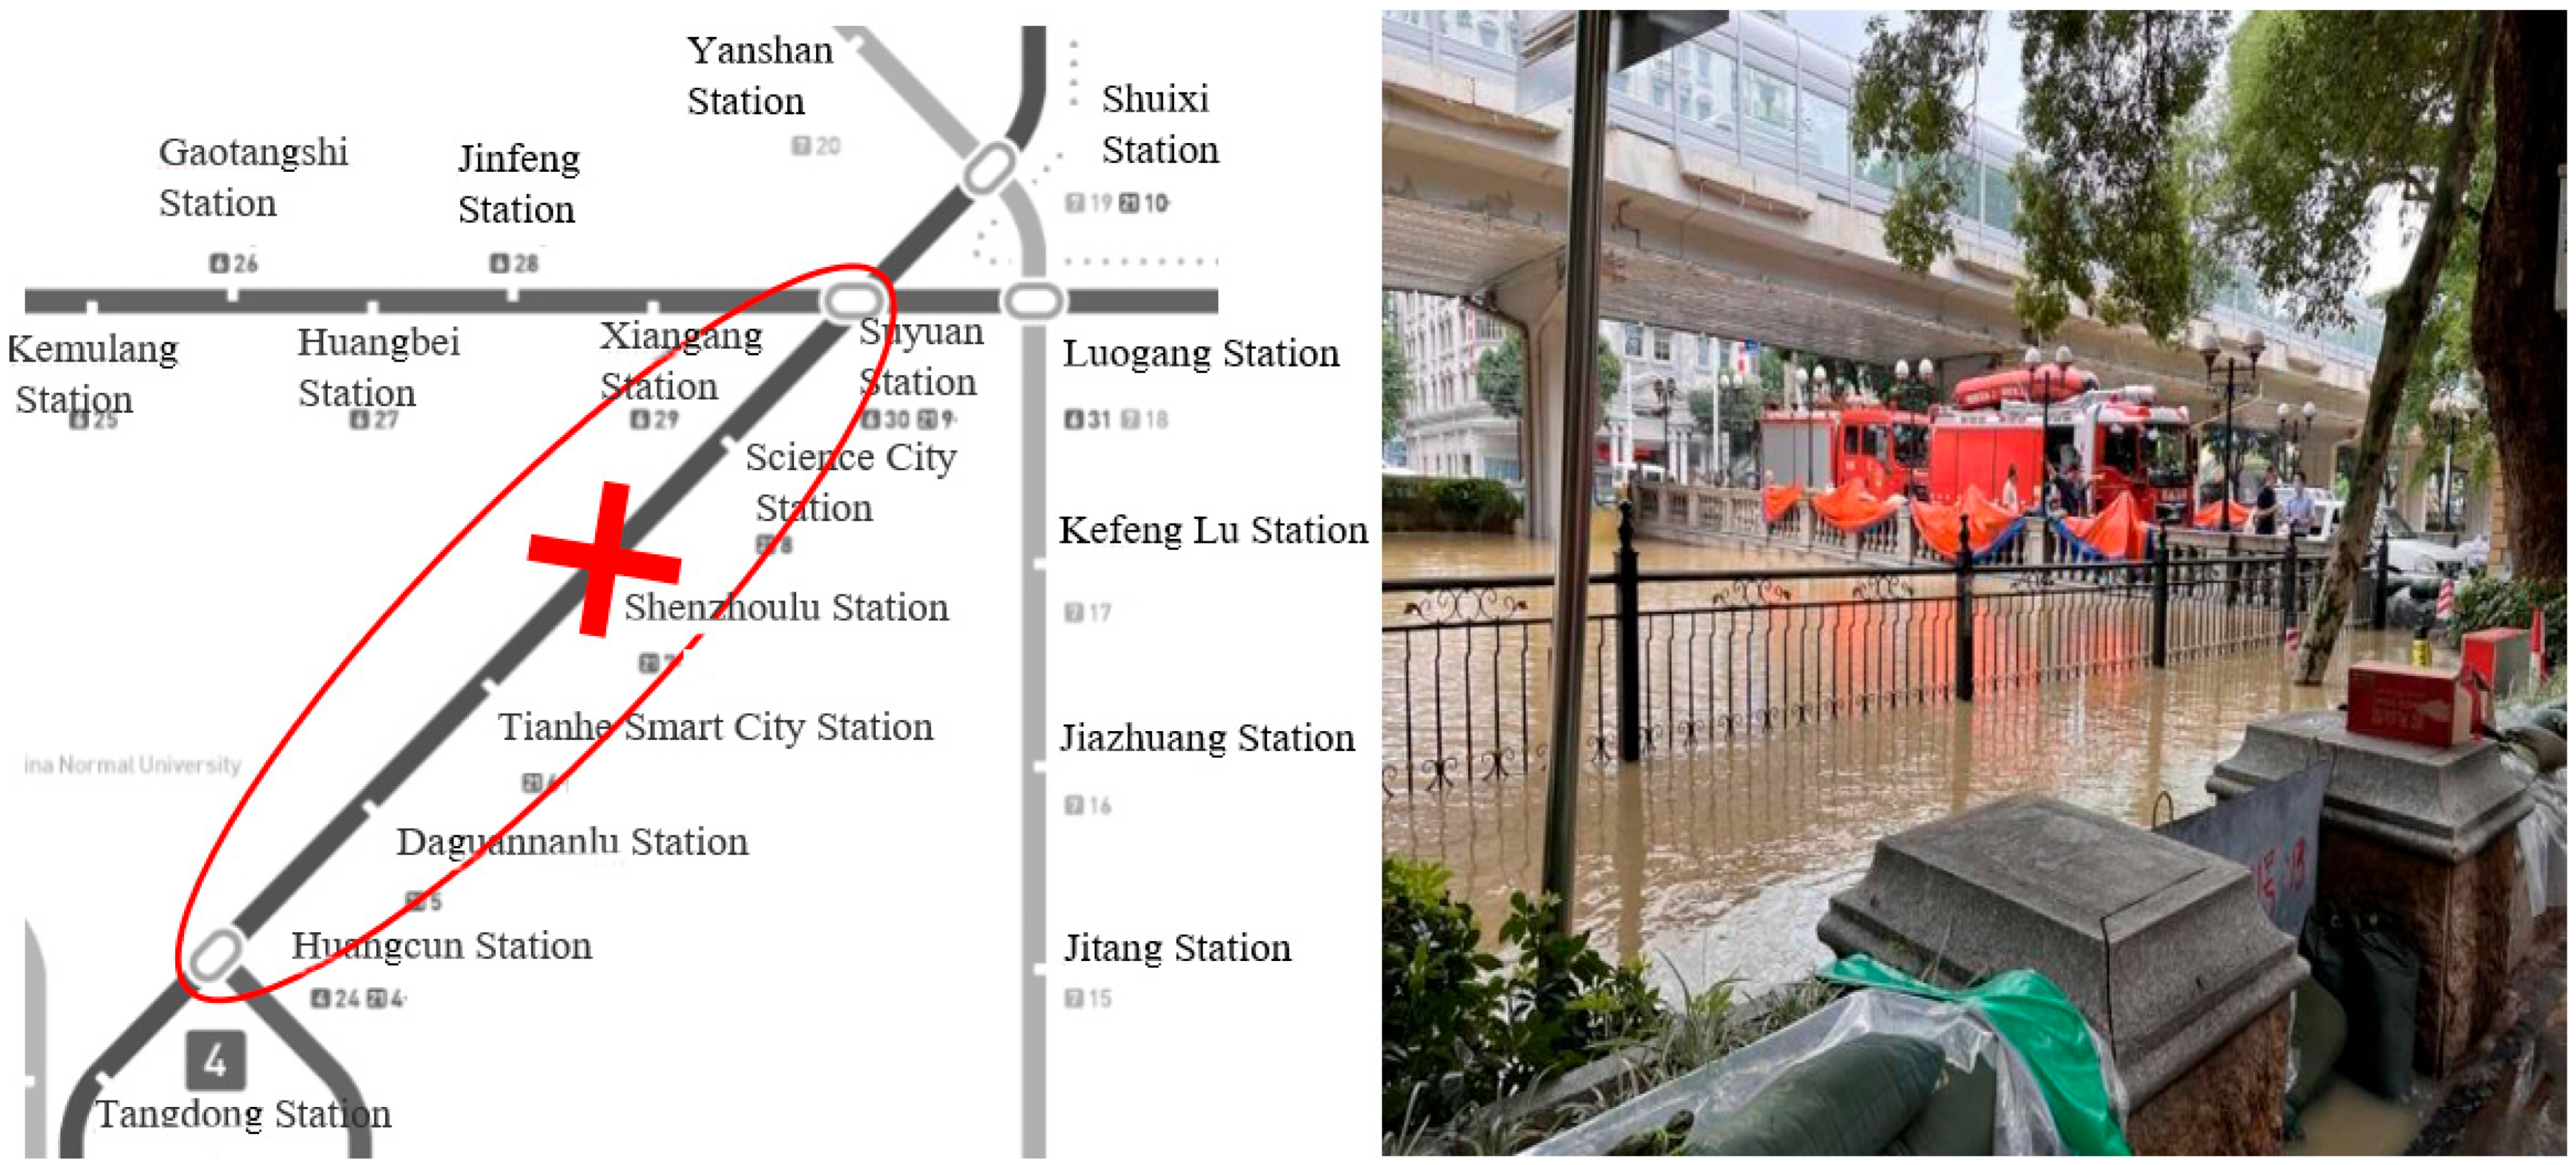
36]. For example, rainwater flooding occurred at Shenzhoulu Station, which is located within the section between Huangcun Station and Suyuan Station on Guangzhou Metro Line 21. Because this station is situated in the middle of the section, the disruption forced an interruption of train services. Huangcun Station and Suyuan Station were consequently used as temporary turnback stations to implement short-turn operations. This led to the complete suspension of all six stations within the affected section for approximately 7 h, causing a direct economic loss of 915,100 RMB [
37].
Figure 1 combines a schematic representation of the affected section and a field observation of the flooding conditions, illustrating both the operational impact and the physical cause of the disruption.
Similar large-scale disruption events have also been observed in other metro systems. For example, during the Zhengzhou Metro Line 5 flooding event in 2021, severe water ingress between Haitansi Station and Shakou Road Station caused train trapping, resulting in 14 fatalities and 5 injuries, and leading to the suspension of the entire metro network [
38].
In addition, the Beijing Metro Changping Line accident in 2023 occurred in the section between Xierqi Station and Life Science Park Station. To facilitate emergency response and rescue operations, the section between Xierqi Station and Zhuxinzhuang Station was suspended, and bus bridging services were implemented. The accident resulted in 130 injuries, including 3 severe and 70 minor cases, and caused a direct economic loss of approximately 9.508 million yuan, significantly affecting passenger travel along the corridor [
39]. These cases collectively demonstrate that disruptions in urban rail transit systems often lead to measurable impacts in terms of affected stations, service duration, casualties, and economic losses. More importantly, disruption effects frequently propagate across continuous operational sections rather than remaining confined to a single station. Such propagation is closely associated with operational constraints, particularly turnback arrangements and train circulation adjustments. Therefore, modeling disruptions at the section level is essential for accurately capturing the real-world impact of station failures.
However, existing dynamic evaluation methods usually simulate station failures by removing only the failed station itself, without accounting for the indirect failures induced by train operation adjustments. Although dynamic evaluation methods are generally more capable of capturing network responses to disruptions than static methods, especially under emergency scenarios [
40], they still fail to fully reflect the fact that network connectivity is constrained by train operability and operational organization. As a result, their applicability to reality world operational decision making remains limited.
Train operation interruptions can exert far reaching impacts on urban rail transit systems. Once a station experiences a bidirectional interruption, the disturbance is no longer confined to the failed station itself, but propagates through train operation adjustments such as turnback reorganization and service suspension of adjacent sections. These cascading effects may lead to large scale service disruptions, reduced network connectivity, and significant deterioration of passenger accessibility. Therefore, understanding and modeling the impacts of train operation interruptions is essential for accurately identifying critical stations and for supporting effective operation management and emergency response in urban rail transit networks.
In summary, existing critical station identification studies in urban rail transit have shown a clear evolution from static, topology-based evaluation to dynamic, performance-oriented assessment. Correspondingly, the indicator system has gradually expanded from traditional topological measures to a more comprehensive framework incorporating network topology, network connectivity, passenger travel service, and disruption-induced performance degradation. Although this transition has improved the realism of station importance evaluation, most existing methods still simplify disruption scenarios by considering only the failed station itself, without adequately reflecting the indirect failures caused by train operation adjustments in actual rail transit systems. In practice, when a two-way operational interruption occurs, especially at stations related to turnback operations, the affected range often extends beyond the failed station and propagates to multiple adjacent stations and sections. Therefore, from the perspective of real-world operation management, it is necessary to further develop a dynamic critical station identification method that explicitly considers train turnback operations and the associated failure range. In this context, the objective of this study is to develop a critical station identification method that incorporates turnback-induced failure propagation within operational sections under bidirectional disruptions. To achieve this objective, an improved node removal strategy is proposed to extend the failure scope from individual stations to operationally coupled sections, and a comprehensive evaluation framework integrating network connectivity, network topology characteristics, and station attributes is constructed based on the TOPSIS method. By aligning the methodological design with the identified research gap, this study aims to provide a more realistic and operation-oriented assessment of station importance in urban rail transit networks.
The remainder of this paper is organized as follows.
Section 2 introduces the modeling of network topology and defines the failure scope under bidirectional operational disruptions considering turnback operations.
Section 3 presents the proposed methodology and evaluation framework, describing the selection of evaluation indexes and the comprehensive evaluation method of node importance.
Section 4 applies the proposed method to the network of Chengdu (2022) and analyzes the results. Finally, conclusions and future work are provided in
Section 5.
3. Key Site Identification
In this study, key stations in an urban rail transit network refer to those whose failure may cause network segmentation, service interruption, or a significant reduction in operational accessibility, thereby exerting a substantial impact on the continuity of network operation. The criticality of a station is therefore reflected by the extent to which its failure disrupts network integrity and service continuity. In general, stations that induce a larger affected range and more severe operational consequences after failure are ranked higher in the identification results.
However, evaluating station importance solely based on network connectivity indicators may lead to biased or incomplete results, especially under bidirectional interruption scenarios. Stations located within the same turnback section often exhibit similar connectivity impacts when failures are simulated using traditional node removal methods. As a result, it becomes difficult to distinguish the relative importance of different stations within the same return section, even though their operational roles and indirect failure consequences may differ substantially in practice.
To address this limitation, this study constructs a comprehensive station importance evaluation framework by integrating three complementary perspectives: network connectivity, network topology characteristics, and station attributes. Network connectivity indicators are used to capture the direct and indirect impacts of station failure on the global structure of the network; network topology indicators describe the structural position of a station within the network; and station attribute indicators reflect the operational and service characteristics of stations. By combining these three dimensions, the evaluation framework can more accurately represent both the structural and operational importance of stations under bidirectional operational disruptions.
Finally, the Technique for Order Preference by Similarity to an Ideal Solution (TOPSIS) is employed to synthesize multiple indicators and derive a comprehensive importance ranking of stations, thereby identifying key stations in the urban rail transit network.
3.1. Problem Description and Assumptions
3.1.1. Network Connectivity Indicators
Under station failure scenarios, especially when indirect failures occur due to turnback operation adjustments, the most direct manifestation of system vulnerability is the degradation of network connectivity. The impact of a station’s failure on network connectivity is a fundamental criterion for evaluating its importance. In dynamic failure scenarios, the extent to which the network becomes fragmented and the degree to which overall transmission efficiency declines directly reflect the criticality of a station. Therefore, this study adopts two widely used dynamic connectivity indicators—maximum connected subgraph change and network efficiency change—to quantify the impact of station failure on the network [
22,
23,
24].
- (1)
Change value of maximum connectivity subgraph
When failed stations are removed from the urban rail transit network, the network may be divided into several disconnected subgraphs. Among them, the subgraph containing the largest number of stations is defined as the maximum connected subgraph, which represents the largest part of the network that can still operate as an integrated system. This indicator is expressed as: It is expressed as Equation (1).
where
represents the maximum connectivity subgraph change value before and after the failure of station
.
denotes the number of stations in the normal network.
is the maximum connectivity subgraph number of stations after the failure of station
. The larger value of
indicates that the failure of station
leads to a more significant loss of network connectivity, implying that the station plays a more critical role in maintaining global network integrity. This indicator is particularly suitable for capturing the indirect failure effects caused by turnback section disruptions, where the failure of a single station may isolate an entire group of downstream stations from the network core.
- (2)
Change value of network efficiency
Although the maximum connected subgraph change value reflects the extent of network fragmentation, it does not fully capture the degradation of connectivity within the remaining connected components. Therefore, network efficiency is introduced to evaluate the overall accessibility and information transmission efficiency of the network after station failure. The change value of the network efficiency can be expressed as Equation (2).
where the larger the value of
indicates a more pronounced deterioration in network accessibility due to the failure of station
, suggesting that the station is more important in maintaining efficient connections among stations. Compared with the maximum connected subgraph change value, this indicator is more sensitive to changes in shortest paths and is capable of capturing subtle connectivity degradation even when the network remains largely connected. The expression is as Equation (3).
where
denotes the network efficiency of the network in a certain state.
is the shortest path length from site
to site
. Let
represents the efficiency of the initial network.
denotes the network efficiency after the failure of station
.
3.1.2. Network Topology Characterization Indicators
In addition to connectivity changes, the inherent topological position of a station within the network also determines its potential influence. Degree centrality reflects local connectivity, closeness centrality indicates overall accessibility, and betweenness centrality measures the station’s role as a path intermediary [
12]. These three indicators capture different dimensions of a station’s structural importance in the network and are therefore suitable as static topological evaluation metrics. Thus, the three metrics are chosen to describe the importance of the station in the network topology characteristics. The computational formulas are as shown in Equations (4)–(6).
where
denotes the degree centrality of site
.
= 1 when there is a connecting edge between site
and site
; otherwise,
= 0.
is the meso centrality of site
.
represents the number of shortest paths between site
and site
that pass through site
.
is the number of shortest paths between site
and site
.
expresses the near centrality of site
.
Together, these topology indicators complement the dynamic connectivity indicators by capturing the structural roles of stations, which is essential for distinguishing stations that may exhibit similar connectivity impacts but occupy different positions within the network structure.
3.1.3. Indicators of the Site’s Own Attributes
Evaluating station importance solely based on graph theoretical indicators may introduce bias, as the actual operation of an urban rail transit network is influenced not only by its topological structure but also by the operational scale and functional characteristics of individual stations. In practice, stations with similar structural positions in the network may differ significantly in terms of passenger service capacity, operational roles, and management priority. To capture these non-topological factors, this study selects two station attribute indicators: the number of station entrances, which reflects passenger flow scale, and the station type, which indicates its operational role—namely, intermediate stations, return (turnback) stations, origin and terminus stations, and interchange stations. These two indicators complement network connectivity and topology metrics by representing the intrinsic operational importance of stations.
- (1)
Number of station entrances
The number of station entrances and exits is an important indicator that indirectly reflects the scale of passenger flow served by a station. In general, stations with more entrances and exits are designed to accommodate larger passenger volumes, serve wider catchment areas, and provide greater accessibility to surrounding urban functions. Such stations usually play a more significant role in daily passenger distribution and evacuation during emergencies.
Therefore, the number of station entrances is selected as an attribute indicator to represent the passenger service scale of a station. A larger number of entrances indicates a higher passenger handling capacity and, consequently, a higher level of station importance from the perspective of passenger service and operational demand.
- (2)
Type of site
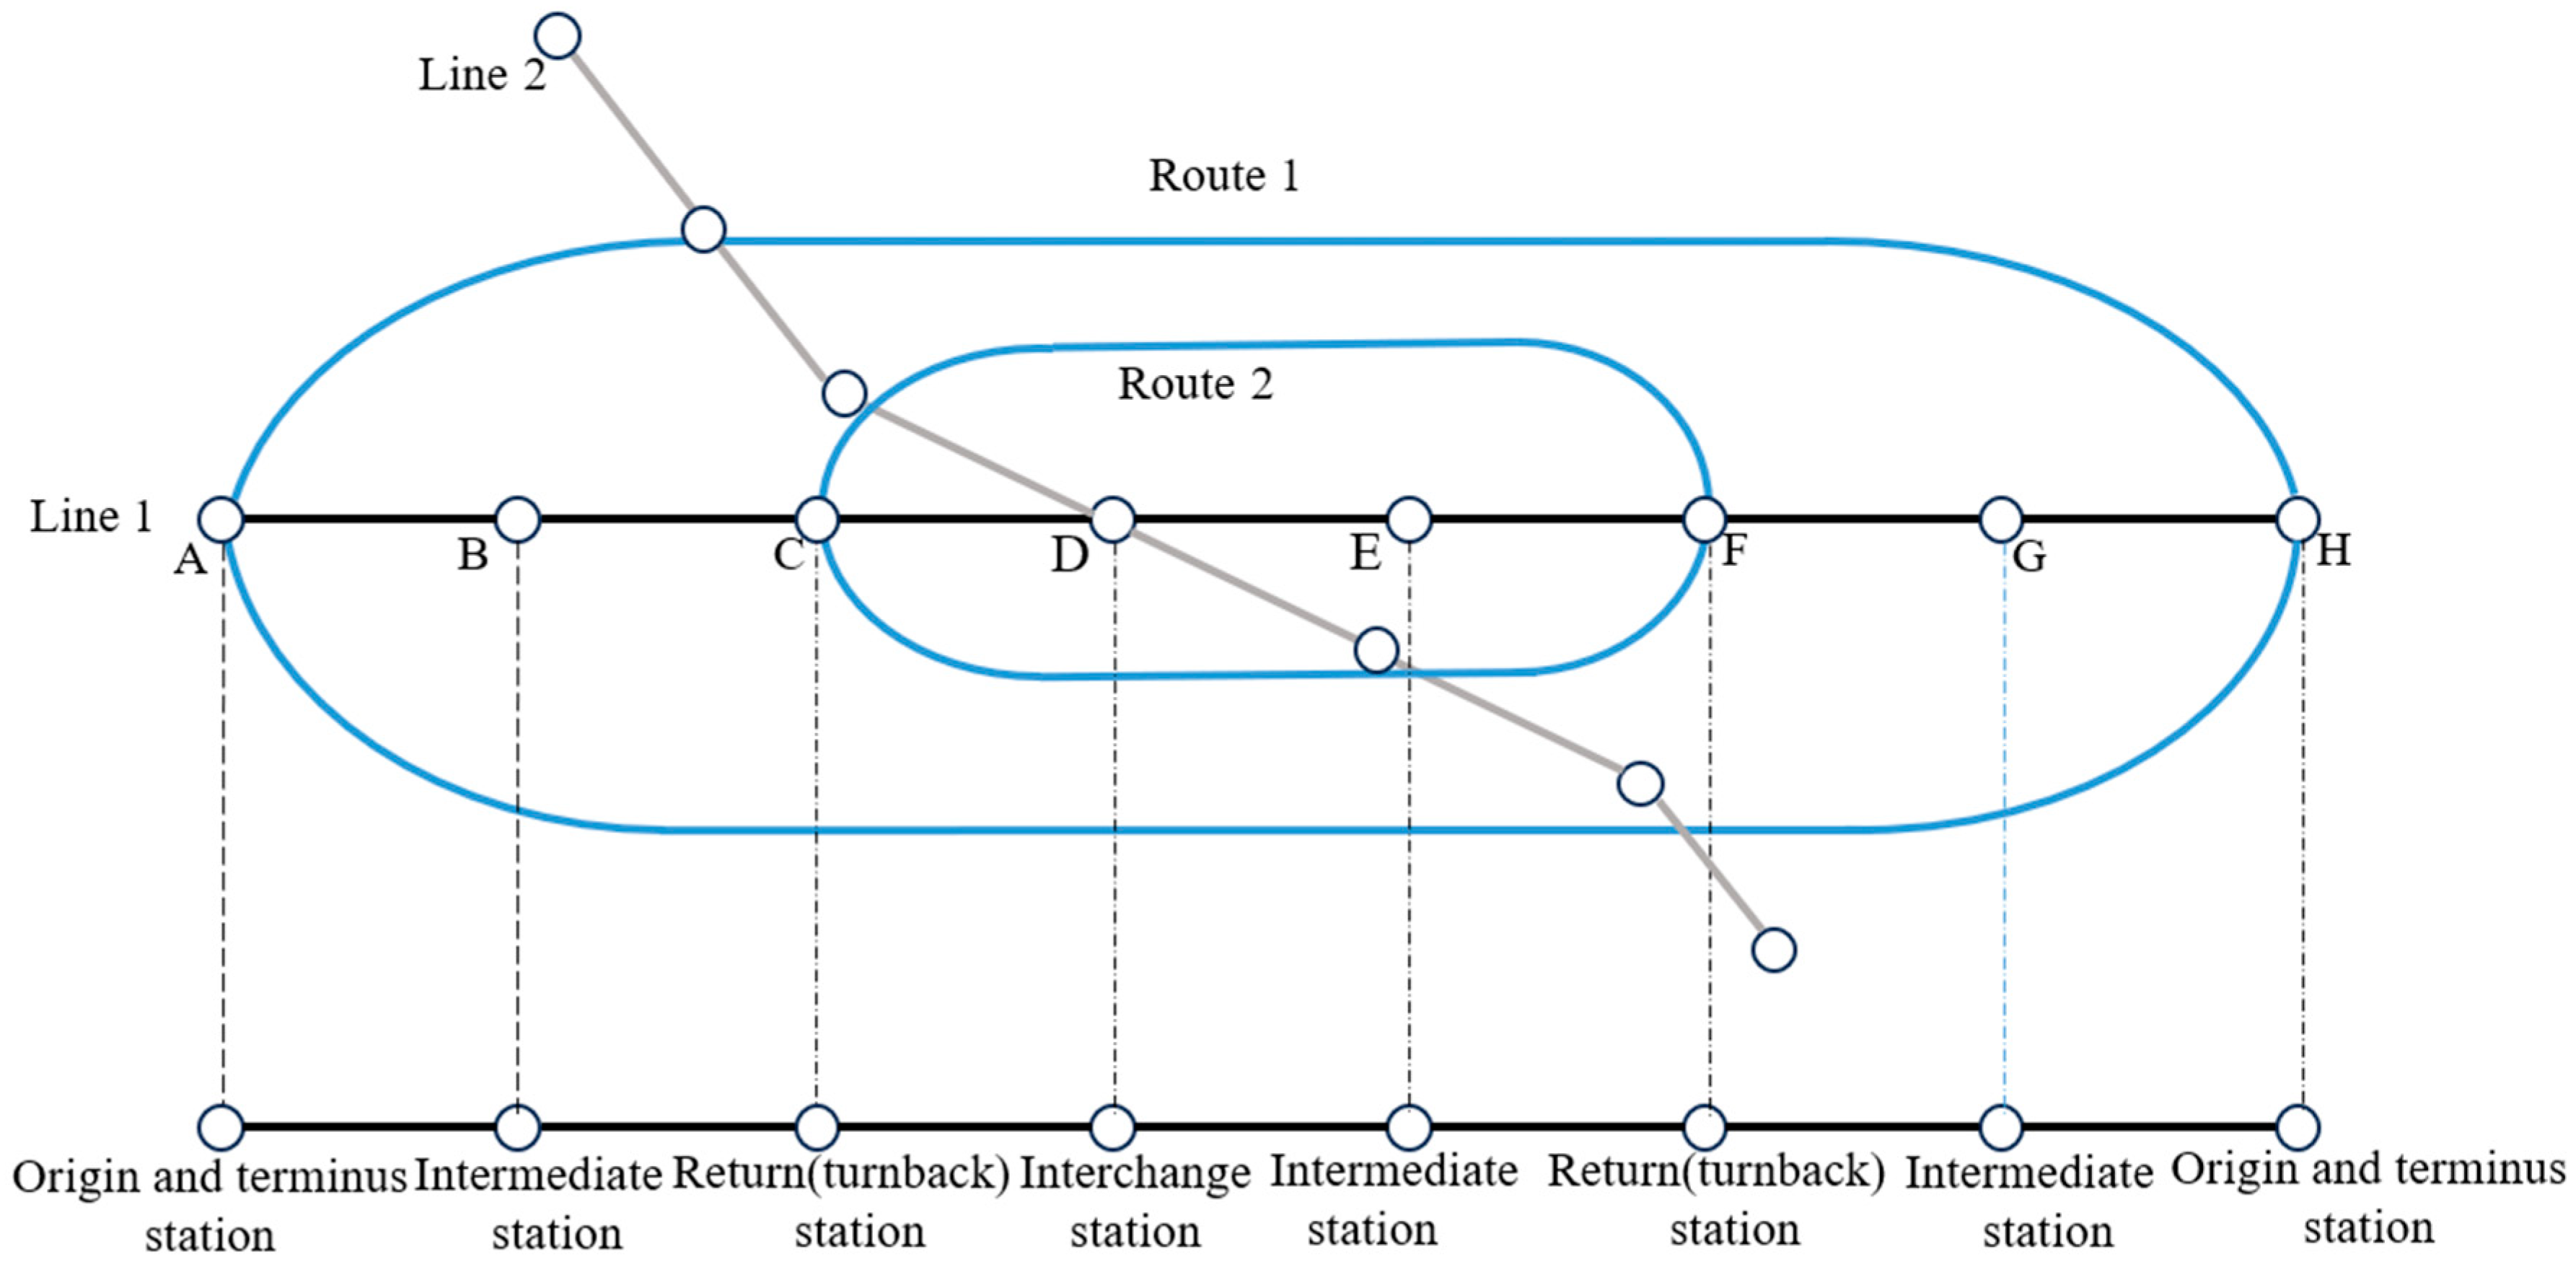
Different types of stations play distinct roles in rail transit operations, and their importance cannot be fully captured by topological indicators alone. According to operational characteristics, urban rail transit stations can be classified into four categories: intermediate stations, return (turnback) stations, origin and terminus stations, and interchange stations. To facilitate a clearer understanding of station classification and their operational roles, a schematic diagram is provided in
Figure 3. The figure illustrates a simplified urban rail transit network with both a main route (Route 1) and a short-turn route (Route 2), reflecting the common operational pattern of long and short turnback services.
As shown in the figure, origin and terminus stations, represented by Stations A and H, are located at the ends of the line and serve as the starting or terminating points for train services. These stations define the outer boundaries of the full-route operation.
Intermediate stations, such as Stations B, E, and G, are distributed along the line and mainly provide passenger boarding and alighting services. These stations do not directly participate in operational control activities such as turnback or line transfer.
Turnback stations, including Stations C and F, are located within the line and enable trains to reverse direction. In the figure, these stations determine the operational range of the short-turn service, where trains circulate within a limited section instead of the entire line. Under disruption conditions, these stations play a key role in adjusting train operations and may lead to the suspension of service within the corresponding section.
Interchange stations, represented by Station D, connect different lines, such as Line 1 and Line 2 in the figure, and function as critical transfer nodes within the network. These stations are essential for maintaining network connectivity and enabling passenger transfers between routes.
The coexistence of full-route and short-turn operations in the figure highlights the operational dependency among stations within a turnback section. When a disruption occurs at or near a turnback station, its impact may propagate throughout the entire short-turn section rather than being confined to the failed station itself. This characteristic provides an important basis for modeling section-level failure propagation in this study.
To reflect these functional differences, differentiated importance values are assigned to different station types as follows [
49]: intermediate station is counted as 1, turnback station is counted as 2, origin and terminus station is counted as 2, and interchange station is counted as 3. Interchange stations are assigned the highest value because they connect multiple lines and play a critical role in maintaining network wide connectivity and passenger transfer efficiency. Although the degree centrality indicator already accounts for the number of connected lines at an interchange station, assigning a unified value of 3 to all interchange stations avoids excessive amplification of interchange effects while still reflecting their higher operational importance.
In addition, stations connected to depots, parking lots, or vehicle sections are particularly important in actual operations, as they directly affect train dispatching, storage, and recovery under disruption scenarios. Therefore, if a station is connected to a parking lot or vehicle section, an additional value of 0.5 is added to its original station type score to account for its enhanced operational significance.
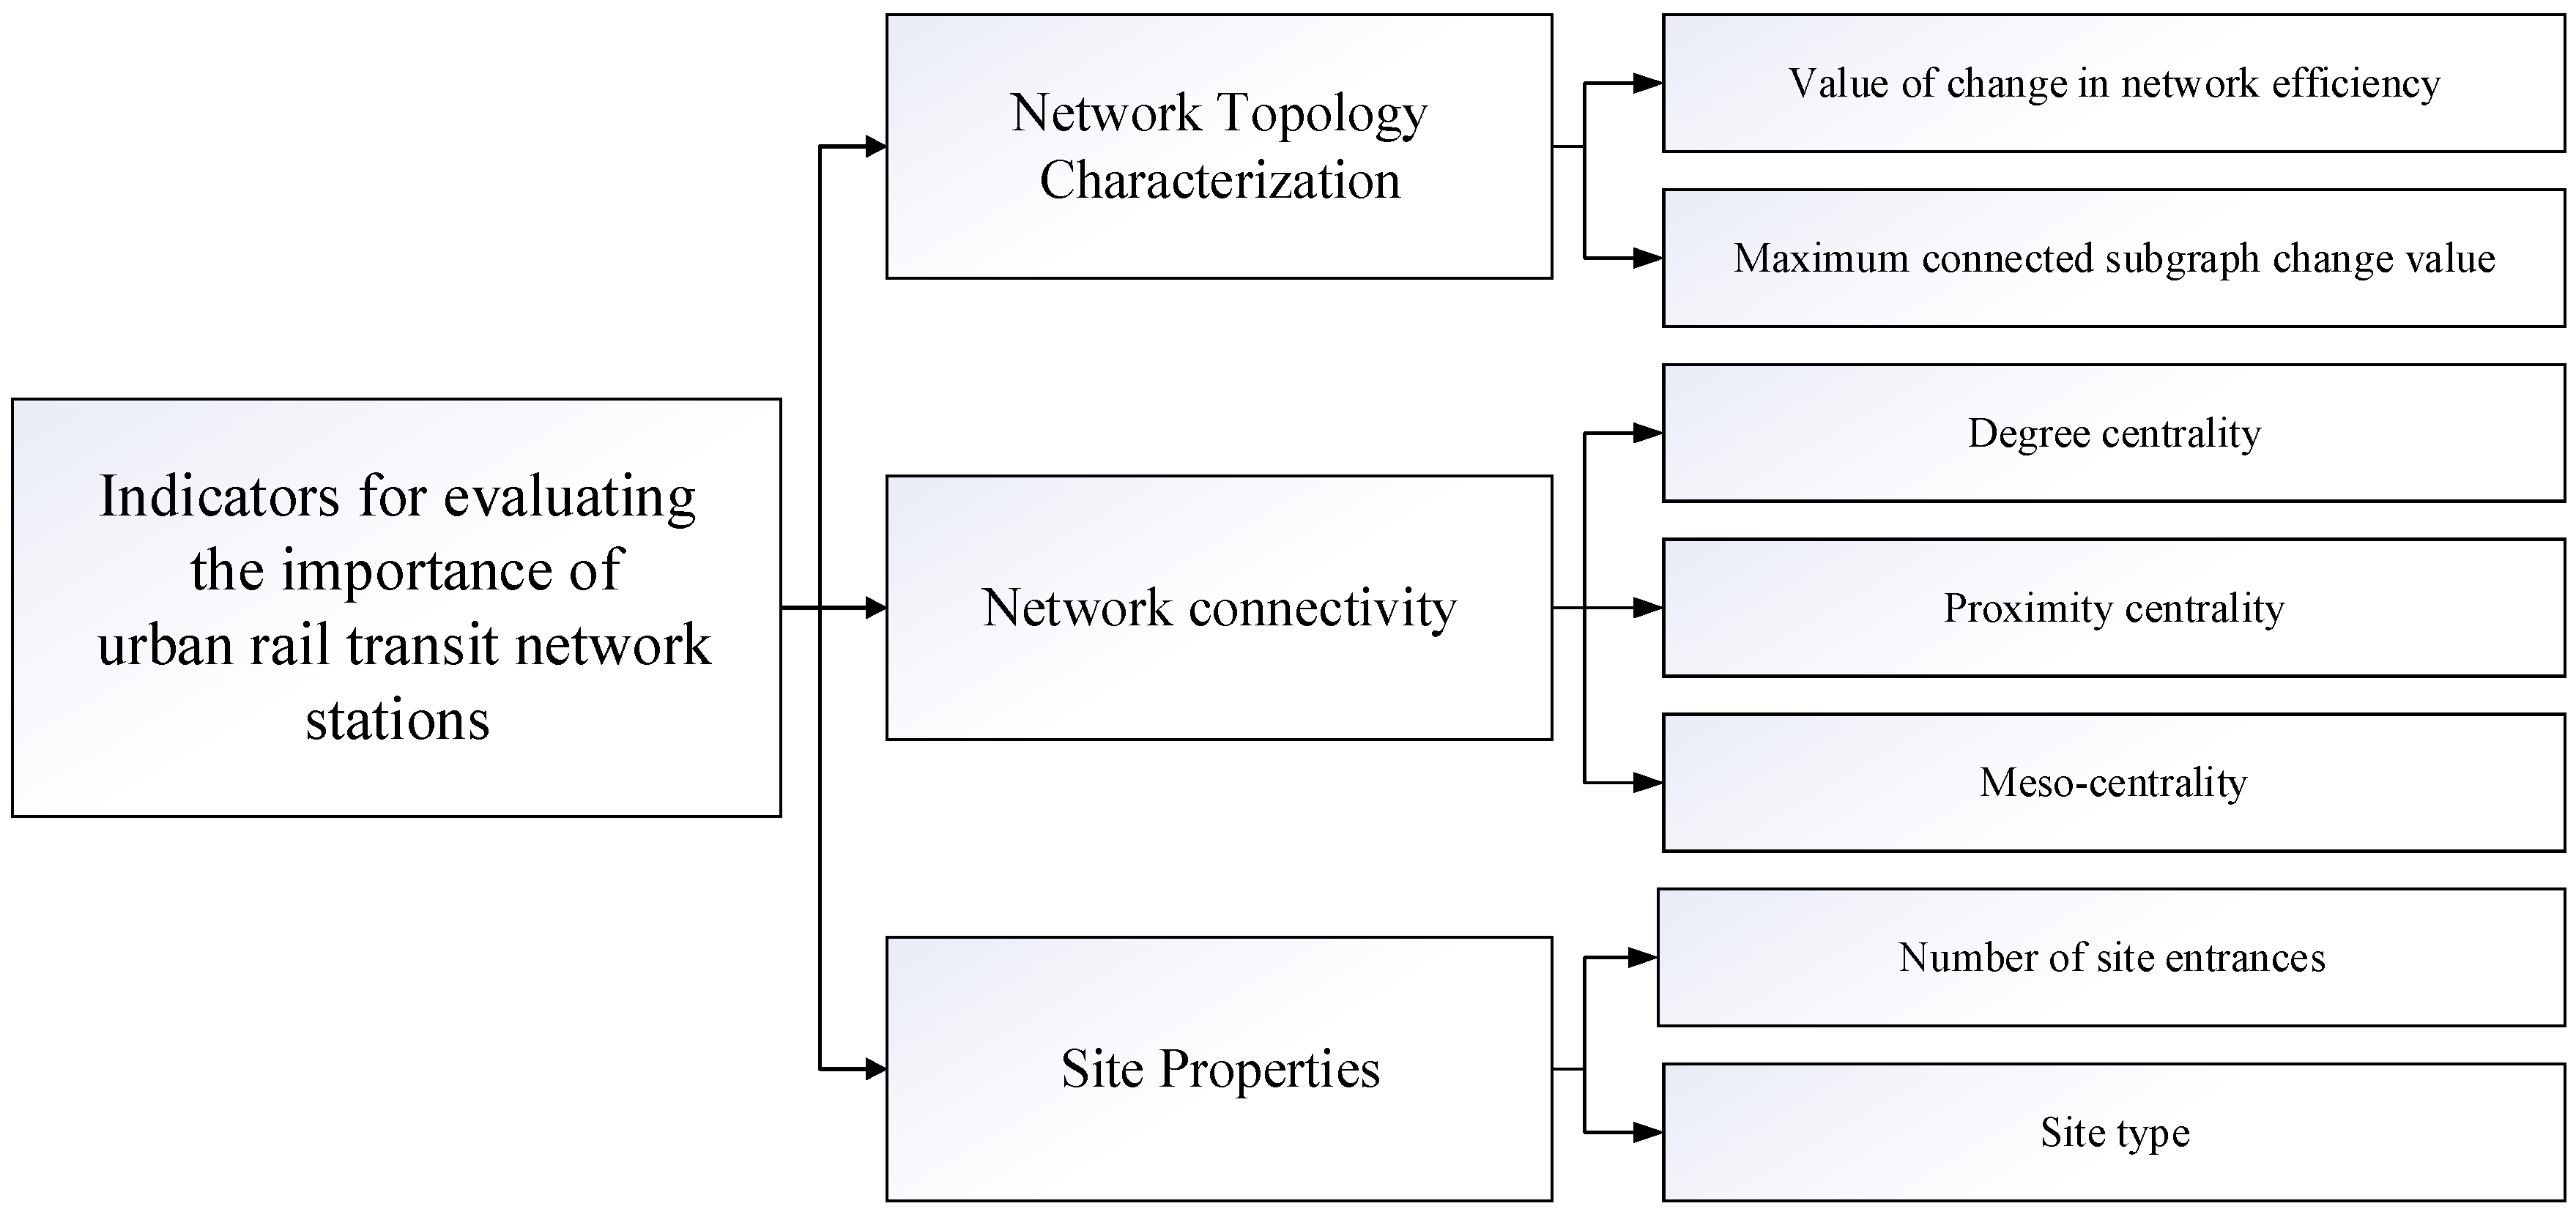
If a station belongs to more than one category, the category with the higher importance value is adopted as the final station type value, ensuring that the most critical functional role of the station is fully reflected in the evaluation. In summary, by incorporating station attribute indicators, namely, the number of station entrances and station type, this study complements the connectivity and topology indicators and establishes a more comprehensive station importance evaluation framework, as shown in
Figure 4. This integrated approach enables the identification of critical stations not only from a structural perspective but also from an operational and service oriented perspective, which is particularly important under bidirectional interruption scenarios.
To examine potential redundancy among the selected indicators, correlation analysis was conducted using both Pearson and Spearman correlation coefficients, with the results presented in
Table 1(a) and
Table 1(b), respectively.
The analysis shows that most pairs of indicators exhibit moderate correlations, with the majority of correlation coefficients below 0.7, which does not reach the commonly accepted threshold for strong multicollinearity.
Although certain indicators, such as degree centrality and meso centrality, show relatively higher correlations, they still reflect different aspects of network structure and operational characteristics. Therefore, to preserve the completeness of the evaluation framework, all selected indicators are retained.
3.2. Comprehensive Evaluation Based on the TOPSIS Method
Given that station importance is jointly determined by multiple indicators from different dimensions—including network connectivity, network topology characteristics, and station attributes—a comprehensive evaluation method is required to integrate heterogeneous indicators into a unified importance ranking. These indicators differ in scale, unit, and variability, and no single indicator can fully reflect station importance under bidirectional interruption scenarios.
The Technique for Order Preference by Similarity to an Ideal Solution (TOPSIS) is a widely used multicriteria decision making method that ranks evaluation objects according to their relative distances to an ideal solution and a negative ideal solution. This method makes full use of the original data information, preserves the relative differences among evaluation objects, and can effectively reflect the comprehensive performance gap between alternatives. In addition, TOPSIS does not impose strict requirements on data distribution or sample size, and its computational process is straightforward and easy to implement [
50,
51]. These characteristics make TOPSIS particularly suitable for station importance evaluation problems involving multiple indicators with different physical meanings.
Therefore, the TOPSIS method is employed in this study to synthesize the selected evaluation indicators and to determine the comprehensive importance ranking of stations in the urban rail transit network.
The basic idea of the TOPSIS method is as follows: first, a normalized decision matrix is constructed to eliminate the influence of different indicator scales; then, the optimal solution and the worst solution for each indicator are identified; finally, the relative closeness of each evaluation object to the optimal solution is calculated based on weighted distances. The specific evaluation procedure consists of five steps, as described below.
- (1)
Calculation of indicator weights
Determining appropriate indicator weights is a key step in the TOPSIS evaluation process, as weights directly affect the contribution of each indicator to the final evaluation results. In this study, the principle for weight determination is to reflect the relative importance of indicators based on their ability to distinguish differences among stations. Indicators with greater variability are considered to contain more discriminative information and should therefore be assigned higher weights. Based on this principle, the coefficient of variation method is adopted to objectively determine indicator weights according to their degree of dispersion [
52,
53]. This method is selected because it avoids subjective bias and ensures that the weighting process is fully data-driven. Compared with subjective weighting approaches, it provides a more objective reflection of indicator importance. Although alternative methods, such as entropy-based or hybrid weighting approaches, could also be applied, the coefficient of variation method is considered appropriate for this study due to its simplicity, transparency, and consistency with the available dataset.
The weight of the
th indicator is then determined by normalizing the coefficient of variation is shown as Equations (7) and (8).
where
is the value of the
th site for the
th indicator (
= 1, 2, ···, m;
= 1, 2, ···, n).
represents the mean squared deviation of the values of the
th indicator across all sites.
denotes the mean value of the values of the
th indicator across all stations.
is the coefficient of variation for the
th evaluation indicator.
denotes the weight of the
th evaluation indicator.
By using the coefficient of variation method, the weighting process objectively reflects the intrinsic differences among indicators and enhances the robustness of the comprehensive evaluation.
- (2)
Construction of the normalized initial matrix
Assuming that there are
m evaluation objects and
n evaluation indicators, the original data matrix
is shown as Equation (9).
To eliminate the influence of different indicator dimensions and magnitudes, the original matrix is normalized using vector normalization. The normalized standard matrix is
, The element in the matrix is
, whose formula is given by Equation (10).
This normalization process ensures that all indicators are dimensionless and comparable, providing a consistent basis for subsequent distance calculations.
- (3)
Determine the best and worst option
The optimal solution is shown as Equation (11).
where
.
The worst solution is shown as Equation (12).
where
.
The optimal solution represents a hypothetical station with the best performance across all indicators, while the worst solution represents a station with the poorest performance. These two reference points form the benchmark for evaluating the relative importance of each station.
- (4)
The proximity of the evaluation object to the optimal and inferior solutions
The degree of proximity of the evaluation object to the optimal solution is shown as Equation (13).
The proximity of the subject of the evaluation to the worst program is shown as Equation (14).
These distances quantify how close each station is to the ideal state and how far it is from the worst state, considering the relative importance of each indicator.
- (5)
Calculate the closeness of the evaluation object to the optimal solution
The closeness of the evaluation object to the optimal solution is shown as Equation (15).
where
indicates the closeness of the
th evaluation object to the optimal program. 0 ≤
≤ 1. The larger the value of
, the more optimal the evaluation object. The
value of the evaluation object can be sorted from large to small to obtain the final evaluation results sorting.
By ranking the values of in descending order, the final comprehensive importance ranking of stations in the urban rail transit network is obtained.
Overall, by integrating objective indicator weighting with the TOPSIS comprehensive evaluation framework, this study is able to synthesize heterogeneous indicators from multiple dimensions and to identify critical stations in a systematic and transparent manner. This approach ensures that the evaluation results are both data driven and consistent with the operational characteristics of urban rail transit networks under bidirectional interruption scenarios.
4. Case Study
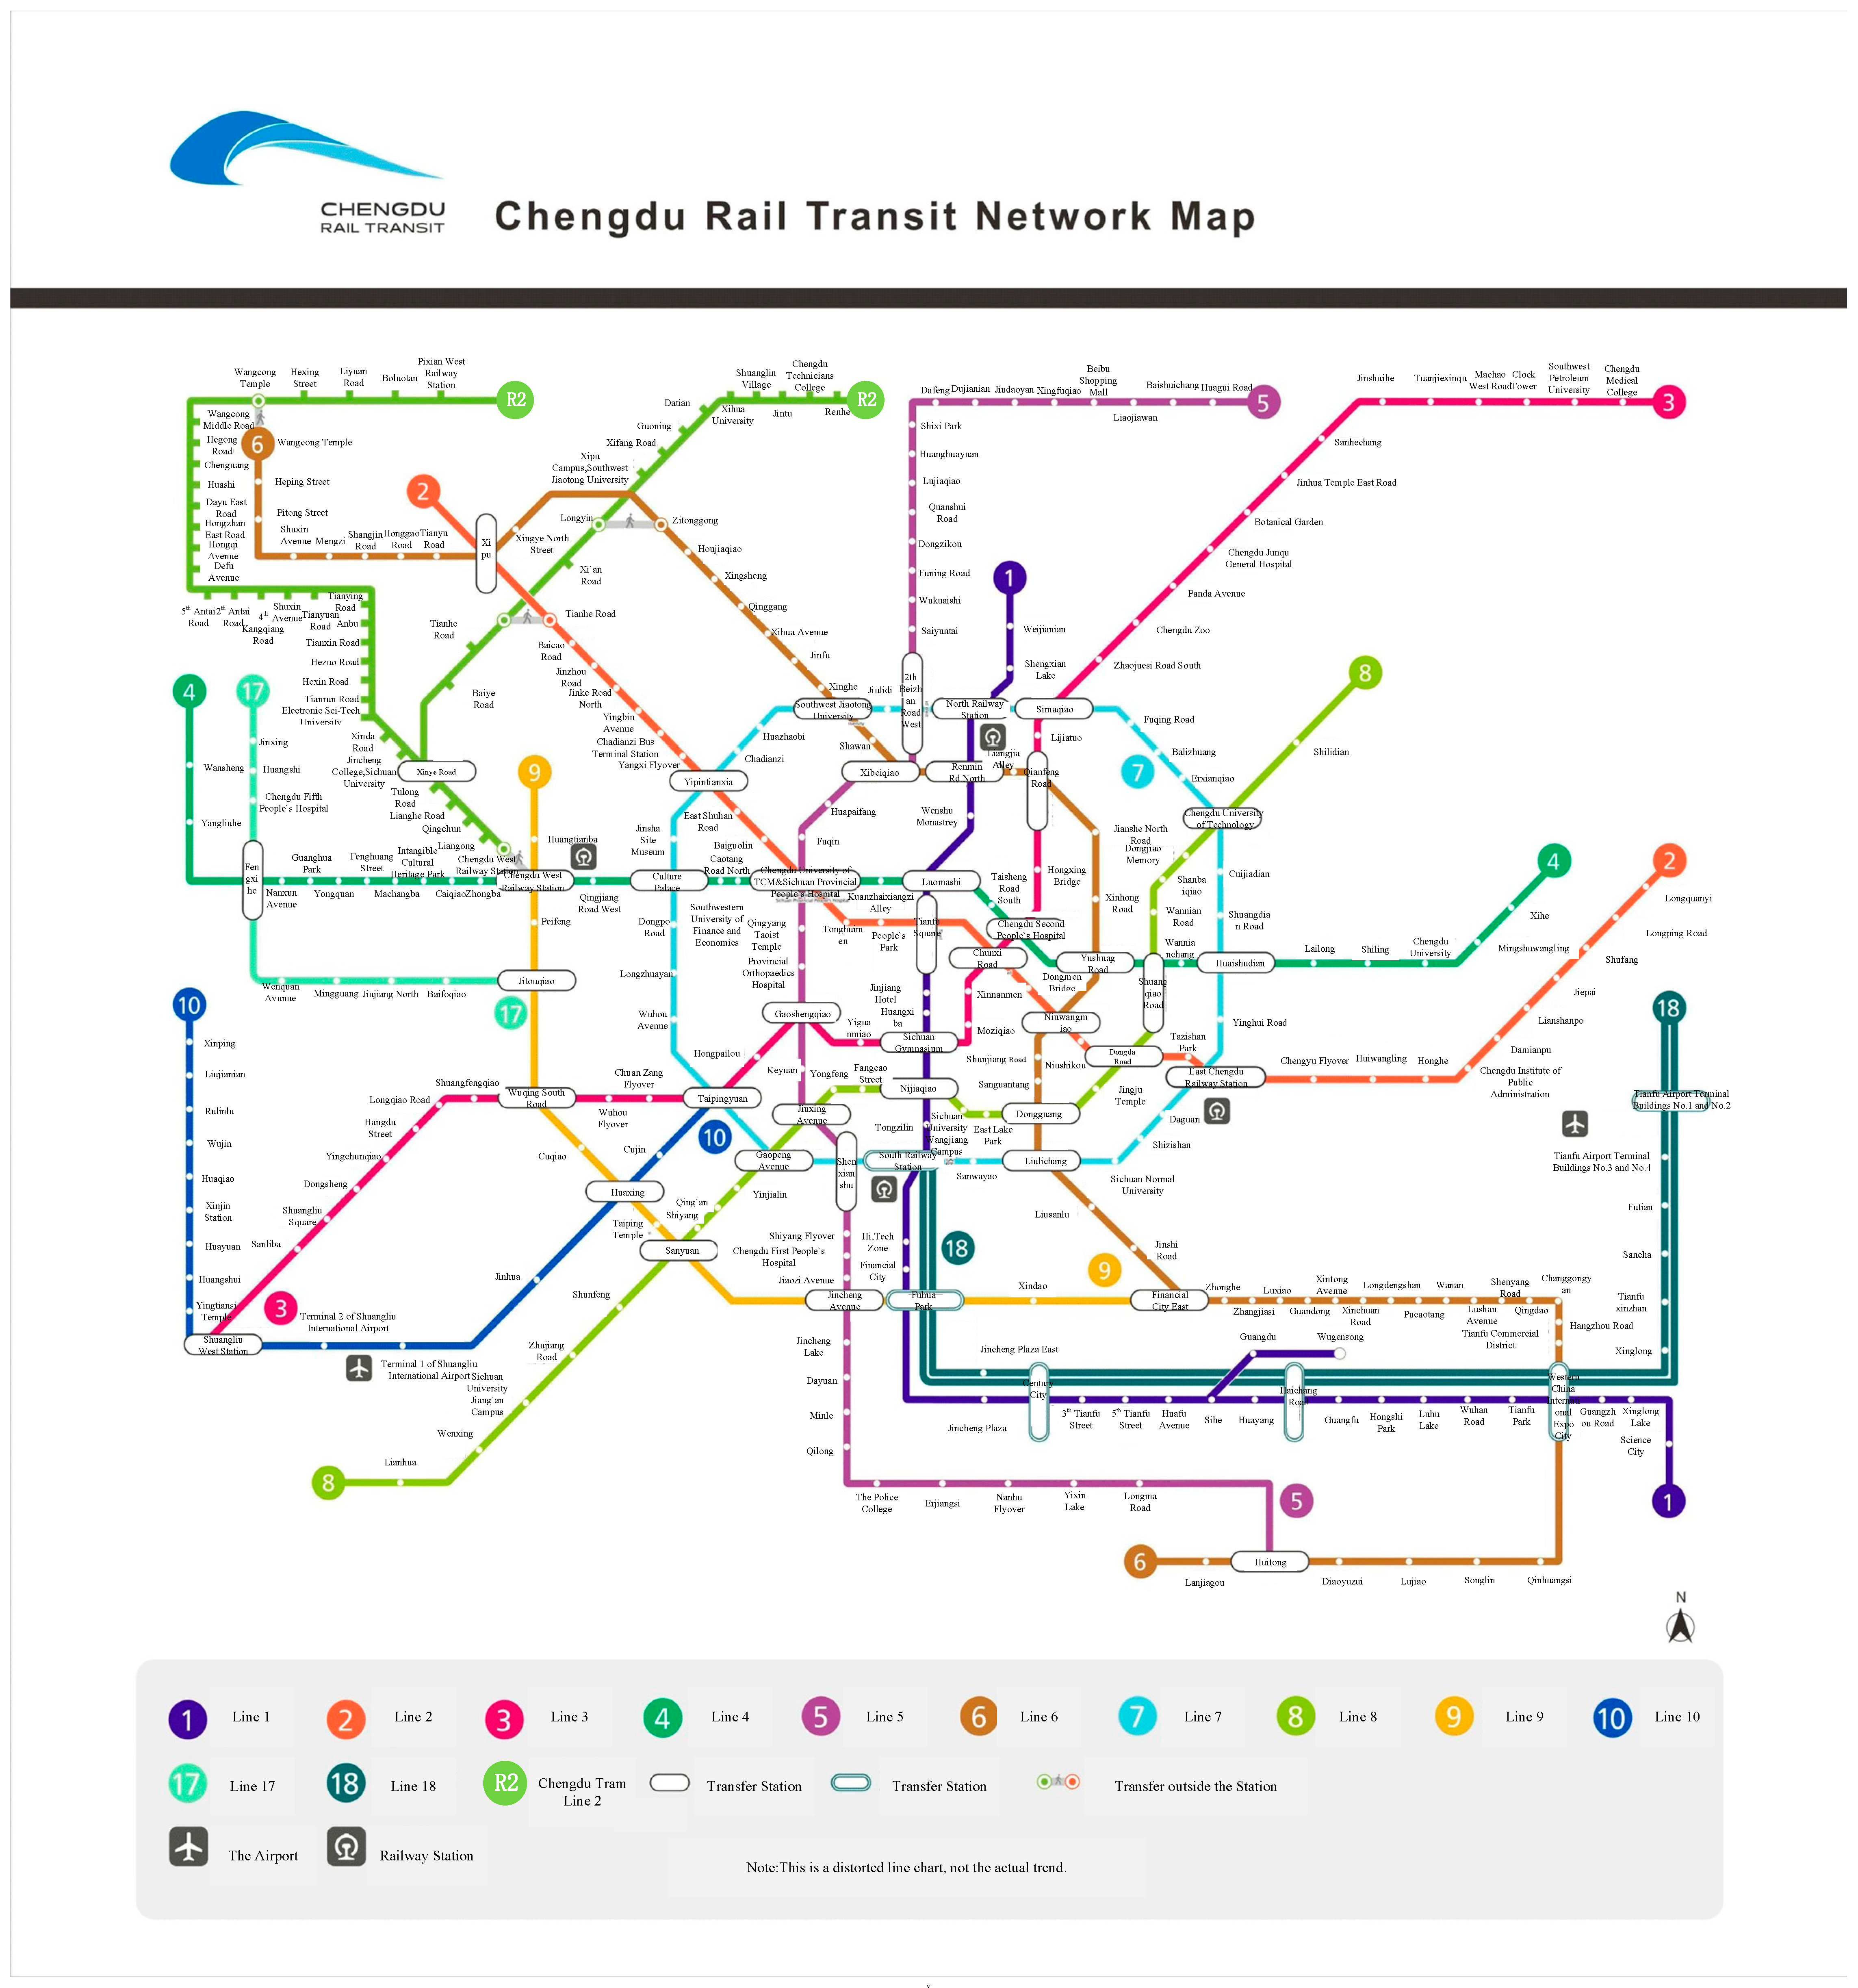
As of July 2022, Chengdu has operated 12 metro lines, with a total line length of about 518 km, 282 stations, 46 interchanges, and 19 turnback stations. Chengdu Metro has entered the stage of network operation, and it is necessary to analyze the importance of its stations. Thus, the Chengdu Metro is chosen as an example application, and the rail network map is shown in
Figure 5.
4.1. Calculation Results
4.1.1. Calculation of Evaluation Indicator Values
Based on the Space L method, the Chengdu Metro network topology was constructed, and the values of the evaluation indicators for each station were calculated. Due to the large number of stations in the network,
Table 2 presents the calculation results for 10 representative stations as examples, covering all seven evaluation indicators, including two network connectivity indicators, three network topology indicators, and two station attribute indicators. In
Table 1, in the original removal method, the turnback relationship of lines is neglected, and the failed station itself is removed when a station malfunctions. In contrast, the improved removal method incorporates the turnback relationship of lines. Specifically, when a station fails, all other stations within the same turnback section as the failed station will also be rendered inoperable.
From the perspective of network connectivity indicators, the value of change in network efficiency and the maximum connected subgraph change value under the improved node removal method are consistently greater than or equal to those obtained using the original node removal method. For example, for Renmin North Road Station and Wenshu Monastery Station, the change in network efficiency increases from 0.0007 to 0.0021 and from 0.0005 to 0.0020, respectively, while the maximum connected subgraph change value increases from 1 to 3 in both cases. Similar patterns can be observed at Sichuan Gymnasium Station, where the maximum connected subgraph change value increases significantly from 1 to 6. These results indicate that, once the failure scope is expanded to include the turnback section under bidirectional interruptions, the negative impact of station failure on network connectivity becomes more pronounced.
Regarding network topology indicators, including degree centrality, proximity centrality, and meso centrality, the indicator values remain unchanged under the two node removal methods. This is because these indicators are calculated based on the static topological structure of the network and are independent of the failure simulation process. For instance, stations such as North Railway Station, Luomashi Station, and Sichuan Gymnasium Station consistently exhibit relatively high meso centrality values, reflecting their strong bridging roles in the shortest path structure of the network.
From the perspective of station attribute indicators, the number of station entrances and site type values also remain unchanged between the two methods. Stations with a larger number of entrances, such as Tianfu Square Station and Sichuan Gymnasium Station, show higher entrance counts, indicating a larger passenger service scale. In addition, interchange stations generally exhibit higher site type values, reflecting their greater operational importance in the network.
A comprehensive comparison across the seven indicators shows that the differences between the original and improved node removal methods are mainly concentrated in the dynamic connectivity related indicators, while the topology and attribute indicators remain stable. This result demonstrates that the improved node removal method does not alter the inherent structural characteristics of the network or station attributes, but rather provides a more realistic representation of the operational impact of station failures under bidirectional interruptions.
Overall, the larger values of network efficiency loss and maximum connected subgraph change obtained under the improved node removal method indicate that this method can more effectively capture the indirect failure effects induced by train operation adjustment at turnback stations. Consequently, the improved method is better aligned with actual rail transit operational conditions and provides a more accurate basis for evaluating station importance.
4.1.2. Calculation of Evaluation Indicator Weights
According to Equations (6) and (7), the weights of the evaluation indicators were determined using the coefficient of variation method, and the results are presented in
Table 3. The calculated weights exhibit clear differences among indicators, reflecting the varying degrees of information contribution of each indicator to station importance evaluation.
Among all indicators, the maximum connected subgraph change value obtains the largest weight (0.25), followed by meso centrality (0.23) and the value of change in network efficiency (0.20). These three indicators are all directly related to network connectivity and failure propagation, indicating that the variation in connectivity indicators across stations is relatively large. In particular, the maximum connected subgraph change value is highly sensitive to the scale of indirect station failures under bidirectional operational disruptions, resulting in strong discrimination ability among stations and, consequently, a higher weight.
The meso centrality indicator also receives a relatively high weight, as stations differ significantly in their roles as bridges in the shortest path structure of the network. Stations located at key structural positions, such as intersections between loop lines and radial lines, tend to exhibit substantially higher meso centrality values, which leads to greater variability and a higher weight under the coefficient of variation method.
In contrast, degree centrality (0.09) and proximity centrality (0.05) are assigned relatively lower weights. This can be attributed to the fact that the overall topology of the Chengdu Metro network is relatively dense, and the differences in direct connectivity and average path accessibility among stations are comparatively limited. As a result, these indicators show smaller variation across stations and contribute less to distinguishing station importance.
Regarding station attribute indicators, the weights of site type (0.10) and number of site entrances (0.08) are moderate. Although these indicators play an important role in reflecting operational characteristics and passenger service capacity, their numerical distributions are relatively discrete or concentrated, which limits their variability compared with dynamic connectivity indicators.
Overall, the weight distribution demonstrates that indicators describing the impact of station failure on network connectivity dominate the evaluation system. This result is consistent with the research objective of identifying critical stations under bidirectional interruptions and confirms the rationality of combining dynamic connectivity indicators with topology and attribute indicators in the proposed evaluation framework.
4.1.3. TOPSIS Synthesis Evaluation
According to Equations (9) and (10), the optimal and inferior solutions of each evaluation indicator under the improved node removal method are obtained, as shown in
Table 4. The results indicate that clear differences exist between the best and worst values of most indicators, reflecting substantial heterogeneity in station characteristics across the Chengdu Metro network.
From the perspective of dynamic connectivity indicators, the value of change in network efficiency ranges from 0.012 to 0.219, while the maximum connected subgraph change value varies from 0.000 to 0.280. The relatively large range of these two indicators demonstrates that station failures exert highly uneven impacts on network connectivity under bidirectional interruption scenarios. Stations associated with large best values tend to trigger extensive indirect failures within turnback sections, whereas stations corresponding to the worst values cause only localized or negligible connectivity degradation.
Regarding network topology indicators, degree centrality, proximity centrality, and meso centrality also exhibit evident differences between optimal and inferior solutions. In particular, meso centrality shows a wide variation interval, with the worst value equal to 0.000 and the best value reaching 0.292. This indicates that certain stations do not lie on any shortest paths between other station pairs, while others play a critical bridging role in the network structure.
It should be noted that the occurrence of 0.000 values in the worst solutions of the maximum connected subgraph change value and meso centrality does not imply data abnormality. Instead, these values correspond to stations whose failure does not reduce the size of the maximum connected subgraph or whose structural position does not contribute to shortest path transmission. Such stations are typically peripheral or weakly connected nodes, and their limited influence on overall network performance is realistically captured by the TOPSIS normalization process.
For station attribute indicators, the number of site entrances and site type present relatively narrower value ranges, with best values of 0.160 and 0.108, respectively. This suggests that, although these indicators contribute to distinguishing station importance, their discrimination ability is weaker than that of dynamic connectivity indicators, which is consistent with the weight distribution results discussed in
Section 4.1.2.
Based on the optimal and inferior solutions, Equations (11)–(13) are employed to calculate the closeness of each station to the optimal solution. By ranking the closeness values in descending order, the comprehensive importance ranking of stations in the Chengdu Metro network is obtained.
4.2. Analysis of Results
Since this paper adopts the form of virtual interchange stations to represent transfer lines when constructing the rail transit network, the critical stations listed in the “Line” column only belong to their corresponding lines.
Table 5 presents the top 20 stations in terms of comprehensive importance ranking after applying the improved station failure strategy. The rankings are derived from the closeness values obtained through the TOPSIS method, where a higher closeness value indicates that a station is closer to the ideal solution and thus more important in the overall evaluation.
After applying the improved station failure strategy, the top 20 stations in terms of comprehensive importance exhibit a highly concentrated distribution across a small number of major lines. Specifically, Line 1, Line 3, and Line 5 account for 18 out of the top 20 stations, representing 95% of the highest ranked stations. This concentration reflects the structural and operational significance of these major radial lines, which serve as primary corridors connecting peripheral areas to the network core. As a result, disruptions occurring along these lines are more likely to affect a large number of downstream stations, leading to a substantial reduction in overall network connectivity.
Moreover, the ranking results reveal that highly important stations are not limited to traditional interchange hubs. Several top ranked stations, including Saiyuntai Station, WukuaiShi Station, as well as Zhaojuesi Road South Station, are non-interchange stations. Their high importance rankings indicate that station criticality is not solely determined by topological connectivity, but is strongly influenced by their locations within operationally sensitive turnback sections.
In addition, the gradual decline in closeness values from 0.713 to 0.391 suggests that the network is supported by a group of critical stations with comparable levels of importance, rather than being dominated by a single node. This pattern reflects the collaborative nature of urban rail transit operations, in which multiple structurally and operationally important stations jointly sustain network performance.
Overall, these results demonstrate that the proposed improved station failure strategy provides a more realistic and operation oriented identification of critical stations. By explicitly incorporating turnback section indirect failures, the method overcomes the inherent limitations of traditional node removal approaches and yields station importance rankings that are more consistent with reality world operational characteristics.
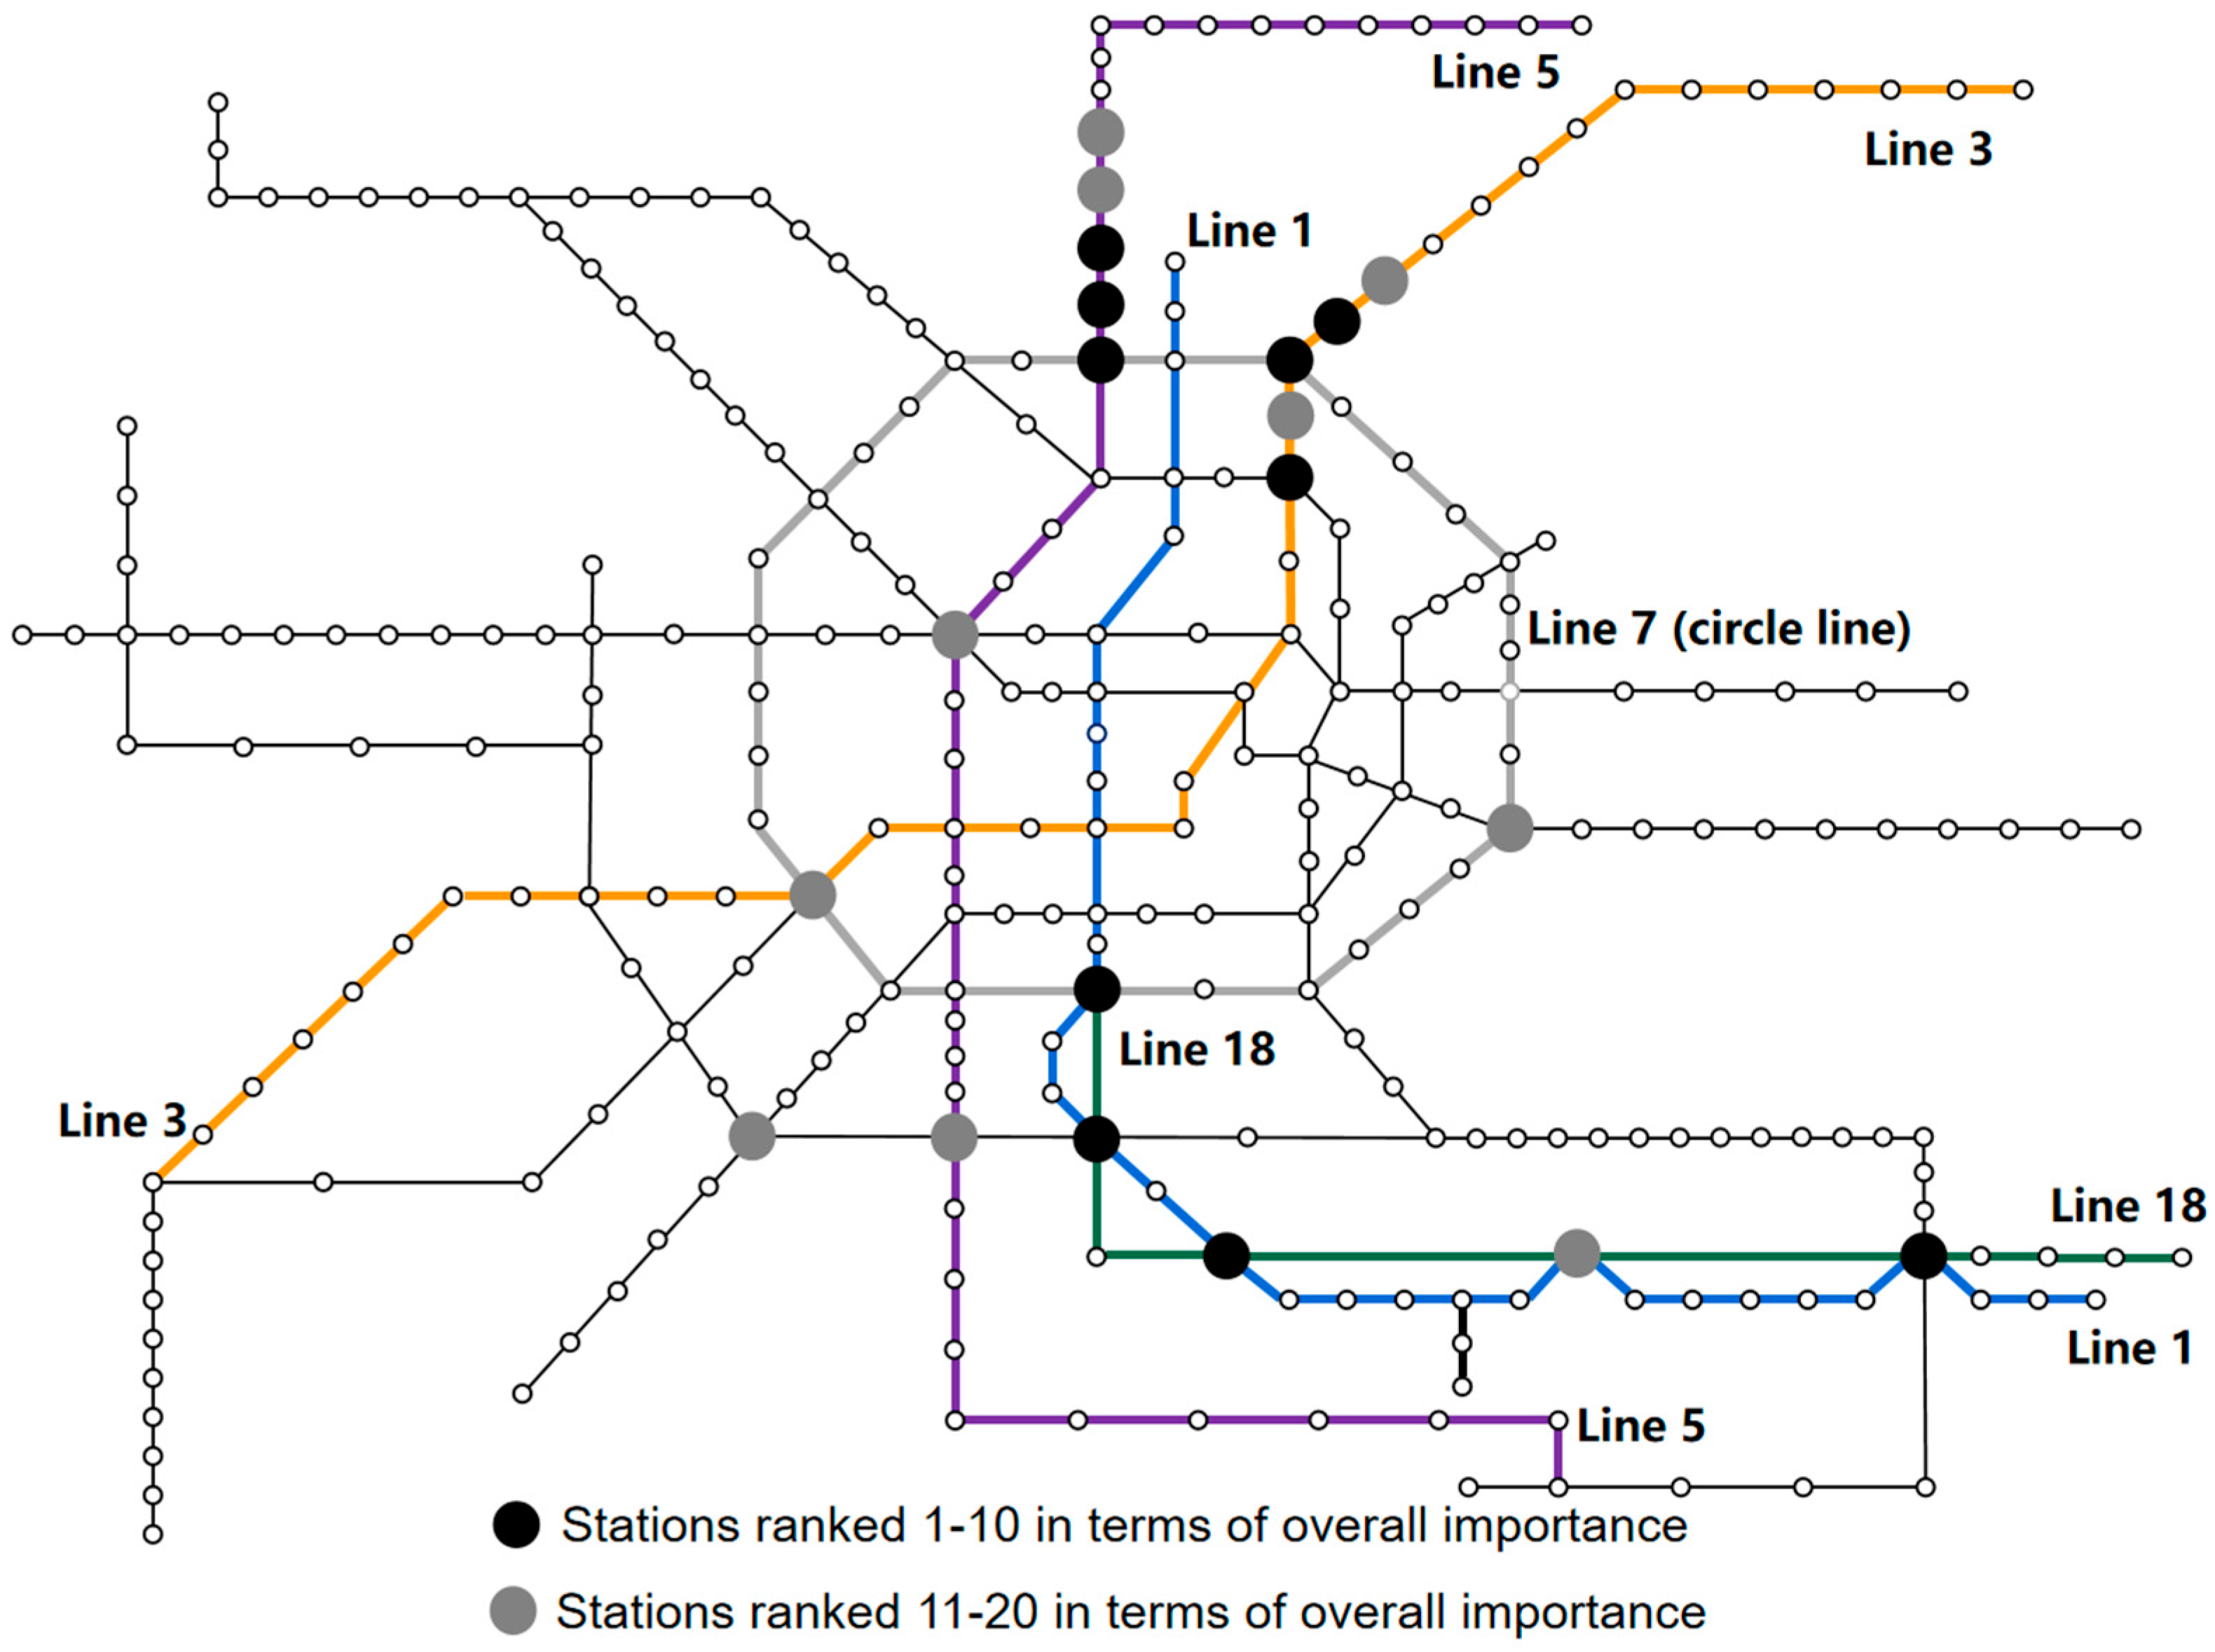
And the top 20 stations in terms of comprehensive importance ranking could be shown in
Figure 6.
Figure 6 illustrates the spatial distribution of the top 20 stations in terms of comprehensive importance after applying the improved station failure strategy. Stations ranked 1–10 are highlighted as dark nodes, while stations ranked 11–20 are shown as light nodes.
As shown in the figure, the most critical stations are highly concentrated in the central area where the ring line (Line 7) intersects with multiple radial lines, including Line 1, Line 3, Line 5, and Line 18. This concentration indicates that, when turnback section indirect failures are considered, the network core becomes a region of elevated systemic vulnerability. Failures occurring in this area can rapidly propagate across multiple lines through operational adjustments, leading to extensive degradation of network connectivity.
In addition, several high importance stations are distributed along major radial corridors, particularly along Line 1, Line 3, and Line 5. These stations exhibit a clustered, corridor distribution pattern rather than isolated locations, suggesting that their importance is closely related to their roles within operationally coupled turnback sections. Once a failure occurs at a critical section along a radial line, many downstream stations may become disconnected from the network core, amplifying the impact of a single station failure.
It is noteworthy that many highlighted stations are non-interchange stations. Their prominence in the figure demonstrates that station importance under the improved failure modeling framework is not solely determined by topological connectivity or interchange function. Instead, stations located within key turnback sections can exert disproportionate influence on network performance due to indirect failure propagation induced by train operation adjustments.
Furthermore, the spatial proximity between the top ranked stations and those ranked 11–20 indicates a hierarchical yet interdependent structure. While the highest ranked stations are more tightly clustered in the network core, surrounding stations form an extended critical region that supports overall network stability. This pattern reflects the cooperative nature of urban rail transit operations, in which network resilience is maintained by a group of spatially and operationally related critical stations rather than a single dominant node.
Overall, the spatial distribution shown in
Figure 6 provides intuitive evidence that the proposed improved station failure strategy yields station importance results that are consistent with both the structural configuration and operational characteristics of the urban rail transit network.
4.2.1. Importance of Station Type
Among the top 20 stations identified under the improved station failure strategy, 13 stations are interchange stations, indicating that transfer hubs remain dominant in the upper tier of the importance ranking. Multiline interchange stations rank prominently because they serve as key interfaces where passenger transfers and train operations from different lines converge, thereby playing a crucial role in maintaining network connectivity and operational coordination.
Representative examples include Chengdu East Railway Station, Taipingyuan Station, and Qianfeng Road Station, all of which connect multiple radial corridors and play key roles in both passenger movement and network level train circulation. The failure of these stations can simultaneously disrupt multiple lines and transfer paths, resulting in a rapid decline in network connectivity and accessibility, as well as significant disturbances to passenger flow distribution.
At the same time, the results reveal that several non-interchange stations also appear among the top ranked stations. Notable examples include Saiyuntai Station (Line 5) and Zhaojuesi South Road Station (Line 3). Although these stations do not function as passenger transfer nodes, they are located within key turnback sections where radial lines interact with the loop line, and therefore play an important role in determining the operational boundaries of train circulation. Under bidirectional interruption scenarios, failures at these locations can trigger train operation adjustments that indirectly disrupt both the loop line and the connected radial lines, resulting in impacts comparable to those caused by major interchange stations.
4.2.2. Important Station Location
Most of the top ranked stations are spatially concentrated in areas where the loop line intersects with major radial lines. Typical examples are stations located around the intersections between Line 7 and Line 3, as well as Line 7 and Line 5, where stations play a critical structural role in linking radial corridors to the network core.
Failures occurring at these locations can directly sever the connection between the terminal sections of radial lines and the central metro network, as these stations act as key gateways controlling the accessibility of peripheral areas. As a result, entire line segments become isolated and are forced to operate independently, leading to a significant reduction in network connectivity and passenger accessibility. For example, the northern terminal sections of Line 3 and Line 5 each include more than 14 stations. When a station at the intersection between a radial line and the loop line fails, these downstream stations are disconnected from the network core simultaneously, leading to large scale service disruption. This demonstrates that failures at loop–radial intersections may transform a local disruption into a corridor-level service interruption, significantly amplifying its impact scope.
Therefore, the spatial concentration of high-ranked stations around loop–radial intersections reveals a key operational vulnerability of the network: once these gateway stations fail, the resulting disruption may rapidly spread along radial corridors and reduce both network connectivity and passenger accessibility. From a practical perspective, these findings suggest that transit agencies should prioritize stations located at loop–radial intersections for monitoring and protection. For example, interchange stations such as Qianfeng Road Station and Sima Bridge Station play a critical role in maintaining network connectivity, while non-interchange stations such as Zhaojuesi Road South Station and Saiyuntai Station are located within key turnback sections and may trigger section-level service interruptions. In particular, contingency plans should be prepared for scenarios in which radial corridors are disconnected from the network core, including temporary turnback operations, passenger rerouting, and emergency capacity allocation. This distinction indicates that different types of critical stations require differentiated management strategies, where interchange stations should focus on maintaining transfer capacity, while stations within turnback sections should be prioritized for operational control and disruption containment.
4.2.3. Important Station Line Attribution
For station line attribution, most of the stations with the highest importance belong to Line 1, Line 3, Line 5, Line 7, and Line 18. Notably, several top ranked stations are located along Line 7 and at its intersections with other major lines, which highlights the structural significance of these corridors. This reason could be as follows.
- (1)
Line 7, as the only loop line in the Chengdu Metro network, undertakes the function of connecting multiple lines in the network and satisfying the passenger flow between the lines. Interchange stations along Line 7, such as South Railway Station, 2nd Beizhan West Road Station and Sima Bridge Station, therefore exhibit consistently high importance values.
- (2)
The northern end of the radial line of Line 3 and Line 5 has a large number of stations, and these sections connect to the central network at their intersections with the loop line. The ray and the loop line intersection area station failure affect a wide range. Therefore, the management of these two lines should focus on the northern end of the radial line, and the loop line intersection part of the emergency situation should be used to transfer, evacuation of passengers, to reduce the delay in passenger travel.
- (3)
The two lines (i.e., Line 1 and Line 18) have a high degree of overlap. If the connection between the two lines of the transfer station failure, this will affect the normal operation of the two lines. If the transfer station connecting the two lines fails, it will affect the normal operation of the two lines and cause serious negative impacts on the travel of the residents along the lines. Therefore, the overall importance of the five transfer stations connecting the two lines is on the high side.
4.3. Comparison of Recognition Results Before and After Node Removal Method Improvement
Table 6 compares the key stations before and after the improved method, listing the top 20 key stations under the original approach and their corresponding rankings when the improved station removal method is applied.
Table 6 presents a comparison of the top 20 critical stations identified by the original removal method and the improved removal method after considering the effect of turnback stations. In general, the two sets of results exhibit a relatively high degree of consistency. Most stations that ranked within the top 20 under the original method still remain in relatively prominent positions after the methodological improvement, indicating that the identification of critical stations is generally stable. This consistency suggests that the proposed method does not overturn the original recognition pattern, but instead refines it by incorporating the operational characteristics associated with turnback stations.
From the perspective of the highest-ranked stations, the overlap between the two methods is particularly evident. 2nd Beizhan West Road Station, Incubation Park Station, Simaqiao Railway Station, South Railway Station, Western China Int’l Expo City Station, and Century City Station all remain within the top six to eight positions under the improved method, although their relative order changes slightly. Among them, Incubation Park Station rises from 2nd to 1st, and South Railway Station rises from 7th to 2nd, while 2nd Beizhan West Road Station drops modestly from 1st to 3rd and Simaqiao Station changes only from 3rd to 4th. These results indicate that the core set of the most important stations is highly consistent across the two methods. In other words, the stations identified as the most influential by the original method are still recognized as the primary critical stations after introducing the improved mechanism. This provides direct evidence for the reliability of the proposed method.
At the same time, the improved method leads to a certain degree of rank adjustment for some stations. For example, Saiyuntai Station decreases from 4th to 8th, Wukuaishi Station from 6th to 9th, Funing Road Station from 8th to 13th, and Chengdu East Railway Station from 11th to 15th. These changes are noticeable but still remain within a relatively limited range. They imply that, after the turnback-station effect is taken into account, the improved method can better distinguish subtle differences among stations that originally appeared to have similar levels of importance. Therefore, rather than changing the fundamental identification results, the improved method enhances the discriminative capacity of the ranking.
A few stations show comparatively larger ranking shifts. Dongzikou Station falls from 12th to 20th, Shuangliuxi Railway Station from 17th to 25th, Panda Avenue Station from 18th to 24th, Lujiaqiao Station from 20th to 28th, and Chengyu Flyover Station experiences the largest decline, moving from 19th to 38th. These larger changes suggest that the importance of some stations may be overestimated when the turnback-station factor is ignored. After this factor is introduced, the ranking becomes more sensitive to actual operational dependencies within the network, allowing stations with weaker turnback-related influence to be distinguished from those with stronger structural and functional significance.
Overall, the comparison demonstrates that the proposed method has good credibility and robustness. The most important stations identified by the improved method are largely consistent with those obtained by the original method, especially for the leading positions in the ranking. This means that the proposed method preserves the essential recognition results of the traditional approach. Meanwhile, by incorporating the effect of turnback stations, it provides a more refined and operationally realistic evaluation of station importance. Therefore, the improved method can be regarded as both reliable and credible for identifying critical stations in urban rail transit networks.
Based on the above,
Table 7 compares the stations with a ranking change amplitude of over 20% in station importance, along with their affiliated lines, before and after the improvement of the node removal method. For each station, two importance rankings are reported, corresponding to the original removal method and the improved removal method, respectively. The change in value represents the absolute difference between the two rankings, while the magnitude denotes the change value relative to the variation range of all stations.
Table 7 compares station importance rankings obtained under the original station removal method and the improved station removal method. The results show that expanding the failure scope by incorporating turnback section indirect effects leads to substantial ranking shifts for multiple stations across different lines. The absolute ranking changes range from 57 to 173, with relative changes between 20.2% and 61.3%, indicating that the improvement does not merely introduce minor adjustments but systematically alters the importance evaluation for a subset of stations.
In particular, Lijiatuo Station (Line 3) exhibits the largest upward shift, improving from 187 to 14 (a change of 173, 61.3%), followed by Pucaotang Station (Line 6), which improves from 271 to 113 (a change of 158, 56.0%). These pronounced changes suggest that the original removal method may substantially underestimate the importance of stations whose failures trigger broader operational impacts beyond the failed node itself. Similarly, stations such as Tianfu Park Station (Line 1) and Shiyang Flyover Station (Line 5) also demonstrate large upward shifts, further confirming the sensitivity of importance rankings to the failure scope definition.
Moreover, the stations with notable ranking changes are distributed across several major lines, with Line 3 and Line 6 appearing most frequently. This pattern implies that the improved failure modeling framework reveals operationally sensitive stations along key corridors, rather than concentrating effects on a single line. It is also noteworthy that Rulin Road Station (Line 10) shows a decrease in importance ranking (from 177 to 239), indicating that the improved method may reallocate criticality by differentiating stations whose indirect failure impacts are limited under the expanded failure scope. Overall,
Table 6 demonstrates that incorporating operational dependency into the station removal strategy provides a more operation consistent assessment of station criticality.
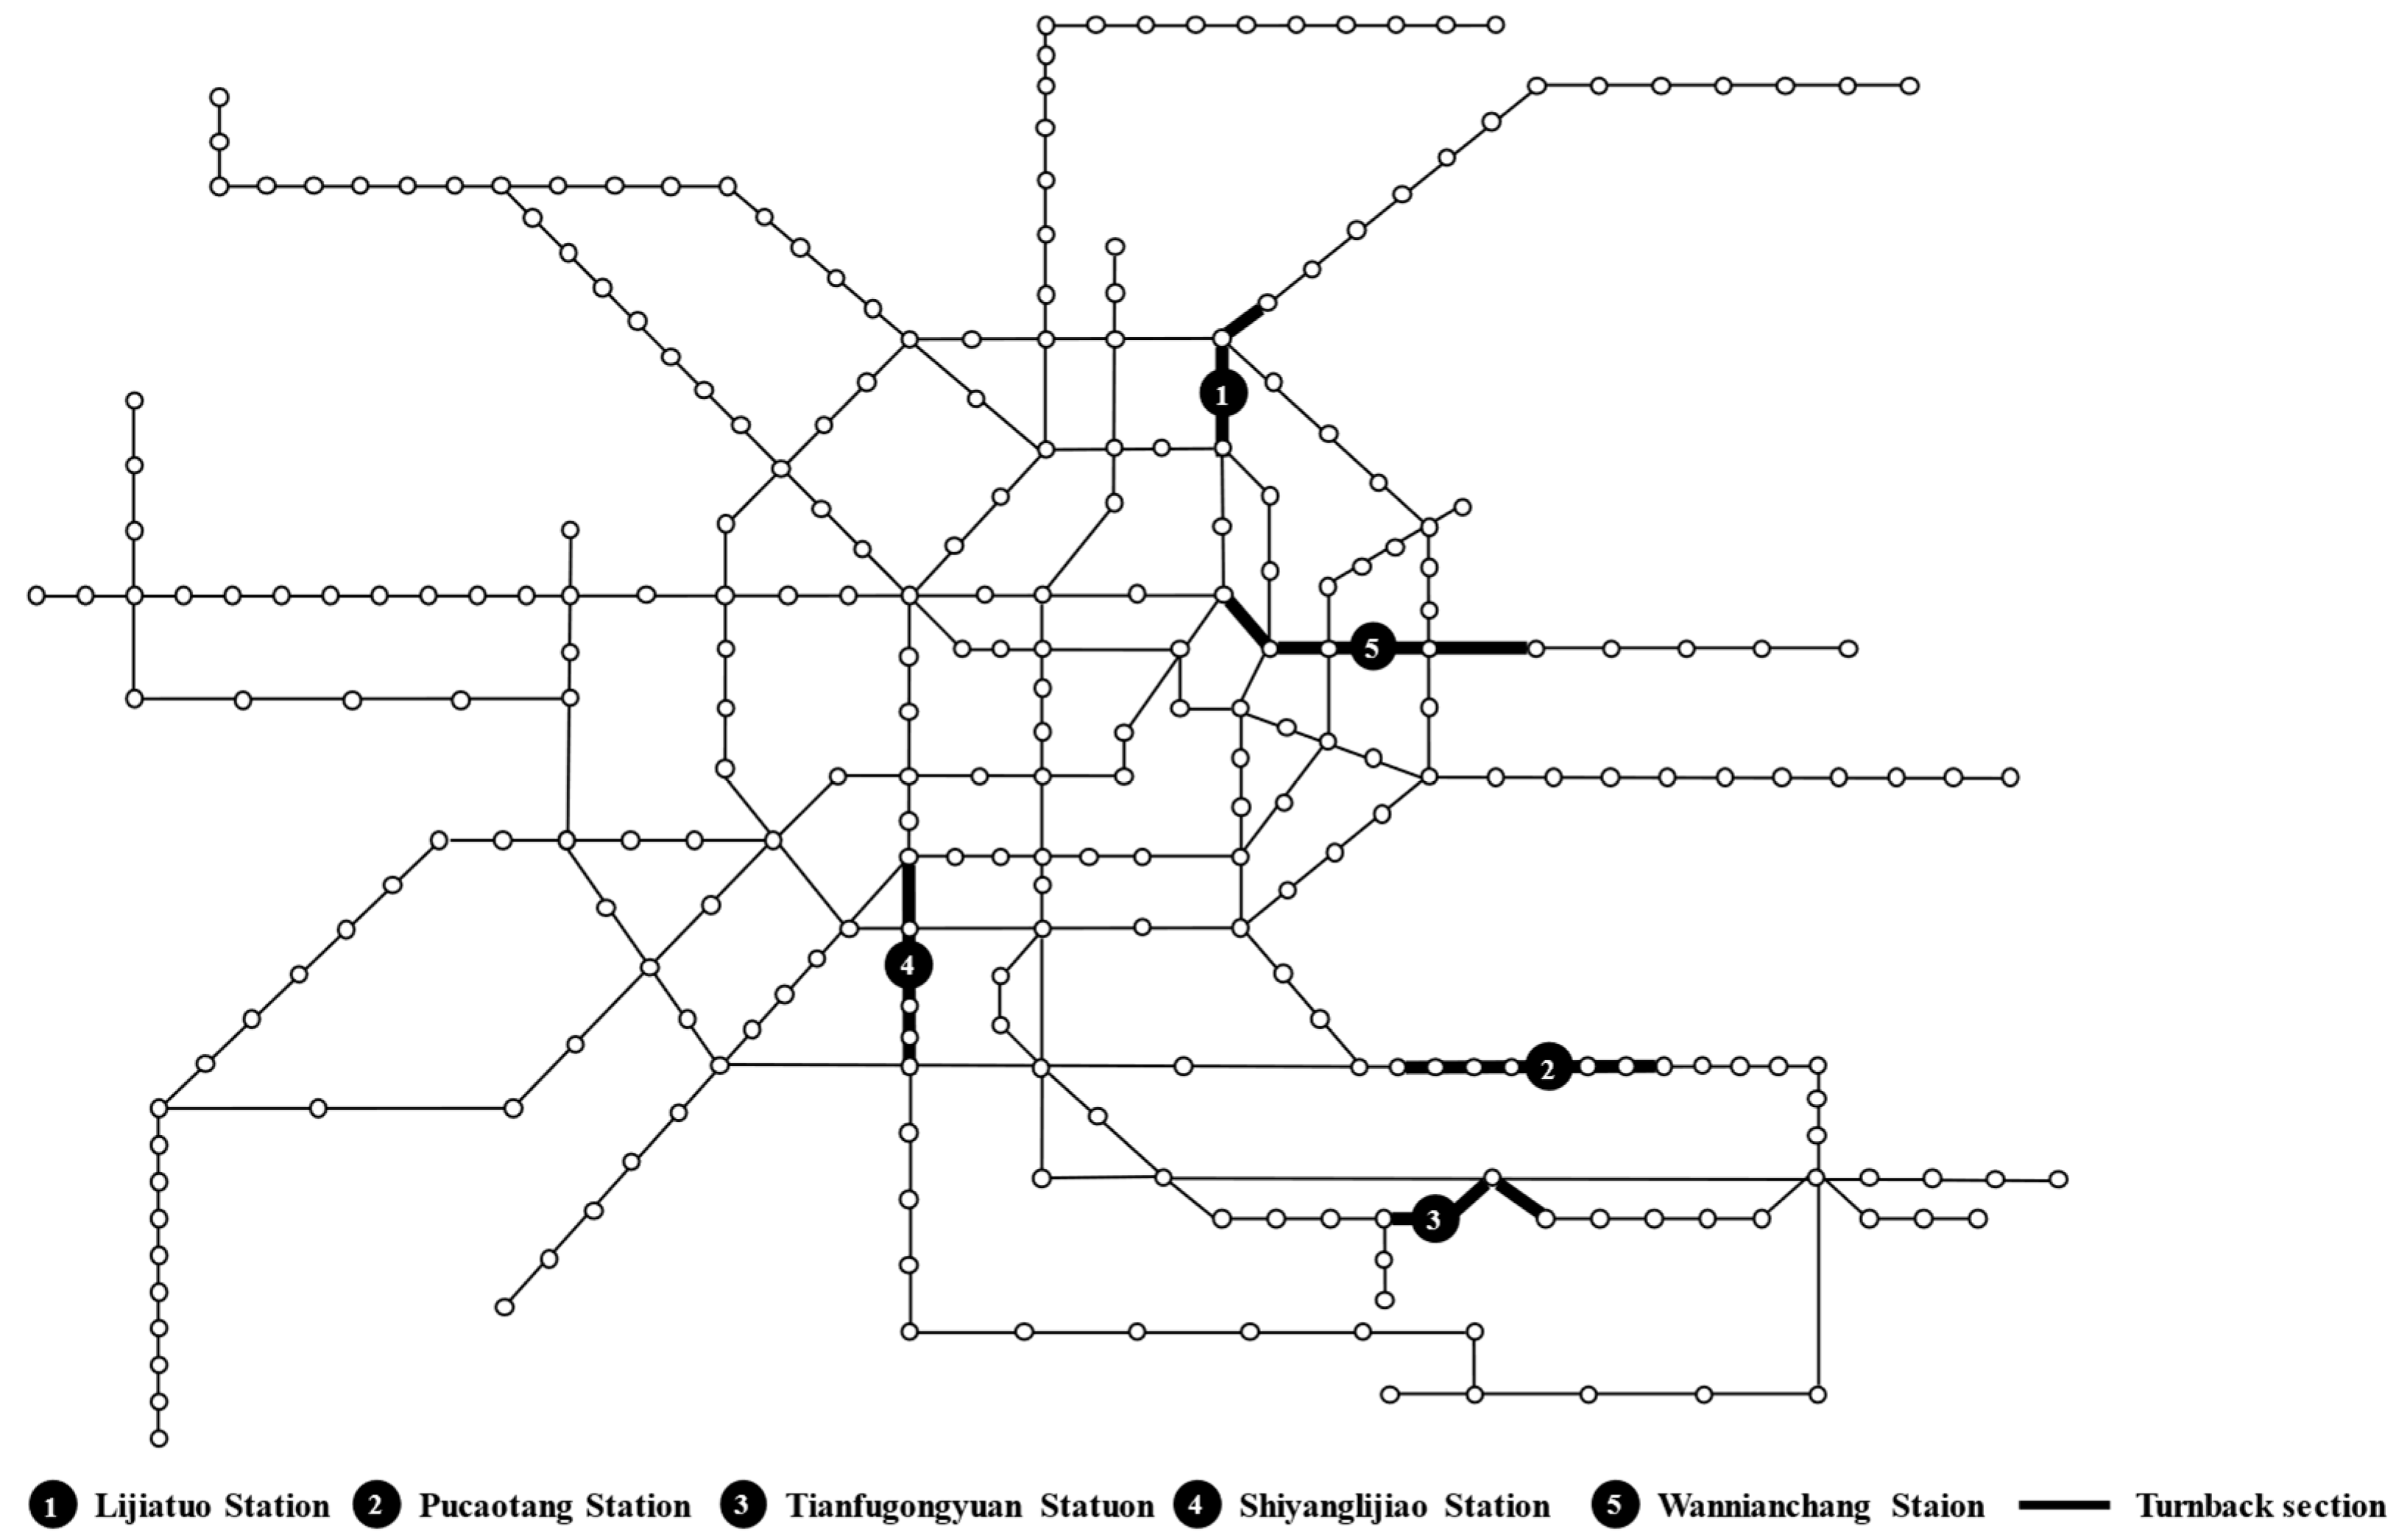
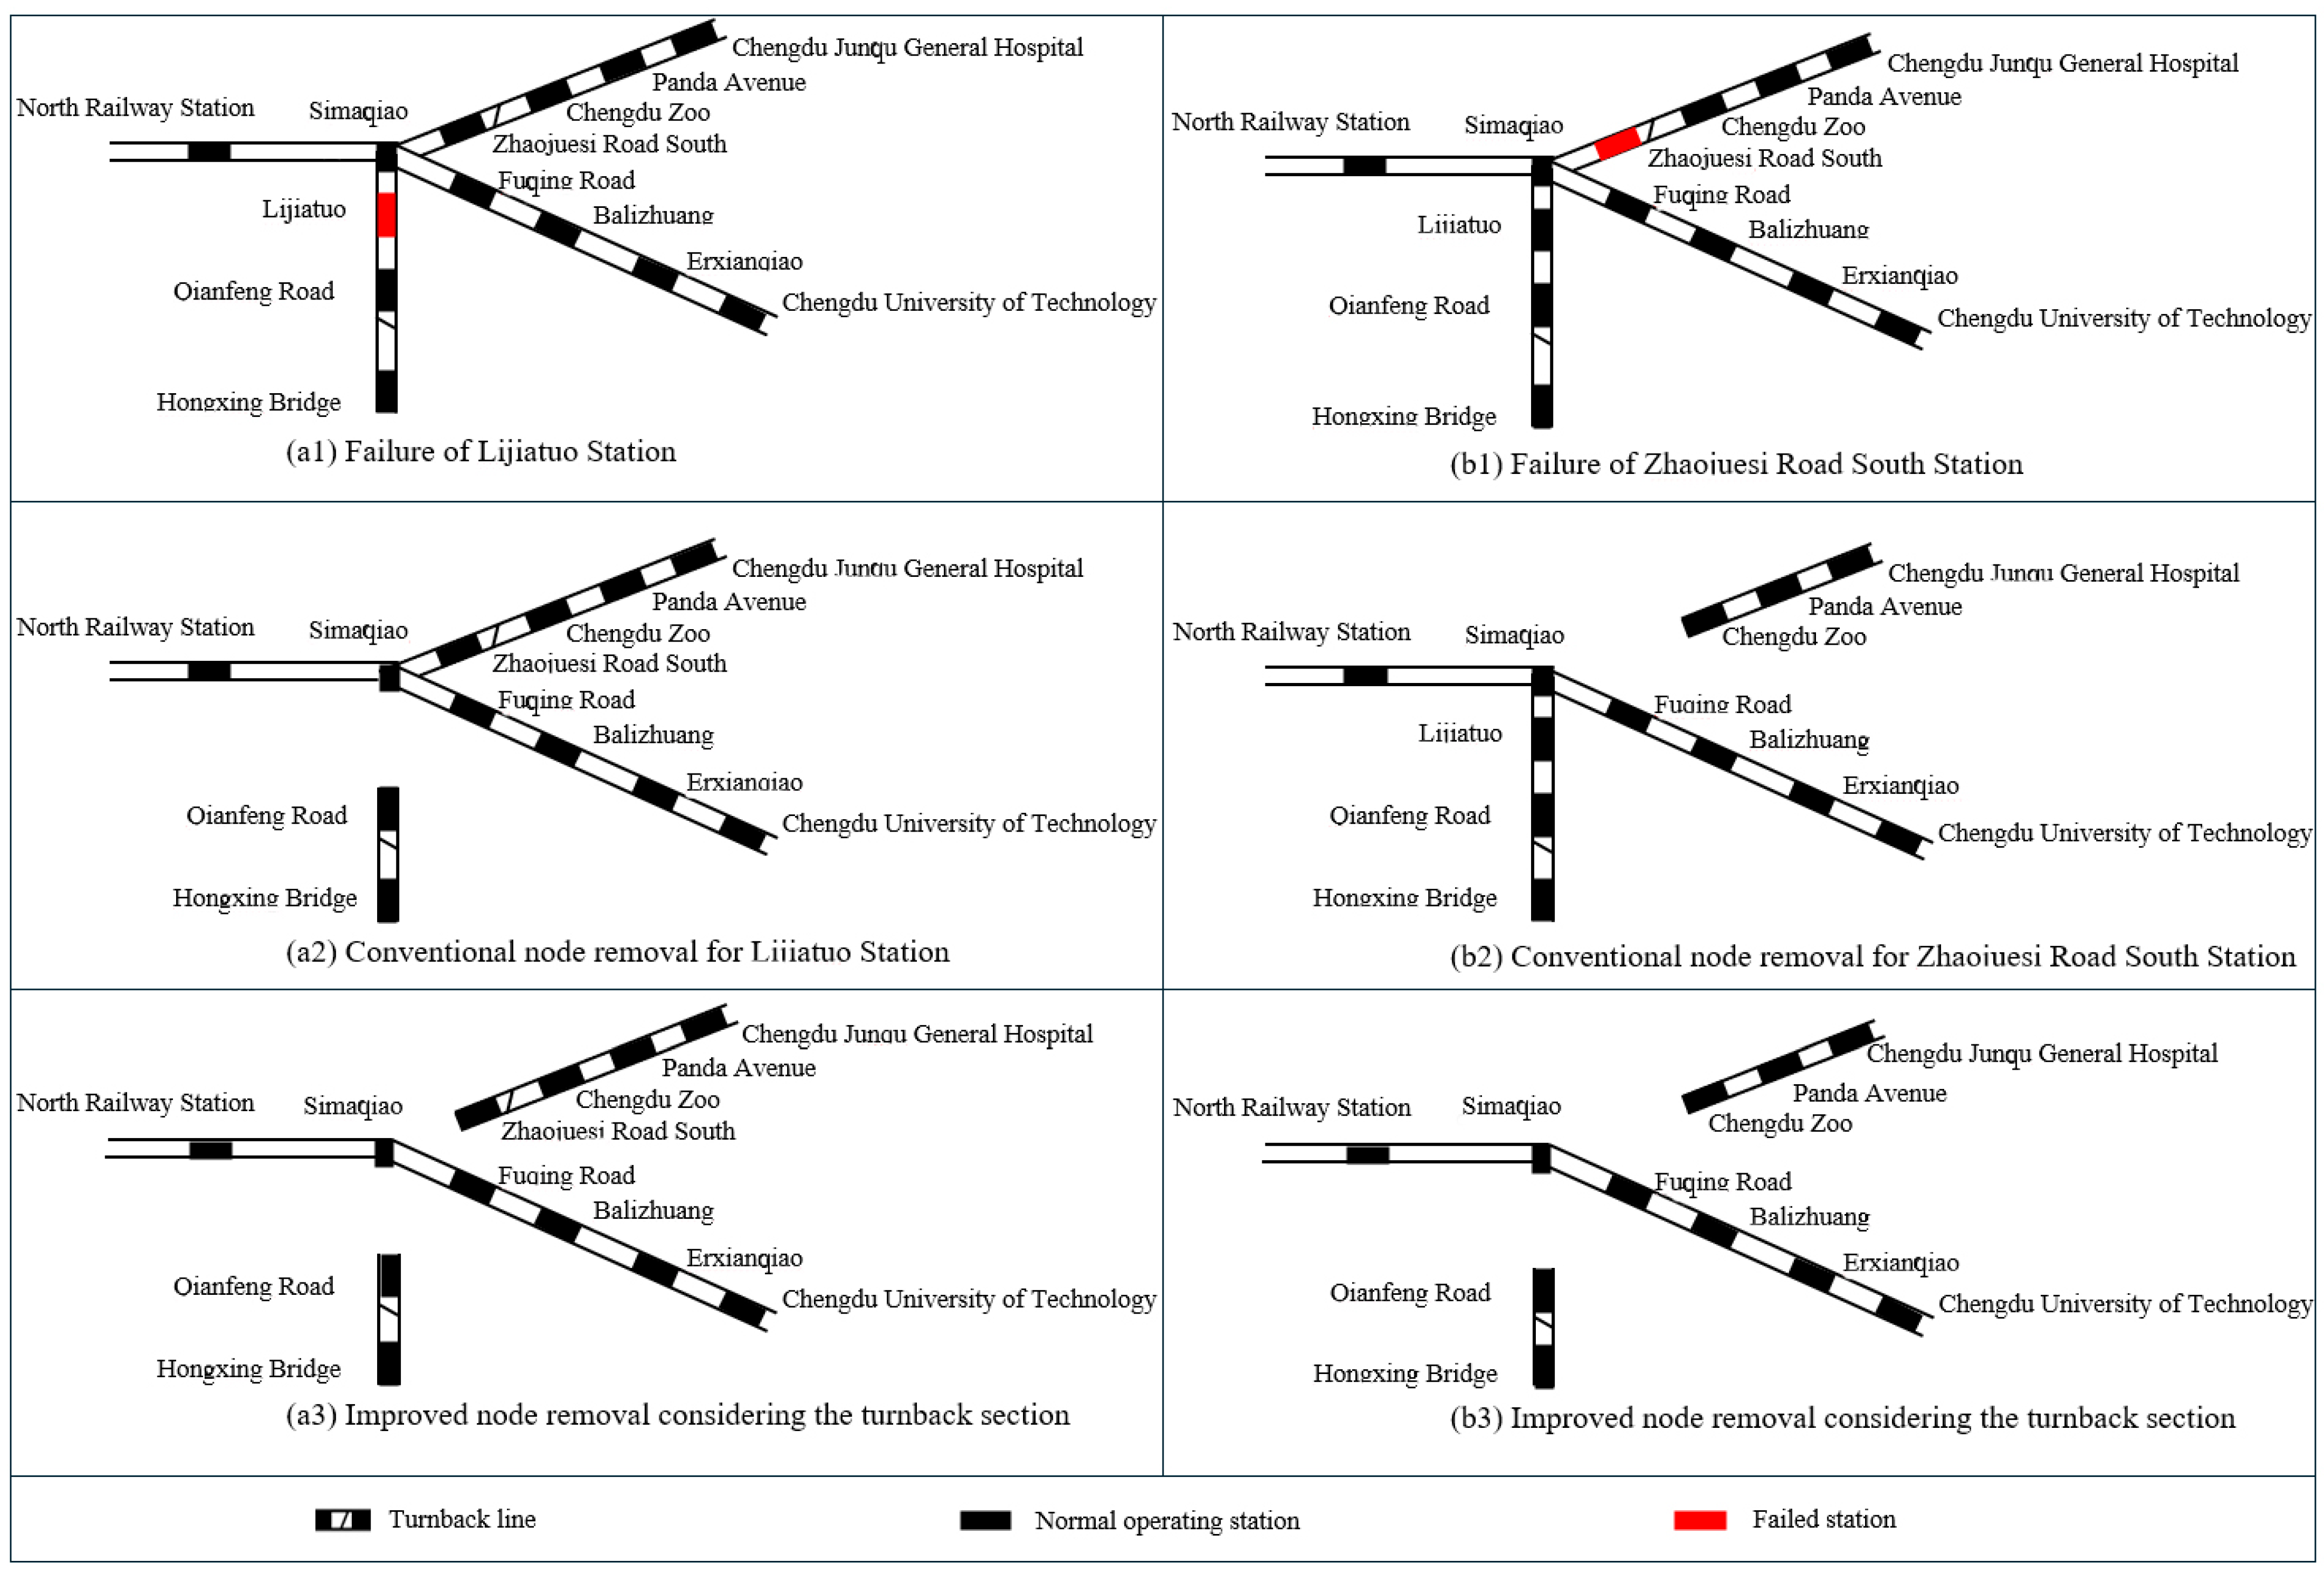
To further illustrate the impact of turnback stations on the identification of critical stations, the turnback sections where the top 5 stations with the largest changes are located are shown in
Figure 7.
Figure 7 illustrates the folding (turnback) sections of the urban rail transit network and their topological relationship with the ring line and radial lines. As shown in the figure, the folding segments play a critical role in maintaining train circulation and connectivity between the radial lines and the central network area.
The primary reason for this deviation lies in the simplified assumption adopted in the original node removal method, which considers only the failure of the target node itself while neglecting the section-level operational impacts on other stations within the same turnback section. In practice, the failure of a turnback related station can indirectly disrupt train circulation and service continuity of adjacent stations. By ignoring these affected nodes, the original method underestimates the actual impact scope of disruptions, particularly for stations located within operationally coupled sections. Consequently, the improved node removal method, which incorporates the indirect failure effects within the turnback section, provides a more realistic assessment of station importance, leading to notable differences in the evaluation results under the two methods.
Among the stations identified, Lijiatuo Station and Wannianchang Station are both non-interchange stations and are not directly located at the intersection of the ring line and the radial lines. Consequently, under the original node removal method, which considers only the failure of the target node itself, their importance rankings are relatively low, as their direct removal does not immediately disconnect major network corridors.
However, these stations are all located within turnback sections. Therefore, station failure will affect not only the station itself and its adjacent lines, but also other stations within the same turnback section. For example, the failure of Lijiatuo Station will lead to the failure of the section from Qianfeng Road Station to Zhaojuesi Road South Station, and the failure of Pucaotang Station will cause the failure of the section from Zhonghe Station to Wan’an Station. This indicates that disruption effects are expanded from a single station to an entire operational section. This disruption prevents stations along the affected radial lines from maintaining effective connections with the network core, resulting in a significant decline in overall network connectivity. Consequently, the difference in the importance evaluation results of these stations under the two node removal methods exceeds 30%. A similar mechanism can be observed for Tianfu Park Station, Shiyang Flyover Station, and Wannianchang Station. Although these stations are also non-interchange stations and their direct failures do not immediately fragment the network, the turnback sections in which they are located include multiple interchange stations or serve as key operational links for train circulation. Therefore, their failures generate broader indirect impacts by affecting multiple lines and transfer paths, which substantially weakens network connectivity.
Overall, the comparison results indicate that the proposed method has both good validity and clear novelty. On the one hand, the top-ranked stations identified by the improved method are highly consistent with those obtained by the original removal method, especially for the leading positions, which demonstrates that the proposed method preserves the core identification results of the traditional approach and is therefore reliable. On the other hand, after incorporating the indirect effects of turnback sections, the improved method is able to identify several stations whose importance was previously underestimated. This means that the method not only maintains consistency with the original evaluation results, but also uncovers some operationally critical stations that were overlooked before. Therefore, the proposed method can provide a more refined and realistic basis for critical station identification in urban rail transit networks.
5. Conclusions
This study proposes an identification method for critical stations in urban rail transit networks considering turnback stations under bidirectional operational disruptions. The main conclusions can be summarized as follows.
First, in terms of methodological contribution, this study proposes a critical station identification method that combines an improved node removal strategy with a comprehensive evaluation framework. Specifically, the improved node removal method incorporates the indirect failures caused by train operation adjustments within the same turnback section under bidirectional interruptions, while the evaluation framework integrates indicators from network connectivity, network topology characteristics, and station attributes, with the TOPSIS method and objective weighting used for synthesis. In this way, the proposed method can provide a more systematic, realistic, and data-driven assessment of station importance, and it is able to identify stations whose importance is underestimated by conventional approaches while preserving the core identification results.
Second, in terms of key findings, the results indicate that station criticality is jointly determined by network structure and operational characteristics. Interchange stations and stations located near loop–radial intersections remain dominant due to their roles in maintaining network connectivity. At the same time, several non-interchange stations located within key turnback sections are also identified as critical, as their failures may trigger section-level service interruptions and significantly expand the impact scope of disruptions.
Finally, from the perspective of practical implications, the proposed method can support disruption preparedness and emergency response by helping transit agencies identify priority stations, anticipate corridor-level and turnback-related disruption scenarios, and assist in decision-making for passenger rerouting and emergency resource allocation.
By accounting for indirect failure effects, the proposed method provides a more accurate identification of critical stations, which is valuable for improving network resilience analysis, emergency management strategies, and the proposed research method can be applied to urban rail transit networks in other diverse cities. It should be noted that these conclusions are derived under the current modeling assumptions. To facilitate the research, this paper has simplified the actual situation, so there are still several aspects worthy of further investigation.
First, from a methodological perspective, this study adopts a topology-based network representation with predefined turnback sections and employs a single objective weighting method without conducting sensitivity analysis. In addition, the failure modeling focuses on disruption impacts but does not explicitly incorporate dynamic operational processes such as train scheduling, headway adjustments, and recovery strategies. To maintain model tractability and focus on section-level failure propagation, detailed operational constraints are simplified in the current framework. In particular, operational factors such as turnback capacity and rolling stock constraints are not explicitly modeled, although they may influence the actual extent of disruption propagation. Future research can address these limitations by integrating dynamic train operation data, incorporating alternative weighting schemes, and designing experiments under different modeling assumptions to evaluate the robustness of the results.
Second, from a data and demand representation perspective, passenger flow is indirectly represented through station attribute indicators, while dynamic passenger demand and rerouting behavior are not explicitly modeled. In addition, OD-based demand characteristics and transfer passenger flows are not directly incorporated due to data availability constraints. Future studies may incorporate time-varying passenger flow data and behavioral responses, as well as OD-based demand variables, enabling the framework to capture both network-level connectivity degradation and passenger-level service impacts.
Third, from an application perspective, although the proposed method demonstrates its effectiveness using the Chengdu Metro network (2022), the practical application value is mainly discussed qualitatively, and quantitative evaluation has not yet been conducted. In addition, the Chengdu Metro network has undergone significant expansion in recent years. Future research can apply the proposed method to updated network data (e.g., Chengdu Metro as of 2025) and extend the analysis to other urban rail transit systems with different network structures.
Finally, to quantitatively evaluate the application value of the proposed method in disruption planning and emergency response, simulation-based studies can be conducted, examining factors such as disruption duration, affected passenger scale, recovery efficiency, and operational cost. In addition, network performance indicators including accessibility degradation, travel time increase, and service reliability can be incorporated to provide a more comprehensive evaluation of disruption impacts.