1. Introduction
Snow, as a key component of the cryosphere, is an important part of the surface coverage [
1,
2,
3]. Its unique high albedo, low thermal conductivity, and phase change latent heat effect significantly influence the surface radiation balance, hydrological cycle, and atmospheric circulation pattern and have extremely high response sensitivity to global climate change [
4,
5,
6]. In China, snow is widely distributed in the northeastern region—Inner Mongolia, the Qinghai–Xizang Plateau, and the northern part of Xinjiang, which are all high-latitude or high-altitude areas. Especially in arid and semi-arid regions, meltwater is a crucial source of water resources, directly affecting agricultural and livestock production as well as the stability of the ecosystem [
2,
7,
8,
9]. The western foothills of the Greater Khingan Mountains in Inner Mongolia lie in the transitional zone between arid and humid climates, and are an important ecological barrier in northern China [
10,
11,
12]. Influenced by topography and monsoons, this area has a long and abundant snow cover in winter, which not only ensures the water supply for the grassland ecosystem but is also a major factor causing snow disasters in pastoral areas and threatening the safety of life and property [
13,
14,
15]. Therefore, a thorough understanding of the temporal and spatial characteristics as well as the evolution patterns of the snow cover in this area is of great significance for regional ecological protection and disaster prevention.
Recent studies have systematically investigated the spatiotemporal variations in snow cover across China’s three main stable snow regions. Among them, the Qinghai–Tibet Plateau (QTP) maintains the largest stable snow-covered area, followed by the Northeast-Inner Mongolia region, with Northern Xinjiang presenting the smallest spatial extent but highly concentrated snow depth [
6]. At the regional scale, continuous remote sensing monitoring utilizing MODIS products has revealed the dynamic evolution of snow cover. For instance, in Northern Xinjiang and the Altai Mountains, multi-decadal satellite observations and topographic analyses indicate that the regional snow cover fraction exhibits significant interannual fluctuations with an overall, yet statistically insignificant, declining trend [
9]. In the Northeast-Inner Mongolia region, spatial heterogeneity is highly pronounced; research indicates that snow distribution is strongly regulated by climatic variables, with the most persistent snowpack concentrated in the Hulunbuir and Hinggan League areas, where annual snow cover duration consistently exceeds 90 days [
16,
17]. Furthermore, extensive evaluations based on long-term meteorological station data across the Qinghai–Tibet Plateau emphasize that snow depth is positively correlated with elevation, and its climatic response is highly season-dependent: winter snow depth is primarily driven by precipitation, whereas spring and summer snow dynamics are predominantly regulated by temperature fluctuations [
18]. However, most existing research has focused on large-scale generalizations, such as analyzing snow cover dynamics across the entirety of China or broad hemispheric scales [
6,
10], while systematic exploration of the specific geographical unit of the western foot of the Greater Khingan Mountains remains relatively weak. Furthermore, most studies often focus solely on the effects of climatic factors or geographical factors, lacking systematic research that combines the two for quantitative comparison. Moreover, there is still a need for further exploration to reveal the sensitivity response mechanism of the long-term snow dynamics in this region to climate change.
In view of this, this paper utilizes the long-term series of remote sensing inversion data of snow parameters from 1982 to 2024, along with the corresponding temperature, precipitation and elevation data, to analyze the spatiotemporal distribution and evolution patterns of snow parameters, as well as the coupling driving mechanisms of climate factors and geographical factors on snow changes. The aim is to provide scientific support for the dynamic evolution understanding of the northern ecological barrier and water resource management.
2. Study Area and Datasets
2.1. Overview of the Study Area
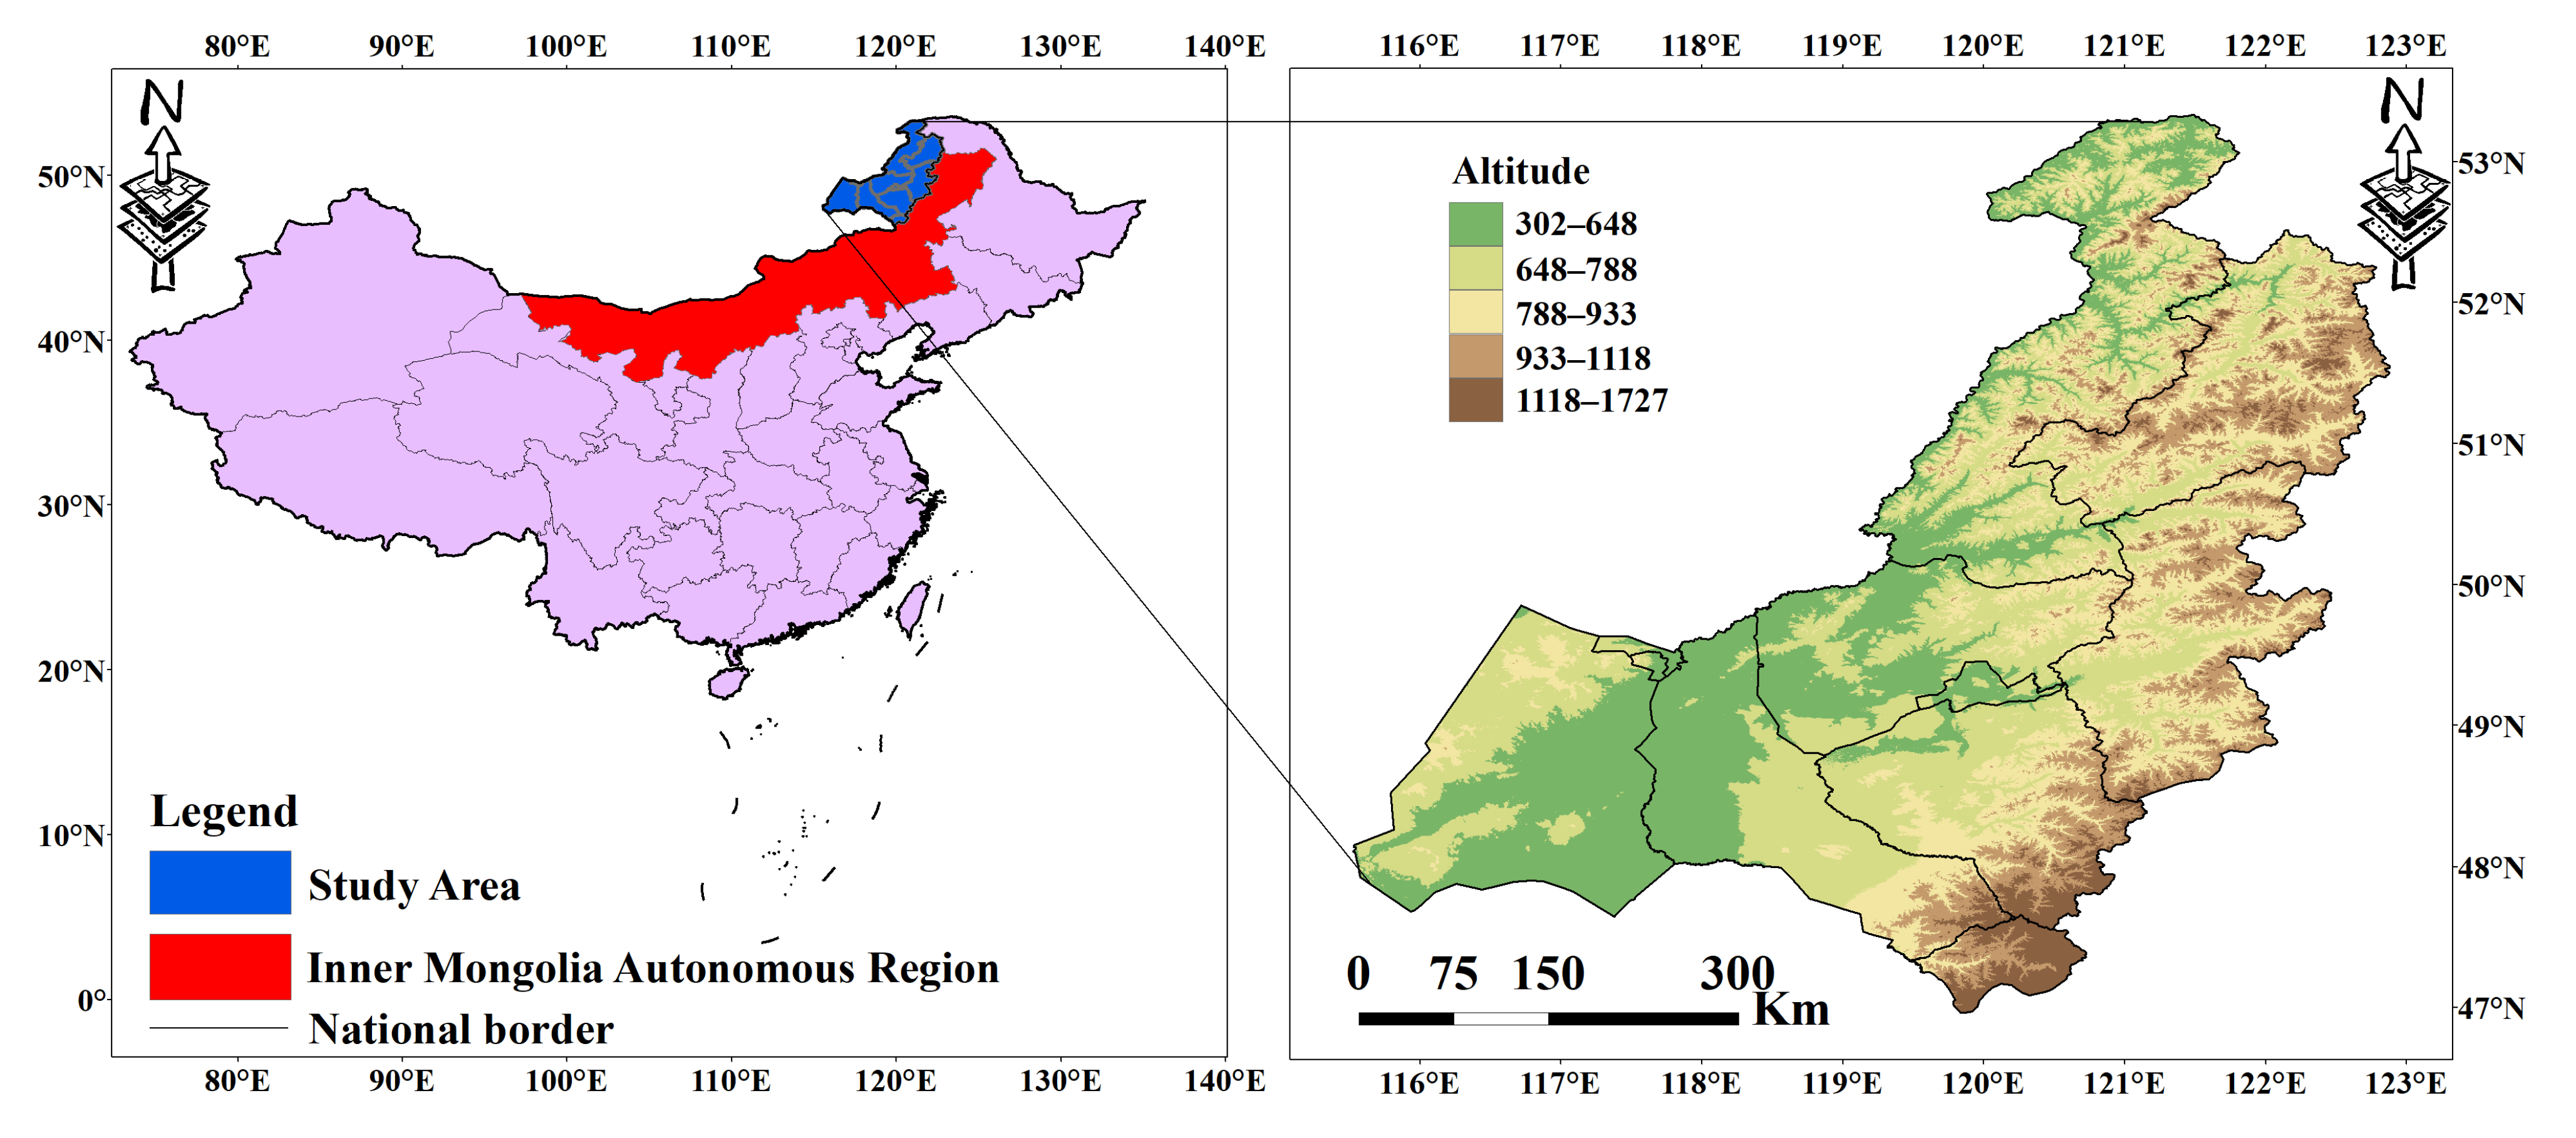
The western foothills of the Greater Khingan Mountains in the Inner Mongolia Autonomous Region are located in the northeastern part of Inner Mongolia (
Figure 1). Their geographical coordinates range from N46°10′ to 53°30′, and from E115°30′ to 123°20′ [
19,
20,
21,
22,
23]. The administrative area includes the western part of Hulunbuir City and the northern part of Xing’an League. It borders the Eastern Province of Mongolia to the east, is adjacent to the main ridge of the Greater Khingan Mountains to the west, connects with the Xilingol Grassland to the south, and is adjacent to the Ermengalin River Basin to the north [
24,
25,
26]. As a transitional zone between the Inner Mongolia Plateau and the Northeast Plain, this area has a stepped topography with higher elevations in the east and lower ones in the west. It belongs to the mid-temperate semi-arid continental monsoon climate zone, with an annual average temperature ranging from −2 to 3 °C, and the extreme low temperature reaching −45 °C; the annual precipitation is 250–400 mm, with the snowfall period lasting for 6 months (from October to the following April), and the snow depth is generally 5–30 cm, with some mountainous areas reaching over 50 cm [
27,
28,
29]. This area is not only an important ecological security barrier in northern China, but also a crucial transitional zone between arid and semi-arid regions and humid areas. The land is mainly composed of natural grasslands and forests, and there are some ecological problems such as grassland desertification and wetland shrinkage in some areas [
29,
30,
31].
2.2. Data Sources and Preprocessing
The data used in this article include remote sensing data of snow cover, meteorological data and geographical data. The sources of the data and specific information are presented in
Table 1. To maintain the consistency of the data in terms of time and space, using the R language, the high-precision dataset was resampled and cropped to 1/12° × 1/12° through the nearest neighbor interpolation method. The time range was from 1982 to 2024. The snow phenological data was only used from 1982 to 2020 because the original time span of the AVHRR China Snow Phenological Dataset used was from 1980 to 2020, and there was no official matching data for 2021 to 2024. To ensure the consistency of data in time and space and the reliability of the analysis, the time period was not forcibly extended. Using the DEM digital elevation data provided by the Geospatial Data Cloud, with a spatial resolution of 1 km, the spatial distribution of watershed slope and aspect was obtained through ArcGIS 10.8 software. Currently, this snow cover data has been widely applied in various fields such as the analysis of snow temporal and spatial changes and influencing factors in the upper reaches of the Yarlung Zangbo River, as well as related research in the Sanjiangyuan region and the Qinghai–Xizang Plateau, and its reliability is relatively high [
18,
32,
33]. The long-term annual mean values of snow cover fraction (SCS), snow cover depth (SCM), snow cover days (SCD), average snow depth, precipitation and temperature in Inner Mongolia from 1982 to 2024 are provided in
Table S1 of the Supplementary Materials.
3. Research Methods
3.1. Definition of Snow Cover Parameters
Based on the characteristics of seasonal changes in snow cover, this paper follows the research of Tang et al. [
45] and defines the period from 1 September of the current year to 31 August of the following year as a hydrological year. The snow parameters in this paper refer to snow depth and snow phenology, including snow cover days (SCD), snow cover start date (SCS), and snow cover melt date (SCM) [
46,
47,
48].
The number of snow cover days refers to the total number of days with snow cover within a snow season [
47]. By counting the total number of times each snow pixel appears in each snow year, the SCD within the snow season in the western foothills of the Greater Khingan Mountains can be obtained.
where the value of SCD ranges from 0 to 366 days;
n represents a complete hydrological year (365 or 366 days); and
Si represents the binary pixel value of the daily snow cover dataset (1 indicates snow cover, and 0 indicates land).
Following standard meteorological observation practices set by the China Meteorological Administration and consistent with the literature, the threshold for a valid snow cover day is defined as a snow depth of h ≥ 1 cm [
34,
45]. Based on this criterion, the date when the first occurrence of h ≥ 1 cm of snow occurs during a snow season is defined as the beginning of the snow cover (SCS); the date when the last occurrence of h ≥ 1 cm of snow occurs is defined as the end of the snow cover (SCM) [
34].
where
represents a fixed date, indicating the date of the maximum snow cover in each hydrological year;
is the number of snow cover days before
; and
is the number of snow cover days after
.
The snow depth is the ratio of the sum of all snow depths within the snow season to the number of days in that season, which represents the annual average snow depth.
3.2. Improved Mann–Kendall Test
The improved Mann–Kendall test can eliminate the autocorrelation components in the time series, significantly improving the accuracy of trend testing. It is widely used in hydrological and meteorological research [
49,
50].
(1) Divide each data point in the time series by the average value of the entire series to obtain a set of time series
[
49]. Then, calculate the trend estimate value
β for the new time series:
In Equation (4), when β > 0, the time series shows an upward trend; when β < 0, the time series shows a downward trend.
(2) After removing
Tt from the time series, the corresponding stationary sequence
Yt can be obtained [
49]:
(3) Calculate the autocorrelation coefficient
ri [
49]:
where Ri is the rank of
ri, and
R′ is the average of the ranks.
(4) Calculate the variance
var(
S) of the trend statistics
S [
49]:
(5) Calculate the
Z value of the time series trend to characterize the significance of its change trend. The expressions for
S > 0,
S = 0, and
S < 0 are as follows [
49]:
where
Z > 0 indicates an upward trend;
Z < 0 indicates a downward trend; |
Z| > 1.64 indicates that the trend has passed the significance test with a
p-value of 0.1; |
Z| > 1.96 indicates that the trend has passed the significance test with a
p-value of 0.05; |
Z| > 2.58 indicates that the trend has passed the significance test with a
p-value of 0.01. The specific significance judgment criteria are detailed in
Table 2.
3.3. Correlation Analysis Method
The Pearson correlation analysis method was employed to study the response relationship between SCD changes and temperature and precipitation [
51]. Given that the original time series exhibit non-stationary characteristics (trends), all data were detrended using a linear regression method to obtain stationary sequences before analysis. This ensures that the correlation coefficients reflect the coupled interannual fluctuations rather than shared long-term trends. The calculation formula is as follows:
where
n represents the cumulative number of years in the statistical period,
and
are the two variables for the correlation analysis, and
and
are the average values of the two variables over
n years. When
r > 0, a positive value of
r indicates a positive correlation between the two; when
r < 0, a negative value indicates a negative correlation. The closer the absolute value of
r is to 1, the higher the correlation.
3.4. Linear Regression Analysis
Linear regression analysis, as a statistical method, usually employs multiple independent variables to explain and predict the changing patterns of the dependent variable. The regression coefficients of each independent variable can directly reflect the weight of their influence on the fluctuations of the dependent variable. In this study, climate factors (precipitation, temperature) and terrain parameters (elevation, slope, aspect) were used as independent variables. Based on previous studies [
51,
52] and the physical characteristics of the study area, elevation, slope, and aspect were selected as the core topographic indicators. These specific parameters were selected as the core topographic indicators because they represent the primary physical controls on the regional energy balance (via aspect) and mass redistribution (via slope and elevation) that govern snow cover dynamics. A multiple linear regression model was constructed to reveal the quantitative relationship between snow characteristics and influencing factors, and to clarify the contribution rate of different environmental factors to the dynamic changes in snow depth. It should be noted that elevation and temperature have a correlation in the physical mechanism [
53,
54,
55]. In this study, both elevation and temperature were included in the construction of the regression model, aiming to distinguish the independent contributions of terrain structures other than vertical temperature changes (such as mountain barriers, local circulation) to snow, and the variance inflation factor VIF was less than 3, indicating no severe multicollinearity.
(1) Normalize the independent variables so that their results are mapped to the range [0, 1] [
54]:
(2) Calculation of the contribution rates of each factor [
54]:
where
y represents the snow depth;
(
i = 1, 2, …, 5) are the normalized values of precipitation, temperature, elevation, slope, and aspect;
(
i = 1, 2, …, 5) are the regression coefficients of each influencing factor;
b is the regression residual;
is the contribution rate of factor
i to the snow depth.
3.5. Cross-Wavelet Analysis
This paper uses the cross-wavelet method to analyze the correlation between snow cover parameter meteorological factors, thereby exploring and revealing the driving factors of snow cover parameters in the western foothills of the Greater Khingan Mountains [
56,
57]. The cross-wavelet transformation method combines wavelet analysis and cross-spectrum analysis, and can better present the resonance period and phase relationship between two non-stationary time series. The theory is as follows: Suppose
and
are the wavelet transform coefficients of the time series
and
respectively, then the cross wavelet transform is defined as:
where
represents the complex conjugate of
.
4. Results and Analysis
4.1. Spatial Distribution of Snow Cover Parameters and Influencing Factors
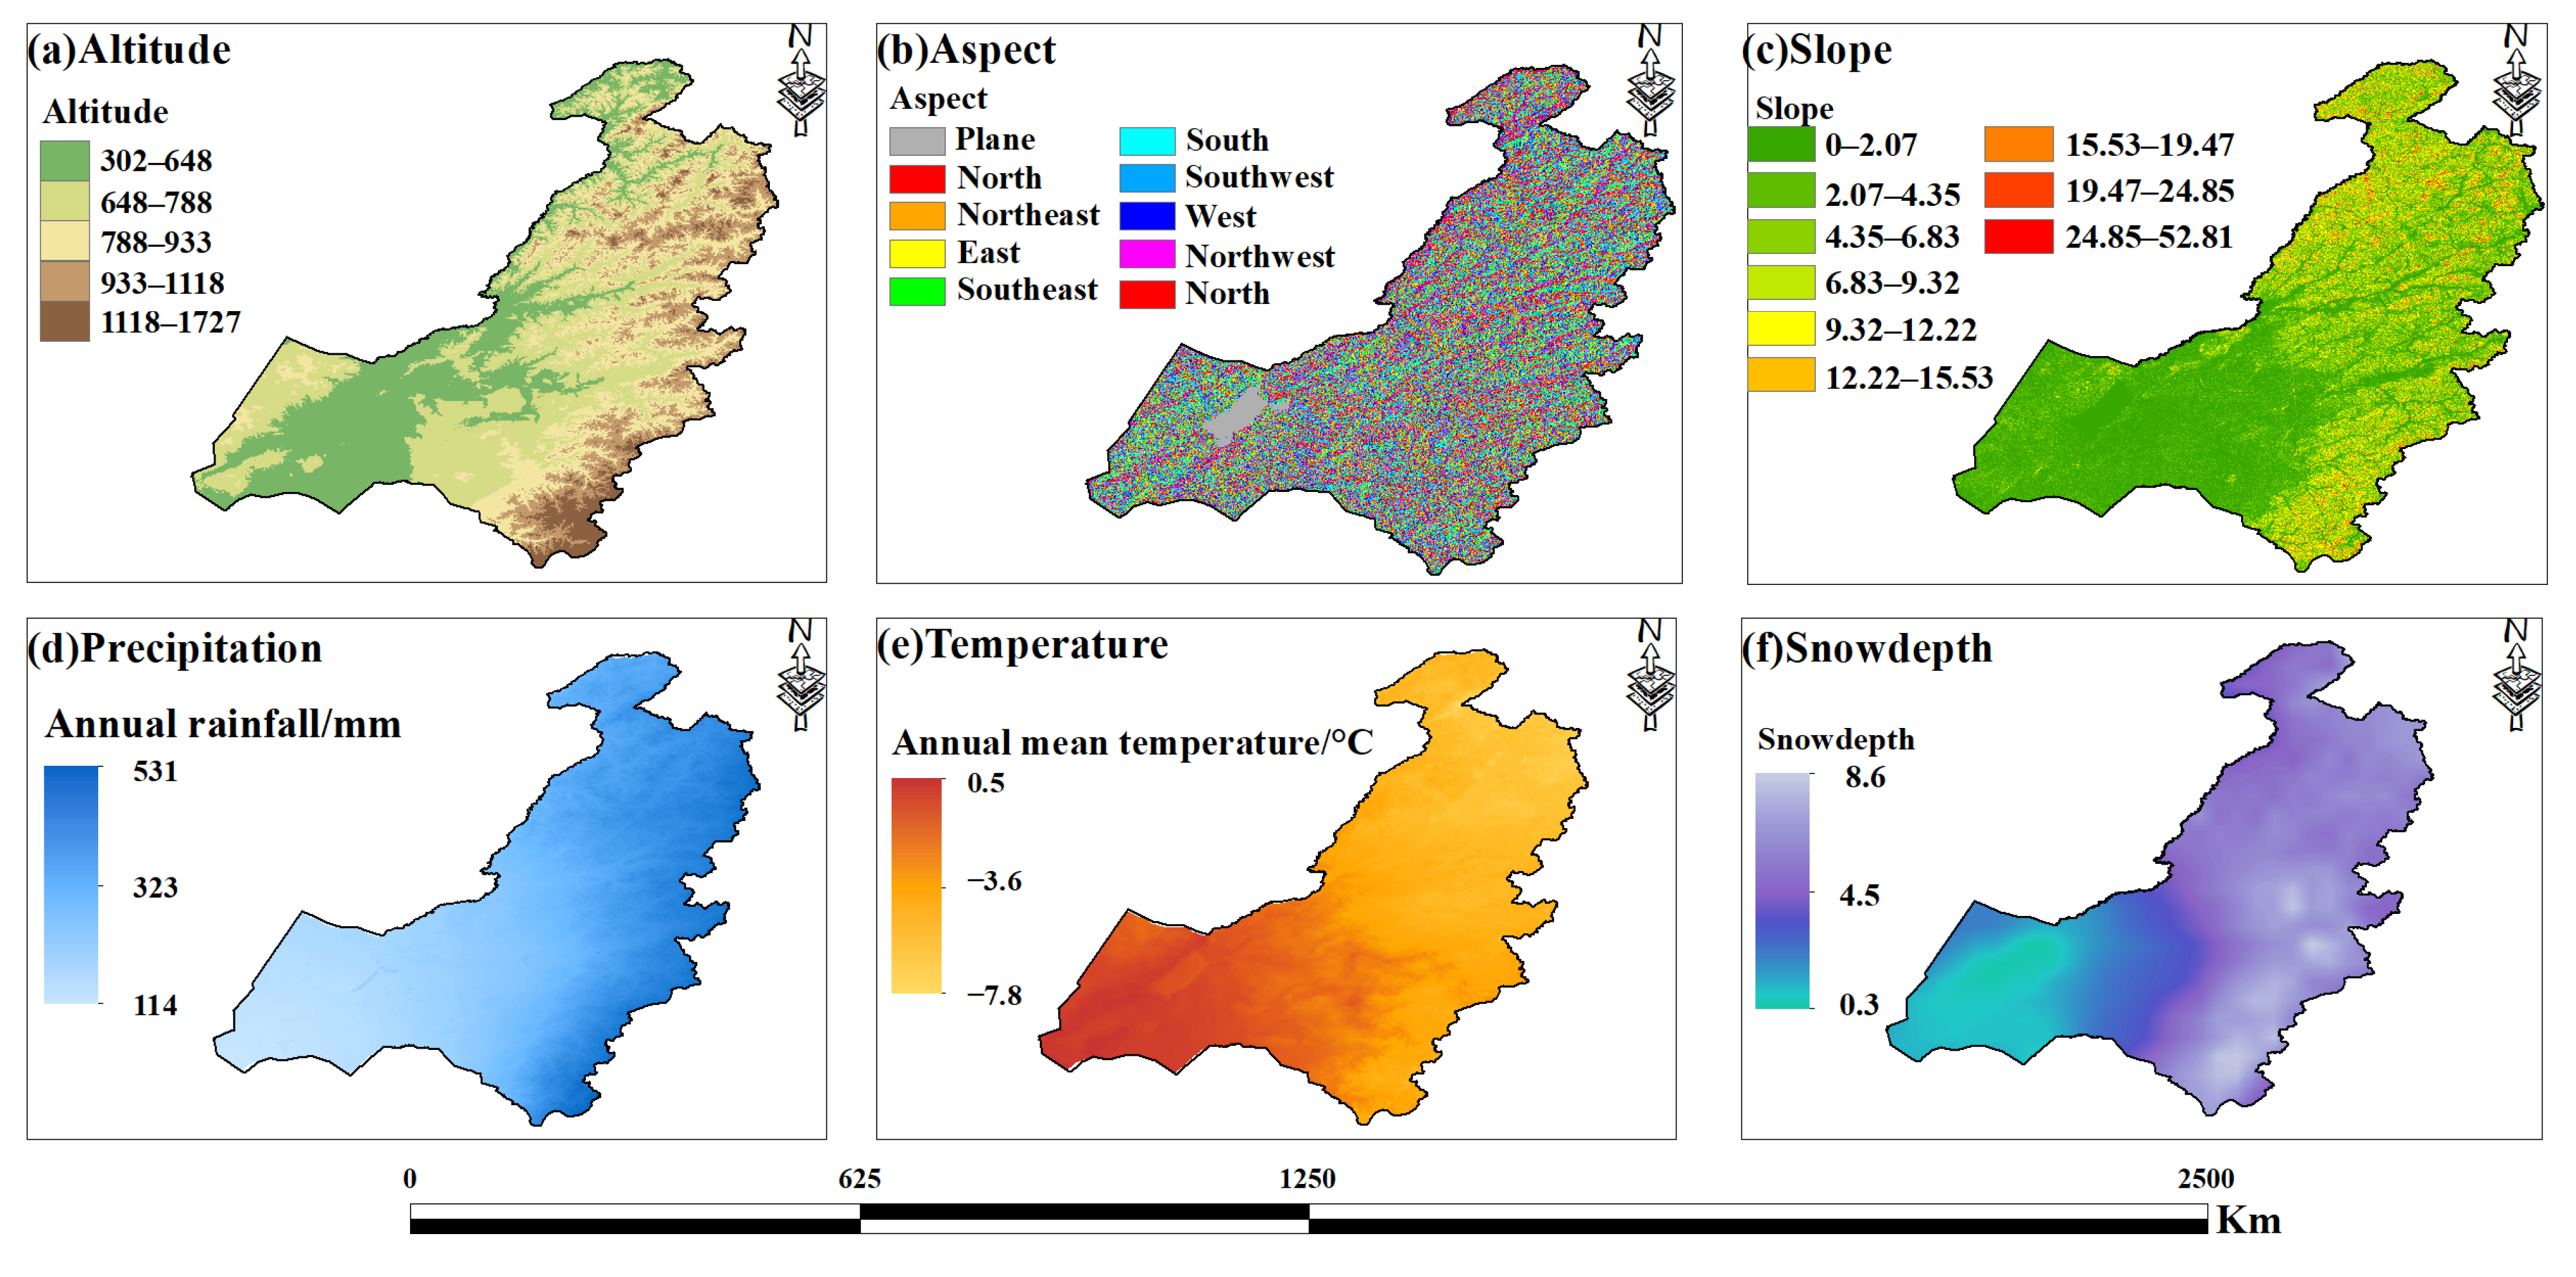
The spatial distribution of elevation, slope, aspect, and the multi-year average values of precipitation, temperature and snow depth in the study area from 1982 to 2024 is shown in the figure.
Figure 2a–c illustrate that in the northeastern part of the western foot of the Greater Khingan Mountains, the altitude is relatively high and the slope variation is significant; in the southwestern part, the altitude is lower, and the slopes in the central and southern regions are steeper. The slope orientation is mainly dominated by the north slope and the northeast slope.
Figure 2d–f reveal that precipitation is relatively abundant in the eastern and southern parts of the Greater Khingan Mountains’ western slope, whereas the northwestern region experiences less. Influenced by geographic factors, temperatures decrease toward the northeast and increase toward the southwest, a pattern closely tied to the altitudinal gradient. Furthermore, the interaction of geographic and meteorological factors drives significant spatial variation in snow depth: it is greater in northeastern and high-altitude areas and lower in southwestern and low-altitude regions. Overall, the high-altitude area at the western foot of the Greater Khingan Mountains has more snow cover days. This is mainly due to the decrease in temperature as altitude increases, which slows down the melting of the snow, and the gentle-sloped terrain is conducive to the accumulation of the snow layer.
4.2. Interannual Variations in Snow Cover Parameters and Influencing Factors
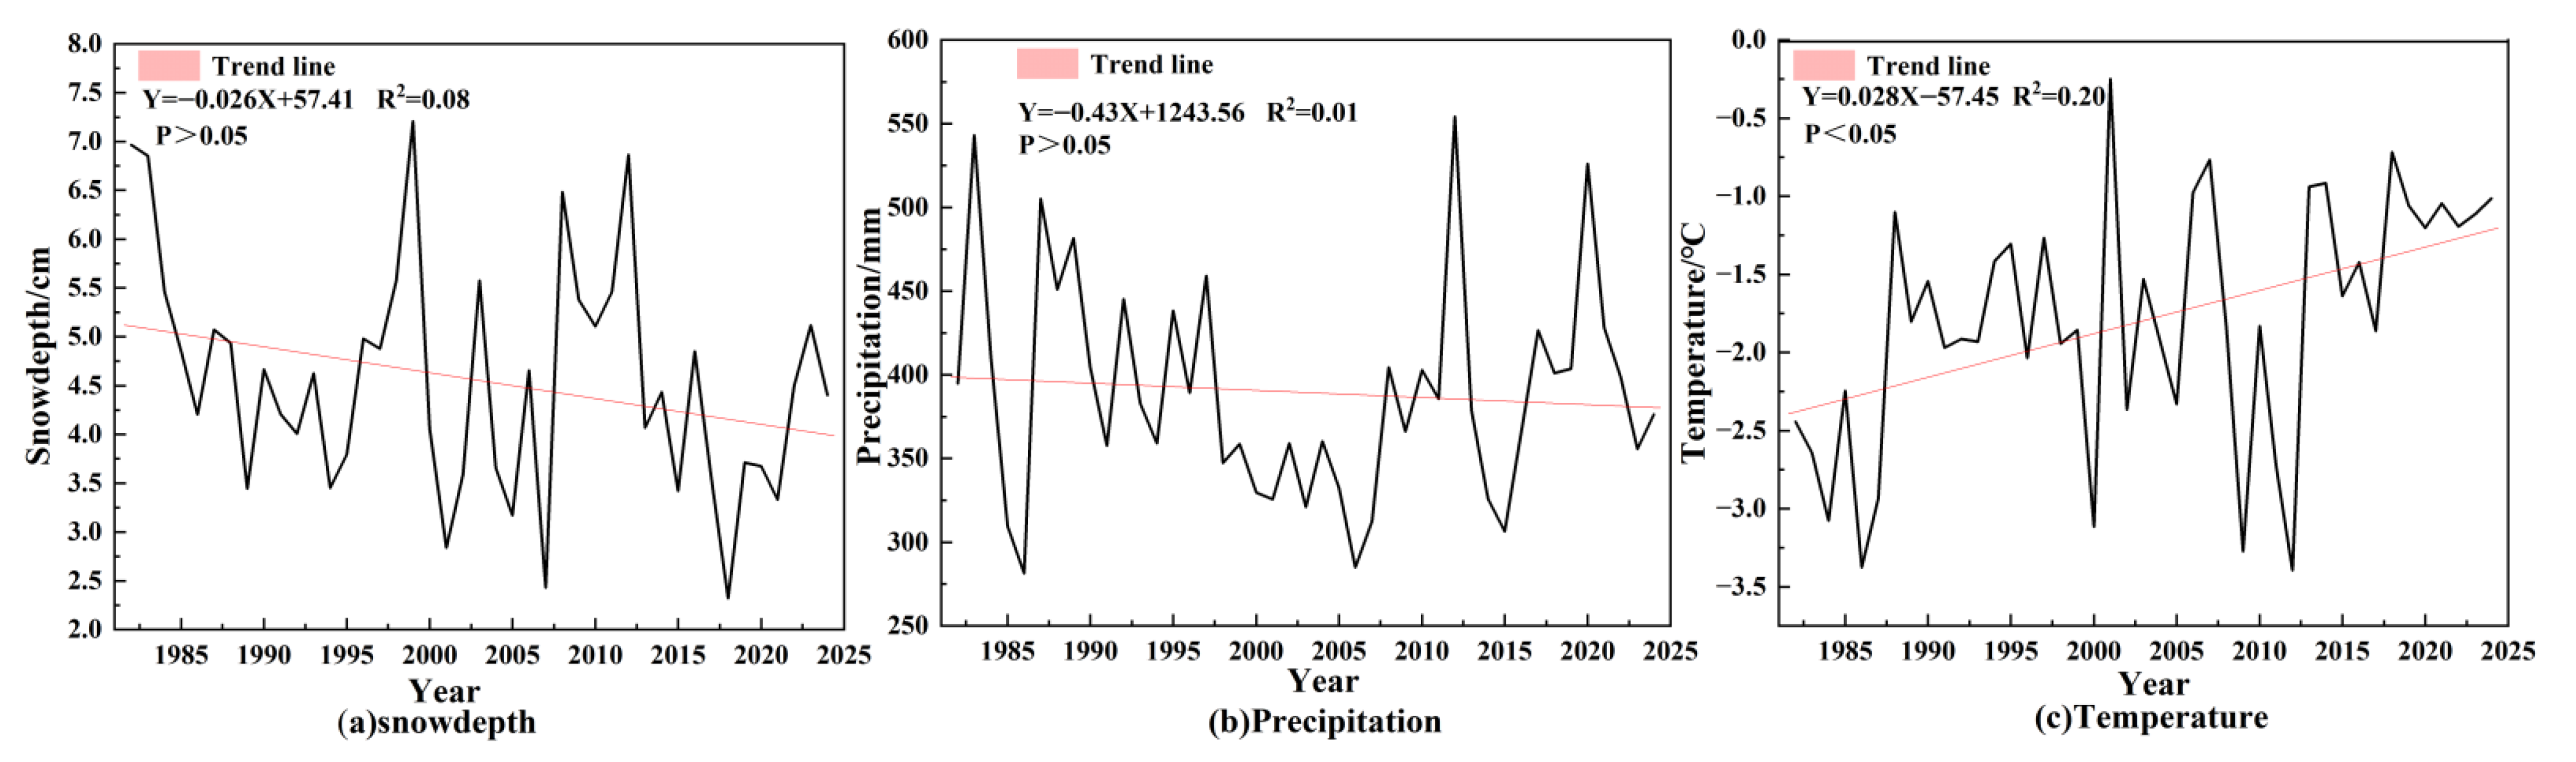
Based on the interannual data of snow depth, annual precipitation, and annual average temperature in the western part of the Greater Khingan Mountains from 1982 to 2024, an analysis was conducted. The results are shown in
Figure 3. During this period, the regional snow dynamics were closely associated with the interannual evolution characteristics of climate factors.
Figure 3a displays that snow depth exhibited a slight, yet marginally significant, downward trend throughout the study period at a rate of −0.026 cm a
−1. Interannual fluctuation was also pronounced, with snow depth ranging from 2.0 cm to 7.5 cm, representing a maximum variation of 5.5 cm.
Figure 3b shows that the annual precipitation exhibits no significant long-term trend and is characterized by strong interannual fluctuations. Although the annual precipitation includes rainfall in the non-snowy period, its extreme interannual instability is also reflected in the snowfall distribution during the snow cover period. Due to its extremely low goodness of fit, it cannot provide a stable supply for snow accumulation, indicating that precipitation is not the dominant factor.
Figure 3c illustrates that the annual average temperature has a significant upward trend, with a warming rate of 0.028 °C a
−1. Especially after 2000, the temperature has remained at a relatively high level, which is highly consistent with the variation range of snow depth.
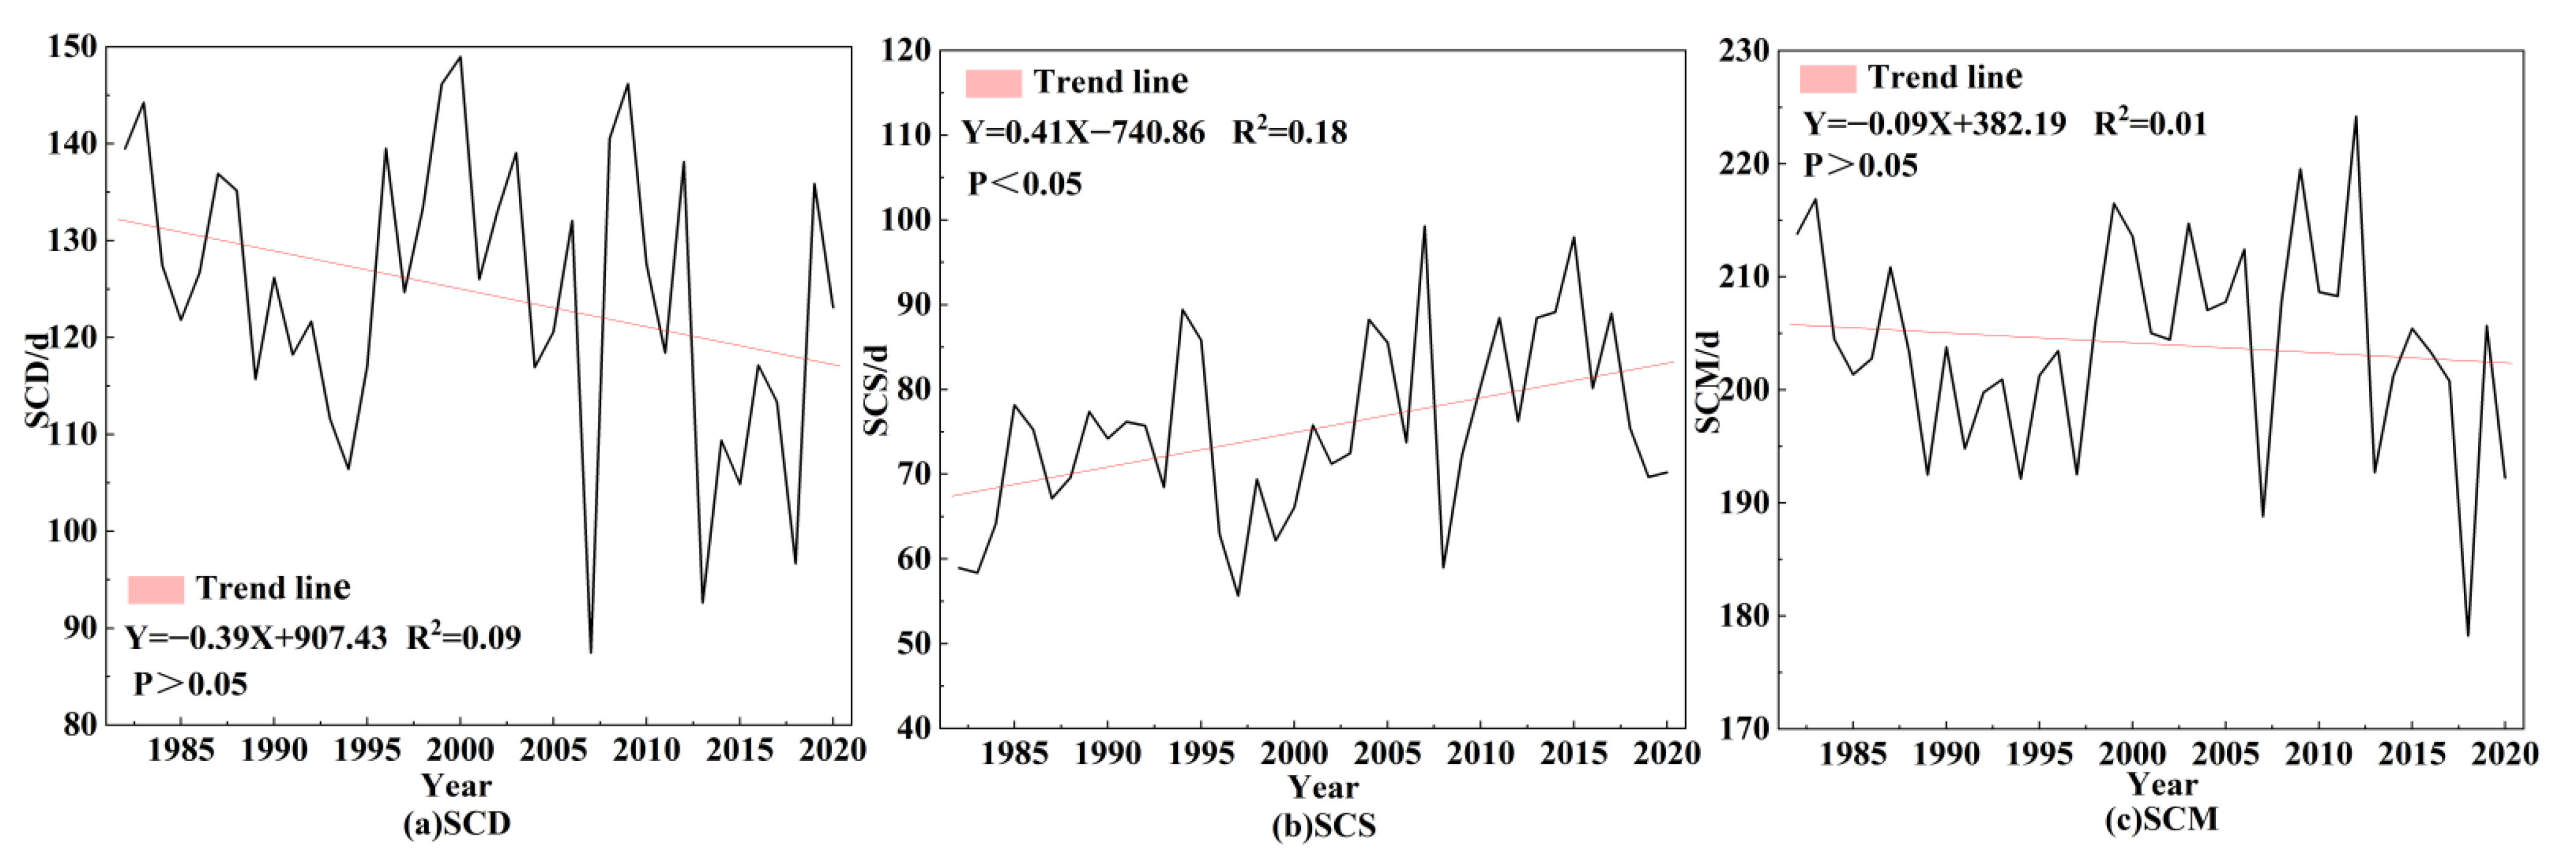
The inter-annual variations in snow phenology in the study area from 1982 to 2020 were analyzed, and the results are shown in
Figure 4. As can be seen from
Figure 4a, the number of snow-covered days in different hydrological years has generally shown a marginally significant downward trend. The number of snow-covered days decreased at a rate of −0.39 d a
−1, and the average number of snow-covered days over many years was 125 days;
Figure 4b exhibits that the SCS in the western part of the Greater Khingan Mountains in Inner Mongolia mainly occurs in October and November. There is a significant trend of delayed SCS, indicating that the SCS gradually shifts later each year.
Figure 4c indicates that the SCM mainly occurs in March and April of the following year. The SCM shows significant interannual fluctuations and does not form a consistent trend.
4.3. Changes in Snow Cover Parameters and Influencing Factors Trends
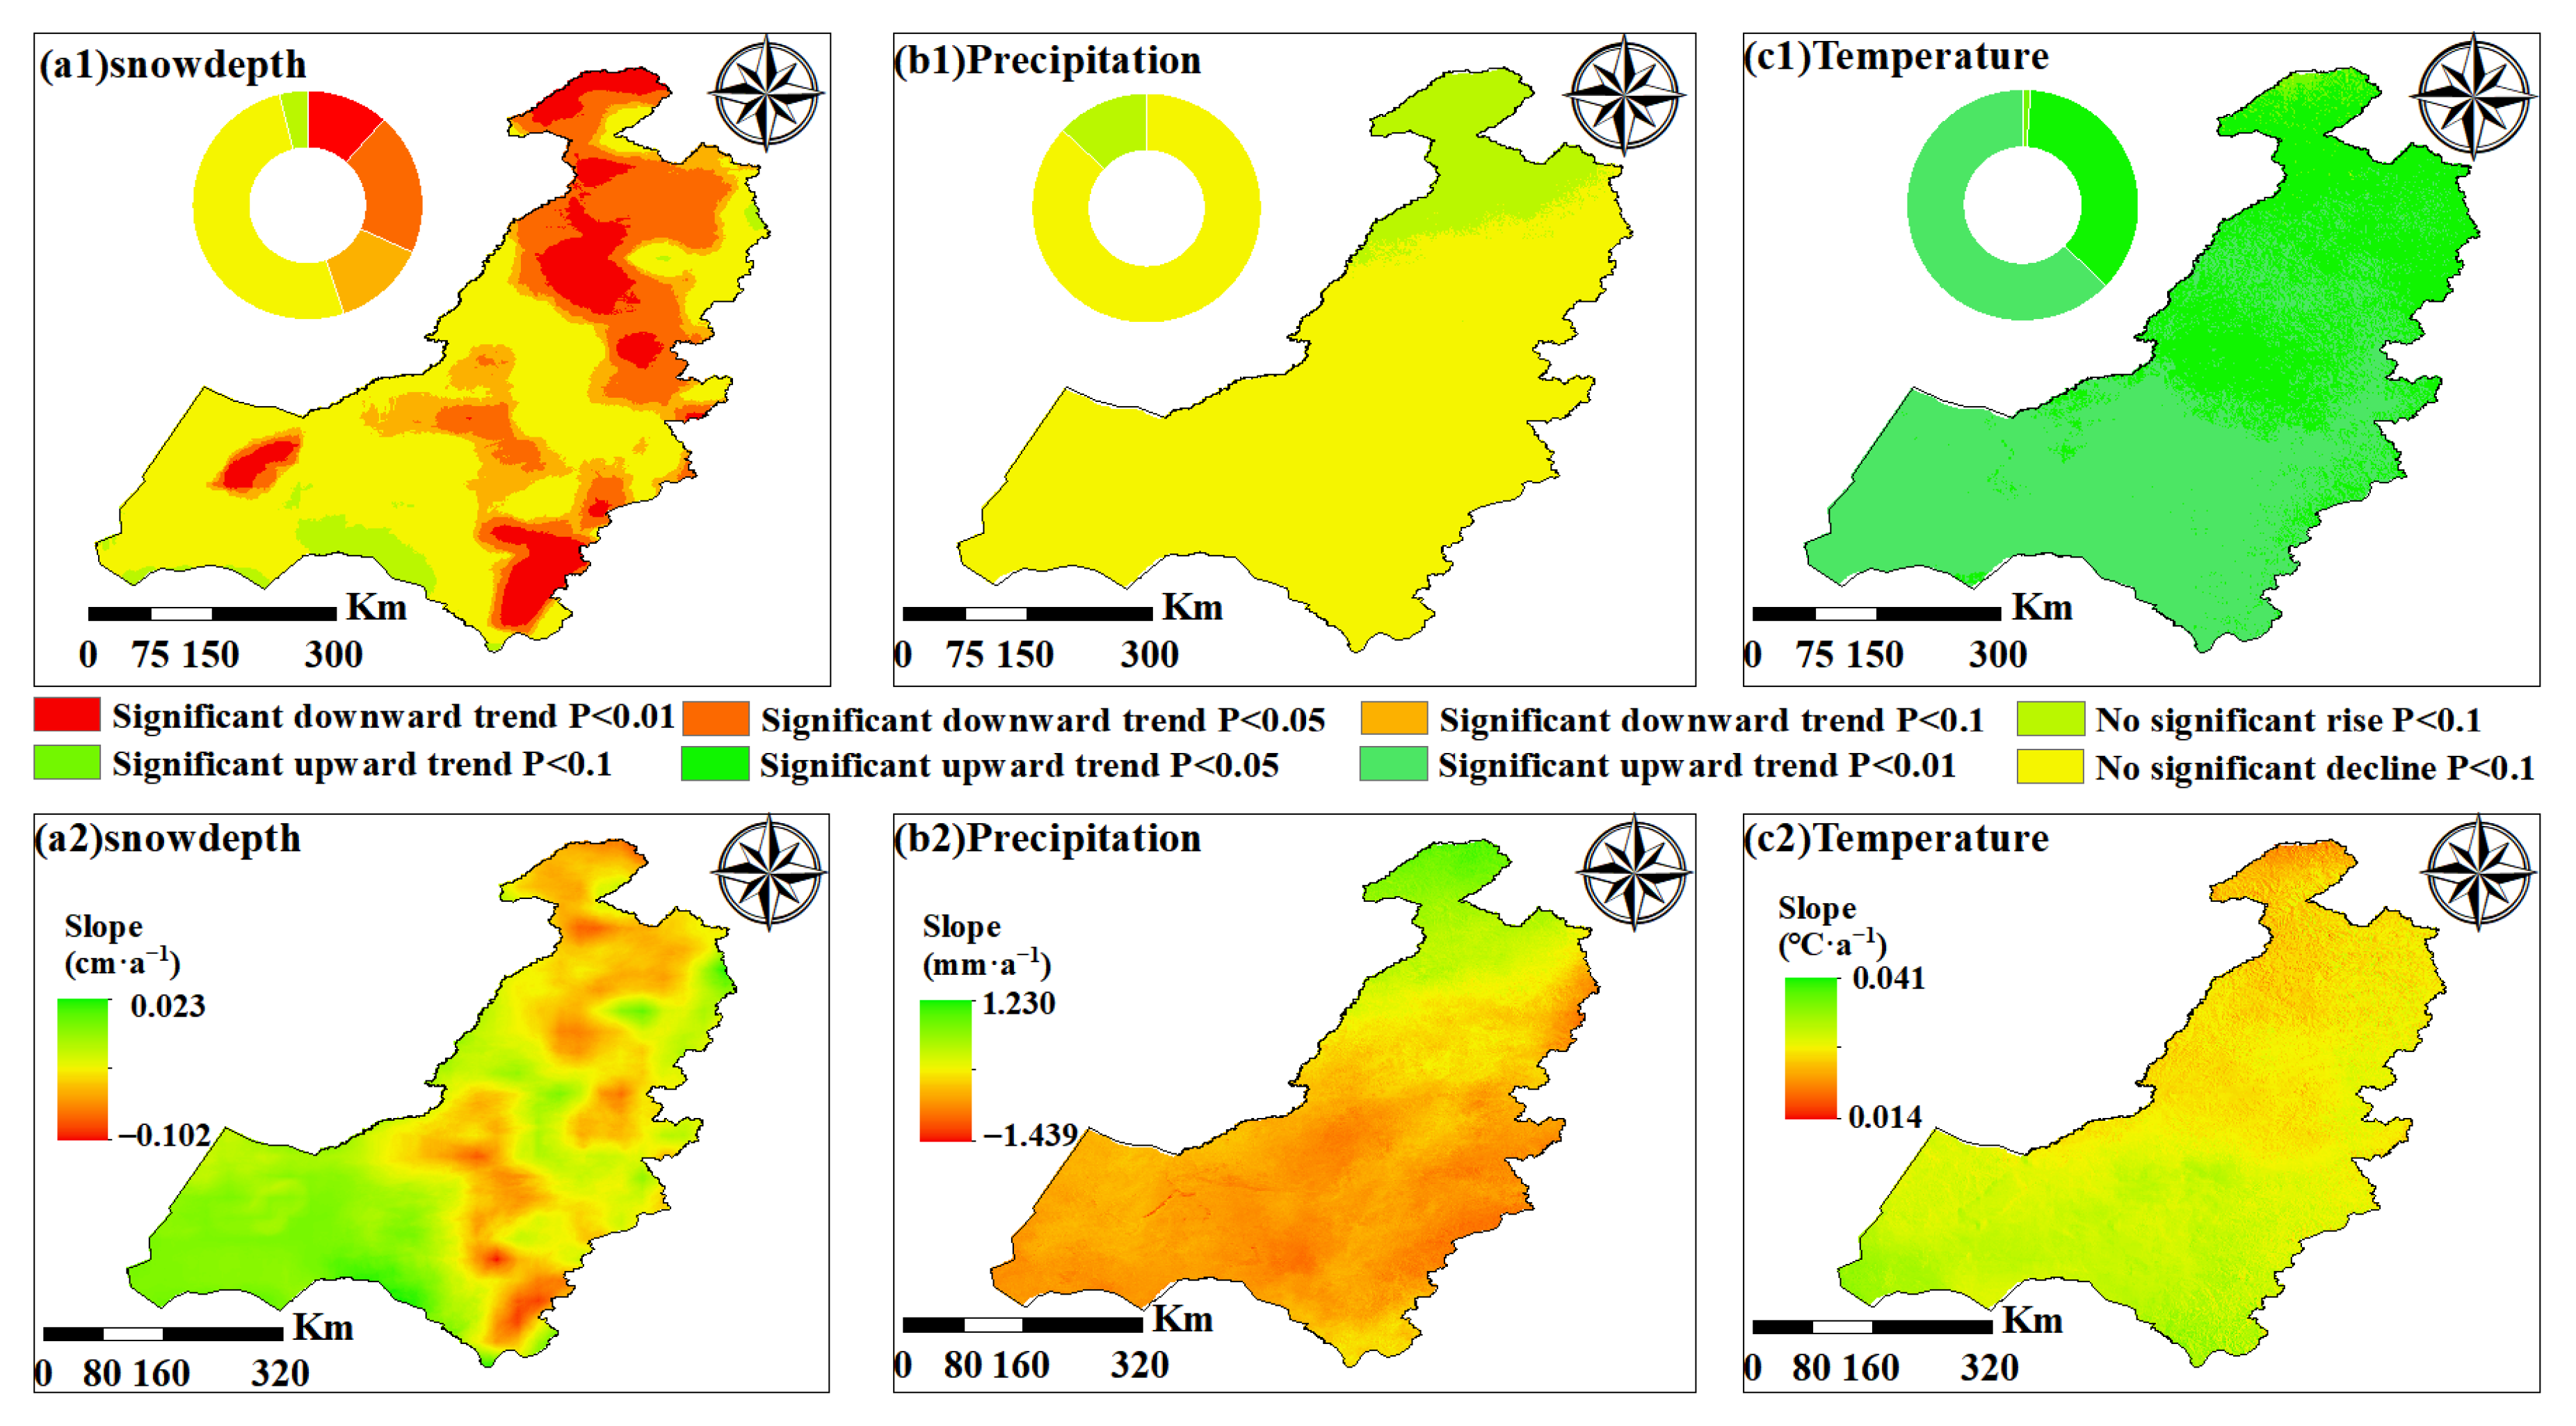
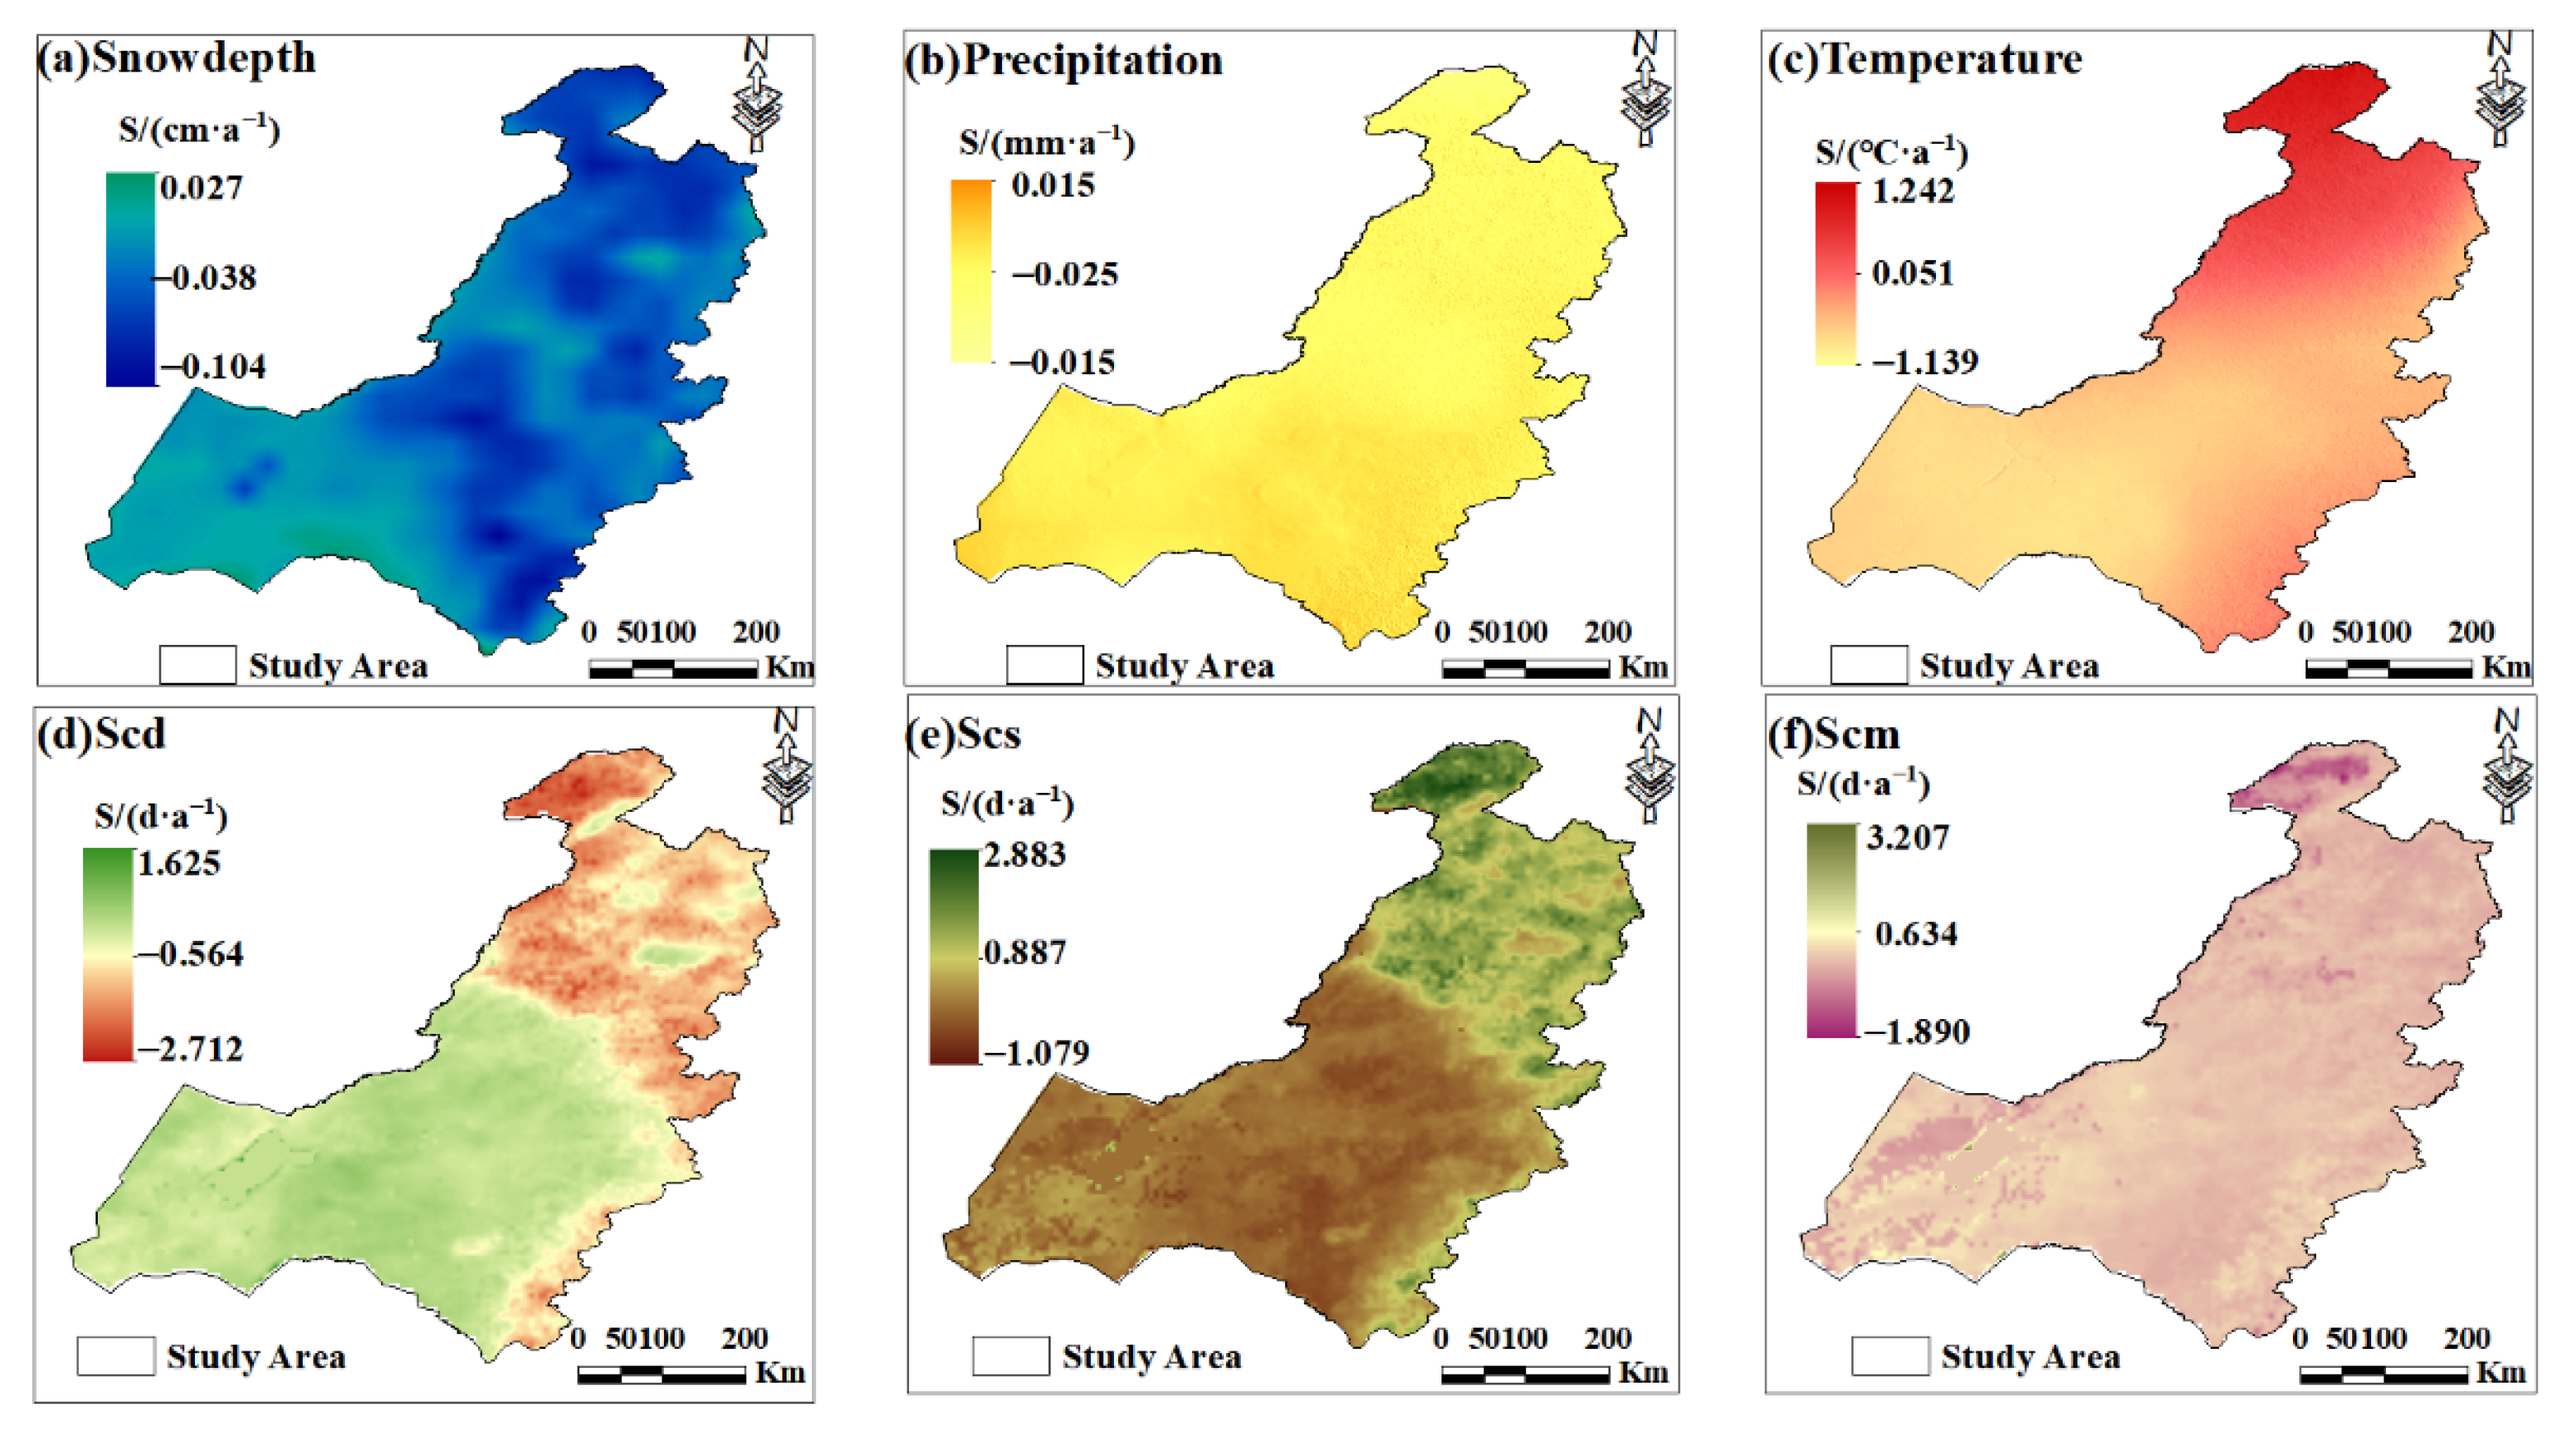
The spatial distribution results of the trend analysis of snow depth and meteorological factors in the western part of the Greater Khingan Mountains from 1982 to 2024 are shown in
Figure 5. A declining trend in average annual snow depth was observed across nearly the entire western foothills of the Greater Khingan Range (96.03% of the area). This reduction was statistically significant (
p < 0.01) in 11.59% of the territory, notably within the northern and southern reaches. Meanwhile, 51.18% of the region experienced a marginal decrease (
p < 0.1), predominantly in the central and southwestern zones. Across the entire study area, snow depth change rates varied between −0.102 and 0.023 cm a
−1. The annual precipitation in the study area mainly showed no significant change. The area with no significant decrease accounted for 86.89%, while the area with no significant increase accounted for 13.11%. The range of change was from −1.439 mm a
−1 to 1.230 mm a
−1. The annual average temperature shows a general upward trend. The warming trend is particularly significant in the high-altitude areas of the northwest and the hilly regions of the southeast (Z > 1.96,
p < 0.05), while the warming amplitude in the central river valleys is relatively limited. Among them, the area showing an extremely significant increase accounts for 62.72% (
p < 0.01), and the area showing a significant increase accounts for 36.18% (
p < 0.05). The temperature has shown a significant upward trend throughout the region, which is in close alignment with the areas where the snow depth has decreased.
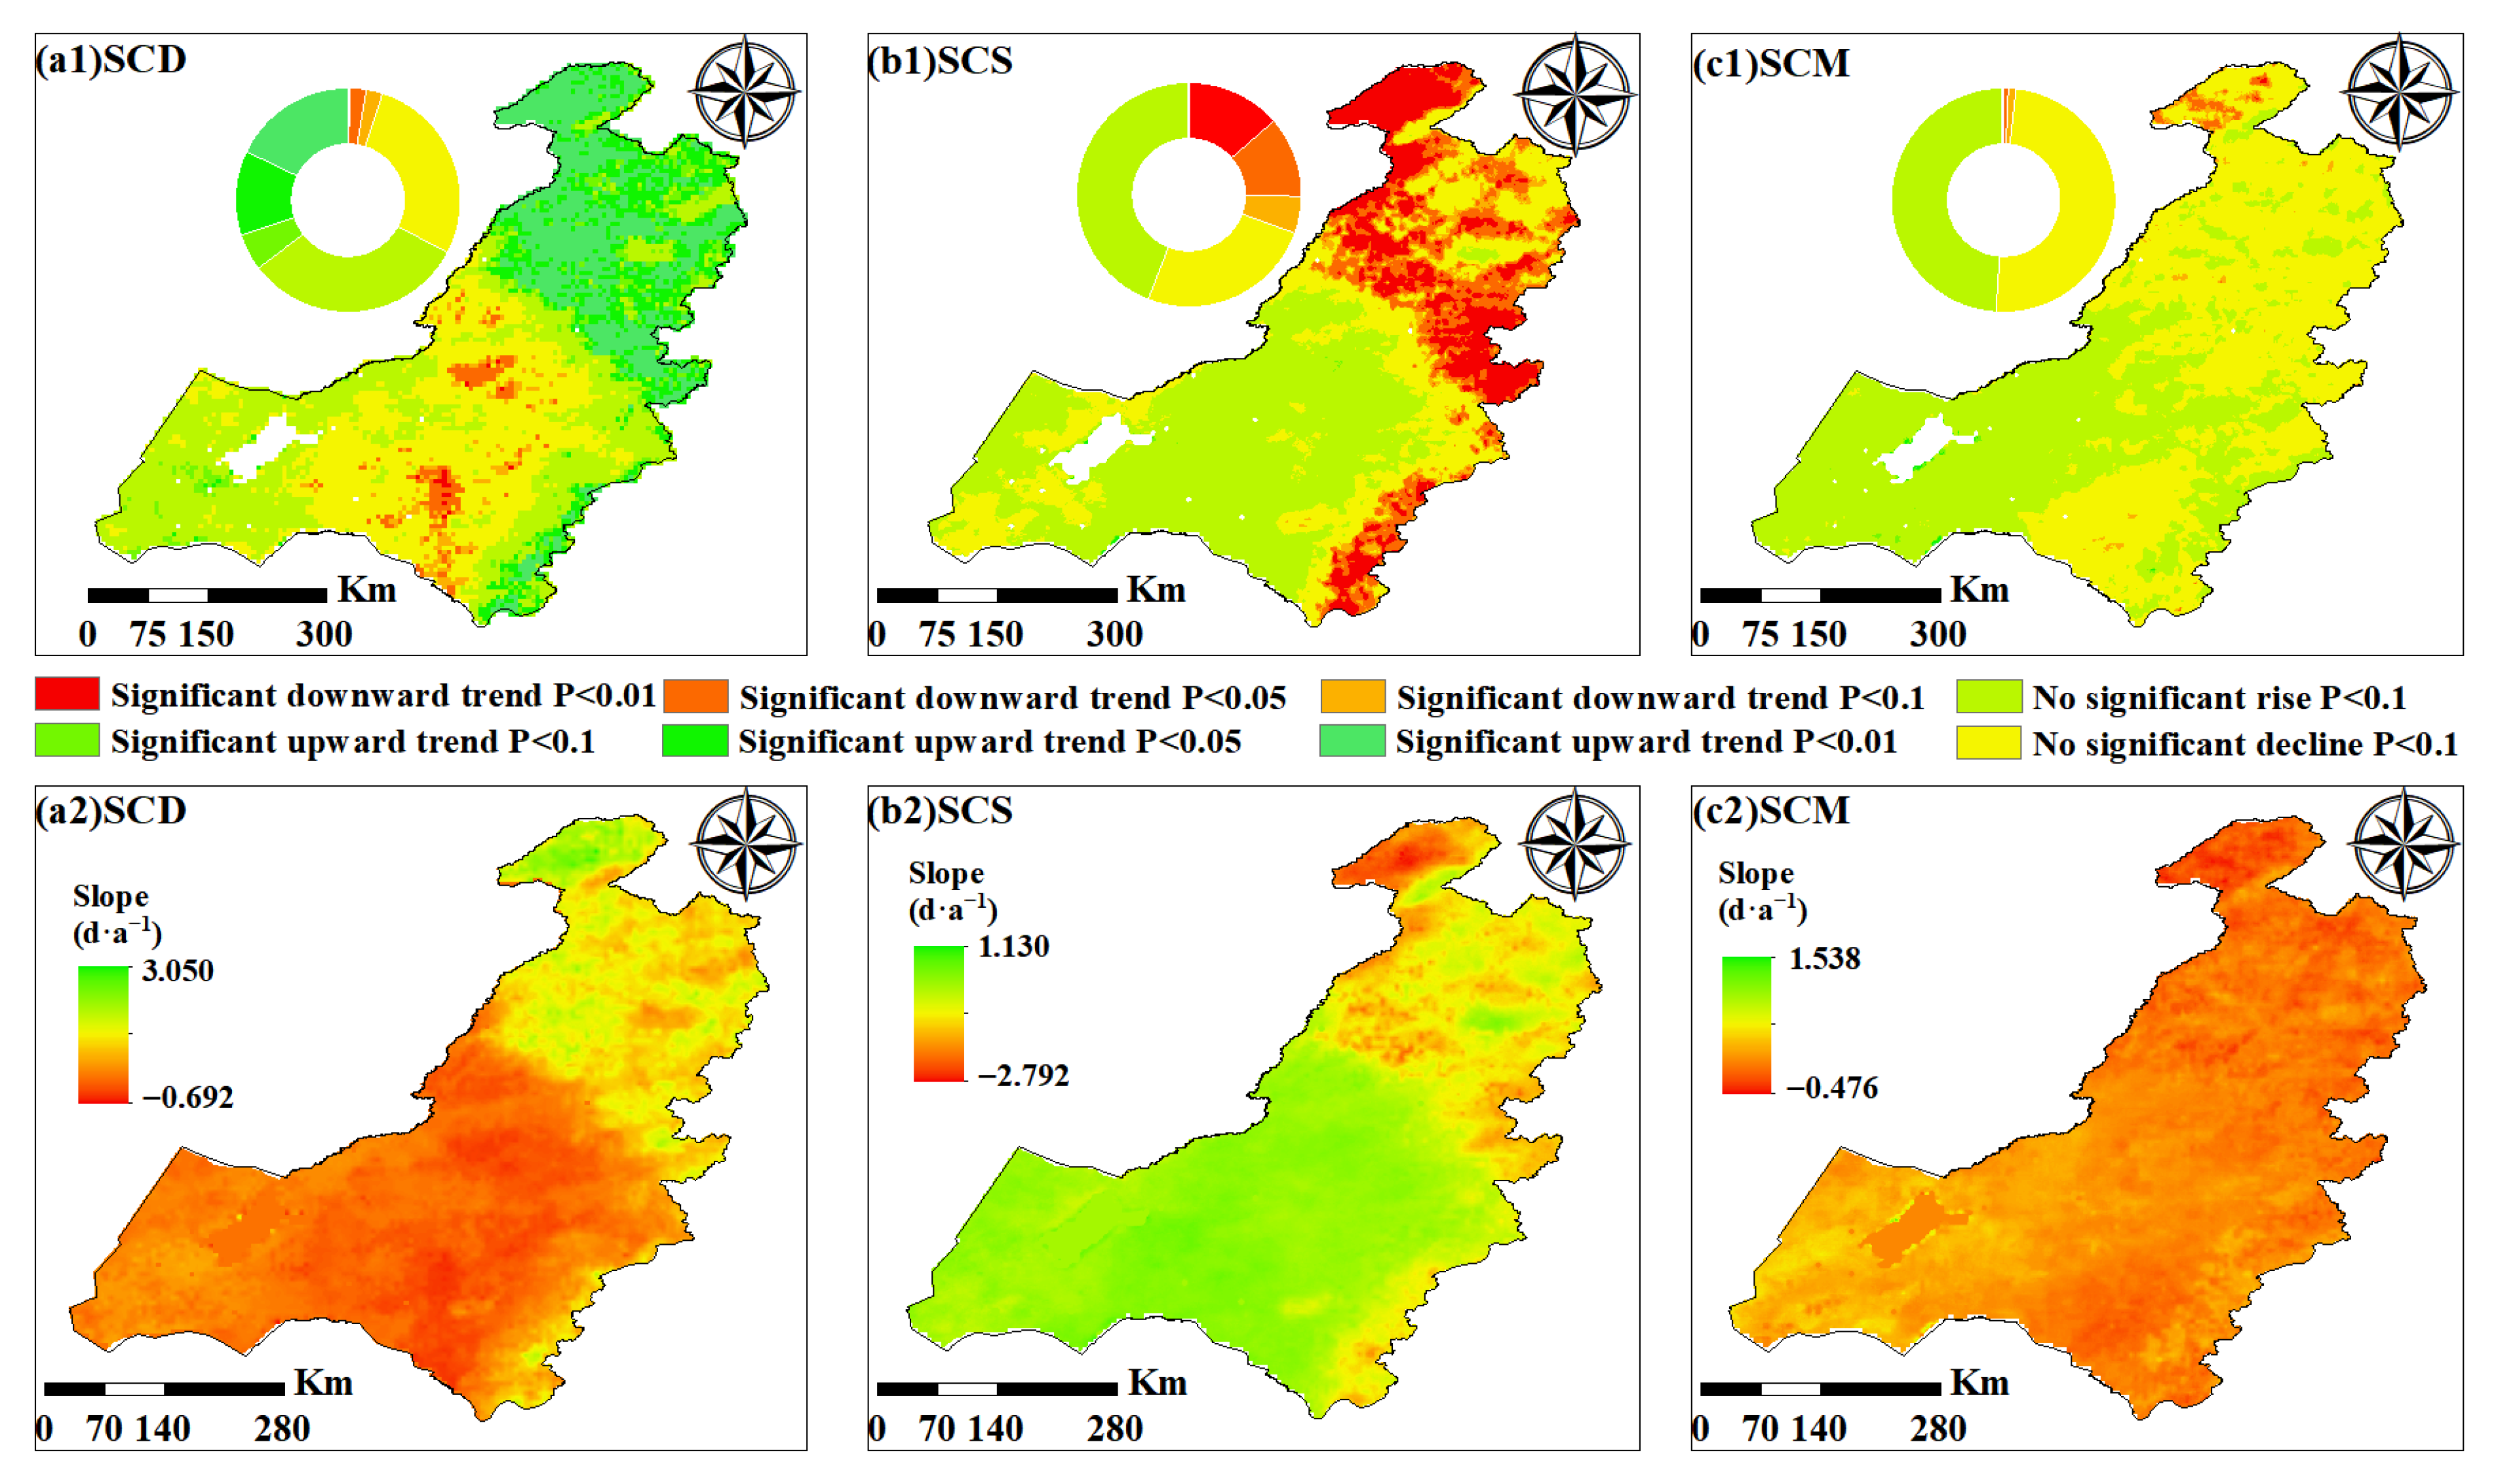
Figure 6 further presents the changing patterns of snow phenological parameters. Spatial analysis shows that the variation in snow days exhibits a southward decrease and northward increase pattern. SCD in the northeastern region has been increasing. The proportion of areas with a highly significant increase (
p < 0.01) reached 17.89%; while in the central and southern regions, the changes were mainly insignificant fluctuations. The overall change rate ranged from −0.692 d a
−1 to 3.050 d a
−1. On the SCS, the trend was not significant in the central and western regions, while it showed a decreasing trend in the northeastern region. Among them, the area with a non-significant increase accounted for 43.98%, the area with a non-significant decrease accounted for 25.36%, and the area with an extremely significant decrease accounted for 13.61%. The overall change range was −2.792 d a
−1 to 1.130 d a
−1. The SCM shows a spatial differentiation feature across the region, with no significant increase in the northwest region and a slight decrease in some areas of the southeast region. The overall change range is −0.476 d a
−1 to 1.538 d a
−1.
Based on the grid data of snow cover parameters and climatic elements in the western part of the Greater Khingan Mountains, an analysis was conducted, and the spatial distribution pattern of the variation rates of each element was calculated and shown in
Figure 7. Based on the significant conclusion of the aforementioned Mann–Kendall (MK) trend test, the spatio-temporal evolution pattern can be further analyzed: The annual average snow depth shows a marginally significant decreasing trend, with the reduction rate being the highest in the north. This is consistent with the conclusion from the MK test that “96.03% of the area shows a decreasing trend, and the north and south have significant declines”. The annual precipitation shows a slight fluctuation throughout the region, with no significant trend changes; the annual average temperature shows an overall increase, with the northeastern region experiencing the highest warming rate, and the warming high-value area is highly coupled with the area where snow depth has significantly decreased, revealing the driving effect of temperature rise on snow melting.
Figure 7d–f further illustrate the spatial heterogeneity of snow phenology: SCD shows an increasing trend in the northeastern region, a slight change in the central–southern region, while the SCS is significantly delayed in the western and southern regions, and earlier in the northeastern region; the SCM is significantly delayed in the northeastern region and earlier in the southwestern region.
4.4. Correlation Analysis of Snow Cover Parameters and Influencing Factors
4.4.1. Correlation Analysis of Snow Depth and Its Influencing Factors
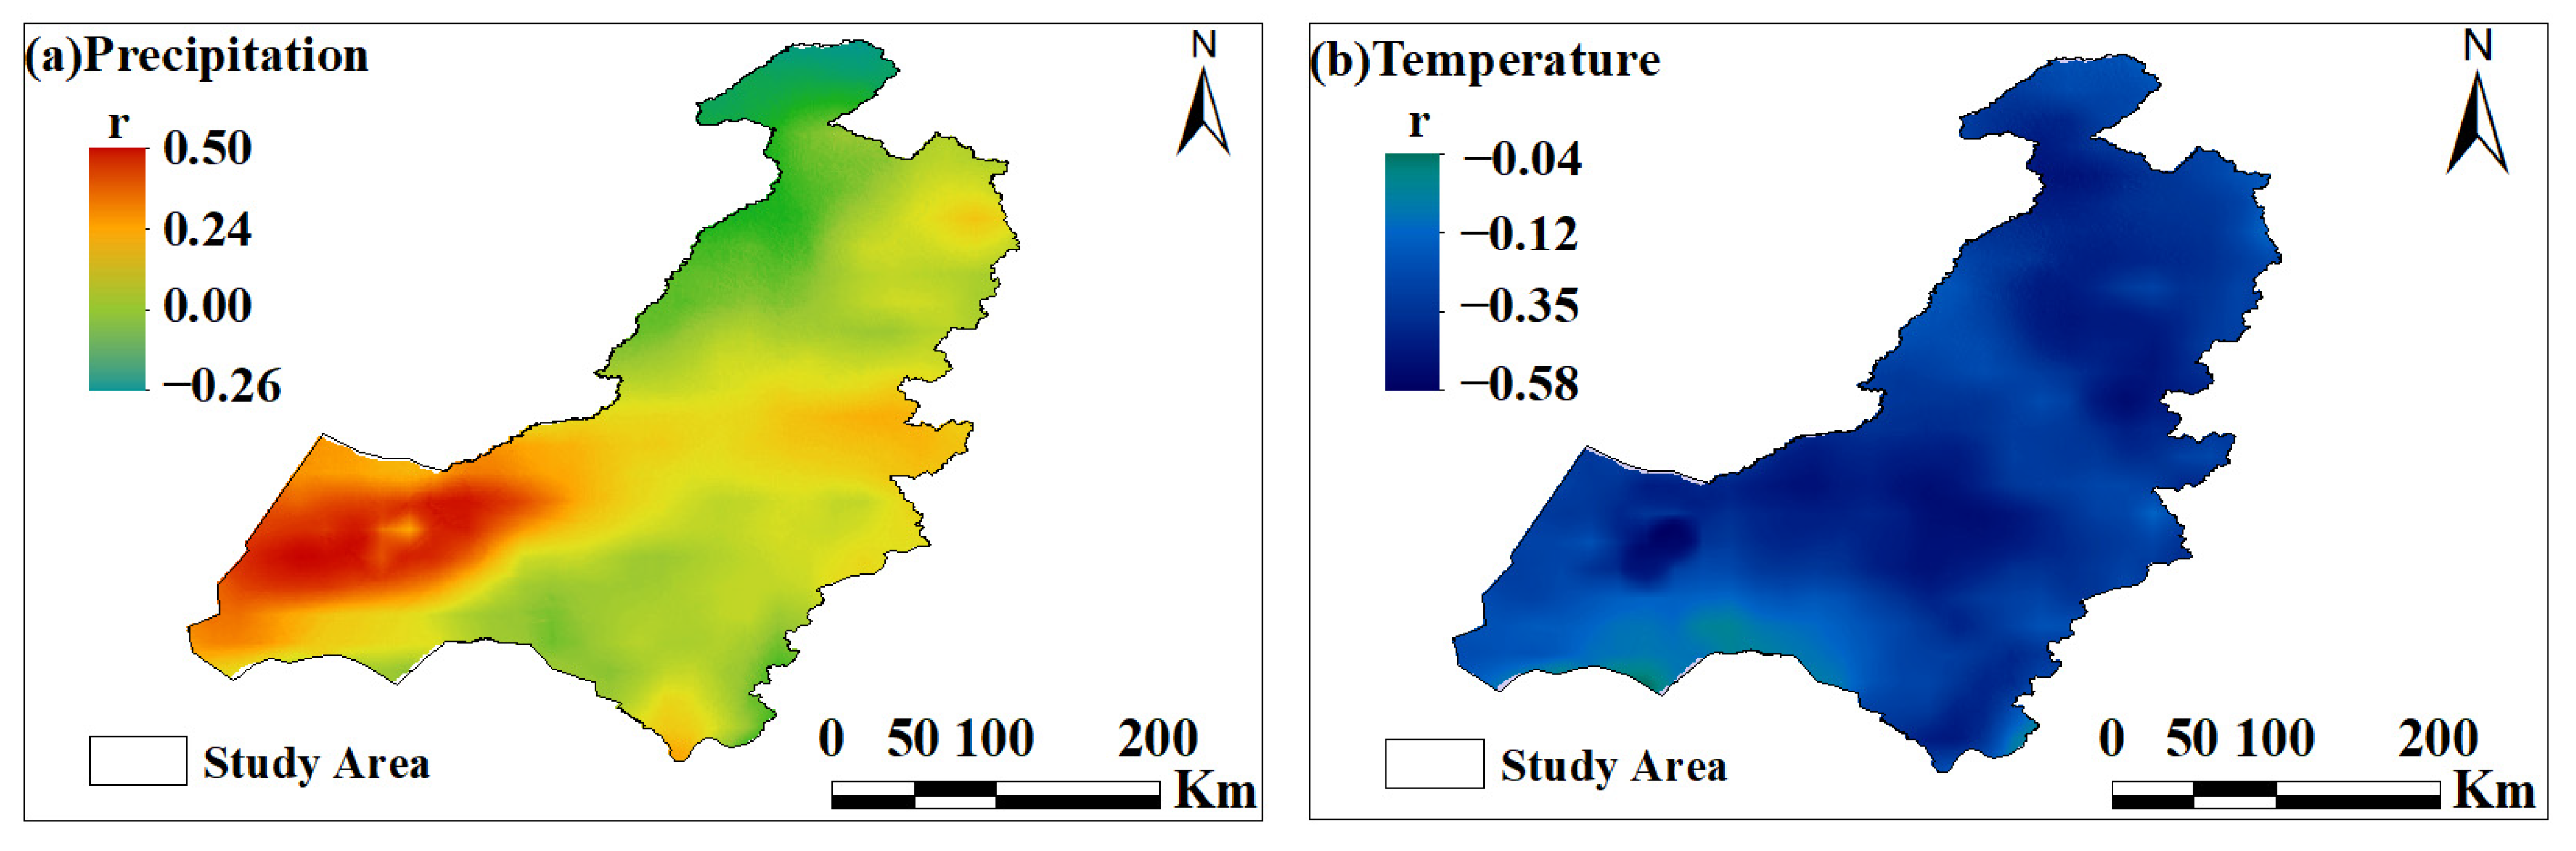
Temperature and precipitation are the two main meteorological factors that describe the changes in snow cover. Therefore, at the grid scale, the correlation coefficient r between the average snow depth from 1982 to 2024 and the annual precipitation, as well as the annual average temperature was calculated. The correlation between the average snow depth and the two climate factors, as well as the spatial distribution pattern, were analyzed and compared. The results are shown in
Figure 8. The annual average snow depth is mainly positively correlated with precipitation, while it is mainly negatively correlated with temperature.
Figure 8a shows that the correlation coefficient between the annual average snow depth and annual precipitation exhibits a spatial pattern of being stronger in the west and weaker in the east. The western region shows a significant positive correlation (r = 0.24–0.50), indicating that an increase in precipitation can directly promote snow accumulation in this region. In the eastern region, the correlation coefficient shows a weak negative correlation, suggesting that the regulatory effect of precipitation on the snow depth is weaker in the east. In the western foothills of the Greater Khingan Range, a positive correlation between snow depth and precipitation was observed across 81.26% of the region, covering approximately 12.77 × 10
4 km
2. Notably, areas with a correlation coefficient exceeding 0.4 are primarily concentrated in the northwest, accounting for 4.89% of the total area (roughly 0.78 × 10
4 km
2). The correlation coefficients between snow depth at the western foot of the Greater Khingan Range and precipitation mainly range from 0.0 to 0.2.
Figure 8b shows that the annual average snow depth is negatively correlated with the annual average temperature, and the negative correlation is stronger in the northern part (r = −0.58 to −0.35). In the low-altitude areas, the average temperature is around 0 °C, and the correlation coefficients between the annual average snow depth and the annual average temperature are mostly below −0.4, demonstrating a strong negative correlation. Therefore, temperature is the main factor influencing the changes in snow cover in this region. Overall, the area where there is a significant negative correlation between temperature and snow depth in the western foothills of the Greater Khingan Range is approximately 11.51 × 10
4 km
2, accounting for about 73.63% of the total area of the study region. Additionally, 26.37% of the area has a correlation coefficient of less than −0.4 between the two variables, especially in the southeastern part of the western foothills of the Greater Khingan Range.
We calculate the correlation coefficients between the average snow depth in the western foothills of the Greater Khingan Mountains in Inner Mongolia and climatic factors (precipitation, temperature) as well as geophysical factors (elevation, slope, aspect). The results show that: Precipitation and elevation are positively correlated with the depth of snow cover, with correlation coefficients of 0.25 and 0.22 respectively; while temperature, slope, and aspect are negatively correlated with the depth of snow cover, with correlation coefficients of −0.32, −0.18, and −0.10 respectively. Among them, the correlation between snow depth and temperature is the most significant, while the correlation with aspect is the weakest. This indicates that among the climatic factors, more precipitation and lower temperature jointly promote the formation and preservation of snow cover. Among the geographical factors, higher altitudes and gentler slopes are more conducive to SCD, while the influence of slope orientation is relatively limited. Overall, the degree of influence of each factor on the snow depth, from greatest to least, is: temperature, precipitation, elevation, slope, and slope orientation.
4.4.2. Correlation Analysis of Snow Phenology and Influencing Factors
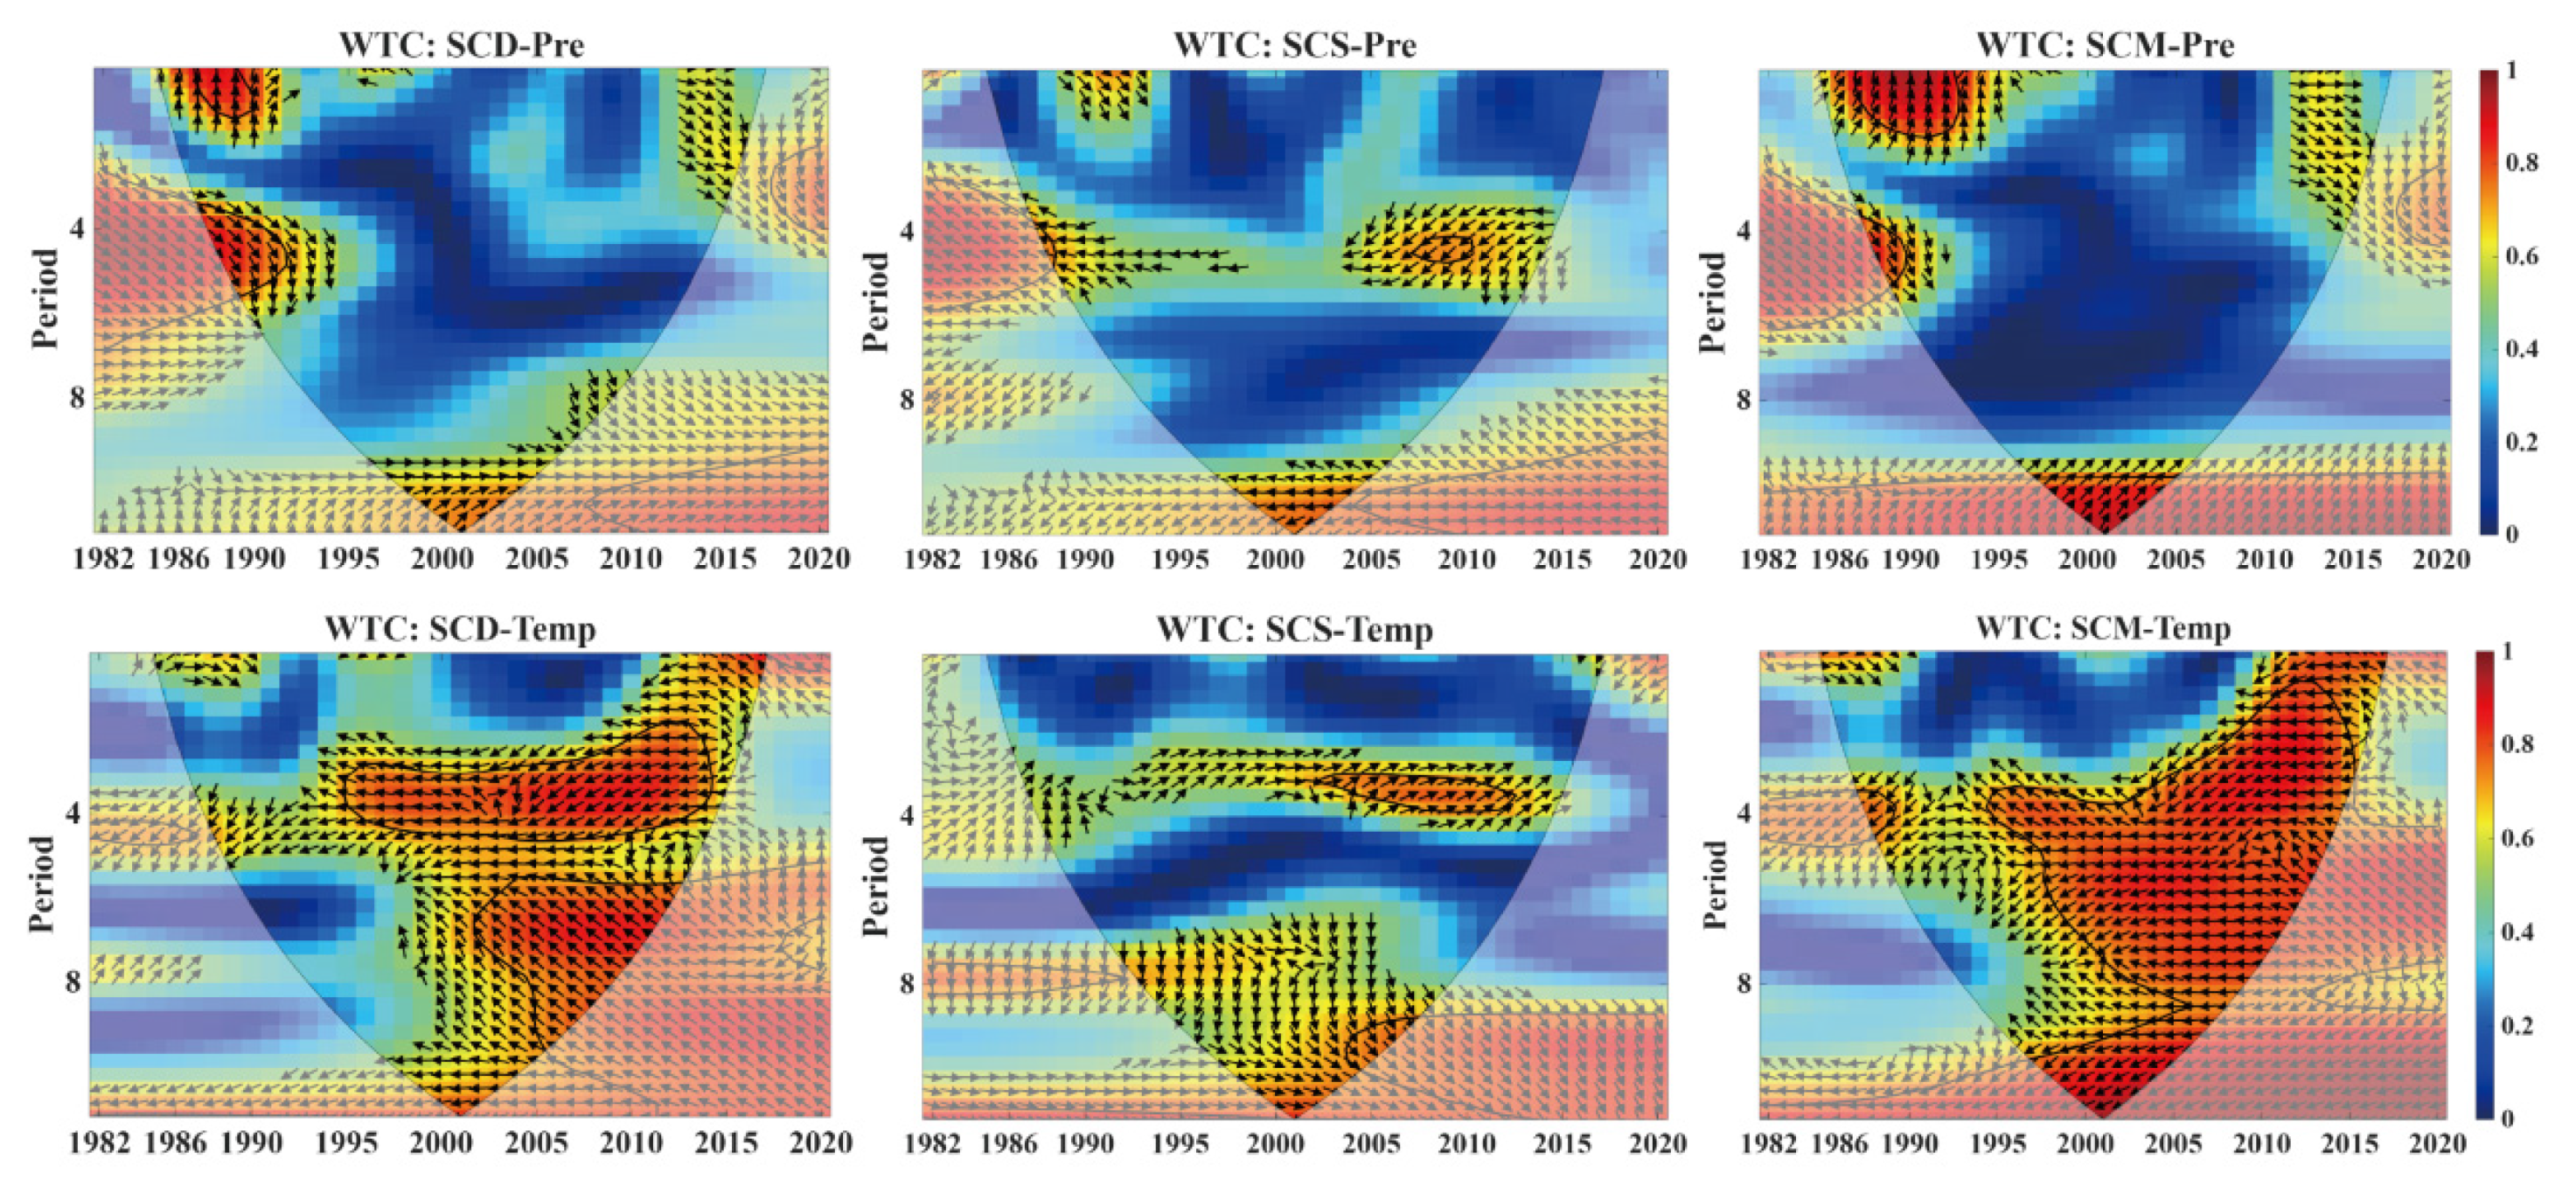
The cross-wavelet power spectrum further reveals the correlations between the snow phenology and climatic factors in the western part of the Greater Khingan Mountains at different time scales, as shown in
Figure 9. The correlation between snow cover days (SCD), snow cover start date (SCS), snow cover melt date (SCM) and precipitation shows certain relationships. For instance, there is a weak resonant cycle between snow cover days and precipitation in the 2–4 year period from 1982 to 1990, between SCS and precipitation in the 4–6 year period from 2000 to 2005, and between SCM and precipitation in the 2–4 year period from 1982 to 1988. In the low-energy area, there is no stable coherent relationship, indicating that the regulatory effect of precipitation on snow phenology is limited to small-scale fluctuations in the early stage of the study and the overall correlation is not strong. The snow phenology has a clear correlation with temperature in the high-energy zone. The coverage area of the high-energy zone is extensive and the duration is continuous. Among them, the SCD and temperature show a large-scale high-energy zone pattern over the 2–8-year period from 1990 to 2020. The SCS and temperature show a stable high-energy characteristic over the 2–6-year period from 1995 to 2010, and the SCM and temperature show a stable high-energy characteristic over the 2–8-year full cycle from 1990 to 2020. All three show an inverse phase distribution, reflecting the negative correlation between the increase in temperature and the decrease in snow days, the delay of the SCS, and the advancement of the SCM. The low-energy zone also has a continuous coherent signal. Overall, the correlation between snow phenology and temperature in the western foot of the Greater Khingan Mountains is significantly stronger than that of precipitation. Temperature is the key climatic factor regulating the dynamic of regional snow phenology, while the correlation relationship with precipitation is relatively weak.
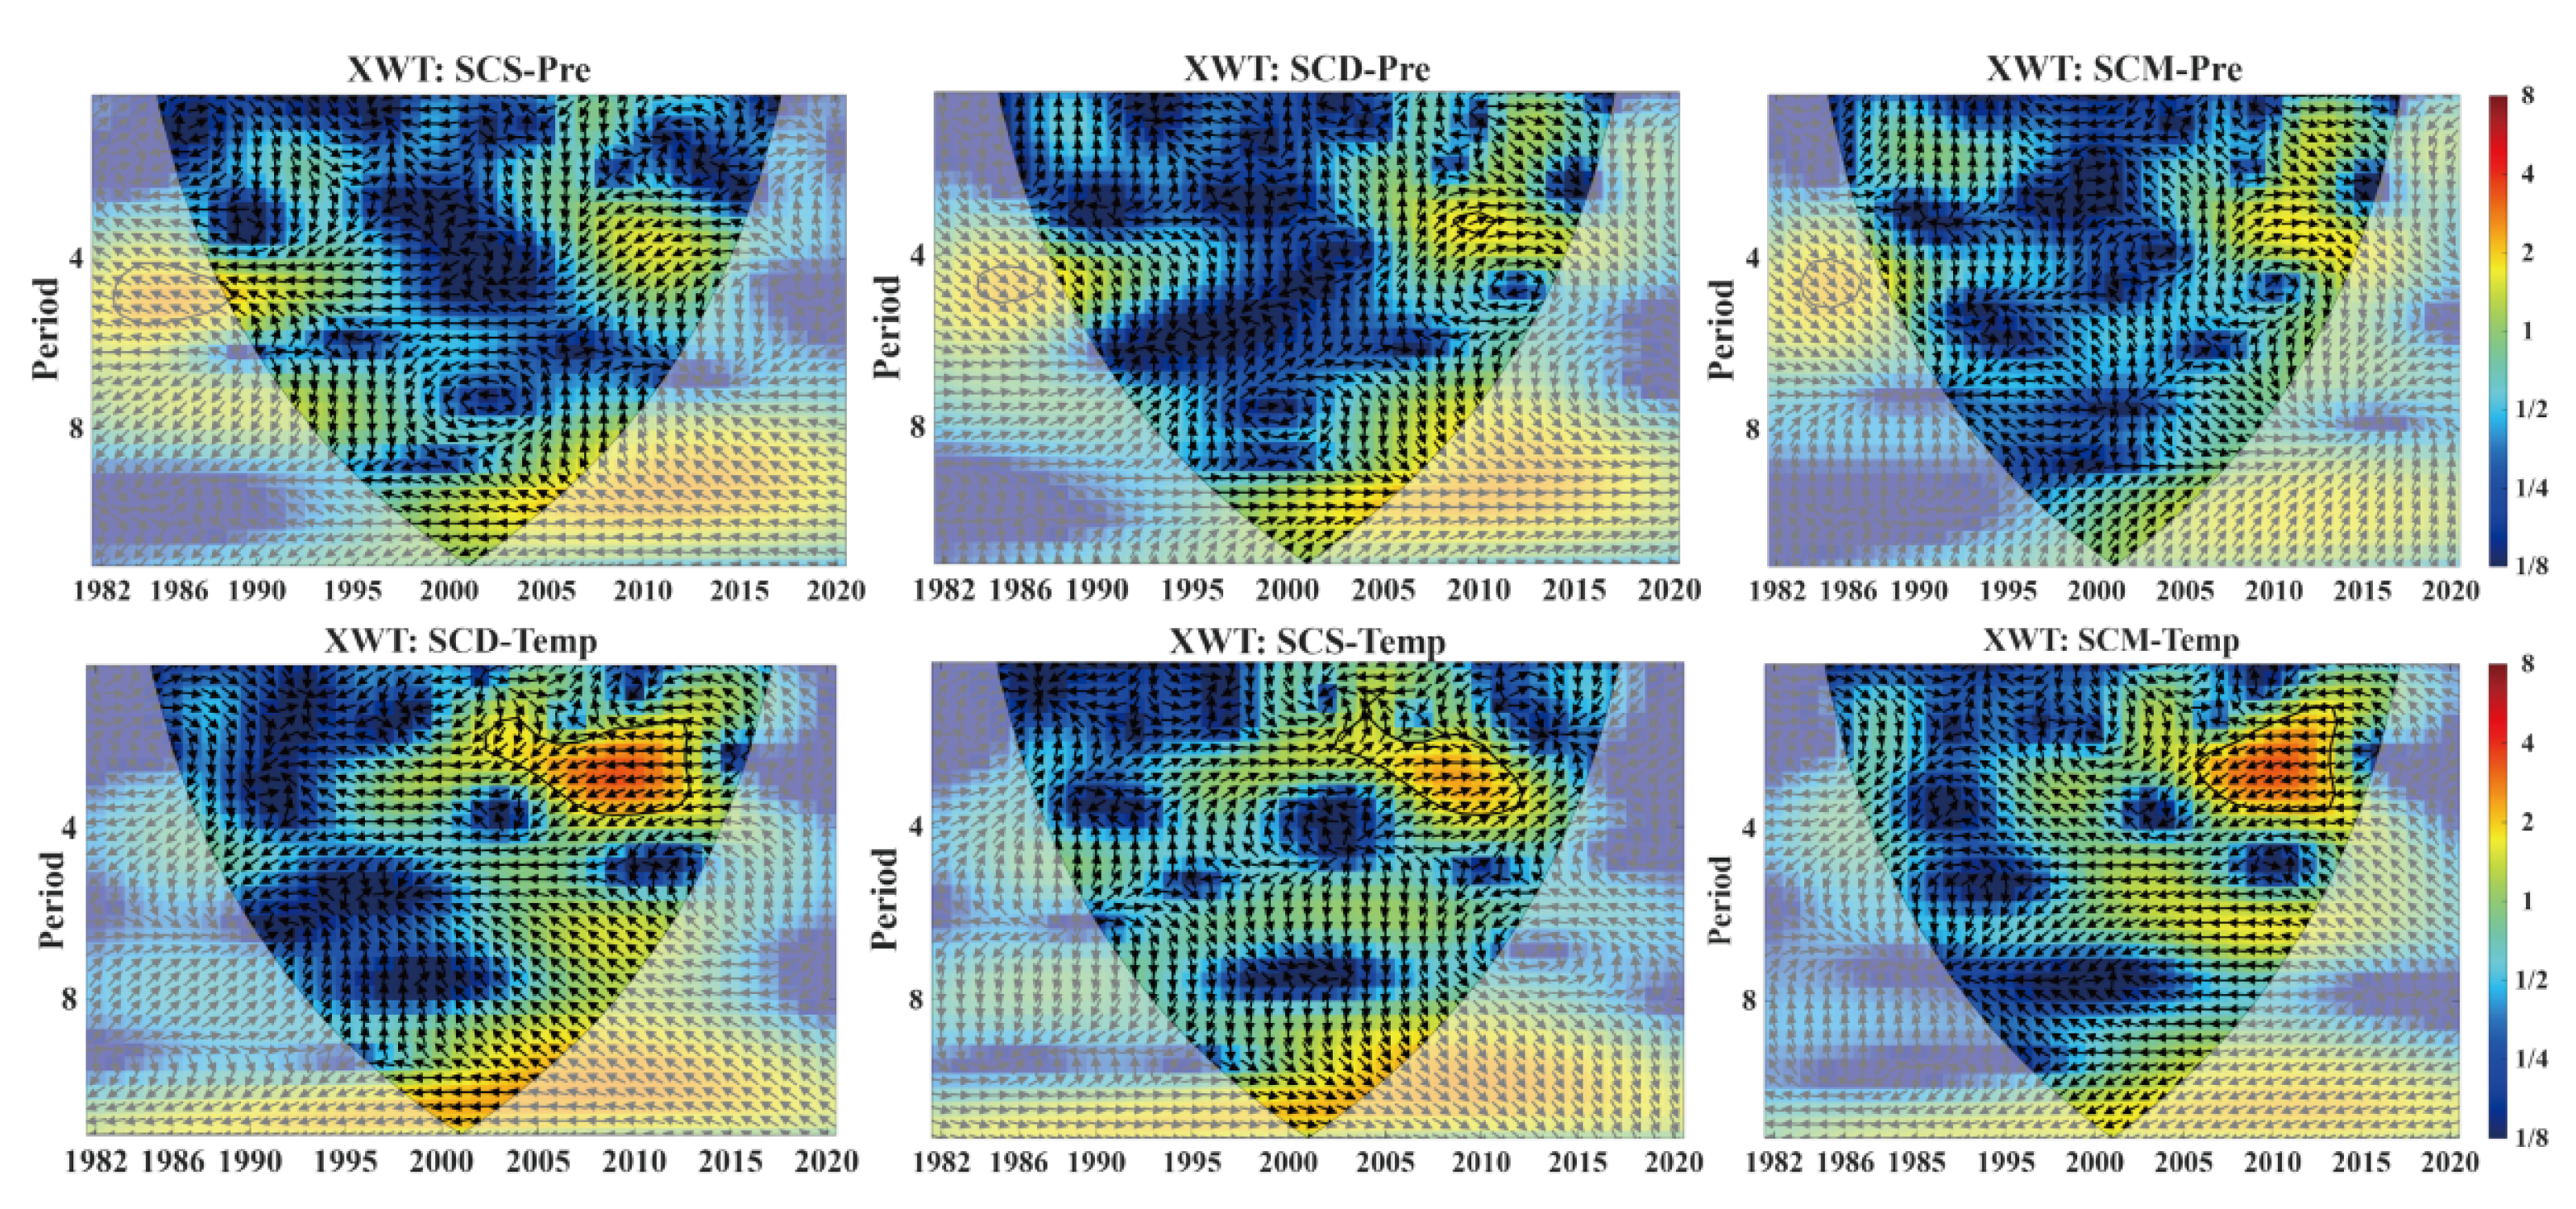
Based on the cross-wavelet coherency spectrum (XWT) analysis as shown in
Figure 10, there are significant differences in the time–frequency resonance characteristics of snow phenology (SCS, SCD, SCM) in the western foothills of the Greater Khingan Mountains and precipitation and temperature. The cross-wave energy of Snow phenology and precipitation is generally low overall. Only in some local periods and on the medium-short time scale, there are sporadic high-energy resonance areas. The main manifestation is that there are concentrated energy signals between the SCS and precipitation within a 2–4 year cycle from 1990 to 2000, and between SCD and precipitation within a 4–6 year cycle from 2000 to 2010. There are no obvious high-energy resonance areas between the SCM and precipitation. The overall resonance effect is weak in intensity and short in duration, indicating that the regulation effect of precipitation on Snow phenology is limited; The cross-wave energy of snow phenology and temperature is significantly higher. Among them, the energy concentration areas were observed for the 2–4 year cycle of snow days and temperature from 2005 to 2015, the 4–8 year cycle of the SCS and temperature from 2000 to 2010, and the 4–6 year cycle of the SCD and temperature from 2000 to 2015. The phase arrows were distributed in an opposite phase, reflecting the negative correlation between the increase in temperature and the decrease in the SCD, the delay of the SCS, and the advancement of the SCM. The correlation between the two was significant.
Using climate factors (precipitation, temperature) and geographical factors (elevation, slope, aspect) as independent variables and the average annual snow depth over multiple years as the dependent variable, a multiple linear regression analysis was conducted to calculate the contribution rate of each influencing factor to the average annual snow depth during the snow season from 1982 to 2024. The results show that precipitation, temperature and elevation have a relatively high contribution rate to the snow depth, while slope and aspect have a lower contribution rate. The contribution rates of precipitation, temperature, elevation, slope and aspect to the spatial distribution of annual average snow depth are 0.245, 0.445, 0.186, 0.083 and 0.041 respectively. It can be seen that the contribution rates of the five influencing factors from high to low are temperature, precipitation, elevation, slope and aspect. By summing up the contribution rates of climate factors and geographical factors, the contribution rates of climate factors and geographical factors to the snow depth are 0.690 and 0.310 respectively. The contribution rate of climate factors is significantly higher than that of geographical factors.
5. Discussion
This study focuses on the cold zone ecological barrier and the forest–grassland transition zone at the western foot of the Greater Khingan Mountains in Inner Mongolia. Based on long-term remote sensing and meteorological data from 1982 to 2024, it systematically analyzes the temporal and spatial changes in snow cover and the coupling mechanism of terrain and climate. This study contributes to understanding cryosphere–climate interactions in the western foot of the Greater Khingan Mountains. This research has filled the gap in the study of regional small-scale snow cover, improved the regional subdivision results of snow cover in Northeast China and Inner Mongolia, and provided methodological references for similar studies on snow cover in transitional zones.
5.1. Regulation of Snow Distribution Through Coupled Terrain–Climate Interaction
This study, through quantitative analysis using multiple linear regression, found that climatic factors (precipitation, temperature) accounted for a total contribution rate of 0.690 to the spatial differentiation of snow cover, which was significantly higher than that of geographical factors (elevation, slope, aspect), which was 0.310. Among them, temperature accounted for 0.445, precipitation accounted for 0.245, and elevation accounted for 0.186, while slope and aspect were 0.083 and 0.041, respectively. Temperature and precipitation were the core driving forces. In the high-altitude areas of the northeastern region, due to the cooling effect of altitude on temperature, the snowmelt is effectively delayed, making these areas snow-rich (with SCD exceeding 150 days). The gentle slope terrain is conducive to the physical accumulation of snow. However, as global warming intensifies, the driving effect of this terrain is being affected. The MK trend test shows that the snowfall decline trend in the northern high-altitude area is the most significant (
p < 0.01), indicating that the continuous warming has exceeded the buffering effect of the terrain and has become the dominant variable in the regional snow dynamic evolution [
57,
58].
5.2. Climate-Warming Effects on Snow Cover Dynamics
The observed significant warming trend over the past four decades has directly led to a corresponding decline in snow depth, with snow cover exhibiting a markedly stronger sensitivity to temperature than to precipitation. It is essential to distinguish between long-term climate change and interannual climate variability in this region. While the steady decline in snow depth is primarily driven by a significant warming trend (p < 0.05), the pronounced interannual fluctuations observed are largely regulated by short-term climate variability, particularly the instability and high variance of precipitation. The sensitivity of snow cover to temperature was significantly stronger than that of precipitation. The effects of warming on snow cover can be interpreted from three aspects:
(1). Time–frequency resonance characteristics: The study found that the SCD and temperature exhibited a stable medium–short resonance cycle of 2 to 8 years during the period from 1990 to 2020, with the phase arrow pointing to the left (anti-phase). This quantitatively revealed a strong negative correlation between the increase in temperature and the decrease in SCD. In contrast, precipitation and snow parameters only exhibited weak resonances in local time periods and could not provide stable accumulation compensation.
(2). Transformation of snowfall patterns: The observed warming trend during the transition months (October and April) facilitates a phase shift from solid to liquid precipitation. This increase in rain-on-snow or sleet events directly contributes to the delayed SCS (
Figure 4b) and the reduction in SCD, as liquid precipitation promotes faster thermal degradation of the existing snowpack [
59,
60]. Despite a significant increase in temperature, the SCM did not show the expected significant early onset trend (
Figure 4c). This phenomenon is mainly related to the frequent extreme snowfall in the western foothills of the Greater Khingan Range during spring (March–April). Although the warming in spring accelerated the melting of snow, the unstable snowstorms during this period often led to the surface being briefly covered by new snow, interfering with the remote sensing’s interpretation of the end date of snow cover. This short-term ‘reconstruction’ of snow cover caused SCM to exhibit significant interannual fluctuations, masking the melting signals under the long-term warming background [
61,
62].
(3). SCD—Albedo positive feedback mechanism: Warming leads to earlier melting of snow, exposing the ground surface, which absorbs more radiation, further heating the surface atmosphere and accelerating the sublimation and melting of the remaining snow. The results of this study show that precipitation as a whole shows a non-significant and slightly decreasing trend with significant interannual fluctuations (R
2 = 0.01). This unstable precipitation supply not only fails to offset the melting loss caused by warming but also exacerbates the volatility risk of snow depth (
Figure 3a,b) [
62,
63].
5.3. Limitations
5.3.1. Data Timeliness and Uncertainty in Recent Snow Phenology Interpretation
While the snow phenology dataset ends in 2020, meteorological observations through 2024 confirm a sustained warming trend and fluctuating precipitation consistent with the prior study period, suggesting that the identified drivers of snow decline remain dominant. Future updates of snow phenology datasets or the use of alternative high-temporal-resolution products will help reduce this uncertainty and allow a more complete assessment of recent snow-cover dynamics in the western Greater Khingan Mountains.
5.3.2. The Ecological Hydrological Impact of Snow Cover Changes on Runoff
Although this study has clarified the temporal and spatial evolution pattern of snow cover in the western foothills of the Greater Khingan Mountains, due to the lack of high-frequency field-measured hydrological data as support, it has not been able to deeply explore the nonlinear feedback mechanism of snow cover degradation on the regional ecological hydrological process. The snow depth has been continuously decreasing at a rate of 0.026 cm a
−1, and the snow cover period has significantly shortened. This process may trigger a series of complex chain reactions: On the one hand, the reduction and delay of the peak snowmelt in spring may intensify the water stress during the grassland greening period, disrupting the synchronization between vegetation phenology and water supply [
64,
65]. On the other hand, the reduction in snow cover extent will alter the surface albedo, leading to changes in the depth of soil freezing and thawing and the thermal structure during winter. Currently, the sensitivity assessment of the ecological barrier function in this area is still at the stage of macroscopic pattern description. Future research should combine high-resolution remote sensing (e.g., Sentinel-2, Landsat 8/9, or Sentinel-1 SAR products) with distributed hydrological models, and focus on solving the regulatory mechanisms of snow evolution on the recharge of river runoff and the resilience of the ecosystem.
Furthermore, incorporating snow cover area as a spatial constraint is vital for improving the reliability of these hydrological models and subsequent water management strategies. Research has demonstrated that integrating remote-sensing snow cover data, alongside other variables such as isotope or glacier dynamics, significantly reduces simulation uncertainties in capturing streamflow seasonality within large mountainous basins [
33]. The spatial information provided by satellite snow cover images effectively complements traditional volumetric discharge data, leading to a more robust calibration and enhanced performance of physically based distributed hydrological models [
66]. In the context of the Greater Khingan Mountains, employing such multi-variable validation techniques will be crucial for translating macroscopic snow degradation patterns into actionable insights, thereby providing a more accurate and reliable basis for seasonal water allocation, drought early warning, and disaster mitigation in the downstream pastoral areas.
5.3.3. Limitations in Future Climate Scenario Simulations
While this study comprehensively elucidates the historical spatiotemporal evolution of snow cover from 1982 to 2024, it lacks future scenario simulations coupled with Global Climate Models (GCMs), thereby limiting its predictive capacity regarding long-term snow dynamics. Given the observed regional warming rate of 0.028 °C a−1, projecting snow cover responses under various emission scenarios is crucial. Under high-emission scenarios, the snow cover duration is expected to shorten further, potentially leading to a complete absence of seasonal snowpack in low-altitude regions and a severe depletion of meltwater resources. Conversely, while low-emission scenarios might decelerate the rate of snow degradation, reversing this overall trajectory remains highly improbable.
The absence of these predictive models hinders the identification of critical tipping points in snow cover transitions. Consequently, this restricts the study’s ability to offer forward-looking guidance for regional ecological water replenishment, disaster risk stratification, and long-term strategic planning for water resource management and snow disaster mitigation in pastoral areas. Future research should, therefore, integrate multi-model ensemble approaches to quantitatively assess the impacts of projected warming gradients on snow reserves, ultimately enhancing the prognostic and practical value of the findings [
67,
68,
69,
70].
6. Conclusions
This study investigated the spatiotemporal changes in snow cover in the western Greater Khingan Mountains, Inner Mongolia, using long-term remote sensing, meteorological, and topographic datasets. The main conclusions are as follows.
(1) Snow cover exhibited clear spatial heterogeneity across the study area. Greater snow depth and longer snow cover duration were mainly observed in the northeastern, high-altitude, gentle-slope, and north-facing areas, indicating that both climatic and topographic conditions jointly shaped the regional snow distribution.
(2) Snow depth showed a slight but marginally significant declining trend during 1982–2024, at a rate of 0.026 cm a−1. Snow cover days decreased during 1982–2020 at a rate of 0.39 d a−1. Snow cover onset tended to be slightly but significantly delayed, whereas snowmelt timing showed substantial interannual variability. These results indicate an overall weakening of snow cover persistence in the study area.
(3) Temperature showed stronger and more persistent associations with snow cover changes than precipitation. Correlation, cross-wavelet, and regression analyses consistently suggested that climatic factors explained more variability in snow cover than geographic factors, with temperature making the largest contribution. These findings suggest that regional warming has played a leading role in recent snow cover decline.
(4) Although the snow phenology analysis was limited to 1982–2020 because of dataset availability, the results still provide useful evidence for understanding climate-sensitive snow dynamics in this cold-region transitional zone.
Overall, this study highlights the sensitivity of snow cover to ongoing climate warming in the western Greater Khingan Mountains and provides a useful basis for ecological conservation, seasonal water-resource adaptation, and sustainable management in cold-region landscapes of northern China.
Author Contributions
Conceptualization, Z.Z.; Methodology, Z.Z. and Y.Z.; Software, Y.Z. and W.Z.; Validation, Y.Z. and W.Z.; Formal analysis, F.W.; Investigation, Z.Z.; Resources, S.L. and S.Z.; Data curation, Y.Z., W.Z., H.G. and S.L.; Writing—original draft, Y.Z. and H.G.; Writing—review & editing, F.W.; Visualization, F.W. and Y.W.; Supervision, H.G., Y.W. and S.Z.; Project administration, H.G., Y.W. and S.Z.; Funding acquisition, Z.Z. All authors have read and agreed to the published version of the manuscript.
Funding
This research was supported by National Natural Science Foundation of China Project (42401022) and Special research project of China Institute of Water Resources and Hydropower Research (grant number MKKH2025JK006).
Institutional Review Board Statement
Not applicable.
Informed Consent Statement
Not applicable.
Data Availability Statement
The original contributions presented in this study are included in the article/
Supplementary Materials. Further inquiries can be directed to the corresponding author.
Conflicts of Interest
The authors declare no conflicts of interest.
References
- Li, Z.; Zhang, S.; Meng, X.; Lyu, S.; Yang, X.; Ao, Y.; Ma, D.; Shang, L.; Shu, L.; Chang, Y. Effect of snow cover on water and heat transfer in alpine meadows in the source region of Yellow River. Sci. Total Environ. 2023, 859, 160205. [Google Scholar] [CrossRef]
- Chen, S.; Xiao, P.; Zhang, X.; Qi, J.; Yin, G.; Ma, W.; Liu, H. Simulating snow-covered forest bidirectional reflectance by extending hybrid geometric optical–radiative transfer model. Remote Sens. Environ. 2023, 296, 113713. [Google Scholar] [CrossRef]
- Rupp, D.; Mote, P.; Bindoff, N.; Stott, P.; Robinson, D. Detection and Attribution of Observed Changes in Northern Hemisphere Spring Snow Cover. J. Clim. 2013, 26, 6904–6914. [Google Scholar] [CrossRef]
- Armstrong, R.; Brodzik, M. Recent Northern Hemisphere snow extent: A comparison of data derived from visible and Microwave Satellite Sensors. Geophys. Res. Lett. 2001, 28, 3673–3676. [Google Scholar] [CrossRef]
- Fichefet, T.; Morales Maqueda, M.Á. Modelling the influence of snow accumulation and snow-ice formation on the seasonal cycle of the Antarctic sea-ice cover. Clim. Dyn. 1999, 15, 251–268. [Google Scholar] [CrossRef]
- Zou, Y.F.; Sun, P.; Ma, Z.C.; Lv, Y.F.; Zhang, Q. Snow Cover in the Three Stable Snow Cover Areas of China and Spatio-Temporal Patterns of the Future. Remote Sens. 2022, 14, 3098. [Google Scholar] [CrossRef]
- Gao, Z.; Liu, Z.; Han, P.; Zhang, C. Investigating spatial-temporal trend of snow cover over the three provinces of Northeast China based on a cloud-free MODIS snow cover product. J. Hydrol. 2024, 645, 132044. [Google Scholar] [CrossRef]
- Ma, Q.; Keyimu, M.; Li, X.; Wu, S.; Zeng, F.; Lin, L. Climate and elevation control snow depth and snow phenology on the Tibetan Plateau. J. Hydrol. 2023, 617, 128938. [Google Scholar] [CrossRef]
- Chen, W.Q.; Ding, J.L.; Wang, J.Z.; Zhang, J.Y.; Zhang, Z. Temporal and spatial variability in snow cover over the Xinjiang Uygur Autonomous Region, China, from 2001 to 2015. PeerJ 2020, 8, e8861. [Google Scholar] [CrossRef]
- Chen, X.N.; Liang, S.L.; Cao, Y.F.; He, T. Distribution, attribution, and radiative forcing of snow cover changes over China from 1982 to 2013. Clim. Change 2016, 137, 363–377. [Google Scholar] [CrossRef]
- Jin, X.; Ke, C.Q.; Xu, Y.Y.; Li, X.C. Spatial and temporal variations of snow cover in the Loess Plateau, China. Int. J. Climatol. 2015, 35, 1721–1731. [Google Scholar] [CrossRef]
- Qin, S.; Xiao, P.F.; Zhang, X.L. How do snow cover fraction change and respond to climate in Altai Mountains of China? Int. J. Climatol. 2022, 42, 7213–7227. [Google Scholar] [CrossRef]
- Li, Q.; Wang, X.; Wei, W.; Li, Z.; Che, T. Increased sensitivity of snow phenology to temperature in unstable snow regions since 1990. J. Hydrol. 2025, 662, 134121. [Google Scholar] [CrossRef]
- Xiao, Y.; Hu, G.-J.; Li, R.; Wu, T.-H.; Wu, X.-D.; Liu, G.-Y.; Zou, D.-F.; Yao, J.-M.; Zhou, N.; Zhao, L. Autumn snow expansion and spring divergence in Northeast China (2000–2020). Adv. Clim. Change Res. 2026, 17, 105–116. [Google Scholar] [CrossRef]
- Zhu, L.; Ma, G.; Zhang, Y.; Wang, J.; Tian, W.; Kan, X. Accelerated decline of snow cover in China from 1979 to 2018 observed from space. Sci. Total Environ. 2022, 814, 152491. [Google Scholar] [CrossRef] [PubMed]
- Ying, H.; Shan, Y.; Zhang, H.; Yuan, T.; Rihan, W.; Deng, G. The Effect of Snow Depth on Spring Wildfires on the Hulunbuir from 2001–2018 Based on MODIS. Remote Sens. 2019, 11, 321. [Google Scholar] [CrossRef]
- Huang, K.; Xu, W.; Wang, H.; Li, H.; Li, L.; Li, Z.; Si, J.; Liu, H.; Wu, C. Dynamic Snow Melting Process and Its Driving Factors in Northern Grasslands. Atmosphere 2024, 15, 462. [Google Scholar] [CrossRef]
- Xu, W.; Ma, L.; Ma, M.; Zhang, H.; Yuan, W. Spatial-temporal variability of snow cover and depth in Qinghai-Tibetan Plateau. J. Clim. 2016, 30, 1521–1533. [Google Scholar] [CrossRef]
- Li, H.; Wang, Y.; Jia, Q.; Wang, W.; Zhang, J.; Xing, P.; Wan, H.; Li, F.Y. Impacts of drought on the spring phenology of temperate vegetation along a climate gradient: A case study in Inner Mongolia. J. Environ. Manag. 2025, 394, 127568. [Google Scholar] [CrossRef]
- Liu, B.; Ji, H.; Xu, H.; Deng, Y.; Luo, H.; Xue, Z.; Ren, W. Monitoring the river ice phenology along the Inner Mongolia reach of the Yellow River using time-series images from landsat and Sentinel-2. J. Hydrol. Reg. Stud. 2026, 64, 103140. [Google Scholar] [CrossRef]
- Liu, X.; Lai, Q.; Yin, S.; Gao, R. Assessing the impact of drought on water use efficiency among ecosystems on the Mongolian Plateau. Energy Nexus 2026, 21, 100664. [Google Scholar] [CrossRef]
- Mei, Y.; Batunacun; An, C.; Wu, Y.; Bao, Y.; Liu, K.; Feng, Y.; Hu, Y.; Hai, C.; Nendel, C. Identifying the dominant drivers of grassland degradation in Inner Mongolia, China. Ecol. Indic. 2025, 179, 114161. [Google Scholar] [CrossRef]
- Mumtaz, F.; Li, J.; Liu, Q.; Dong, Y.; Liu, C.; Gu, C.; Zhang, H.; Zhao, J.; Akhtar, M.; Bashir, B.; et al. A comprehensive framework for evaluating ecosystem quality changes and human activity contributions in Inner Mongolia and Xinjiang, China. Land Use Policy 2025, 151, 107494. [Google Scholar] [CrossRef]
- Liu, J.F.; Chen, R.S. Studying the spatiotemporal variation of snow-covered days over China based on combined use of MODIS snow-covered days and in situ observations. Theor. Appl. Climatol. 2011, 106, 355–363. [Google Scholar] [CrossRef]
- Qiao, D.J.; Wang, N.Q. Relationship between Winter Snow Cover Dynamics, Climate and Spring Grassland Vegetation Phenology in Inner Mongolia, China. ISPRS Int. J. Geo-Inf. 2019, 8, 42. [Google Scholar] [CrossRef]
- Zhao, Y.Y.; Yin, H.; Zhang, W.J.; Yan, J.H.; An, J.J.; Zhang, Z.Z.; Wu, Y.J.; Hu, W.; Lai, H.X.; Wang, F.; et al. Evaluation of water resources carrying capacity in Ordos city based on the Game Theory-Topsis-Grey Prediction coupling model. Sci. Rep. 2026, 16, 5782. [Google Scholar] [CrossRef]
- Xu, L.; He, J.; He, Y.; Zhang, L.; Xu, H.; Tang, C. Multidimensional factors influencing ecosystem services and their relationships in alpine ecosystems: A case study of the Daxing’anling forest area, Inner Mongolia. For. Ecosyst. 2025, 14, 100383. [Google Scholar] [CrossRef]
- Xu, L.; He, Y.; Zhang, L.; Xu, H.; Tang, C. Multi-scenario impacts on ecosystem services and relationships in alpine ecosystems: A case study of the Daxing’anling forest area, Inner Mongolia. Trees For. People 2025, 21, 100975. [Google Scholar] [CrossRef]
- Xu, L.; He, Y.; Zhang, L.; Bao, G.; Xu, H. Spatial variation in ecosystem service relationships in alpine ecosystems: A case study of the Daxing’anling forest area, Inner Mongolia. Ecol. Indic. 2024, 166, 112351. [Google Scholar] [CrossRef]
- Kang, Y.; Guo, E.; Wang, Y.; Bao, G.; Gu, X.; Bao, Y.; Mandula, N.; Wang, C. Response of gross primary productivity to compound dry and hot events in Inner Mongolia under large-scale circulation patterns. Glob. Planet. Change 2026, 260, 105392. [Google Scholar] [CrossRef]
- Zhang, M.; Guo, E.; Wang, Y.; Si, H.; Li, X.; Kang, Y.; Gu, X.; Zhao, P.; Xu, H.; Zhao, S.; et al. Causation, evolution, and multi-level propagation from meteorological to agricultural drought in Inner Mongolia. Agric. Water Manag. 2026, 326, 110236. [Google Scholar] [CrossRef]
- Li, S.; Hu, J.; Shang, W.; Duan, K. Spatiotemporal variation of snow cover days and influencing factors on the Loess Plateau during 2000–2019. J. Hydrol. 2023, 627, 130419. [Google Scholar] [CrossRef]
- Avesani, D.; Nan, Y.; Tian, F. Reducing hydrological uncertainty in large mountainous basins: The role of isotope, snow cover, and glacier dynamics in capturing streamflow seasonality. Hydrol. Earth Syst. Sci. 2025, 29, 5755–5775. [Google Scholar] [CrossRef]
- Che, T.; Jin, R.; Armstrong, R.; Zhang, T. Snow depth derived from passive microwave remote-sensing data in China. Ann. Glaciol. 2017, 49, 145–154. [Google Scholar] [CrossRef]
- Dai, L.; Che, T.; Ding, Y. Inter-Calibrating SMMR, SSM/I and SSMI/S Data to Improve the Consistency of Snow-Depth Products in China. Remote Sens. 2015, 7, 7212–7230. [Google Scholar] [CrossRef]
- Dai, L.Y.; Che, T.; Ding, Y.J.; Hao, X.H. Evaluation of snow cover and snow depth on the Qinghai-Tibetan Plateau derived from passive microwave remote sensing. Cryosphere 2017, 11, 1933–1948. [Google Scholar] [CrossRef]
- Che, T.; Dai, L.; Li, X. Long-Term Series of Daily Snow Depth Dataset in China (1979–2024); National Tibetan Plateau Data Center, Ed.; National Tibetan Plateau Data Center: Beijing, China, 2015.
- Shouzhang, P. 1-km Monthly Mean Temperature Dataset for China (1901–2024); National Tibetan Plateau Data Center, Ed.; National Tibetan Plateau Data Center: Beijing, China, 2025.
- Peng, S.; Gang, C.; Cao, Y.; Chen, Y. Assessment of climate change trends over the Loess Plateau in China from 1901 to 2100. Int. J. Climatol. 2018, 38, 2250–2264. [Google Scholar] [CrossRef]
- Peng, S.; Ding, Y.; Wen, Z.; Chen, Y.; Cao, Y.; Ren, J. Spatiotemporal change and trend analysis of potential evapotranspiration over the Loess Plateau of China during 2011–2100. Agric. For. Meteorol. 2017, 233, 183–194. [Google Scholar] [CrossRef]
- Ding, Y.; Peng, S. Spatiotemporal Trends and Attribution of Drought across China from 1901–2100. Sustainability 2020, 12, 477. [Google Scholar] [CrossRef]
- Peng, S.; Ding, Y.; Li, Z. 1-km monthly temperature and precipitation dataset for China from 1901–2017. Earth Syst. Sci. Data 2019, 11, 1931–1946. [Google Scholar] [CrossRef]
- Shouzhang, P. 1-km Monthly Precipitation Dataset for China (1901–2024); National Tibetan Plateau Data Center, Ed.; National Tibetan Plateau Data Center: Beijing, China, 2025.
- Hao, X.; Zhao, Q.; Ji, W.; Wang, J.; Li, H. AVHRR China Snowpack Phenology Data Set (1980–2020); National Cryosphere Desert Data Center: Lanzhou, China, 2021.
- Tang, Z.; Deng, G.; Hu, G.; Zhang, H.; Pan, H.; Sang, G. Satellite observed spatiotemporal variability of snow cover and snow phenology over high mountain Asia from 2002 to 2021. J. Hydrol. 2022, 613, 128438. [Google Scholar] [CrossRef]
- Dariane, A.B.; Khoramian, A.; Santi, E. Investigating spatiotemporal snow cover variability via cloud-free MODIS snow cover product in Central Alborz Region. Remote Sens. Environ. 2017, 202, 152–165. [Google Scholar] [CrossRef]
- Dong, C. Remote sensing, hydrological modeling and in situ observations in snow cover research: A review. J. Hydrol. 2018, 561, 573–583. [Google Scholar] [CrossRef]
- Foppa, N.; Stoffel, A.; Meister, R. Synergy of in situ and space borne observation for snow depth mapping in the Swiss Alps. Int. J. Appl. Earth Obs. Geoinf. 2007, 9, 294–310. [Google Scholar] [CrossRef]
- Rui, W.; Zhao, C.; Zhang, J.; Guo, E.; Li, D.; Alu, S.; Ha, S.; Dong, Z. Bivariate copula function-based spatial–temporal characteristics analysis of drought in Anhui Province, China. Meteorol. Atmos. Phys. 2019, 131, 1341–1355. [Google Scholar]
- Guo, Y.; Huang, S.; Huang, Q.; Wang, H.; Fang, W.; Yang, Y.; Wang, L. Assessing socioeconomic drought based on an improved Multivariate Standardized Reliability and Resilience Index. J. Hydrol. 2019, 568, 904–918. [Google Scholar] [CrossRef]
- Huang, X.; Deng, J.; Wang, W.; Feng, Q.; Liang, T. Impact of climate and elevation on snow cover using integrated remote sensing snow products in Tibetan Plateau. Remote Sens. Environ. 2017, 190, 274–288. [Google Scholar] [CrossRef]
- Dozier, J.; Bair, E.H.; Davis, R.E. Estimating the spatial distribution of snow water equivalent in the world’s mountains. Wiley Interdiscip. Rev. Water 2016, 3, 461–474. [Google Scholar] [CrossRef]
- Elder, K.; Rosenthal, W.; Davis, R.E. Estimating the spatial distribution of snow water equivalence in a montane watershed. Hydrol. Process. 1998, 12, 1793–1808. [Google Scholar] [CrossRef]
- Jost, G.; Weiler, M.; Gluns, D.R.; Alila, Y. The influence of forest and topography on snow accumulation and melt at the watershed-scale. J. Hydrol. 2007, 347, 101–115. [Google Scholar] [CrossRef]
- Montgomery, D.C.; Peck, E.A.; Vining, G.G. Introduction to Linear Regression Analysis, 6th ed.; John Wiley & Sons, Inc.: Hoboken, NJ, USA, 2021. [Google Scholar]
- Grinsted, A.; Moore, J.C.; Jevrejeva, S. Application of the cross wavelet transform and wavelet coherence to geophysical time series. Nonlinear Process. Geophys. 2004, 11, 561–566. [Google Scholar] [CrossRef]
- Torrence, C.; Compo, G.P. A Practical Guide to Wavelet Analysis. Bull. Am. Meteorol. Soc. 1998, 79, 61–78. [Google Scholar] [CrossRef]
- Mote, P.; Li, S.; Lettenmaier, D.; Xiao, M.; Engel, R. Dramatic declines in snowpack in the western US. npj Clim. Atmos. Sci. 2018, 1, 2. [Google Scholar] [CrossRef]
- Woods, R.; Berghuijs, W.; Hrachowitz, M. Understanding How Snowmelt Manifests in Streamflow. In Proceedings of the AGU Fall Meeting 2014, San Francisco, CA, USA, 13–19 December 2014. [Google Scholar]
- Maina, F.Z.; Kumar, S.V. Global patterns of rain-on-snow and its impacts on runoff from past to future projections. Nat. Commun. 2025, 16, 4731. [Google Scholar] [CrossRef] [PubMed]
- Flanner, M.G.; Shell, K.M.; Barlage, M.; Perovich, D.K.; Tschudi, M.A. Radiative forcing and albedo feedback from the Northern Hemisphere cryosphere between 1979 and 2008. Nat. Geosci. 2011, 4, 151–155. [Google Scholar] [CrossRef]
- Dettinger, M.D.; Knowles, N.; Cayan, D.R. Trends in snowfall versus rainfall in the Western United States—Revisited. In Proceedings of the AGU Fall Meeting, San Francisco, CA, USA, 14–18 December 2015. [Google Scholar]
- Thackeray, C.; Fletcher, C.; Derksen, C. Quantifying the skill of CMIP5 models in simulating seasonal albedo and snow cover evolution: CMIP5 simulated albedo and SCF skill. J. Geophys. Res. Atmos. 2015, 120, 5831–5849. [Google Scholar] [CrossRef]
- Harpold, A.; Molotch, N.; Musselman, K.; Bales, R.; Kirchner, P.; Litvak, M.; Brooks, P. Soil moisture response to snowmelt timing in mixed-conifer subalpine forests: Soil moisture response to snowmelt. Hydrol. Process. 2014, 29, 2782–2798. [Google Scholar] [CrossRef]
- Chen, X.; An, S.; Inouye, D.W.; Schwartz, M.D. Temperature and snowfall trigger alpine vegetation green-up on the world’s roof. Glob. Change Biol. 2015, 21, 3635–3646. [Google Scholar] [CrossRef]
- Finger, D.; Pellicciotti, F.; Konz, M.; Rimkus, S.; Burlando, P. The value of glacier mass balance, satellite snow cover images, and hourly discharge for improving the performance of a physically based distributed hydrological model. Water Resour. Res. 2011, 47, W07519. [Google Scholar] [CrossRef]
- Krinner, G.; Derksen, C.; Essery, R.; Flanner, M.; Hagemann, S.; Clark, M.; Hall, A.; Rott, H.; Brutel-Vuilmet, C.; Kim, H.; et al. ESM-SnowMIP: Assessing snow models and quantifying snow-related climate feedbacks. Geosci. Model Dev. 2018, 11, 5027–5049. [Google Scholar] [CrossRef]
- Mudryk, L.; Santolaria-Otín, M.; Krinner, G.; Ménégoz, M.; Derksen, C.; Brutel-Vuilmet, C.; Brady, M.; Essery, R. Historical Northern Hemisphere snow cover trends and projected changes in the CMIP6 multi-model ensemble. Cryosphere 2020, 14, 2495–2514. [Google Scholar] [CrossRef]
- Immerzeel, W.W.; Lutz, A.F.; Andrade, M.; Bahl, A.; Biemans, H.; Bolch, T.; Hyde, S.; Brumby, S.; Davies, B.J.; Elmore, A.C.; et al. Importance and vulnerability of the world’s water towers. Nature 2020, 577, 364–369. [Google Scholar] [CrossRef]
- Mankin, J.; Viviroli, D.; Singh, D.; Hoekstra, A.; Diffenbaugh, N. The potential for snow to supply human water demand in the present and future. Environ. Res. Lett. 2015, 10, 114016. [Google Scholar] [CrossRef]
| Disclaimer/Publisher’s Note: The statements, opinions and data contained in all publications are solely those of the individual author(s) and contributor(s) and not of MDPI and/or the editor(s). MDPI and/or the editor(s) disclaim responsibility for any injury to people or property resulting from any ideas, methods, instructions or products referred to in the content. |