Article

Multi-Attribute Utility Analysis of Sustainable Supplier Selection Based on Optimized Genetic Algorithm


1
Business School, Wuxi Taihu University, Wuxi 214063, China
2
School of Economics and Management, China University of Mining and Technology, Xuzhou 221116, China
3
China Ship Scientific Research Center, Wuxi 214000, China
*
Author to whom correspondence should be addressed.
Sustainability 2026, 18(10), 5000; https://doi.org/10.3390/su18105000
Submission received: 30 March 2026 / Revised: 6 May 2026 / Accepted: 8 May 2026 / Published: 15 May 2026

Abstract

With the global emphasis on sustainable development, supply chain management is facing new challenges and opportunities. Enterprises often face a large number of suppliers when selecting suppliers, which makes the selection process complex. Considering the crucial role of supplier selection in sustainable supply chains, a sustainable supplier selection model based on multi-attribute utility analysis and a fuzzy approximation ideal solution ranking method is proposed to reduce carbon emissions and environmental pollution. This model helps companies scientifically evaluate and select suppliers by comprehensively considering three aspects: environment, economy, and society. Meanwhile, the study utilizes an optimized genetic algorithm-based order allocation model to raise the efficacy and fairness of order allocation. Reducing procurement costs often relies on improving resource utilization and reducing production waste, which directly lowers the energy consumption and carbon emission intensity per unit of product. At the same time, reducing product damage and delivery delay rates can avoid additional greenhouse gas emissions caused by rework, abandonment, and emergency transportation. By improving supplier productivity and optimizing order allocation, the developed model can not only reduce economic costs but also control environmental pollution and carbon footprints from the source of the supply chain. The outcomes indicate that technological level is a crucial factor influencing supplier selection, with a significant positive impact on supplier willingness to choose, and its standard path coefficient is 0.199, with a significance level of 0.001. Meanwhile, the optimized genetic algorithm exhibits strong stability and convergence in order allocation. This optimization model has high efficiency in handling large-scale orders. This provides strong support for the decision-making of enterprises in sustainable supply chain management and a valuable reference for China’s exploration and practice in the field of sustainable development.

1. Introduction

The challenges faced by sustainable supply chain management (SSCM) are multifaceted, involving multiple dimensions such as environment, society, and economy [1]. SSCM is often affected by unforeseeable events, such as natural disasters, widespread epidemics, geopolitical tensions, etc., which can pose a sustained threat of disruption to the supply chain (SC) [2]. At the same time, SSCM will also face increasing pressure from consumers, suppliers, and stakeholders to reduce carbon footprints and adopt sustainable practices in the SC [3]. Suppliers play a crucial role in sustainable SCs. By optimizing supplier selection, companies can mitigate SC risks, including regulatory and standard non-compliance risks, as well as limited impact on supplier behavior and sustainable development initiatives [4]. However, because of the large number of suppliers, the decision-making problem of supplier selection that enterprises need to face urgently needs to be solved [5]. In order to help enterprises choose sustainable suppliers, ensure business continuity, save costs, and reduce carbon emissions and environmental pollution, a decision optimization model is developed to assist decision-making. To deal with the multi-objective decision-making issue of supplier selection, the multi-attribute utility theory (MAUT) is introduced in this study. At the same time, the study combines an optimized genetic algorithm (GA) and the technique for order preference by similarity to an ideal solution (TOPSIS) to build an order allocation model, thereby improving the efficiency and fairness of order allocation.
The MAUT is often used to deal with multi-objective issues. Umar R et al. proposed the use of the MAUT decision-making method to choose the best employees for PT Kerry Express Indonesia. The evaluation criteria include attendance, output, discipline, and reporting, and the outcomes indicated that the MAUT approach could validly and efficiently select the best employees [6]. Nuroji N et al. applied the MAUT approach to tackle the challenge of choosing the best employees for the company. The four criteria of ability, discipline, performance, and responsibility considered were analyzed in the research. The results indicated that the MAUT method could provide effective decision support for selecting the best employees [7]. Saputra W proposed a solution that combines MAUT and rank sum methods to address the issue of schools selecting the best students at the end of each semester. The results showed that the MAUT and rank sum methods could effectively evaluate and select the best students [8]. Rueda Benavides et al. proposed a decision model that combines MAUT and rank sum methods to address the challenges of national infrastructure performance in funding allocation for state transportation agencies in the United States. The outcomes indicated that the model could effectively balance conflicting objectives [9]. Setiawansyah S et al. raised a MAUT comprehensive approach to address the issues of insufficient transparency and lack of evaluation tools in the recruitment process of English teachers in private schools. The outcomes indicated the effectiveness of the MAUT approach in the process of English teacher recruitment and selection [10]. Although the above studies validated the effectiveness of the MAUT in multi-attribute decision-making, its application scenarios are mostly focused on optimal choices in a single dimension (such as employee or student selection), without involving the complex trade-offs of conflicting economic, environmental, and social goals in supply chain management. In addition, existing MAUT models usually assume that each attribute is independent of each other, and the weight setting depends on the subjective judgment of decision-makers, lacking the ability to handle uncertainty and fuzzy information. In the problem of sustainable supplier selection, there is often a correlation between indicators (such as the constraint between green production and cost), and relying solely on MAUT is difficult to ensure the robustness of decision-making. It is urgent to introduce supplementary methods that can handle fuzzy preferences and distance measures.
The application scope of GA is relatively wide. Ehtesham Rasi R et al. suggested an integrated integer linear programming framework for balancing economic and environmental dimensions, which uses a GA and multi-objective particle swarm optimization algorithm to handle the model. The outcomes indicated that the model validly optimized the sustainability performance of the SC, including economic costs, social time, etc. [11]. Li Z et al. proposed a cell division GA to address the challenge of optimizing printed circuit board components in multifunctional surface mount machines, which allocates based on component units. The results indicated that this method significantly reduced the time required for optimizing printed circuit board components in both simulation and experimentation [12]. Wei W et al. improved the non-dominated sorting GA II to tackle the obstacles of safety, mobility, environmental concerns, and spatial constraints presented by contemporary transportation. The results showed that compared with previous methods, the improved NSGA-II algorithm had significant performance improvements [13]. Fang T et al. proposed a Reply-based distributed multi-user computing task offloading algorithm to alleviate the computational burden in mobile edge computing. The outcomes indicated that the proposed algorithm could validly optimize resource allocation in MEC [14]. Gad AF et al. raised a method for optimizing multi-objective parameters through GA to address the problem of large and chaotic data in open source and easy-to-use Python libraries, which supports various parameters. The results showed that the method proposed by the research could help organize and classify Python library data, greatly improving computational efficiency [15]. Although the above genetic algorithm applications have demonstrated their powerful search capabilities in multi-objective optimization, they mostly focus on single-stage decision-making problems (such as resource allocation and task scheduling), lacking systematic integration with decision-making methods in the supplier pre-screening stage (such as MAUT or TOPSIS). In addition, standard genetic algorithms are prone to getting stuck in local optima in order allocation and have a slow convergence speed for large-scale problems. Existing improvement research mostly optimizes from the perspective of algorithm parameters, without considering the feedback mechanism of supplier selection evaluation results on order allocation constraints. Therefore, in the context of sustainable supply chain management, relying solely on genetic algorithms cannot solve the hierarchical coupling problem between supplier sorting and order allocation. It is necessary to construct an integrated framework that combines multi-criteria evaluation with intelligent optimization.
In summary, many experts and researchers around the world have carried out thorough investigations into the MAUT and GA. However, no one has yet applied the MAUT model and optimized GA to SSCM. Based on the above background, this study aims to address the following core issues: how to scientifically integrate multiple economic, environmental, and social standards in sustainable supply chain management and achieve effective screening and order allocation of a large number of candidate suppliers. To fill the gap in the existing literature that lacks the integration of the multi-attribute utility theory, fuzzy approximation ideal solution ranking method, and adaptive genetic algorithm system into supplier selection decision-making, this paper proposes the following research objectives: firstly, to construct a sustainable supplier selection (SSS) model based on the MAUT and quantitatively evaluate the comprehensive performance of suppliers in key indicators such as technological level, green production, safety, and health; secondly, by combining fuzzy TOPSIS and the optimized genetic algorithm, to develop an order allocation model with the goal of minimizing procurement costs, product damage rates, delayed delivery quantities, and carbon emissions, while maximizing the total procurement value; and thirdly, to verify the feasibility and superiority of the proposed model through practical cases. Compared to existing research, the original contribution of this article is that the MAUT method has been systematically applied for the first time to integrate comprehensive criteria for sustainable supplier selection, overcoming the limitations of a single economic orientation. Optimizing the adaptive mechanism of the genetic algorithm significantly improves the convergence efficiency and solution quality of order allocation in large-scale problems. The collaborative framework of the MAUT fuzzy TOPSIS-GA can simultaneously handle supplier sorting and multi-objective order allocation under the same decision logic, providing a new tool for sustainable supply chain management that combines theoretical rigor and practical operability.

2. Methods and Materials

The study first constructed an SSS MAUT model based on multiple methods to raise the efficacy of supplier selection. To further ensure the efficiency of order allocation in SSCM, fuzzy TOPSIS and optimized GA were selected to build the model.

2.1. Construction of MAUT Model for SSS

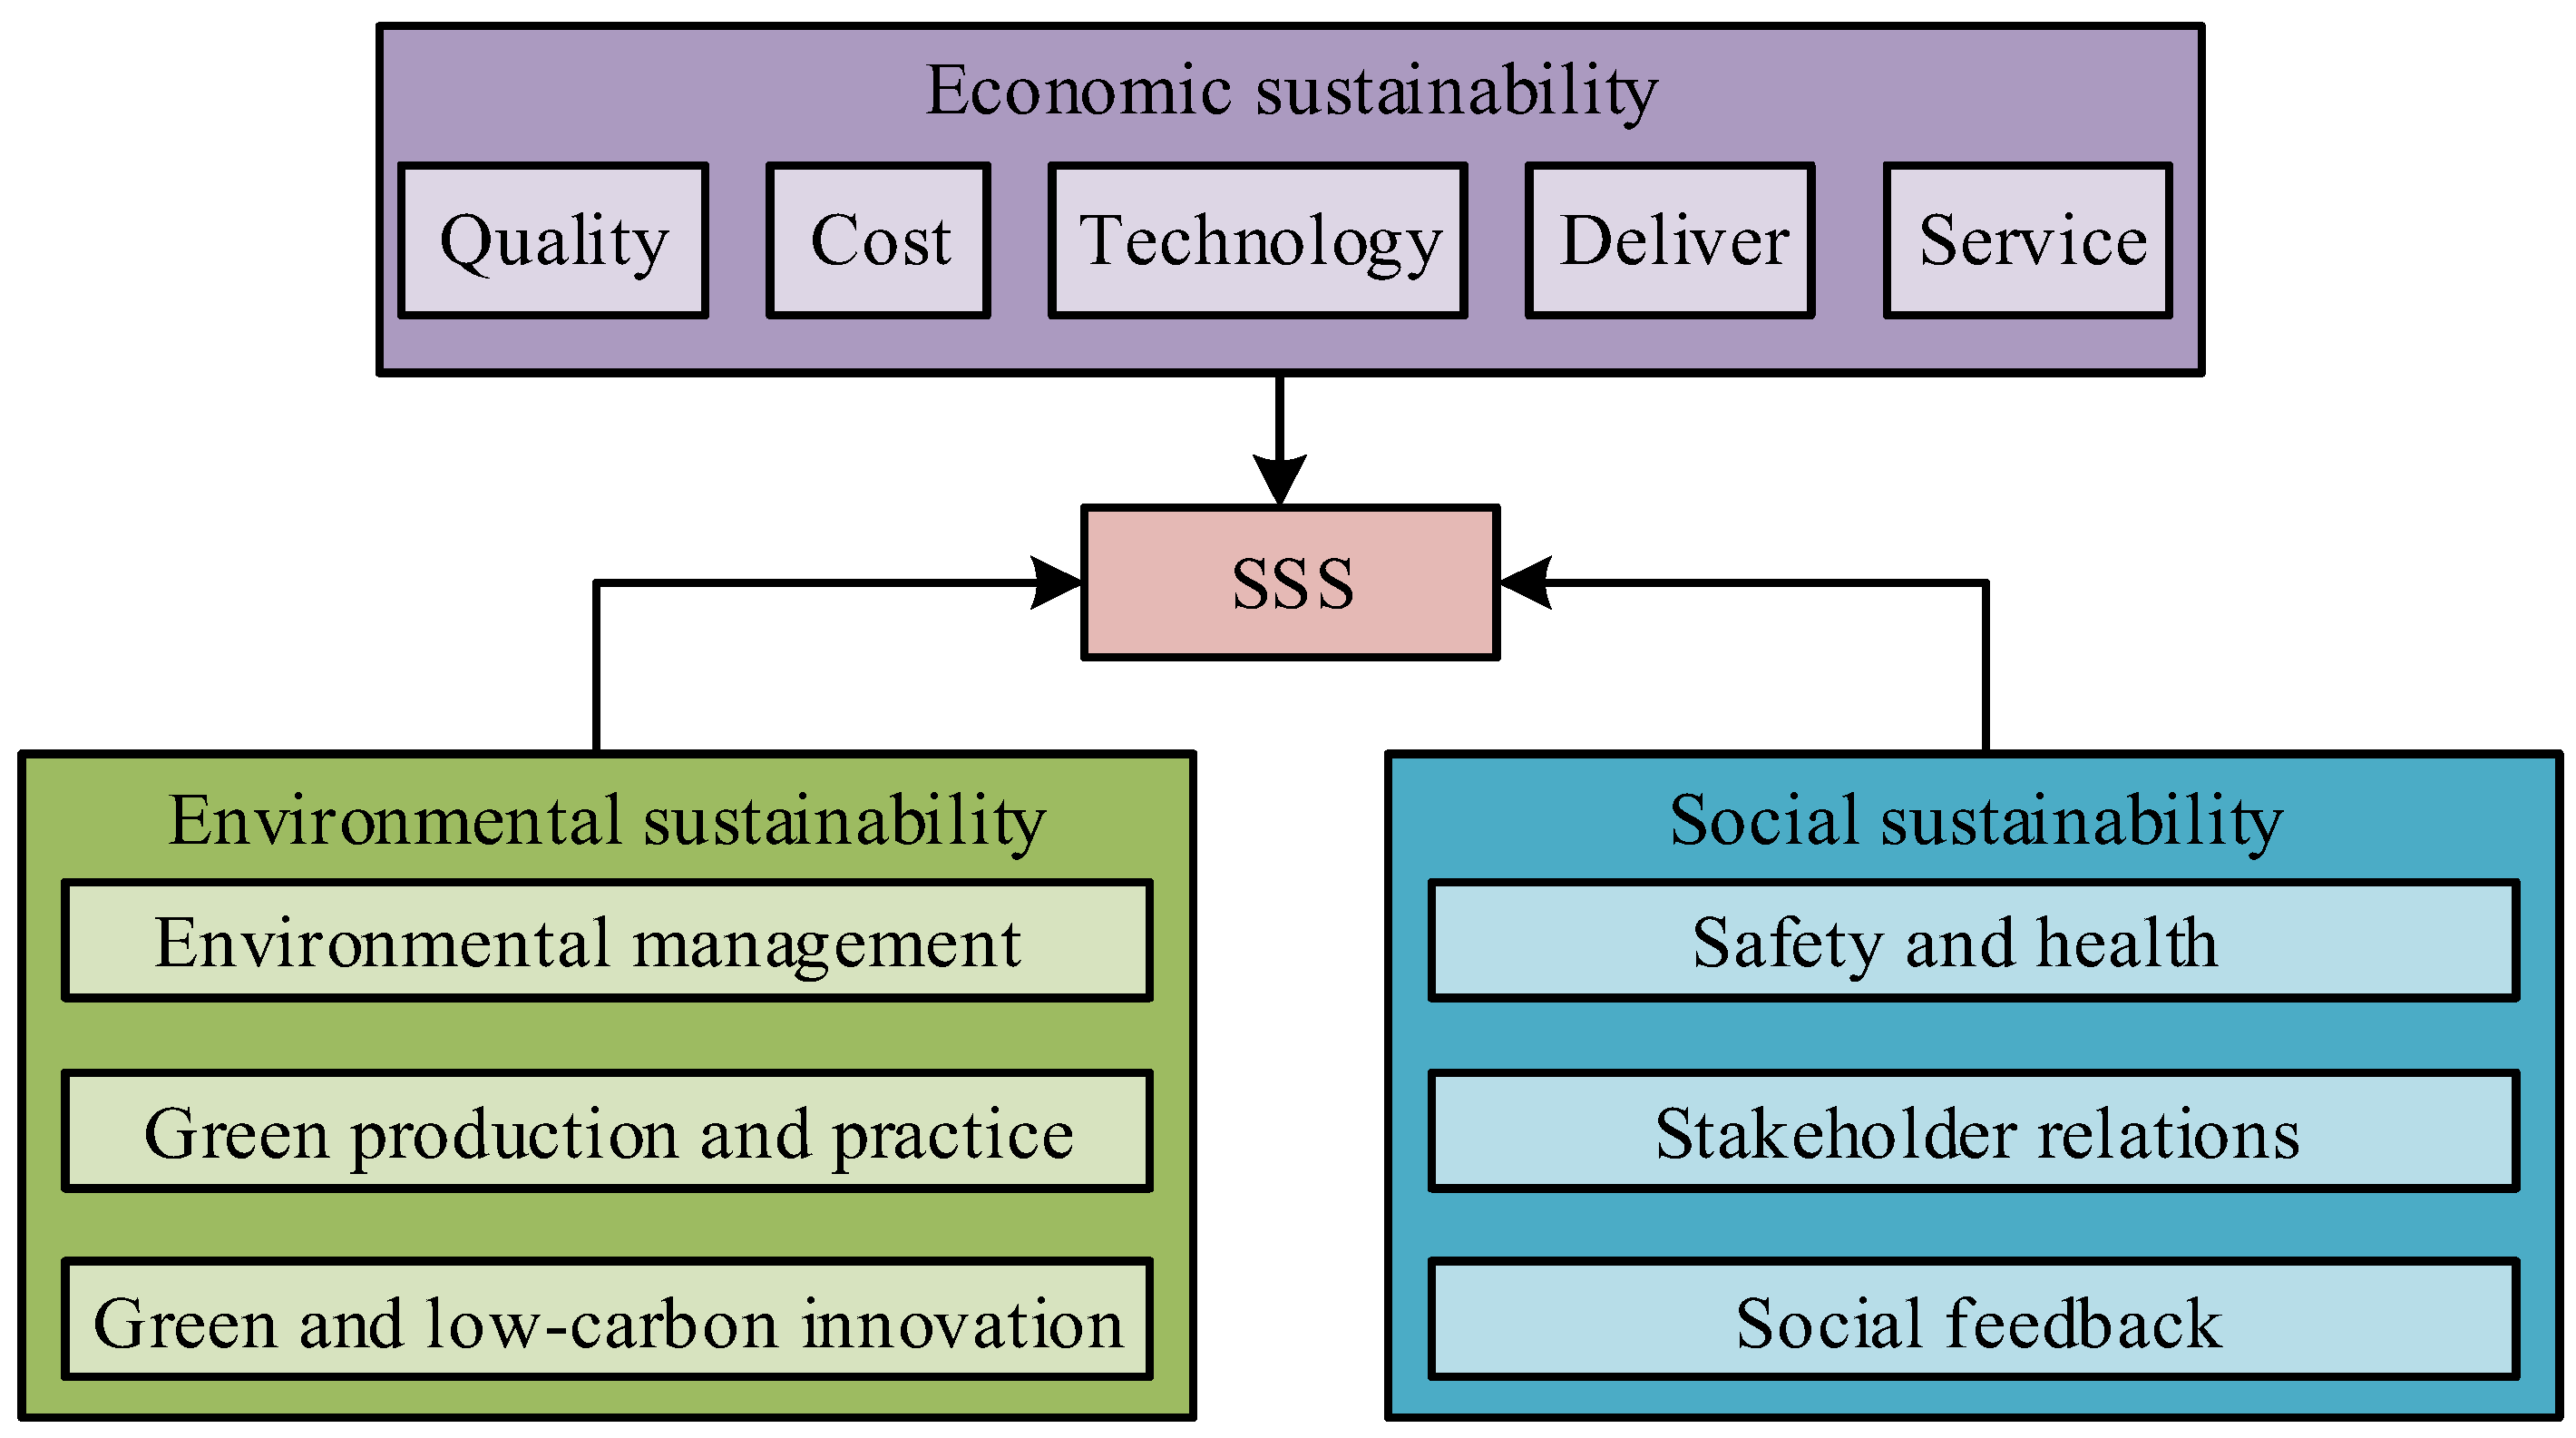
In SSCM, SSS and order allocation (SSSOA) are two core issues [16]. The issues affecting SSS include economic, social, and environmental goals, and suppliers should fully consider these three aspects and adjust their selection decisions in a timely manner. The SSS standard framework is shown in Figure 1.
From Figure 1, the main factors affecting the SSS standard are economic, social, and environmental factors, which are consistent with the triple bottom line (TBL) framework. The TBL underscores that evaluating a business’s success should not solely hinge on economic profits but must also encompass its effects on the environment and society [17]. In the SSS process, economic issues are the core factors that affect SSS issues, which in turn include factors such as cost, quality, and service level. The study first controls the optimal quality, which is calculated as represented in Equation (1).
min f 1 ( X ) = i = 1 n X i q i
In Equation (1), X i denotes the quantity of the i th supplier order and q i is the scrap rate of the i th supplier. The cost control calculation is in Equation (2).
min f 2 ( X , Y ) = i = 1 n C i X i + i = 1 n O i Y i
In Equation (2), Y i is a binary variable. If Y i = 0, it means the order has not been assigned to the i th supplier, and if Y i = 1, it means the order has been assigned to the i th supplier. C i represents the unit price of the goods provided by the i th supplier, and O i is the order cost of the i th supplier. The control calculation of the service level is shown in Equation (3).
max f 3 ( X ) = W i X i
In Equation (3), W i represents the punctual delivery situation of the i th supplier. The study also requires certain constraints to control the economic issues in SSS, as shown in Equation (4).
X i V i × Y i , i = 1 , 2 , , n i = 1 n X i ( 1 q i ) D , i X i 0 , i = 1 , 2 , , n
In Equation (4), V i represents the manufacturing capability of the supplier, n represents the proportion of products that meet quality standards in the orders delivered by the supplier, D represents the procurement needs of key customers (buyers), and the total number of n needs to be greater than the D value. With selection constraints in place, it is necessary to evaluate the environmental impact of SSS processes, including carbon emissions, waste management, and resource consumption. This involves multiple dimensions of factors; therefore, the study introduces the MAUT. The MAUT is a decision analysis method that provides a decision framework for representing preferences in multi-objective or multi-criteria decision-making. This theory allows decision-makers to choose from multiple options, which can be evaluated based on multiple attributes or criteria [18]. This method simplifies the decision-making process, allowing decision-makers to more intuitively evaluate and compare the strengths and weaknesses of different suppliers, as calculated in Equation (5).
U ( Z ) = i = 1 k λ i × 1 Z i Z i Z i
In Equation (5), k represents the numerical indicators of the objective function, Z i is the benchmark value of the i th objective, and Z i is the true value of the i th objective. Therefore, Z i Z i represents the distance between the true value of the i th objective function and the benchmark value of the i th objective function, 1 Z i Z i Z i is the degree of achievement of the i th objective, and λ i represents the importance weight assigned by the decision maker to the i th objective. Subsequently, the research constructed a MAUT planning model and calculated it as shown in Equation (6).
max i = 1 3 λ i × 1 Z i Z i Z i
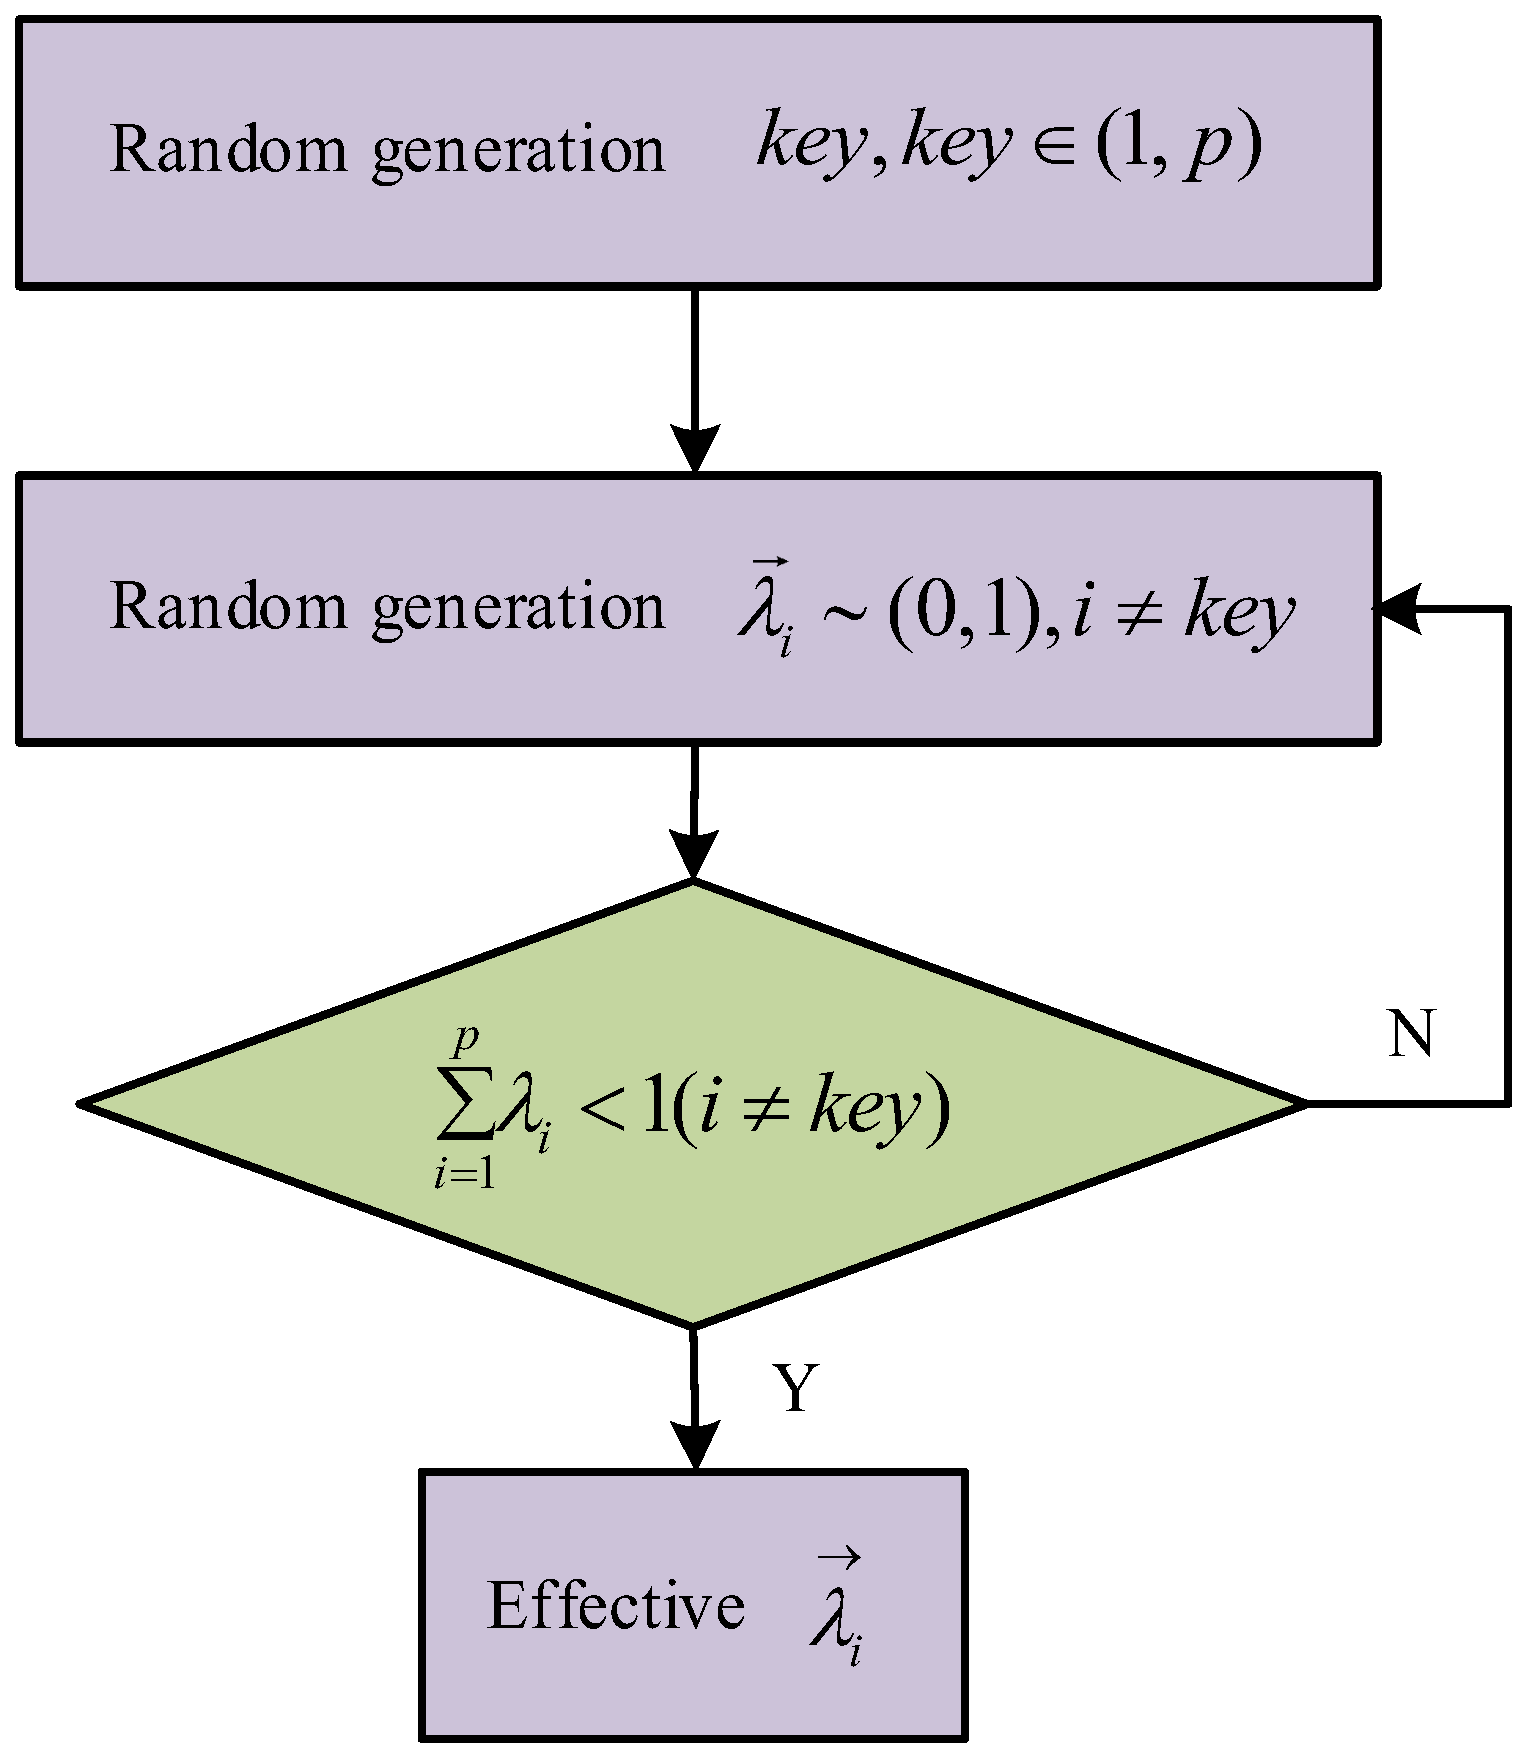
Based on the above constraints and control equations, the calculation of the optimal solution for SSS using the MAUT model can be categorized into four phases. Firstly, the benchmark target vector is determined. Secondly, the priority of the objective functions’ weights is established, assigning the highest weight to the most significant objective function. Then, the weight vectors for each group are calculated to yield a series of potential supplier allocation schemes. Finally, these options are filtered, and the corresponding selection plan is determined. Figure 2 illustrates the computational procedure of the MAUT model.
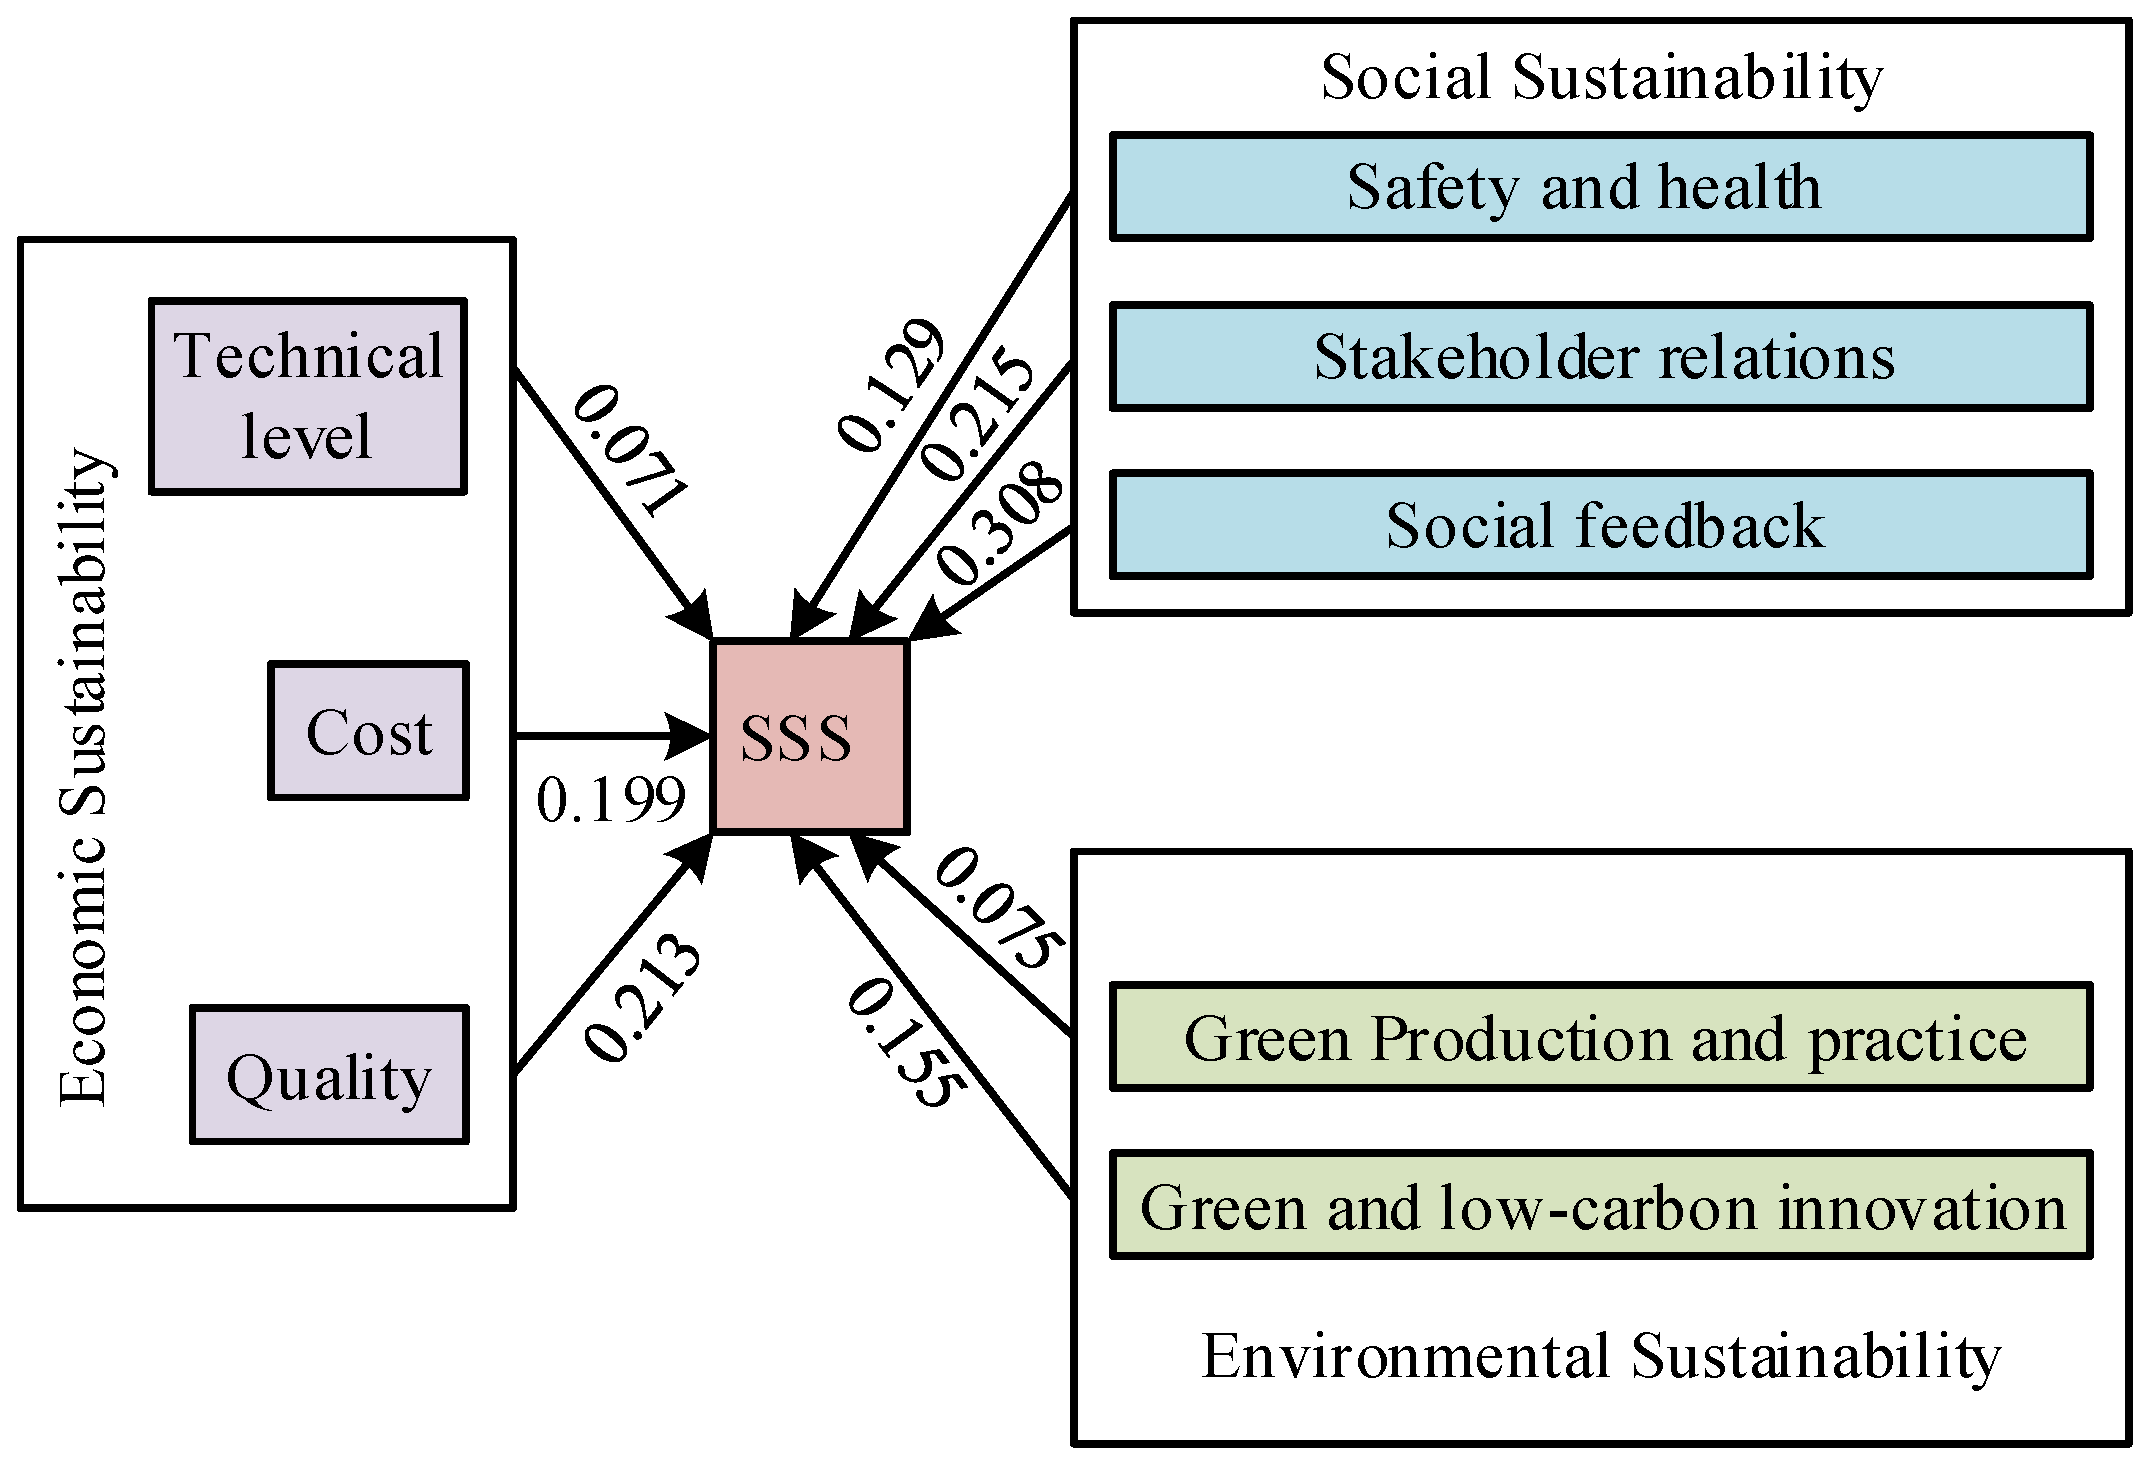
By following the calculation steps of the MAUT model in Figure 2, the degree of influence on SSS can be determined. The calculated influencing factors are used as the main evaluation criteria for SSS decision-making in order to reduce the information complexity and uncertainty in SSS problems. The final research determined eight indicators as the selection criteria: cost, technological level, supplier supply quality, green production and practice, green low-carbon innovation, safety and health, stakeholder relations, and social feedback. The optimized SSS impact indicators of the MAUT model are shown in Figure 3.
The specific calculation methods for each indicator in Figure 3 can be quantified based on the historical data of the enterprise and industry standards. For example, the technological level is obtained by normalizing and weighting indicators such as the number of patents and the proportion of R&D investment. Green production and practice are calculated based on measured values such as unit product carbon emissions and wastewater and exhaust gas treatment rates. Safety and health are evaluated based on factors such as the rate of work-related accidents and occupational health certification. This indicator framework is designed based on the triple bottom line theory and has universality, suitable for most manufacturing enterprises or supply chain core enterprises facing sustainable supplier selection decisions. However, in practical applications, different industries or enterprises can adaptively adjust the weight of each indicator according to their own strategic priorities and regulatory requirements. The ranking of various sustainable supplier selection factors in Figure 3 is not subjective speculation but is calculated based on the weight coefficients determined in the MAUT model. The study distributed a survey questionnaire to 15 supply chain management experts and industry practitioners, used the Analytic Hierarchy Process to compare the importance of each indicator pairwise, and combined it with the goal achievement degree in the MAUT model to calculate the global weight of each indicator. The calculation results show that the weight of “safety and health” is 0.248, significantly higher than “stakeholder relations” (0.193) and “cost” (0.126). From Figure 3, the optimized SSS selection preference of the MAUT model considers safety and health as the most important factors, followed by stakeholder relationships, supplier service levels, costs, etc. SSS preference has shifted from being dominated by economic factors to being dominated by social sustainability. The MAUT model fully considers the balance between economic benefits and social and environmental responsibilities during optimization, which provides a basis for subsequent research on SSSOA issues.
The basic dataset used for model testing comes from the Wind Industry Chain database and the supplier performance database of the China Supply Chain Management Research Center. A total of 200 suppliers located in different industries (mainly manufacturing, covering automotive, electronics, mechanical components, etc.) were selected as initial samples. The sample selection adopts a stratified random sampling method, stratified by enterprise size (large, medium, and small) and industry category, with a certain number randomly selected from each layer to ensure that the sample covers suppliers with different production capacities and sustainable performance levels. Data collection is mainly conducted through three channels: first, environmental, social, and governance (ESG) reports and annual financial reports publicly released by enterprises are obtained; second, qualitative indicators such as a supplier’s technical level, safety and health, and stakeholder relationships are obtained through a questionnaire survey (the questionnaire is pre-reviewed by two professors in the field of supply chain management and uses the Likert five-point scale); and third, quantitative data provided by third-party platforms such as green supply chain evaluation systems are obtained, including carbon emissions, product damage rates, and on-time delivery rates. The sample has good representativeness in industry distribution (78% in manufacturing and 22% in services), but due to limited data availability, the proportion of small enterprises is relatively low (only 15%), and suppliers in the informal economy are not included, which may lead to certain limitations in the model’s evaluation of the sustainable performance of small and micro-enterprises.

2.2. Sustainable Supplier Order Allocation Model Based on Optimization GA

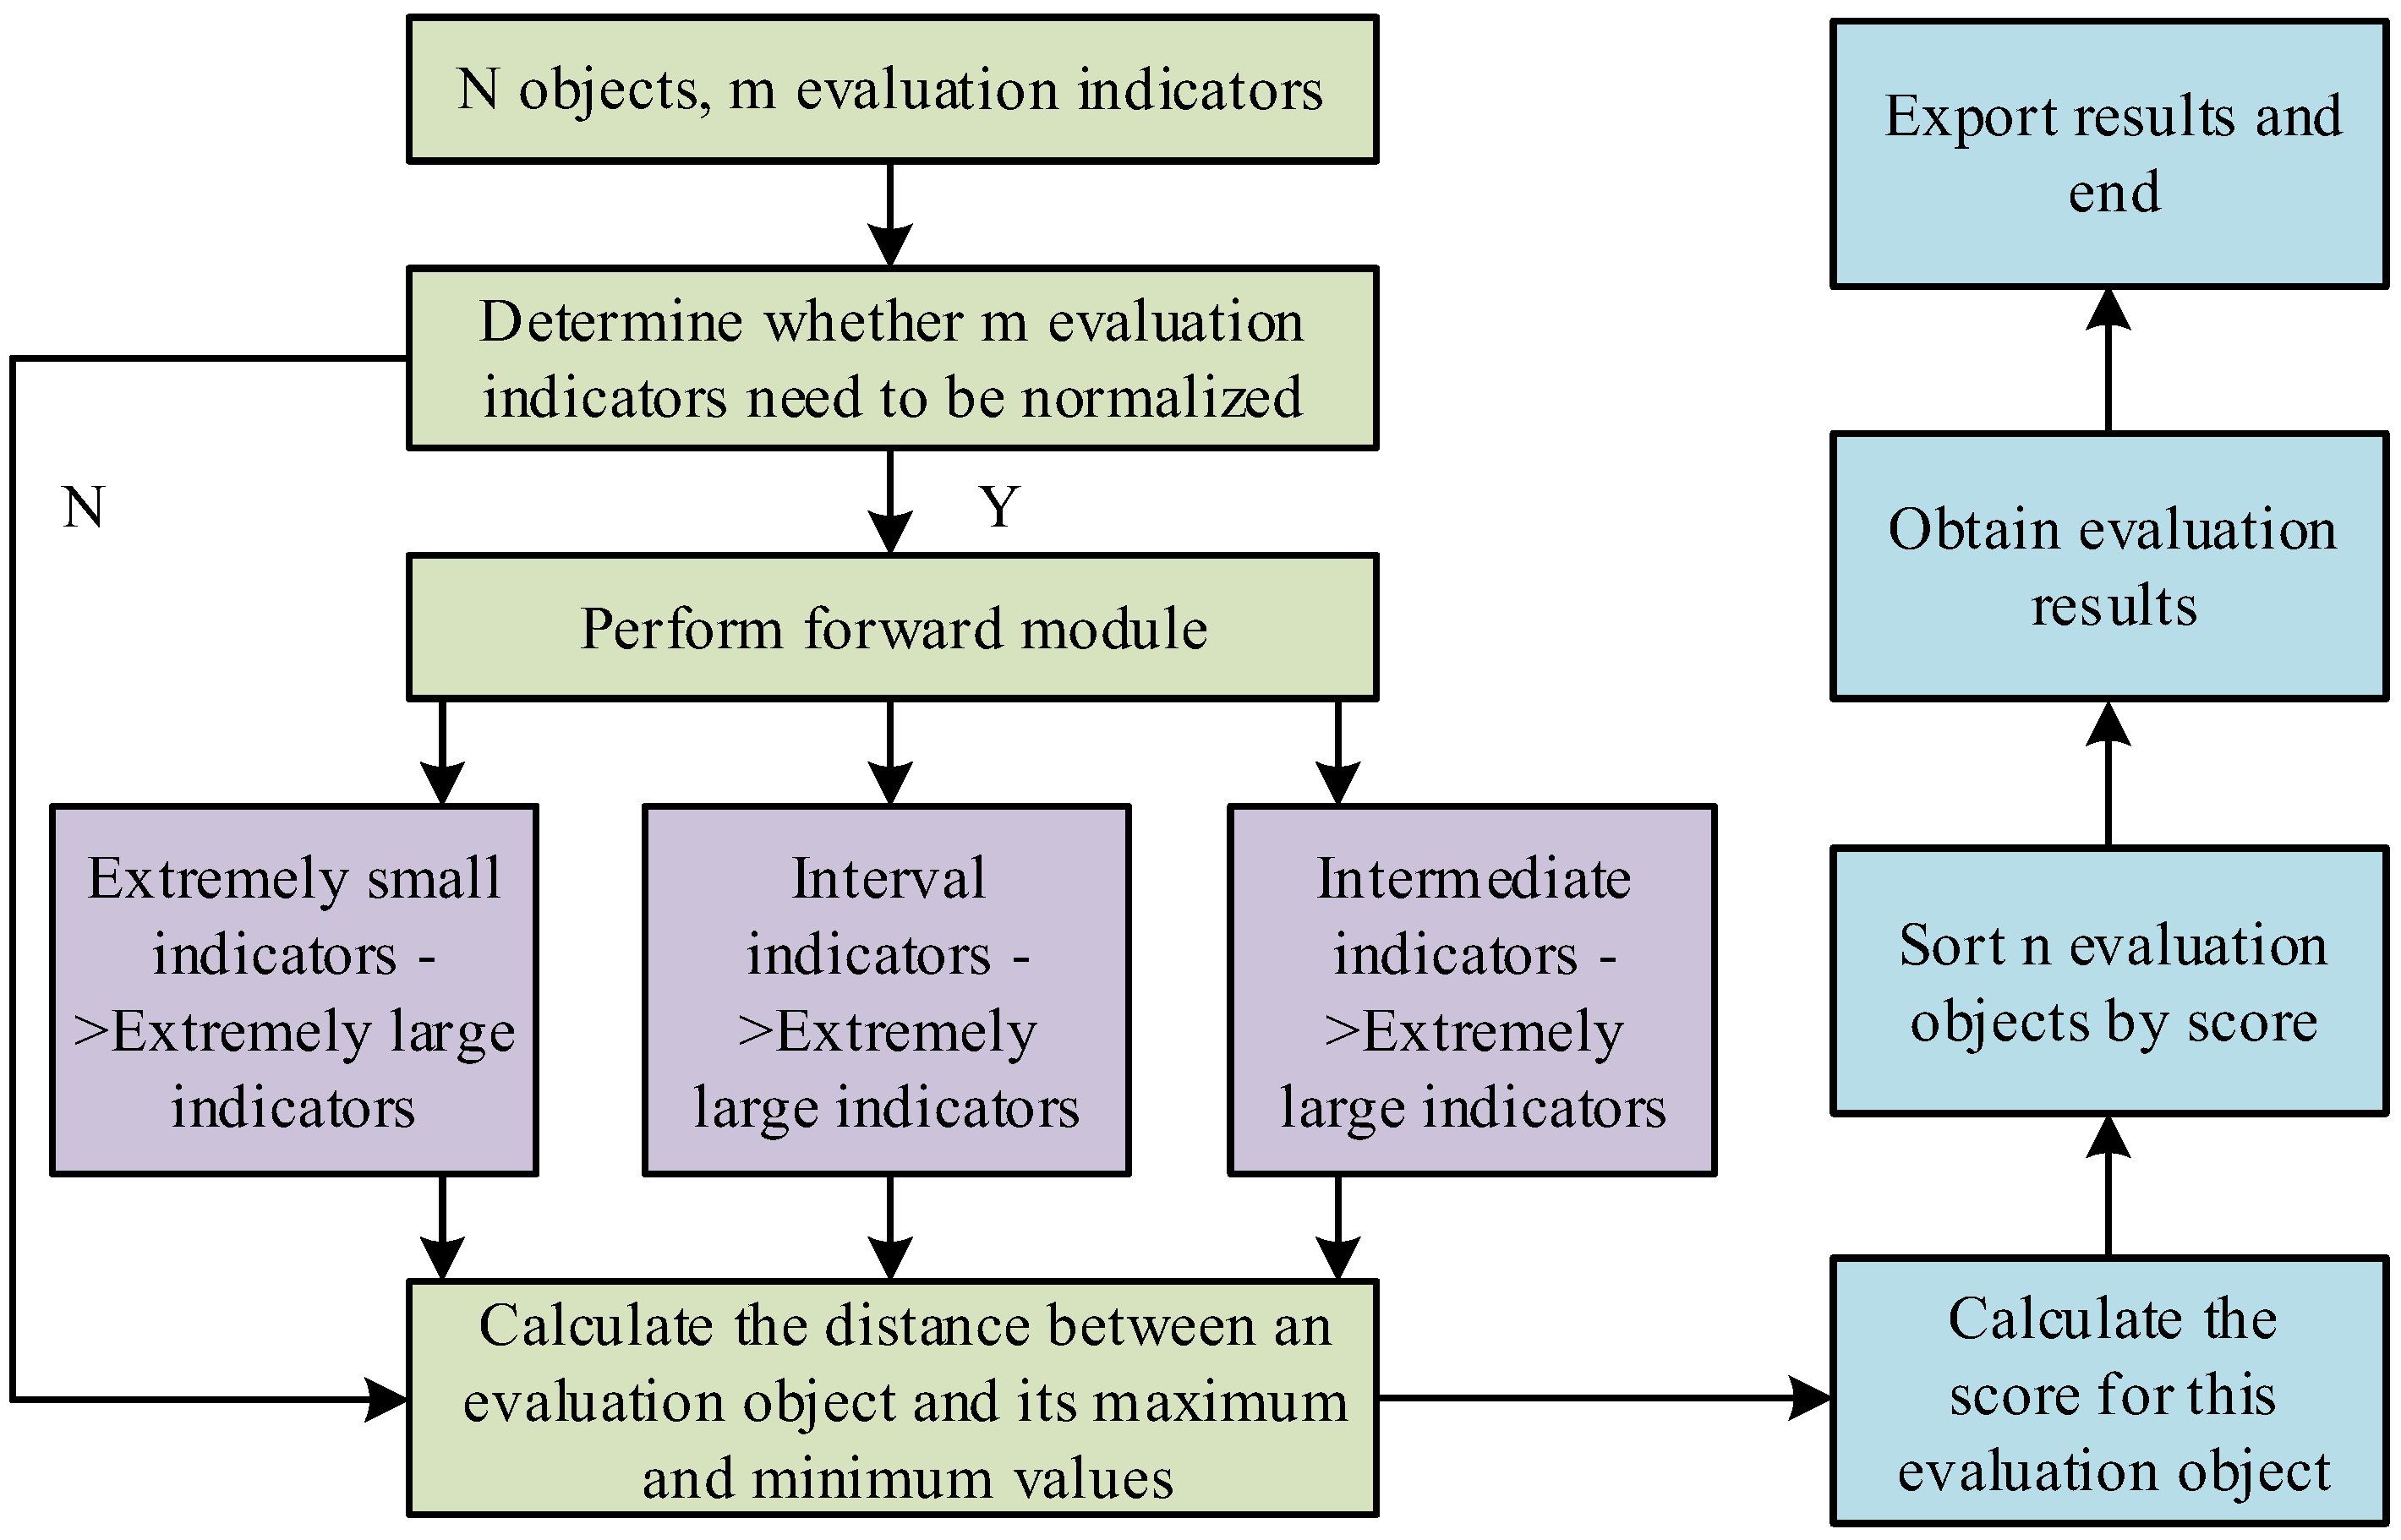
After constructing the MAUT model, preliminary selection decision indicators are obtained, and then another core issue in SSCM needs to be explored based on this, SSSOA. This issue requires a comprehensive evaluation and selection of suppliers based on the optimized SSS decision indicators of the MAUT. Currently, the research and practical status of SSSOA issues indicate that it is a complex multidimensional decision-making process that requires consideration of multiple factors and objectives. Based on this, the research proposed using the TOPSIS method to construct an SSSOA model. TOPSIS ranks evaluation objects by measuring their proximity to an IS and distance from a negative ideal solution (NIS), ultimately selecting the option that is nearest to the ideal and farthest from the negative as the optimal choice [19]. The operating principle of TOPSIS is shown in Figure 4.
The operation principle of the TOPSIS method in Figure 4 can be summarized into five steps. Firstly, the original matrix is normalized and the indicator types are unified. Next, the matrix is standardized after normalization to eliminate the influence of dimensionality. Then, the calculated scores are normalized. Subsequently, the normalized outcome is computed to ascertain the separation between the IS and NIS. Ultimately, the ranking is established according to the proximity of each solution to the ideal and its distance from the negative ideal. The solution that lies nearer to the ideal and further from the negative is deemed superior. The calculations for the IS and NIS are outlined in the equation provided (7).
V = v i j m n i = 1 , 2 , , m j = 1 , 2 , , n
In Equation (7), j represents the assumed multiple candidate suppliers, n is the number of suppliers that meet the selection criteria, m represents the selection weight, and v i j m n represents the matrix weighted normalization matrix. From this, the distance to the IS and the distance to the NIS can be deduced using the calculations presented in Equations (8) and (9).
d i = j = 1 n d ν v i j , v j , i = 1 , 2 , , m
In Equation (8), d i represents the fuzzy positive IS distance and v j represents the ideal value of the j th supplier. In Equation (9), d i represents the fuzzy NIS distance, d ν is the weight of the v th attribute, v i j is the performance value of the i th solution on the j th supplier, and v j represents the negative ideal value of the j th supplier. However, the TOPSIS assumes that the evaluation indicators are independent of each other, but in reality, there may be some correlation between many indicators. This correlation may affect the accuracy of the decision results. Therefore, it is proposed to use the optimized GA to maintain population diversity, which requires non-dominated sorting and correlation index crowding calculation. The GA is a heuristic search algorithm that mimics the processes of natural selection and genetics and has shown great potential in solving optimization and search problems [20]. The research conducts adaptive optimization on the GA algorithm to dynamically adjust based on population fitness, ultimately adapting to different search stages and environments. The calculation of optimizing the adaptive GA algorithm is shown in Equation (10).
j = q j q max , q j = K ( j ) 1 N j = 1 N K ( j ) , q max = max ( q j )
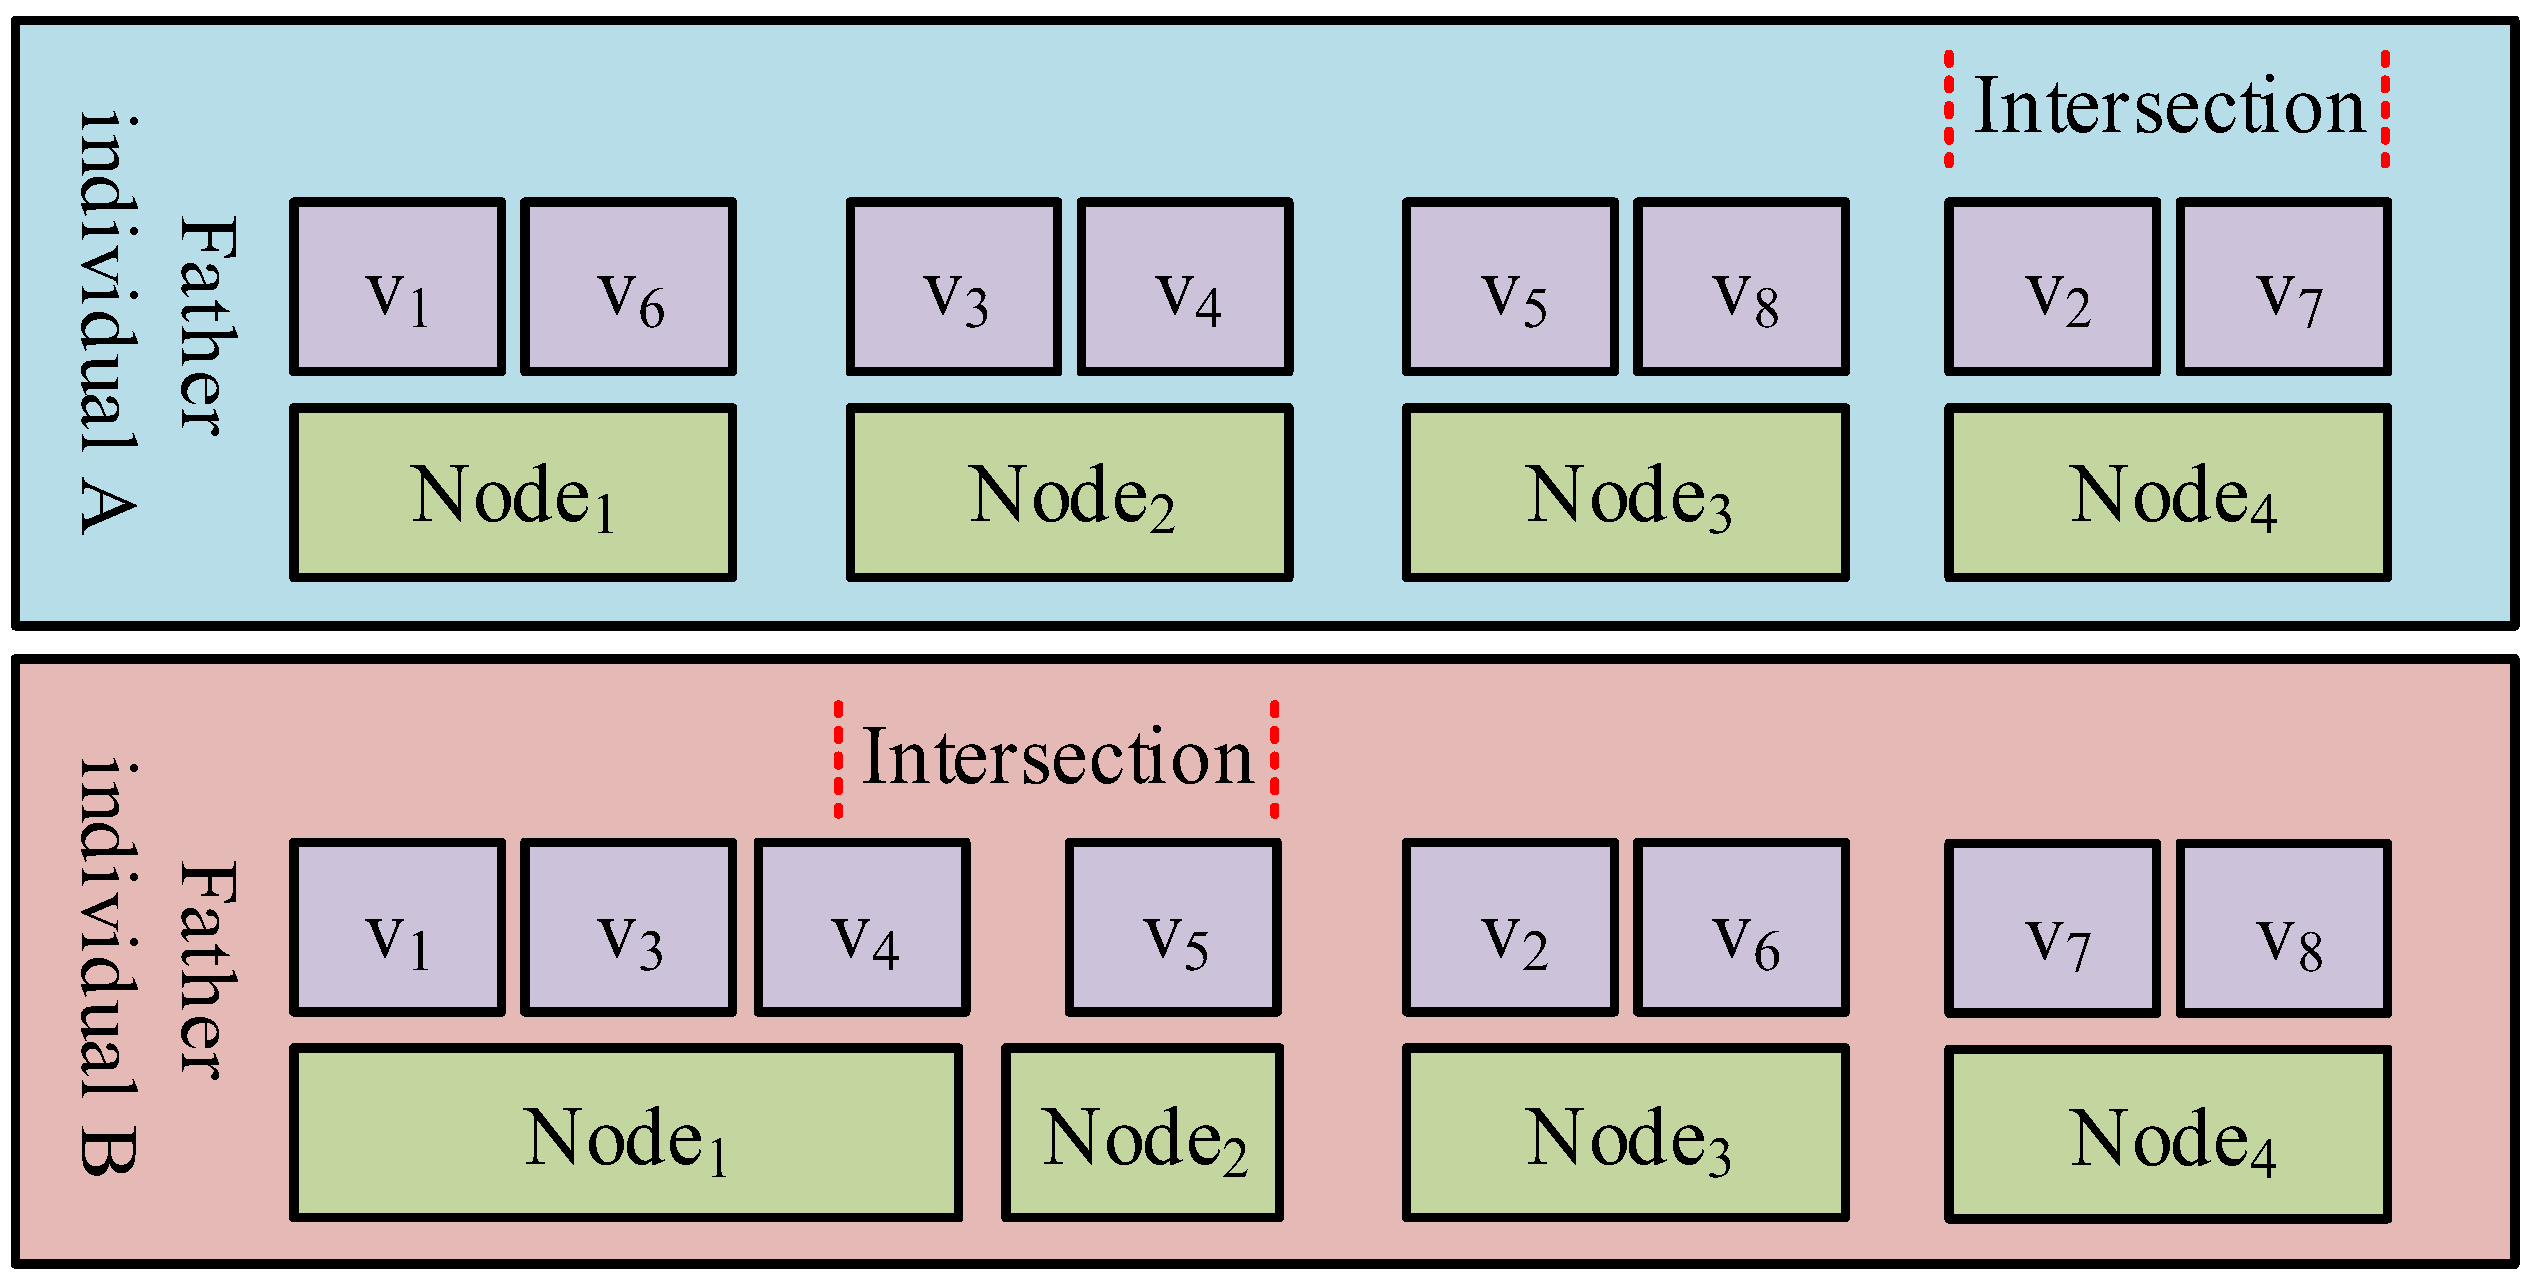
In Equation (10), j is the normalized ratio of the j th supplier and q j is the normalized weight value of the j th supplier. N represents the paternal gene, and the probability of the adaptive GA needs to be higher than that of genetic genes, with N forming the offspring gene. K represents the correlation between decision indicators. The optimized GA is shown in Figure 5.
In Figure 5, the two parent individuals are composed of a series of subgenes, which in turn form nodes. This genetic process can make genetic information complete while increasing population likelihood. The research utilizes the optimized adaptive GA to optimize the TOPSIS model and construct a new SSSOA model. The minimum procurement cost calculation of the SSSOA model is shown in Equation (11).
m i n T C P = i = 1 N P i X i Y i + i = 1 N Q Y i + i = 1 N T i X i Y i + i = 1 N H X i 2 Y i
In Equation (11), P i represents the unit purchase price of sustainable supplier i , X i represents the number of product orders from sustainable supplier i , Y i represents a variable from 0 to 1, N is the number of sustainable suppliers, Q is the maximum acceptable rate of damaged products for decision-makers, T i is the unit transportation cost of sustainable supplier i , and H is the unit inventory holding cost of products. The maximum total procurement value of the SSSOA model is calculated as shown in Equation (12).
m a x T V P = i = 1 N W i X i , i = 1 N W i = 1
In Equation (12), W i is the number of product orders from sustainable supplier i . The minimum carbon emission calculation of the SSSOA model is shown in Equation (13).
m i n T C E = i = 1 N G i X i
In Equation (13), G i represents the unit product carbon emissions of sustainable supplier i . The minimum product damage calculation of the SSSOA model is shown in Equation (14).
m i n T D A = i = 1 N q i X i
In Equation (14), q i represents the average product damage rate of sustainable supplier i . The calculation of the minimum delayed delivery quantity for the SSSOA model is shown in Equation (15).
m i n T L A = i = 1 N p i X i
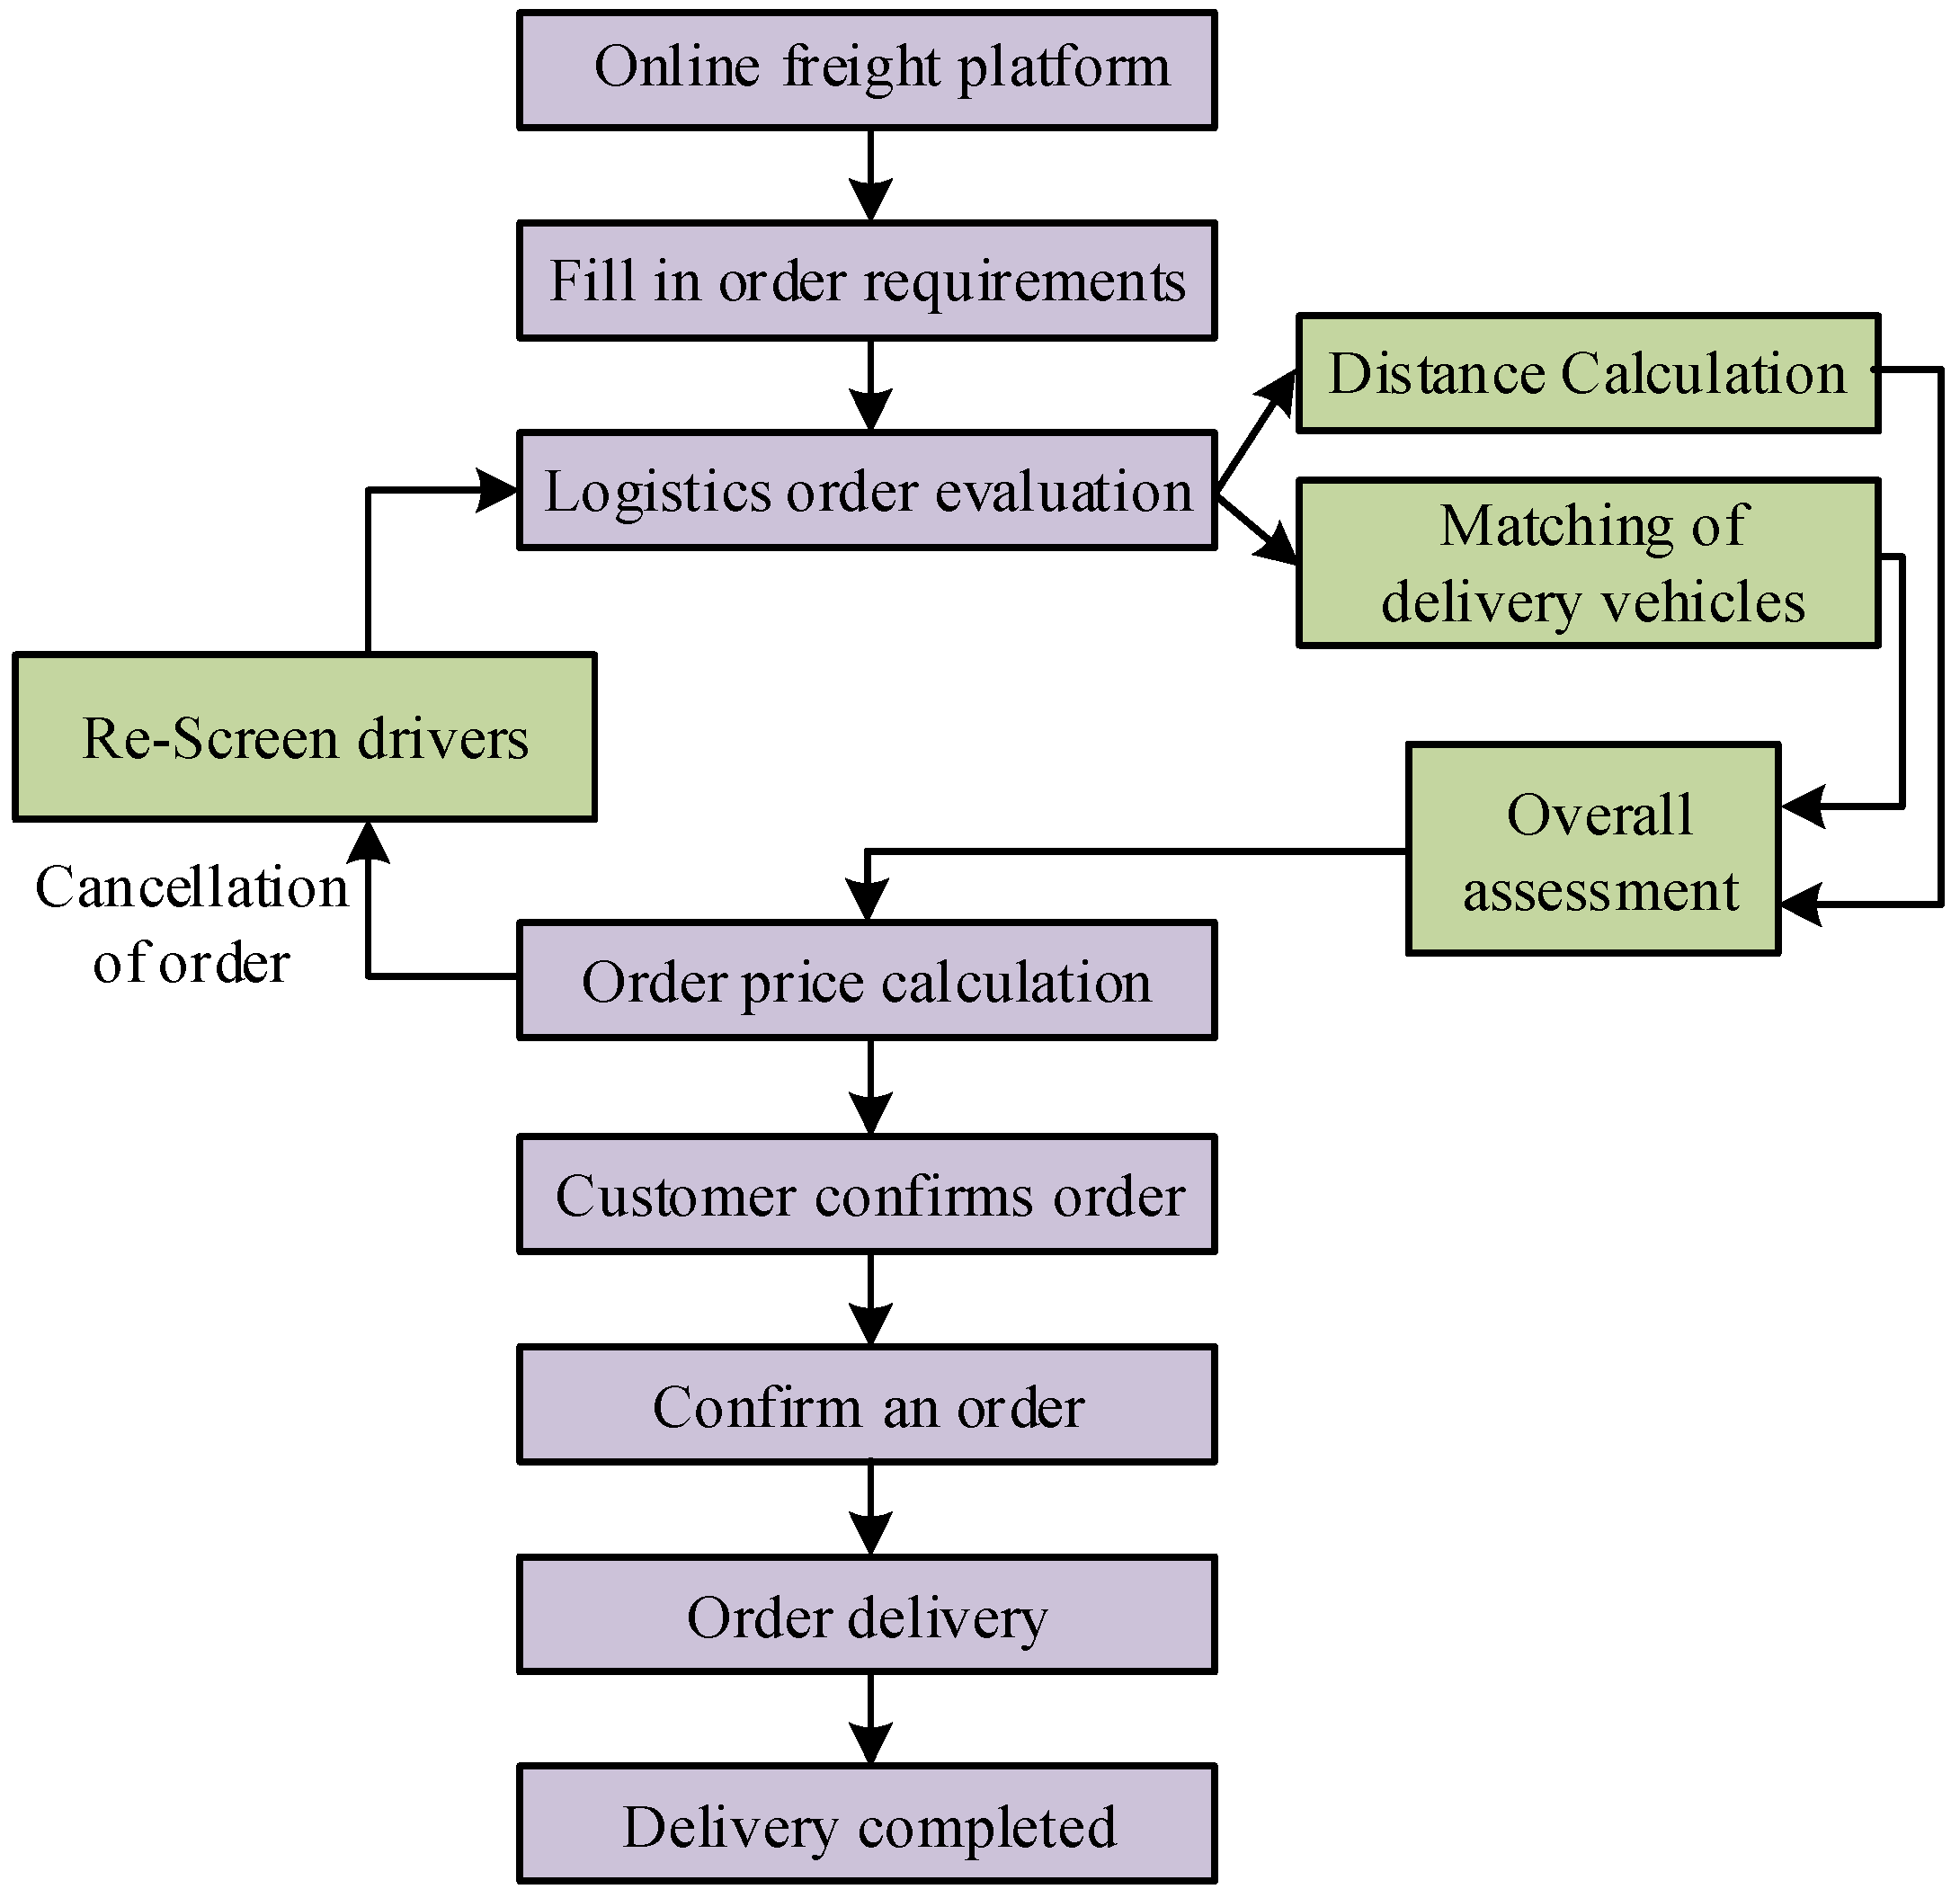
In Equation (15), p i is the average delayed delivery rate of sustainable supplier i . In summary, the operational process of the SSSOA model for sustainable supplier orders, which combines optimized GA, is shown in Figure 6.
According to Figure 6, a sustainable supplier order allocation model based on the optimized GA is designed to obtain the optimal order allocation result. The order delivery model needs to calculate the distance between the origin and destination of product transportation, and the platform automatically matches suitable idle delivery vehicles based on the type and distance of goods. It is essential to undertake a thorough assessment of all work aspects and orders to achieve the most efficient delivery plan.
Regarding the determination of weights for each evaluation criterion, this study adopts the Analytic Hierarchy Process combined with expert scoring. Fifteen experts were invited to participate, including eight supply chain directors or procurement managers from manufacturing companies, four professors in sustainable supply chain research from universities, and three policy advisors from government environmental departments or industry associations. Experts score the importance of each indicator (cost, technological level, green production, safety and health, etc.) by comparing the judgment matrix pairwise. After consistency testing (CR < 0.1), the local weights of each indicator are calculated, and then the global weights are calculated based on the target achievement degree of the MAUT model. To ensure the reliability of the model, three methods were used for validation. (1) First was the sensitivity analysis, where after changing the weight by 20% and observing the changes in supplier ranking, the results showed that the ranking remained stable (Spearman correlation coefficient > 0.85). (2) Next was comparative verification, where by comparing the MAUT model with other commonly used multi-criteria decision-making methods (such as traditional TOPSIS and the simple weighting method) on the same dataset, it was found that the MAUT model has higher sensitivity in distinguishing between optimal and non-optimal suppliers. (3) Last was backtesting, where 5 suppliers with actual cooperation performance data were selected and the model’s predicted optimal supplier was compared with the actual performance ranking; the agreement was 80% (4/5).

3. Results

This section compared the capability of the design model and the differences in supplier selection and order allocation before and after optimization and evaluated the impact of the optimization plan on the economic, social, and environmental benefits of the enterprise.

3.1. Performance Analysis of MAUT Model and Optimized GA Model

To confirm the performance advantages of the MAUT model raised in the study and the SSSOA model based on the optimized GA, experiments were conducted. The computer environment and parameters applied in the experiment are in Table 1.
The experiment first used AMOS 17.0 software to test the MAUT model to confirm the validity of the evaluation criteria for the SSS selected by the MAUT model. Four SSS models were set up in the experiment, with Model 1 being the standard MAUT model, taking into account environmental, economic, and social impact indicators. Model 2 is a TBL model that does not consider environmental factors, Model 3 is a TBL model that does not consider environmental and economic factors, and Model 4 is a TBL model that does not consider economic, environmental, and social factors. The experiment used four models to screen and make decisions on data from 200 suppliers on a certain online platform, ultimately selecting suppliers that meet sustainable development standards. The data was sourced from the Wind Industry Chain and SC database. The selection outcomes of the four models are in Table 2.
In Table 2, GFI is the goodness of fit index, CFI is the comparative fit index, and RMSEA is the root mean square of approximation error. From Table 2, the technical level was an important factor affecting supplier selection, with a significant positive impact on supplier willingness to choose, and its standard path coefficient was 0.199, with a significance level of 0.001. The standardized path coefficient reflects the magnitude of the direct effect of the independent variable on the dependent variable, with a larger absolute value indicating a stronger influence and a positive or negative sign indicating the direction of influence. The significance level (p-value) is used to determine whether the estimated coefficient is statistically significant and non-zero, usually with a threshold of 0.05. When p < 0.05, it is considered to have a significant impact. The coefficient of technical level in this study is 0.199 p = 0.001, This means that for every one standard deviation increase in technical level, the willingness to choose suppliers increases by 0.199 standard deviations, and this positive effect is significant at the 0.001 level. In addition, the MAUT model proposed by the research had the lowest RMSEA value, which was 0.047, indicating the best fit performance. According to the commonly used model fitting index evaluation criteria in the literature, an RMSEA less than 0.05 indicates good fitting, 0.05–0.08 indicates reasonable fitting, and greater than 0.10 indicates poor fitting; a GFI and CFI greater than 0.90 are excellent, while 0.80–0.90 are acceptable. In this study, the RMSEA of Model 1 was 0.047 (<0.05), reaching the level of “good fit”: GFI = 0.812 (>0.80) and CFI = 0.886 (>0.80). All reached the level of “acceptable” or above. In contrast, the RMSEA of Models 2 to 4 were all greater than 0.08 (0.081, 0.082, and 0.088, respectively), and the GFI and CFI were both below 0.81, only reaching acceptable or unacceptable levels at the edges. The above comparison further confirms the superiority of the MAUT model proposed in this study in terms of fitting performance. The GFI value of Model 1 was closer to 1 compared to the other three models, indicating that Model 1 had a better fitting effect. The CFI value of Model 1 was closer to 1 compared to the other three models, indicating that Model 1 had a better fitting effect. This indicated that the MAUT model proposed by the research could accurately help decision-makers evaluate and compare suppliers under multiple objectives and standards, determine the best sustainable option, and had more significant performance advantages. To further validate the effectiveness of the model and quantify the accuracy of the estimation, chi square difference tests and Bootstrap confidence interval estimates were conducted between the models. The specific results are shown in Table 3.
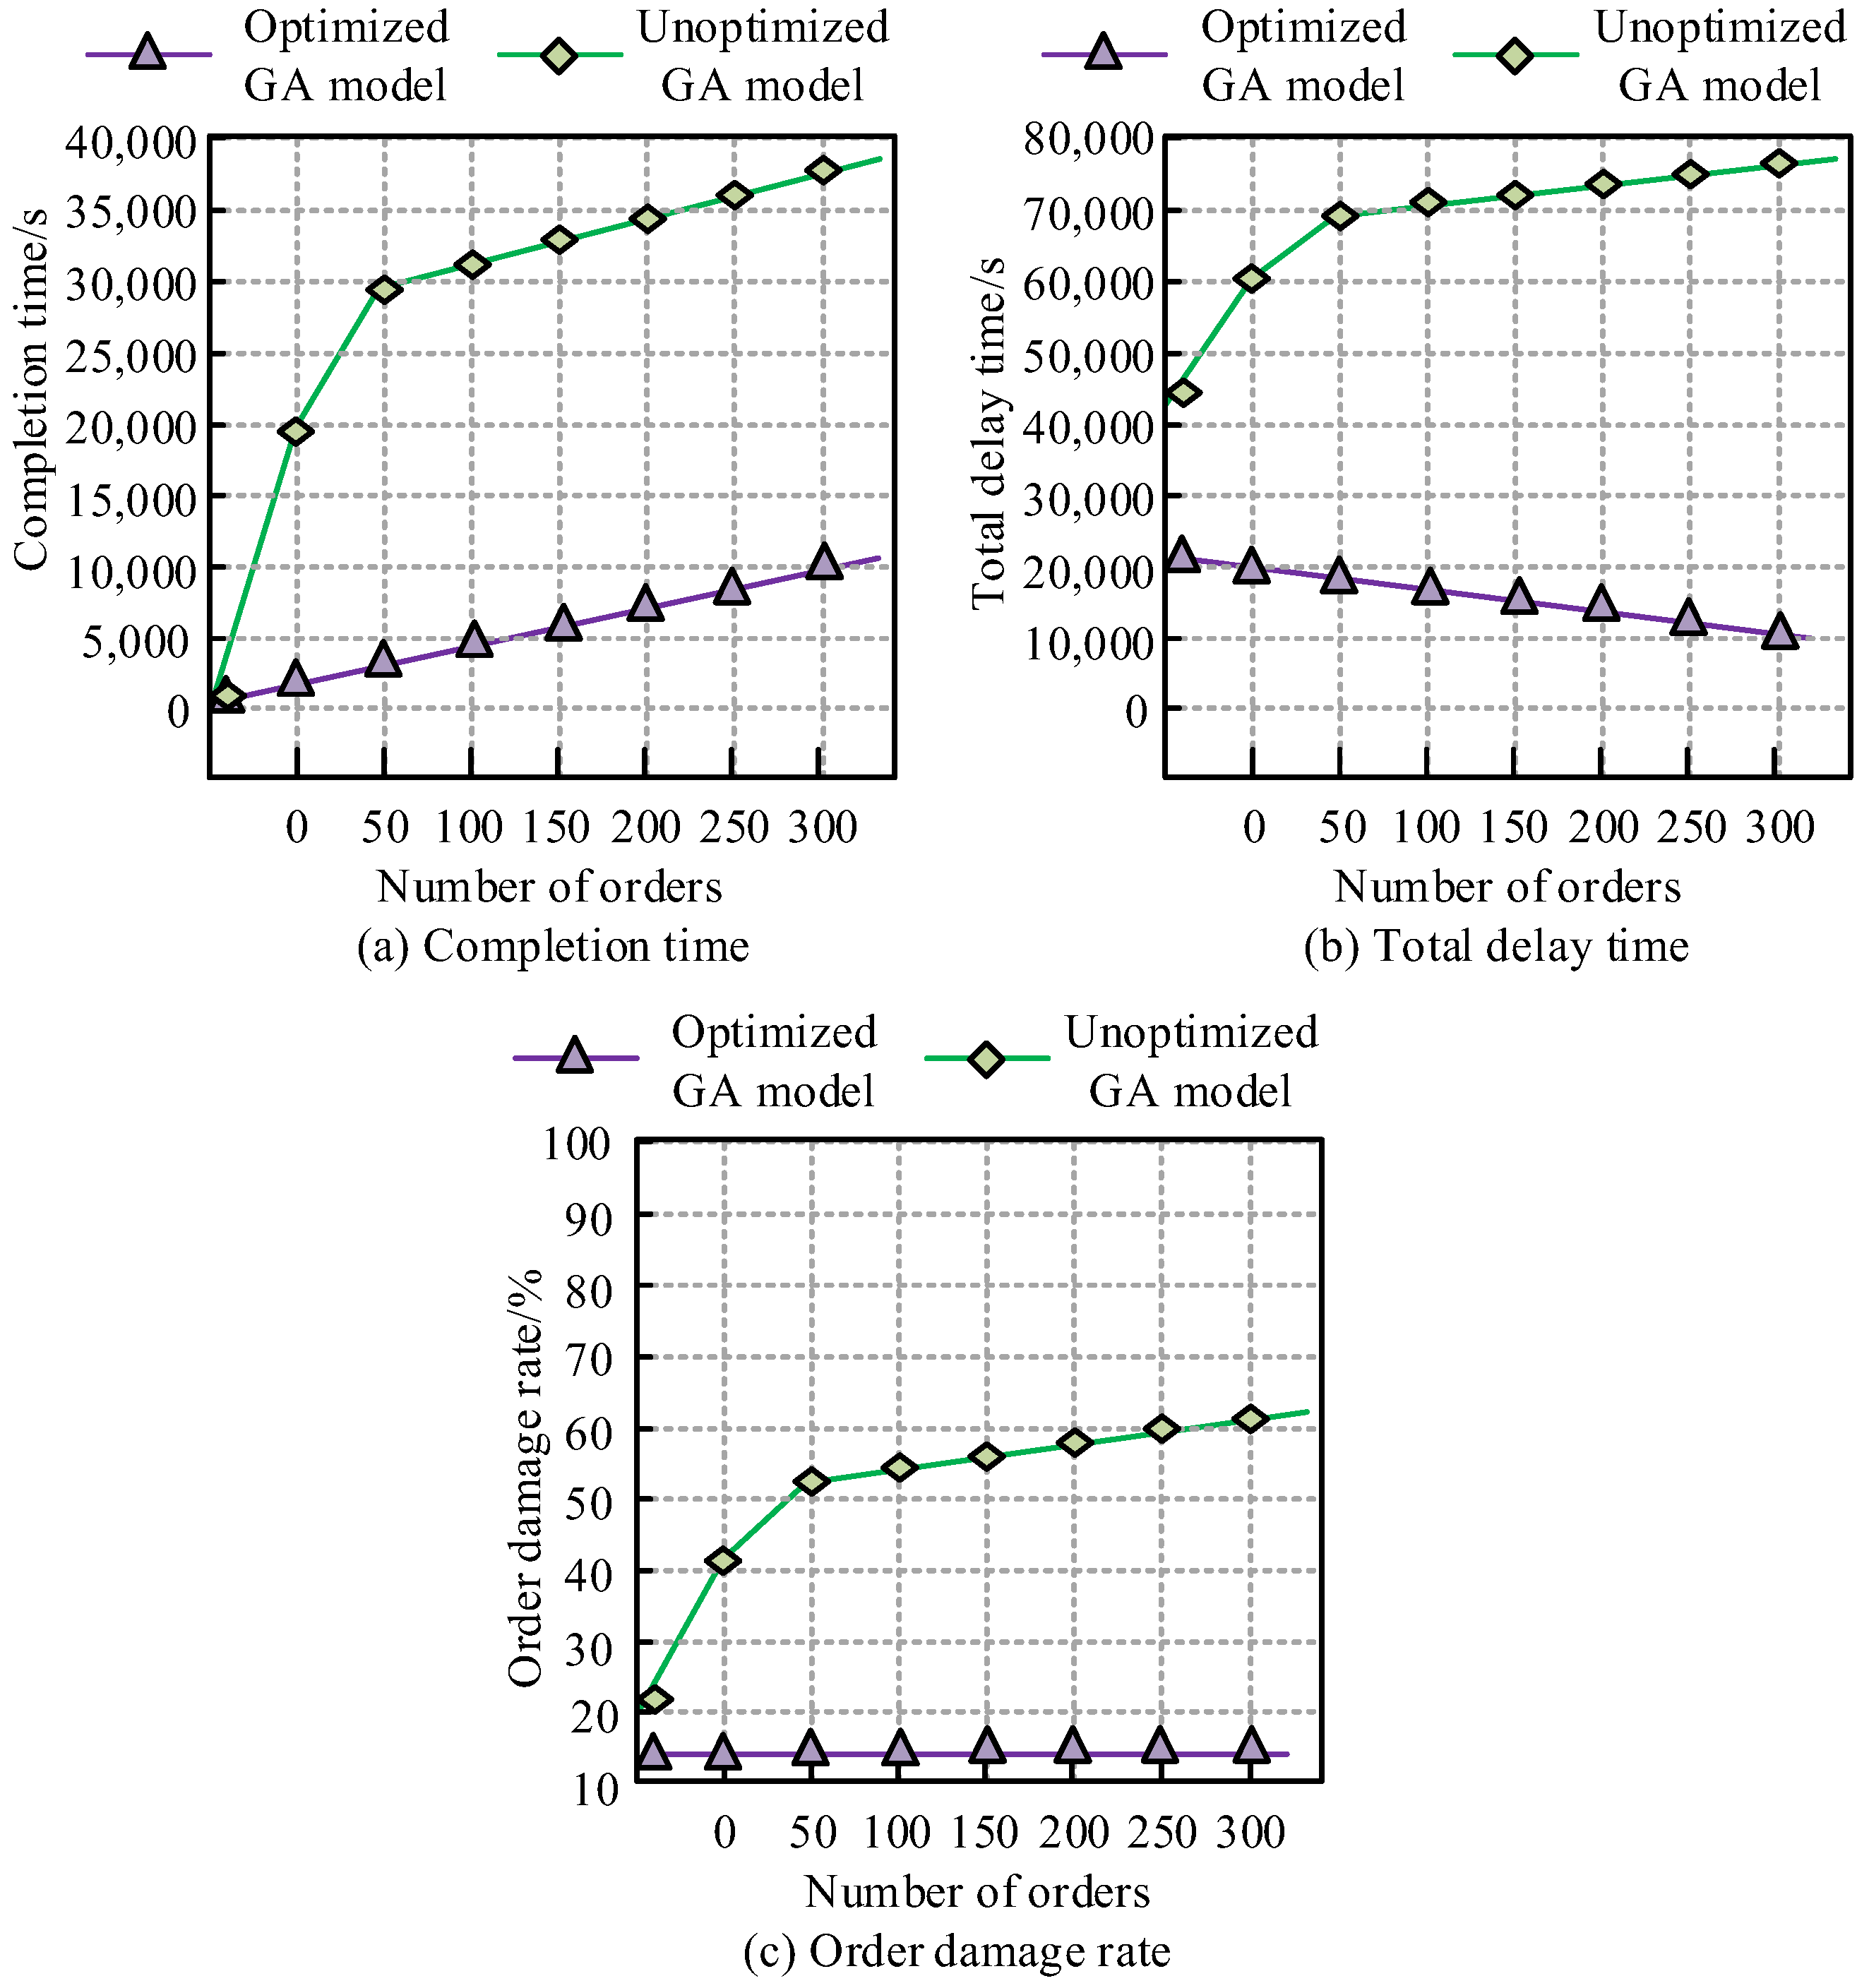
Table 3 summarizes the comparison results of nested models based on the complete MAUT model (Model 1), as well as the 95% confidence intervals obtained from 2000 repeated samplings of key parameters. All chi square differences were significant (p < 0.001), and the confidence intervals for each parameter did not include 0, indicating that Model 1 was significantly better than other simplified models, and the effects of each core influencing factor were statistically robust. Subsequently, the study conducted a performance analysis on the sustainable supplier order allocation model based on the optimized GA algorithm, comparing the performance of the allocation model before and after GA optimization. The results are shown in Figure 7.
In Figure 7a, the allocation model combined with the optimized GA had a more significant effect when the number of orders was smaller, and the time curve maintained a steady growth trend, with a maximum completion time of 10,025 s. The unoptimized GA model showed a significant increase in completion time as the number of orders increased, and the growth rate accelerated when the number of orders exceeded 100. From Figure 7b, the optimized GA allocation model also had a lower allocation delay time, demonstrating good control ability. The delay time showed a gentle downward trend, with the lowest delay time being 10,118 s. This indicated that the optimized GA model had significant advantages in reducing total delay time, which was crucial for improving customer satisfaction and market Reply speed. From Figure 7c, the optimized GA model maintained a low damage rate across all order quantities, and as the order quantity increased, the growth rate of the damage rate was much lower than that of the unoptimized model. This indicated that the optimized GA model could better ensure product quality, make reasonable use of supplier advantages, and bring economic benefits and competitive advantages to enterprises.
Sensitivity analysis was conducted to further investigate the actual impact of environmental factors (green production and practice, green low-carbon innovation) on supplier selection decisions. The specific operation was performed as follows: Float the weights of the above two environmental indicators up and down by ±10%, ±20%, and ±30% based on the original values, recalculate the MAUT comprehensive scores and rankings of 200 suppliers, and observe the changes in the top 10 suppliers in the ranking. The results showed that when the weight of green and low-carbon innovation decreased by 20%, the high environmental performance suppliers who were originally ranked third and sixth decreased to fifth and ninth, respectively, while suppliers with lower costs but moderate environmental performance increased in ranking. When the weight was increased by 20%, the previously ranked fifth and eighth suppliers rose to second and fourth, respectively. The sensitivity of green production to weight is relatively low (within ±30% of weight changes, ranking changes do not exceed two places). The above analysis indicates that green and low-carbon innovation is the most sensitive indicator of decision results among environmental factors, and its weight changes can significantly change the final ranking of suppliers, thereby directly affecting the supplier selection decision of enterprises. This discovery validates the actual influence of environmental factors in sustainable supplier selection and suggests that companies should carefully evaluate the priority of green innovation indicators when setting weights.

3.2. Actual Application Results

In order to further confirm the practical implementation effects of the proposed sustainable supplier distribution model and MAUT model based on the optimized genetic algorithm and ensure that the method can achieve the expected goals, an experimental analysis was conducted. The experiment selected a certain automobile manufacturing enterprise in Sichuan Province as the decision-making party, which needs to purchase tens of thousands of sets of copper lining components during periods of high manufacturing order volume. To achieve sustainable supply chain management, the company’s goal in selecting suppliers not only covers economic dimensions (minimizing procurement costs and maximizing total procurement value), but also integrates environmental dimensions (minimizing unit product carbon emissions and prioritizing suppliers with green production certification) and social dimensions (ensuring employee safety and health, complying with labor rights, and maintaining good stakeholder relationships). At the same time, operational efficiency indicators such as minimizing product damage rates and delayed delivery volumes are also taken into consideration to ensure synergistic optimization between economic, environmental, and social goals. At present, five relevant suppliers were contacted for cooperation, and the basic data of these five component suppliers are in Table 4.
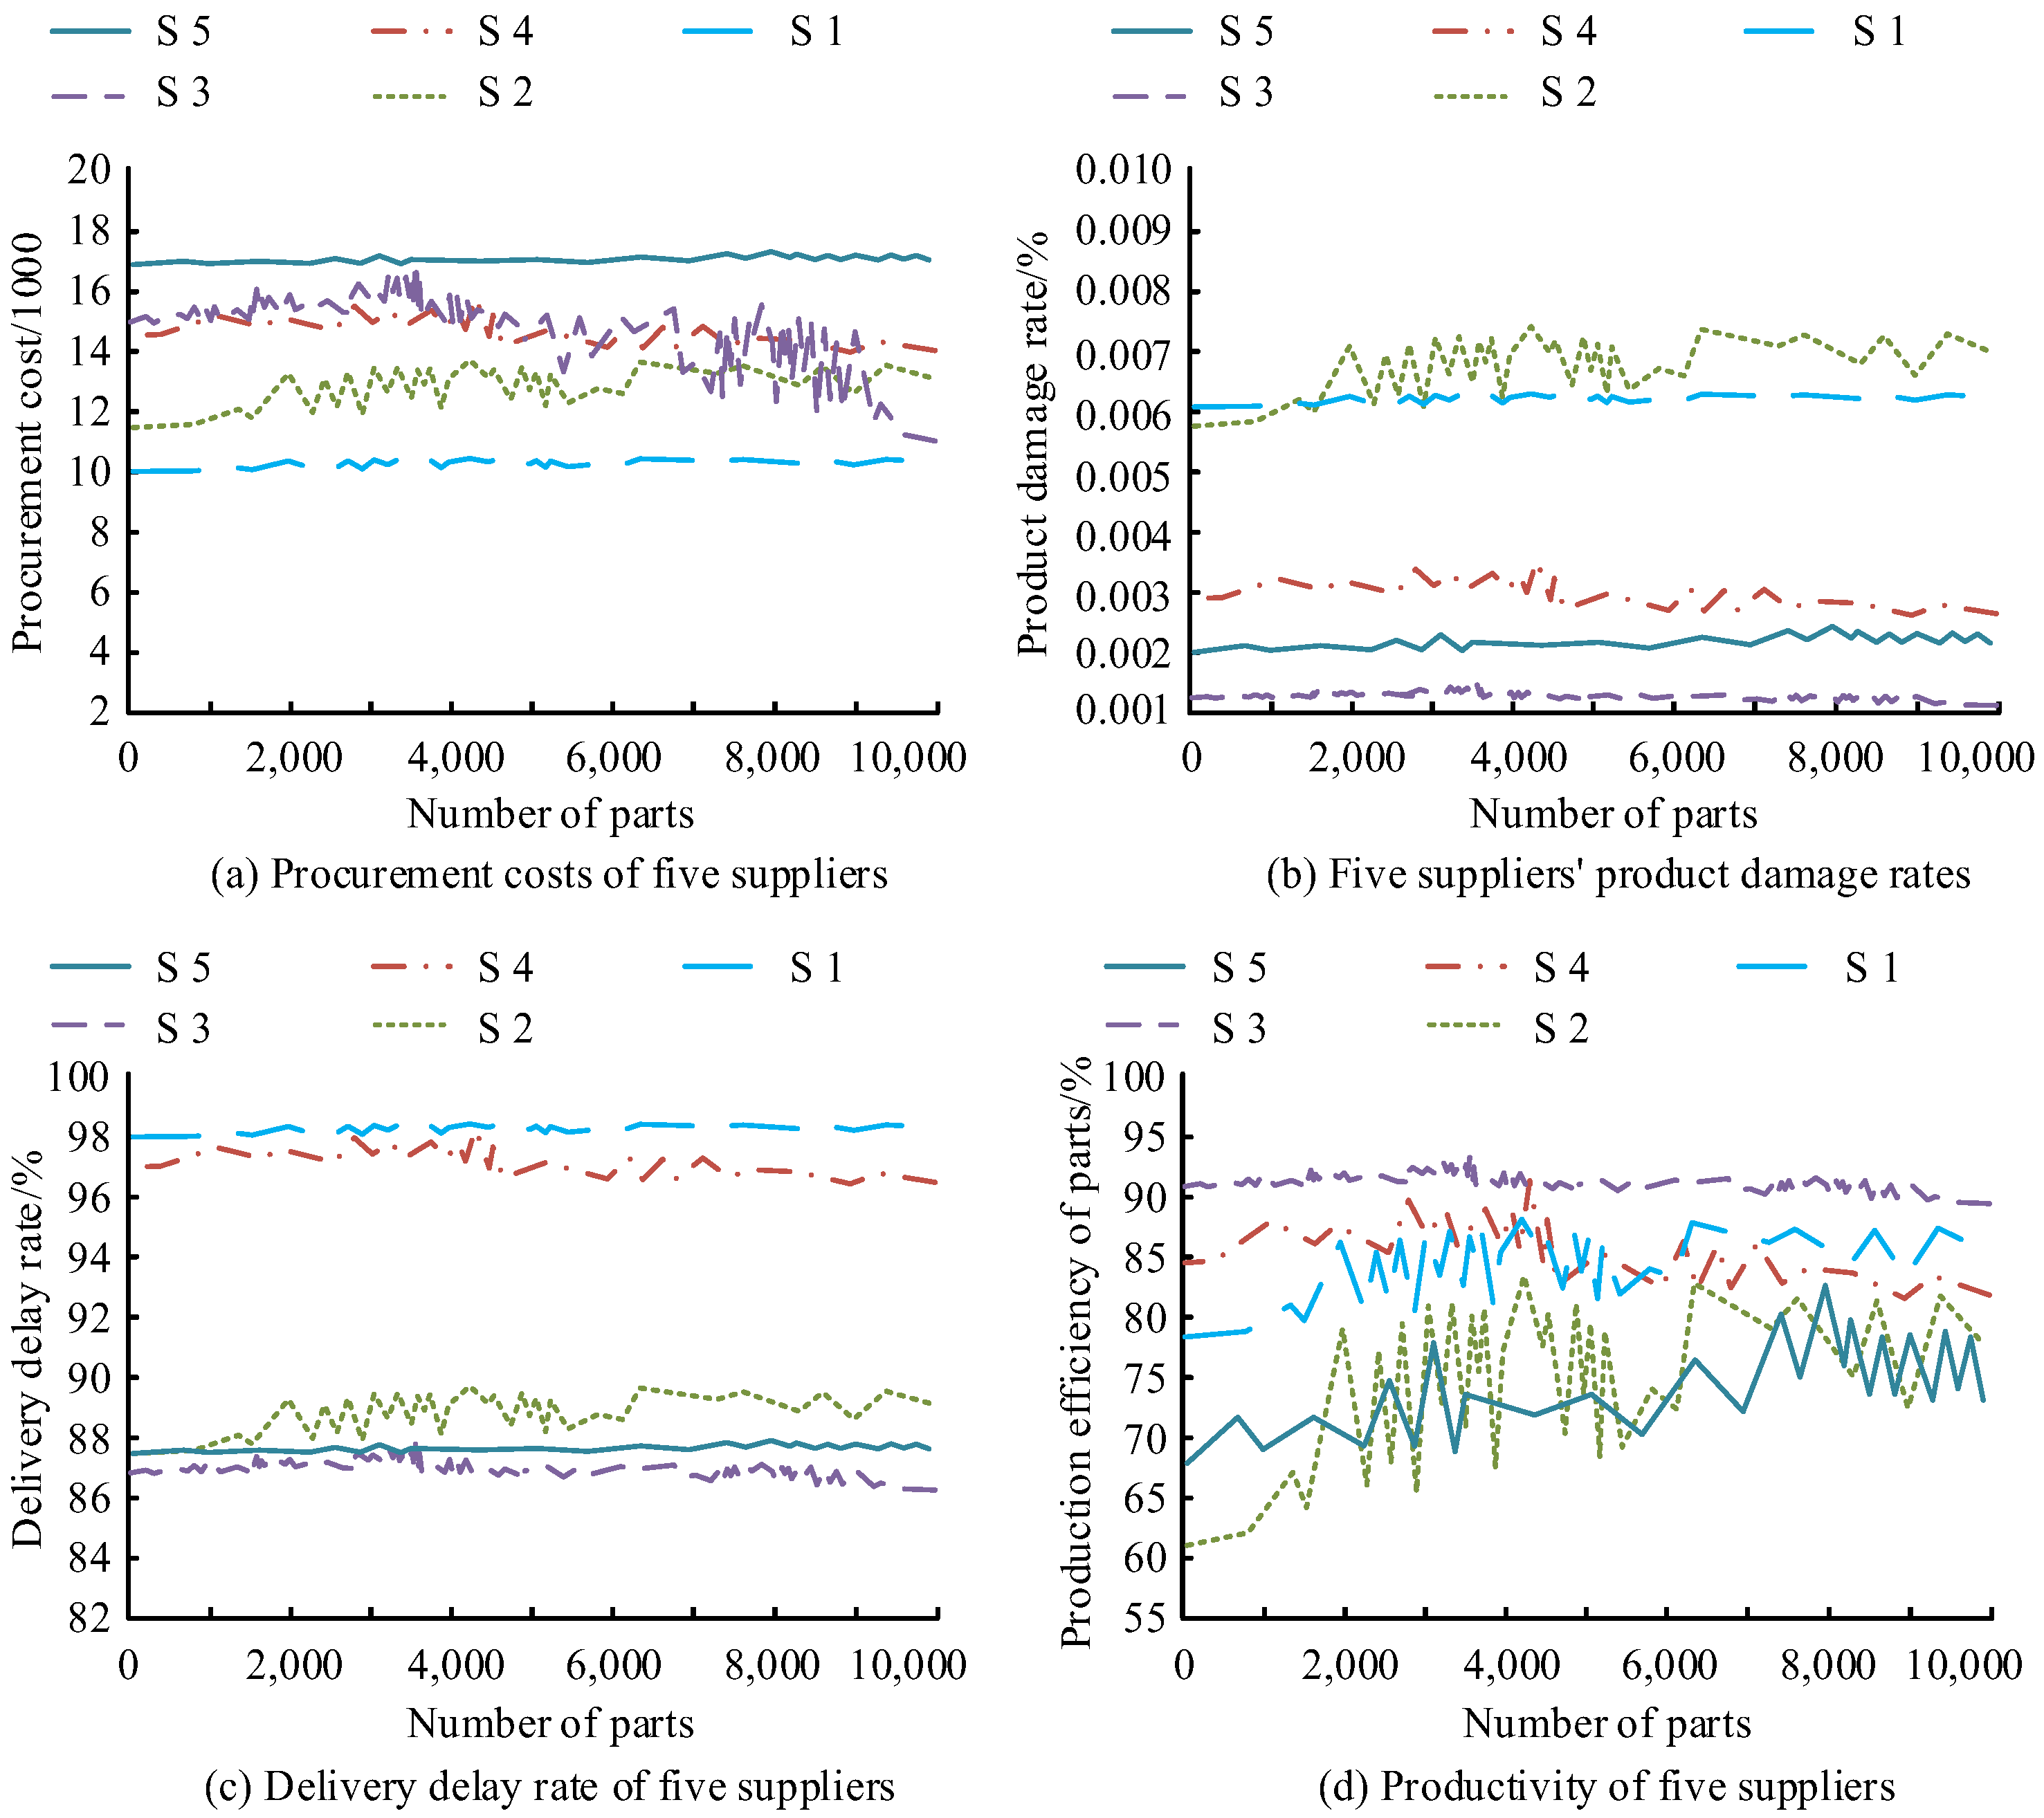
The experiment was based on the basic data of suppliers in Table 4, and the MAUT model was used to calculate the influencing factors for SSS. A decision condition analysis of five suppliers was conducted based on comprehensive economic, environmental, and social factors, mainly evaluating their parts procurement costs, product damage rates, delivery delay rates, and parts production efficiency. The analysis results are shown in Figure 8.
From Figure 8a, the initial procurement costs of Supplier 3 and Supplier 4 were lower, but as the number of parts required by the decision-maker increased, the costs decreased. From a sustainable perspective, Supplier 3 had a greater advantage, with costs as low as 100,000 yuan. In Figure 8b, the product damage rate of Supplier 3 was much lower than the other four suppliers and was not affected by the number of parts, with a damage rate maintained at around 0.001. In Figure 8c, the delivery delay rates of Supplier 1 and Supplier 3 were relatively low, and Supplier 3 maintained the lowest delay rate within the entire range of parts quantity, with a minimum delay rate of 85%. Supplier 3 showed the best performance in terms of on-time delivery, which maintained SC stability and promoted sustainable decision-making. In Figure 8d, Supplier 3 had the highest production efficiency, with values remaining between 90% and 93%. This indicated that the MAUT model proposed by the research could effectively evaluate various indicators comprehensively based on the real situation of suppliers and promote optimal selection in practical applications. Although Figure 8 shows quantitative indicators such as cost, damage rate, delay rate, and production efficiency, the reason why “safety and health” become the most important factor is that in the comprehensive score of the MAUT model, this indicator has the highest weight on the final supplier selection decision. Taking Supplier 3 as an example, its safety and health score is 92.3 points, much higher than Supplier 1’s 67.5 points and Supplier 5’s 71.2 points. Combining its low damage rate and high production efficiency, Supplier 3 ranks first in the weighted total score. This reflects the “threshold effect” of safety and health in comprehensive decision-making—even if the cost is low, if the safety and health standards are not met, the model will significantly reduce the first choice probability. Finally, the actual performance of the sustainable supplier delivery model based on optimized GA was verified through experiments, and the results are shown in Figure 9.
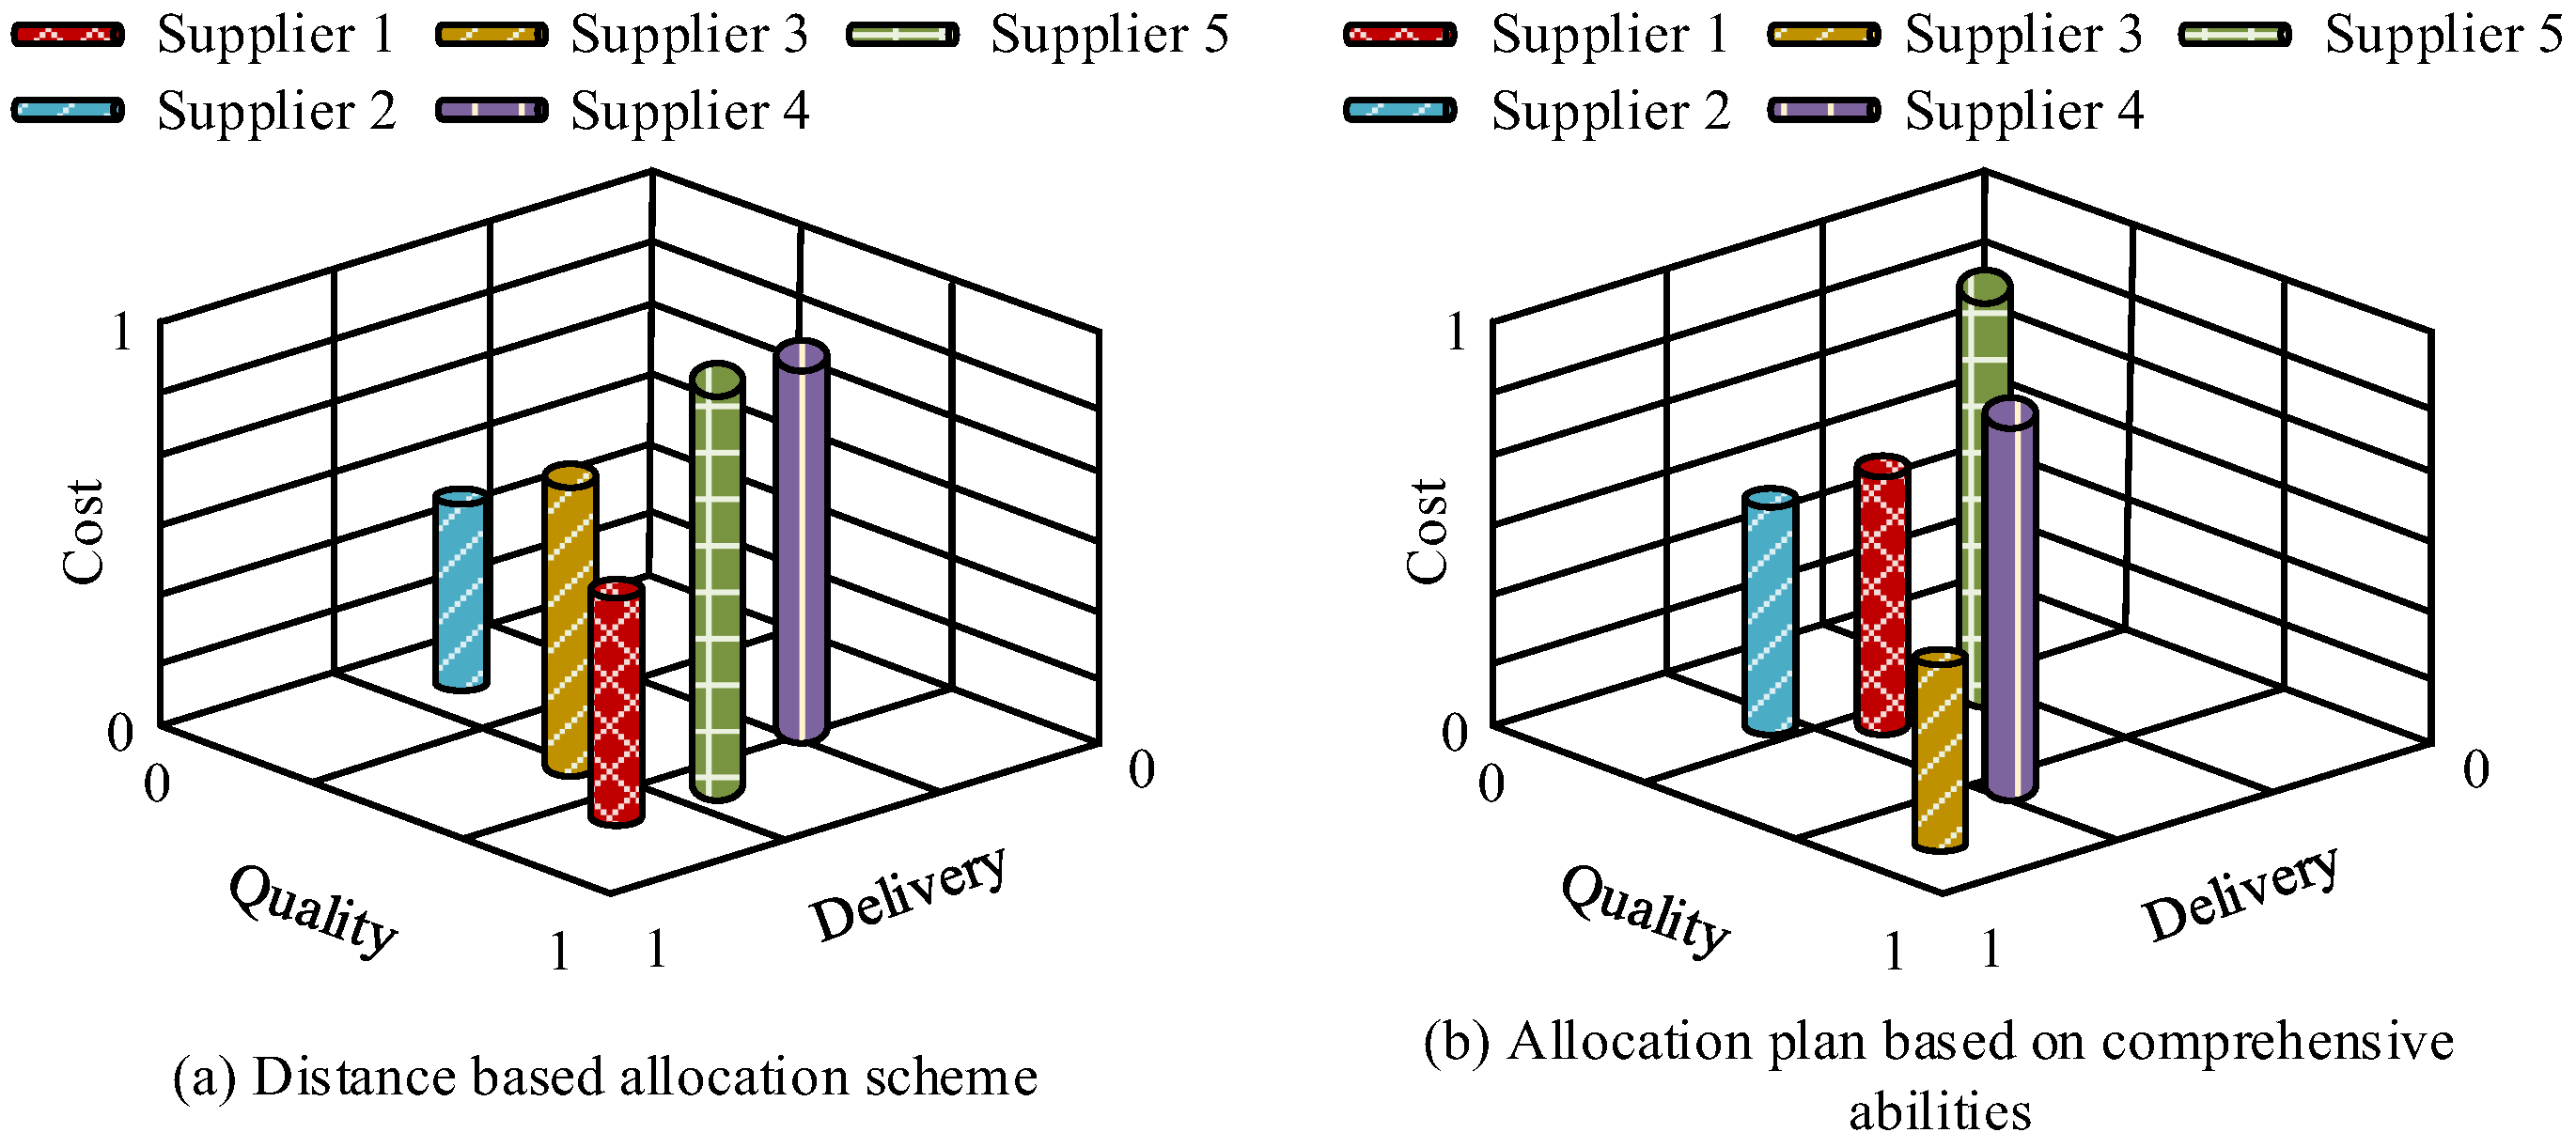
From Figure 9, the sustainable supplier distribution model based on the optimized GA constructed by the research conducted distribution simulations based on the actual situations of five suppliers and the results analyzed by the MAUT model. The simulation mainly considered the delivery distance and the comprehensive capabilities of each supplier. In Figure 9a, from the perspective of delivery distance, choosing Supplier 1 had more advantages, while Supplier 3 was second only to Supplier 1. From the perspective of the comprehensive capabilities of each supplier, it can be seen in Figure 9b that choosing Supplier 3 had more advantages. Supplier 3 had a lower total cost, high product quality, and outstanding delivery capabilities. Overall, Supplier 3 was more conducive to sustainable development and was the best choice for cooperative suppliers. This indicated that the sustainable supplier delivery model based on the optimized GA could help decision-makers choose the optimal delivery plan. In practical applications, it was adept at handling a large number of orders and complex SC management tasks and had high practical value and promotional significance.

4. Discussion

The research results show that technological level is the most significant positive factor affecting sustainable supplier selection (standardized path coefficient = 0.199, p < 0.001), while safety and health rank highest in the MAUT comprehensive weight. This result may be due to the following reasons: in the manufacturing supply chain, the level of technology directly determines the production efficiency, quality control capability, and green process improvement potential of suppliers, thereby affecting both economic and environmental performance. High-tech suppliers are often able to achieve lower carbon emissions and product damage rates at lower costs, making them a core focus for decision-makers. At the same time, safety and health have been given the highest weight, reflecting the tightening of labor rights regulations in recent years, the increasing pressure on corporate social responsibility, and the emphasis on workplace safety after the epidemic, making suppliers’ social sustainability performance a threshold indicator of “veto power”.
The proposed MAUT fuzzy TOPSIS adaptive GA collaborative model has three significant advantages compared to existing methods. Firstly, at the level of model structure, the nested design of MAUT and fuzzy TOPSIS addresses the inherent shortcomings of a single multi-attribute decision-making method. The MAUT excels at handling utility merging of different dimensional indicators but lacks robustness to fuzzy correlations between indicators. Fuzzy TOPSIS can effectively identify the boundaries of compensation effects between indicators by introducing positive and negative ideal solution distance measures. Secondly, at the level of improvement methods, the adaptive genetic algorithm dynamically adjusts the crossover probability and mutation probability, avoiding the problem of the standard GA easily getting stuck in local optima. Thirdly, in terms of technical significance, the model integrates supplier pre-evaluation (MAUT + TOPSIS) and order allocation (GA) into the same decision-making logic chain for the first time. The study achieved two-stage feedback coupling by using the comprehensive utility value of MAUT as the initial weight of the GA fitness function, thereby achieving Pareto optimality in the final order allocation scheme in three dimensions: economic benefits, environmental emissions, and social responsibility. This technological path provides a new computational paradigm for digital decision-making in sustainable supply chain management.
Compared with existing research, there are similarities and differences in the findings and conclusions of the study in the following aspects. In the field of MAUT applications, research by Umar et al., Nuroji et al., and Setiawansyah et al. has validated the effectiveness of the MAUT in multi-attribute decision-making. However, these studies only focus on single dimensional performance indicators (such as attendance, discipline, and teaching ability) and do not address the balance between environmental and social goals. In contrast, the study extended the MAUT to sustainable supply chain management scenarios for the first time, incorporating non-economic indicators such as carbon emissions, green production, safety, and health, and demonstrated that the MAUT can effectively address the utility integration problem of the economic environmental social triple bottom line. The results of this study further indicate that when the decision dimension is expanded from single objective to multi-objective, the weight sensitivity of the MAUT is higher than that of the simple weighting method, which is consistent with the conclusion of Rueda Benavides et al. that the MAUT is superior to the linear weighting method in multi-objective conflicts.

5. Conclusions

In the context of global sustainable development, enterprises face the challenge of balancing multiple economic, environmental, and social objectives in supplier selection and order allocation. This study proposes a collaborative decision-making model that integrates the MAUT, TOPSIS, and GA. Based on the Wind Industry Chain database and field data from 200 manufacturing suppliers, AHP expert scoring is used to determine weights, and the reliability of the model is verified through the chi square difference test and Bootstrap confidence interval. The research results suggest that technological level is the core driving factor affecting sustainable supplier selection, and its effect indirectly reduces carbon emissions by improving production efficiency and green innovation capabilities. Safety and health rank first in the comprehensive weight, indicating that social sustainability has become the main consideration in decision-making. The model shows in practical application cases that the recommended Supplier 3 performs the best in procurement cost, product damage rate, delayed delivery rate, and productivity. At the same time, its safety and health score is 92.3 points, fully achieving the synergy of economic, environmental, and social goals.
The study has the following limitations: firstly, the proportion of small- and medium-sized enterprises in the sample is relatively low, and suppliers in the informal economy were not included, which may affect the applicability of the model to small and micro-enterprises. Secondly, the determination of weights overly relies on subjective expert ratings. Although consistency tests have been conducted, individual cognitive biases cannot be completely eliminated. Thirdly, the low-carbon concept only uses carbon emissions as a single indicator and does not consider the full lifecycle assessment of a carbon footprint. Fourthly, corporate social responsibility (CSR) only covers a few dimensions such as safety and health and labor rights and does not address broader issues such as anti-corruption and community investment. Future research directions include expanding the sample size of small and micro-enterprises, developing semi-supervised or big-data-based objective weight estimation methods to reduce subjective bias, introducing a full lifecycle carbon assessment method and establishing a multi-level carbon emission accounting system, exploring the application of deep learning and reinforcement learning in supplier dynamic evaluation and adaptive order allocation, and further enhancing the real-time decision-making capability of the model.

Author Contributions

Conceptualization, J.Y.; methodology, J.Y.; validation, J.Y.; data curation, W.S.; writing—original draft preparation, J.Y.; writing—review and editing, W.S.; visualization, W.S. All authors have read and agreed to the published version of the manuscript.

Funding

This work was supported by the Philosophy and Social Science Foundation of Colleges and Universities in Jiangsu Province (NO:2022SJYB1021).

Institutional Review Board Statement

Not applicable.

Informed Consent Statement

Not applicable.

Data Availability Statement

All data has been submitted in the manuscript, and this article agrees to be publicly used.

Conflicts of Interest

The authors declare no conflicts of interest.

References

  1. Sadeghiravesh, M.H.; Khosravi, H.; Abolhasani, A. Selecting proper sites for underground dam construction using Multi-Attribute Utility Theory in arid and semi-arid regions. J. Mt. Sci. 2023, 20, 197–208. [Google Scholar] [CrossRef]
  2. Imam, A.I.; Suleiman, A. Development of a flexible pavement condition rating model using multi-attribute utility theory. Int. J. Pavement Res. Technol. 2023, 16, 1079–1100. [Google Scholar] [CrossRef]
  3. Widodo, W. Implementation of Multi-Attribute Utility Theory Method for Selecting Social Assistance Recipients. JEECS (J. Electr. Eng. Comput. Sci.) 2023, 8, 123–132. [Google Scholar] [CrossRef]
  4. Oktaria, I. Kombinasi Metode Multi-Attribute Utility Theory (MAUT) dan Rank Order Centroid (ROC) dalam Pemilihan Kegiatan Ekstrakulikuler. J. Ilm. Inform. Dan Ilmu Komput. (JIMA-Ilk.) 2023, 2, 1–11. [Google Scholar] [CrossRef]
  5. Farsi, M.; Hosahalli, D.; Manjunatha, B.R.; Gad, I.; Atlam, E.S.; Ahmed, A.; Ghoneim, O.A. Parallel genetic algorithms for optimizing the SARIMA model for better forecasting of the NCDC weather data. Alex. Eng. J. 2021, 60, 1299–1316. [Google Scholar] [CrossRef]
  6. Umar, R.; Sahara, D. Best Employee Decision Using Multi Attribute Utility Theory Method. J. RESTI (Rekayasa Sist. Dan Teknol. Inf.) 2022, 6, 945–951. [Google Scholar] [CrossRef]
  7. Nuroji, N. Penerapan Multi-Attribute Utility Theory (MAUT) Dalam Penentuan Pegawai Terbaik. J. Ilm. Inform. Dan Ilmu Komput. (JIMA-Ilk.) 2022, 1, 46–53. [Google Scholar] [CrossRef]
  8. Saputra, W.; Wardana, S.A.; Wahyuda, H.; Megawaty, D.A. Penerapan Kombinasi Metode Multi-Attribute Utility Theory (MAUT) dan Rank Sum Dalam Pemilihan Siswa Terbaik. J. Inf. Technol. Softw. Eng. Comput. Sci. 2024, 2, 12–21. [Google Scholar] [CrossRef]
  9. Rueda-Benavides, J.; Khalafalla, M.; Miller, M.; Gransberg, D. Cross-asset prioritization model for transportation projects using multi-attribute utility theory: A case study. Int. J. Constr. Manag. 2023, 23, 2746–2755. [Google Scholar] [CrossRef]
  10. Setiawansyah, S.; Sulistiyawati, A. Penerapan Metode Logarithmic Percentage Change-Driven Objective Weighting dan Multi-Attribute Utility Theory dalam Penerimaan Guru Bahasa Inggris. J. Artif. Intell. Technol. Inf. 2024, 2, 62–75. [Google Scholar] [CrossRef]
  11. Ehtesham Rasi, R.; Sohanian, M. A multi-objective optimization model for sustainable supply chain network with using genetic algorithm. J. Model. Manag. 2021, 16, 714–727. [Google Scholar] [CrossRef]
  12. Li, Z.; Yu, X.; Qiu, J.; Gao, H. Cell division genetic algorithm for component allocation optimization in multifunctional placers. IEEE Trans. Ind. Inform. 2021, 18, 559–570. [Google Scholar] [CrossRef]
  13. Wei, W.; Yang, R.; Gu, H.; Zhao, W.; Chen, C.; Wan, S. Multi-objective optimization for resource allocation in vehicular cloud computing networks. IEEE Trans. Intell. Transp. Syst. 2021, 23, 25536–25545. [Google Scholar] [CrossRef]
  14. Fang, T.; Yuan, F.; Ao, L.; Chen, J. Joint task offloading, D2D pairing, and resource allocation in device-enhanced MEC: A potential game approach. IEEE Internet Things J. 2021, 9, 3226–3237. [Google Scholar] [CrossRef]
  15. Gad, A.F. Pygad: An intuitive genetic algorithm python library. Multimed. Tools Appl. 2024, 83, 58029–58042. [Google Scholar] [CrossRef]
  16. Narkhede, G. Strategic supplier selection and order allocation for sustainable development of small and medium-sized enterprises: Insights from a case study. J. Glob. Oper. Strateg. Sourc. 2025, 18, 518–547. [Google Scholar] [CrossRef]
  17. Sharma, M.; Joshi, S. Digital supplier selection reinforcing supply chain quality management systems to enhance firms performance. TQM J. 2023, 35, 102–130. [Google Scholar] [CrossRef]
  18. Mahmoudi, A.; Javed, S.A.; Mardani, A. Gresilient supplier selection through fuzzy ordinal priority approach: Decision-making in post-COVID era. Oper. Manag. Res. 2022, 15, 208–232. [Google Scholar] [CrossRef]
  19. Praneetpholkrang, P.; Kanjanawattana, S. A multi-objective optimization model for shelter location-allocation in Reply to humanitarian relief logistics. Asian J. Shipp. Logist. 2021, 37, 149–156. [Google Scholar] [CrossRef]
  20. Pamucar, D.; Torkayesh, A.E.; Biswas, S. Supplier selection in healthcare supply chain management during the COVID-19 pandemic: A novel fuzzy rough decision-making approach. Ann. Oper. Res. 2023, 328, 977–1019. [Google Scholar] [CrossRef] [PubMed]
Figure 1. SSS standard framework.
Sustainability 18 05000 g001
Figure 2. Illustrative drawing of the calculation process of the MAUT model.
Sustainability 18 05000 g002
Figure 3. The SSS problem optimized by the MAUT model mainly considers the indicators shown.
Sustainability 18 05000 g003
Figure 4. Illustrative drawing of the operation principle of the TOPSIS method.
Sustainability 18 05000 g004
Figure 5. Schematic diagram of optimizing the sequence combination of adaptive GA genes.
Sustainability 18 05000 g005
Figure 6. Illustrative drawing of the operation process of the SSSOA model for sustainable supplier orders combined with optimized GA.
Sustainability 18 05000 g006
Figure 7. Performance comparison of sustainable supplier order allocation models before and after GA optimization.
Sustainability 18 05000 g007
Figure 8. Analysis of favorable factors for sustainable selection of 5 suppliers using MAUT model.
Sustainability 18 05000 g008
Figure 9. Actual application effect of sustainable supplier distribution model based on optimized GA.
Sustainability 18 05000 g009
Table 1. Environment and parameter settings used in the experiment.
Device NameConfiguration Name
Development toolQt Creator
Development languagePython 3.7.4
Operating systemI5-12400F processor
Memory64 G
Hard disk1 TB
CPUIntel (R) CoreTM i5-9600k
System platformWin 10
Population size200
Maximum number of iterations500
Intersection probability (initial)0.9
Cross probability (final)0.6
Mutation probability (initial)0.01
Mutation probability (final)0.05
Table 2. The effectiveness of four models in the SSS of the processor.
/Comparison ItemsM 1M 2M 3M 4Significance Level
Standard path coefficient estimation Cost 0.042 0.032 0.037 /0.128
Technical level 0.199 0.188 0.205 0.264 0.001
Supplier supply quality 0.037 0.033 //0.023
Green production and practice 0.215 0.210 0.164 0.202 0.002
Green and low-carbon innovation 0.309 0.309 0.227 0.206 0.002
Safety and health 0.098 ///0.015
Stakeholder relations 0.128 0.107 0.101 0.099 0.032
Social feedback 0.073 0.021 0.062 0.011 0.006
RMSEA (root mean square error of approximation) 0.047 0.081 0.082 0.088 /
GFI (goodness of fit index)0.812 0.706 0.614 0.532 /
CFI (comparative fit index) 0.886 0.807 0.805 0.793 /
Table 3. Chi square difference test between models and confidence intervals for key parameters.
Comparison ItemStatistics/ParametersValue95% Confidence Intervalp
Chi square difference test between models (based on Model 1)
Model 1 vs. Model 2Δχ2 (Δdf = 3)34.27/<0.001
Model 1 vs. Model 3Δχ2 (Δdf = 5)51.86/<0.001
Model 1 vs. Model 4Δχ2 (Δdf = 7)78.15/<0.001
Standardized path coefficients for key parameters (Bootstrap 2000 times)////
technical levelcoefficient0.199[0.165, 0.234]<0.001
Green and low-carbon innovationcoefficient0.309[0.278, 0.341]<0.001
Safety and healthcoefficient0.098[0.072, 0.125]<0.001
Table 4. Basic data of 5 component suppliers.
/Product Unit PriceOrdering CostProduct Non Conformance RateTechnical Production CapacityDelivery Punctuality Rate
Supplier 1 15 1000 0.006 5560 0.98
Supplier 2 8 1250 0.007 7000 0.88
Supplier 3 12 1500 0.001 8500 0.98
Supplier 4 11 1460 0.003 9000 0.91
Supplier 5 9 1700 0.002 8500 0.85
Disclaimer/Publisher’s Note: The statements, opinions and data contained in all publications are solely those of the individual author(s) and contributor(s) and not of MDPI and/or the editor(s). MDPI and/or the editor(s) disclaim responsibility for any injury to people or property resulting from any ideas, methods, instructions or products referred to in the content.