Article

Network Positions in Venture Capital Co-Shareholder Networks and Corporate Green Technology Innovation: Evidence from China’s STAR and ChiNext Markets

1
School of Economics and Finance, Hohai University, Changzhou 213200, China
2
School of Business, Hohai University, Changzhou 213200, China
3
Bank of Nanjing Co., Ltd., Nanjing 211000, China
*
Author to whom correspondence should be addressed.
Sustainability 2026, 18(10), 4992; https://doi.org/10.3390/su18104992
Submission received: 16 April 2026 / Revised: 8 May 2026 / Accepted: 13 May 2026 / Published: 15 May 2026

Abstract

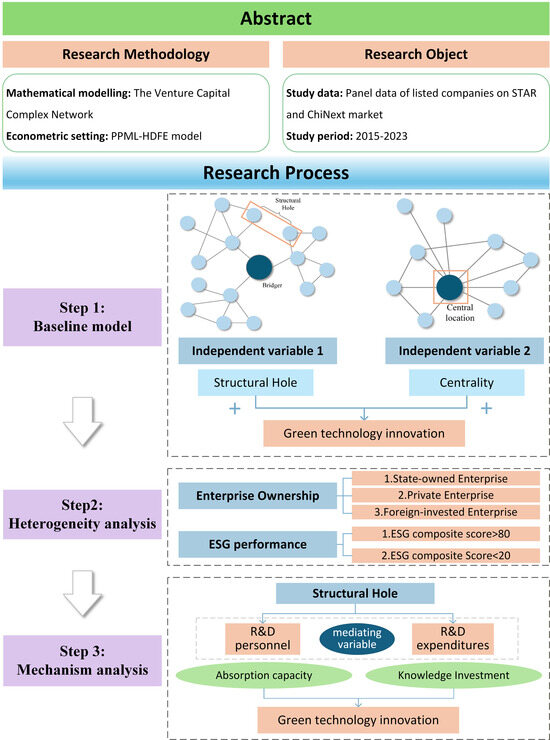
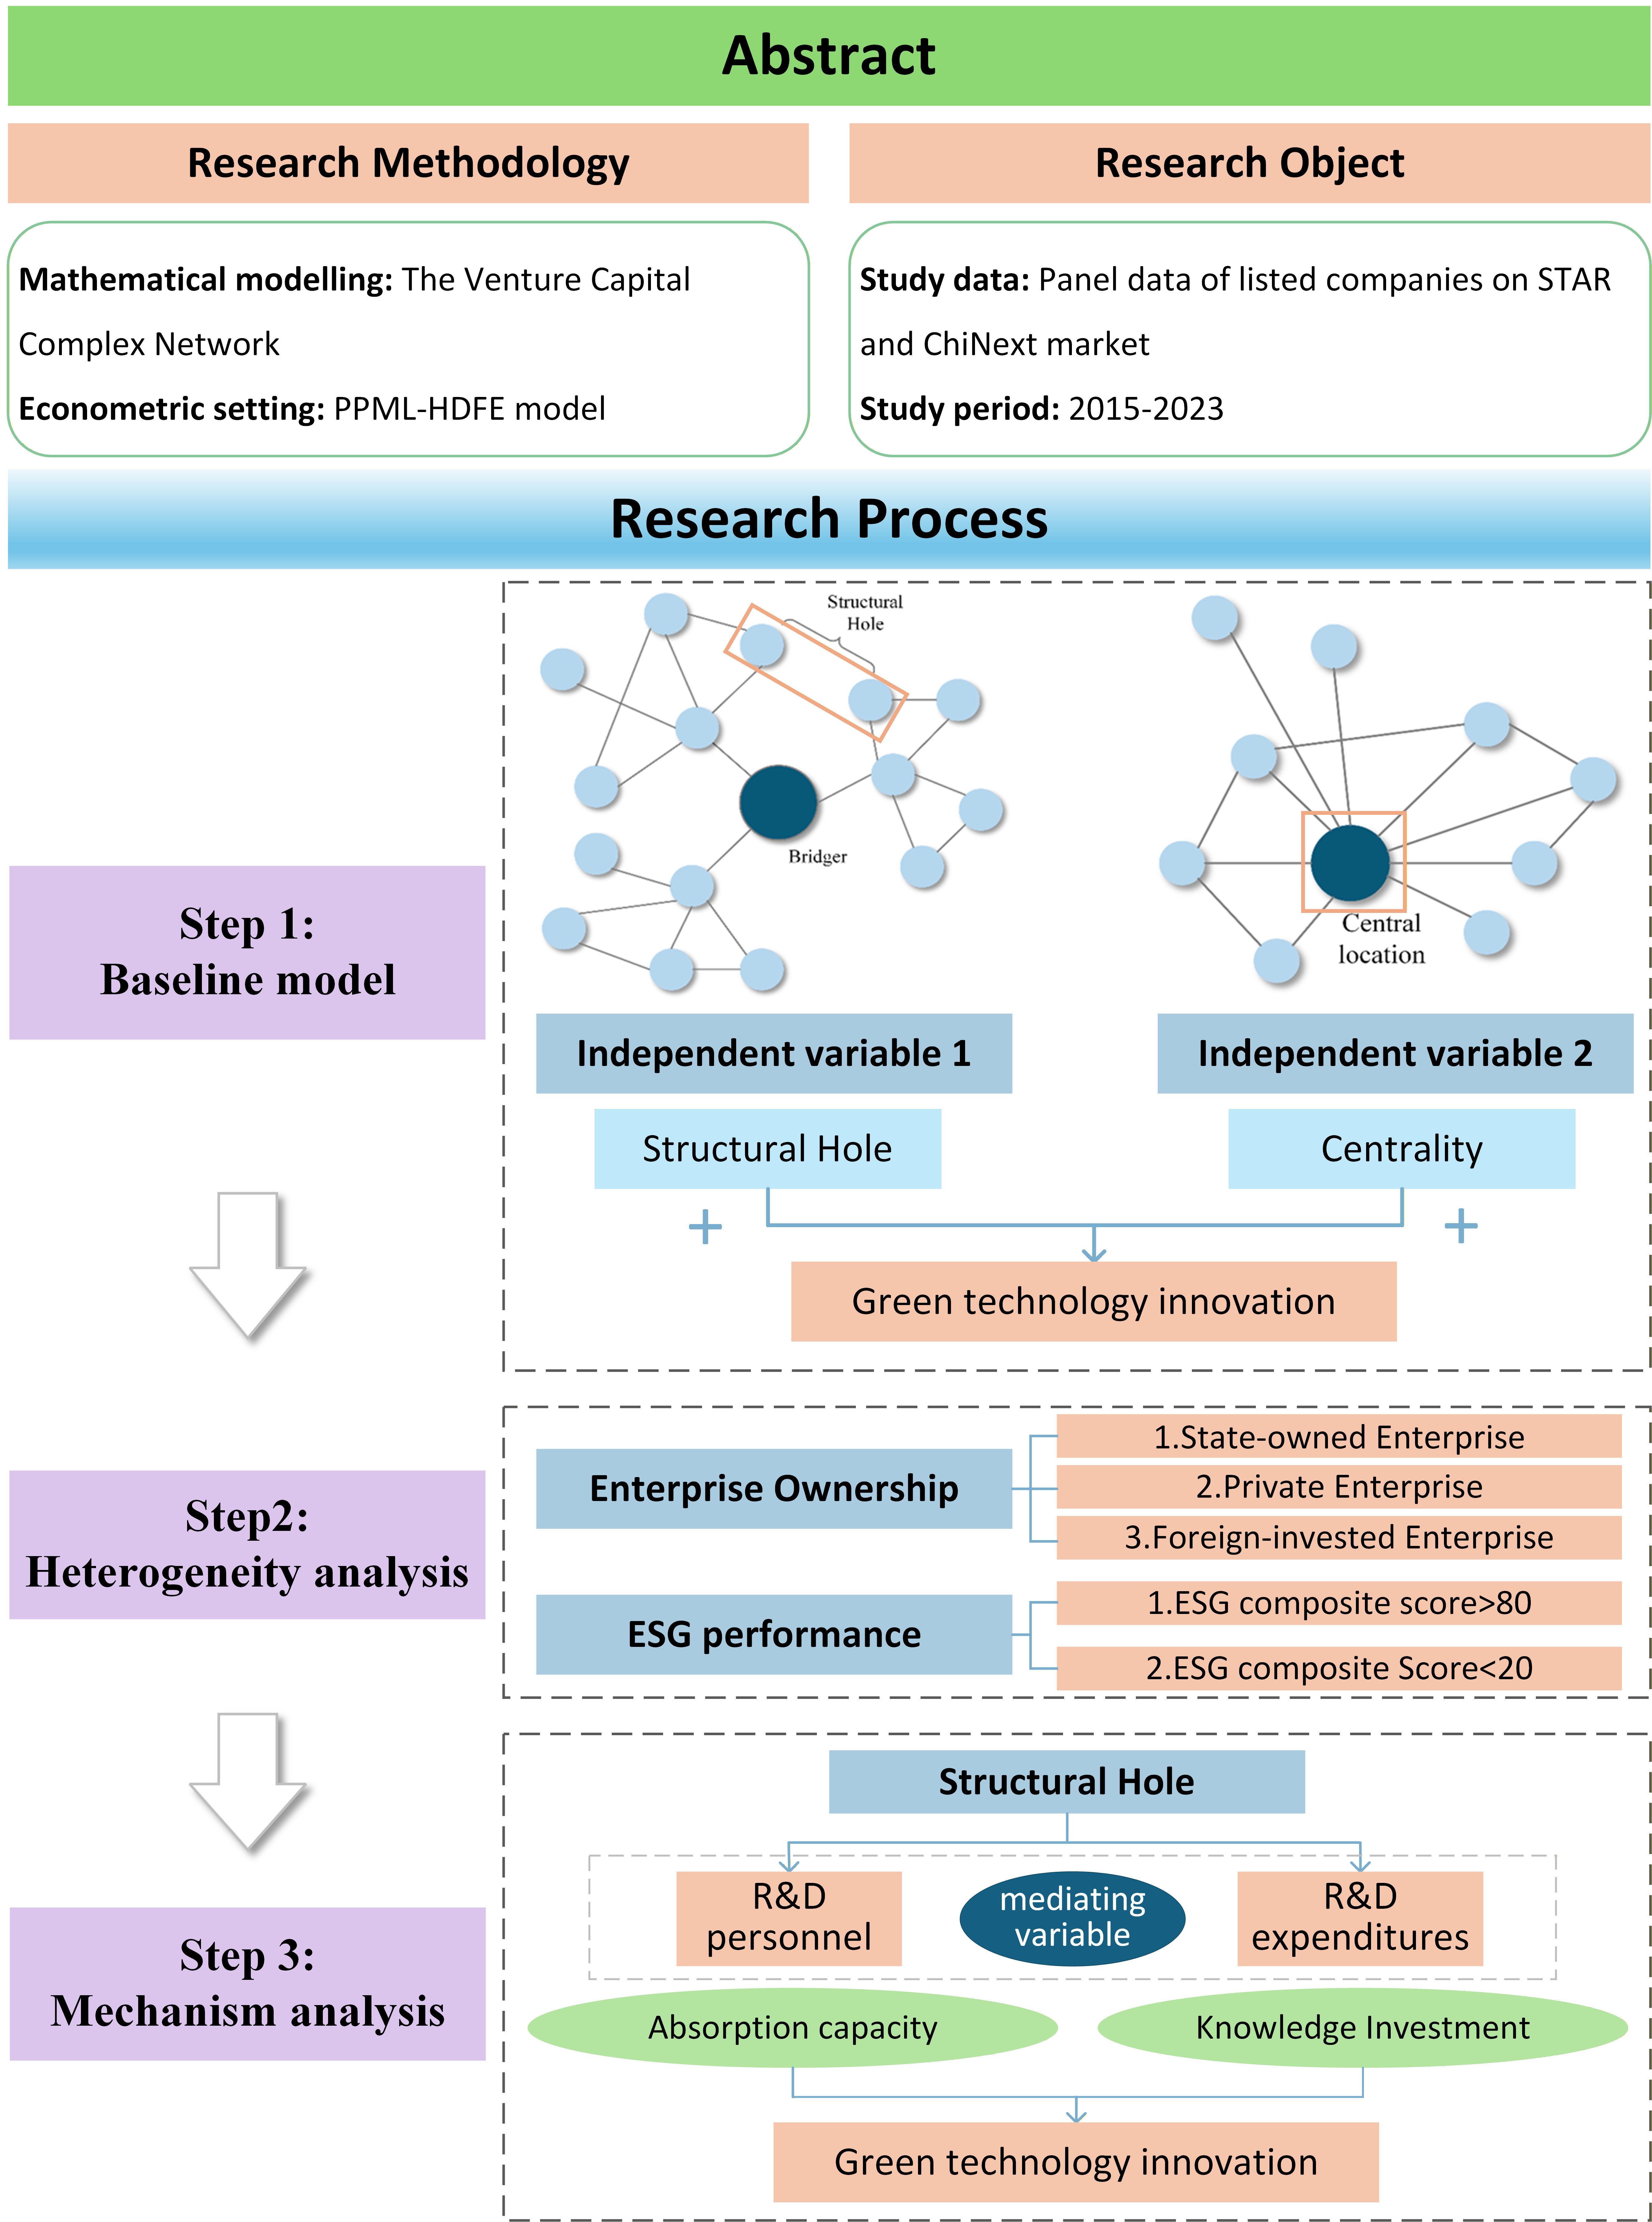
Given the urgent need for corporate green transformation in the context of global climate governance, the sustainable development goals, and China’s dual carbon goals, this study examines the spillover effects of venture capital networks formed through common shareholder ties on green technology innovation from a complex network perspective. Based on regression analysis of panel data from Chinese A-share STAR and ChiNext Market listed companies between 2015 and 2023, we find the following: (1) Within venture capital networks, enterprises with higher centrality and structural hole positions exhibit more significant green technology innovation performance. (2) This facilitation effect varies across firm types. Private enterprises, foreign-invested enterprises and enterprises with weaker ESG performance rely more heavily on network advantage for innovation. (3) The mechanism analysis shows that occupying advantageous positions in venture capital networks enables firms to increase R&D personnel and R&D expenditure, thereby strengthening their ability to absorb external knowledge and transform innovation resources, which further enhances green technology innovation output.

Graphical Abstract

1. Introduction

The climate crisis stands as one of the most severe and urgent global challenges of our time [1]. The Paris Agreement explicitly aims to limit global warming to 1.5–2 °C above pre-industrial levels, requiring nations to fulfill stricter carbon emission reduction commitments and action plans. As the world’s largest carbon emitter, China has shown unwavering determination in addressing climate change. The goals of “carbon peaking” and “carbon neutrality” not only demonstrate the responsibility of a major power but also inject powerful momentum into global climate governance [2]. Against this backdrop, research on green finance holds significant importance. By directing capital flows toward low-carbon sectors, green finance has become a crucial link in promoting sustainable development and achieving the dual carbon strategic objectives [3].
As pressure to reduce carbon emissions continues to mount, companies are generally facing stricter requirements for green transformation. Green technology innovation (GI) is widely recognized as a key pathway for enterprises to achieve green transformation and sustainable development [4]. Green technology innovation refers to an innovative model that reduces environmental emissions and energy consumption [5], with its core objective being to achieve sustainable development through means such as improving resource utilization efficiency. As the primary agents of green technology innovation, enterprises must act as the driving force behind green transformation and sustainable development [6]. For Chinese enterprises, this pressure has become even more pronounced against the backdrop of the continued advancement of China’s “dual carbon” goals and green finance policies. However, despite the growing importance of globalization, Chinese enterprises exhibit relatively poor green technology innovation performance [7] and face multiple challenges, including insufficient funding and significant technical difficulties. Furthermore, green technology projects feature extended development cycles, requiring substantial time for R&D and testing before market entry, characterized by high initial investments and long payback periods [8]. Some enterprises may resort to greenwashing to meet environmental compliance requirements when faced with the dual pressure of transformation demands and green technology innovation challenges. This could result in financial risks and other adverse consequences.
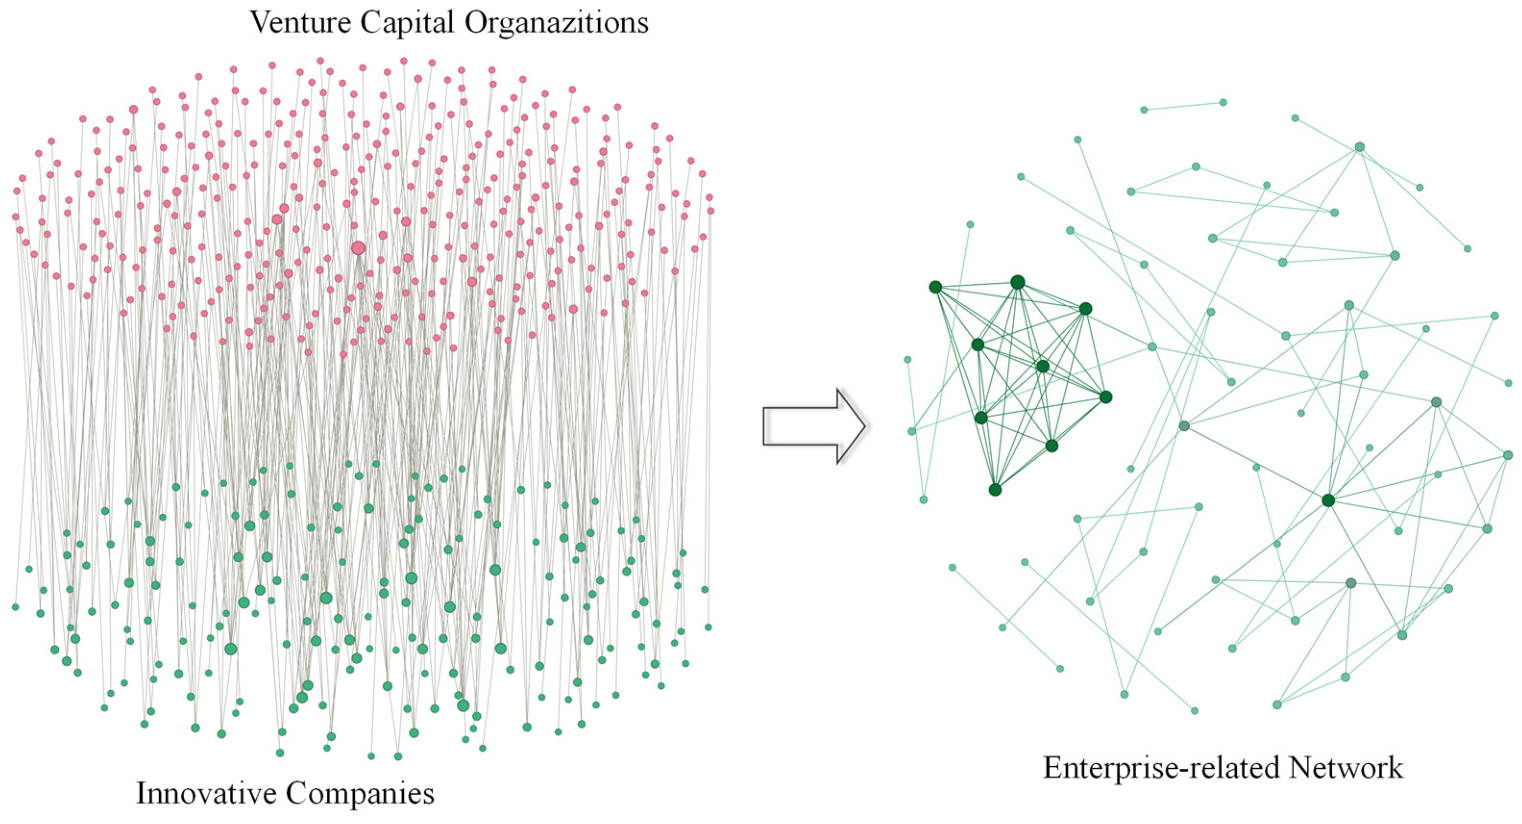
Therefore, under the combined effects of green transition pressure and financing constraints, firms increasingly need external resources and organizational support to continuously advance green technology innovation activities and transform them into commercially viable innovation outcomes. As patient capital, venture capital is such an essential external support mechanism, providing not only funding but also value-added services like strategic planning, resource integration, and management empowerment. To better illustrate the role of venture capital and the interactions among multiple actors in the process of firm growth and innovation, Figure 1 presents a conceptual overview of this mechanism. In emerging fields such as green technology, venture capital firms leverage their specialized expertise and resource networks to significantly influence corporate innovation pathways [9]. Compared to companies without venture capital backing, those receiving such support demonstrate superior performance in patent applications and R&D efficiency [10]. However, in recent years, slowing macroeconomic growth has often led to declining valuations for startups and growth-stage companies. This trend has heightened investor risk aversion, resulting in an overall contraction of venture capital activity.
An undeniable fact is that many innovative enterprises in their growth phase are highly dependent on external capital. Venture capital is almost the critical lifeline sustaining their survival and growth [11]. Against the backdrop of a tightening venture capital market, these companies must exhibit better innovation performance and commercialization potential to attract sustained attention and capital injections, creating a complex virtuous cycle. On one hand, companies increase investments in green technology innovation to meet climate change and green transition demands, yet these investments often have long payback periods, making it imperative to attract venture capital through superior innovation performance. On the other hand, venture capital involvement not only provides financial support but also leverages its resource networks and expertise to help companies improve innovation efficiency, ultimately yielding better innovation outcomes. This virtuous cycle should be a shared goal for both venture capitalists and companies.
Therefore, this study aims to effectively promote the capital market’s enhancement of green technology innovation and provide a new research perspective for understanding the micro-level mechanisms through which venture capital supports corporate green transitions and the development of a green economy. The main contributions of this study are as follows. First, this study uses complex network analysis to construct a corporate interlocking network based on shared venture capital shareholder ties. This approach addresses a gap in traditional research on green technology innovation, which has paid limited attention to interfirm network relationships. Second, based on network centrality and structural hole theory, this study employs a Poisson pseudo-maximum likelihood model with high-dimensional fixed effects (PPML-HDFE). It systematically examines how firms’ structural positions in the venture capital network affect green technology innovation. It also analyzes how firms obtain external information resources through their positions in the network during the innovation process. In doing so, this study highlights the important role of external capital in promoting green technology innovation. Third, this study uses subgroup regression and mediation effect models to further examine the impact of venture capital networks on green technology innovation. The analysis is extended from two perspectives: heterogeneity and underlying mechanisms. On the one hand, this study examines whether the effects of venture capital networks differ across firms with different ownership structures and ESG performance. This helps address the limited attention given to firm heterogeneity in previous studies. On the other hand, R&D personnel and R&D expenditure are introduced as mediating variables. This allows the study to reveal the internal mechanism through which firms’ positions in the venture capital network influence green technology innovation from the perspectives of absorptive capacity and knowledge input.

2. Literature Review

In the venture capital decision-making process, investors’ judgments are often influenced by multiple factors. Venture capital firms typically focus on evaluating an enterprise’s team capabilities, business model, technology, and market prospects [12]. Whether a company can overcome existing technological bottlenecks and continuously drive technological innovation serves as a crucial basis for venture capitalists to evaluate its growth potential and future investment returns [13]. In recent years, as global climate governance and sustainable development have emerged as core issues, green technology innovation has garnered widespread attention. The increasing frequency of climate disasters and their severe impacts on socioeconomic development have subjected enterprises to greater policy and environmental pressures, creating an urgent need to advance the innovation and development of green technologies [14]. Enterprises engaging in green technology innovation can not only reduce energy consumption and carbon emissions but also create competitive advantages by enhancing resource utilization efficiency [15], leading to a win-win outcome for both economic and environmental benefits. At the practical level, green technology innovation is now regarded as a crucial means for enterprises to fulfill environmental responsibilities and respond to carbon neutrality strategies. Consequently, enterprises that achieve significant accomplishments in green technology innovation can effectively convey strong growth signals to venture capitalists, which in turn enhances their ability to attract investment.
Research indicates that corporate green technology innovation is influenced by multiple complex factors [16]. A firm’s technological capabilities, organizational structure, and management characteristics are key determinants of innovation success [17]. Management’s sense of social responsibility, innovative spirit, and risk-taking propensity significantly drive green technology innovation by affecting corporate strategic decisions and resource allocation patterns [18]. Beyond traditional internal factors, corporate social responsibility (CSR) practices have been identified as important drivers of green innovation. Yuan and Cao confirmed that through the mediating mechanism of green dynamic capabilities [19], CSR initiatives significantly promoted green product and process innovation. However, these studies primarily focus on internal corporate governance and efficiency analysis. Building upon this foundation, some scholars have further expanded their perspective to examine the impact of policy and technological environments on green technology innovation. From an external perspective, government policy interventions are widely regarded as crucial exogenous drivers propelling global green trade and innovation, manifesting through both supportive policies and regulatory measures [20,21]. Numerous countries and regions have actively introduced diverse green policy instruments, such as fiscal subsidies, eco-credits, and additional incentives [22], to guide enterprises toward increased investment in green technology innovation. With the introduction of government green funds (GGF), the number of patent applications for new energy technologies by enterprises has increased significantly [23]. Additionally, in consideration that enterprises may neglect the long-term value of green development while pursuing short-term economic gains, governments often employ restrictive or punitive policies to correct corporate behavior [24]. The Porter hypothesis [25] posits that appropriate environmental regulation can drive firms to engage in green innovation activities and establish unique competitive advantages. It compensates firms for the costs of complying with environmental policies, ultimately achieving a balance between environmental and economic benefits [26,27,28]. Related studies also demonstrate that mandatory environmental legislation and pollution taxes [29] can effectively compel firms to increase environmental investments, which will drive them toward green technology innovation.
These findings partially address the research gap regarding the role of external institutional and technological environments in green innovation. However, they overlook the unique role that market-based financial capital may play in supporting corporate green innovation. As the high-risk, long-cycle nature of green technology innovation investments becomes more pronounced, academia has increasingly turned its attention to the role of capital markets. Disclosure systems and investor preferences within capital markets create market constraints and incentive mechanisms. Positive corporate information is more likely to influence stock prices, and investors are also more inclined to pay attention to and respond to management’s efforts in promoting corporate innovation [30]. Furthermore, companies that attract significant investor attention due to their environmental practices can enhance their reputational capital and valuation. This alleviates financing constraints and further incentivizes green innovation [31]. Within the framework of the overall function of capital markets, venture capital serves as a specialized financing method that does not prioritize short-term returns. Instead, it provides robust support for green innovation in high-tech enterprises through capital and resource backing [32]. Moreover, venture capitalists excel at overcoming high uncertainty and information asymmetry through financing, management and active monitoring [33,34]. These activities provide effective assistance for the rapid commercialization of clean energy technologies [35].
Subsequently, scholars gradually began exploring the role of venture capital networks in promoting innovation, aiming to address the limitation of traditional studies that primarily explain the function of VC from the perspective of capital provision. The position of a venture capital firm within a co-investment network can influence its access to information, investment performance, and the subsequent growth of its portfolio companies [36,37]. Kortum and Lerner also noted that venture capital significantly promotes patent output, playing a role in innovation that goes beyond mere capital supply [38]. Furthermore, research on innovation networks suggests that firm innovation not only originates from internal R&D investment but is also affected by external knowledge networks, indirect ties, and structural embeddedness [39]. These studies provide a theoretical foundation for this paper to interpret corporate green technology innovation from the perspective of network position. Meanwhile, research on common ownership and cross-shareholding addresses the gap in traditional corporate governance studies, which mainly focus on the equity structure of individual firms and pay limited attention to the network effects generated when the same investor is connected to multiple firms. Existing studies indicate that when the same investor holds stakes in multiple firms, channels for information transmission and resource sharing may be established among these firms. Institutional investors’ common ownership can influence firms’ competitive behavior, collaboration, and innovation outcomes [40]. When the same VC holds shares in competing firms, it may reshape the innovation competitive landscape among portfolio companies through project selection, capital allocation, and adjustment of innovation directions [41]. Studies on common institutional ownership also suggest that networks of common shareholders may generate inter-firm innovation spillover effects and enhance green innovation performance [42].
In summary, existing research has thoroughly demonstrated the pivotal role of capital markets in directly driving corporate green technological innovation. However, most studies focus directly on analyzing venture capital networks themselves, with relatively little attention given to the corporate interconnectivity derived from venture capital relationships. Specifically, they neglect to consider how companies may form competitive or cooperative ties through shared shareholders, which further influences their innovation outputs. Moreover, the existing literature often treats firms as monolithic entities, failing to explore how firms with differing governance capabilities and resource endowments exhibit divergent green innovation performance under venture capital support. Therefore, to examine the impact mechanism of such indirect effects, it is necessary to construct a corporate network based on venture capital relationships. Based on this, this study constructs an interfirm association network based on shared venture-capital shareholder relationships, and examines how firms’ centrality and structural hole positions within this network affect green technology innovation. It further incorporates heterogeneity perspectives related to ownership nature and ESG performance to reveal how venture capital networks can compensate for firms’ shortcomings in green governance through external resource allocation and knowledge spillovers. Finally, from the two dimensions of R&D personnel and R&D expenditure, this paper uncovers the mechanisms through which venture-capital networks influence green technological innovation, demonstrating that advantageous positions in external networks can be translated into actual green technological innovation outputs by enhancing firms’ knowledge absorptive capacity and level of innovation investment.

3. Theoretical Basis and Research Hypothesis

In studies of venture capital networks, venture capital firms serve as crucial nodes connecting multiple enterprises. When a venture capital firm holds stakes in several companies simultaneously, these enterprises form indirect interorganizational ties through share investors [43]. From a social network theory perspective, interactions between individuals are often established and strengthened through common third parties [44]. As common shareholders, venture capital institutions function as third-party connectors, enabling firms that originally lack direct business dealings to form indirect ties through investment relationships. The reason that venture capital networks can influence firms’ green technology innovation lies not only in the fact that firms possess more connections, but in the way these connections reshape the conditions under which firms access external resources and knowledge. Resource dependence theory suggests that firms find it difficult to cope with uncertainty in the external environment solely through their own capabilities; therefore, they need to obtain critical resources through interorganizational relationships, reduce resource constraints, and enhance their ability to adapt to the environment [45]. Green technology innovation is typically characterized by long R&D cycles, high funding requirements, strong technological uncertainty, and delayed commercialization returns and thus relies more heavily on external resource support. Furthermore, knowledge spillover theory argues that firms’ innovation activities depend not only on their internal R&D investment but also on the knowledge created and diffused by external actors [46]. Through co-shareholding relationships, venture capital institutions incorporate different firms into the same relational network, enabling firms to obtain more knowledge and information beyond capital investment, including technological assessments, industry experience, governance advice, and potential cooperation opportunities. Accordingly, firms’ embeddedness in venture capital networks can be understood as a form of corporate social capital. Unlike physical and human resources, it is an intangible asset formed through relationships among actors, dependent on network structures, and capable of helping firms better cope with uncertainty in the innovation process, identify key technological breakthrough opportunities, and acquire market information [47]. Related studies also show that interfirm relationships are shaped not only by formal business cooperation but also by network position, relationship strength, and forms of structural embeddedness [48].

3.1. The Role of the Network Center Position

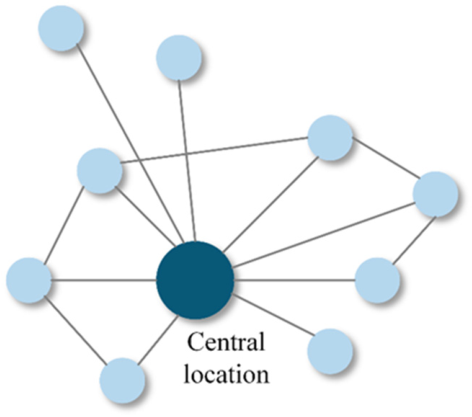
The key mechanism through which network centrality promotes green technology innovation lies not in a simple increase in the number of ties, but in firms’ ability to acquire external knowledge more effectively by virtue of their central positions. Enterprises positioned at the center of venture capital networks gain access to greater information and resources through shared investors, while also securing stronger initiative in potential partnerships. Higher network centrality often correlates with enhanced reputation [49], fostering greater external trust and strengthening inter-enterprise recognition. This, in turn, improves collaboration and resource acquisition efficiency while creating more opportunities for cross-enterprise communication and innovation partnerships [50]. This process is consistent with the logic of the Matthew effect, whereby actors with initial advantages in resources, reputation, or network position are more likely to obtain further opportunities and resources, thereby continuously reinforcing their existing advantages. As centrality increases, these enterprises attract greater resource inflows and collaboration opportunities than peripheral enterprises, gaining competitive advantages in market performance or innovation output. Figure 2 provides a schematic illustration of an enterprise’s central position within a venture capital network. Therefore, this study proposes the following hypotheses:
H1. 
The degree of centrality of an enterprise within a venture capital network is positively correlated with its green technology innovation performance.

3.2. The Role of the Network Structural Holes Position

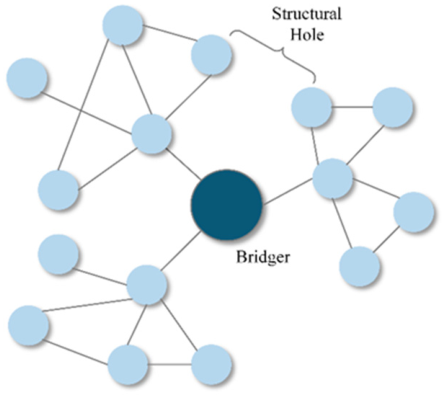
A structural hole refers to the gap between two unconnected nodes. When these nodes are linked through a third node, the gap is filled, creating significant advantages for the bridging node. Unlike network centrality, which primarily reflects the breadth of connections, structural holes place greater emphasis on whether firms can bridge otherwise disconnected network groups and thereby access non-redundant and heterogeneous resources and information. Enterprises occupying structural holes can exploit information asymmetries to gain greater self-interest, possessing substantial informational advantages and control over benefits [51].
The essence of innovative enterprises lies in leveraging information asymmetry to create value. Within venture capital networks, occupying a unique structural hole position enables enterprises to better exploit information asymmetry advantages to secure resources and opportunities [52]. For portfolio companies, establishing connections with venture capital institutions to enter networks formed by co-investment relationships represents a crucial pathway for accessing and utilizing information. Since the production and dissemination of tacit knowledge often rely on informal network relationships, an enterprise’s position within the structural hole of the network determines its access to scarce information resources and its structural control over resource allocation. Enterprises occupying pivotal structural hole positions are better positioned to mediate information flows, thereby securing greater developmental opportunities. Thus, enterprises that secure effective structural hole positions gain advantages in information acquisition and control, ultimately enhancing their innovation capabilities. Figure 3 provides a schematic illustration of structural holes within a venture capital network. Therefore, this study proposes the following hypothesis:
H2. 
The degree of structural holes in an enterprise’s network positively correlates with its green technology innovation performance.

4. Research Design

4.1. Data Resources

This study focuses on companies listed on China’s STAR Market and ChiNext Board. On one hand, as the world’s largest carbon emitter, China bears critical responsibility in implementing carbon reduction and advancing green transformation. Its performance in green innovation not only directly impacts the achievement of domestic sustainable development goals but also exerts significant spillover effects on the global climate governance landscape. On the other hand, with the reform of capital market systems and the refinement of a multi-tiered market structure, listed companies on emerging boards such as the STAR Market and ChiNext have demonstrated robust growth potential and innovative vitality, providing a broad platform for green technology R&D. This study constructs its research sample by combining data from multiple sources. Venture capital events and corporate green technology innovation data are sourced from the CNRDs database, while control variables such as corporate financial characteristics are drawn from the Wind database and CSMAR database. The study sample period spans from 2015 to 2023. This timeframe was selected because it encompasses both the inception of intensive green finance and innovation policies and the active innovation period following the establishment of the STAR Market, making it highly representative. However, after 2023, the disclosure of relevant data is insufficient. In addition, there is an inherent time lag in patent application and examination publications, which means that patent records for the most recent years are not yet complete. Therefore, this paper sets the sample period to end in 2023. Furthermore, to ensure data quality and research reliability, we applied stringent sample screening criteria: companies with ST* or ST designations and samples with severe data missingness were excluded. Meanwhile, considering that some financial variables may contain extreme values, all control variables are winsorized at the 1% level in both tails. This yielded an imbalanced panel dataset comprising 1544 STAR Market and ChiNext-listed companies from 2015 to 2023, totaling 5566 observations.

4.2. Research Methods and Variable Specification

This study first utilizes the CNRDs database to construct a venture capital network, forming a bipartite network structure. In this network, venture capital institutions and innovative enterprises serve as nodes, while investment relationships function as the edges connecting these nodes. This network comprises three components: a set of venture capital institutions, a set of innovative enterprises, and a set of investment relationships between them. It comprehensively characterizes the complex relationships within the venture capital market. This study employs a three-year rolling time window approach to construct a corporate affiliation network based on venture capital common shareholder relationships. Specifically, the network for year t is built using investment events occurring from year t − 2 to year t. This treatment helps identify relatively stable interfirm connections while avoiding historical relationships that may be weakened or even become invalid over an excessively long time span. Subsequently, this study projects the two-mode network into a one-mode network among firms. Specifically, if two firms share at least one venture capital shareholder within the observation window, an edge is considered to exist between them. The network structure is shown in Figure 4. This study does not set a minimum shareholding threshold. This is because the focus of this study is on relational embeddedness formed by shared shareholders and its potential effects on information and resource transmission, rather than on the strength of equity control. Meanwhile, interfirm relationships are treated as unweighted. That is, edges are determined solely by the existence of shared venture capital shareholders, without further assigning weights based on the number of shared shareholders or the proportion of shared equity holdings. This treatment helps highlight the structural characteristics of the network itself and avoids additional noise caused by differences in weighting criteria.
Building upon the constructed network, we employed NetworkX’s built-in algorithms in Python 3.12 to calculate structural metrics for network nodes. These metrics not only capture direct connections between nodes, but also account for the importance of adjacent nodes, providing a comprehensive assessment of each enterprise’s position within the network. To integrate enterprise-level data, we matched enterprise network structural metrics with innovation data, constructing an integrated panel dataset that combines network positioning characteristics with green technology innovation outcomes. Finally, we employ the integrated dataset for benchmark regression, robustness testing, and mechanism analysis to systematically examine the relationship between venture capital network structural indicators and corporate green technology innovation. The key variables in this study are defined as follows. Table 1 reports the definitions and measurements of the main variables used in this study.
(1)
Dependent variable. This study uses the number of green invention patents applied for by enterprises in the current year as the dependent variable to measure their green technology innovation. However, considering that using the number of patent applications alone may not fully capture innovation quality and actual impact, this paper further adopts the number of citations of firms’ green patents as an alternative measure in the robustness tests.
(2)
Explanatory variables. The explanatory variables in this study are structural embeddedness indicators of venture capital firms’ network ties, primarily measured by relative betweenness centrality and structural hole indicators.
Relative Degree Centrality: Relative degree centrality measures the number of other actors directly connected to an actor. When comparing multiple distinct networks, relative degree centrality must be employed—defined as the ratio of a node’s absolute degree centrality to the maximum possible degree within the network, as shown in Equation (1). Here, d i represents the number of other enterprises directly connected to the focal enterprise. n is the scale of the enterprise network.
R D C e n t r a l i t y = d i n 1
Structural Holes: Drawing on prior network research, effective size serves as a reliable predictor of structural hole effects. The larger an actor’s effective size, the higher the likelihood of occupying a structural hole position, enabling more efficient access to information and resources, as illustrated by Equation (2). Here, j represents all nodes connected to node i , and q represents the third node in the network excluding i and j . This variable undergoes logarithmic transformation in this study.
S t r u c t u a l H o l e i = j ( 1 q p i q m j q ) , q i , j
PageRank Index: To enhance the reliability of our findings, we also introduced the PageRank index as a supplementary metric. It provides a measure of node importance from the perspective of the overall network structure. The PageRank formula is
P R ( t i ) = 1 d n + d t j M ( t i ) P R ( t j ) C ( t j )
(3)
Control Variables: This study introduces a series of control variables at the enterprise level. These variables include enterprise size (Size, natural logarithm of total assets), enterprise age (Age, natural logarithm of years since establishment), capital structure (Lev, debt-to-asset ratio), profitability (ROA, return on assets), corporate governance (Indep: percentage of independent directors; Dual: combined roles) and institutional investor ownership (INST: percentage of shares held by institutional investors). Additionally, to control for the effects of industry, macroeconomic environment and regional differences, we incorporated fixed effects for industry, year, and province.

4.3. Model Design

To examine the impact of structural embedding metrics of enterprise nodes in venture capital networks on their green technology innovation, we constructed a baseline regression model grounded in social network theory and the innovation production function framework. These theories suggest that an individual’s position within a network significantly influences their ability to access resources and information, thereby affecting their green technology innovation output. In addition, considering that the number of green invention patent applications is a non-negative count variable with a large number of zero values, this paper employs the Poisson pseudo-maximum likelihood model with high-dimensional fixed effects (PPML-HDFE) for estimation. This approach helps avoid sample loss and estimation bias caused by logarithmic transformation. Compared with other count models, PPML-HDFE is more suitable for robustly identifying the effects of the core explanatory variables while controlling for multiple dimensions of fixed effects.
E G I i t = exp β 0 + β 1 N e t w o r k i t + μ C o n t r o l s i t + I n d u s t r y + Y e a r + P r o v i n c e
In the equation, G I i t denotes the green technology innovation output of enterprise i in year t ; N e t w o r k i t represents the structural embeddedness indicator of enterprise i within the network; C o n t r o l s represents a set of control variables; I n d u s t r y , Y e a r , P r o v i n c e represent industry, year, and region fixed effects respectively. Table 2 reports the descriptive statistics of the main variables.

5. Empirical Analysis

5.1. Baseline Model

Table 3 presents the regression results on the impact of corporate network position on green technological innovation. Columns (1) and (3) display univariate regressions without any control variables, while Columns (2) and (4) represent regressions incorporating control variables. The baseline regression results in the table indicate a significant positive correlation between an enterprise’s network centrality and green technology innovation within its venture capital-based common shareholder relationship network, confirming Hypothesis 1. Specifically, after controlling for enterprise characteristics such as size, capital structure, and age, the coefficient for network centrality is 8.651 and is positively significant at the 1% level. Since this study employs a PPML model, when a firm’s network centrality increases by 0.01, the expected value of its green technology innovation increases by approximately 9.04%. Venture capital not only provides financial support for technology innovation but also builds bridges for information and resource sharing among enterprises through common shareholder relationships. Occupying a network central position enables enterprises to access heterogeneous knowledge and experience, facilitating resource integration and risk sharing during green technology R&D, thereby enhancing innovation outcomes. Table 3 further reveals that the structural hole coefficient of enterprises’ network position (0.129) exhibits a significant positive correlation with green technology innovation performance. Holding other conditions constant, a 0.1 unit increase in the structural hole indicator is associated with an approximately 2.2% increase in the expected value of firms’ green technology innovation. Therefore, Hypothesis 2 is supported. This finding indicates that enterprises not only need to establish more connections within networks to enhance innovation performance but also require occupying bridge positions to link partners lacking direct ties, thereby accessing more scarce and heterogeneous information resources. Thus, compared to the quantitative advantage of centrality, the structural hole findings highlight the qualitative advantage derived from network position, offering a new perspective on the formation mechanism of corporate green technology innovation performance. This contrasts with Pahnke et al.’s conclusion that entrepreneurial enterprises’ indirect connections with other enterprises through shared VCs intensify information leakage and competitive pressures, thereby inhibiting innovation output [53]. Our study posits that while such competitive relationships may carry risks of knowledge leakage, under specific conditions they can also create a pressure mechanism for enterprises, intensifying their sense of crisis and indirectly stimulating their innovation momentum.

5.2. Endogeneity Tests

Considering that firms’ positions in the venture capital network may not be entirely exogenous, this study further conducts supplementary tests for potential endogeneity. On the one hand, firms with stronger innovation capabilities may be more likely to attract the attention of venture capital institutions [12]. As a result, they may occupy more advantageous positions in the shared-shareholder network, leading to a potential reverse causality problem. On the other hand, factors that are difficult to fully observe, such as corporate management quality, tax incentives, innovation culture, and access to government subsidies, may simultaneously affect firms’ network positions and their green technology innovation performance [54]. Due to limitations in data availability, this study cannot fully control for all of these potential omitted variables. Therefore, it mainly uses one-period lagged explanatory variables and dependent variables to alleviate endogeneity concerns arising from reverse causality and firms’ pre-existing innovation capabilities.
First, this study lags the core explanatory variables by one period to examine whether prior network positions can still explain current green technology innovation. Compared with contemporaneous network indicators, one-period lagged network positions help reduce the possibility that current green technology innovation may reversely affect network structure in terms of temporal ordering. The results in Table 4 show that the coefficient of lagged network centrality (L_centrality) is 5.262 and is significantly positive at the 1% level. The coefficient of the lagged structural hole variable (L_SH) is 0.227 and is significantly positive at the 5% level. These results indicate that firms’ positional advantages in the venture capital shared-shareholder network in the previous period continue to promote their subsequent green technology innovation performance. From a practical perspective, firms located at the center of the network or in structural hole positions in the previous period can gain earlier access to capital and knowledge resources, and gradually transform these network resources into innovation outputs in the subsequent R&D process.
Second, given that green technology innovation is characterized by a certain degree of path dependence, this study further includes the one-period lagged dependent variable to control for firms’ existing innovation foundation and innovation inertia. The results show that the coefficient of the one-period lagged green technology innovation variable (L_GI) is significantly positive, indicating that firms’ green technology innovation is indeed persistent. After controlling for this persistence, the effects of network centrality (6.395) and structural holes (0.302) on green technology innovation remain positive and significant. This suggests that the positive relationship between firms’ positions in the corporate venture capital network and green technology innovation is not entirely driven by firms’ past innovation capabilities. Firms’ green technology innovation is influenced not only by accumulated historical innovation experience but also by the resource connections, information transmission, and knowledge spillovers generated by external network structures, which may provide additional support for their subsequent innovation activities.
Overall, whether using one-period lagged explanatory variables or controlling for the one-period lagged dependent variable, the core network structure variables continue to exert a significantly positive effect. This indicates that the baseline findings of this study are, to some extent, robust to potential interference arising from reverse causality and innovation inertia.

5.3. Robustness Tests

To ensure the reliability of the research conclusions, this study conducts robustness tests from three perspectives: replacing the explanatory variables, replacing the dependent variable and adjusting the event window. First, with respect to replacing the explanatory variables, we use the PageRank index as an alternative measure of centrality and the degree of structural holes to capture network position. The PageRank index comprehensively characterizes the importance of corporate nodes within venture capital networks by considering complex interconnections between nodes through iterative calculations from a global network perspective [55]. The regression results in Column (1) of Table 5 indicate that using the PageRank index, the positive correlation between an enterprise’s position in the venture capital network and its green technology innovation remains significant, with a level of significance consistent with the baseline regression results. This demonstrates that our core research findings exhibit strong robustness to the choice of network centrality metrics. In current green technology innovation practices, it can indeed be observed that firms maintaining close ties with key innovation actors through venture capital co-shareholder relationships tend to engage in more frequent information exchange, thereby providing support for firms to access more opportunities for green technology innovation.
With respect to replacing the dependent variable, this study replaces the measure of green technology innovation from the number of green patent applications to the number of citations received by green patents. The results reported in Columns (2) and (3) of Table 5 show that the regression coefficients of network centrality and the degree of structural holes are 4.241 and 0.205, respectively, and both are significantly positive at the 1% statistical level. This indicates that when green technology innovation is measured by the number of green patent citations, firms’ central positions and structural hole positions in the venture capital co-shareholder network can still promote green technology innovation. This result suggests that network advantages not only encourage firms to increase the number of green patent applications but also help enhance the technology value and influence of green technology innovation outcomes.
Finally, this study adjusts the three-year rolling window originally used to construct the venture capital co-shareholder network to a five-year rolling window, in order to examine whether changes in the specification of the duration of network relationships affect the research conclusions. The results reported in Columns (4) and (5) of Table 5 show that, under the five-year window specification, the regression coefficients of network centrality and structural holes remain positive and significant. Even when the observation window for venture capital relationships is extended, the promoting effect of firms’ network positions on green technology innovation remains robust. Venture capital co-shareholder relationships can continue to facilitate resource connections, information transmission, and knowledge spillovers over a relatively long period, helping firms transform external network advantages into stable innovation capabilities.

5.4. Heterogeneity Analysis

To gain deeper insights into the differential effects of venture capital networks on corporate green technology innovation, we further examined the heterogeneity of these effects across different enterprise attributes. First, considering the variations in resource allocation, policy support, and market environments among enterprises with different ownership structures, we grouped the sample into state-owned enterprises, private enterprises, and foreign-funded enterprises for separate regression analysis, following the methodology of Zhang et al. [56]. In Table 6, Columns (1) and (4), Columns (2) and (5), and Columns (3) and (6) report the regression results for state-owned enterprises, private enterprises, and foreign-invested enterprises, respectively.
For the sample of state-owned enterprises, the coefficient of the structural hole variable in Column (4) is −0.149 and is significantly negative at the 5% statistical level. Holding other conditions constant, an improvement in the structural hole position of state-owned enterprises does not generate the expected innovation gains; instead, it may be associated with a decline in green technology innovation output. Although state-owned enterprises positioned at higher structural hole levels can access more novel and diverse information through common shareholder relationships in venture capital, this information carries higher uncertainty. Constrained by policies such as carbon trading systems and industrial structure optimization when engaging in green innovation, state-owned enterprises prioritize achieving social objectives [57]. They tend to follow policy-driven and prudent development paths, lacking sufficient motivation to absorb and utilize high-risk information.
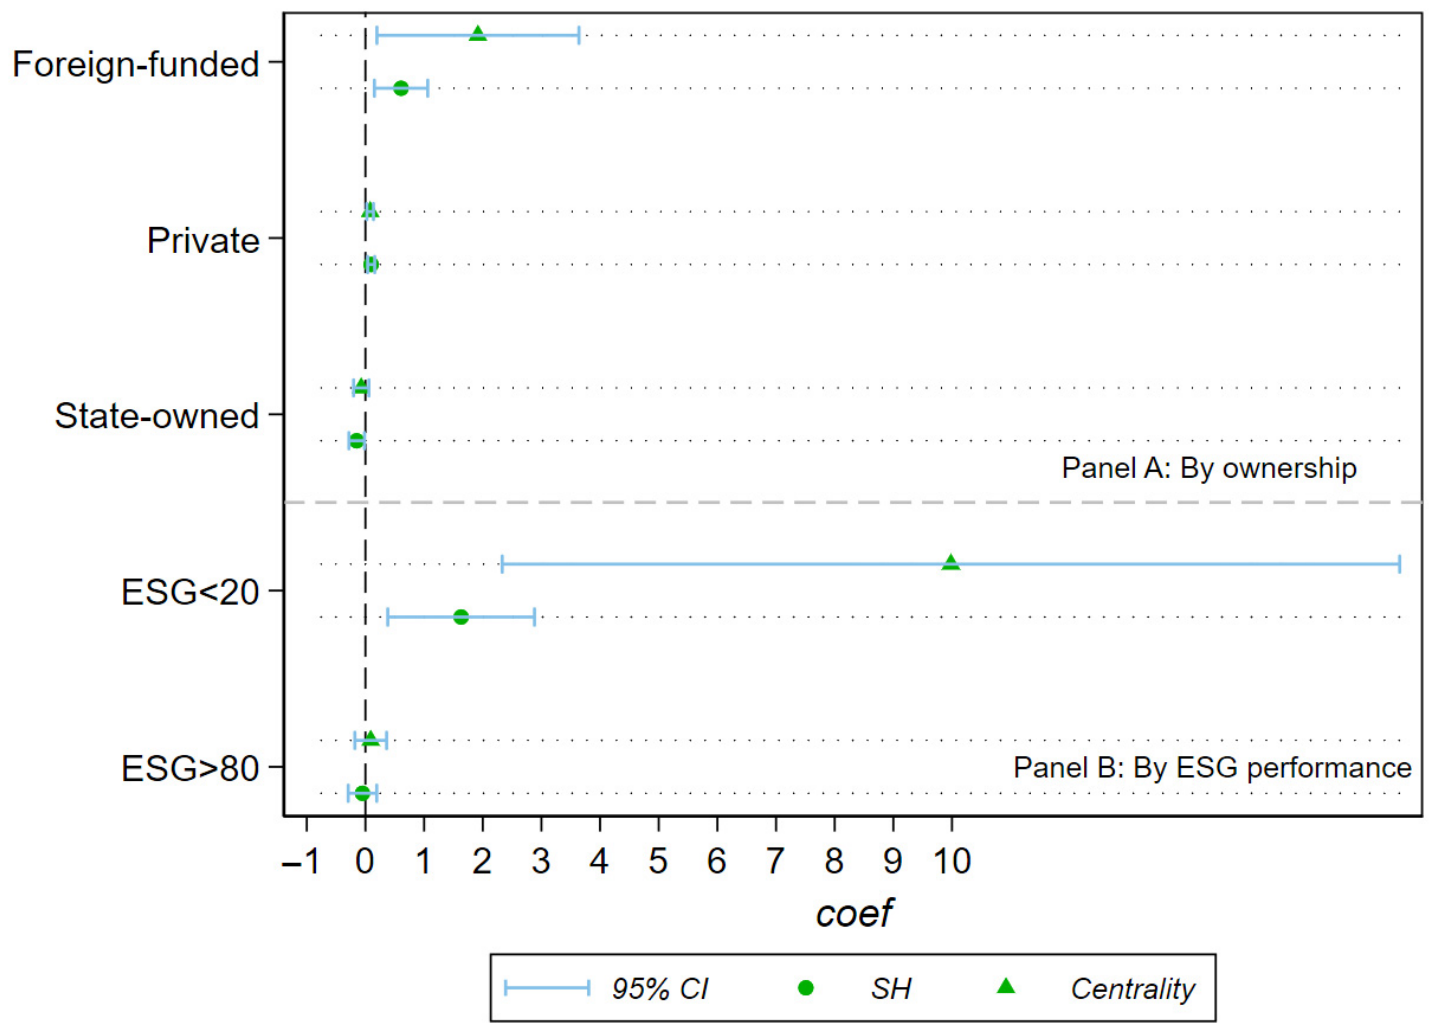
The empirical results of Models (2) and (5) indicate that the coefficients for centrality and structural hole degree of private enterprises are 0.081 and 0.098 respectively, and remain significant at the 1% level. This confirms the positive impact of occupying a central position and an effective structural hole position within the network on green technology innovation. Private enterprises typically face greater financing constraints and significant challenges in resource acquisition [58], making them more reliant on occupying pivotal positions within venture capital networks to access external information, technology, and financial support. Simultaneously, their high degree of marketization [59] enables them to efficiently integrate heterogeneous resources and rapidly respond to market demands when occupying structural holes, thereby accelerating green technology innovation and enhancing competitiveness.
When analyzing the regression results for foreign-invested enterprises, the network position variables also exhibit significant positive effects. When foreign-invested enterprises occupy more central or more bridging positions in the venture capital network, their green technology innovation performance improves significantly. A possible explanation is that foreign-invested enterprises generally possess stronger international management experience and cross-regional resource integration capabilities, enabling them to identify and utilize heterogeneous knowledge within the venture capital network more effectively. The information advantages generated by structural hole positions across actors, markets, and technological fields may complement foreign-invested enterprises’ international technological backgrounds and organizational absorptive capacity, thereby enhancing their green technology innovation output.
Furthermore, as ecological civilization advances, investors increasingly scrutinize corporate environmental performance. Public exposure to environmental violations may trigger investor divestment and heighten financing difficulties through increased implicit costs [60]. Consequently, ESG ratings serve as critical indicators of corporate environmental, social responsibility, and governance performance, reflecting overall sustainability capabilities and profoundly influencing green technology innovation. To further examine whether the effect of venture capital network position varies with firms’ sustainable governance foundations, this study follows the quintile grouping method of Avramov et al. [61]. Specifically, firms are ranked in ascending order according to their overall ESG scores, and the sample is divided into five quintile groups. Firms in the highest quintile are defined as the high ESG performance group, while those in the lowest quintile are defined as the low ESG performance group. This grouping enables an investigation of the heterogeneous effects of venture capital network position on green technology innovation across different ESG levels. In Table 7, Columns (1) and (3) report the empirical results for the high ESG performance group, while Columns (2) and (4) report those for the low ESG performance group.
As shown in Table 7, enterprises with a composite score below 20 exhibit a significant positive impact of both centrality and structural hole degree within the network on green technology innovation outcomes, with coefficients of 9.982 and 1.632 respectively. This indicates that for enterprises with relatively weaker ESG performance, the promotional effect of venture capital network positional advantages on their green technology innovation performance is more critical. Such enterprises lack sufficient resources and capabilities for green governance and are more inclined to seek external support through network relationships. This aligns with Yang et al.’s argument that companies with lower ESG ratings can mitigate the negative impacts encountered during green innovation through collaborative efforts [62]. Therefore, it is necessary to appropriately lower the barriers for such enterprises to collaborate with venture capital institutions through measures like easing financing access conditions. This encourages their active participation in venture capital networks, leveraging external capital and technical support to compensate for insufficient endogenous innovation. Simultaneously, considering that merely relaxing financing conditions may lead enterprises to rely on external capital in the short term while neglecting their own green governance responsibilities, they should also be guided to continuously improve their governance structures and increase investments in energy conservation, emission reduction, and green production to gradually enhance their ESG performance. For companies with strong ESG performance, their network centrality and effective structural hole size did not significantly influence green technology innovation outcomes. The likely reason lies in the fact that such enterprises possess suitable corporate governance structures and management mechanisms [63], having already established a robust foundation for green technology innovation. Their green technology R&D activities rely more heavily on endogenous capabilities and long-term strategic orientation. In other words, the network effects generated by venture capital co-shareholder relationships hold relatively limited significance for these enterprises.
However, it should be noted that the sample timeframe for this study spans 2015–2023, representing a relatively short observation period. Some firms with low ESG performance may engage in so-called ‘’greenwashin’’ behavior [64], that is, applying for green patents with limited technological content in order to improve external evaluations. Such behavior may interfere with the relationship between venture capital networks and green technology innovation. Future research could employ a longer time series or introduce indicators such as the degree of patent commercialization to enhance the explanatory power of the findings.
Figure 5 further illustrates the heterogeneous characteristics of venture capital network structure embedding’s impact on corporate green technology innovation across different enterprise types. The figure presents point estimates for regression coefficients linking network centrality and structural holes to green technology innovation, with horizontal lines indicating corresponding confidence intervals. This comprehensively reflects the directionality and significance of estimated results across different subsamples. From the perspective of ownership heterogeneity, the estimated coefficients of network centrality and structural holes are significantly positive for the samples of private enterprises and foreign-invested enterprises, and their confidence intervals do not cross zero. This indicates that venture capital network position promotes green technology innovation in these types of firms. From the perspective of ESG-level heterogeneity, the figure shows that, among firms with weaker ESG performance, both network centrality and structural hole variables exert positive effects, and their confidence intervals do not cross zero. This suggests that such firms are more likely to obtain external resource support through venture capital networks to compensate for deficiencies in green governance and innovation capabilities. By contrast, among firms with stronger ESG performance, the point estimates of the two network variables are smaller, and their confidence intervals are close to or include zero, indicating that the marginal effect of network position on green technology innovation is relatively limited for firms with high ESG scores. When firms already possess a strong foundation in sustainable governance, their innovation activities may become less dependent on external venture capital networks.

5.5. Mechanism Analysis

To further explore the mechanism through which venture capital networks promote firms’ green technology innovation, this study introduces the number of R&D personnel (RDPerson) and R&D expenditure (RDSpendSum) as mediating variables, and examines the transmission paths from the perspectives of absorptive capacity and knowledge input.
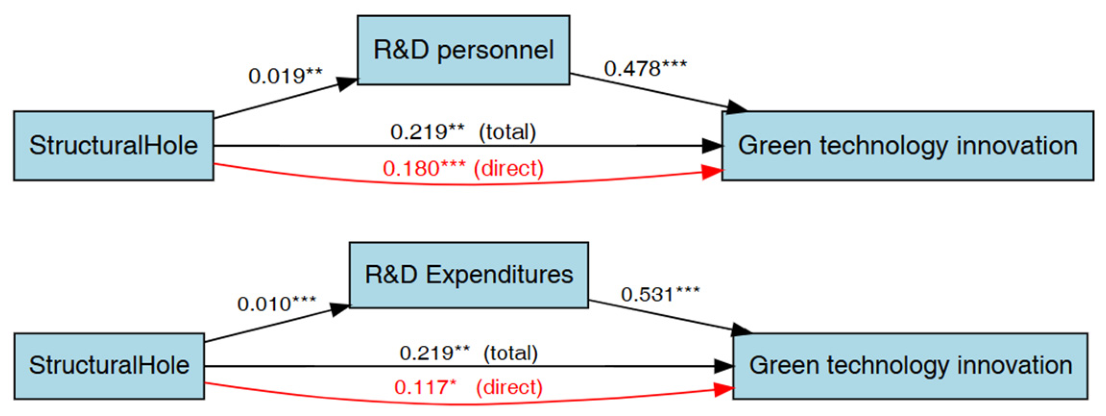
When firms occupy advantageous positions in venture capital networks, they can access a greater amount of information resources. However, whether these external resources can be transformed into actual innovation output depends on firms’ internal R&D foundation and resource investment. On the one hand, R&D personnel reflect firms’ ability to absorb and transform external knowledge. A larger number of research personnel helps firms make more effective use of network resources, thereby promoting green technology innovation [65]. On the other hand, R&D expenditure reflects the intensity of firms’ resource investment in innovation activities. Advantages in venture capital network positions may encourage firms to increase R&D investment by alleviating financing constraints, enhancing resource acquisition capabilities, and strengthening innovation confidence, thereby improving green technology innovation output. Furthermore, we focus on the structural hole variable for a mechanism analysis. This is because firms’ R&D personnel and R&D expenditure are closely related to the efficiency with which they absorb and transform heterogeneous resources, which aligns strongly with the cross-boundary resource integration mechanism represented by structural holes. Compared to selecting centrality variables for mechanism analysis, employing a structural hole perspective holds greater practical significance. As shown in Figure 6, the structural hole position of an enterprise within the venture capital network affects green technology innovation both directly and indirectly through R&D personnel and R&D expenditures.
According to Columns (1), (2), and (3) of Table 8, the regression results show that structural hole positions in the network have a significantly positive effect on the number of R&D personnel in firms (0.019, p < 0.05), indicating that firms occupying advantageous positions in the venture capital network are able to attract more R&D personnel. Furthermore, the number of R&D personnel has a positive and significant effect on green technology innovation (0.478, p < 0.01), suggesting that an increase in R&D personnel directly promotes green technology innovation output. This result supports the logic of absorptive capacity theory: a firm’s ability to absorb and recreate knowledge depends on its existing knowledge base, much of which is embedded in its products, processes, and personnel [66]. Firms can therefore enhance their ability to absorb external knowledge by increasing the number of research personnel and transforming such knowledge into actual innovation outcomes.
In addition, through further mediation effect analysis, the regression results in Columns (4), (5), and (6) show that R&D expenditure plays a partial mediating role between structural hole position and green technology innovation. After R&D expenditure is included, the coefficient of structural hole position decreases from 0.219 to 0.117 (p < 0.01), indicating that firms occupying structural hole positions can indirectly promote green technology innovation by increasing R&D expenditure. This finding is consistent with the conclusions of the existing literature, suggesting that venture capital not only provides financial support but also promotes innovation output by improving firms’ resource allocation and R&D investment [67].
Overall, venture capital networks are not merely providers of funding; rather, by optimizing resource allocation, attracting innovative talent, and promoting R&D investment, they become a key force driving green technology innovation. Policymakers and investors should therefore focus on how to build more favorable venture capital networks that can reduce financing costs and optimize resource allocation, thereby providing stronger support for firms’ green technology innovation.

6. Conclusions and Implications

6.1. Main Conclusions

Through empirical research on companies listed on China’s STAR and ChiNext Market from 2015 to 2023, we found that the positional characteristics within corporate networks formed through venture capital relationships significantly promote green technology innovation. This manifests in three specific ways:
  • The higher the degree of centrality and structural holes within networks possessed by innovative enterprises, the more pronounced their green technology innovation performance becomes. Hypotheses 1 and 2 are supported. In this process, venture capital not only provides enterprises with capital but also connects different enterprises through shareholder networks, thereby enhancing opportunities for resource sharing and cross-industry collaboration. Enterprises with stronger network positional advantages can leverage the heterogeneous information resources generated by these connections to foster the development of green technology innovation. This conclusion remains statistically significant even after robustness tests involving variable substitution.
  • This catalytic effect manifests differently across enterprises with varying attributes. Specifically, private enterprises and foreign-invested enterprises rely more heavily on centrality and structural hole positions within networks to drive green technology innovation, whereas state-owned enterprises exhibit lower network dependency, with their green technology innovation being more strongly influenced by policy guidance. For enterprises with weaker ESG performance, the role of venture capital networks is particularly pronounced; conversely, those with stronger ESG performance rely more heavily on endogenous innovation capabilities, with network position playing a relatively minor role. This finding reveals differences in the degree of reliance on venture capital networks during innovation across distinct enterprise types. This information can help policymakers and corporate decision-makers develop more targeted support strategies.
  • The mechanism analysis shows that when firms occupy structural hole positions in venture capital networks, they can effectively transform external network resources into green technology innovation outcomes by enhancing their internal R&D capabilities and R&D investment. Specifically, structural hole positions significantly increase the number of R&D personnel and promote R&D expenditure, thereby strengthening firms’ ability to absorb heterogeneous knowledge and integrate cross-boundary resources. This forms a mediating pathway through which structural hole positions promote green technology innovation.
These findings suggest that venture capital networks can serve as an important market-based mechanism for channeling financial and knowledge resources toward sustainable innovation, thereby contributing to green transformation and broader sustainable development goals.

6.2. Management Implications

Based on the aforementioned research findings, we propose the following management implications:
  • For innovative enterprises, it is advisable to proactively embed themselves within industrial and capital networks, leveraging industry alliances and investment platforms to enhance visibility among venture capital institutions. By attracting equity participation from diversified venture capital firms, implicit connections with other enterprises can be established. Furthermore, enterprises may reserve a reasonable proportion of long-term equity for VCs within their shareholding structure, ensuring their deep involvement in innovation strategy, technological R&D, and management to accelerate internal and external resource integration. Concurrently, adopting diversified talent strategies to attract R&D personnel enhances the capacity to transform heterogeneous resources into green technology innovation outcomes.
  • For venture capital institutions, it is imperative to transcend the role of mere capital providers and proactively assume the function of network orchestrators, facilitating cross-sector resource integration and knowledge spillovers. This involves fostering technological exchange and collaborative innovation among portfolio companies. Furthermore, a robust green due diligence and performance monitoring mechanism must be established, with particular emphasis on the quality of green patents and the effectiveness of innovation translation. Such measures ensure that capital genuinely flows to enterprises possessing genuine innovative potential, while preventing superficial greenwashing practices.
  • For policymakers, it is imperative to optimize the development environment for the venture capital market and establish long-term mechanisms supporting green technological innovation. Enterprises should be encouraged to engage in cross-sector collaboration, thereby strengthening the exchange of information and technology within venture capital networks. Targeted support should be provided to companies with weaker ESG performance, lowering barriers to their engagement with venture capital institutions while simultaneously helping them consolidate their endogenous innovation capabilities. This approach will enhance their long-term sustainable competitiveness.

6.3. Limitations and Outlook

Although we believe our research offers valuable insights, it nevertheless possesses certain limitations. Firstly, this study employs the quantity of green patents to measure corporate innovation performance; however, patent volume does not fully reflect innovation quality or market potential. Future research should incorporate metrics such as patent citation frequency, technological influence, and commercialization levels to more comprehensively evaluate the efficacy and value of green technology innovation. Secondly, this study takes the Chinese capital market as its research context, and the external validity of its conclusions still needs to be further examined in other countries and regions. Nevertheless, existing studies on emerging economies such as India, Brazil, and Southeast Asian countries also suggest that venture capital networks can promote enterprise innovation through knowledge spillovers and resource allocation. Consistent with these studies, this study further extends this mechanism to the field of green technology innovation. Therefore, the findings of this study provide certain reference value for other economies facing pressures from green transformation and financing constraints. Future research may conduct cross-country comparative studies to further examine the applicability and boundary conditions of this mechanism under different institutional environments. Thirdly, venture capital networks often exhibit community-based characteristics, with distinct communities potentially forming unique knowledge-sharing patterns and resource allocation mechanisms. Future research should employ community detection algorithms to identify cohesive subgroups within networks, analyzing how different collaborative innovation models within these communities contribute differentially to green technology breakthroughs. This would provide a theoretical foundation for developing more refined network governance mechanisms.

Author Contributions

Conceptualization, Y.J. and S.M.; methodology, S.M.; software, K.Z.; formal analysis, S.M.; data curation, L.J. and X.W.; writing—original draft preparation, S.M.; writing—review and editing, K.Z.; visualization, S.M.; supervision, Y.J.; project administration, Y.J. All authors have read and agreed to the published version of the manuscript.

Funding

This research was funded by Social Science Foundation of Jiangsu Province, grant number 24EYB005 and College Students’ Innovative Entrepreneurial Training Plan Program, grant number S202510294147.

Institutional Review Board Statement

Not applicable.

Informed Consent Statement

Not applicable.

Data Availability Statement

The original data presented in the study are openly available in the CNRDs database, the Wind database and CSMAR database. The authors confirm that critical data generated during this research are included in this article as tables and figures. Additional data will be made available upon reasonable request.

Conflicts of Interest

Author Xuan Wang was employed by the company Bank of Nanjing Co., Ltd., Nanjing, China. The remaining authors declare that the research was conducted in the absence of any commercial or financial relationships that could be construed as a potential conflict of interest.

References

  1. Reckien, D.; Salvia, M.; Heidrich, O.; Church, J.M.; Pietrapertosa, F.; De Gregorio-Hurtado, S.; D’Alonzo, V.; Foley, A.; Simoes, S.G.; Lorencová, E.K.; et al. How are cities planning to respond to climate change? Assessment of local climate plans from 885 cities in the EU-28. J. Clean. Prod. 2018, 191, 207–219. [Google Scholar] [CrossRef]
  2. Liu, Z.; Deng, Z.; He, G.; Wang, H.L.; Zhang, X.; Lin, J.; Liang, X. Challenges and opportunities for carbon neutrality in China. Nat. Rev. Earth Environ. 2022, 3, 141–155. [Google Scholar] [CrossRef]
  3. Huang, J.B.; He, W.R.; Dong, X.W.; Wang, Q.H.; Wu, J. How does green finance reduce China’s carbon emissions by fostering green technology innovation? Energy 2024, 298, 131266. [Google Scholar] [CrossRef]
  4. Flammer, C.; Hong, B.; Minor, D. Corporate governance and the rise of integrating corporate social responsibility criteria in executive compensation: Effectiveness and implications for firm outcomes. Strateg. Manag. J. 2019, 40, 1097–1122. [Google Scholar] [CrossRef]
  5. Zhao, X.; Shang, Y.; Ma, X.; Xia, P.; Shahzad, U. Does carbon trading lead to green technology innovation: Recent evidence from Chinese companies in resource-based industries. IEEE Trans. Eng. Manag. 2022, 71, 2506–2523. [Google Scholar] [CrossRef]
  6. Oh, S.G.; Choi, J.; Kang, M.J.; Son, S.W.; Jeong, S.; Min, S.K.; Yeh, S.W.; Kim, Y.H. Significant reduction of unequal population exposure to climate extremes by achieving the carbon neutrality. Earth’s Future 2024, 12, e2023EF004381. [Google Scholar] [CrossRef]
  7. Jiang, T.; Ji, P.; Shi, Y.; Ye, Z.; Jin, Q. Efficiency assessment of green technology innovation of renewable energy enterprises in China: A dynamic data envelopment analysis considering undesirable output. Clean Technol. Environ. Policy 2021, 23, 1509–1519. [Google Scholar] [CrossRef]
  8. Tang, M.; Liu, Y.; Hu, F.; Wu, B. Effect of digital transformation on enterprises’ green innovation: Empirical evidence from listed companies in China. Energy Econ. 2023, 128, 107135. [Google Scholar] [CrossRef]
  9. Meng, F.; Tian, Y.; Han, C.; Band, S.S.; Arya, V.; Alhalabi, M. Study on value symbiosis and niche evolution of the corporate venture capital ecological community for innovation and knowledge. J. Innov. Knowl. 2023, 8, 100363. [Google Scholar] [CrossRef]
  10. Balachandran, S.; Hernandez, E. Mi casa es tu casa: Immigrant entrepreneurs as pathways to foreign venture capital investments. Strateg. Manag. J. 2021, 42, 2047–2083. [Google Scholar] [CrossRef]
  11. Lei, X.; Xu, X. The “spider web” of venture capital: An invisible force driving corporate green technology innovation. Technol. Soc. 2025, 82, 102882. [Google Scholar] [CrossRef]
  12. Gompers, P.A.; Gornall, W.; Kaplan, S.N.; Strebulaev, I.A. How do venture capitalists make decisions? J. Financ. Econ. 2020, 135, 169–190. [Google Scholar] [CrossRef]
  13. Ewens, M.; Nanda, R.; Rhodes-Kropf, M. Cost of experimentation and the evolution of venture capital. J. Financ. Econ. 2018, 128, 422–442. [Google Scholar] [CrossRef]
  14. Anderegg, W.R.; Collins, T.; Grineski, S.; Nicholls, S.; Nolte, C. Climate change greatly escalates forest disturbance risks to US property values. Environ. Res. Lett. 2023, 18, 094011. [Google Scholar] [CrossRef]
  15. Yan, Y.; Lin, T.; Ma, H. The impact of corporate climate risk on carbon intensity: Evidence from China. Energy 2025, 334, 137532. [Google Scholar] [CrossRef]
  16. Li, Z.H.; Huang, Z.M.; Su, Y.Y. New media environment, environmental regulation and corporate green technology innovation: Evidence from China. Energy Econ. 2023, 119, 106545. [Google Scholar] [CrossRef]
  17. Zhang, Y.; Sun, J.; Yang, Z.; Wang, Y. Critical success factors of green innovation: Technology, organization and environment readiness. J. Clean. Prod. 2020, 264, 121701. [Google Scholar] [CrossRef]
  18. Phung, G.; Trinh, H.H.; Nguyen, T.H.; Trinh, V.Q. Top-management compensation and environmental innovation strategy. Bus. Strategy Environ. 2023, 32, 1634–1649. [Google Scholar] [CrossRef]
  19. Yuan, B.L.; Cao, X.Y. Do corporate social responsibility practices contribute to green innovation? The mediating role of green dynamic capability. Technol. Soc. 2022, 68, 101868. [Google Scholar] [CrossRef]
  20. Brunel, C. Green innovation and green Imports: Links between environmental policies, innovation, and production. J. Environ. Manag. 2019, 248, 109290. [Google Scholar] [CrossRef]
  21. Shao, Y.M.; Chen, Z.F. Can government subsidies promote the green technology innovation transformation? Evidence from Chinese listed companies. Econ. Anal. Policy 2022, 74, 716–727. [Google Scholar] [CrossRef]
  22. Hu, G.Q.; Wang, X.Q.; Wang, Y. Can the green credit policy stimulate green innovation in heavily polluting enterprises? Evidence from a quasi-natural experiment in China. Energy Econ. 2021, 98, 105134. [Google Scholar] [CrossRef]
  23. Zheng, Z.J.; Li, X.Q.; Han, X.F.; Shi, D.Q.; Liu, J. Better green financial instrument: Government green fund and corporate new energy technology innovation. Energy Econ. 2025, 143, 108234. [Google Scholar] [CrossRef]
  24. Lee, C.C.; Lee, C.C. How does green finance affect green total factor productivity? Evidence from China. Energy Econ. 2022, 107, 105863. [Google Scholar] [CrossRef]
  25. Porter, M.E.; van der Linde, C. Toward a new conception of the environment-competitiveness relationship. J. Econ. Perspect. 1995, 9, 97–118. [Google Scholar] [CrossRef]
  26. Kim, I.; Pantzalis, C.; Zhang, Z.Y. Multinationality and the value of green innovation. J. Corp. Financ. 2021, 69, 101996. [Google Scholar] [CrossRef]
  27. Orsatti, G.; Quatraro, F.; Pezzoni, M. The antecedents of green technologies: The role of team-level recombinant capabilities. Res. Policy 2020, 49, 103919. [Google Scholar] [CrossRef]
  28. Ren, S.G.; Li, X.L.; Yuan, B.L.; Li, D.Y.; Chen, X.H. The effects of three types of environmental regulation on eco-efficiency: A cross-region analysis in China. J. Clean. Prod. 2018, 173, 245–255. [Google Scholar] [CrossRef]
  29. Yi, Y.X.; Wei, Z.J.; Fu, C.Y. An optimal combination of emissions tax and green innovation subsidies for polluting oligopolies. J. Clean. Prod. 2021, 284, 124693. [Google Scholar] [CrossRef]
  30. Liu, Y.; Chen, W.; He, X. Substantive innovation or strategic catering: Capital market pressure and corporate green innovation structure. Int. Rev. Econ. Financ. 2025, 97, 103752. [Google Scholar] [CrossRef]
  31. He, F.; Yan, Y.L.; Hao, J.; Wu, J. Retail investor attention and corporate green innovation: Evidence from China. Energy Econ. 2022, 115, 106308. [Google Scholar] [CrossRef]
  32. Hall, B.H.; Lerner, J. The financing of R&D and innovation. In Handbook of the Economics of Innovation; Elsevier: Amsterdam, The Netherlands, 2010; Volume 1, pp. 609–639. [Google Scholar]
  33. Kaplan, S.N.; Strömberg, P. Venture capitalists as principals: Contracting, screening, and monitoring. Am. Econ. Rev. 2001, 91, 426–430. [Google Scholar] [CrossRef]
  34. Popov, A.; Roosenboom, P. Venture capital and new business creation. J. Bank. Financ. 2013, 37, 4695–4710. [Google Scholar] [CrossRef]
  35. Popov, A.; Roosenboom, P. Venture capital and patented innovation: Evidence from Europe. Econ. Policy 2012, 27, 447–482. [Google Scholar] [CrossRef]
  36. Hochberg, Y.V.; Ljungqvist, A.; Lu, Y. Whom you know matters: Venture capital networks and investment performance. J. Financ. 2007, 62, 251–301. [Google Scholar] [CrossRef]
  37. Sorenson, O.; Stuart, T.E. Syndication networks and the spatial distribution of venture capital investments. Am. J. Sociol. 2001, 106, 1546–1588. [Google Scholar] [CrossRef]
  38. Kortum, S.; Lerner, J. Assessing the contribution of venture capital to innovation. RAND J. Econ. 2000, 31, 674–692. [Google Scholar] [CrossRef]
  39. Phelps, C.; Heidl, R.; Wadhwa, A. Knowledge, networks, and knowledge networks: A review and research agenda. J. Manag. 2012, 38, 1115–1166. [Google Scholar] [CrossRef]
  40. He, J.; Huang, J.K. Product Market Competition in a World of Cross-Ownership: Evidence from Institutional Blockholdings. Rev. Financ. Stud. 2017, 30, 2674–2718. [Google Scholar] [CrossRef]
  41. Li, X.L.; Liu, T.; Taylor, L.A. Common ownership and innovation efficiency. J. Financ. Econ. 2023, 147, 475–497. [Google Scholar] [CrossRef]
  42. He, J.; Shen, X.X. Institutional investor cross-ownership networks and green innovation: Evidence from China. Int. Rev. Econ. Financ. 2024, 96, 103657. [Google Scholar] [CrossRef]
  43. Sivakumar, K.; Roy, S.; Zhu, J.; Hanvanich, S. Global innovation generation and financial performance in business-to-business relationships: The case of cross-border alliances in the pharmaceutical industry. J. Acad. Mark. Sci. 2011, 39, 757–776. [Google Scholar] [CrossRef]
  44. Borgatti, S.P.; Mehra, A.; Brass, D.J.; Labianca, G. Network Analysis in the Social Sciences. Science 2009, 323, 892–895. [Google Scholar] [CrossRef]
  45. Hillman, A.J.; Withers, M.C.; Collins, B.J. Resource Dependence Theory: A Review. J. Manag. 2009, 35, 1404–1427. [Google Scholar] [CrossRef]
  46. Bloom, N.; Schankerman, M.; Van Reenen, J. Identifying technology spillovers and product market rivalry. Econometrica 2013, 81, 1347–1393. [Google Scholar] [CrossRef]
  47. Chierici, R.; Tortora, D.; Del Giudice, M.; Quacquarelli, B. Strengthening digital collaboration to enhance social innovation capital: An analysis of Italian small innovative enterprises. J. Intellect. Cap. 2021, 22, 610–632. [Google Scholar] [CrossRef]
  48. Wang, G.; Zha, Y.; Wang, T.; Wu, G.; Yi, H.; Liu, B. Network governance of collaborative innovation: A bipartite network perspective. Public Manag. Rev. 2026, 28, 307–333. [Google Scholar] [CrossRef]
  49. Wang, L.; Lang, Z.; Duan, J.; Zhang, H. Heterogeneous venture capital and technological innovation network evolution: Corporate reputation as mediating variable. Financ. Res. Lett. 2023, 51, 103478. [Google Scholar] [CrossRef]
  50. Cumming, D.; Schmidt, D.; Walz, U. Legality and venture capital governance around the world. J. Bus. Ventur. 2010, 25, 54–72. [Google Scholar] [CrossRef]
  51. Burt, R.S. The social structure of competition. Netw. Knowl. Econ. 2003, 13, 57–91. [Google Scholar]
  52. Xing, Z.; Fang, D.; Wang, J.; Zhang, L. Digital technology and industry-university-research (IUR) R&D network configurations: An exploration of market participation and market maturity. Technol. Soc. 2024, 78, 102595. [Google Scholar] [CrossRef]
  53. Pahnke, E.C.; McDonald, R.; Wang, D.; Hallen, B. Exposed: Venture Capital, Competitor Ties, and Entrepreneurial Innovation. Acad. Manag. J. 2015, 58, 1334–1360. [Google Scholar] [CrossRef]
  54. Bronzini, R.; Piselli, P. The impact of R&D subsidies on firm innovation. Res. Policy 2016, 45, 442–457. [Google Scholar] [CrossRef]
  55. Gleich, D.F. PageRank Beyond the Web. Siam Rev. 2015, 57, 321–363. [Google Scholar] [CrossRef]
  56. Zhang, W.J.; Xu, N.; Li, C.Y.; Cui, X.H.; Zhang, H.; Chen, W.X. Impact of digital input on enterprise green productivity: Micro evidence from the Chinese manufacturing industry. J. Clean. Prod. 2023, 414, 137272. [Google Scholar] [CrossRef]
  57. Wang, J.X.; Ma, M.D.; Dong, T.Y.; Zhang, Z.Y. Do ESG ratings promote corporate green innovation? A quasi-natural experiment based on SynTao Green Finance’s ESG ratings. Int. Rev. Financ. Anal. 2023, 87, 102623. [Google Scholar] [CrossRef]
  58. Yu, C.H.; Wu, X.Q.; Zhang, D.Y.; Chen, S.; Zhao, J.S. Demand for green finance: Resolving financing constraints on green innovation in China. Energy Policy 2021, 153, 112255. [Google Scholar] [CrossRef]
  59. Zhang, C.S.; Qiu, P.; Zhang, L.; Hong, X.Y.; Wang, D.Q. The impact of digital transformation on enterprises’ export stability: Evidence from listed companies in China. Int. Rev. Financ. Anal. 2024, 96, 103582. [Google Scholar] [CrossRef]
  60. Lyu, H.Y.; Ma, C.N.; Arash, F. Central environmental protection inspection, green technology innovation and carbon intensity of industrial enterprises—Empirical research based on multi-period differences-in-differences model. Energy 2024, 307, 132649. [Google Scholar] [CrossRef]
  61. Avramov, D.; Cheng, S.; Lioui, A.; Tarelli, A. Sustainable investing with ESG rating uncertainty. J. Financ. Econ. 2022, 145, 642–664. [Google Scholar] [CrossRef]
  62. Yang, C.Y.; Zhu, C.H.; Albitar, K. ESG ratings and green innovation: A U-shaped journey towards sustainable development. Bus. Strategy Environ. 2024, 33, 4108–4129. [Google Scholar] [CrossRef]
  63. Xiong, Z.Q.; Hu, J.; Li, W.F. From policy to practice: Enhancing enterprise productivity through energy transition initiatives. Energy 2024, 311, 133361. [Google Scholar] [CrossRef]
  64. Jin, Y.S.; Li, H.; Lu, J. How does energy policy uncertainty perception affect corporate greenwashing behaviors? Evidence from China’s energy companies. Energy 2024, 306, 132403. [Google Scholar] [CrossRef]
  65. Löfsten, H.; Lindelöf, P. R&D networks and product innovation patterns—Academic and non-academic new technology-based firms on Science Parks. Technovation 2005, 25, 1025–1037. [Google Scholar] [CrossRef]
  66. Escribano, A.; Fosfuri, A.; Tribó, J.A. Managing external knowledge flows: The moderating role of absorptive capacity. Res. Policy 2009, 38, 96–105. [Google Scholar] [CrossRef]
  67. Lei, H.; Gao, R.Y.; Ning, C.T.; Sun, G.L. Green finance and corporate green innovation. Financ. Res. Lett. 2025, 72, 106577. [Google Scholar] [CrossRef]
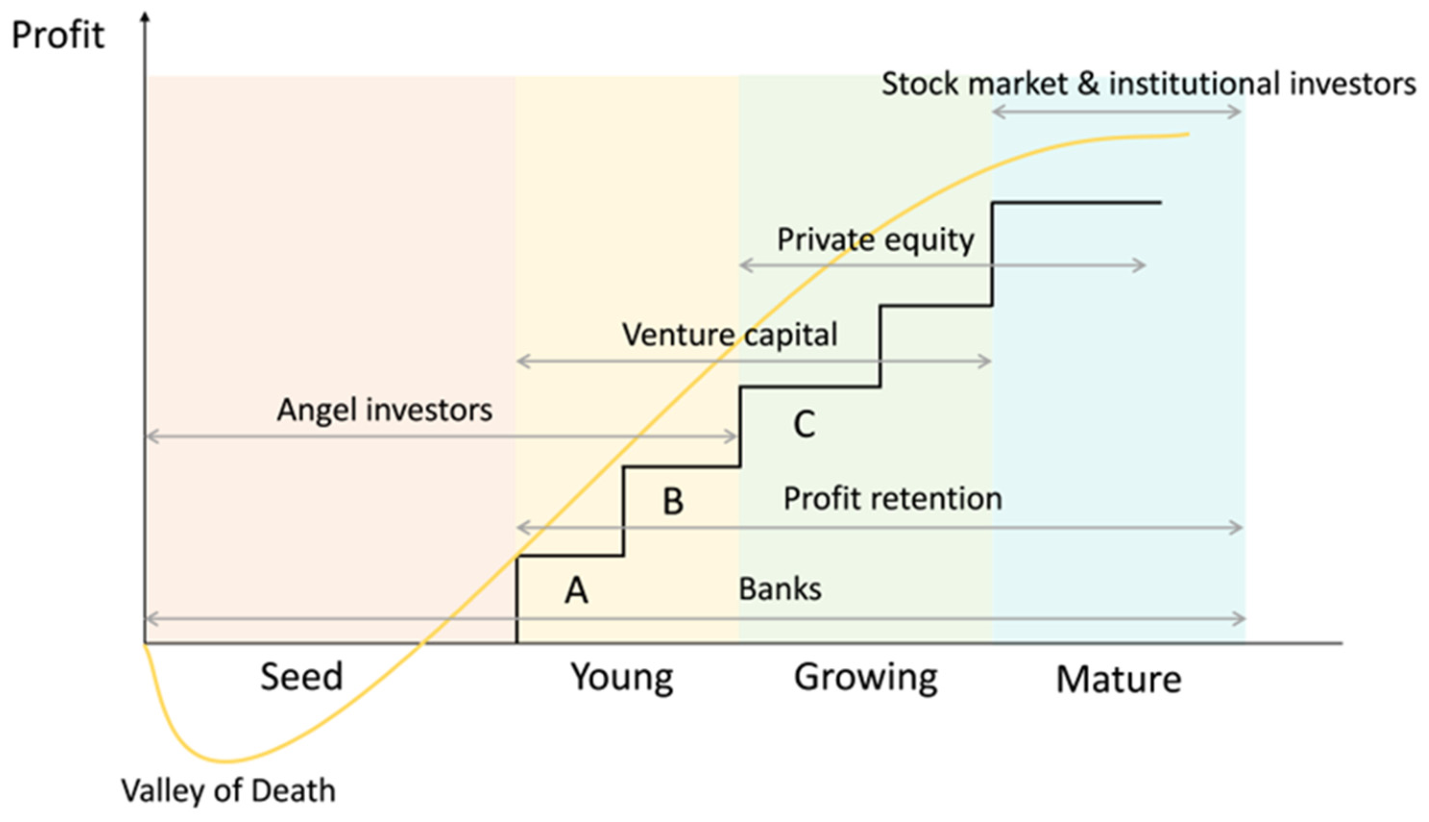
Figure 1. The role of venture capital and emerging roles of other actors in growing businesses. (In this figure, A, B and C correspond to the key financing nodes of Stage A, Stage B and Stage C in the enterprise development process respectively).
Sustainability 18 04992 g001
Figure 2. Schematic diagram for central location.
Sustainability 18 04992 g002
Figure 3. Schematic Diagram for Structural Holes.
Sustainability 18 04992 g003
Figure 4. Venture capital network example.
Sustainability 18 04992 g004
Figure 5. Heterogeneity analysis forest plot.
Sustainability 18 04992 g005
Figure 6. Visualization of the mediating effect. (Note: *** p < 0.01, ** p < 0.05, * p < 0.1. Standard errors in parentheses).
Sustainability 18 04992 g006
Table 1. Variable definitions.
VariableVariable NameVariable Definition
GIGreen technology innovationNumber of green invention patents applied for by the enterprise in the current year
CentralityRelative degree centralityNumber of enterprise relationships/Maximum possible relationships in the network
SHStructural holeThe degree to which an enterprise possesses non-redundant relationships within its network
SizeEnterprise sizeNatural logarithm of total enterprise assets
ROAReturn on total assetsNet profit after tax/total assets
LevLeverage ratioTotal liabilities/total assets
AgeEnterprise ageNumber of years from the enterprise’s founding to the observation year
IndepPercentage of independent directorsNumber of independent directors/Number of directors
DualCombined rolesTake the value of 1 if the chairman and the general manager are the same person; and 0 otherwise
INSTPercentage of shares held by institutional investorsTotal shares held by institutional investors/Total outstanding shares
Table 2. Descriptive statistics.
VariableNMeanSDMinMax
GI55664.04017.5910.000494.000
Centrality55660.0020.0170.0000.166
SH55660.0940.4640.0003.715
Size556620.6814.6070.00027.299
ROA55660.0310.086−2.1200.542
Lev55660.3290.1950.0001.004
Age55662.8700.3011.6093.761
Indep556636.3519.3810.00060.000
Dual55660.4200.4940.0001.000
INST55660.3090.2420.0000.920
Table 3. Regression results of the baseline model.
Variable(1)(2)(3)(4)
GIGIGIGI
Centrality8.651 ***
(2.217)
5.319 ***
(2.056)
SH 0.389 ***
(0.090)
0.219 **
(0.085)
Size 0.192 *
(0.105)
0.184 *
(0.105)
ROA 1.430
(1.416)
1.440
(1.413)
Lev 1.426 **
(0.584)
1.435 **
(0.582)
Age −0.478
(0.336)
−0.476
(0.336)
Indep 0.002
(0.015)
0.002
(0.015)
Dual 0.439 ***
(0.139)
0.448 ***
(0.140)
INST 0.595 ***
(0.282)
0.590 **
(0.283)
Constant1.965 ***
(0.102)
−1.949 ***
(0.128)
1.944 ***
(0.102)
−1.863
(2.799)
N5560556055605560
Pseudo_R20.29480.37420.29830.3750
Year FEYESYESYESYES
Industry FEYESYESYESYES
Province FEYESYESYESYES
Note: *** p < 0.01, ** p < 0.05, * p < 0.1. Standard errors in parentheses.
Table 4. Results of the endogeneity tests.
VariableExplanatory Variable Lagged by One PeriodDependent Variable Lagged by One Period
(1)(2)(3)(4)
GIGIGIGI
L_GI 0.007 ***
(0.001)
0.007 ***
(0.001)
L_centrality5.262 ***
(2.037)
L_SH 0.227 **
(0.089)
centrality 6.395 ***
(1.623)
SH 0.302 ***
(0.084)
Size0.210 **
(0.103)
0.016
(0.044)
0.013
(0.042)
ROA1.270
(1.466)
1.567 *
(0.827)
1.571 *
(0.810)
Lev1.308 **
(0.602)
1.517 ***
(0.425)
1.511 ***
(0.422)
Age−0.519
(0.388)
−0.267
(0.300)
−0.265
(0.296)
Indep0.003
(0.016)
0.011
(0.011)
0.011
(0.011)
Dual0.475 ***
(0.138)
0.200
(0.132)
0.206
(0.131)
INST0.596 **
(0.291)
0.712 **
(0.286)
0.687 **
(0.287)
Constant−2.295
(2.899)
−1.986
(2.977)
0.739
(1.313)
0.808
(1.286)
N4608460846084608
Pseudo_R20.38760.38870.45610.4584
Year FEYESYESYESYES
Industry FEYESYESYESYES
Province FEYESYESYESYES
Note: *** p < 0.01, ** p < 0.05, * p < 0.1. Standard errors in parentheses.
Table 5. Results of the robustness test.
VariableReplace Explanatory VariableReplace Dependent VariableAdjusting the Event Window
(1)(2)(3)(4)(5)
GIGI_CitationGI_CitationGIGI
PageRank0.137 ***
(0.034)
Centrality 4.241 ***
(1.503)
5.886 ***
(1.962)
SH 0.205 ***
(0.058)
0.276 ***
(0.095)
Size0.159 **
(0.070)
0.074 *
(0.039)
0.073 *
(0.038)
0.181 *
(0.103)
0.150
(0.099)
ROA1.450 *
(0.869)
1.124 *
(0.643)
1.106 *
(0.639)
1.439
(1.422)
1.433
(1.412)
Lev1.458 ***
(0.340)
0.644 *
(0.359)
0.637 *
(0.358)
1.432 **
(0.581)
1.455 **
(0.572)
Age−0.460 **
(0.191)
−0.586 *
(0.314)
−0.586 *
(0.309)
−0.497
(0.337)
−0.496
(0.342)
Indep0.001
(0.010)
−0.027 *
(0.016)
−0.026 *
(0.016)
0.002
(0.015)
0.003
(0.015)
Dual0.466 ***
(0.087)
0.004
(0.137)
0.005
(0.136)
0.428 ***
(0.137)
0.417 ***
(0.138)
INST0.577 ***
(0.174)
0.353
(0.327)
0.338
(0.327)
0.586 **
(0.284)
0.590 **
(0.284)
Constant−1.348
(1.814)
4.263 ***
(0.867)
4.276 ***
(0.862)
−1.768
(2.773)
−1.139
(2.726)
N55605560556055605560
Pseudo_R20.37810.37600.37800.37620.3792
Year FEYESYESYESYESYES
Industry FEYESYESYESYESYES
Province FEYESYESYESYESYES
Note: *** p < 0.01, ** p < 0.05, * p < 0.1. Standard errors in parentheses.
Table 6. Grouping test based on the ownership of enterprises.
VariableState-OwnedPrivateForeign-InvestedState-OwnedPrivateForeign-Invested
(1)(2)(3)(4)(5)(6)
GIGIGIGIGIGI
Centrality−0.072
(0.067)
0.081 ***
(0.028)
1.918 **
(0.879)
SH −0.149 **
(0.068)
0.098 ***
(0.031)
0.607 ***
(0.232)
Size0.350
(0.317)
0.159 **
(0.066)
0.024
(0.062)
0.360
(0.314)
0.152 **
(0.066)
0.027
(0.062)
ROA−1.561
(1.531)
1.574 *
(0.913)
0.889
(2.539)
−1.375
(1.514)
1.592 *
(0.915)
0.212
(2.564)
Lev−0.028
(0.715)
1.285 ***
(0.327)
1.755 *
(0.961)
0.050
(0.696)
1.285 ***
(0.325)
1.711 *
(0.950)
Age0.322
(0.409)
−0.669 ***
(0.204)
−0.650
(0.399)
0.249
(0.403)
−0.662 ***
(0.204)
−0.691 *
(0.402)
Indep−0.023
(0.022)
0.002
(0.011)
−0.010
(0.022)
−0.020
(0.022)
0.002
(0.011)
−0.011
(0.022)
Dual−0.064
(0.234)
0.457 ***
(0.084)
0.539
(0.358)
−0.103
(0.231)
0.467 ***
(0.084)
0.582
(0.363)
INST−0.225
(0.473)
0.646 ***
(0.191)
−0.619
(0.794)
−0.144
(0.457)
0.639 ***
(0.192)
−0.679
(0.800)
Constant−5.109
(7.060)
−0.656
(1.820)
2.632 *
(1.381)
−5.328
(7.002)
−0.523
(1.813)
2.596 *
(1.363)
N33950281903395028190
Pseudo_R20.62930.40490.37400.63360.40580.3789
Year FEYESYESYESYESYESYES
Industry FEYESYESYESYESYESYES
Province FEYESYESYESYESYESYES
Note: *** p < 0.01, ** p < 0.05, * p < 0.1. Standard errors in parentheses.
Table 7. Grouping test based on the ESG performance of enterprises.
VariableHigh ESG PerformancePoor ESG PerformanceHigh ESG PerformancePoor ESG Performance
(1)(2)(3)(4)
GIGIGIGI
Centrality0.090
(0.138)
9.982 **
(3.903)
SH −0.051
(0.124)
1.632 **
(0.638)
Size0.020
(0.114)
0.067
(0.069)
0.029
(0.117)
0.067
(0.069)
ROA−3.450 *
(1.788)
−8.738 ***
(2.951)
−3.455 *
(1.779)
−8.738 ***
(2.951)
Lev2.381 **
(1.036)
−1.059
(1.105)
2.371 **
(1.046)
−1.059
(1.105)
Age0.122
(0.333)
0.228
(0.399)
0.076
(0.326)
0.228
(0.399)
Indep0.021
(0.019)
0.026
(0.036)
0.022
(0.019)
0.026
(0.036)
Dual0.190
(0.247)
0.014
(0.409)
0.159
(0.255)
0.014
(0.409)
INST1.535 **
(0.653)
0.834
(0.737)
1.597 **
(0.677)
0.834
(0.737)
Constant0.310
(2.371)
0.692
(1.392)
0.191
(2.430)
−0.383
(1.226)
N304267304267
p-Fisher0.0000.000
Pseudo_R20.71400.45190.71410.4519
Year FEYESYESYESYES
Industry FEYESYESYESYES
Province FEYESYESYESYES
Note: *** p < 0.01, ** p < 0.05, * p < 0.1. Standard errors in parentheses.
Table 8. Results of the mediation analysis.
Variable(1)(2)(3)(4)(5)(6)
GIRDPersonGIGIRDSpendSumGI
SH0.219 **
(0.085)
0.019 **
(0.008)
0.180 ***
(0.068)
0.219 **
(0.085)
0.010 ***
(0.003)
0.117 *
(0.066)
RDPerson 0.478 ***
(0.060)
RDSpendSum 0.531 ***
(0.053)
Size0.184 *
(0.105)
0.008 ***
(0.002)
0.005
(0.027)
0.184 *
(0.105)
0.003***
(0.001)
−0.025
(0.023)
ROA1.440
(1.413)
0.261 ***
(0.050)
0.525
(1.299)
1.440
(1.413)
0.078 ***
(0.017)
0.337
(1.181)
Lev1.435 **
(0.582)
0.243 ***
(0.029)
0.923
(0.589)
1.435 **
(0.582)
0.065 ***
(0.009)
0.915 *
(0.553)
Age−0.476
(0.336)
0.011
(0.016)
−0.516
(0.337)
−0.476
(0.336)
−0.013 **
(0.005)
−0.402
(0.319)
Indep0.002
(0.015)
−0.004 ***
(0.001)
0.013
(0.014)
0.002
(0.015)
−0.002 ***
(0.000)
0.020
(0.014)
Dual0.448 ***
(0.140)
−0.004
(0.009)
0.381 ***
(0.127)
0.448 ***
(0.140)
−0.002
(0.003)
0.376 ***
(0.126)
INST0.590 **
(0.283)
0.077 ***
(0.021)
0.405
(0.277)
0.590 **
(0.283)
0.035 ***
(0.007)
0.145
(0.256)
Constant−1.863
(2.799)
1.540 ***
(0.049)
−0.755
(1.160)
−1.863
(2.799)
2.885 ***
(0.015)
−7.710 ***
(1.532)
N556055405538556055505548
Pseudo_R20.37500.01720.41370.37500.00490.4334
Year FEYESYESYESYESYESYES
Industry FEYESYESYESYESYESYES
Province FEYESYESYESYESYESYES
Note: *** p < 0.01, ** p < 0.05, * p < 0.1. Standard errors in parentheses.
Disclaimer/Publisher’s Note: The statements, opinions and data contained in all publications are solely those of the individual author(s) and contributor(s) and not of MDPI and/or the editor(s). MDPI and/or the editor(s) disclaim responsibility for any injury to people or property resulting from any ideas, methods, instructions or products referred to in the content.