Article

A Study on Summer Thermal Comfort in Chongqing Riverside Parks: Based on Microclimate Measurements and Thermal Comfort Evaluation


School of Architecture and Urban Planning, Chongqing Jiaotong University, Chongqing 400074, China
*
Author to whom correspondence should be addressed.
Sustainability 2026, 18(10), 4990; https://doi.org/10.3390/su18104990
Submission received: 1 April 2026 / Revised: 7 May 2026 / Accepted: 12 May 2026 / Published: 15 May 2026

Abstract

As a mountain–water city in the upper Yangtze River region, Chongqing is characterized by complex river-valley terrain, dense riverside development, extreme summer heat, high humidity, and frequent calm-wind conditions. Existing studies on waterfront thermal comfort mainly focus on plain cities, whereas mountainous riverside parks remain insufficiently understood. This study investigated summer thermal comfort in three riverside parks in Chongqing—Jiulongtan Park, Coral Park, and Jiangtan Park—through field measurements of air temperature, black globe temperature, wind speed, relative humidity, and Thermal Radiation, combined with thermal sensation vote (TSV) and thermal comfort vote (TCV) surveys. Results showed that the maximum air temperature reached 43.7 °C and the maximum black globe temperature reached 61.6 °C. The hydrophilic layer recorded the highest wind speed (1.64 ± 0.39 m/s), while the elastic layer showed high PET values (36.00–46.10 °C). Regression analysis indicated neutral PET values of 32.49–35.74 °C. Correlation analysis showed that PET, mean thermal sensation vote (MTSV), and mean thermal comfort vote (MTCV) were positively correlated with air temperature, black globe temperature, mean radiant temperature (Tmrt), and relative humidity. In contrast, PET was negatively correlated with wind speed. This study reveals the coupled effects of river-valley terrain, elevation stratification, waterfront microclimate, and landscape elements on outdoor thermal comfort, providing a scientific basis for optimizing shading, ventilation, and hydrophilic spaces in hot-humid mountain–water cities.

1. Introduction

The construction of ecological civilization is closely related to national sustainable development and is a strategic priority that must be continuously promoted [1,2]. Global warming continues to intensify. According to the China Climate Change Blue Book (2025), China’s annual mean temperature in 2024 exceeded the baseline by 1.0 °C for the first time, making it the warmest year since 1901. Long-term monitoring data from 1961 to 2024 also show a significant upward trend in China’s annual mean temperature, with an average increase of 0.31 °C per decade [3]. Against this climatic background, cities with complex terrain and dense riverside development face more severe outdoor thermal stress during summer heat events. Therefore, improving thermal comfort in riverside public spaces is not only a microclimate design issue but also an important requirement for enhancing the quality of residents’ outdoor activities and urban climate resilience. According to the World Meteorological Organization (WMO), an “extreme heat event” occurs when the daily maximum temperature exceeds 32 °C and persists for at least three consecutive days [4]. Outdoor thermal comfort is closely associated with extreme heat events and is generally evaluated through physiological responses, psychological perceptions, and environmental parameters. To quantitatively characterize human thermal sensation in hot environments, various thermal comfort indices have been developed, including Physiological Equivalent Temperature (PET), Universal Thermal Climate Index (UTCI), Standard Effective Temperature (SET*), Mean Radiant Temperature (Tmrt), and Predicted Mean Vote (PMV) [5,6,7,8]. Among these, PET has become an important tool for quantifying outdoor thermal comfort because it can capture the relationship between the outdoor thermal environment and human thermal equilibrium [9].
Recent studies further suggest that thermal comfort should not be interpreted solely as a function of air temperature. Zhang et al. investigated outdoor thermal comfort across different landscape spaces in urban parks in Chengdu using field meteorological monitoring and questionnaire surveys. They established local neutral temperature ranges based on PET and UTCI [10]. Cai et al. examined outdoor thermal comfort in Wuhan under different protection and activity-intensity conditions, showing that PET-based thermal comfort benchmarks varied significantly with clothing and activity states [11]. In research on building thermal comfort control, Alhamayani et al. indicated that PMV-based thermal comfort evaluation and prediction should consider relative humidity, mean radiant temperature, and solar heat gain rather than relying solely on dry-bulb temperature [12,13]. These studies show that thermal comfort research has shifted from single-temperature-based assessments toward integrated evaluation frameworks that combine objective thermal indices, microclimatic measurements, and subjective human responses. As an important type of urban green space, riverside parks play a key role in regulating outdoor microclimates in waterfront cities and improving the urban living environment [14]. Their microclimatic effects mainly depend on the combined cooling, humidifying, and radiation-shielding functions of vegetation and water bodies. Green spaces within riverside parks can enhance outdoor thermal comfort, contribute to regional climate regulation, and help mitigate the urban heat island effect at the city scale [15,16,17].
At present, urban outdoor thermal comfort research is generally conducted at two spatial scales. The first involves large-scale macro analyses using remote sensing imagery, focusing on the spatial patterns of urban heat islands and their relationships with land use and socioeconomic factors. The second involves small-scale studies based on field measurements or microclimate simulations that examine the effects of local underlying surfaces, vegetation, and water bodies on thermal environments [18]. Methodologically, this field has evolved from early meteorological parameter monitoring to multidimensional evaluation frameworks [19], in which objective indices such as PET are increasingly combined with subjective tools, including the Thermal Sensation Vote (TSV) and the Thermal Comfort Vote (TCV) [20,21,22]. However, most existing studies on riverside thermal comfort have been conducted in relatively flat urban environments, where terrain-induced elevation differences and vertical spatial stratification are less pronounced. In mountain riverfront cities characterized by complex terrain and hot-humid summer conditions, the microclimatic characteristics and human thermal responses remain insufficiently understood [23,24,25]. In contrast, Chongqing’s riverside parks are embedded in a mountain–water urban landscape formed by river-valley terrain, large elevation differences, fluctuating waterfront spaces, dense built-up areas, and diverse vegetation and surface materials. These conditions may modify wind movement, solar exposure, humidity distribution, and human thermal perception, making the thermal comfort mechanisms of Chongqing’s riverside parks differ from those of plain-city waterfront parks.
This study integrates the mountain–water urban landscape perspective with field microclimate monitoring, PET calculation, and subjective TSV/TCV evaluation to investigate thermal comfort in riverside parks under hot-humid mountainous conditions. Unlike conventional outdoor thermal comfort studies that primarily evaluate PET and subjective thermal responses in general urban open spaces, this study focuses on how elevation stratification, hydrophilic spaces, shading, and underlying surface types jointly shape thermal comfort in Chongqing’s riverside parks. By analyzing field data collected during summer heat events and examining the relationships among microclimatic variables, PET, TSV, and TCV, this study systematically evaluates outdoor thermal comfort in riverside parks. The findings are expected to provide scientific evidence for microclimate-sensitive design and the optimization of thermal comfort in riverside public spaces in hot-humid mountain–water cities.

2. Materials and Methods

2.1. Study Samples and Measurement Site Selection

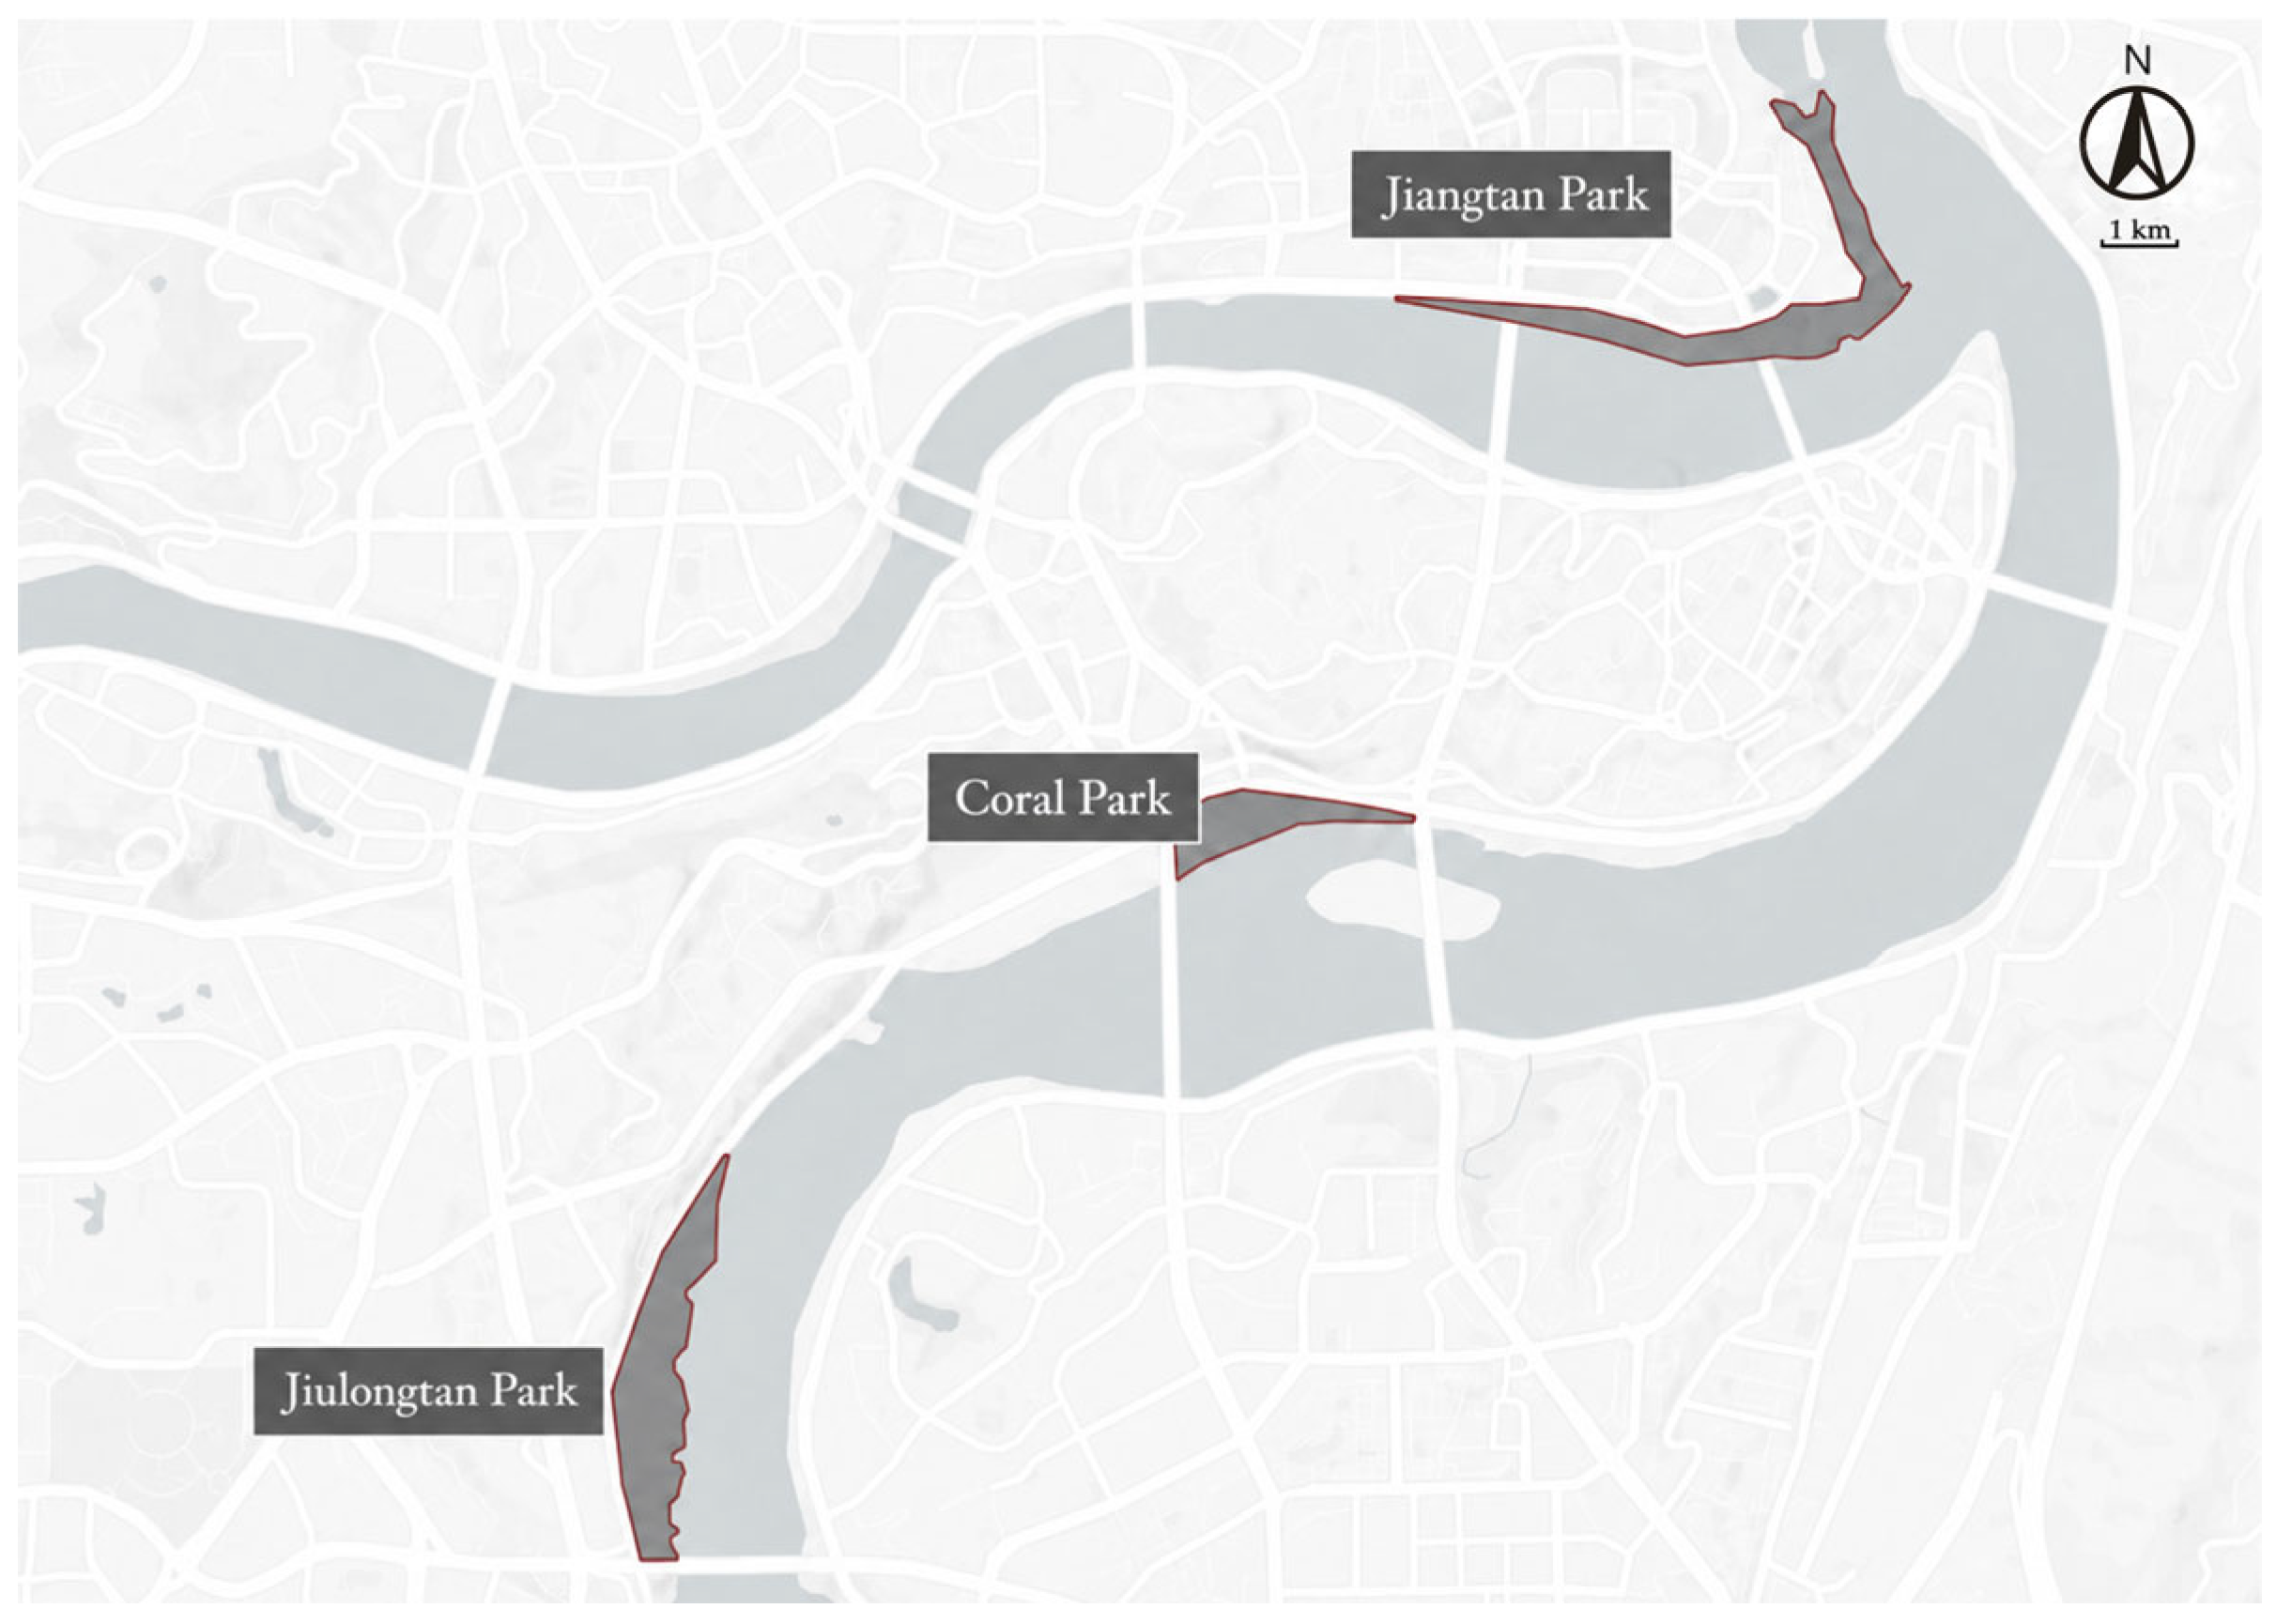
Chongqing is situated in a climate zone with hot summers and cold winters, characterized by a humid, rainy spring, a hot and humid summer, a pleasant, cool autumn, and a gloomy, snow-scarce winter. The average summer temperature in the city center is 27.8 °C, while the winter average is 9.1 °C. The central urban area of Chongqing is located at 106°33′19.6″ E and 29°33′49.1″ N, with an average elevation of 259 m. Three typical riverside parks—Jiulongtan Park, Coral Park, and Jiangtan Park—located in the city center were selected as the study samples. All three parks are part of Chongqing’s “Two Rivers and Four Banks” public space system and serve as key nodes within the city’s waterfront area. These parks not only serve as vital spaces for urban waterfront ecology and public recreation but also play an essential role in enhancing the spatial functionality of the “Two Rivers and Four Banks” system, shaping the city’s riverside landscape, and improving the quality of regional public spaces.
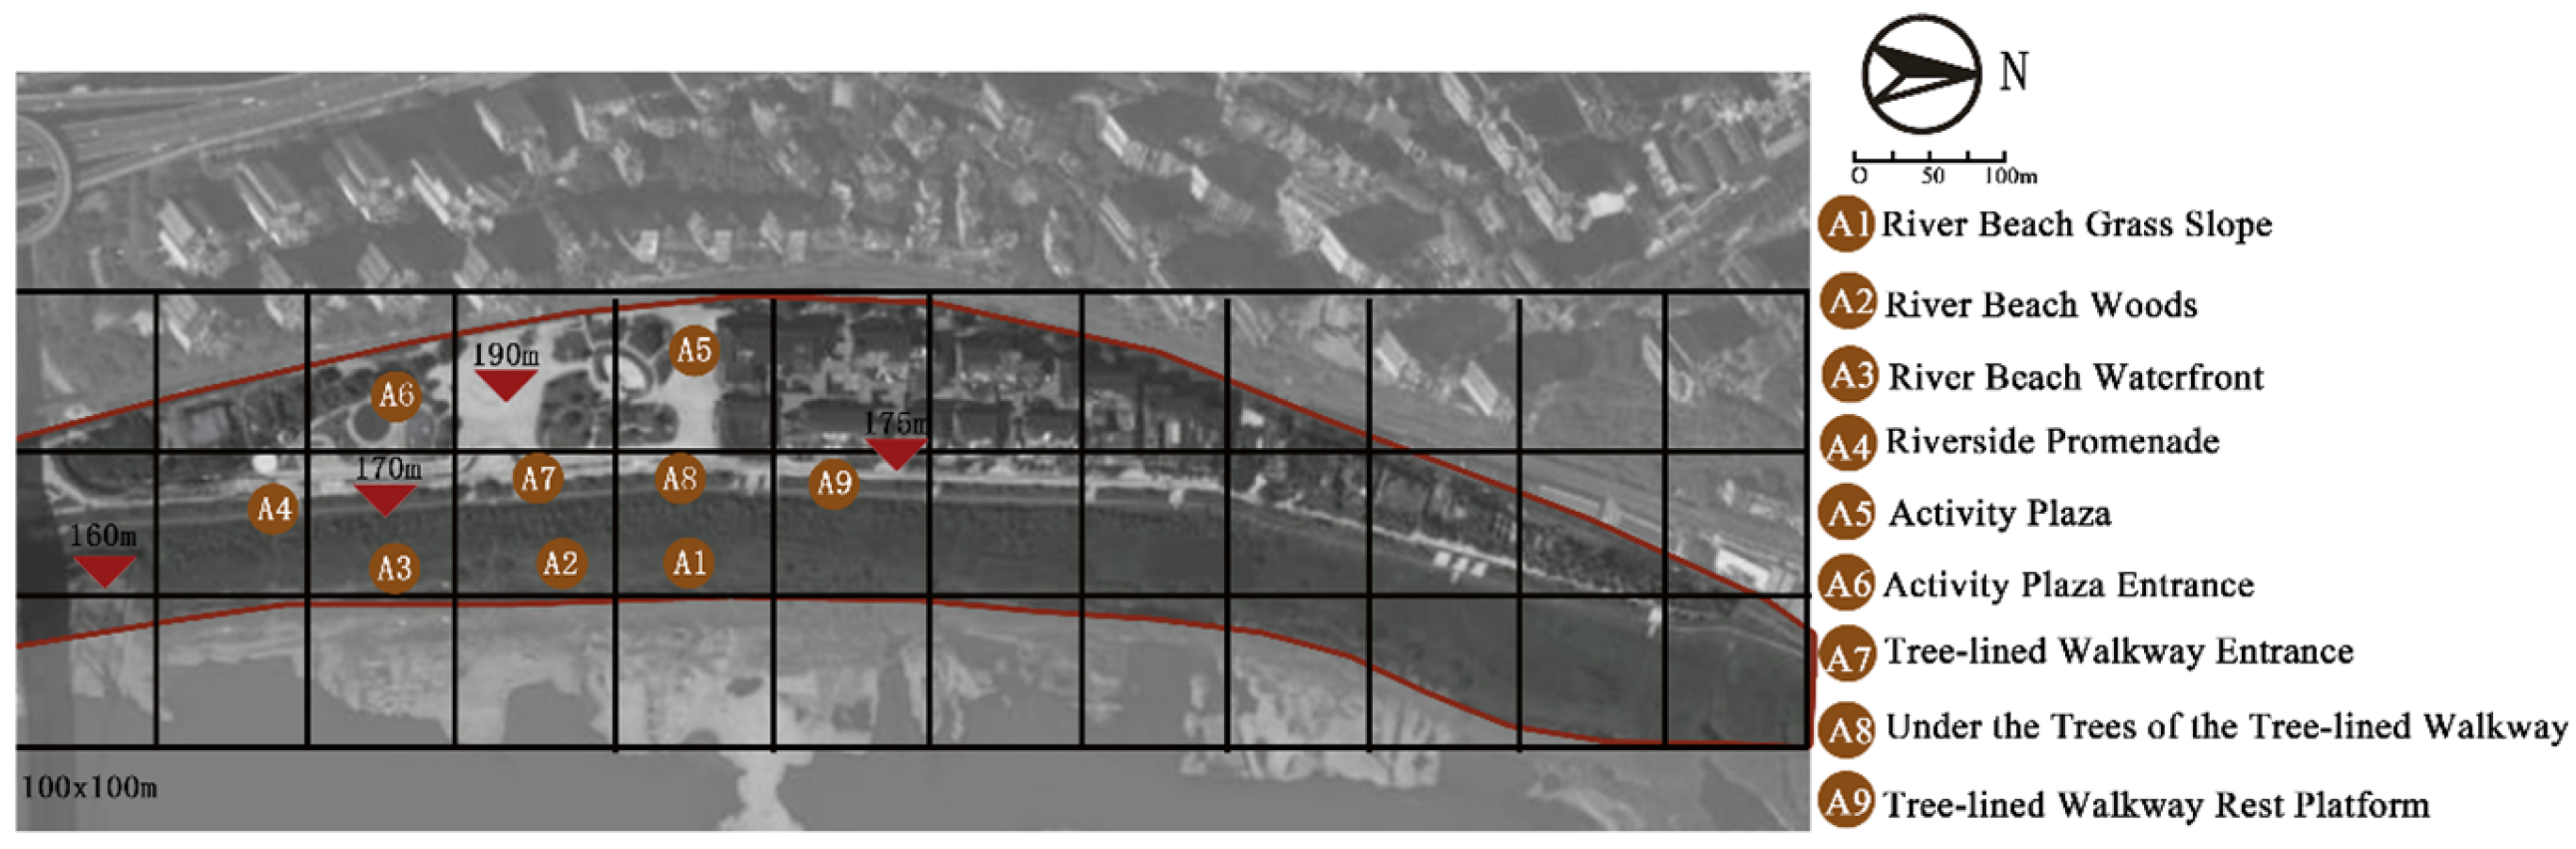
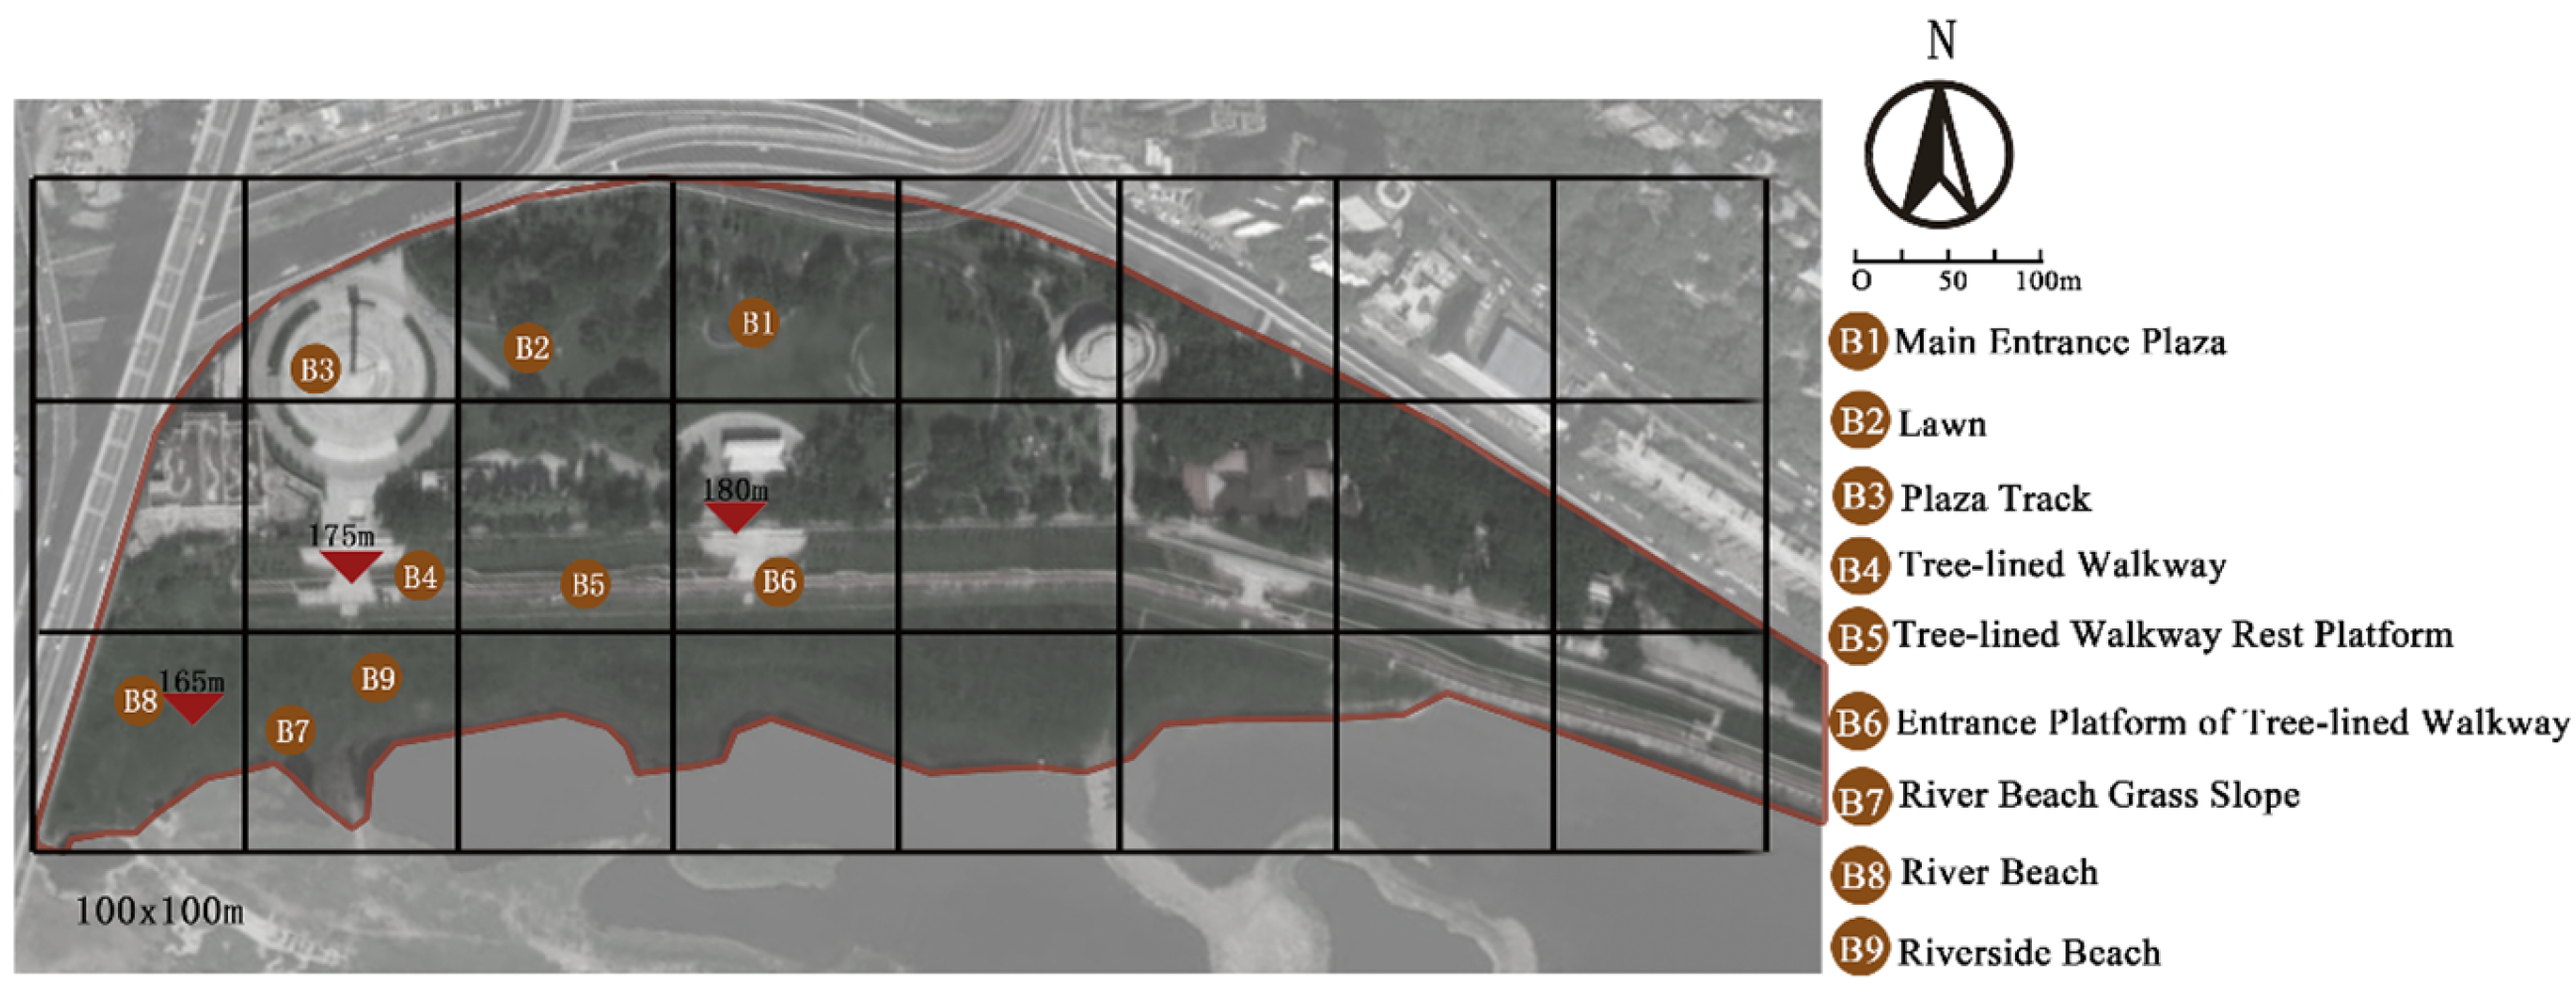
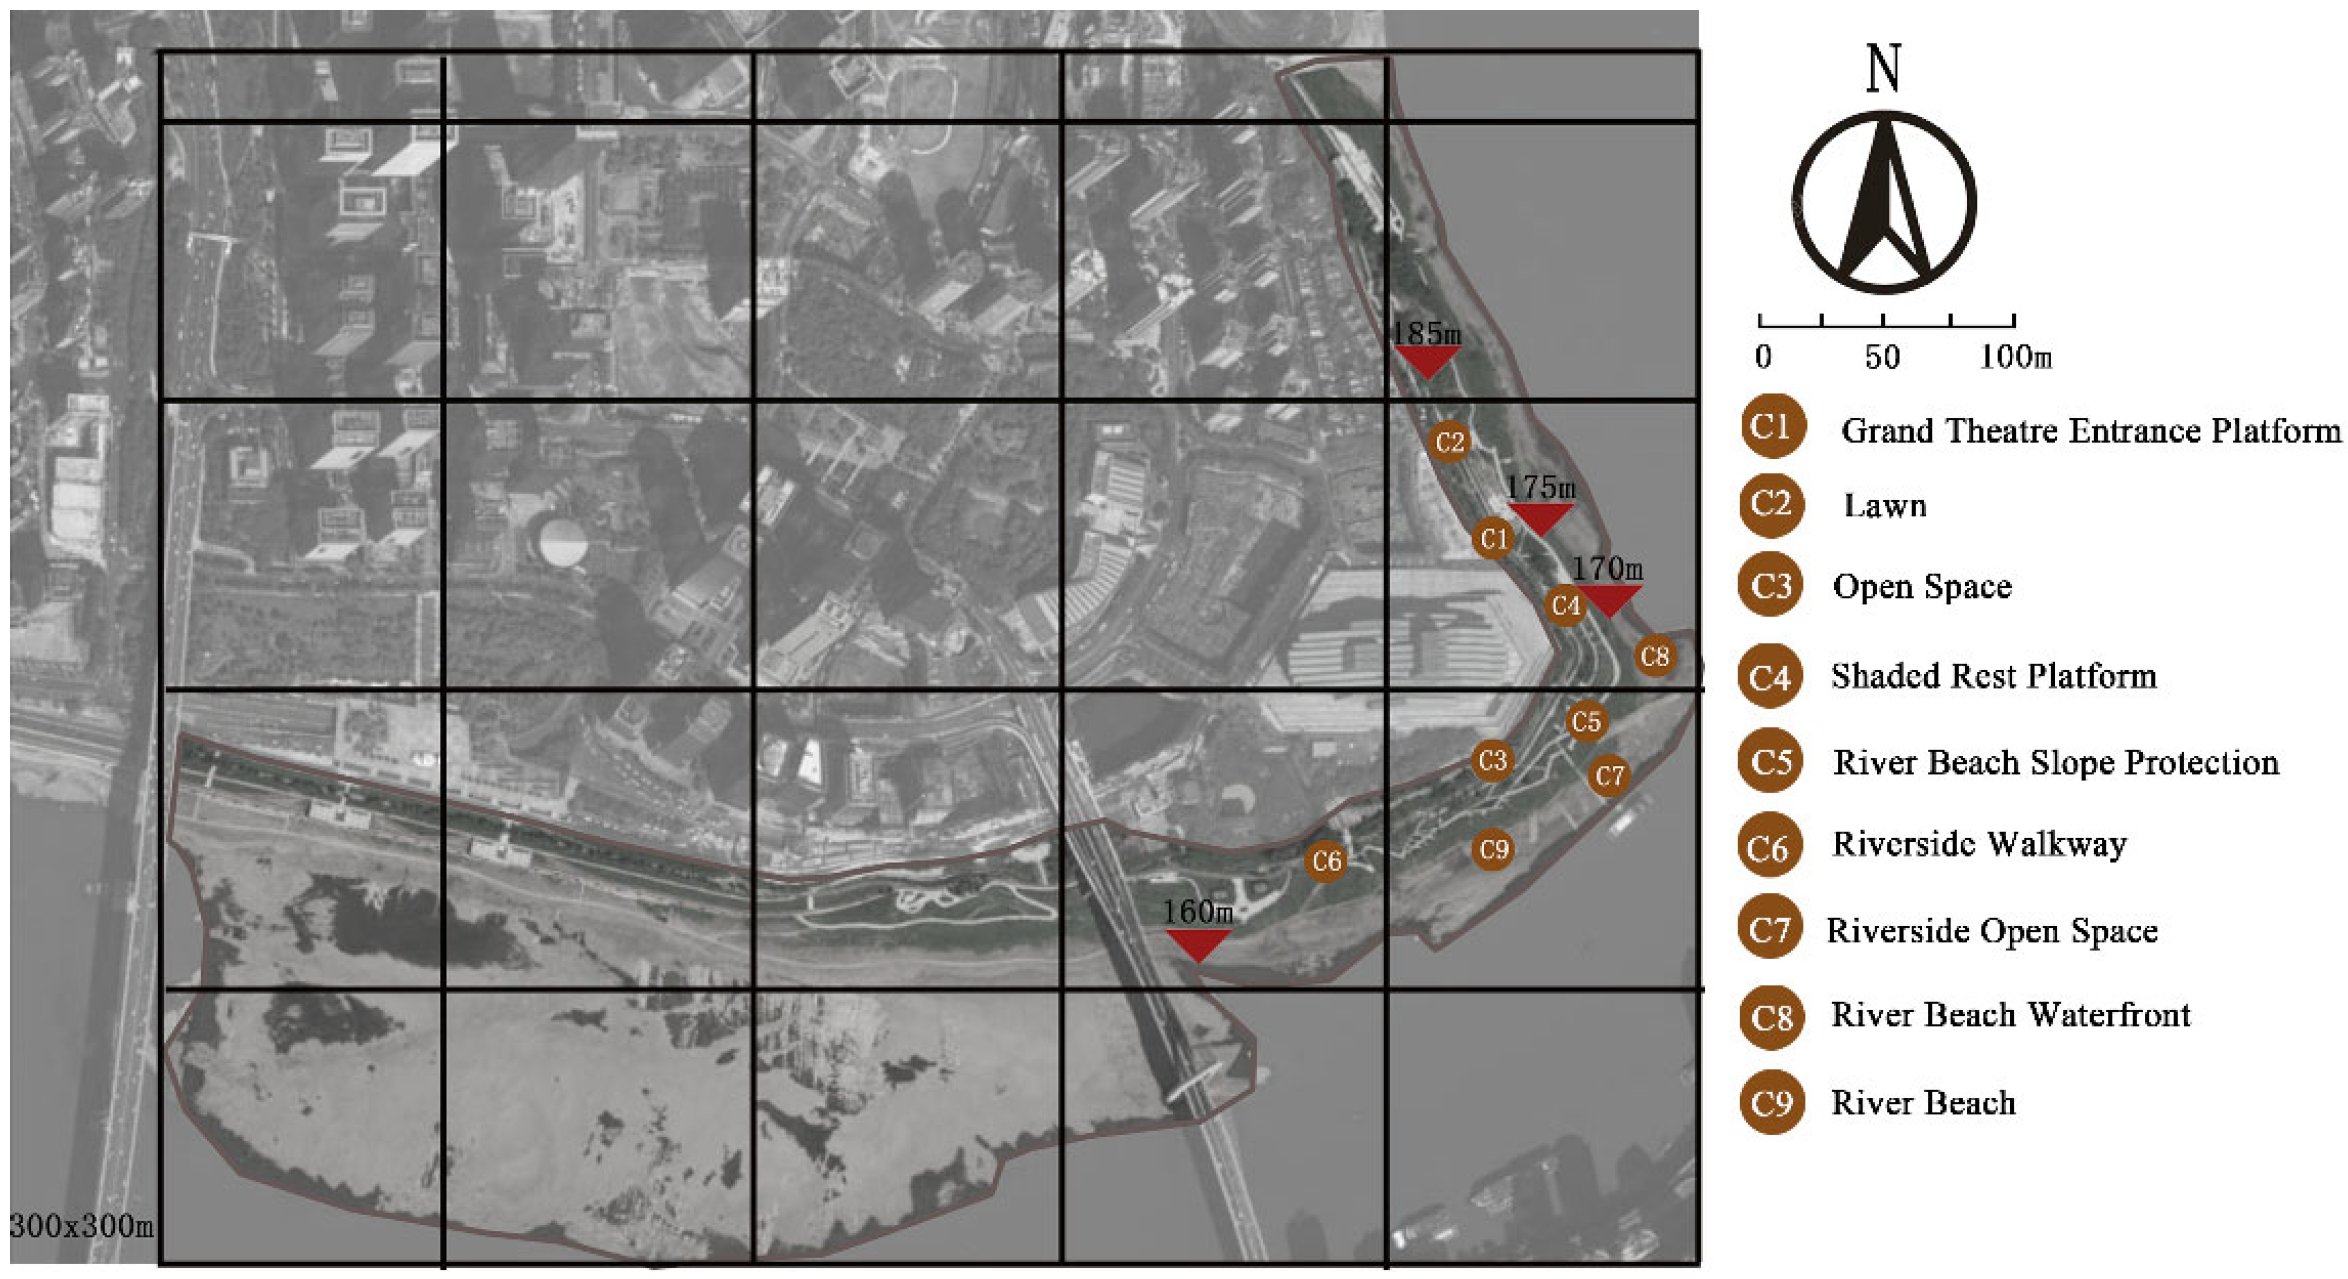
In this study, a grid-based approach was employed to select measurement sites. Jiulongtan Park, Coral Park, and Jiangtan Park were divided into 100 m × 100 m, 100 m × 100 m, and 300 m × 300 m grids, respectively, partitioning each study area into uniform units that served as the foundational elements for subsequent spatial analysis. The grid division was used as a spatial control framework for preliminary site screening rather than as a mechanical rule for placing measurement points at grid centers. Within this grid framework, measurement points were further selected by considering elevation levels, site types, shading conditions, underlying surface materials, accessibility, and patterns of human activity. Therefore, the final measurement points were not evenly distributed within each grid cell but were chosen to represent typical spatial environments across different elevations and landscape conditions. On this basis, considering both the vertical characteristics of Chongqing’s “Two Rivers and Four Banks” riverside spaces and the water-level fluctuations of the Three Gorges Reservoir, elevation-based zoning criteria were established using the waterline as a reference: areas with elevations ≤ 165 m were defined as the hydrophilic layer; areas with 165 m < elevation ≤ 175 m as the elastic layer; and areas with elevations > 175 m as the active layer. It should be noted that this elevation zoning system was applied within each of the three parks, rather than assigning each park to a single elevation type. In other words, Jiulongtan Park, Coral Park, and Jiangtan Park each contained the hydrophilic layer, elastic layer, and active layer, and measurement points were selected from these different elevation levels within each park.
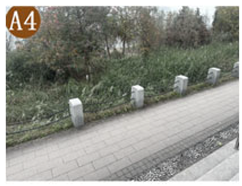
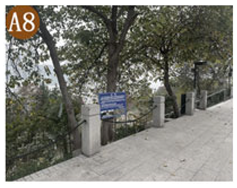
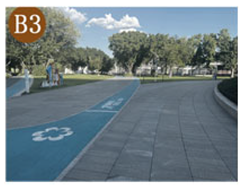
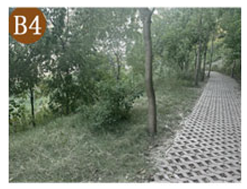
The selection of measurement points accounted for not only elevation gradients across different platform levels but also the diversity of site types. Three measurement points at the lowest water level were located in Informal Green Spaces (IGS) along the riverbank. Shading conditions were categorized as fully shaded, partially shaded, and unshaded, and the Sky View Factor (SVF) was calculated for each measurement point to characterize spatial openness. The SVF at each measurement point was calculated using RayMan (v1.2). During image acquisition, the camera (Nikon Coolpix 4500 digital camera (Nikon Corporation, Tokyo, Japan)) was positioned approximately 1.5 m above the ground, with the lens facing vertically upward, to represent the openness of the sky at pedestrian activity height. Site photographs and information on surrounding obstructions, including tree canopies, buildings, terrain, and other landscape elements, were used to represent local spatial enclosure. SVF values range from 0 to 1, where values closer to 1 indicate more open sky conditions and values closer to 0 indicate stronger spatial enclosure. Following field surveys and considering patterns of human activity, nine measurement points were ultimately selected in each park. The spatial distribution and characteristics of these points are presented in Figure 1, Figure 2, Figure 3 and Figure 4 and Table 1.

2.2. Research Methods

2.2.1. Study Period

Based on weather forecasts and the definition of extreme heat events, field measurements of the thermal environment were taken in Jiulongtan Park, Coral Park, and Jiangtan Park on 17 July 2025 (weekday, sunny, maximum temperature 39.0 °C, average cloud cover 28.8%), 18 July 2025 (weekday, sunny, maximum temperature 38.0 °C, average cloud cover 31.2%), and 19 July 2025 (weekday, partly cloudy, maximum temperature 37.0 °C, average cloud cover 34.8%). Measurements were conducted from 09:00 to 19:00 at two-hour intervals, yielding five observations per day at each measurement site. These three consecutive days were selected because they represented a typical summer heat-event period in Chongqing, with daily maximum temperatures exceeding 37 °C and no rainfall during the measurement period. Therefore, the dataset is suitable for analyzing microclimatic differences and thermal comfort characteristics under typical hot-weather conditions. However, the measurements were not intended to represent the entire summer season or all weather conditions.

2.2.2. Measurement Instruments and Thermal Comfort Metrics

Site elevation was measured using a United GPS handheld device United GPS handheld device (G120BD[M1]) (United Electronics Co., Ltd., Taipei, China). Thermal Radiation intensity in four directions at each measurement point was recorded with a TES-1333 pyranometer (TES Electronic Corp., Taipei, China) (accuracy ±5%, resolution 0.1 W/m2), and the average value was calculated [26]. Black-globe temperature was measured with a Hengxin AZ8758 Black Globe Thermometer (AZ Instrument Corp., Taipei, China) globe thermometer. Air temperature, relative humidity, and wind speed were recorded with a Kestrel 5500 handheld weather meter (Nielsen-Kellerman, Boxborough, MA, USA) handheld weather meter. During field measurements, all microclimatic instruments were placed approximately 1.5 m above the ground to represent human thermal exposure near pedestrian activity height. The instruments were positioned in representative activity areas at each measurement point and kept away from obstacles, building walls, tree trunks, and artificial shading. The original shading condition of each site was retained and recorded as fully shaded, partially shaded, or unshaded. Before formal measurements, all instruments were checked for battery status, sensor stability, and time synchronization, and the main meteorological instruments were cross-checked under the same conditions to ensure data consistency.
Physiological Equivalent Temperature (PET) was used as the indicator of outdoor thermal comfort. PET values were calculated using RayMan (v1.2), with the following physiological parameters: age 35 years, height 175 cm, weight 70 kg, clothing insulation 0.5 clo, and metabolic rate 80 W/m2. Fixed physiological parameters were used in PET calculations to ensure comparability of PET values across different measurement points, elevation levels, and parks. Although respondents’ age, height, and weight were collected via the questionnaire, these variables were primarily used to describe sample characteristics and to interpret differences in subjective thermal responses.

2.2.3. Data Analysis and Processing

Statistical analyses, including correlation and regression analyses, were performed using IBM SPSS Statistics (v27) to explore relationships among PET, TSV, TCV, and microclimatic variables, thereby verifying the scientific validity of the quantitative data and providing reliable statistical support for the study’s conclusions. Origin software was used to visualize the monitored microclimatic variables and survey data. Before correlation and regression analyses, the normality of PET, mean thermal sensation vote (MTSV), mean thermal comfort vote (MTCV), and the main microclimatic variables was examined using the Shapiro–Wilk test in SPSS. The results showed that air temperature, black globe temperature, relative humidity, and mean radiant temperature generally satisfied the normality assumption, whereas PET, MTSV, MTCV, and wind speed did not fully satisfy it. Therefore, Spearman correlation analysis was used to examine the relationships among microclimatic variables, PET, MTSV, and MTCV, thereby improving the robustness of the results. It should be noted that air temperature, black globe temperature, mean radiant temperature, and Thermal Radiation are physically related microclimatic variables, and potential multicollinearity may exist among them. For example, black globe temperature and Tmrt are strongly affected by Thermal Radiation and air temperature. Therefore, the correlation analysis in this study was mainly used to describe the associations among variables rather than to identify the independent contribution of each factor. To avoid multicollinearity in regression modeling, PET was used as an integrated thermal comfort index, and air temperature, black globe temperature, Tmrt, and Thermal Radiation were not simultaneously included as independent variables in the regression models. For the regression analysis, standardized residuals, residual scatter plots, and normal P-P plots were examined to assess model suitability.

2.2.4. Questionnaire Survey

Respondents were randomly selected near each measurement site to participate in a subjective questionnaire survey. The questionnaire consisted of two main parts. The first part addressed respondents’ thermal sensation and thermal comfort, as well as their perceptions and preferences regarding various climatic parameters. Thermal sensation votes (TSV) were recorded on a 7-point scale (cold, −3; cool, −2; slightly cool, −1; neutral, 0; slightly warm, 1; warm, 2; hot, 3), while thermal comfort votes (TCV) were recorded on a 5-point scale (intolerable, 4; very uncomfortable, 3; uncomfortable, 2; slightly comfortable, 1; comfortable, 0). The second part collected respondents’ personal information, including gender, age, clothing, height, and weight. A probability sampling method was employed to maximize the representativeness, randomness, and scientific rigor of the sample. Stratification by elevation level was used to prevent over-concentration of respondents in any single spatial layer. Within each elevation level, respondents were randomly selected at each measurement site. Questionnaires were distributed at fixed intervals at each site, with the starting point predetermined to avoid subjective selection by surveyors and to ensure coverage across peak hours of pedestrian flow. Time-segmented quotas were applied to capture diverse population groups, and each visitor was surveyed only once. During the field study, 360 questionnaires were distributed, of which 309 were valid, yielding a response rate of 85.8%. The valid questionnaires covered the three parks, different elevation levels, shading environments, and survey periods, which helped reflect visitors’ subjective thermal responses under different spatial and temporal conditions. Although the number of refusals was not systematically recorded, the high valid response rate and the stratified, time-segmented sampling strategy helped improve the representativeness of the questionnaire data.

3. Thermal Environment Analysis During Hot-Weather Conditions in Riverside Parks

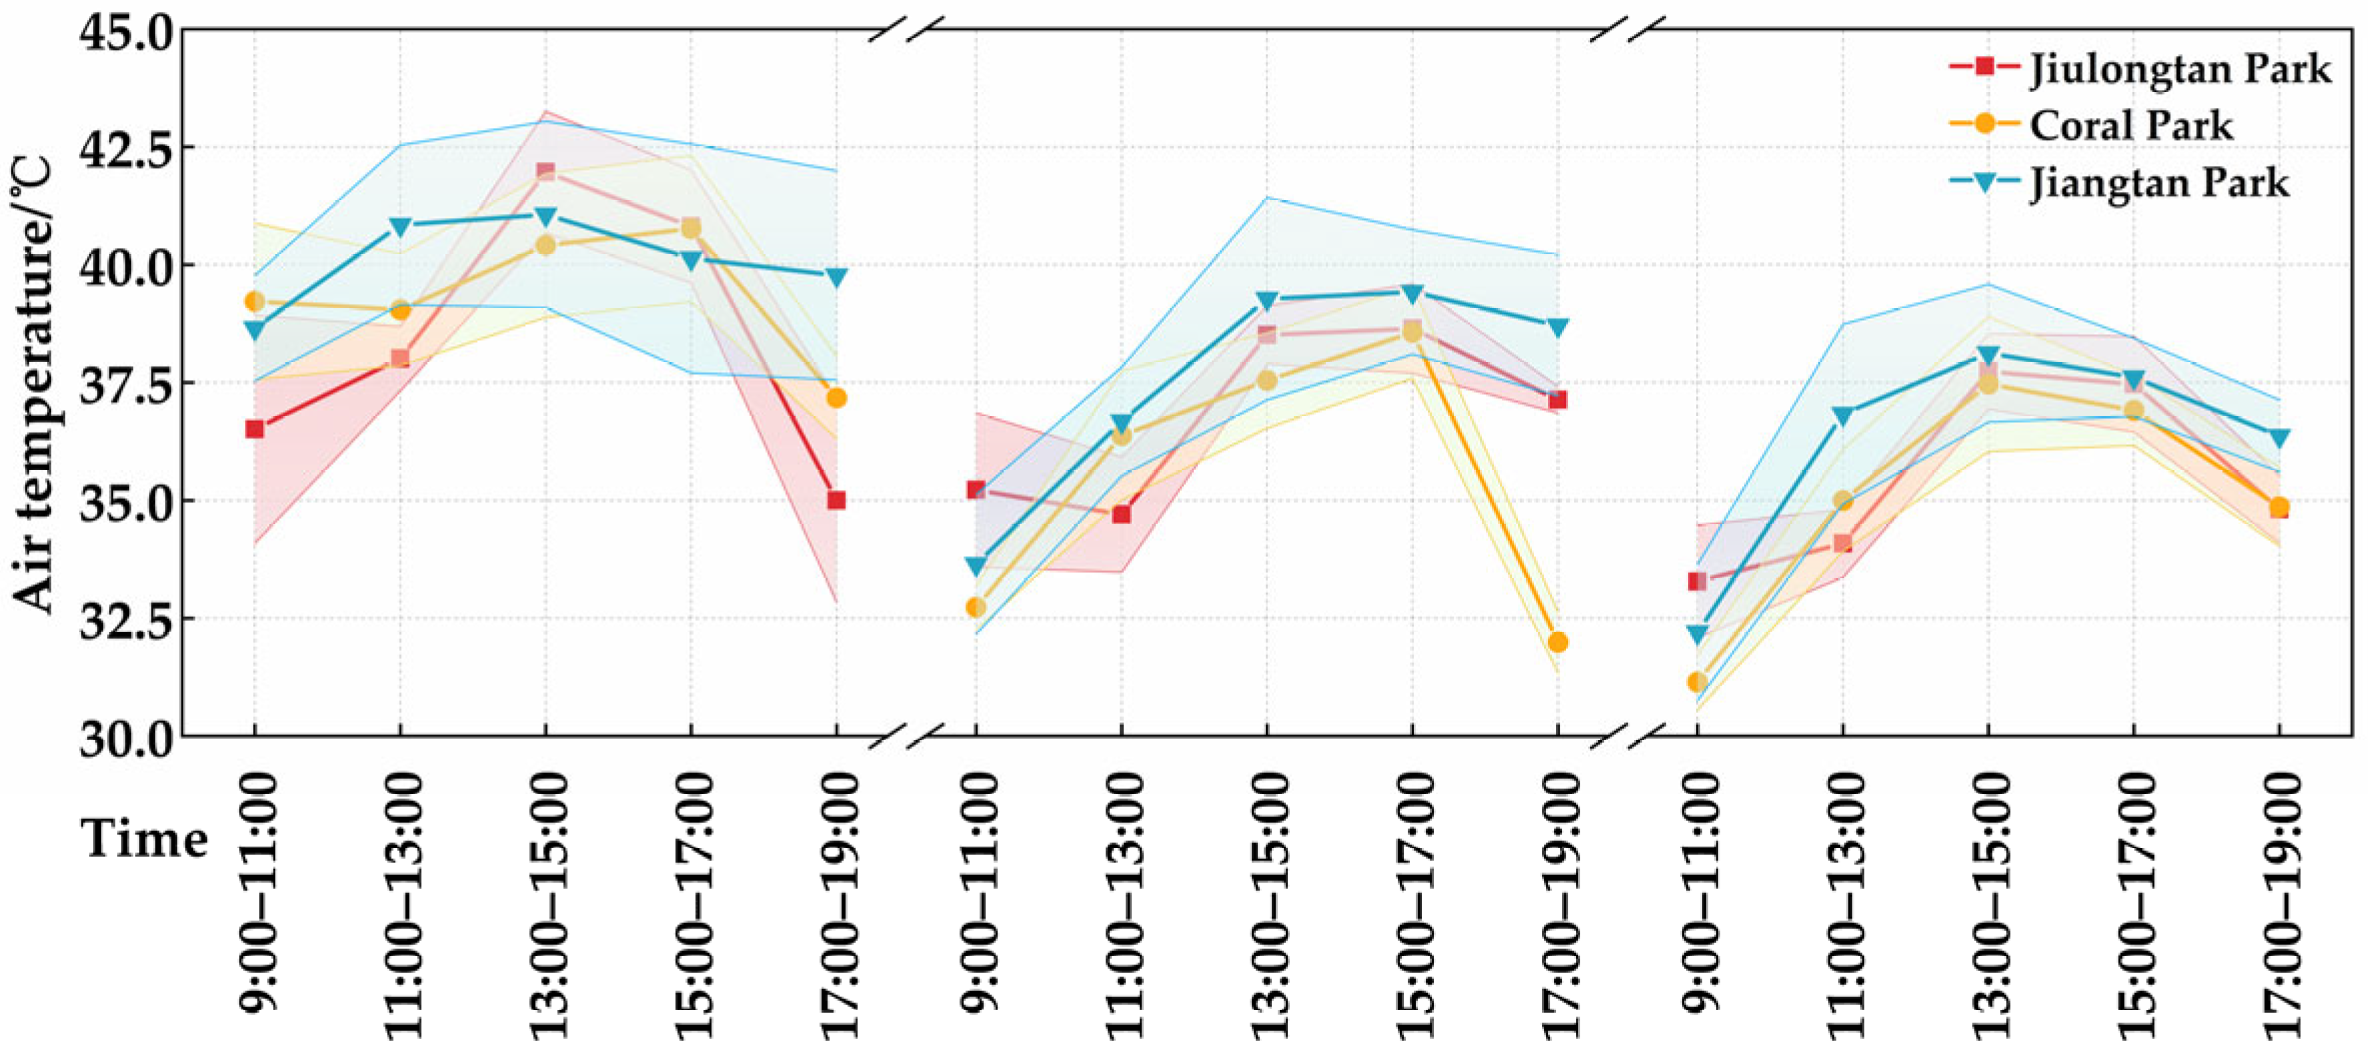
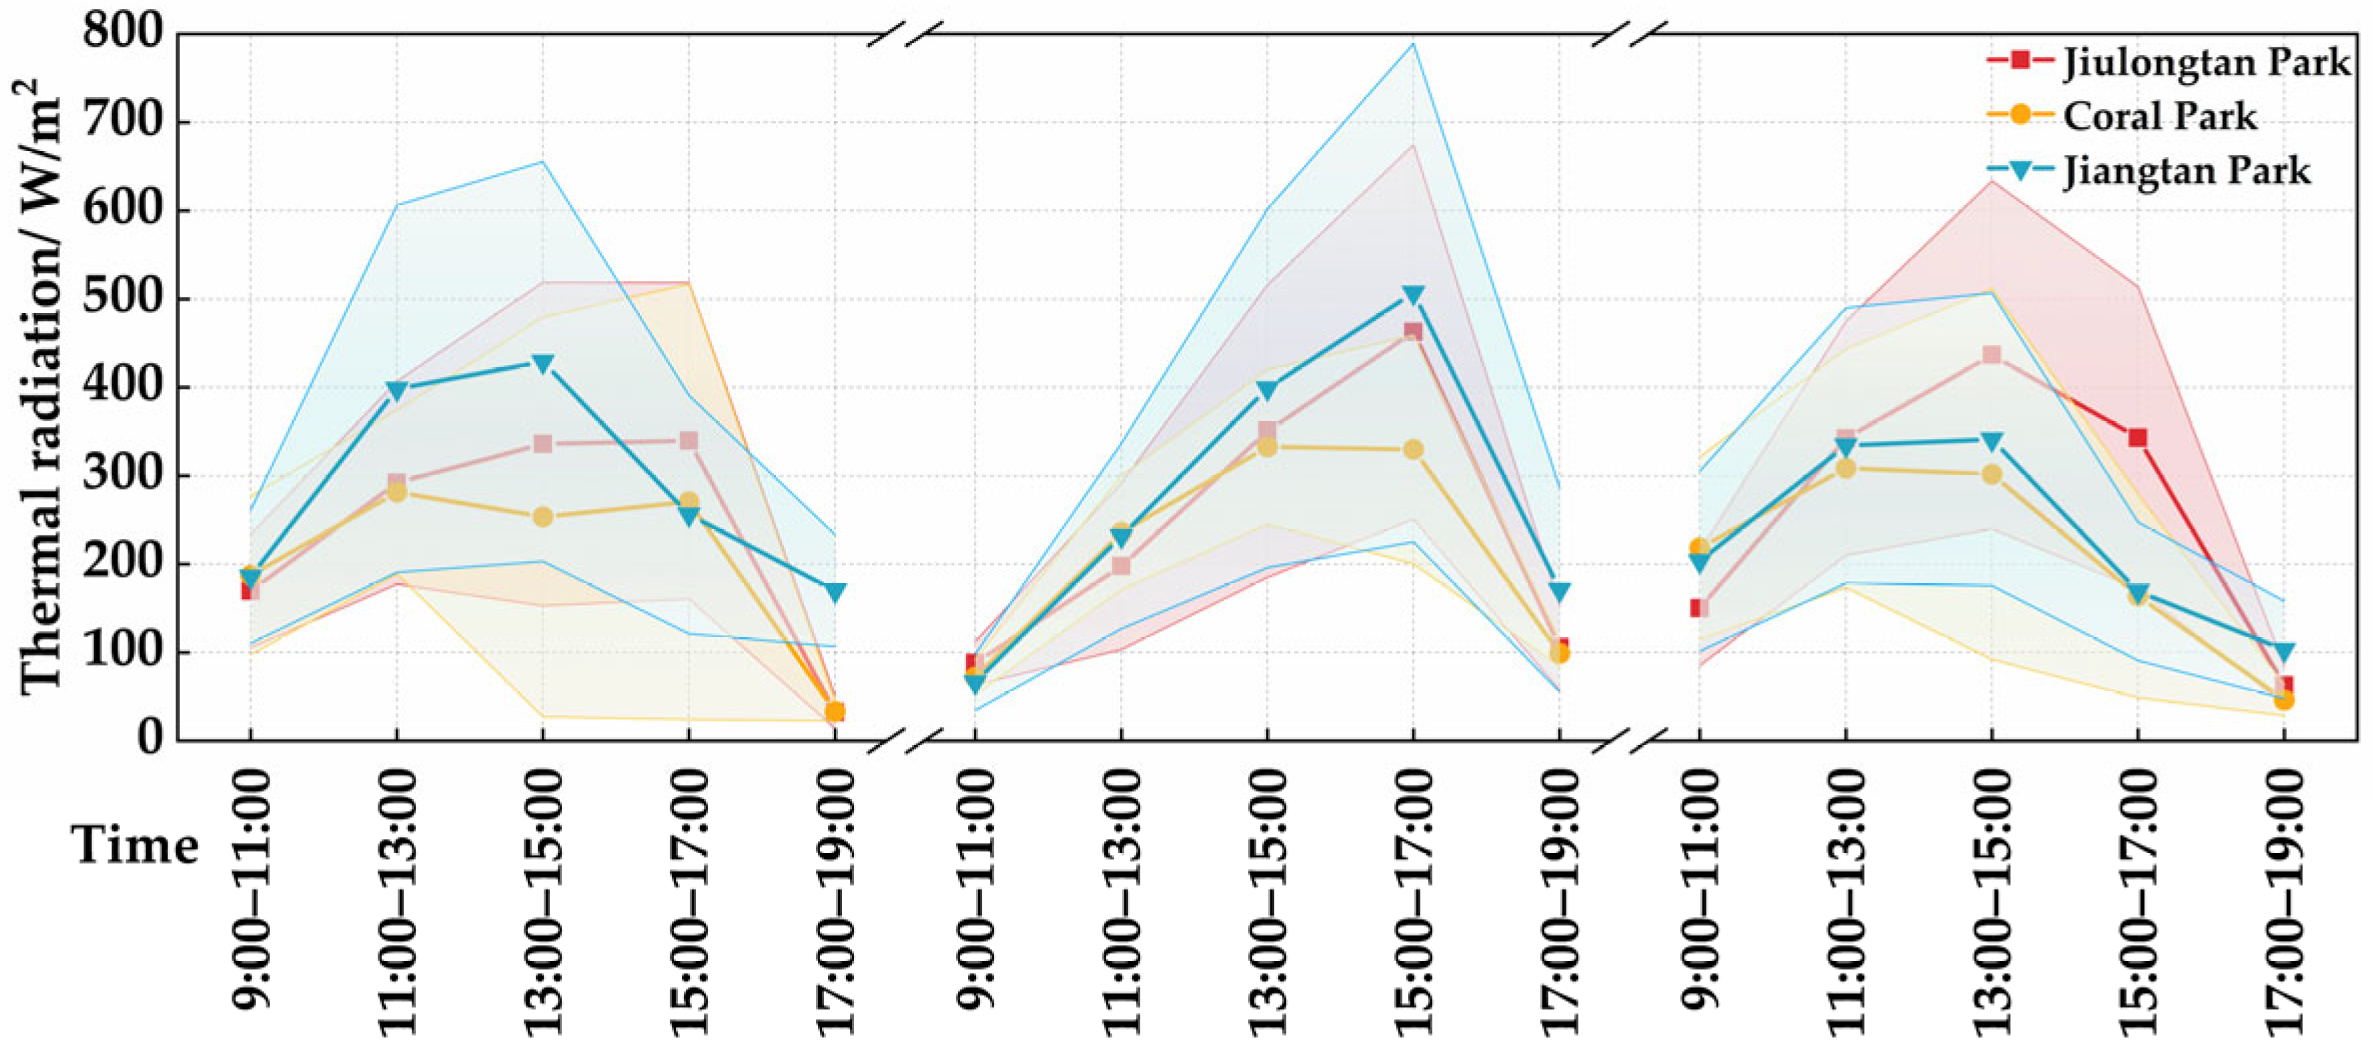
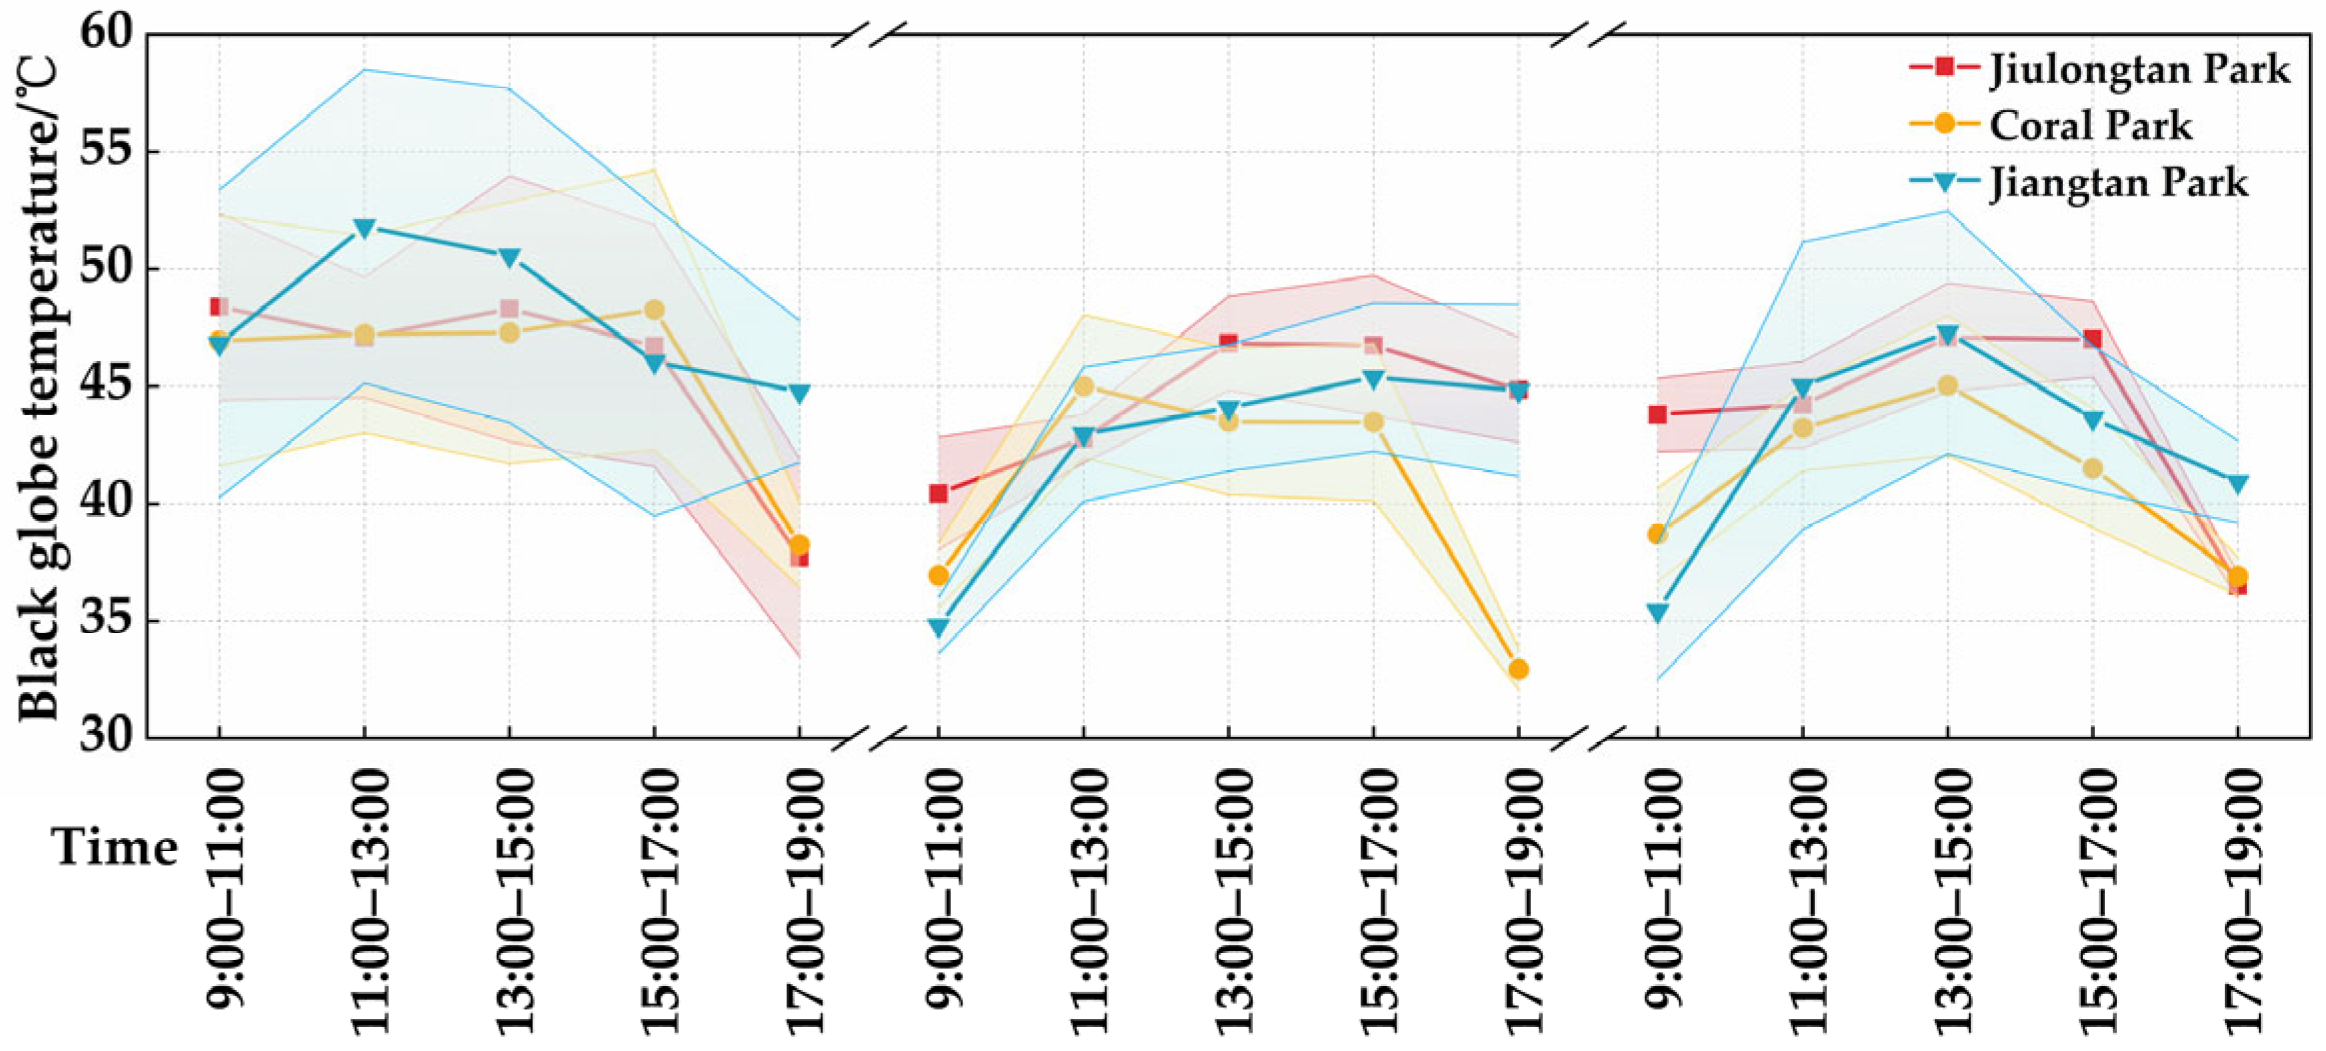
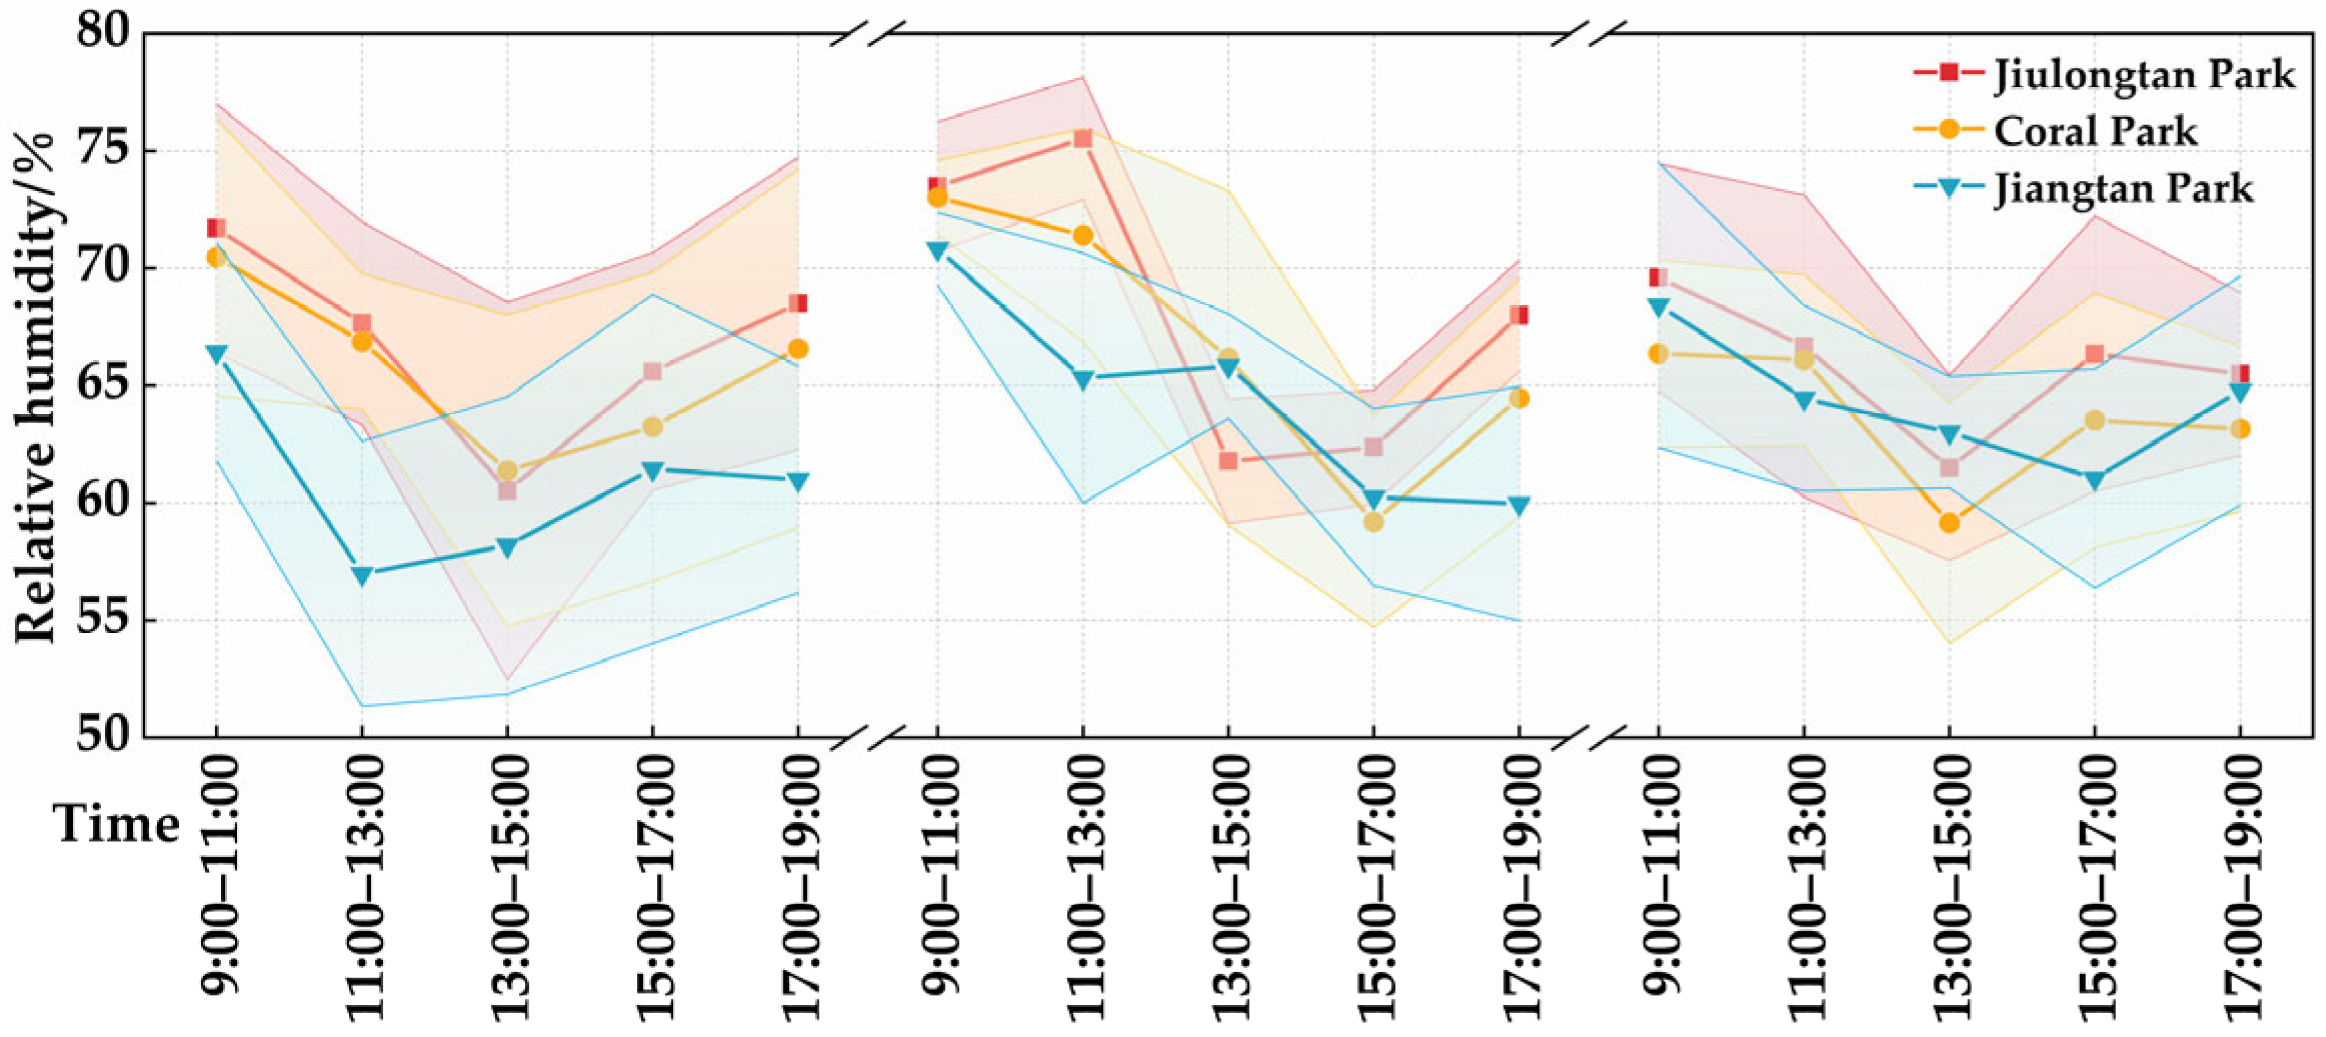
To improve readability, Figure 5, Figure 6, Figure 7 and Figure 8 use solid lines to represent the mean values for each park, while shaded bands indicate the Min–Max range among measurement points within the same park.

3.1. Air Temperature Analysis

The variations in air temperature across the three parks are shown in Figure 5. During the three-day observation period, air temperature in all three parks showed a highly synchronized diurnal pattern. Temperatures gradually increased after 09:00, peaked between 13:00 and 17:00, and then declined toward the evening. According to Table 2, the maximum air temperatures in Jiulongtan Park, Jiangtan Park, and Coral Park were 43.7 °C, 43.1 °C, and 42.8 °C, respectively, while the corresponding minimum air temperatures were 31.2 °C, 30.6 °C, and 30.1 °C. Therefore, the maximum–minimum temperature differences during the observation period were 12.5 °C, 12.5 °C, and 12.7 °C in Jiulongtan Park, Jiangtan Park, and Coral Park, respectively, indicating strong heat exposure and marked temperature fluctuations during the observed hot-weather period.
Although the three parks showed similar temporal patterns, the shaded bands in Figure 5 indicate clear spatial differences within each park. The wider Min–Max bands during the afternoon suggest that local site conditions, such as shading, underlying surface materials, and spatial openness, significantly affected air temperature at the measurement-point scale [27]. In general, spaces with stronger vegetation shading and lower sky openness tended to have lower peak temperatures and smaller fluctuations. In contrast, more open spaces with a higher proportion of hard-paved surfaces were more likely to warm rapidly and reach higher afternoon temperatures. Among the three parks, Jiulongtan Park recorded the highest air temperature, at 43.7 °C, suggesting greater heat accumulation in some exposed areas. These results indicate that summer air temperature in Chongqing’s riverside parks is influenced not only by regional weather conditions but also by local spatial heterogeneity within each park.

3.2. Black Globe Temperature Analysis

Black globe temperature reflects the combined effects of air temperature and environmental thermal radiation. As shown in Figure 6, black globe temperature was more sensitive to Thermal Radiation and shading conditions than air temperature. During the observation period, black globe temperature increased rapidly from the morning and reached its highest values between 13:00 and 17:00, indicating strong radiant thermal stress during summer afternoons. According to Table 2, the maximum black globe temperatures in Jiulongtan Park, Jiangtan Park, and Coral Park were 61.6 °C, 60.2 °C, and 58.7 °C, respectively, while the corresponding minimum values were 32.3 °C, 32.4 °C, and 33.8 °C. Therefore, the maximum–minimum differences in black globe temperature were 29.3 °C, 27.8 °C, and 24.9 °C in Jiulongtan Park, Jiangtan Park, and Coral Park, respectively. These values indicate that black globe temperature fluctuated much more strongly than air temperature and was substantially affected by radiation exposure. The three parks showed similar temporal patterns in black globe temperature, but the Min–Max shaded bands reveal clear spatial heterogeneity within each park. The difference between the upper and lower boundaries of the shaded bands was particularly evident in the afternoon, suggesting that direct exposure to Thermal Radiation and insufficient continuous shading significantly increased radiant thermal stress. In contrast, shaded or partially enclosed spaces exhibited lower black-globe temperatures and smaller fluctuations. Jiulongtan Park recorded the highest black globe temperature, followed by Jiangtan Park and Coral Park, indicating that open hard-paved spaces and areas with insufficient shading were more likely to accumulate radiant heat. Overall, the variation in black globe temperature indicates that radiation exposure and shading conditions are important factors affecting human thermal perception in Chongqing’s riverside parks.

3.3. Relative Humidity Analysis

Relative humidity is one of the key factors affecting outdoor thermal comfort because it influences the efficiency of evaporative heat loss from the human body. As shown in Figure 7, relative humidity in the three parks generally followed a diurnal pattern, with higher values in the morning and evening and lower values around midday. From 09:00 to 15:00, the relative humidity gradually decreased as the air temperature increased. After 15:00, relative humidity increased again as air temperature declined. According to Table 2, the maximum relative humidity values at Jiulongtan Park, Coral Park, and Jiangtan Park were 77.6%, 77.5%, and 76.1%, respectively, while the corresponding minimum values were 52.7%, 53.7%, and 52.8%, respectively. Therefore, the humidity ranges in Jiulongtan Park, Coral Park, and Jiangtan Park were 24.9%, 23.8%, and 23.3%, respectively. These results indicate that all three parks exhibited clear diurnal variations in humidity during the observed hot-weather period. The park-level mean curves and Min–Max shaded bands indicate that humidity conditions differed among the three parks and also fluctuated within each park. Coral Park showed relatively high overall humidity, whereas Jiulongtan Park had a larger humidity range, possibly because it contained both exposed hard-paved spaces and shaded vegetated spaces. Jiangtan Park had a slightly lower maximum humidity and an overall variation at an intermediate level.

3.4. Thermal Radiation Intensity Analysis

During the observed hot-weather period, Thermal Radiation increased the heat load on the human body and intensified perceived thermal stress. As shown in Figure 8, Thermal Radiation increased rapidly after 09:00 and generally peaked between 13:00 and 15:00. Compared with air temperature and relative humidity, Thermal Radiation exhibited stronger short-term variation, indicating its high sensitivity to shading conditions and sky openness. According to Table 2, the maximum Thermal Radiation values in Jiangtan Park, Jiulongtan Park, and Coral Park were 863.2 W/m2, 728.3 W/m2, and 686.0 W/m2, respectively, while the corresponding minimum values were 27.1 W/m2, 17.9 W/m2, and 38.4 W/m2. Therefore, the Thermal Radiation ranges in Jiangtan Park, Jiulongtan Park, and Coral Park were 836.1 W/m2, 710.4 W/m2, and 647.6 W/m2, respectively. These large ranges indicate significant spatial and temporal differences in solar exposure within the three parks. The wider shaded bands around midday and early afternoon suggest clear differences in radiation between shaded and exposed spaces. Open spaces with higher sky openness and a larger proportion of hard-paved surfaces generally showed higher upper-bound Thermal Radiation values. In contrast, spaces protected by tree canopies or other shading elements maintained lower radiation levels and smaller fluctuations.

4. Thermal Comfort Assessment During Hot-Weather Conditions in Riverside Parks

Thermal comfort is a subjective psychological state that reflects an individual’s satisfaction with the thermal environment. The American Society of Heating, Refrigerating, and Air-Conditioning Engineers (ASHRAE) defines it as a person’s subjective assessment of whether the surrounding thermal environment is satisfactory [28].

4.1. Observation and Questionnaire Survey Analysis

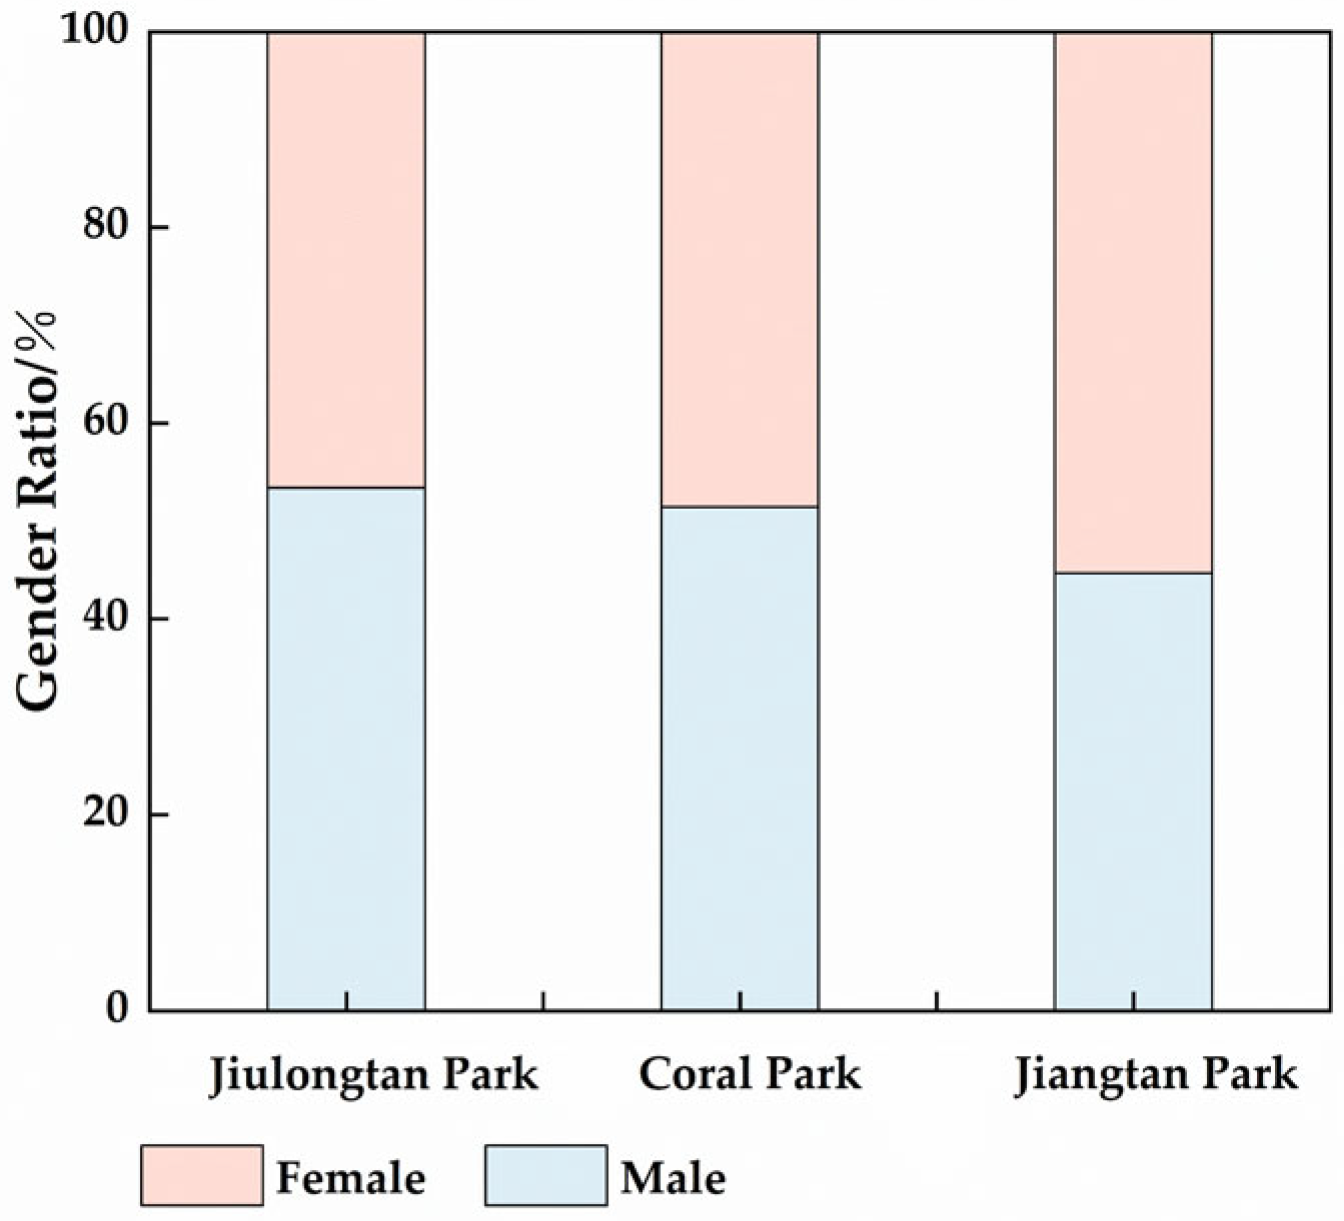
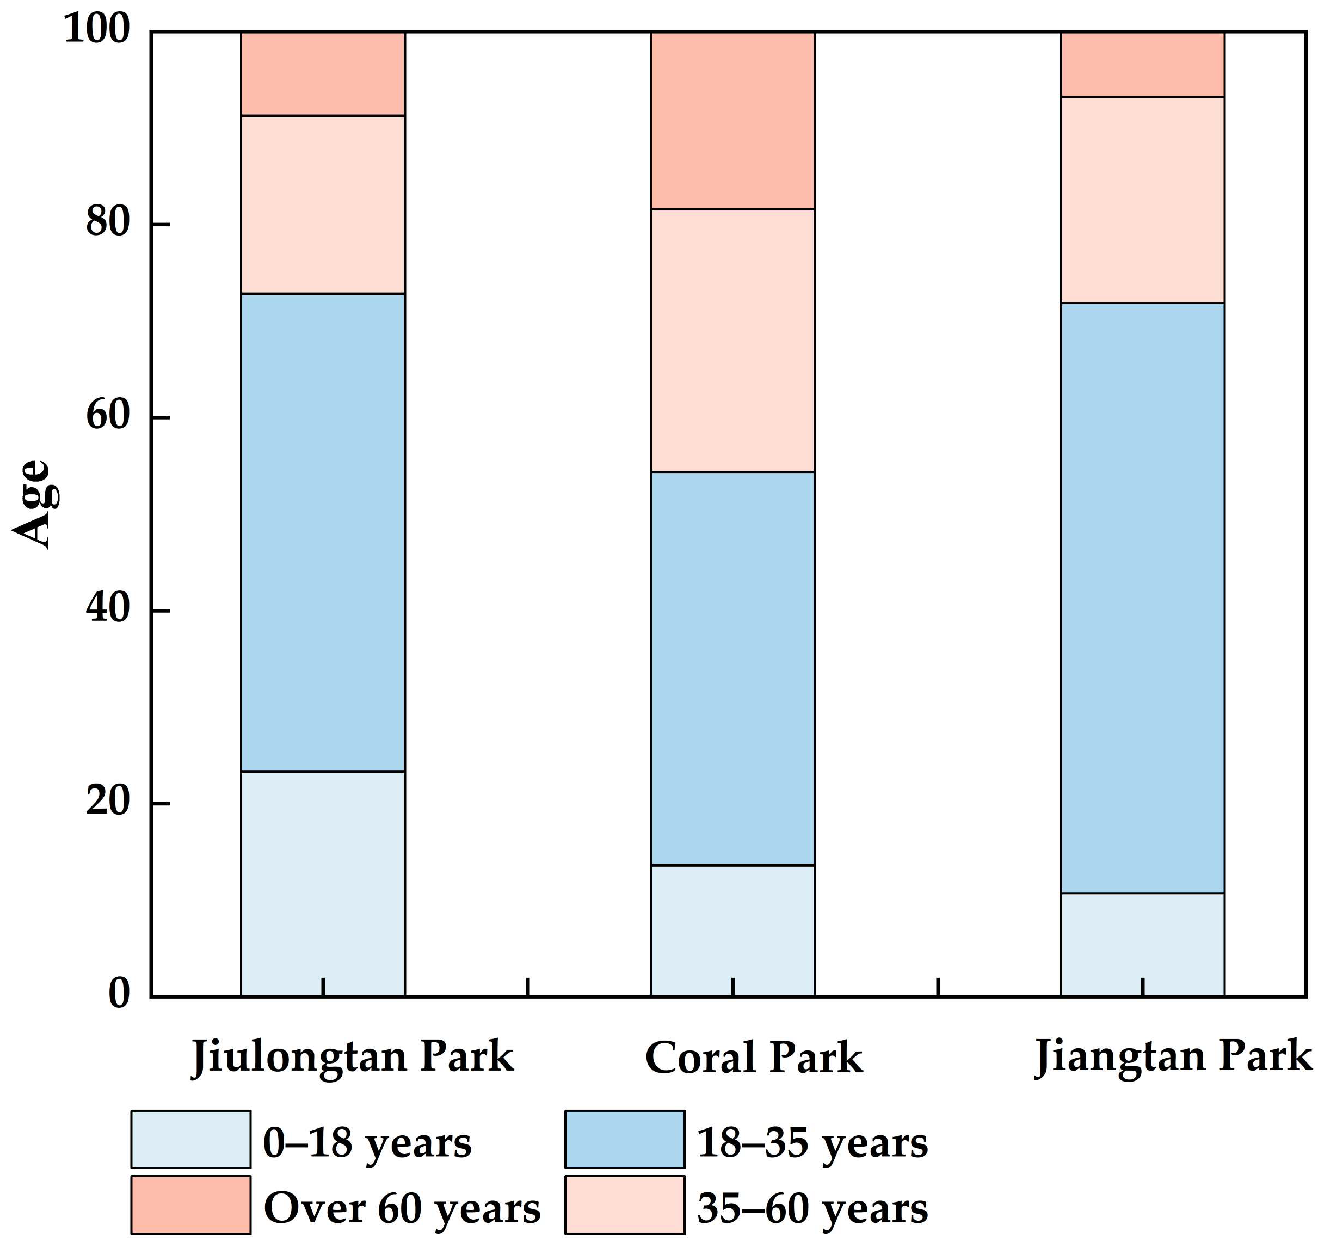
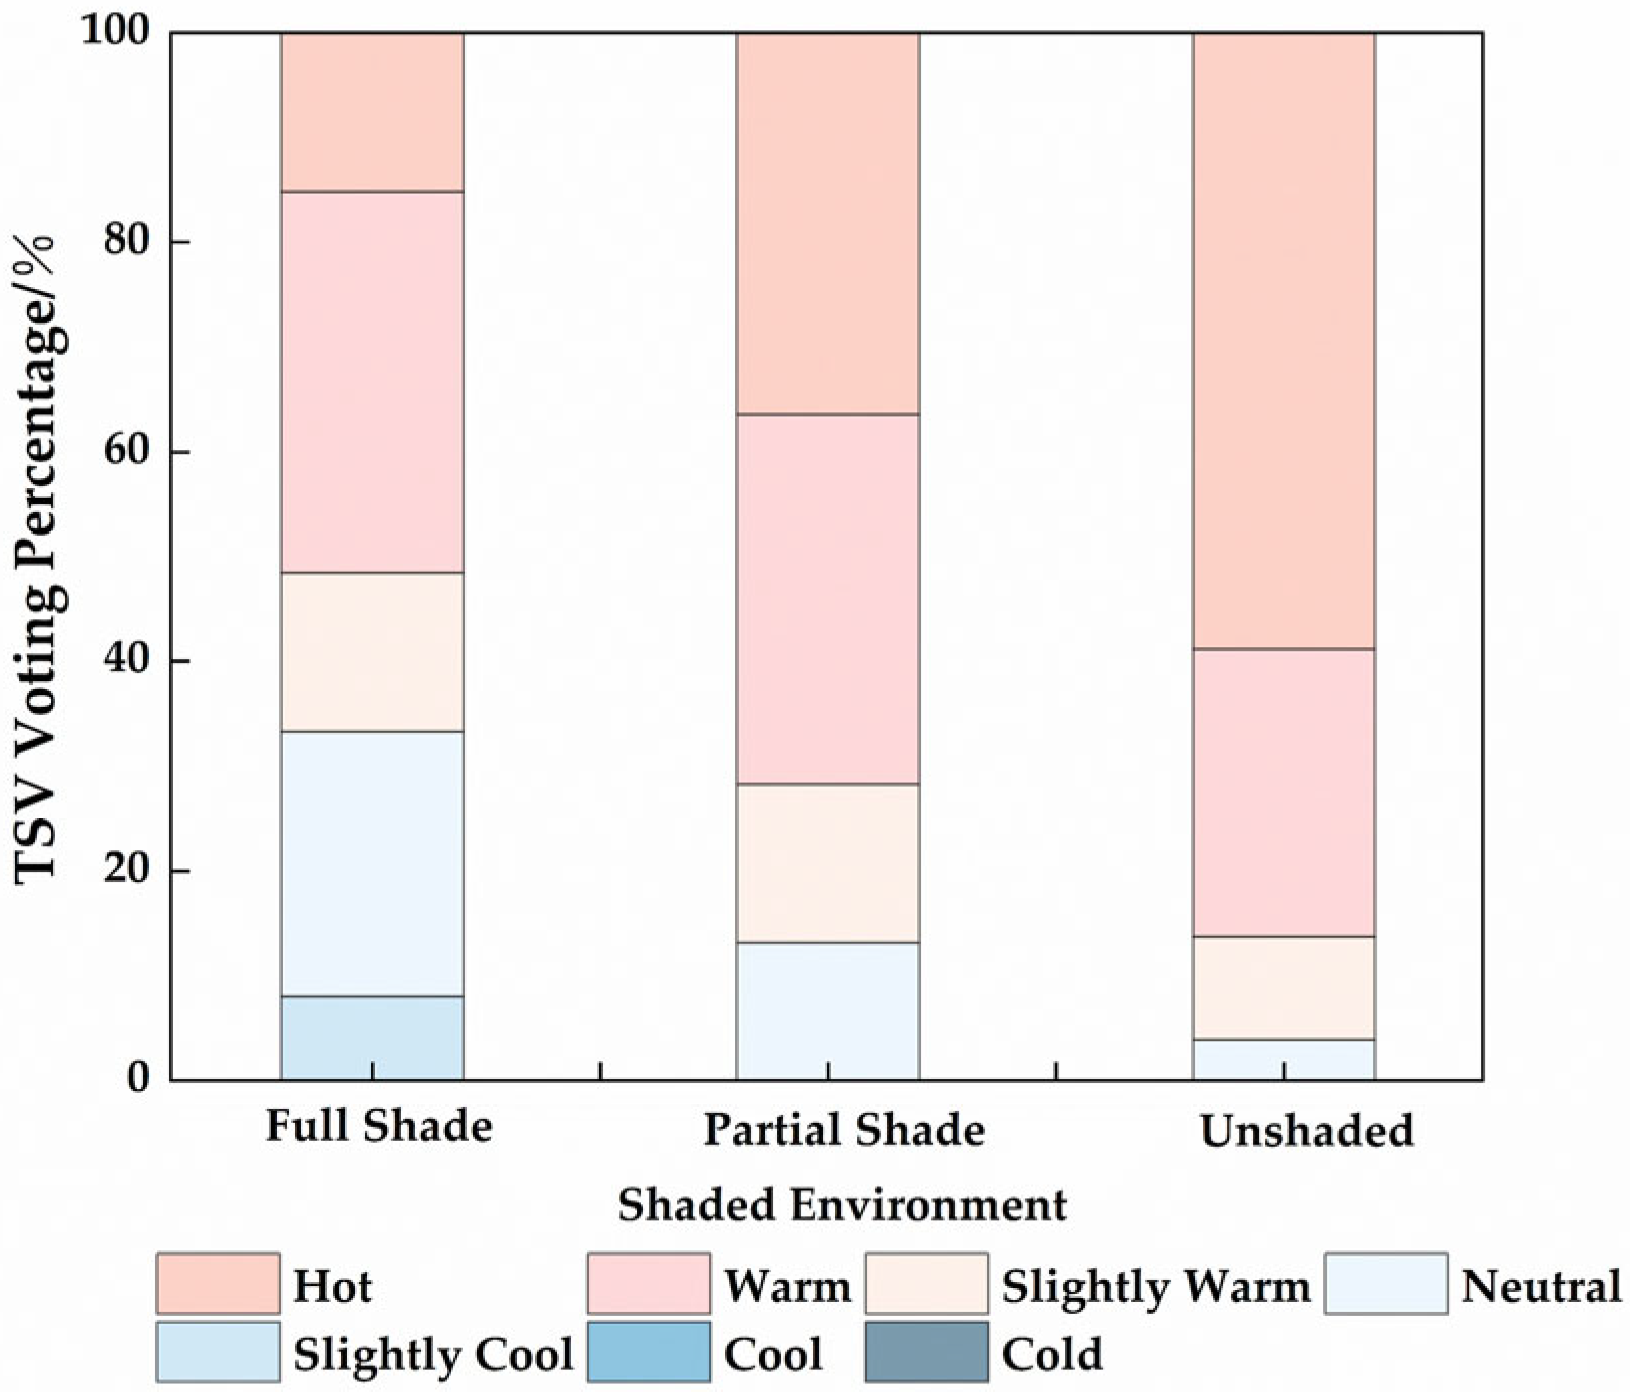
Respondents ranged in age from 10 to 70 years, with the majority aged 18 to 45. The gender ratio of respondents was roughly balanced across the three parks (Figure 9). Each park exhibited distinct age distribution characteristics: Jiulongtan Park had a higher proportion of adolescents, Coral Park had a slightly larger proportion of older adults, and Jiangtan Park, due to its scenic attributes, was predominantly visited by young adults (Figure 10). Measurement points were categorized as fully shaded, partially shaded, or unshaded to analyze thermal sensation and comfort perceptions under different shading conditions. As shown in Figure 11, in fully shaded environments, thermal sensation votes (TSV) were mainly “neutral,” “slightly warm,” and “warm,” collectively accounting for 76.0% of responses: “neutral” (comfortable range) 25.0%, “slightly warm” 15.0%, and “warm” 36.0%. Votes for “hot” accounted for only about 15.0%, and no “cool/cold” responses were reported, indicating that thermal sensation was generally concentrated in the comfortable-to-mildly warm range. In partially shaded environments, thermal sensation shifted toward “warm”: “warm” accounted for 35.0%, “slightly warm” 15.0%, and “neutral” dropped to 13.0%; “hot” votes increased to 36.0%, while “cool/cold” responses remained absent, and the proportion of comfortable responses declined markedly. In unshaded areas, thermal discomfort was significantly higher: “hot” accounted for 59.0%, “warm” 27.0%, and “slightly warm” only 10.0%, with almost no “neutral” or lower comfort votes. Overall, thermal sensation in unshaded spaces was concentrated in the “warm–hot” range.
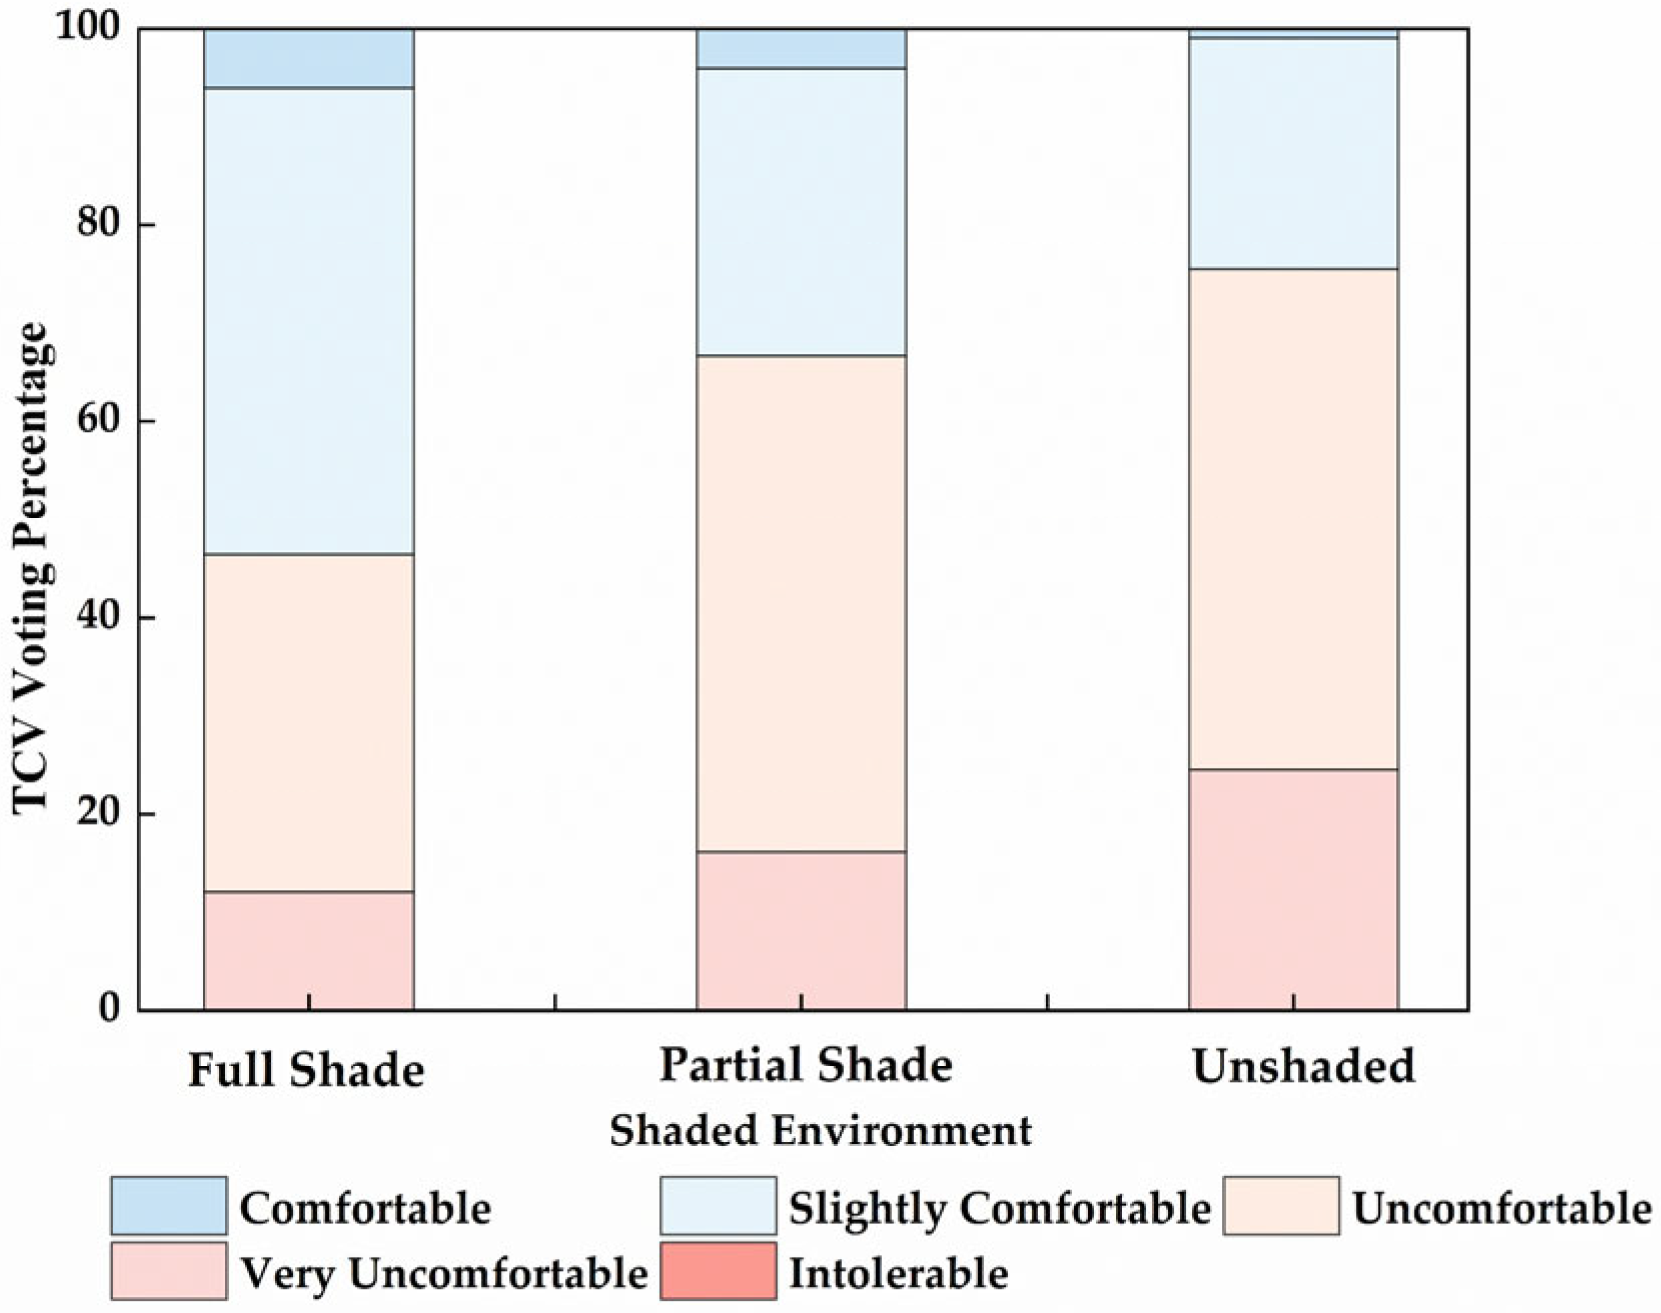
The questionnaire results for thermal comfort are presented in Figure 12. In fully shaded environments, thermal comfort responses were dominated by “comfortable” and “slightly comfortable,” together accounting for 53.0% of responses, with “slightly comfortable” at 47.0% and “comfortable” at 6.0%. Votes for “uncomfortable” accounted for 37.0%, while no “very uncomfortable” or “intolerable” responses were reported, indicating the highest overall comfort levels. In partially shaded environments, the proportion of responses within the comfortable range decreased markedly: “uncomfortable” rose to 51.0%, “slightly comfortable” dropped to 29.0%, and “comfortable” accounted for only 4.0%. No “intolerable” votes were recorded, but the overall comfort experience was lower than in fully shaded areas. In unshaded environments, thermal discomfort intensified: “uncomfortable” accounted for 51.0% and “very uncomfortable” for 25.0%, while “comfortable” responses accounted for only 1.0%, and no “intolerable” responses occurred. Overall, thermal comfort in unshaded spaces fell largely within the discomfort range.

4.2. PET Calculation and Analysis

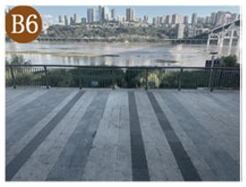
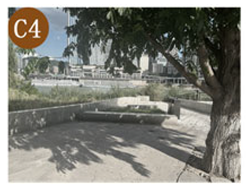
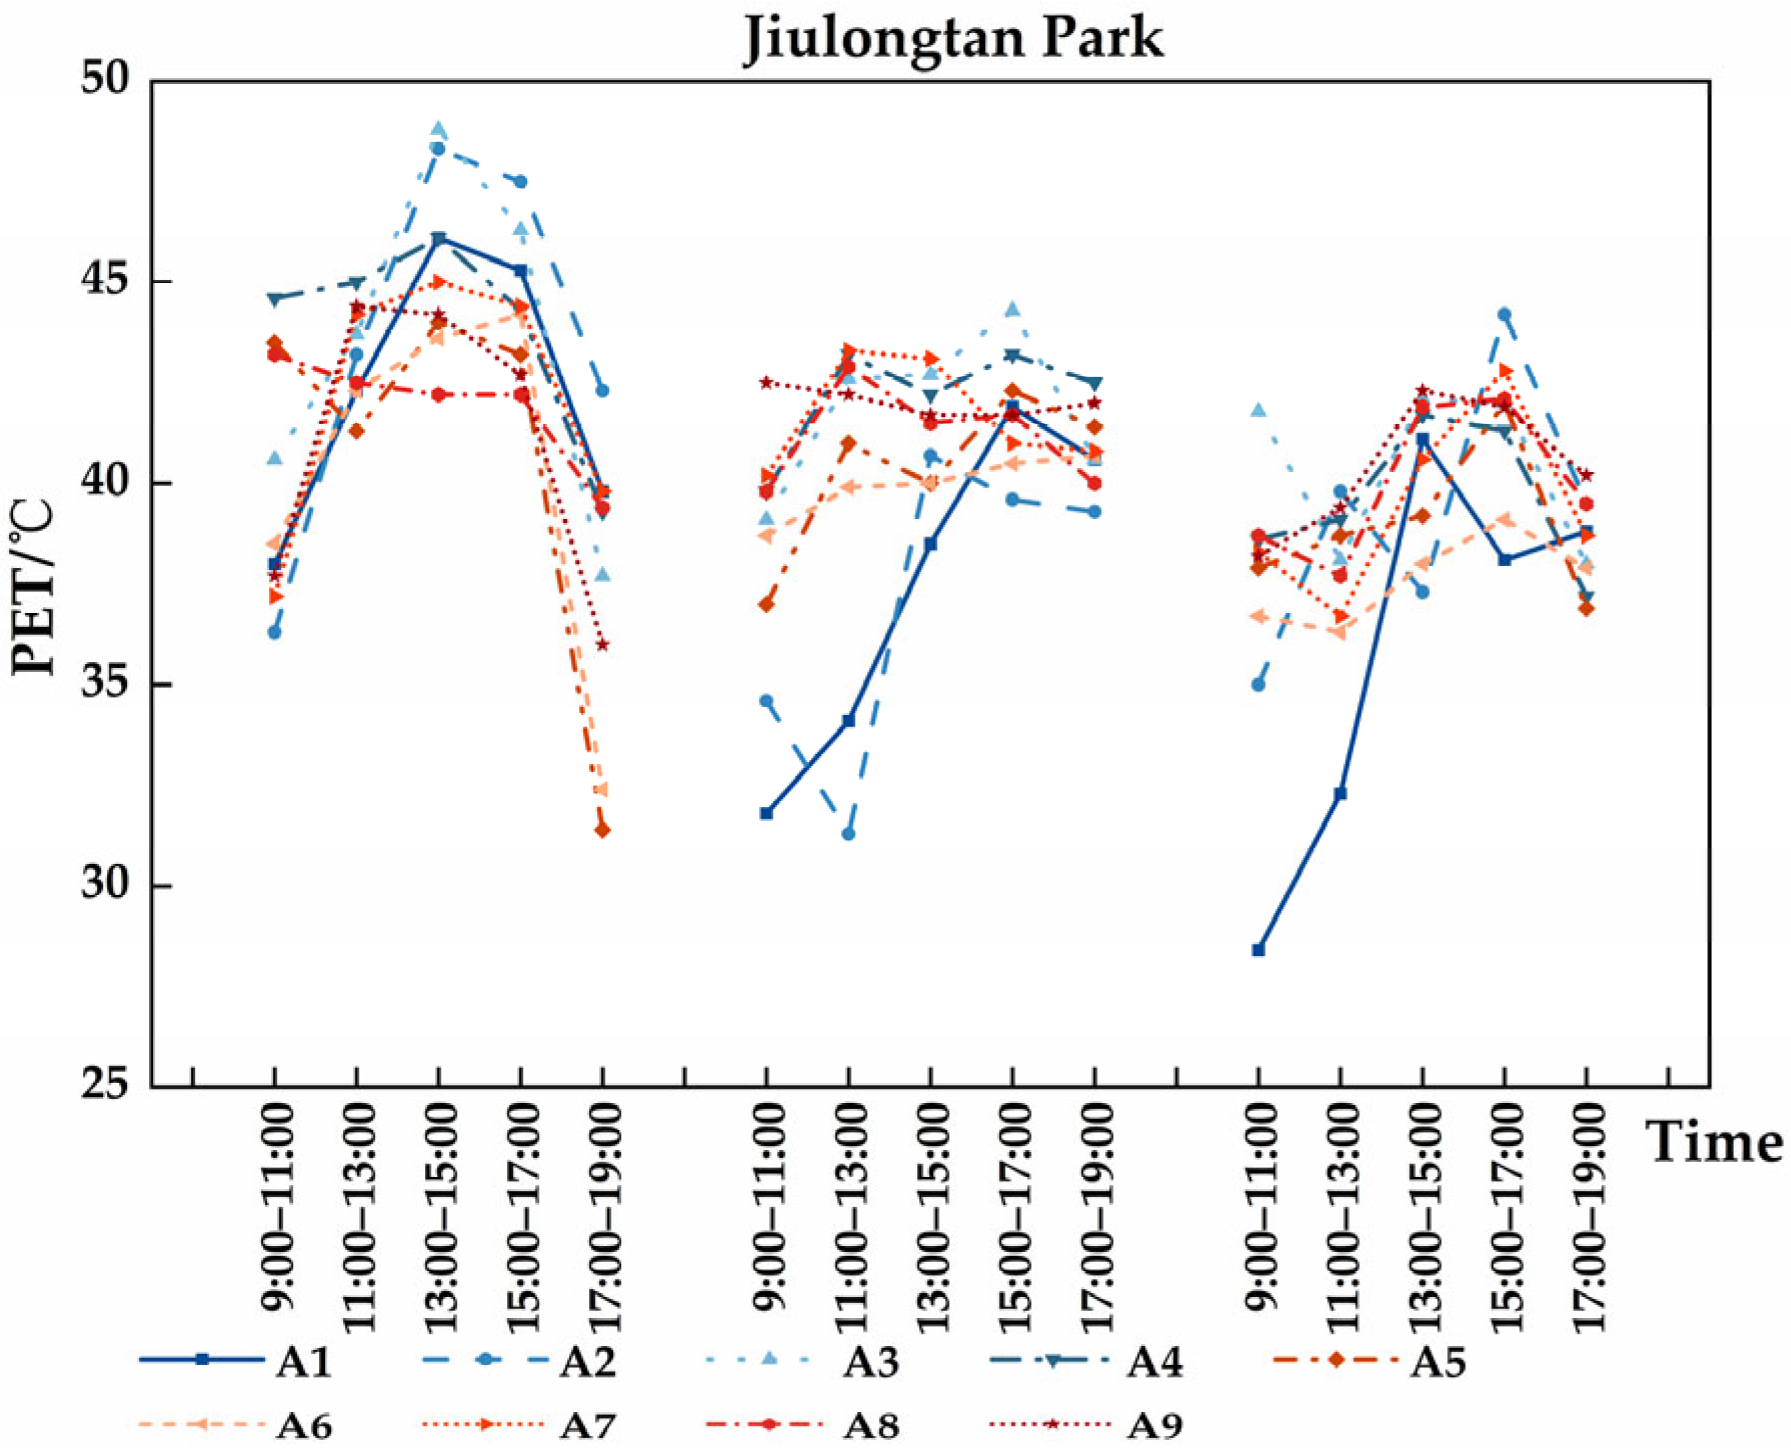
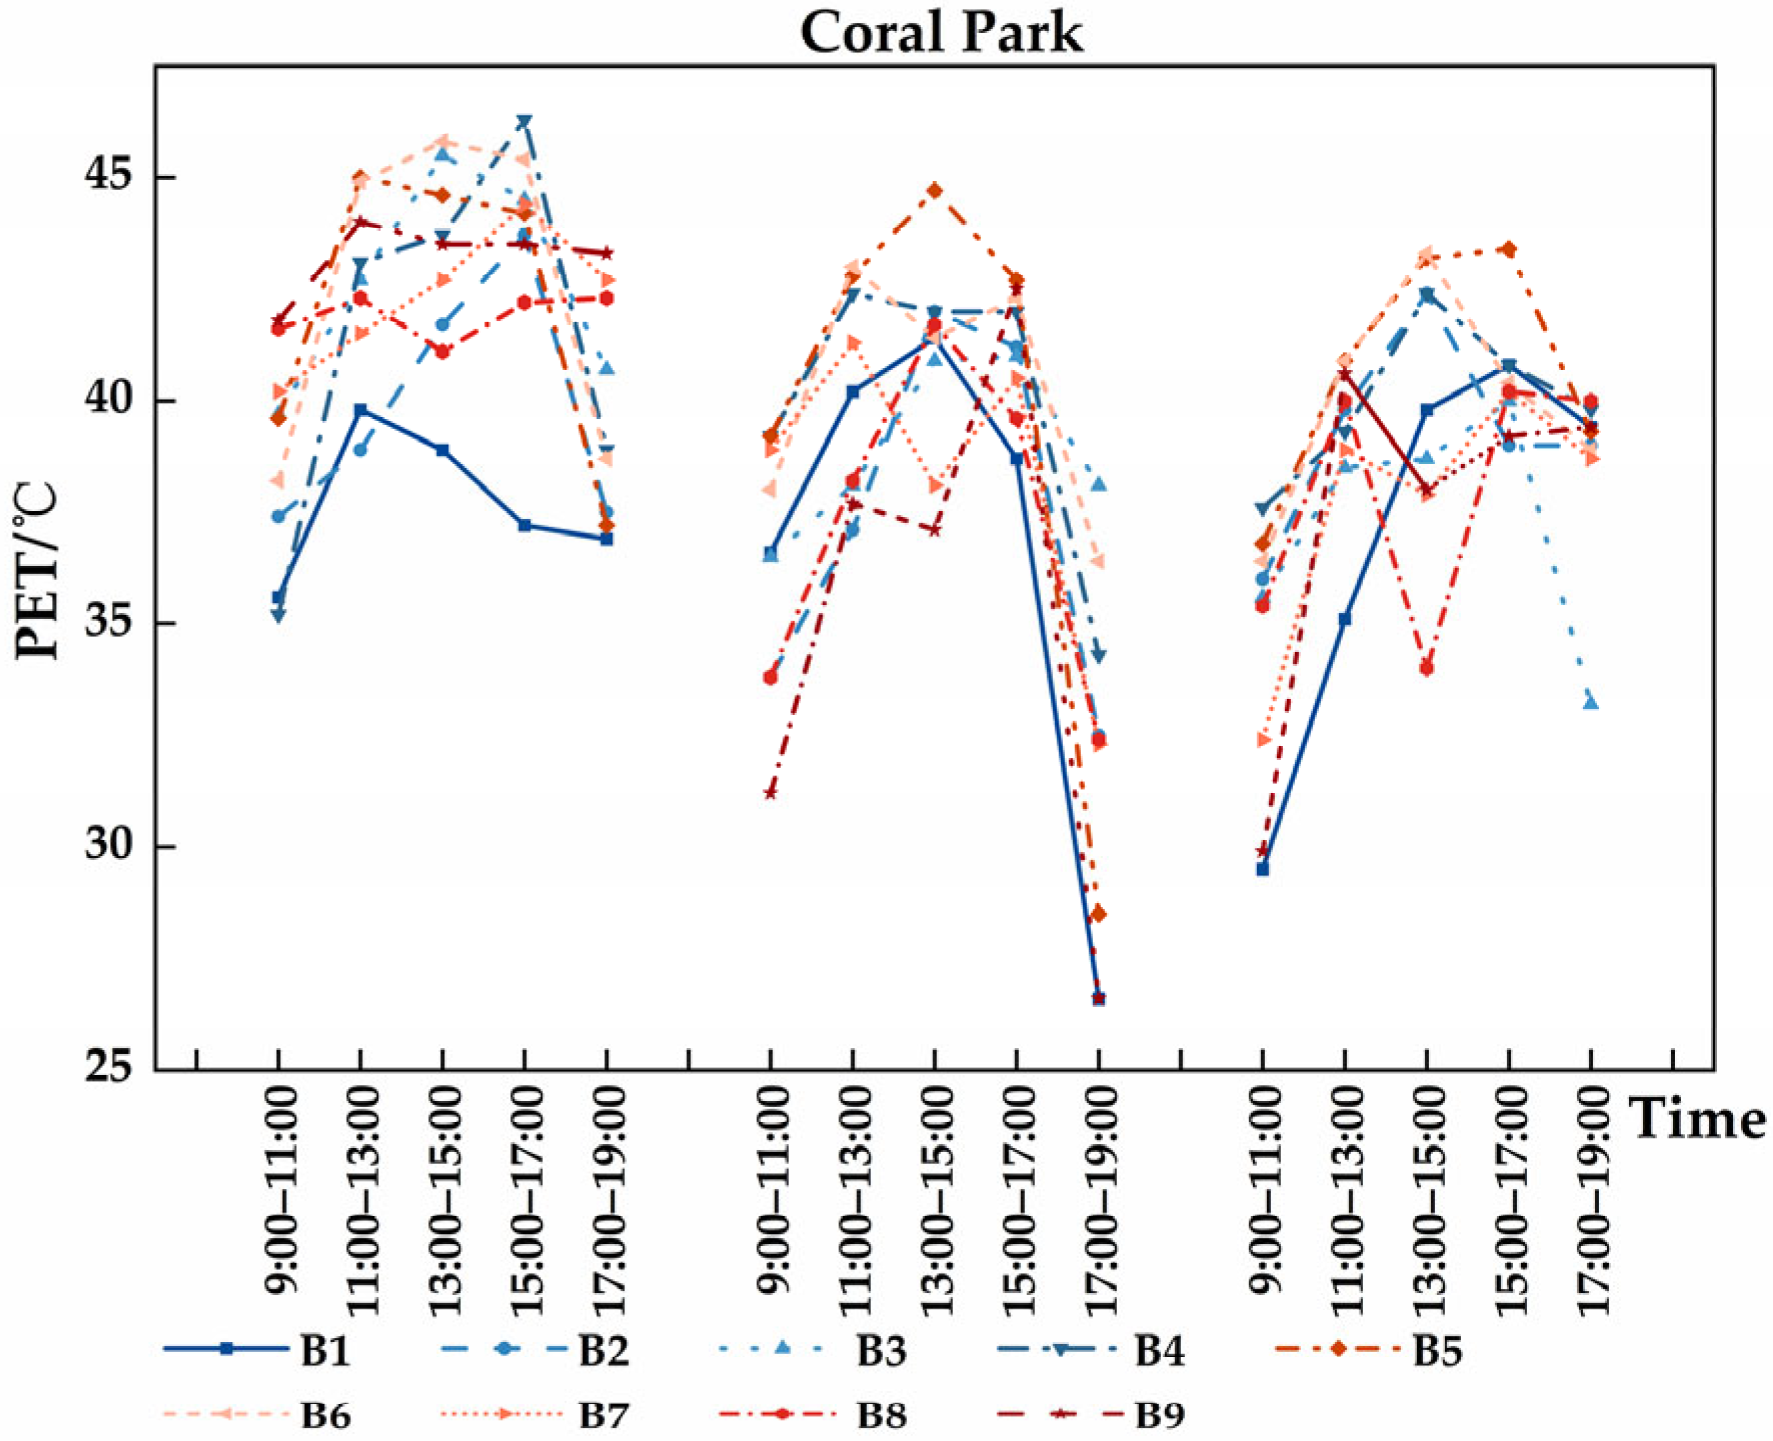
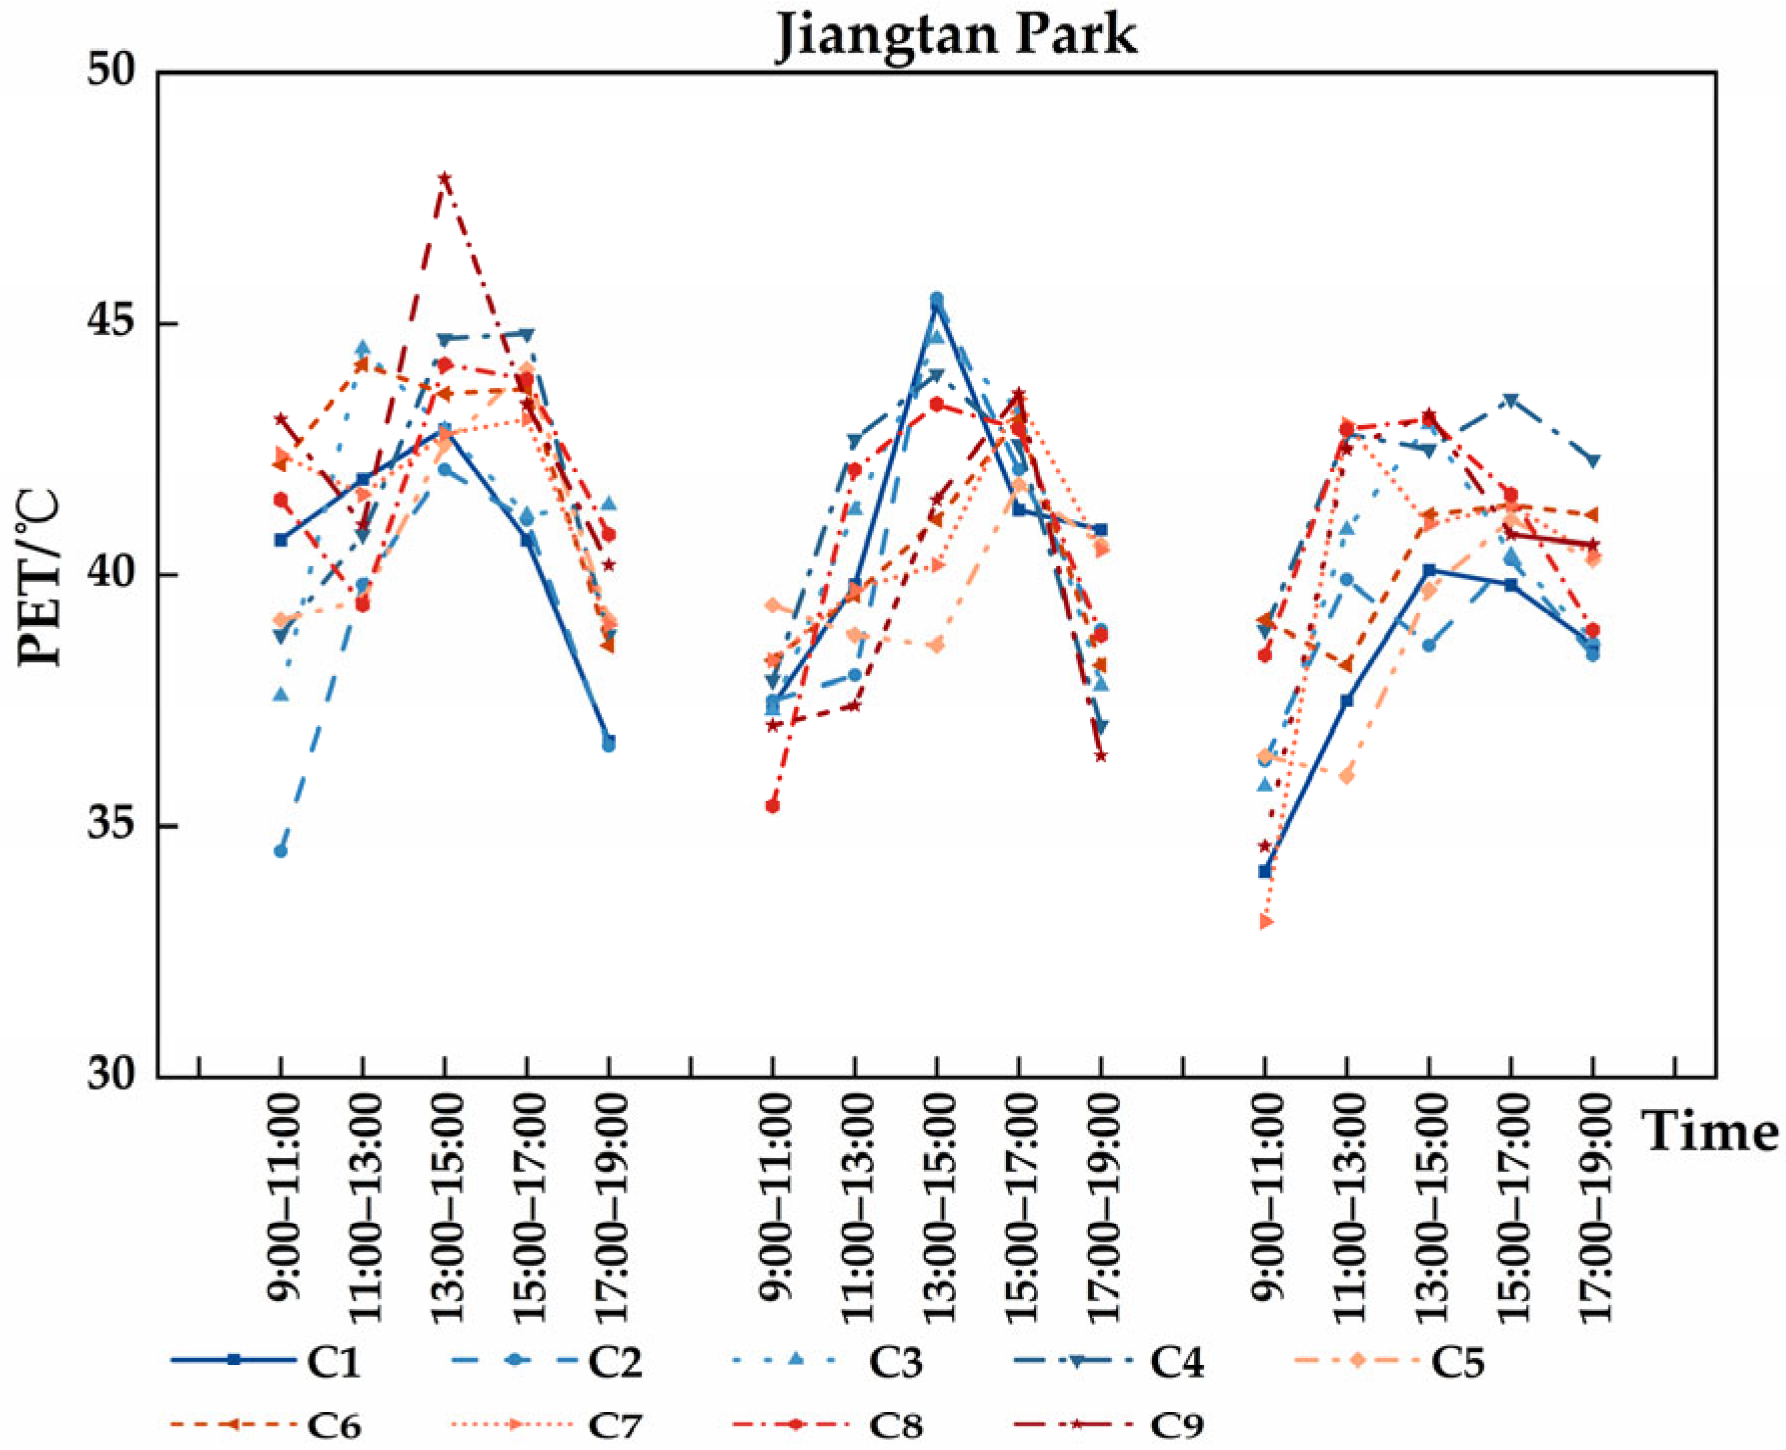
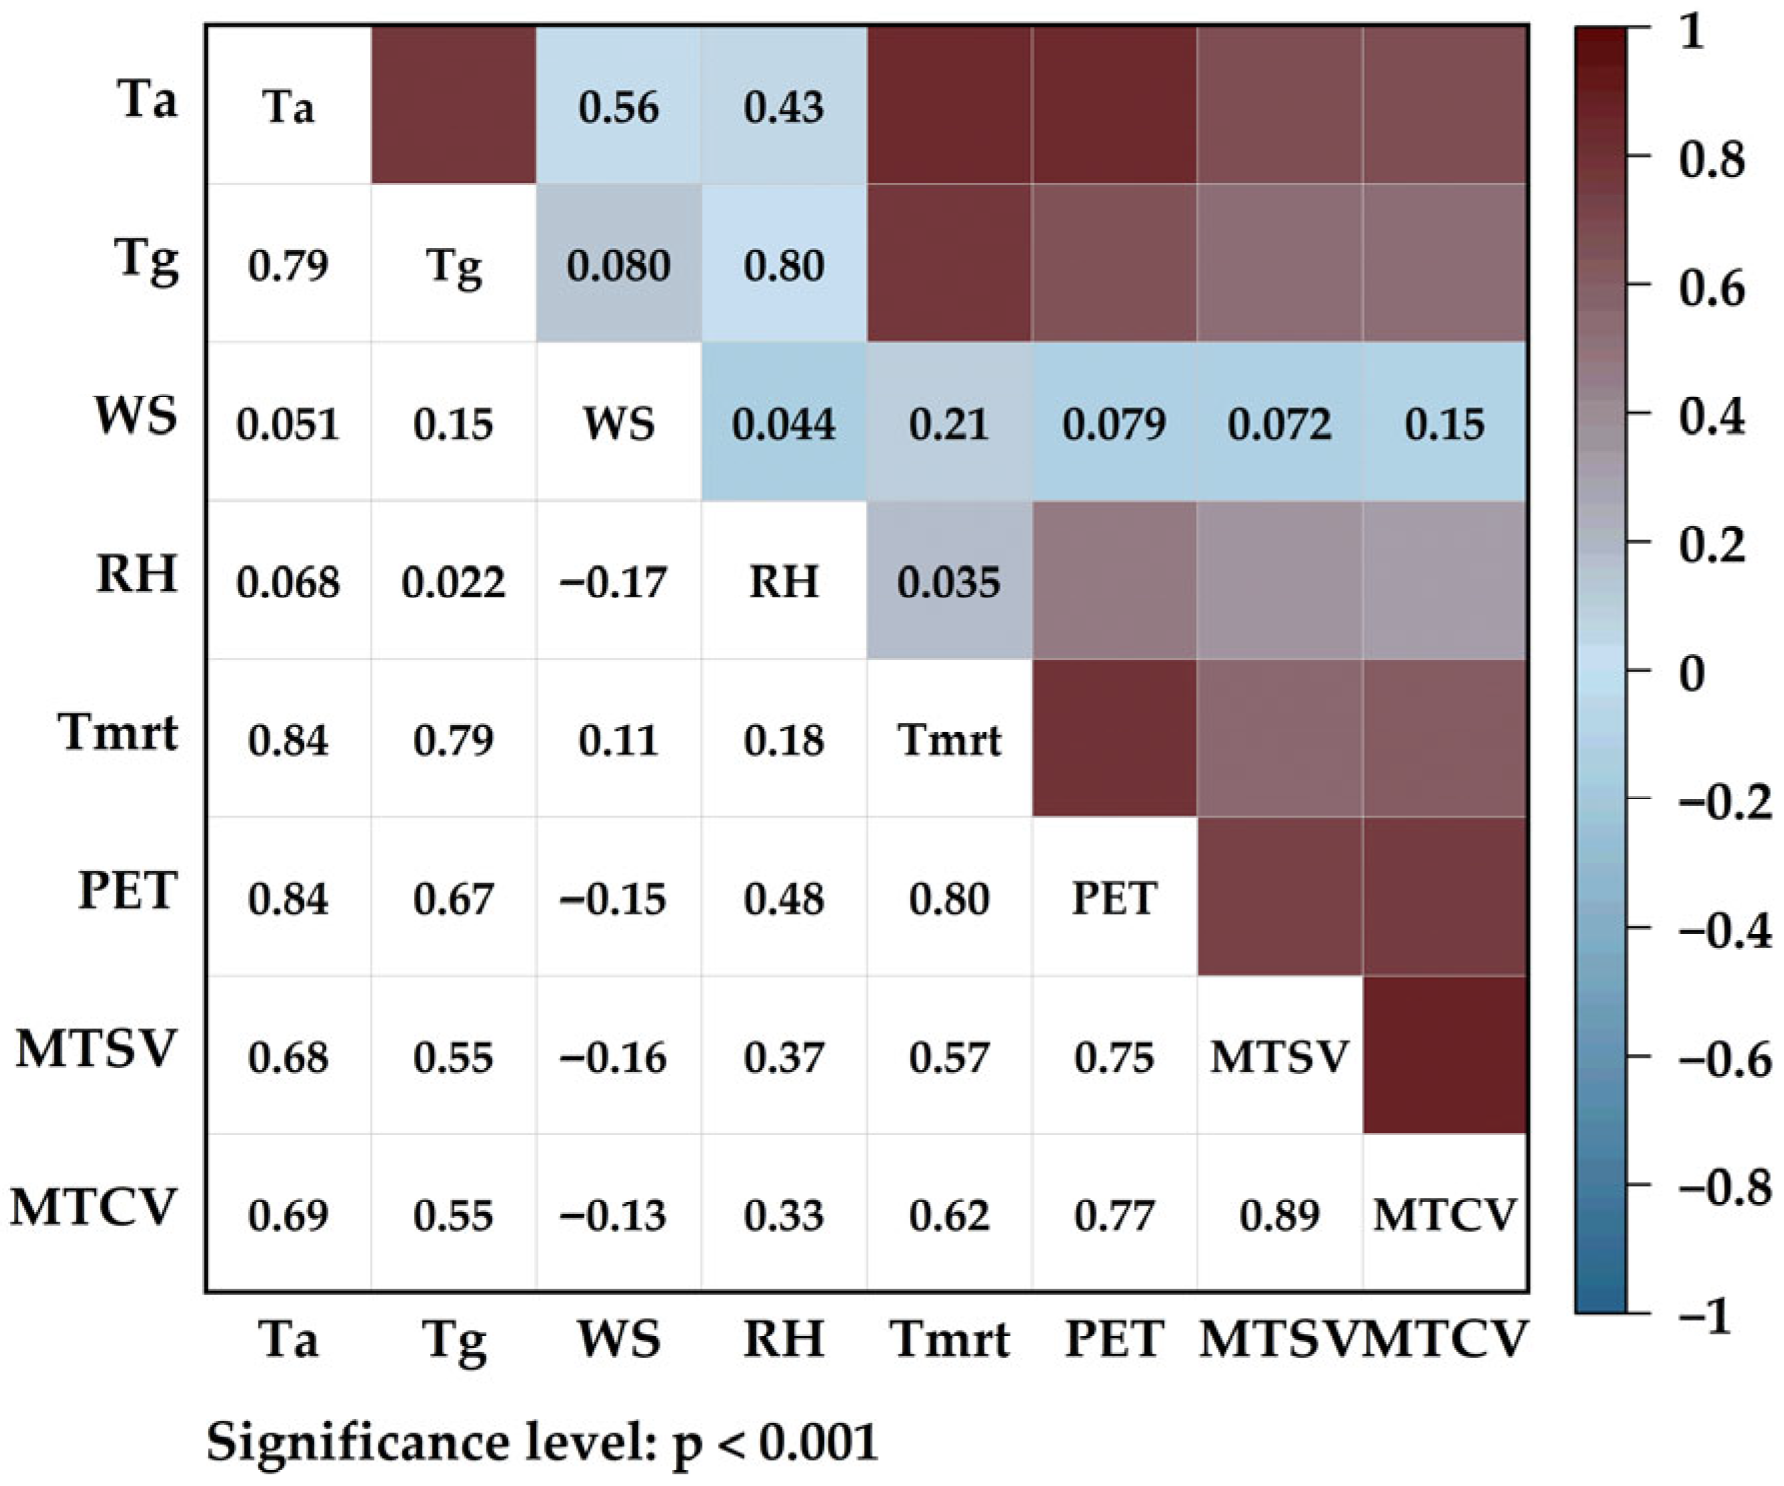
As shown in Figure 13, Figure 14 and Figure 15, the overall PET values in the three parks were high on 17 July, with unshaded areas generally exceeding 45 °C. On 18 July, PET values were slightly lower overall, while on 19 July, the thermal environment was intermediate between the previous two days, with relatively small fluctuations at each measurement point. Fully shaded points, such as A6, A7, B1, and C1, consistently exhibited lower PET values than open spaces. Partially shaded and unshaded points, including A4, B6, and C4, maintained high PET values throughout the day, with some periods exceeding 45 °C. Most measurement points showed a PET trend of rising first and then declining, while some points exhibited more gradual changes. These patterns were generally consistent with the variations in air temperature, Thermal Radiation, and black globe temperature discussed above. Correlation analyses among the variables were conducted using Origin (v2024) software, and the results are presented in Figure 16. PET, air temperature, mean radiant temperature, and relative humidity showed significant positive correlations with MTSV and MTCV, whereas PET showed a significant negative correlation with wind speed. Results in Table 3 indicate that the cooling effect of river breezes exhibits vertical stratification: the hydrophilic layer experienced the highest wind speed (1.64 ± 0.39 m/s), the active layer an intermediate value, and the elastic layer the lowest. Conversely, thermal indices (PET) showed an opposite distribution pattern, with the elastic layer exhibiting the highest PET range (36.00–46.10 °C), followed by the hydrophilic layer, and the active layer the lowest (26.60–42.80 °C). Overall, PET tended to decrease with increasing wind speed; however, the lower PET values observed in the hydrophilic layer should not be attributed to wind speed alone. They may also be jointly influenced by proximity to the water body, shading conditions, underlying surface types, and local spatial openness. Therefore, the results indicate an association between river breezes and improved thermal conditions, rather than an isolated causal effect of wind speed.

4.3. Thermal Comfort Threshold Analysis

Curve fitting was used to describe the statistical relationship between PET and MTSV/MTCV and to estimate thermal comfort thresholds, rather than to demonstrate a causal relationship between PET and subjective thermal responses. Model performance was evaluated using R2, adjusted R2, F-tests, p-values, standard errors of estimate, 95% confidence intervals, and residual diagnostics.
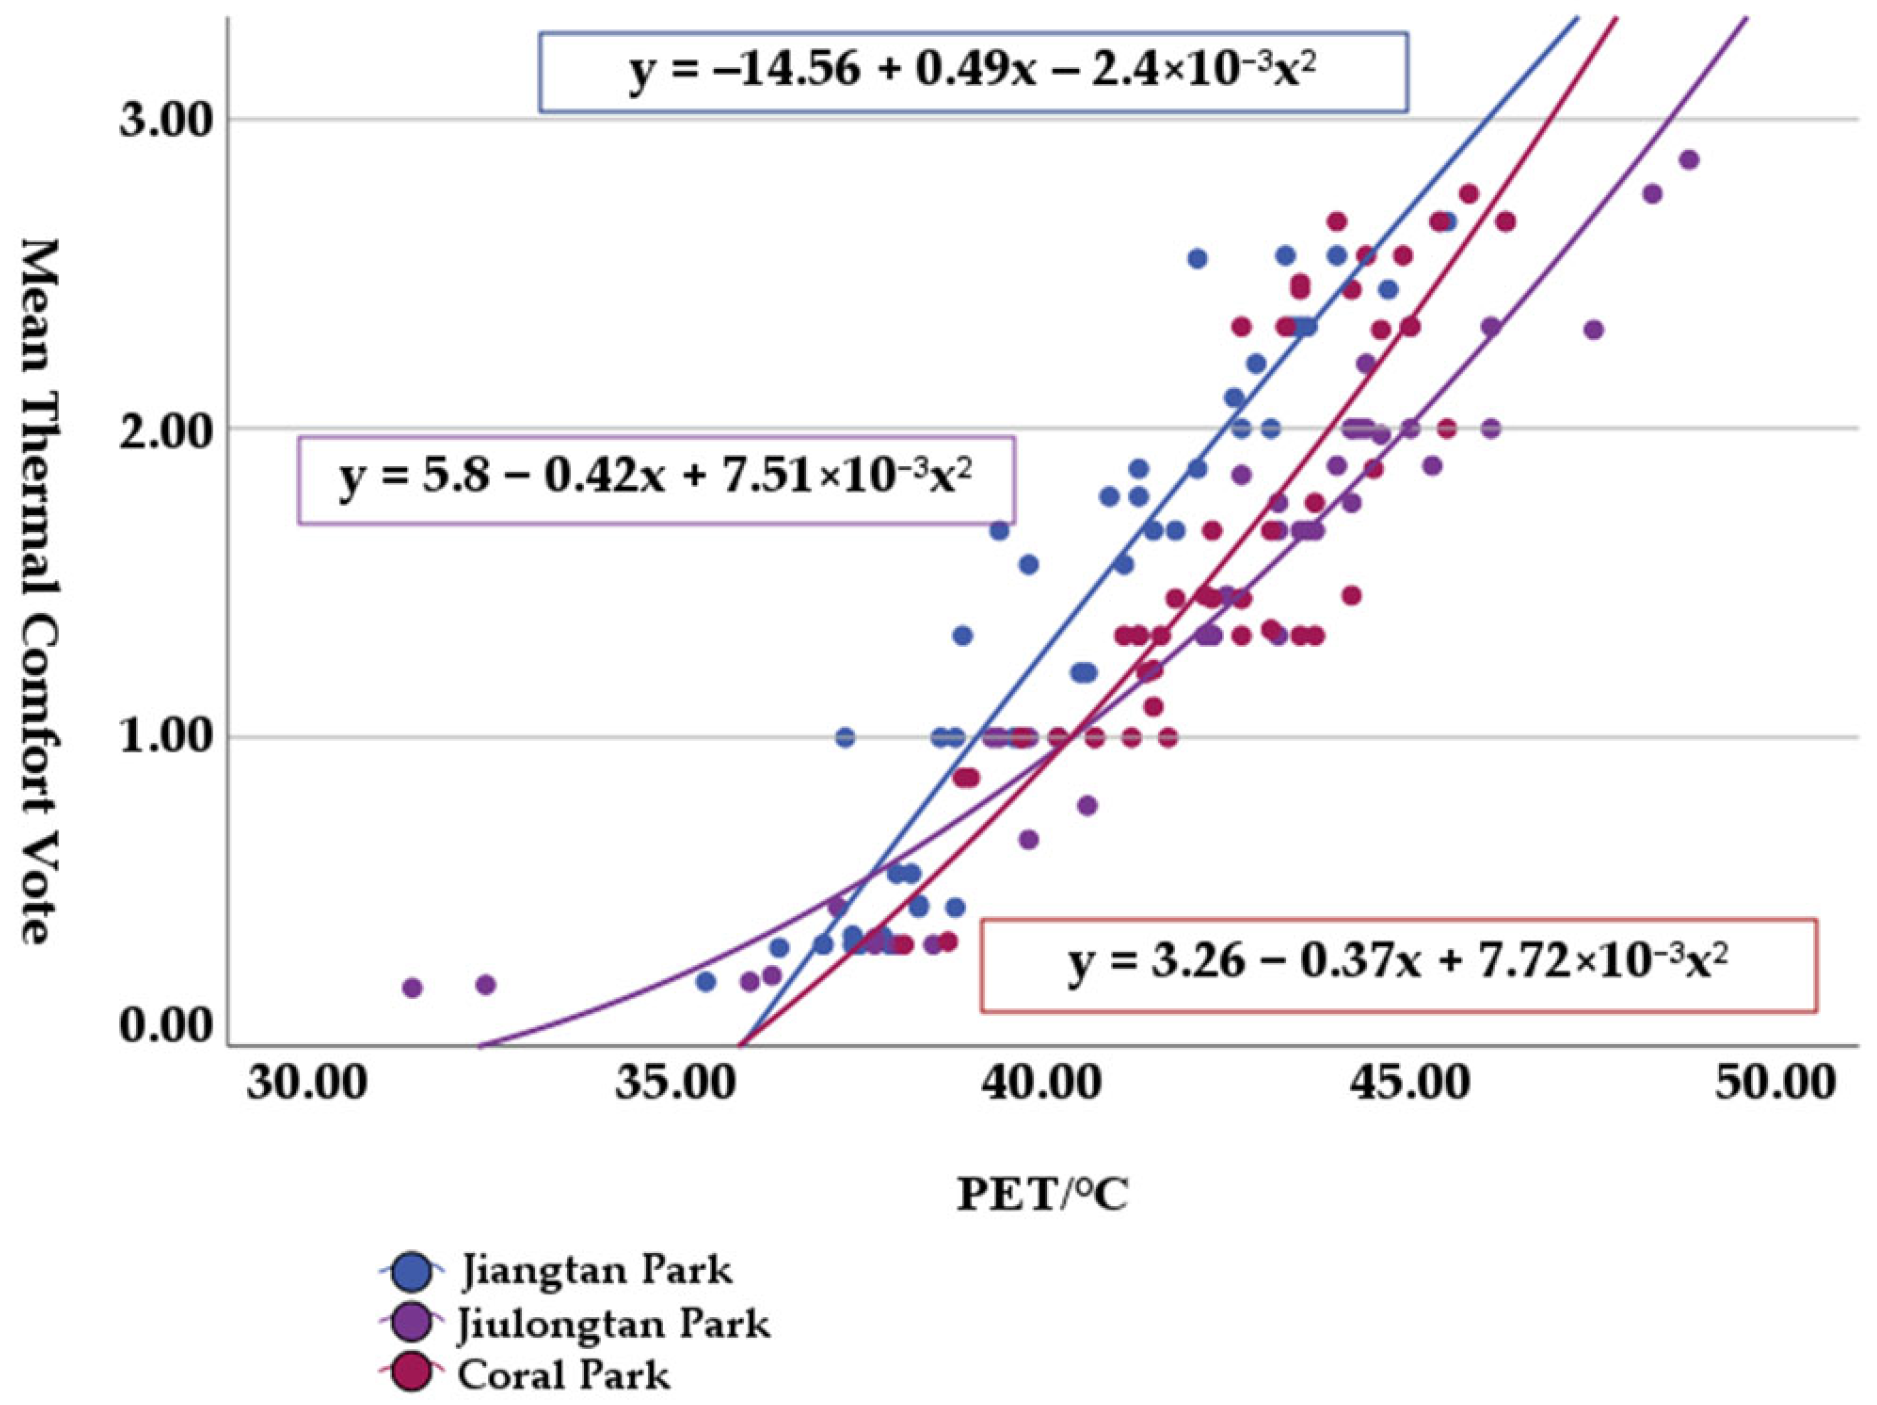
Using SPSS, curve fitting was performed to relate PET to MTCV. As shown in Figure 17, the resulting regression equations are as follows:
MTCVCoral Park = 3.26 − 0.37PET + 0.00772PET2 (R2 = 0.760)
MTCVJiangtan Park = −14.56 + 0.49PET − 0.0024PET2 (R2 = 0.903)
MTCVJiulongtan Park = 5.8 − 0.42PET + 0.00751PET2 (R2 = 0.932)
When MTCV = 0, the corresponding PET values were interpreted as the most comfortable PET values under the observed conditions, rather than thermal neutral PET values. These values were 36.30 °C for Coral Park, 36.10 °C for Jiangtan Park, and 31.06 °C for Jiulongtan Park. When MTCV ≥ 1, the corresponding PET ranges representing thermal comfort in each area were 36.30 ± 4.44 °C for Coral Park, 36.10 ± 3.23 °C for Jiangtan Park, and 31.06 ± 8.85 °C for Jiulongtan Park.
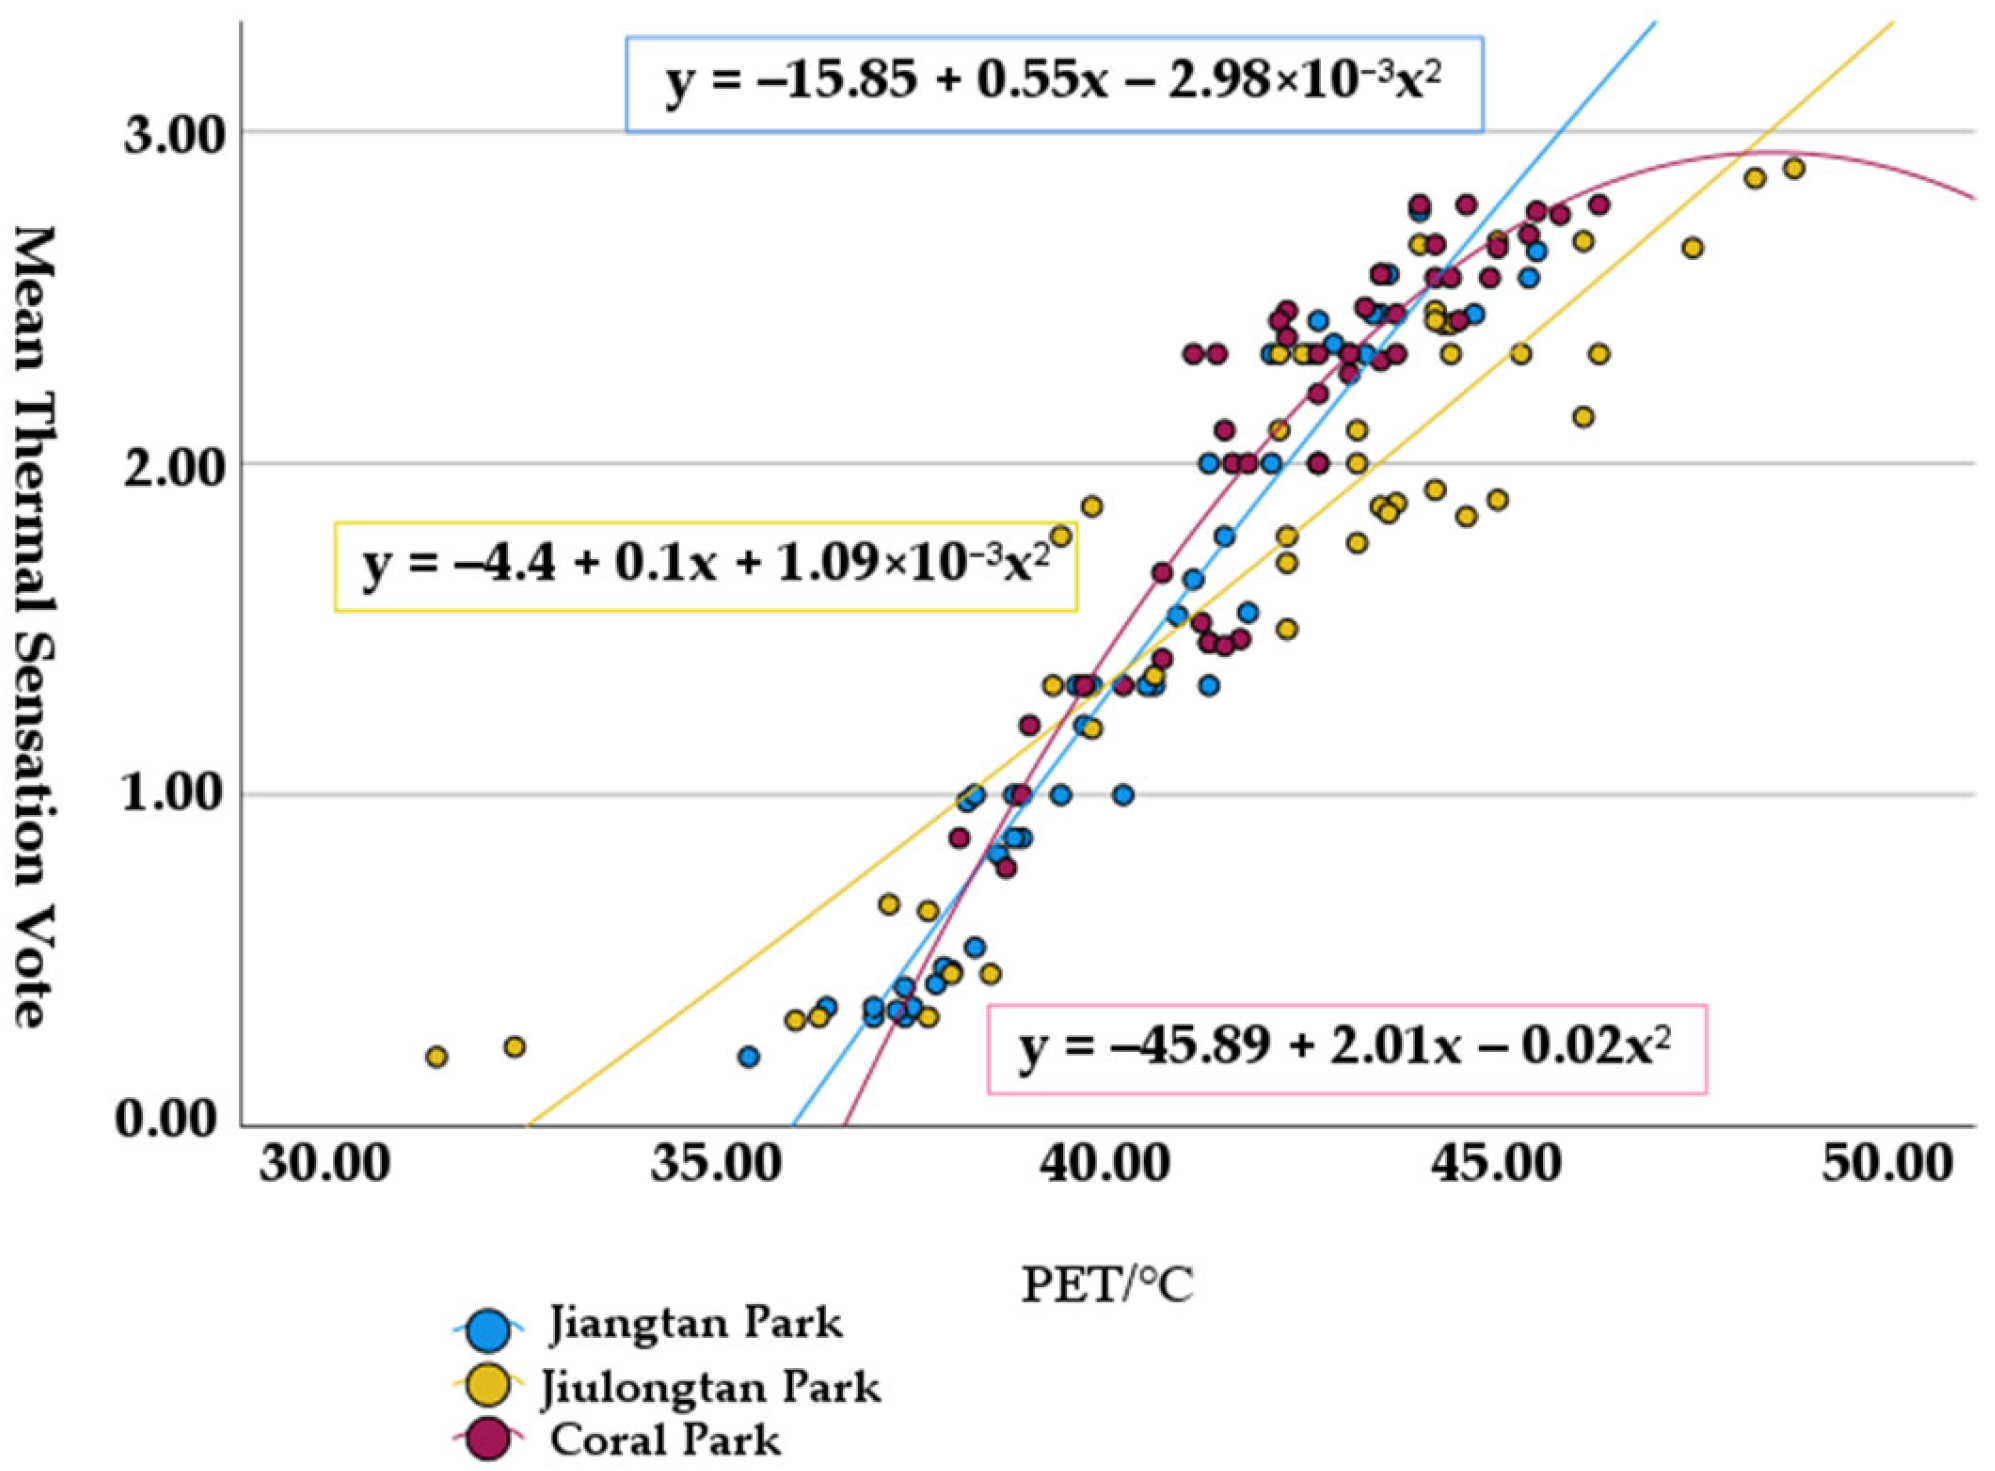
Curve fitting between PET and MTSV was performed for each park. As shown in Figure 18, the resulting regression equations are as follows:
MTSVCoral Park = −45.89 + 2.01PET − 0.02PET2 (R2 = 0.860)
MTSVJiangtan Park = −15.85 + 0.55PET − 0.00298PET2 (R2 = 0.940)
MTSVJiulongtan Park = −4.4 + 0.1PET + 0.00109PET2 (R2 = 0.834)
When MTSV = 0, the corresponding PET values in each measurement area were 35.07 °C for Coral Park, 35.74 °C for Jiangtan Park, and 32.49 °C for Jiulongtan Park. The PET range corresponding to MTSV between −0.5 and 0.5 was defined as the thermal neutral range, indicating that respondents exhibited no clear preference for feeling hot or cold within this PET span. The PET ranges representing thermal comfort in each area were 35.09 ± 0.83 °C for Coral Park, 35.76 ± 1.49 °C for Jiangtan Park, and 32.44 ± 2.93 °C for Jiulongtan Park.
As shown in Table 4, the regression models for Jiulongtan Park, Coral Park, and Jiangtan Park were all statistically significant, with R2 values of 0.834, 0.860, and 0.940, respectively, and all models reached p < 0.001. Standardized residuals, residual scatter plots, and normal P-P plots were examined to assess model suitability, and 95% confidence intervals were used to evaluate the uncertainty of the regression coefficient estimates. The results showed that the 95% confidence intervals of the PET and PET2 terms in Coral Park did not cross zero, indicating relatively stable coefficient estimates. In Jiulongtan Park and Jiangtan Park, the confidence intervals for some individual polynomial coefficients crossed zero, indicating uncertainty in their estimates. However, because PET and PET2 are polynomial terms derived from the same variable, this study primarily interpreted the results based on the overall model fit, F-test results, and neutral PET values obtained from the fitted equations. The standardized residuals of the three models were all within ±3, and no extreme residuals were observed, indicating that the model results were acceptable.

5. Discussion

This study analyzed summer thermal comfort in three representative riverside parks in Chongqing under typical hot-weather conditions. By combining field microclimate measurements, PET calculation, and TSV/TCV questionnaire surveys, this study revealed the thermal comfort characteristics of riverside park spaces in a hot-humid mountain–water city. The following discussion is organized around the observed results, previous studies, methodological limitations, and planning implications.
(1) During the observed hot-weather period, the three parks showed different thermal environment characteristics. Jiulongtan Park recorded the highest air and black globe temperatures, indicating greater heat exposure and radiant thermal stress. This was closely related to its relatively open activity spaces, higher proportion of hard-paved surfaces, and discontinuous shading. Coral Park had relatively lower air and black globe temperatures. Still, its humidity was higher, and its spatial structure was more enclosed, which may have created a stable yet stuffy thermal environment. In Jiangtan Park, Thermal Radiation was strong in some open spaces; however, its waterfront recreational function, open riverside landscape interface, and more diverse activity spaces may have influenced users’ subjective thermal responses. The regression results between MTSV and PET further showed that the neutral PET values differed among the three parks. Jiulongtan Park had the lowest neutral PET value, Coral Park showed an intermediate value, and Jiangtan Park had the highest value. This result indicates that thermal comfort differences among the three parks were not determined solely by air temperature or PET. The lower neutral PET value at Jiulongtan Park does not indicate a more comfortable thermal environment; rather, it may reflect greater thermal exposure and relatively lower thermal tolerance among users under the observed site conditions. In contrast, the higher neutral PET value at Jiangtan Park suggests that respondents there exhibited relatively higher thermal tolerance during the observed hot-weather period. Overall, the differences among the three parks resulted from the combined effects of spatial openness, shading conditions, underlying surface materials, waterfront accessibility, humidity conditions, and user activity patterns.
(2) Elevation stratification affected thermal comfort by changing the spatial relationship between park users, waterfront spaces, and upper activity areas. In the sampled parks, the hydrophilic layer was closest to the river and mainly consisted of riverbank spaces, soft or semi-natural underlying surfaces, and open waterfront interfaces. This layer recorded the highest wind speed, and its PET range was lower than that of the elastic layer. However, the relatively low PET in the hydrophilic layer should not be interpreted as the independent effect of wind speed. Instead, it should be understood as the combined result of proximity to the water body, evaporative cooling, open waterfront interfaces, underlying surface materials, and local shading. The elastic layer showed the highest PET range among the three elevation levels. This indicates that the transitional zone between the waterfront space and the upper platforms may be the area most prone to heat accumulation during hot-weather periods.
The elastic layer usually contains hard-paved walkways, terraces, and transitional activity spaces. These areas are exposed to strong Thermal Radiation but lack continuous shading. At the same time, their intermediate elevation weakens the direct cooling influence of the waterfront, while heat stored in hard materials such as granite, concrete, and bluestone further increases radiant thermal stress. Therefore, the elastic layer became a key thermal-risk zone in the sampled riverside parks. The PET range of the active layer was lower than that of the elastic layer, although its thermal environment still varied among different spaces. This may be related to more stable tree shading, larger activity platforms, and relatively open spatial layouts in some upper-level activity areas. In addition, users in the active layer may have more opportunities to choose shaded resting spaces or adjust their activity patterns. Overall, the influence of elevation on thermal comfort was not a simple linear effect of height. Instead, elevation affected thermal comfort by reorganizing the coupled effects of proximity to water, shading conditions, surface heat storage, spatial openness, and user activities. Therefore, elevation stratification should be considered an important spatial mechanism for the thermal comfort design of mountain–water riverside parks.
(3) As shown in Table 5, the neutral PET values of the three sampled parks ranged from 32.49 °C to 35.74 °C. Compared with the standard PET thermal comfort reference range of 18 °C ≤ PET ≤ 23 °C [29], the maximum neutral PET observed in this study was considerably higher, reaching 35.74 °C. In addition, the neutral PET values were slightly higher than those reported in several previous outdoor thermal comfort studies in plain cities such as Shanghai, Hangzhou [30], Tianjin [31], Harbin [32], and Chengdu [33]. This difference may be related to Chongqing’s long-term hot-humid summer climate, river-valley terrain, dense riverside development, and local outdoor activity habits. Under such climatic and spatial conditions, visitors may gradually develop greater tolerance to hot environments through behavioral adjustments and psychological expectations.
In this study, thermal adaptation was primarily interpreted through the lenses of subjective thermal perception, behavior, and environmental interaction. The relatively high neutral PET values may be associated with visitors’ adaptive behaviors, such as actively seeking shade, avoiding direct solar exposure, adjusting activity intensity, and choosing waterfront or higher-elevation spaces with relatively favorable microclimatic conditions. Since physiological parameters such as skin temperature, heart rate, sweating rate, and core body temperature were not measured, the results do not directly indicate physiological adaptation. Instead, they reflect visitors’ thermal tolerance and adaptive responses in the sampled riverside parks under the observed hot-weather conditions.
(4) Compared with numerical simulation methods such as computational fluid dynamics (CFD) and ENVI-met (v5.7.2), the field measurement combined with the questionnaire survey method used in this study can capture real microclimatic conditions in riverside parks and actual users’ subjective thermal perceptions. This approach directly links measured environmental parameters with TSV and TCV responses, which is important for evaluating outdoor thermal comfort from the users’ perspective. However, this method also has limitations. Field measurements are affected by specific weather conditions, monitoring periods, and site-use patterns, making it difficult to isolate the independent contribution of each environmental factor fully. In contrast, CFD and other microclimate simulation methods can provide more detailed spatial information on airflow, radiation, and heat transfer, and can test different design scenarios under controlled boundary conditions.
The methodological framework of this study can be transferred to other waterfront cities, including mountain riverfront cities, hot-humid riverside cities, tropical waterfront cities, dry-hot waterfront green spaces, and temperate waterfront public spaces. However, specific thermal comfort thresholds, neutral PET values, and design implications should be calibrated locally based on climate background, terrain conditions, water-body form, vegetation structure, underlying surface materials, user behavior, clothing insulation, activity intensity, and local thermal adaptation background. Therefore, this study should be regarded as an empirical field-based assessment under observed hot-weather conditions, rather than a universal model applicable to all summer weather conditions or all waterfront cities.
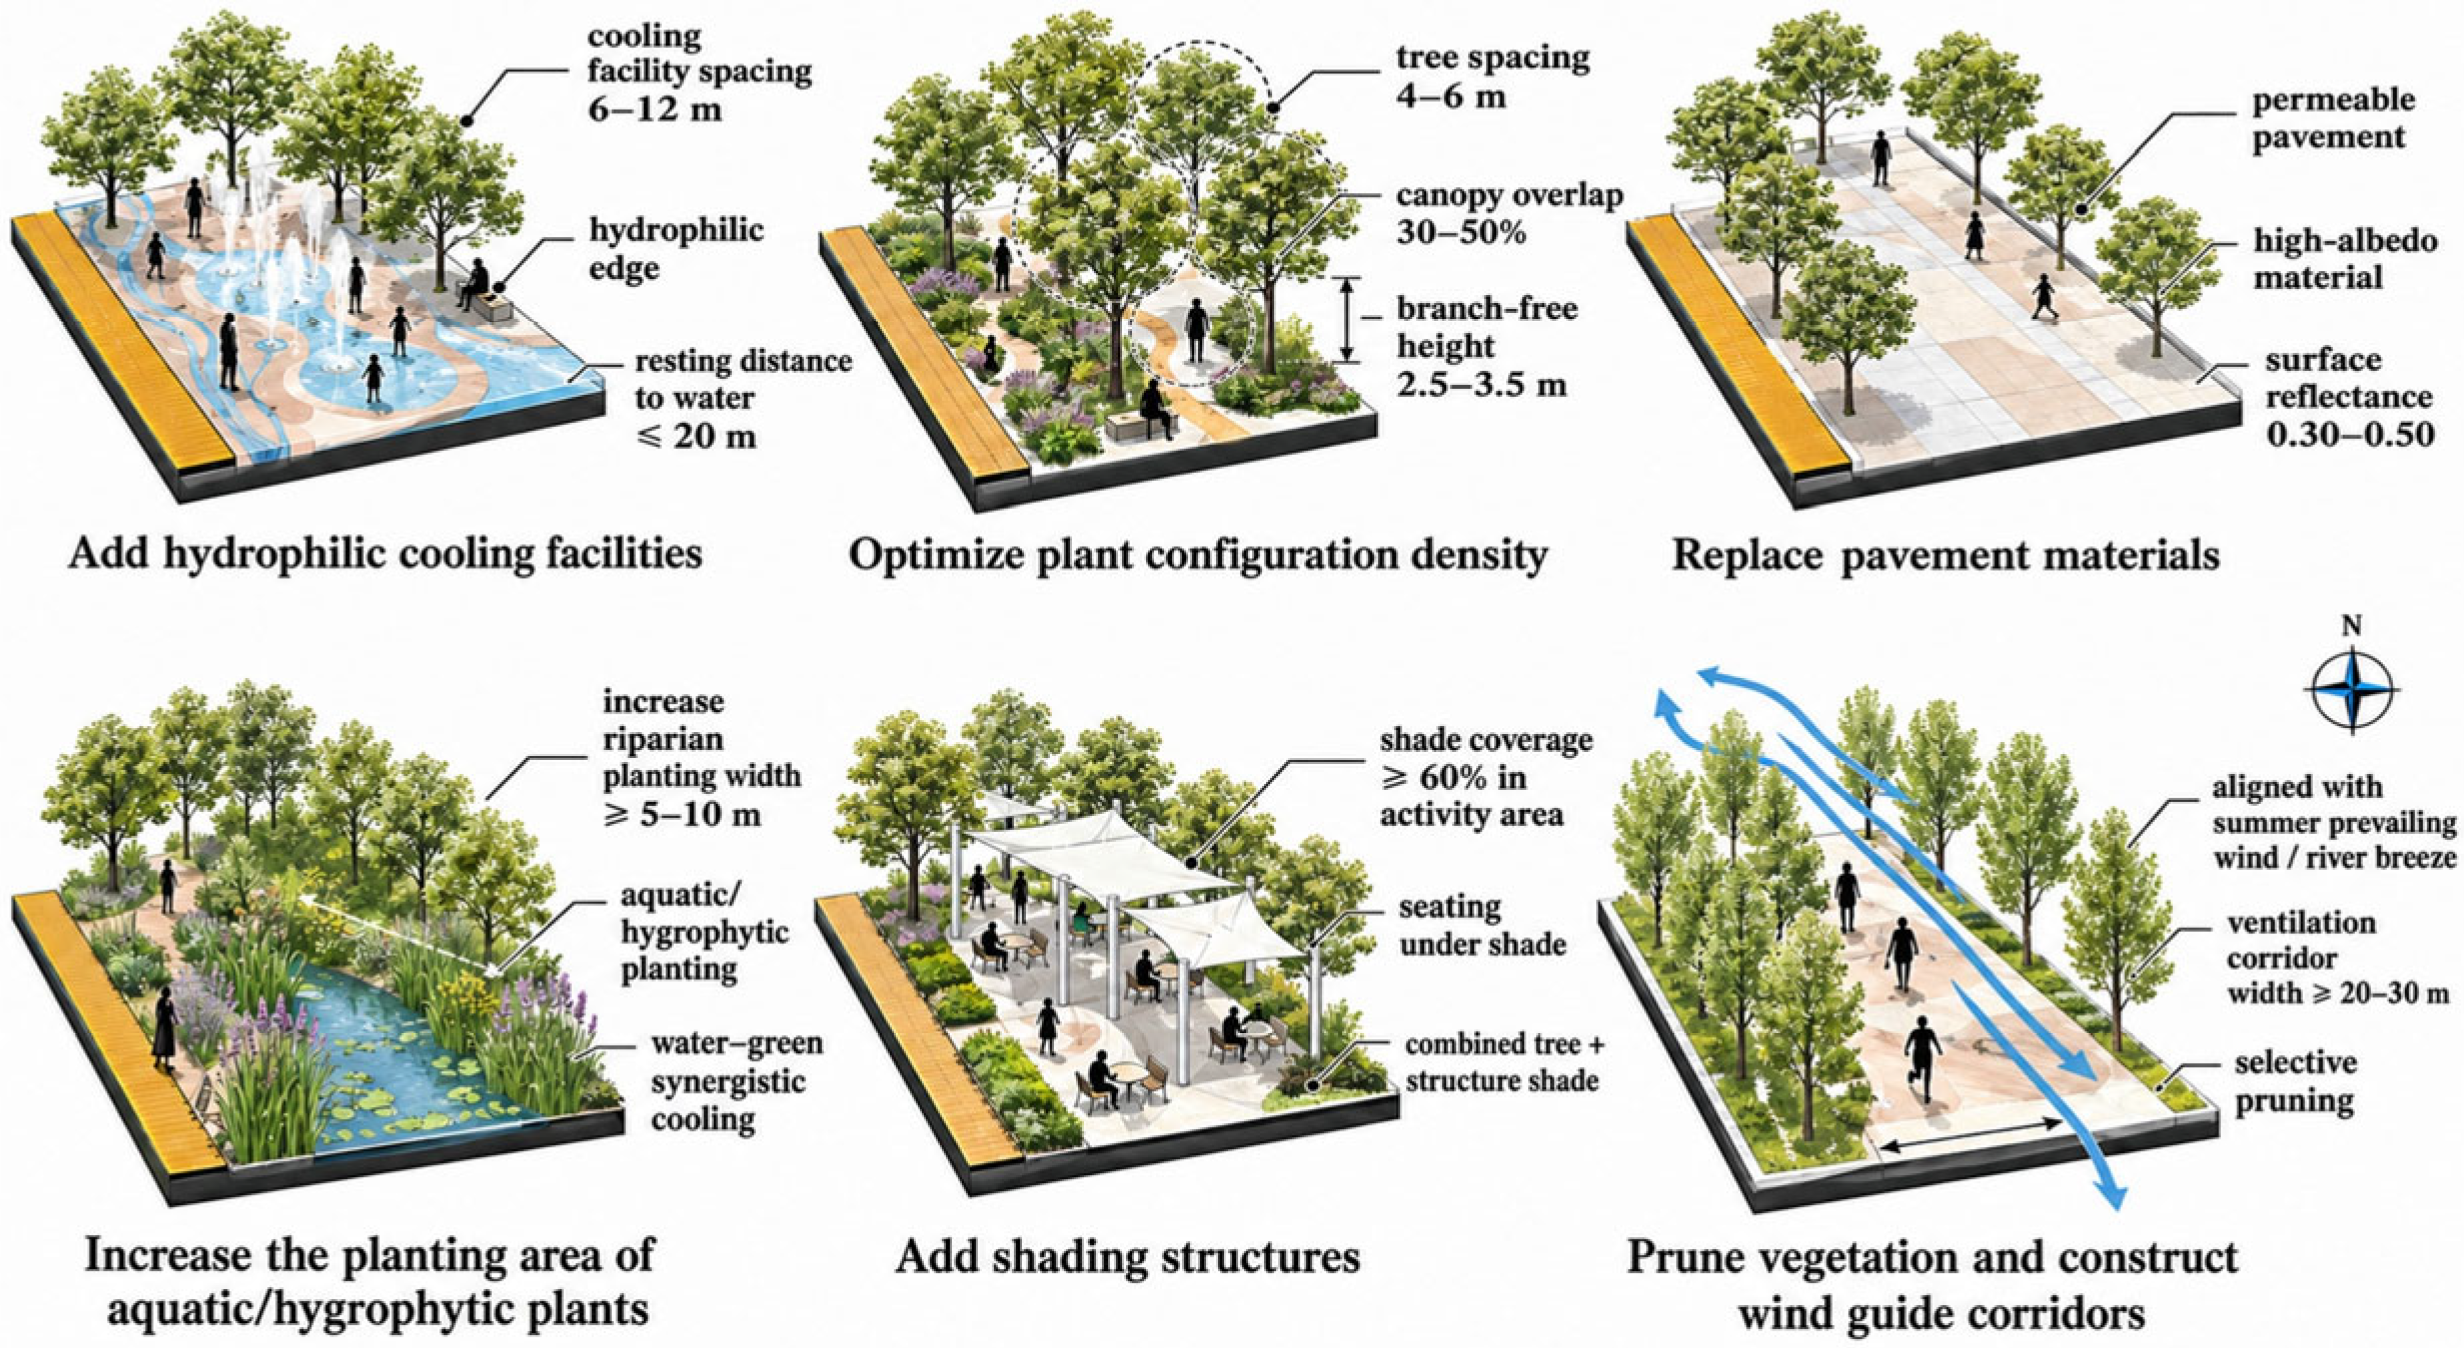
(5) Based on the observed microclimatic differences and subjective thermal responses, differentiated spatial compensation strategies could be considered for the three parks. For Jiulongtan Park, where strong Thermal Radiation and high black-globe temperatures were observed, radiation-shielding strategies could be prioritized. These may include increasing continuous tree-canopy coverage in exposed activity spaces, adding temporary or permanent shading facilities, and using permeable or low-heat-storage pavement materials where appropriate. For Coral Park, where high humidity and weak air movement may contribute to a stuffy thermal environment, ventilation-oriented landscape adjustment could be considered. For example, overly dense understory vegetation and enclosed forest edges could be moderately thinned while maintaining sufficient canopy shade. For Jiangtan Park, strengthening water–green synergistic cooling may help improve thermal comfort near the waterfront. This could include increasing riparian vegetation continuity, adding wetland or aquatic planting where site conditions allow, and improving pavement permeability to support evaporative cooling. These strategies should be regarded as preliminary planning implications derived from observed microclimatic differences, rather than as fixed quantitative design standards. Figure 19 presents a conceptual optimization framework rather than specific engineering parameters.

6. Conclusions

This study investigated summer thermal comfort in three representative riverside parks in Chongqing—Jiulongtan Park, Coral Park, and Jiangtan Park—by combining field microclimate measurements, PET calculation, and TSV/TCV questionnaire surveys. The results showed strong outdoor thermal stress during the observed hot-weather period, with a maximum air temperature of 43.7 °C and a maximum black globe temperature of 61.6 °C. Shading conditions significantly influenced subjective thermal responses: fully shaded spaces had a higher proportion of comfortable responses, whereas unshaded spaces were mainly associated with “warm,” “hot,” and “uncomfortable” votes. Elevation stratification also affected thermal comfort. The hydrophilic layer recorded the highest wind speed. In contrast, the elastic layer exhibited the widest PET range, indicating that thermal comfort in mountain–water riverside parks is jointly influenced by elevation, proximity to water, shading, underlying surface materials, and spatial openness.
Regression analysis using MTSV indicated that the neutral PET values for the three parks ranged from 32.49 °C to 35.74 °C. The regression models for Jiulongtan Park, Coral Park, and Jiangtan Park were all statistically significant. The interpretation of the results was based primarily on the overall model fit, F-test results, and neutral PET values, rather than solely on R2 values. Spearman correlation analysis further showed that PET, MTSV, and MTCV were positively correlated with air temperature, black globe temperature, mean radiant temperature, and relative humidity. In contrast, wind speed was negatively correlated with PET. These results indicate that both objective microclimatic conditions and subjective human thermal responses should be considered when evaluating outdoor thermal comfort in hot-humid riverside parks.
Due to time limitations, the findings of this study were based on field measurements conducted during a typical three-day summer heat event. They should not be generalized to the entire summer season or to all weather conditions. Future research should combine long-term microclimate monitoring, larger questionnaire samples, and multi-city comparative studies covering sunny, cloudy, pre- and post-rainfall conditions, as well as different levels of heat intensity, to further verify the seasonal representativeness and statistical robustness of the findings.

Author Contributions

All authors contributed equally to this work. M.W. wrote the main manuscript text; H.Z. prepared the figures and tables for this manuscript; J.Z. provided the project research ideas and oversaw quality control; and J.A. was involved in the data analysis and thesis writing. All authors have read and agreed to the published version of the manuscript.

Funding

This study was supported by the Chongqing Higher Education Teaching Reform Research Project, “Research on the Teaching Model Reform Path of Integrating Virtual Reality Technology into Urban and Rural Social Comprehensive Surveys” [Project No. 244063], and the Chongqing Municipal Education Commission Science and Technology Research Program, “Comprehensive Evaluation of the Ecological Benefits of Chongqing Nanshan Botanical Garden” [Project No. KJQN202300757].

Institutional Review Board Statement

Ethical review and approval were waived for this study because the survey data were fully anonymized and did not include sensitive personal information. Based on the national legislation and the consistent policy of Chongqing Jiaotong University’s Academic Ethics and Technology Ethics Committee, formal ethical approval was waived for this study.

Informed Consent Statement

Informed consent was obtained from all participants before the questionnaire and field measurements.

Data Availability Statement

The data that support the findings of this study are available from the corresponding author upon reasonable request.

Conflicts of Interest

The authors declare no conflicts of interest.

Abbreviations

The following abbreviations are used in this manuscript:
TSVThermal Sensation Vote
TCVThermal Comfort Vote
TmrtMean Radiant Temperature
PETPhysiological Equivalent Temperature
WMOWorld Meteorological Organization
SET*Standard Effective Temperature
UTCIUniversal Thermal Climate Index
PMVPredicted Mean Vote
IGSInformal Green Spaces
SVFSky View Factor
MTCVMean Thermal Comfort Vote
MTSVMean Thermal Sensation Vote
CFDComputational Fluid Dynamics
TaAir Temperature
TgBlack Globe Temperature
RHRelative Humidity

References

  1. Chai, Y.P.; Zhao, Z.H. An Analysis of Justice Orientation in China’s Ecological Civilization Construction. Moral. Civiliz. 2026, 148–158. [Google Scholar] [CrossRef]
  2. Si, W.X. China’s Advantages, Way of Thinking, and Realization Path in Building an Ecological Civilization. Southeast Acad. Res. 2024, 6, 128–139. [Google Scholar] [CrossRef]
  3. Yan, C.Y.; Yao, S.B. Analysis of global and China climate change characteristics and trends. China Meteorol. News 2025, 1–4. [Google Scholar] [CrossRef]
  4. Liu, Y.; Zhang, Y.N. Study on the correlation between extreme hot weather and government health expenditure in China. Med. Soc. 2023, 36, 52–56. [Google Scholar] [CrossRef]
  5. Milošević, D.; Trbić, G.; Savić, S.; Popov, T.; Ivanišević, M.; Marković, M.; Ostojić, M.; Dunjić, J.; Fekete, R.; Garić, B. Biometeorological conditions during hot summer days in diverse urban environments of Banja Luka (Bosnia and Herzegovina). Geogr. Pannonica 2022, 26, 29–45. [Google Scholar] [CrossRef]
  6. Fang, Z.; Feng, X.; Lin, Z. Investigation of PMV model for evaluation of the outdoor thermal comfort. Procedia Eng. 2017, 205, 2457–2462. [Google Scholar] [CrossRef]
  7. Acero, J.A.; Herranz-Pascual, K. A comparison of thermal comfort conditions in four urban spaces by means of measurements and modeling techniques. Build. Environ. 2015, 93, 245–257. [Google Scholar] [CrossRef]
  8. Cheng, Y.; Niu, J.; Gao, N. Thermal comfort models: A review and numerical investigation. Build. Environ. 2012, 47, 13–22. [Google Scholar] [CrossRef]
  9. Hoppe, P.R. The physiological equivalent temperature—A universal index for the biometeorological assessment of the thermal environment. Int. J. Biometeorol. 1999, 43, 71–75. [Google Scholar] [CrossRef]
  10. Zhang, L.; Wei, D.; Hou, Y.; Du, J.; Liu, Z.A.; Zhang, G.; Shi, L. Outdoor thermal comfort of urban park—A case study. Sustainability 2020, 12, 1961. [Google Scholar] [CrossRef]
  11. Cai, X.; Shan, X.; Zhou, Z.; Kang, X.; Deng, Q. Investigation and prediction of outdoor thermal comfort under different protection and activity intensity conditions in summer in Wuhan. Sustainability 2024, 16, 3628. [Google Scholar] [CrossRef]
  12. Alhamayani, A.D.; Sun, Q.; Hallinan, K.P. Estimating smart Wi-Fi thermostat-enabled thermal comfort control savings for any residence. Clean Technol. 2021, 3, 743–760. [Google Scholar] [CrossRef]
  13. Alhamayani, A.D.; Sun, Q.; Hallinan, K.P. An improved method to estimate savings from thermal comfort control in residences from smart Wi-Fi thermostat data. Clean Technol. 2022, 4, 395–406. [Google Scholar] [CrossRef]
  14. Chen, L.X.; Deng, Y.L.; Zhang, Y.Z.; Wang, Y. Study on the cold island effect of landscape characteristics of urban parks in Chengdu. Chin. Landsc. Archit. 2023, 39, 132–138. [Google Scholar] [CrossRef]
  15. Topak, F.; Pavlak, G.S.; Pekeriçli, M.K.; Wang, J.; Jazizadeh, F. Collective comfort optimization in multi-occupancy environments by leveraging personal comfort models and thermal distribution patterns. Build. Environ. 2023, 239, 110401. [Google Scholar] [CrossRef]
  16. Xiao, X.D.; Ding, M.; Dong, L.; Wang, Y.; Wang, L. Study on the influence of park characteristics and distance from the water area on summer temperature and humidity effect: A case study of Suzhou Industrial Park. Chin. Landsc. Archit. 2021, 37, 48–53. [Google Scholar] [CrossRef]
  17. Manavvi, S.; Rajasekar, E. Evaluating outdoor thermal comfort in urban open spaces in a humid subtropical climate: Chandigarh, India. Build. Environ. 2022, 209, 108659. [Google Scholar] [CrossRef]
  18. Liu, F.F.; Yan, W.J.; Kong, F.H.; Yin, H.W.; Ban, Y.L.; Bin Xu, W. A review on the urban green space cooling effect based on field measurement of air temperature. Chin. J. Appl. Ecol. 2017, 28, 1387–1396. [Google Scholar] [CrossRef]
  19. Nikolopoulou, M.; Baker, N.; Steemers, K. Thermal comfort in outdoor urban spaces: Understanding the human parameter. Sol. Energy 2001, 70, 227–235. [Google Scholar] [CrossRef]
  20. Huang, R.X.; Yu, K.Y.; Liu, J. Analysis of the influencing factors of park thermal comfort under extreme hot weather: Taking Chating Park in Fuzhou City as an example. Chin. Landsc. Archit. 2024, 40, 99–105. [Google Scholar] [CrossRef]
  21. Zhang, C.F. Mountain City Plaza Kuang-Ao and Design Optimization. Master’s Thesis, Chongqing Jiaotong University, Chongqing, China, 2024. [Google Scholar] [CrossRef]
  22. Liu, H.M.; Ma, Z.Y.; Li, M.; He, B.J. Examination and evaluation of urban heat island effect based on satellite remote sensing: Taking Wuhan as an example. J. Hum. Settl. Environ. West China 2023, 38, 38–45. [Google Scholar] [CrossRef]
  23. Zhang, J.; Li, K.M.; Zhao, L.H. Characteristics of evaluation on subjective thermal comfort in different outdoor spaces in summer in hot and humid areas. Build. Sci. 2019, 35, 8–24. [Google Scholar] [CrossRef]
  24. Liu, B.Y.; Wei, D.X. Review and prospect of thermal comfort in green space. Planner 2017, 33, 02–107. [Google Scholar]
  25. Zhang, J.; Zhang, G.; Liu, J.; Yi, M.; Tang, G. The impact of thermal comfort on visitors’ recreational activities in riverside and under-bridge parks in mountainous cities: Chongqing case. Int. J. Biometeorol. 2026, 70, 6. [Google Scholar]
  26. Zhang, J.J.; Liu, J.J.; Ai, Q.; Liu, Q. Comparison and analysis of thermal comfort in summer between riverside parks and parks under the urban viaducts in Chongqing. J. Southwest Univ. Nat. Sci. Ed. 2022, 44, 97–209. [Google Scholar] [CrossRef]
  27. Shashua-Bar, L.; Hoffman, M.E. Quantitative evaluation of passive cooling of the UCL microclimate in hot regions in summer, case study: Urban streets and courtyards with trees. Build. Environ. 2004, 39, 087–1099. [Google Scholar] [CrossRef]
  28. Halverson, M.A.; Hart, R.; Athalye, R.A.; Rosenberg, M.I.; Richman, E.E.; Winiarski, D.W. ANSI/ASHRAE/IES Standard 90.1-2013 Preliminary Determination: Qualitative Analysis; Pacific Northwest National Laboratory (PNNL): Richland, WA, USA, 2014.
  29. Huang, H.J.; Jie, P.Y. Study on the characteristics of urban space thermal environment and the evaluation of crowd thermal comfort during the high-temperature heatwave: A case study of Yuzhong District, Chongqing. Mod. Urban Res. 2024, 1, 8–106. [Google Scholar]
  30. Yang, L. Study on Microclimate and Thermal Comfort of Green Space in Urban Parks in Winter and Summer: A Case Study of Comprehensive Parks in Qingdao. Master’s Thesis, Qingdao University of Technology, Qingdao, China, 2023. [Google Scholar]
  31. Wei, D.X.; Li, Z.Z.; Huo, Y.H. Research on the winter and summer thermal comfort evaluation of the riverside space—Taking the Haihe River in the central urban area of Tianjin as an example. Landsc. Des. 2025, 23, 12. [Google Scholar]
  32. Xi, T.Y.; Lei, Y.S. Study on people’s outdoor thermal comfort in public city park of severely cold regions in summer and winter. Build. Sci. 2021, 37, 2–60. [Google Scholar] [CrossRef]
  33. Mao, Y.Y.; Han, K. Exploration on outdoor thermal comfort of urban parks: Cases of two urban parks in Chengdu. Urban Archit. 2023, 20, 7–91. [Google Scholar] [CrossRef]
Figure 1. The three study areas of riverside parks in Chongqing.
Sustainability 18 04990 g001
Figure 2. The plan and distribution of measurement points of Jiulongtan Park.
Sustainability 18 04990 g002
Figure 3. The plan and distribution of measurement points in Coral Park.
Sustainability 18 04990 g003
Figure 4. The plan and distribution of measurement points of Jiangtan Park.
Sustainability 18 04990 g004
Figure 5. Temporal variation in air temperature in the three riverside parks.
Sustainability 18 04990 g005
Figure 6. Temporal variation in black globe temperature in the three riverside parks.
Sustainability 18 04990 g006
Figure 7. Temporal variation in relative humidity in the three riverside parks.
Sustainability 18 04990 g007
Figure 8. Temporal variation in thermal radiation in the three riverside parks.
Sustainability 18 04990 g008
Figure 9. Gender distribution of respondents.
Sustainability 18 04990 g009
Figure 10. Age distribution of respondents.
Sustainability 18 04990 g010
Figure 11. Thermal Sensation Vote (TSV).
Sustainability 18 04990 g011
Figure 12. Thermal Comfort Vote (TCV).
Sustainability 18 04990 g012
Figure 13. PET variation in Jiulongtan Park.
Sustainability 18 04990 g013
Figure 14. PET variation in Coral Park.
Sustainability 18 04990 g014
Figure 15. PET variation in Jiangtan Park.
Sustainability 18 04990 g015
Figure 16. Correlation analysis among microclimatic variables, PET, MTSV, and MTCV.
Sustainability 18 04990 g016
Figure 17. Relationship between MTCV and PET.
Sustainability 18 04990 g017
Figure 18. Relationship between MTSV and PET.
Sustainability 18 04990 g018
Figure 19. Schematic diagram of thermal comfort optimization.
Sustainability 18 04990 g019
Table 1. Basic information on the measurement points in three riverside parks in Chongqing.
Point IDMeasurement
Point
Platform LevelElevation
(m)
Ground Surface MaterialSpecific Heat Capacity
kJ/(kg·°C)
Thermal Conductivity
W/(m·K)
Existing PlantsShading EnvironmentSVF
A1Sustainability 18 04990 i001Hydrophilic
layer
165Predominantly silt0.84–0.920.25–2.10Bamboo
Willow
Unshaded0.71
A2Sustainability 18 04990 i002Bermudagrass0.92
A3Sustainability 18 04990 i003Common reed0.92
A4Sustainability 18 04990 i004Elastic layer178Permeable bricks0.85–0.950.20–0.50Chinese tallow tree0.61
A5Sustainability 18 04990 i005Active layer197Granite0.82–0.922.50–3.500.88
A6Sustainability 18 04990 i006Permeable bricks0.85–0.950.20–0.50CamphorFully shaded0.22
A7Sustainability 18 04990 i007Elastic layer185Granite0.82–0.922.50–3.50Ficus microcarpa0.11
A8Sustainability 18 04990 i008ChinaberryPartially shaded0.47
A9Sustainability 18 04990 i009Autumn willowUnshaded0.66
B1Sustainability 18 04990 i010Active layer180Concrete + granite0.90–0.961.50–2.80Ficus virens +
Stair-step grass
Fully shaded0.15
B2Sustainability 18 04990 i011Granite0.82–0.922.50–3.50Partially shaded0.39
B3Sustainability 18 04990 i012Concrete + granite0.90–0.961.50–2.80Unshaded0.78
B4Sustainability 18 04990 i013Elastic layer175Grass paver0.80–0.900.30–0.80Chinese tallow tree +
Bermudagrass
Fully shaded0.07
B5Sustainability 18 04990 i014Partially shaded0.49
B6Sustainability 18 04990 i015175Granite0.82–0.922.50–3.50Unshaded0.76
B7Sustainability 18 04990 i016Hydrophilic
layer
165Predominantly
lawn
0.90–1.050.15–0.35Maiden grass0.87
B8Sustainability 18 04990 i0170.84–0.920.25–2.10Bermudagrass0.93
B9Sustainability 18 04990 i0180.90–1.050.15–0.35Cogongrass0.81
C1Sustainability 18 04990 i019Active layer185Permeable bricks0.85–0.950.20–0.50Ficus virens +
Bermudagrass
Fully shaded0.11
C2Sustainability 18 04990 i020Bluestone +
permeable bricks
0.86–0.940.8–1.5Partially shaded0.63
C3Sustainability 18 04990 i021Permeable bricks +
granite
0.84–0.931.20–2.00Unshaded0.97
C4Sustainability 18 04990 i022Elastic layer175Granite0.82–0.922.50–3.50Ficus virensFully shaded0.79
C5Sustainability 18 04990 i023170Bluestone slab0.882.00–3.00Chinese hackberryPartially shaded0.19
C6Sustainability 18 04990 i024170Concrete0.88–0.961.50–2.30Unshaded0.53
C7Sustainability 18 04990 i025Hydrophilic
layer
160Bluestone slab0.882.00–3.000.86
C8Sustainability 18 04990 i026Cobblestone + silt0.85–0.930.50–1.800.77
C9Sustainability 18 04990 i0270.78
Note: The specific heat capacity and thermal conductivity values are reference thermophysical parameters compiled from building material databases and published data. They were not measured in the field. Typical value ranges were used because these properties vary with material density, porosity, moisture content, mineral composition, and construction methods.
Table 2. Statistical data of microclimate factors in each survey area.
Jiulongtan
Park
Coral ParkJiangtan Park
Air Temperature (Ta)/°CMax43.742.843.1
Min31.230.130.6
Black Globe Temperature (Tg)/°CMax61.658.760.2
Min32.333.832.4
Relative Humidity (RH)/%Max77.677.576.1
Min52.753.752.8
Thermal Radiation (R)/(W/m2)Max728.3686863.2
Min17.938.427.1
Max represents the maximum value among all measurement points within the study area, and Min represents the minimum value among all measurement points within the study area.
Table 3. Comparison of the differences in thermal environment regulation by river winds at different levels.
Platform LevelWind Speed (m/s)Thermal Index (PET/°C)
Hydrophilic Layer1.64 ± 0.3931.30–44.00
Elastic Layer0.87 ± 0.3536.00–46.10
Active Layer1.21 ± 0.2826.60–42.80
Table 4. Regression results between PET and MTSV in the three riverside parks.
ParkR2Adjusted R2F(df)Model p-ValueStd. ErrorNeutral PET/°C
Jiulongtan Park0.8340.826105.285 (2, 42)<0.0010.32932.49
Coral Park0.8600.853128.541 (2, 42)<0.0010.22135.07
Jiangtan Park0.9400.937327.194 (2, 42)<0.0010.20835.74
Table 5. Comparison of neutral PET values between Chongqing and selected plain cities in China.
CityLatitude & LongitudeThermal IndexSummer Thermal Neutral Temperature (°C)
Shanghai31.23 N, 121.49 EPET29.16–32.04
Guangzhou22.3–24.1 N, 112.8–114.2 EPET25.80
Chengdu30.66 N, 104.07 EPET27.01
Hangzhou30.25 N, 120.16 EPET23.60
Harbin45.41 N, 126.37 EPET20.00
Tianjin39.13 N, 117.20 EPET23.30
Chongqing
(This study)
29.56 N, 106.55 EPET32.49–35.74
Disclaimer/Publisher’s Note: The statements, opinions and data contained in all publications are solely those of the individual author(s) and contributor(s) and not of MDPI and/or the editor(s). MDPI and/or the editor(s) disclaim responsibility for any injury to people or property resulting from any ideas, methods, instructions or products referred to in the content.