4.2.1. Heterogeneity Analysis
To further test Hypothesis 2, which posits that the impact of digitalization on household carbon emissions is heterogeneous, this study conducts heterogeneity tests and analyses from three perspectives: individual characteristics, household characteristics, and regional characteristics.
(1) Individual Characteristics Heterogeneity. Social status reflects a comprehensive measure of income level, educational attainment, and occupation. It influences not only individuals’ ability and motivation to access and use digital technologies but also their consumption scale and structure. Environmental awareness, on the other hand, represents an individual’s perception of environmental issues, degree of concern, and willingness to adopt pro-environmental behaviors. It determines how strongly individuals recognize and respond to the low-carbon potential of digitalization. Therefore, this paper argues that the impact of digitalization on household carbon emissions exhibits heterogeneity among individuals of different social status and environmental awareness.
According to the CFPS questionnaire, respondents were asked, “What score would you give yourself for your social status in your local area?” Individuals who rated themselves as 1 were categorized as low social status, while those who rated themselves as 5 were categorized as high social status (N = 1007), those with scores of 2–4 as middle social status (N = 10,494), and those with a score of 5 as high social status (N = 2104). Similarly, based on the question “How serious do you think environmental problems are in China?”, individuals who gave a score of 0 were classified as low environmental awareness (N = 779), those with scores of 2–9 as middle environmental awareness (N = 10,658), and those with a score of 10 as high environmental awareness (N = 2168). Given that this study focuses on differences across extreme groups, the subsequent analysis primarily reports the regression results for the low and high social status groups, as well as the low and high environmental awareness groups.
The results of the subgroup regressions are presented in
Table 7. Columns (1) and (2) display the results for the heterogeneity test based on social status. The coefficient of the core explanatory variable is statistically insignificant for the low social status group, but significantly positive for the high social status group. Individuals with low social status tend to have poorer access to digital infrastructure, lower penetration of digital devices, and weaker digital literacy. Consequently, their overall level of digitalization is relatively low, and the actual impact of digitalization on their lifestyle, energy use, and consumption behavior remains limited. In contrast, the high social status group not only demonstrates a higher degree of digitalization but also possesses higher income and consumption capacity. While enjoying the convenience brought by digital technologies, they are also more likely to engage in high-carbon consumption activities, such as online shopping, food delivery, and commuting with private vehicles. This aligns with status consumption theory, which posits that high-status groups tend to signal their class identity through scarce, symbolic consumption to satisfy their display needs. Digital technologies expand high-end consumption channels, strengthen the social display of consumption, and further stimulate high-carbon consumption.
Columns (3) and (4) report the heterogeneity results based on environmental awareness. The coefficient of the core explanatory variable is significantly positive for the low environmental awareness group, but statistically insignificant for the high environmental awareness group. Environmental behavior theory indicates that environmental awareness directly determines willingness and intensity to engage in environmentally friendly actions. Individuals with stronger environmental consciousness tend to actively apply digital technologies in environmentally friendly and low-carbon behaviors, thereby mitigating the potential carbon-intensive effects of digitalization. Moreover, such individuals are more likely to use digital services in a rational and restrained manner, avoiding unnecessary or excessive consumption that could lead to additional environmental costs. In addition, Chow tests for coefficient differences across groups yield p-values of 0.034 and 0.008, respectively. Both are statistically significant, indicating that the differences in coefficients across groups are statistically meaningful, which further supports the heterogeneity findings discussed above.
(2) Household Characteristics Heterogeneity. According to Menz and Welsch [
60] and Wang et al. [
61], compared with younger individuals, elderly people generally have lower income, more conservative and rational consumption behaviors, and distinct consumption scales and structures. The elderly often face both physiological and psychological barriers in using digital devices, while limitations in social service provision and traditional cultural perceptions further contribute to the digital divide. Therefore, household aging is expected to influence both the level of digitalization and household carbon emissions. In addition, social capital typically reflects the density of a household’s social networks, the quality of interpersonal relationships, the frequency of reciprocal interactions, and the degree of community trust. It shapes consumption behavior, lifestyle, access to information, and value orientations, thereby affecting the relationship between digitalization and carbon emissions. Therefore, this paper argues that the impact of digitalization on household carbon emissions exhibits heterogeneity among households of different levels of aging and social capital.
This study measures household aging by the proportion of members aged 65 and above within a household, and measures household social capital by per capita gift-giving expenditure. For both variables, sample households are divided annually into terciles. Households in the top 30 percent are categorized as high aging households (N = 4309) or high social capital households (N = 3775), those in the bottom 30 percent are categorized as low aging households (N = 7973) or low social capital households (N = 4652), and the remaining households are categorized as medium aging households (N = 1323) or medium social capital households (N = 5178). The regression results for the low- and high-level groups are shown in
Table 8.
In
Table 8, columns (1) and (2) show that the increase in digitalization level is positively associated with household carbon emissions, but this relationship becomes statistically insignificant among highly aged households. The life cycle theory shows that household consumption patterns adjust according to changes in the age structure of its members. Households with low aging levels are generally composed of middle-aged and young members who are more receptive to and frequent users of digital technologies. Their digital activities are closely linked to high-carbon consumption behaviors such as online shopping, streaming entertainment, and the use of smart home devices. In contrast, elderly households tend to maintain traditional consumption habits and rely less on digital platforms in daily life; therefore, changes in digitalization have a limited impact on their overall energy consumption and carbon emissions. Columns (3) and (4) indicate that the effect of digitalization on household carbon emissions is more pronounced among households with lower social capital. Such households are less likely to rely on informal networks, community assistance, or interpersonal exchanges to obtain resources and services. Instead, they depend more on market-based transactions and digital platforms to meet their daily needs, which increases their exposure to carbon-intensive consumption patterns. Conversely, households with higher levels of social capital are more strongly influenced by traditional norms and reciprocal ethics, emphasizing face-to-face interactions and offline social engagements. These behaviors, to some extent, reduce their dependence on high-carbon digital services. Furthermore, Chow tests produce
p-values of 0.018 and 0.010, indicating that the estimated coefficients differ significantly across groups, providing additional evidence in support of the heterogeneity findings.
(3) Regional Characteristics Heterogeneity. The level of regional environmental governance reflects not only the local government’s commitment to ecological protection and the intensity of its regulatory enforcement, but also the strength of environmental regulations and the availability of environmental infrastructure that residents experience. These factors jointly influence household energy use, consumption patterns, and the ways in which digital technologies are applied in daily life. In addition, variations in regional energy intensity are associated with differences in economic structure, technological capability, resource endowment, and policy orientation. Therefore, both the level of environmental governance and the degree of energy intensity at the regional level are likely to shape the relationship between digitalization and household carbon emissions.
This study measures environmental governance by the ratio of investment in environmental pollution control to regional GDP, and measures energy intensity by the ratio of carbon emissions to GDP. Regions in the top 30 percent are defined as having high environmental governance (N = 3624) or high energy intensity (N = 4172), those in the bottom 30 percent are categorized as low environmental governance (N = 4683) or low energy intensity (N = 3624), and the remaining regions are categorized as medium environmental governance (N = 5298) or medium energy intensity (N = 3905). The results of the subgroup regressions for low and high environmental governance, as well as low and high energy intensity, are reported in
Table 9 below.
According to
Table 9, columns (1) and (2) show that the impact of digitalization on household carbon emissions is stronger and more significant in regions with lower levels of environmental governance. Based on environmental regulation theory, stringent environmental regulations curb carbon emissions growth by constraining high-carbon activities and promoting the substitution of clean energy. In areas with weak environmental governance, insufficient regulatory oversight and a lack of technological support allow the positive carbon effects of digitalization to be more fully manifested. In contrast, regions with higher environmental governance tend to have more stringent policy guidance and cleaner energy structures, which can partially offset the carbon-increasing effect associated with digitalization. Columns (3) and (4) report the heterogeneity results with respect to energy intensity. The findings indicate that the effect of digitalization on household carbon emissions is greater and more significant in regions with higher energy intensity compared with regions characterized by lower energy intensity. As Du et al. [
62] pointed out, in areas with lower energy intensity, even if residents do not alter their consumption scale or habits, the cleaner and more sustainable production of goods and services helps to reduce associated carbon emissions. Conversely, regions with carbon-intensive energy structures amplify the emission-increasing effects brought about by digitalization. In addition, Chow tests yield
p-values of 0.055 and 0.005, respectively. Taken together, these results suggest that the estimated coefficients differ across groups, providing supplementary evidence for the heterogeneity analysis.
To enhance the rigor of the heterogeneity analysis, this study further estimates interaction models within a unified regression framework by interacting the core explanatory variable with subgroup indicators. The results are reported in
Table 10. The interaction terms are statistically significant, and their signs are broadly consistent with those obtained from the subgroup regressions, suggesting that the effect of digitalization on household carbon emissions varies across individual, household, and regional groups.
4.2.2. Mechanism Analysis
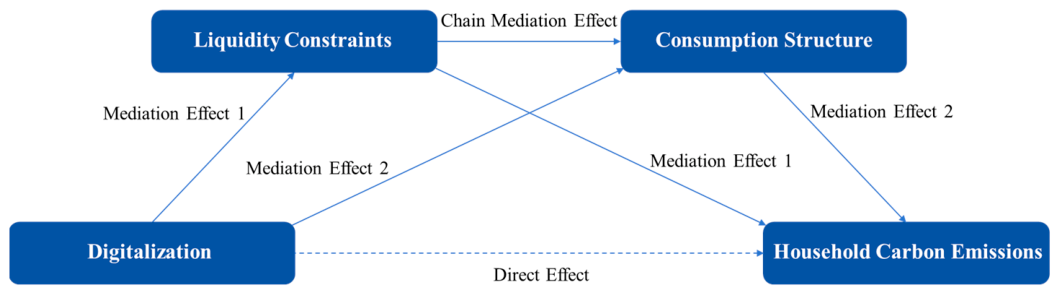
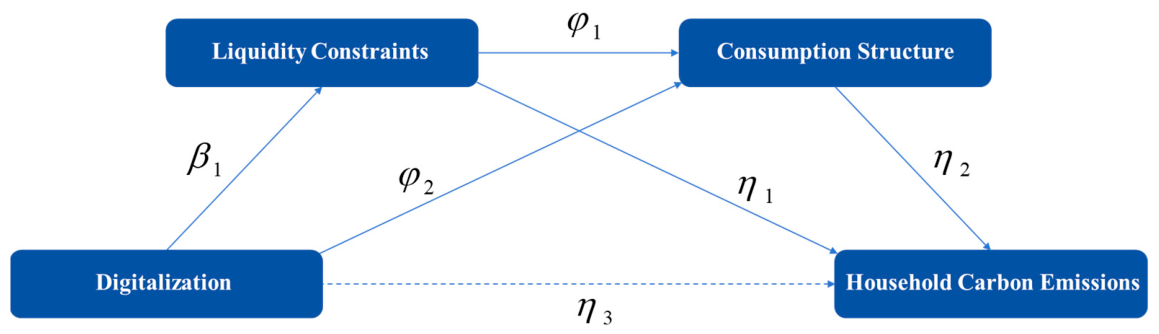
Following Formulas (6)–(8), this study conducts a chain mediation effect test to explore the mechanisms through which digitalization affects household carbon emissions. If the core explanatory variable, Digital, and the mechanism variables, liquidity and structure, are significant, this would confirm the existence of a chain mediation effect. The regression results are presented in
Table 11.
Specifically, in
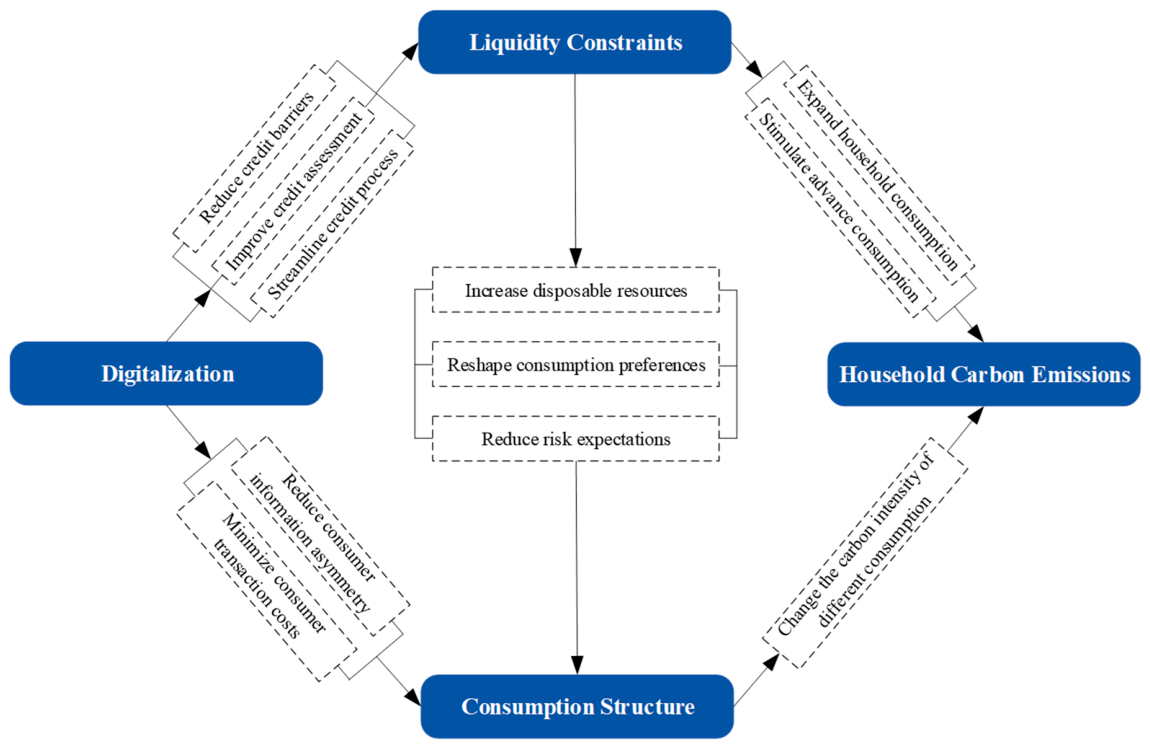
Table 11, the direct effect of the core explanatory variable Digital on the explained variable Carbon is significantly positive, with a coefficient of 0.0276. This indicates that higher levels of digitalization lead to increased household carbon emissions, further supporting Hypothesis 1. The decomposition of the indirect effects reveals several important pathways. First, the indirect effect of Digital on the mediating variable liquidity is significantly negative at 0.0304, and the effect of liquidity on Carbon is also significantly negative at 0.0378. These results suggest that digitalization alleviates household liquidity constraints, which in turn raises household carbon emissions. The estimated partial mediation effect is 0.0011, providing empirical support for Hypothesis 3. Second, the indirect effect of digital on the mediating variable structure is significantly positive at 0.0291, and structure has a significantly positive effect on carbon with a coefficient of 0.3240. This implies that improvements in digitalization can enhance or optimize household consumption structures, leading to higher carbon emissions. The corresponding partial mediation effect of 0.0094 confirms Hypothesis 4. Moreover, the mediating variable liquidity exerts a significantly negative effect on structure (0.0206), indicating that liquidity constraints hinder the upgrading of household consumption structures. Combining the effect of Digital on liquidity and that of structure on Carbon, the estimated value of the chain mediation effect is 0.0001, thereby supporting Hypothesis 5.
To further verify the robustness of these mediation effects, the Bootstrap method is applied. The specific effect values and 95% confidence intervals are obtained using a cluster-bootstrap with 1000 replications, resampling at the household level. The results, summarized in
Table 12, show that for both the direct and indirect effects, the 95% confidence intervals do not include zero, confirming their statistical significance. Among the decomposed indirect effects, the effects through liquidity constraints and consumption structure are 0.0011 and 0.0094, respectively, indicating that a one-level increase in digitalization leads to increases of 0.0011 and 0.0094 units in household carbon emissions through the relaxation of liquidity constraints and the optimization of consumption structure. The chain mediation effect is significantly estimated at 0.0002, suggesting that digitalization not only affects household carbon emissions through individual mechanisms but also operates through a sequential transmission pathway, thereby confirming the internal linkage between these two mechanisms. The total indirect effect, calculated as the sum of all decomposed indirect effects, equals 0.0107. According to the baseline regression results in
Table 3, the total effect of digitalization on household carbon emissions is 0.0342, suggesting that the mediation effects jointly account for approximately 31.29% of the total effect.
The above chain mediation test not only provides evidence on the complex transmission path through which digitalization affects household carbon emissions via liquidity constraints and consumption structure, but also addresses a limitation in previous studies that paid insufficient attention to the multiple mediating relationships between digitalization and its environmental effects. Moreover, it deepens the understanding of the intrinsic mechanisms through which digital technologies empower household economic behavior and influence environmental outcomes. These findings provide crucial empirical evidence for comprehending the internal trade-offs between digital economic development and carbon mitigation, and offer precise micro-level insights for policymakers to coordinate the advancement of digital transformation with the achievement of “dual carbon” goals.
In addition, considering that the explained variable Carbon and the mechanism variable structure are constructed using partially overlapping expenditure categories, there is a potential concern of mechanical correlation, which may affect the identification of the chain mediation effect. To address this issue, this study constructs an alternative measure of carbon emissions by excluding the expenditure categories used in the consumption-structure, thereby reducing potential overlap in variable construction. Based on the baseline mediation framework, this study re-estimates the model using this non-overlapping measure, and the results are reported in
Table 13. The findings show that the chain mediation effect through liquidity constraints and consumption structure remains statistically significant and retains the same direction, further strengthening the credibility of the chain mediation mechanism proposed in this paper.