Article

The Impact of Digital New Infrastructure on the Balanced Development of Digital–Real Economy Integration: Evidence for Sustainable Regional Growth


1
International Business School, Shaanxi Normal University, Xi’an 710119, China
2
Business School, Xinjiang Normal University, Ürümqi 830010, China
*
Author to whom correspondence should be addressed.
Sustainability 2026, 18(10), 4636; https://doi.org/10.3390/su18104636
Submission received: 2 March 2026 / Revised: 28 April 2026 / Accepted: 29 April 2026 / Published: 7 May 2026

Abstract

Digital new infrastructure (DNI) has emerged as a pivotal force in reshaping regional economic geography. However, the existing literature primarily focuses on its macro-growth effects, leaving a significant gap regarding whether it effectively bridges the divide in Digital–Real Economy Integration (DRI) and promotes sustainable regional development. Based on panel data from 31 provinces in China (2013–2023), this study employs a two-way fixed-effects model to empirically investigate the impact of DNI on the balanced development of DRI and its underlying mechanisms. The research findings are threefold: First, DNI acts as a critical driver of regional convergence in DRI by accelerating digital technology diffusion and facilitating digital talent mobility, thereby significantly mitigating inter-provincial disparities. Second, heterogeneity analysis reveals that the convergence effect of DNI is contingent upon regional environments: the “picking the winners” bias in fiscal expenditure inadvertently weakens the inclusive nature of DNI; conversely, a robust high-tech industrial base, financial deepening, and the “East Data, West Computing” strategy significantly enhance the convergence effect by strengthening technology absorption capacity and alleviating financing constraints. Third, threshold effect analysis confirms the catalytic role of marketization, demonstrating that a mature market environment effectively breaks the geographical stickiness of factor flows, thus amplifying the balanced growth dividends of DNI. This study not only extends the theory of regional convergence into the digital era but also provides critical policy insights for achieving sustainable and inclusive digital transformation.

1. Introduction

As a driving force behind the contemporary technological revolution and industrial paradigm shift, the digital economy has evolved into a cornerstone of high-quality development. Deepening the integration of digital technology with the real economy (Digital–Real Economy Integration, hereinafter “DRI”) is not only an inherent requirement for constructing a modern industrial system but also a strategic imperative for optimizing domestic “dual circulation” and forging new national competitive advantages. However, constrained by inherent disparities in economic foundations, industrial structures, and innovation capabilities across provinces, the development trajectory of DRI in China remains significantly imbalanced. While eastern coastal provinces have leveraged their superior factor endowments to become high-growth hubs, central and western regions often grapple with insufficient transformation momentum and shallow integration levels. This widening gap harbors the risk of further solidifying the “DRI divide” [1].
The construction of digital new infrastructure (DNI) in China has transcended simple physical deployment; it has been endowed with the profound mission of reshaping regional economic geography and serving as a “strategic public good.” Distinct from traditional infrastructure, DNI utilizes computing power as a new driving force, data as a new production factor, and computing networks as a new carrier. By integrating innovative, communication, convergent, and computational infrastructure systems, DNI provides comprehensive services—including knowledge spillovers, factor optimization, and network penetration—thereby fundamentally overcoming the constraints of the “distance decay law” and fostering cross-regional digital transformation, intelligent upgrading, and deep industrial integration [2].
By the end of 2025, China had established the world’s most extensive digital infrastructure system. According to the 2025 Statistical Bulletin of the Communications Industry released by the Ministry of Industry and Information Technology (MIIT), the total number of 5G base stations in China has reached 4.838 million, with a density exceeding 34 units per 10,000 people, achieving deep coverage from prefecture-level cities to counties and key townships [3]. From a strategic perspective, the focus of digital infrastructure has shifted from initial “scale expansion” to “spatial equalization and inclusive efficacy.” Over the past decade, the spatial configuration of China’s infrastructure has undergone a fundamental restructuring. Regarding connectivity equity, the gap in fixed-broadband penetration between eastern coastal provinces and central/western regions—which stood at a 2.8-fold disparity in 2015 (with penetration exceeding 70% in provinces like Shanghai and Jiangsu, compared to approximately 25% in western provinces such as Gansu, Qinghai, and Tibet)—has narrowed to within 1.2-fold by 2025, with administrative villages achieving a transition from “partial coverage” to “universal access.” Regarding the equalization of computing power, prior to the “East Data, West Computing” strategy, over 80% of hyper-scale data centers were concentrated in first-tier cities; however, the latest data indicates that with the cluster-based deployment of computing hubs in regions such as Guizhou, Gansu, and Ningxia, the share of data center racks in western regions has risen from 15% in 2020 to 32% in 2025, effectively alleviating the polarized “strong East, weak West” pattern. Furthermore, in terms of integration depth, infrastructure has extended beyond physical connectivity into the core of industrial processes. According to the White Paper on the Digital Economy (2025) published by the China Academy of Information and Communications Technology (CAICT), the national Industrial Internet identification and resolution system now covers all 31 provinces. Notably, the growth rate of registration volume in central and western regions has outpaced the national average for three consecutive years, signaling that infrastructure is increasingly catalyzing endogenous industrial integration in underdeveloped areas.
The transition from “point-based coverage” to “region-wide empowerment” marks a new stage of “inclusive support” for China’s digital infrastructure [4]. However, whether this physical-level equilibrium naturally translates into convergence in Digital–Real Economy Integration remains an open empirical question, which constitutes the primary motivation for this study.
From a global perspective, the socio-economic impact of digital infrastructure remains a subject of intense academic scrutiny, characterized by a persistent debate between “agglomeration externalities” and “convergence potential” [5].
In advanced economies, such as the United States and Europe, research primarily characterizes digital infrastructure as a “general-purpose technology” (GPT) that catalyzes productivity through efficiency gains and innovation diffusion [6]. Studies in these contexts often find that digital connectivity strengthens supply chain resilience and reduces market frictions [7]; however, they also caution against a “skill-biased” technological shift. As argued by Goldfarb and Tucker [8], such advancements may favor regions with high concentrations of human capital, potentially reinforcing the dominance of existing technological hubs and leading to resource polarization [9].
Conversely, evidence from developing and emerging economies highlights a more complex “double-edged sword” effect. While digital infrastructure offers underdeveloped regions the opportunity for “leapfrogging” development [10], its “inclusive efficacy” is frequently constrained by institutional and structural bottlenecks [11]. The World Bank [12] explicitly warns that without complementary investments in digital skills, mere “hardware coverage” may inadvertently exacerbate the “digital divide.” While the existing literature has extensively analyzed these disparities through traditional lenses such as financial access [13] and institutional quality [14], a comprehensive framework explaining how digital infrastructure specifically drives regional convergence remains underdeveloped.
This study seeks to complement existing research by utilizing China’s “proactive deployment” model as a pertinent empirical setting to evaluate the convergence hypothesis. We posit that the mitigation of inter-provincial DRI gaps is fundamentally rooted in a systematic restructuring of digital technology diffusion and digital talent mobility. Diverging from previous research that emphasizes polarization, this study reveals how, empowered by DNI, these two engines drive balanced development through the law of diminishing marginal returns. Specifically, we seek to answer the following questions: How does cross-regional digital technology overcome geographical stickiness to achieve knowledge decoding? And how do talent inflows into underdeveloped regions activate the digital stock of local industries? By answering these questions, this study offers a new template for whether a composite drive of “soft and hard elements” can effectively offset the polarization effects characteristic of the early digital economy, providing critical insights for global balanced development.
The contributions of this study are threefold: First, it integrates DNI, technology diffusion, talent mobility, and balanced DRI development into a unified analytical framework, re-examining the convergence hypothesis in the digital era through the perspective of “diminishing returns to factors.” Second, it clarifies and empirically validates the “hard support” role of digital technology and the “active carrier” value of digital talent, demonstrating that the synergy of soft and hard elements is critical for narrowing inter-provincial DRI gaps. Third, it provides targeted empirical evidence for optimizing digital technology diffusion paths and guiding digital talent allocation in the era of “Dual Gigabit” and “East Data, West Computing,” thereby offering policy insights for achieving balanced DRI development in late-developing regions.

2. Theoretical Analysis and Research Hypotheses

2.1. The Direct Effect of Digital Infrastructure on the Balanced Development of Digital–Real Integration

As the underlying power system supporting the deep integration of the digital and real economies, the spatial layout of digital new infrastructure in China has exhibited distinct phased characteristics. By the end of 2025, China had established the world’s largest 5G network and data center clusters, with the “hard connectivity” of provincial digital foundations largely completed. However, despite the equalization of physical infrastructure coverage, significant disparities persist across provinces regarding the efficiency and depth of digital transformation. While eastern developed provinces, such as Guangdong and Jiangsu, have pioneered the deep application phase of “Industry 4.0,” central and western provinces remain in a “catch-up” phase, striving to reshape traditional industries using digital technologies. This coexistence of “high connectivity” and the “digital divide” serves as the realistic starting point for this study’s exploration of how DNI drives regional balanced development.
From a macroeconomic perspective, the provincial-level imbalance in DRI is essentially an imbalance in the endowment and allocation efficiency of digital production factors. According to the convergence hypothesis in neoclassical growth theory, infrastructure, as a public good with network externalities, follows the law of diminishing marginal returns in its contribution to economic output [15]. Neoclassical theory suggests that because the marginal productivity of capital is lower in capital-abundant regions and higher in capital-scarce regions, the cross-regional allocation of factors drives per capita output toward a steady-state equilibrium [16]. In the context of digital transformation, this asymmetric marginal gain acts as the underlying driver for achieving spatial equilibrium in DRI [17]. Specifically, DNI drives this convergence process through two dimensions:
First, lowering “entry barriers” to facilitate the leap over digital transformation costs. In the absence of DNI, lagging provinces face prohibitive “start-up costs” to promote DRI, including information acquisition costs stemming from geographical isolation, transaction costs for integrating into the national market, and initial investments in building digital systems. The widespread deployment of DNI serves as an inclusive public service for these provinces, significantly diluting the fixed costs of digital transformation [18]. Recent research indicates that the refinement of digital foundations allows underdeveloped regions to bypass the protracted capital accumulation stages of traditional industrialization, enabling a “leapfrog” integration into global value chains [12]. For these regions, the “marginal empowerment effect” brought by DNI is more potent, granting them a faster rate of catch-up.
Second, activating “latent comparative advantages” to reshape the value chains of real industries. The essence of DRI lies in the penetration and reshaping of the real economy by digital technologies. Although lagging provinces may have started their digital economy journey later, they possess distinct comparative advantages in energy, specialized agriculture, and primary manufacturing. Without DNI, these industries often languish at the low end of the value chain. The introduction of DNI provides a “digital empowerment engine” for these traditional industries, directly triggering their deep coupling with digital technologies [19]. For instance, through access to the Industrial Internet, manufacturing in central and western regions can adopt smart manufacturing modules at a lower cost. This differentiated integration path, based on local characteristics, significantly boosts total factor productivity (TFP) in lagging provinces and effectively promotes the convergence of inter-provincial disparities.
In summary, by providing a springboard for “cost-leaping” and an engine for “digital empowerment” for underdeveloped regions, DNI enables them to achieve higher marginal returns in the process of DRI. This asymmetric influence, inherent in the attributes of infrastructure, constitutes the core logic for narrowing inter-provincial disparities. Based on this, this paper proposes the following research hypothesis:
Hypothesis 1 (H1).
The development of digital new infrastructure directly drives the balanced development of digital–real integration, exerting a significant spatial convergence effect.

2.2. Analysis of the Mediating Mechanisms

2.2.1. The Divergence Effect of Digital Technology Diffusion

As the foundational power system of the digital economy, new digital infrastructure drives the convergence of regional digital–real integration by facilitating the spatial diffusion of digital technologies. Unlike traditional physical infrastructure, which drives the flow of material goods, the technological diffusion triggered by new digital infrastructure is characterized by low marginal costs, high permeability, and significant knowledge spillovers, making it a pivotal variable in achieving spatial convergence in regional digital–real integration levels.
First, new digital infrastructure promotes “ex-ante” equity for underdeveloped regions by reducing the costs of technology acquisition. Traditional technological diffusion is often constrained by geographical proximity, leaving peripheral regions subject to severe technological exclusion. However, recent studies suggest that new digital infrastructure—centered on 5G and the Industrial Internet—possesses a “distance-decay” neutralization effect, effectively dismantling the geographical barriers that hinder technological flow [20]. The inclusive deployment of such infrastructure substantially lowers the costs for enterprises in lagging regions to search for, identify, and integrate cutting-edge digital technologies. This enables the central and western regions to transcend the physical barriers of the traditional industrial era and gain real-time access to the same technological factors as those in the eastern, more developed regions [21]. The resulting improvement in information symmetry lays a robust foundation for latecomer regions to participate in digital–real integration, thereby driving inter-provincial growth convergence [22].
Second, the modularity and platform-based empowerment of digital technologies lower the absorption thresholds for latecomer regions. Drawing on the latest technological catching-up theory, digital technologies leverage standardized interfaces to exhibit strong modular attributes, which significantly reduces the dependency of technology application on a region’s existing knowledge accumulation [23]. Traditional industries in underdeveloped regions can bypass the linear evolution of industrialization and utilize mature external algorithms and computing power by connecting to cloud platforms. This “plug-and-play” empowerment model delivers an inclusive digital dividend, allowing latecomer regions to achieve leapfrog industrial upgrading through the cross-stage nature of digital technologies [24]. Given the greater marginal improvement potential in underdeveloped regions, the marginal gains from technological diffusion are more pronounced, thereby generating a significant catching-up effect.
Finally, the demonstration effects and co-evolution triggered by digital technology diffusion reinforce network-based regional linkages. As data factors flow across regions, supported by new digital infrastructure, the successful application scenarios and digital management logics of the leading eastern regions can rapidly spill over to the central and western regions. Recent empirical evidence indicates that digital technology diffusion is reflected not only in the spatial relocation of hardware but also in the penetration of digital transformation experiences [25]. This inter-regional knowledge spillover facilitates collective learning and imitative innovation among enterprises in lagging regions, helping them circumvent the high costs of independent R&D and trial-and-error. Driven by digital network effects, the technological connectivity between regions is significantly enhanced, enabling lagging provinces to narrow the digital–real integration gap through co-evolution and ultimately achieve dynamic equilibrium on a national scale [26].
In summary, by enhancing spatial accessibility, lowering absorption barriers for latecomers, and strengthening inter-regional knowledge spillovers, new digital infrastructure effectively facilitates the extension of technological dividends to geographical peripheries, thereby driving the convergence of inter-provincial digital–real integration. Based on this, the following research hypothesis is proposed:
Hypothesis 2 (H2).
New digital infrastructure significantly narrows the development gap in digital–real integration by promoting the inter-regional diffusion of digital technologies.

2.2.2. The Convergence Effect of Digital Talent Mobility

Digital infrastructure serves not only as a physical carrier for technology diffusion but also as a catalyst that reshapes the spatial–temporal organization of labor markets, fundamentally altering the logic of digital talent allocation. In the context of this study, and consistent with the latest definition by the OECD [27], “digital talent” is defined as a composite workforce possessing advanced information technology literacy, capable of integrating these skills into traditional industrial processes to facilitate data-driven decision-making. As the most dynamic and pervasive production factor in the process of digital–real integration, the cross-regional mobility of digital talent constitutes a core transmission mechanism driving balanced regional development.
First, digital infrastructure mitigates market friction and geographic constraints, thereby weakening the excessive concentration of digital talent in core cities and enhancing the impetus for talent diffusion, which in turn optimizes the spatial distribution of human capital [28]. Recent studies on labor markets suggest that online recruitment systems and dynamic matching platforms underpinned by digital infrastructure significantly alleviate regional information asymmetry. Such digital matching mechanisms dramatically reduce the search costs for high-skilled professionals migrating to less-developed regions. More importantly, the proliferation of high-speed networks and collaborative tools has fostered remote work and “virtual migration” models, effectively eliminating the high switching costs associated with traditional relocation [29]. This paradigm enables digital talent to transcend geographic lock-in, exporting high-end intellectual services to the central and western regions and providing resilient human resource support for achieving “starting-point equity” in digital–real integration.
Second, incoming digital talent acts as “knowledge decoders,” playing a pivotal role in overcoming the “easy to access, hard to empower” bottleneck in less-developed regions. The application of enabling technologies is highly dependent on complementary human capital inputs. Recent empirical evidence indicates that the influx of digital talent not only directly participates in corporate digital transformation [30] but also generates substantial knowledge spillovers through management infiltration and technical demonstration [31]. In less-developed areas, these professionals undertake the “digital re-engineering” of traditional production workflows, transforming abstract digital technologies into concrete industrial processes and achieving a deep coupling between data elements and the real economy. By acting as “active carriers,” this talent flow provides targeted solutions to the dilemma of having equipment but lacking operational expertise, thereby bridging the technology absorption gap between regions at the micro-execution level [32].
Finally, variations in the marginal productivity of digital talent across regions drive the spatial convergence of digital–real integration. According to the law of diminishing marginal returns, human capital in advanced eastern regions is approaching saturation, where the marginal contribution of digital talent to digital–real integration is exhibiting a downward trend. In contrast, digital talent remains scarce in less-developed regions, where even a small influx of high-quality talent could trigger exponential empowerment dividends [33]. Recent research highlights that the backflow of digital talent to central and western regions significantly enhances local enterprises’ ability to process complex market signals, facilitating a transition from resource-driven to data-driven industries [34]. This “high-return characteristic” in latecomer regions, induced by the rebalancing of talent distribution, allows less-developed provinces to demonstrate greater growth elasticity in digital–real integration, ultimately narrowing the inter-provincial development gap.
In summary, by reshaping matching mechanisms, dissolving spatial barriers, and strengthening the marginal empowerment effect of human capital, digital infrastructure facilitates the optimal spatial redistribution of digital talent, thereby driving high-level dynamic equilibrium in digital–real integration nationwide. Consequently, this study proposes the following research hypothesis:
Hypothesis 3 (H3).
Digital infrastructure significantly narrows the digital–real integration gap by promoting the cross-regional mobility of digital talent.

2.3. Threshold Effect Analysis of Marketization

The marginal effect of digital new infrastructure on narrowing the development gap of digital–real integration is not uniform; rather, it is contingent upon the institutional environment. Marketization serves as a critical institutional foundation that dictates the efficiency of resource allocation and the fluidity of production factors [35]. The existing literature suggests that the realization of the inclusive dividends of digital infrastructure is highly dependent on a favorable institutional environment, where variations in institutional quality directly influence the efficiency of these digital gains in promoting economic growth [36].
In regions with a low degree of marketization, administrative barriers, regional protectionism, and factor market distortions impede the cross-regional spillover of digital technologies, thereby limiting the “catch-up effect” generated by DNI. These institutional frictions act as barriers that prevent DNI from effectively bridging the development gap between regions. Conversely, as the degree of marketization improves, the reduction of transaction costs and the enhancement of competitive market mechanisms facilitate the efficient flow of digital elements toward underdeveloped areas [37]. Once the degree of marketization crosses specific critical thresholds, institutional constraints are significantly mitigated, enabling DNI to function as a powerful “equalizer” that accelerates the convergence of DRI levels. Based on this, the following hypothesis is proposed:
Hypothesis 4 (H4).
The convergence effect of DNI on DRI is subject to a threshold constraint associated with the degree of marketization; specifically, as the level of marketization surpasses certain critical thresholds, the role of DNI in narrowing regional DRI disparities is significantly enhanced.
Based on the above analysis, the mechanism through which digital new infrastructure influences the balanced development of digital–real integration is summarized in Figure 1.

3. Research Design

3.1. Variable Selection

3.1.1. Dependent Variable

The Digital–Real Integration Gap ( D R I _ T h e i l ). This study employs a two-step approach to measure the development gap in digital–real integration.
Step 1: Measuring the Provincial Level of Digital–Real Integration (DRI).
Adhering to the principles of scientific rigor and systematic design, and drawing upon the existing literature [38], this study constructs an evaluation index system across four dimensions: infrastructure integration, innovation integration, application integration, and financial integration.
Infrastructure Integration: Grounded in new economic geography and infrastructure theory, digital infrastructure serves as the physical conduit for the penetration of digital factors into the real economy. Thus, this study uses optical cable density to measure the network coverage intensity of regional information transmission, while mobile phone and internet broadband penetration rates reflect the terminal capacity of real-economy entities to access the digital world. These indicators define the boundaries of digital–real integration and the cost-efficiency of information transmission.
Innovation Integration: Based on endogenous growth theory and knowledge spillover theory, the R&D and transformation of digital technologies are the core drivers of digital–real integration. We employ R&D personnel full-time equivalents and total telecommunications volume to reflect the investment and vitality of digital technology R&D. Furthermore, the share of software business revenue captures the penetration level of digital services across all industries, while the industrial technology achievement transformation rate directly measures the ability to translate digital technologies from “laboratory to production line,” representing the depth of integration.
Application Integration: Informed by industrial integration theory and technology diffusion models, the ultimate manifestation of digital–real integration is the digital re-engineering of traditional business models. Consequently, indicators such as e-commerce, enterprise informatization, and computer ownership are selected to delineate the breadth of digital technology application in the sales, management, and production processes of traditional enterprises, particularly in manufacturing. This dimension is critical for assessing the transition from a “physical combination” to a “chemical reaction” between digital technologies and the real economy.
Financial Integration: Referencing financial intermediary theory and digital empowerment logic, digital finance provides capital flow security for the digital transformation of the real economy by mitigating information asymmetry and financing constraints. Coverage breadth, usage depth, and mobile payment levels are utilized here, as digital finance is not only a product of digital–real integration but also a lubricant for development in sectors such as consumption and supply chain integration.
The 14 secondary indicators within the evaluation system are all positive, meaning higher values indicate a higher level of digital–real integration. To avoid the subjectivity of human-assigned weighting and to ensure the objectivity of the results, the Entropy Weight Method is employed to determine the weights of each variable based on the information entropy of the observed values. The specific index system, measurement methods, attributes, units, and weights are presented in Table 1.
Step 2: Measuring the Digital–Real Integration Gap ( D R I _ T h e i l ). The core objective of this study is to examine the impact of digital infrastructure on the digital–real integration gap. Drawing on mainstream practices in regional economics [39], we utilize the Theil index as the primary tool. Compared to the Gini coefficient, the Theil index is more sensitive to variations at both ends of the distribution, enabling a more precise capture of dynamic changes between leading and lagging provinces, while also allowing for the decomposition of the total gap into within-group and between-group components. For any given year t , the national total Theil index T t o t a l , t     is the sum of the contributions of each province:
T t o t a l , t = i = 1 N T i t
This decomposition property allows us to reveal the micro-drivers of changes in the national total gap by analyzing the variation in each province’s contribution T i t . Therefore, we define the contribution of province i in year t   to the national Theil index as the dependent variable, denoted as D R I _ T h e i l i t . The calculation formula is as follows:
D R I _ T h e i l i t = Y i t Y t l n Y i t / P i t Y t / P t
where Y i t   represents the “Total Digital–Real Integration” of province i   in year t . To reflect the economic scale of each province within the national landscape, it is defined as the product of the provincial DRI index and the resident population ( P i t ), i.e., Y i t = D R I i t × P i t . Y t   and P t   represent the national totals for year t .
The indicator D R I T h e i l i t   possesses a clear economic interpretation: when the per capita digital–real integration level of province i ( Y i t / P i t ) exceeds the national average, D D R I T h e i l i t   is positive, identifying the province as a “leader”; conversely, if it falls below the national average, the value is negative, identifying it as a “follower.” Thus, the absolute value of D R I T h e i l i t   precisely measures the “degree of deviation” of province i from the national average.
In the empirical analysis, the dependent variable is utilized according to the research context: in baseline regressions, robustness checks, and other extended analyses, the absolute value is used to test the net effect of digital infrastructure on the overall “degree of deviation.” In contrast, during the subsample regressions for the “two-way convergence” mechanism, the raw value is used to precisely identify the direction and magnitude of the impact on “leaders” versus “followers”.

3.1.2. Core Explanatory Variable

Digital New Infrastructure ( D N I ). Given the rich connotation and multidimensional attributes of digital new infrastructure, a single indicator is insufficient to comprehensively capture its developmental depth. Drawing upon the authoritative definition of “new infrastructure” provided by the National Development and Reform Commission (NDRC) and referencing the existing literature [40], this study constructs a comprehensive evaluation index system covering 31 provincial-level administrative regions in mainland China (see Table 2) across four dimensions: information infrastructure, integrated infrastructure, application infrastructure, and infrastructure support.
Information Infrastructure: Acting as the “blood” and “brain” of the digital economy, this dimension constitutes the fundamental physical support for digital new infrastructure. We measure regional connectivity and computing power through the number of 4G/5G base stations, the number of large and ultra-large data centers, and the number of intelligent computing centers.
Integrated Infrastructure: This dimension aims to delineate the empowerment and reconstruction of traditional physical infrastructure by digital technology. We select the mileage of smart highways and the number of new energy vehicle (NEV) charging piles to reflect the breadth of digital transformation in transportation and energy networks, representing the “interface” capability for the transition between old and new growth drivers.
Application Infrastructure: This dimension focuses on innovation carriers for technological progress and industrial clusters. We incorporate the number of national-level major scientific and technological infrastructure projects, scientific and educational infrastructure, and national new-type industrialization demonstration bases to capture the core potential of digital technology in supporting original innovation and driving large-scale industrial applications.
Infrastructure Support: This dimension reflects the intensity of support provided by local governments through institutional design and policy orientation. Using text analysis, we extract the total frequency and proportion of keywords related to “digital new infrastructure” from provincial government work reports to measure the guidance and guarantee provided by the institutional environment for the implementation of new infrastructure.
The 10 secondary indicators within the evaluation system are all positive, meaning higher values indicate a more advanced level of digital new infrastructure development in the province. To ensure objectivity in the evaluation process, we continue to employ the Entropy Weight Method to determine the weights. By identifying the degree of variation in the information entropy of the observed values for each indicator, we scientifically calculate the comprehensive scores for digital new infrastructure across all provinces from 2013 to 2023. The specific index system, measurement methods, attributes, units, and calculated weights are detailed in Table 2.

3.1.3. Mediating Variables

Based on the theoretical analysis above, this study selects the following indicators as mediating variables:
1. Diffusion of Digital Technology (DTD): Following the research framework of Wu et al. [41], we adopt the intensity of digital transformation among provincial-level listed companies as a proxy for the diffusion of digital technology. Data are sourced from the CSMAR Digital Transformation Database, which is derived from intensive text analysis of keywords related to “artificial intelligence, big data, cloud computing, blockchain, and digital technology applications” in the annual reports of A-share listed companies. To construct the provincial-level index, we aggregate the annual digital transformation keyword frequencies of all listed companies within each province and apply a logarithmic transformation to eliminate dimensional differences and mitigate the right-skewed distribution of the data.
The rationale for selecting this indicator is that, compared to traditional technology-transaction indicators, keyword frequencies in annual reports reflect the substantive adoption and application of digital technologies in corporate strategic decision-making and operations. This measure more precisely captures the dynamic process of digital technology—as a general-purpose technology—permeating into traditional real-economy sectors, thereby effectively explaining how digital new infrastructure drives micro-level innovation and narrows the gap in digital–real integration. Preliminary observations indicate that the level of digital technology diffusion in eastern coastal provinces, such as Guangdong and Zhejiang, is significantly higher than in the central and western regions; this spatial heterogeneity provides an empirical basis for exploring how such diffusion bridges regional development gaps.
2. Mobility of Digital Talent (DTM): Drawing on studies regarding labor mobility and resource allocation, we utilize the net cross-provincial social security transfer volume of insured employees in the “Information Transmission, Software, and Information Technology Services” sector as a proxy for digital talent mobility.
In constructing this indicator, we precisely extract the annual scale of net cross-provincial social security transfers (inflows minus outflows) within the digital-related sector for each province, accurately capturing the direction of micro-level movement and the intensity of resource allocation for digital talent across 31 provinces. The core logic for selecting this indicator is twofold: First, administrative authority. Social security transfer records constitute administrative data, which mandate and accurately capture inter-regional changes in formal labor relationships, effectively excluding mechanical population movements unrelated to employment intentions. Second, occupational precision. Compared to traditional macro-statistical indicators or broad-caliber census data, this indicator is anchored in the information and software industry, possessing a distinct “technical attribute” that more effectively identifies the actual allocation process of digital R&D and technical personnel.
To address the issue of incomplete industry-specific transfer data for some provinces in earlier years, we adhere to the principles of scientific rigor and consistency by employing a “proportional conversion method” for data imputation. Specifically, we multiply the total annual cross-provincial social security transfers of the province by the ratio of employed persons in the “Information Transmission, Software, and Information Technology Services” sector to the total employed persons in urban units during the same period. This ensures the continuity of the panel data. Furthermore, considering that net inflows of digital talent exhibit significant scale disparities across provinces and contain negative values, we follow the approaches of Bellemare and Wichman [42] by applying an Inverse Hyperbolic Sine (IHS) transformation to the raw net transfer volume. The formula is as follows:
D T M i t = l n ( Y i t + Y i t 2 + 1 )
where Y i t   represents the net inflow of digital talent for province i   in year t . The IHS transformation effectively mitigates heteroscedasticity and compresses the variance of extreme values. Moreover, by preserving the statistical information of negative and zero-value samples while ensuring that regression coefficients maintain a percentage interpretation similar to logarithmic transformations, this approach enhances the robustness and interpretability of our empirical results.

3.1.4. Threshold Variable

This study selects Marketization Degree (MAR) as the threshold variable. The data are sourced from the Report on Marketization Index of China’s Provinces, compiled by Wang Xiaolu, Fan Gang, and colleagues [43]. This index provides an objective and systematic evaluation of the marketization process across various regions in China, covering five dimensions: the relationship between government and the market, the development of the non-state economy, the development of product markets, the development of factor markets, and the development of market intermediary organizations and the legal environment. Given that this report accurately reflects disparities in resource allocation, institutional innovation, and the business environment across provinces, it is widely utilized in domestic regional economic research.

3.1.5. Control Variables

Drawing upon the existing literature, and to isolate the impact of other factors on the digital–real integration gap, the following control variables are selected: (1) Economic Development Level (GDP): Measured as the logarithm of regional GDP per capita, this variable controls for the economic scale effect. (2) Human Capital Level (HC): Measured by the average years of schooling to represent the quality of the labor force. (3) Foreign Investment Level (FI): Expressed as the ratio of actual utilized foreign direct investment (FDI) to regional GDP, this variable controls for the impact of external capital and technological spillovers. (4) Fixed Asset Investment in Information Industry (FII): Calculated as the ratio of total social fixed asset investment in the “Information Transmission, Software, and Information Technology Services” sector to total social fixed asset investment, this variable controls for sectoral investment intensity. (5) Government Fiscal Intervention (GOV): Represented by the ratio of local fiscal expenditure on science and technology to general public service expenditure, this variable controls for the intensity of government support for technological innovation. (6) Industrial Structure (IS): Defined as the ratio of the value-added of the tertiary industry to that of the secondary industry, this variable controls for the impact of industrial structural upgrading.

3.2. Data Sources and Descriptive Statistics

3.2.1. Research Scope and Period

This study covers 31 provincial-level administrative regions in mainland China (comprising 22 provinces, 5 autonomous regions, and 4 municipalities, excluding Hong Kong, Macao, and Taiwan), with a sample period spanning from 2013 to 2023. The choice of provincial-level data is primarily based on the integrity and authority of the statistical indicators concerning digital new infrastructure and digital–real integration, which provide an optimal scale for observing the dynamic evolution of regional disparities. The starting year of 2013 is selected based on two primary considerations: first, the official issuance of 4G licenses in China that year marked the beginning of large-scale construction and explosive application of digital infrastructure, serving as a significant policy milestone; second, the statistical caliber of the information industry in relevant yearbooks became more standardized thereafter, effectively ensuring the temporal continuity, comparability, and empirical robustness of the research data.

3.2.2. Data Sources and Pre-Processing

This study employs a balanced panel dataset for empirical analysis, yielding a total of 341 valid “province-year” observations. The data sources for digital–real integration are as follows: Data on infrastructure integration are derived from the China Statistical Yearbook and the China Information Industry Yearbook. Data for innovation and application integration are sourced from the China Industrial Statistical Yearbook, China Statistical Yearbook on Science and Technology, China Statistical Yearbook, the National Bureau of Statistics database, the Statistical Report on the Development of China’s Internet, and provincial statistical yearbooks. Data regarding financial integration are obtained from the Peking University Digital Financial Inclusion Index and the Statistical Report on the Development of China’s Internet.
Data for digital infrastructure are primarily obtained from the China Statistical Yearbook and the annual Statistical Communiqué on National Economic and Social Development of each province. These are supplemented by the annual Digital China Development Report, the China New Infrastructure Industry Market Outlook and Investment Planning Analysis Report, and official public data from the Ministry of Transport and the National Development and Reform Commission (NDRC). Data on digital technology diffusion are sourced from the CSMAR Digital Transformation Database. Data on digital talent mobility are derived from the China Human Resources and Social Security Statistical Yearbook, the Annual Report on Inter-provincial Cross-region Processing issued by the Ministry of Human Resources and Social Security, and official public statistics from provincial departments of human resources and social security. Data for the control variables are collected from the China Statistical Yearbook and provincial statistical yearbooks. For the few missing values in certain years, we follow academic conventions by employing linear interpolation to ensure the integrity of the panel data. To enhance the reliability and representativeness of the data, logarithmic transformations are applied to the selected variables.

3.2.3. Descriptive Statistics

Table 3 reports the descriptive statistics for all variables used in this study. The sample comprises 341 province-year observations. The dependent variable ( D R I _ T h e i l ) exhibits a mean of 0.001, with a range from −0.021 to 0.093, suggesting that there is a notable disparity in the digital–real integration process across different provinces. The mean value of D R I is 0.331, with a standard deviation of 0.122, indicating a moderate level of integration but with considerable variation across regions.
Regarding the independent variable, the level of D N I shows a mean of 0.223, ranging from 0.032 to 0.458. The mediating variables, Tech Diffusion ( D T D ) and Talent Mobility ( D T M ), display means of 8.508 and 7.235, respectively. Other control variables, such as Marketization Level ( M A R ), Economic Development ( G D P ), and Human Capital ( H C ), show reasonable distributions that are consistent with the existing literature on China’s regional development.

3.2.4. Correlation Analysis

To preliminarily exclude the potential interference of multicollinearity on our empirical results, Table 4 reports the Pearson correlation coefficients among the main variables. The results indicate that the correlation coefficient between the core independent variable, digital new infrastructure (DNI), and other variables is consistently and significantly lower than 0.8. While some control variables (e.g., GDP and HC) exhibit relatively higher correlations, this is consistent with the stylized facts of macro-level provincial data.
To further verify this, we conducted a Variance Inflation Factor (VIF) test. The results demonstrate that the VIF value for the core variable, DNI, is only 2.20, which is well below the common empirical threshold of 10. Consequently, we conclude that severe multicollinearity is not an issue in this study, thereby confirming the validity and rationality of our variable selection.

3.3. Model Specification

3.3.1. Baseline Regression Model

The Hausman test results reject the null hypothesis of random effects, indicating that a fixed-effects (FE) model is more appropriate. The FE approach effectively mitigates potential endogeneity bias arising from unobserved time-invariant province-specific characteristics. To empirically test the direct impact of digital new infrastructure (DNI) on the development gap in digital–real integration ( D R I _ T h e i l ), we construct the following two-way fixed-effects (TWFE) model:
D R I T h e i l i t = α 0 + α 1 D N I i t + α 2 Z i t + μ i + λ t + ε i t
where i and t denote the province and year, respectively. D R I T h e i l i t   is the dependent variable representing the development gap in digital–real integration for province i in year t , and D N I i t   is the core independent variable representing the level of digital new infrastructure. Z i t   represents a vector of control variables. μ i   denotes province fixed effects, which control for unobserved time-invariant characteristics specific to each province; λ t denotes year fixed effects, which capture macro-shocks that vary over time but are common to all provinces; and ϵ i t is the stochastic error term. The coefficient α 1 is our primary focus; a significantly negative α 1   would suggest that digital new infrastructure contributes to narrowing the digital–real integration gap.

3.3.2. Mediating Effect Model

To examine the underlying mechanisms through which digital new infrastructure affects the development gap, we employ the stepwise mediation regression approach. The models are specified as follows:
M i t = β 0 + β 1 D N I i t + β 2 Z i t + μ i + λ t + ε i t
D R I _ T h e i l i t = γ 0 + γ 1 D N I i t + γ 2 M i t + γ 3 Z i t + μ i + λ t + ε i t
where M i t   represents the mediating variables, including Tech Diffusion ( D T D ) and Talent Mobility ( D T M ); other variables are defined as in Equation (1). This framework allows us to decompose the total effect of digital new infrastructure on the development gap into direct and indirect components. By testing the statistical significance of β 1   and γ 2 , we can empirically determine whether the influence of digital new infrastructure on the development gap is channeled through tech diffusion or talent mobility.

3.3.3. Threshold Effect Model

To investigate whether marketization level exerts a threshold effect on the relationship between digital new infrastructure and the digital–real integration gap, we adopt the panel threshold regression model proposed by Hansen [44]:
D R I _ T h e i l i t = δ 0 + δ 1 D N I i t · I M A R i t γ + δ 2 D N I i t · I M A R i t > γ + Φ Z i t + λ t + μ i + ε i t
where I   is an indicator function, M A R i t is the threshold variable representing the level of marketization, and γ is the threshold value to be estimated. δ 1   and δ 2   represent the impact coefficients of digital new infrastructure on the integration gap when D N I falls into different marketization intervals. This model endogenously determines the threshold values based on the data, thereby enabling us to capture the nonlinear characteristics and structural breaks in how digital infrastructure influences the digital–real integration gap across different stages of market development.

4. Results and Analysis

4.1. Spatial Pattern of Digital–Real Integration

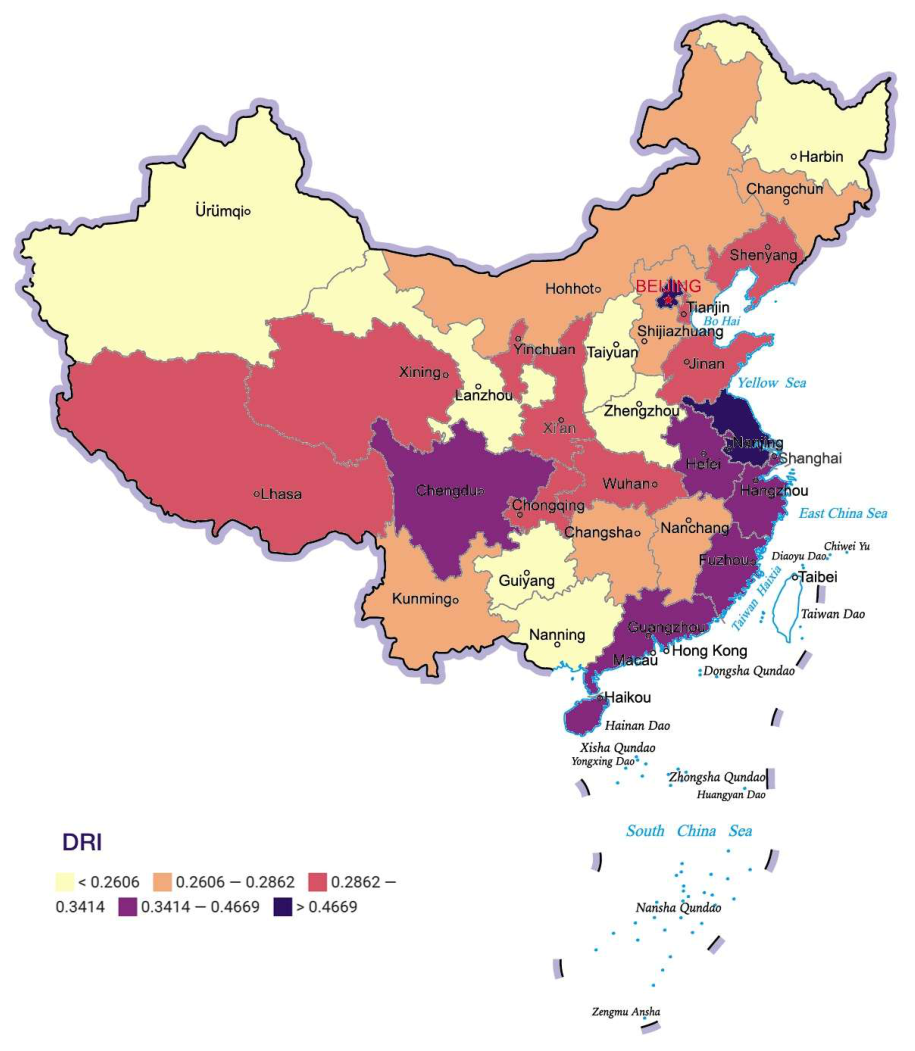
Before proceeding to the empirical testing, we first illustrate the average distribution of the DRI level across 31 provinces in China from 2013 to 2023, as shown in Figure 2. The visualization reveals a significant spatial asymmetry characterized by a “leading East, catching-up Centre and West” pattern.
Leading Regions (High-level, D R > 0.4669 ): Centered around Beijing, Shanghai, and Jiangsu. Leveraging strong technological innovation capabilities and mature digital industrial clusters, these regions have successfully achieved high-efficiency empowerment of the real economy through the digital economy, establishing themselves as national “frontrunners.”
Catching-up Regions (Low-level, D R < 0.2606 ): Primarily located in traditional industrial and agricultural provinces as well as remote areas, such as Xinjiang, Gansu, Guizhou, and Heilongjiang.
Analysis of Causes: Taking Henan and Hebei as examples, despite their substantial industrial scale, the low penetration rate of digital new infrastructure in the early stages (around 2013) resulted in a notable “negative deviation” between their vast real-economy stock and lagging digitalization process. Consequently, these regions constitute the primary “catching-up group.”
Taking provinces such as Xinjiang, Gansu, Guizhou, and Heilongjiang as examples, the relatively low level of digital–real integration is primarily attributable to the sparse distribution of digital facilities and the geographical constraints that distance these regions from core digital industrial clusters. Such location-based characteristics have, to a certain extent, hindered the efficient diffusion of digital technologies into traditional industries, resulting in a pronounced “lagging effect” compared to their eastern coastal counterparts. Consequently, these provinces constitute the primary “catching-up group” within the national landscape of digital–real integration.

4.2. Baseline Regression Results

In Table 5, column (1) reports the impact of digital new infrastructure on the equilibrium of digital–real integration using the full sample. The results show that the regression coefficient for DNI is significantly negative at the 1% level ( β = 0.106 ). This indicates that, after controlling for variables, a one-unit increase in DNI leads to an average reduction of 0.106 units in the absolute deviation of digital–real integration at the national level. These findings suggest that DNI serves not only as a technological investment but also as an “equalizer” for narrowing regional development disparities, significantly suppressing spatial polarization. Thus, Hypothesis 1 (H1) is supported.
Furthermore, this study conducts a subsample analysis by decomposing provinces based on their D R I _ T h e i l i t signs (i.e., identifying them as either “frontrunners” or “catching-up” regions):
Column (2) examines provinces where the level of digital–real integration is below the national average, such as Xinjiang, Gansu, Guangxi, and Heilongjiang. For these “digitally lagging” regions, the DNI coefficient is significantly positive (0.015). In these areas, DNI facilitates a robust “acceleration effect” by providing low-cost and high-efficiency digital access. This allows these provinces to narrow the initial “digital divide” by shifting their digital–real integration deviation from a negative value toward the national average (zero).
Column (3) focuses on provinces with a positive deviation, such as Beijing, Jiangsu, Guangdong, and Shanghai. For these leading regions, the DNI coefficient is significantly negative (−0.171). In these advanced areas, further refinement of DNI does not simply widen the existing lead; instead, it generates a “mitigation effect” through industrial structural optimization. As the digital economy in these regions enters a stage of saturated growth, DNI investment shifts toward supporting the deep “digital-intelligent” transformation of the real economy (e.g., Industrial Internet applications) rather than expanding digital bubbles. Consequently, the positive deviation of digital–real integration in provinces like Jiangsu and Guangdong tends to be moderate, converging toward the national mean.

4.3. Robustness Checks

4.3.1. Handling Endogeneity

Given the potential endogeneity arising from bidirectional causality or omitted variables between our core explanatory variable, digital new infrastructure (DNI), and the deviation of digital–real integration, this study employs an instrumental variable (IV) approach. We construct two panel instrumental variables, I V 1   and I V 2 , by interacting the number of fixed-line telephones per 100 people and the number of post offices per one million people in each province in 1984 with the national information technology service revenue of the previous year, respectively.
The rationale for selecting these instruments is as follows: regarding relevance and path dependence, 1984 marked a pivotal year for China’s comprehensive urban economic reforms, during which the layout of postal and telecommunications infrastructure established the “technological gene” for subsequent provincial communications development. The site selection for modern digital infrastructure, such as fiber-optic networks and 5G base stations, often relies on historical telecommunication hubs, conduit corridors, and existing talent pools. This continuity of historical endowments creates a significant path dependence, rendering the telecommunications density of 1984 highly correlated with the current level of DNI. Regarding the exclusion restriction, 1984 was over 40 years ago. The technical forms of that era—analog signals and physical mail—differ fundamentally from the core of modern digital–real integration, which is built on big data and artificial intelligence. These historical data points are unlikely to exert a direct influence on the current structural deviation of digital–real integration in each province, satisfying the exogeneity requirement by affecting current digital infrastructure solely through its historical legacy.
Table 6 presents the results of the endogeneity treatment. In the first-stage regression, columns (1) and (3) show that the coefficients for I V 1   and I V 2   are significantly positive at the 1% level. Furthermore, the Kleibergen–Paap rk Wald F-statistics are 43.029 and 17.625, respectively, both significantly exceeding the critical value of 16.38 for the 10% maximal IV size (Stock–Yogo weak IV test), thereby ruling out concerns regarding weak instruments.
In the second-stage regression, after correcting for bias using the IVs, the coefficients for DNI remain significantly negative (−0.957 and −1.553), which is entirely consistent with the baseline regression results. It is worth noting that the absolute values of the 2SLS estimates are significantly larger than those in the baseline regression. This is reasonable within the framework of the Local Average Treatment Effect (LATE): provinces that steadily advance their DNI based on historical endowment advantages derive more significant spatial equilibrium dividends.

4.3.2. Further Robustness Checks

To further substantiate the robustness of our baseline finding, we subject it to a battery of alternative specifications, with the results reported in Table 7.
First, we address the potential for influential outliers. The four centrally administered municipalities (Beijing, Shanghai, Tianjin, and Chongqing) exhibit distinct structural and policy attributes that might unduly influence our estimates. We therefore re-estimate our model on a subsample that excludes these administrative regions. Column (1) shows that excluding these municipalities leaves our core result qualitatively unchanged; the coefficient on DNI remains negative and highly significant.
Second, to attenuate the impact of extreme values, we winsorize all continuous variables at the 2nd and 98th percentiles. The persistence of a negative and significant coefficient on DNI, as shown in column (2), indicates that our findings are not driven by data anomalies.
Third, to further mitigate concerns of reverse causality and account for potential time lags in policy effects, we employ a one-period lag of our core explanatory variable (L.DNI). The result in column (3) confirms that past digital infrastructure development has a significant negative effect on the current integration gap. This temporal precedence bolsters a causal interpretation of our estimate.
Finally, we account for potential dynamic endogeneity. The convergence process in DRI may exhibit persistence, where the current state is dependent on past outcomes. To model this dynamic inertia, we specify a model with a lagged dependent variable and estimate it using the System-GMM method, which is designed to handle the associated Nickell bias inherent in standard fixed-effects models. Column (4) reveals that even after controlling for this state dependence, the convergence-promoting effect of DNI remains statistically significant.
Taken together, these tests demonstrate that our central conclusion is remarkably robust. The finding that digital infrastructure fosters balanced development in DRI is invariant to the exclusion of influential samples, the treatment of outliers, the consideration of time lags, and the adoption of a dynamic panel specification. This consistency across multiple model specifications lends considerable credence to our results.

4.4. Mechanism Analysis

Having established the robust, convergence-promoting effect of DNI, we now explore the underlying mechanisms. We test two primary channels through which DNI may influence the balanced development of DRI: the diffusion of digital technology and the mobility of digital talent.

4.4.1. The Mediating Role of Diffusion of Digital Technology

To further uncover the specific pathways through which digital new infrastructure affects the equilibrium of digital–real integration, this study examines the mediating role of digital technology diffusion and conducts subsample regression analysis for the central–western and eastern regions. Table 8 presents the relevant estimation results.
In the central–western regions, DNI exhibits a significant “gap-filling” effect and acts as a primary technological driver. Specifically, the following is true:
As shown in column (1), the regression coefficient of DNI on digital technology diffusion is 1.591, which is significant at the 1% level. This suggests that in the central–western regions, investment in DNI effectively breaks down geographical and information barriers, significantly accelerating the penetration and diffusion of digital technologies within the region. In column (2), when both DNI and DTD are considered, the coefficient of DTD on the Theil index of digital–real integration is −0.003, significant at the 1% level. Since the Theil index measures development disparity, a negative coefficient implies that the extensive diffusion of digital technology significantly narrows the disparity in digital–real integration. The coefficient of DNI in column (2) remains significantly negative (−0.002), indicating that DTD plays a significant mediating role in the central–western regions. By catalyzing technology diffusion, DNI effectively facilitates the deep integration of traditional industries with digital technologies, thereby achieving a balanced development of digital–real integration.
The regression results for the eastern regions demonstrate a similar logical trend, albeit with differences in impact intensity:
As shown in column (3), the driving coefficient of DNI on DTD in the eastern regions (0.687 *) is significantly lower than that in the central–western regions (1.591). This reflects that as digital infrastructure in the eastern regions has reached a state of relative maturity, the marginal contribution of infrastructure investment to technology diffusion has begun to decelerate. Column (4) shows that the coefficient of DTD on narrowing the disparity in the eastern regions is −0.011, which is also significant. This confirms that technology diffusion remains a critical force in optimizing resource allocation and enhancing the equilibrium of digital–real integration in developed regions.
A comprehensive comparison of the regression results between the eastern and central–western regions reveals that the diffusion of digital technology serves as a key mediating pathway through which DNI drives the balanced development of digital–real integration nationwide. We find that the driving force of DNI on technology diffusion is significantly stronger in the central–western regions than in the eastern regions, demonstrating a strong “catch-up effect.” This indicates that in regions with relatively weaker digital infrastructure, infrastructure investment generates higher marginal technological spillover benefits and possesses greater resource-allocation capabilities. Furthermore, the coefficients of DTD on D R I _ T h e i l are significantly negative across all regional groups, confirming that technological spillover is the core mechanism for narrowing provincial disparities in digital–real integration. Therefore, Hypothesis H2 is supported.

4.4.2. The Mediating Role of Digital Talent Mobility

Table 9 presents the results of the mediating effect of inter-provincial digital talent mobility (DTM) on the impact of DNI on the development disparity of D R I _ T h e i l .
First, regarding the driving force of DNI on talent mobility, results in columns (1) and (3) show that the estimated coefficients of DNI on DTM are significantly positive in both subsamples, passing the 1% significance level. It is noteworthy that the driving coefficient in the eastern region (1.233) is slightly higher than that in the central–western region (1.134). This reflects the strong centripetal force exerted by well-developed digital infrastructure on talent; specifically, the eastern region, benefiting from more mature industrial supporting facilities and digital ecosystems, is more effective in attracting the inflow of digital talent and forming a talent agglomeration effect.
Second, regarding the impact of talent mobility on the disparity of digital–real integration, results in columns (2) and (4) confirm that inter-provincial digital talent mobility has a significant negative effect on the Theil index of digital–real integration. Specifically, the coefficient of DTM is −0.001 in the central–western region and −0.004 in the eastern region. This indicates that the inter-regional mobility of digital talent is not only a process of optimized resource allocation but also a crucial force in narrowing the development gap of digital–real integration. The inflow of talent brings advanced experience in digital technology application and management models, thereby facilitating the digital transformation of local traditional industries.
Finally, in summary, although the eastern region exhibits a stronger “siphon effect” in attracting digital talent, digital talent mobility still demonstrates a highly robust mediating pathway in the central–western region, with a t-statistic of −8.665. The empirical results indicate that DNI not only directly contributes to development in the central–western regions but also drives the balanced development of digital–real integration by guiding the inter-provincial flow of digital talent and injecting critical human capital factors into the central–western areas. Therefore, Hypothesis H3 is supported.

5. Further Analyses: Heterogeneity and Threshold Effects

5.1. Heterogeneity Analysis

To further explore the boundary conditions under which DNI influences the balanced development of digital–real integration, this study conducts a multidimensional heterogeneity analysis by introducing interaction terms into the baseline regression model. We examine four key dimensions: government fiscal policy, industrial technology level, financial development, and the national “East-to-West Computing Resource Transfer” strategy. In the regression results presented in Table 10, these four moderating variables are collectively denoted as HET to facilitate a structured comparative analysis. The empirical results for these dimensions are reported in columns (1) through (4), respectively.

5.1.1. Heterogeneity of Government Fiscal Policy

Column (1) examines the moderating role of government fiscal policy intensity (PI), measured by the ratio of local fiscal expenditure to GDP. The results show that while the main effect of DNI is significantly negative, the coefficient of the interaction term is significantly positive (0.050) at the 1% level. This indicates that fiscal expenditure intensity significantly attenuates the “equalizing effect” of DNI. A plausible explanation is that fiscal funds often exhibit a “picking winners” tendency, prioritizing digital industrial clusters with economies of scale and high spillover potential. Such a polarization in resource allocation may induce asymmetric growth in the digitalization process in the short term, creating a “Matthew effect” that partially offsets the inclusive role of DNI in narrowing the disparity in digital–real integration.

5.1.2. Heterogeneity of Industrial Technology Level

Column (2) introduces industrial technology level (ITL) as a moderating variable, proxied by the proportion of high-tech industry output to GDP. The regression results show that the coefficient of the interaction term is significantly negative (−0.018). This implies a clear “gradient difference” in the effect of DNI on the balanced development of digital–real integration across different industrial foundations: the convergence effect of DNI is more pronounced in regions with higher industrial technology levels. This is because regions with a high density of high-tech industries possess stronger “technology absorption capacity” and “digital DNA,” which facilitate efficient synergistic coupling with new infrastructure, thereby accelerating the penetration and transformation of traditional real-sector industries and enhancing the overall equilibrium of digital–real integration.

5.1.3. Heterogeneity of Financial Development

Column (3) examines the impact of regional financial development (FIN), measured by the ratio of the sum of RMB deposits and loans of financial institutions to GDP. The results indicate that the coefficient of the interaction term is significantly negative (−0.005) at the 10% level. This reflects that the quality of the financial environment significantly influences the depth of empowerment provided by DNI: in regions with higher levels of financial deepening, DNI demonstrates stronger “equalizing potential.” A sound financial system and sufficient credit support effectively alleviate the financing constraints faced by traditional enterprises during digital transformation, allowing DNI to function as a critical production factor that is more equitably and smoothly allocated to various real-sector enterprises, thereby narrowing the disparity in digital–real integration through factor empowerment.

5.1.4. Heterogeneity of the “East-to-West Computing Resource Transfer” Strategy

Column (4) conducts a heterogeneity test regarding the national hub nodes for computing power (SH). Based on the official documents issued by the National Development and Reform Commission and other departments, this study assigns a value of 1 to provinces involved in the eight national computing hubs under the “East-to-West Computing Resource Transfer” project (including Beijing, Tianjin, Hebei, Shanghai, Jiangsu, Zhejiang, Guangdong, Chongqing, Sichuan, Inner Mongolia, Guizhou, Gansu, and Ningxia), and 0 otherwise. The results show that the coefficient of the interaction term is significantly negative (−0.018). In provinces incorporated into the national computing hubs, the systematic construction of DNI has a stronger positive effect on the balanced development of digital–real integration compared to non-hub provinces. Through the cross-regional coordination and spillover effects of computing resources, these hub nodes effectively drive the intensive and digital transformation of traditional industries within the province, demonstrating significant strategic-driven and balanced growth characteristics.

5.2. Threshold Effect Analysis

To examine whether the impact of DNI on the balanced development of digital–real integration is subject to nonlinear constraints imposed by the market environment, this study constructs a panel threshold model using the degree of marketization (MAR) as the threshold variable.
First, the Bootstrap method is employed to test for the existence of threshold effects. To ensure the precision of the threshold estimation, we set 400 grid points for the search process. As shown in Table 11, both the single and double threshold models are statistically significant at the 1% and 5% levels, respectively, indicating that the impact of DNI on D R I _ T h e i l is not a simple linear relationship but exhibits a nonlinear, “stepped” characteristic based on the degree of marketization.
Table 12 presents the threshold estimates of 8.2069 and 8.6494, both of which fall within the 95% confidence intervals, confirming the robustness of the threshold estimations.
Table 13 presents the segmented regression results using MAR as the threshold variable. The results demonstrate that while the coefficients of DNI on D R I _ T h e i l are significantly negative across different levels of marketization, the intensity of this impact exhibits a clear “stepwise strengthening” pattern:
Low Marketization Interval (MAR ≤ 8.2069): When the degree of marketization is below the first threshold, the regression coefficient of DNI is −0.0072. This suggests that in stages where market mechanisms are not yet fully developed, while DNI can contribute to narrowing the disparity, its empowerment efficiency is relatively constrained by barriers to resource mobility.
Medium Marketization Interval (8.2069 < MAR ≤ 8.6494): As the degree of marketization crosses the first threshold, the absolute value of the DNI coefficient increases significantly to −0.0441. This implies that improvements in the market environment accelerate the optimized allocation of production factors, thereby reinforcing the “equalizing effect” of DNI.
High Marketization Interval (MAR > 8.6494): Once the degree of marketization exceeds the second threshold, the absolute value of the coefficient further rises to −0.0805, with the marginal contribution to narrowing the disparity being approximately 11 times higher than that in the low marketization interval. Thus, Hypothesis 4 (H4) is supported.
The above results provide strong evidence of the “catalytic” role of marketization in the process of DNI empowering the real economy. As the degree of marketization improves, inter-regional administrative barriers gradually dissolve, facilitating smoother flows of traditional factors—such as land, capital, and talent—alongside digital elements. Under mature market mechanisms, digital infrastructure can more efficiently penetrate traditional enterprises with lower productivity. By reducing information asymmetry and transaction costs, it drives “catch-up” effects in less-developed regions, thereby converging the development gap in digital–real integration more effectively. Consequently, improving the institutional market environment is a critical prerequisite for unleashing the “equalizing” dividends of DNI.

6. Discussion

This study empirically confirms that digital new infrastructure plays a significant positive role in narrowing the regional disparity of digital–real integration. To further explore the theoretical value and practical implications of these findings, this section provides an in-depth discussion on the core results.

6.1. Re-Evaluating the Theoretical Logic of the Equalizing Effect of DNI

Our study reveals that DNI exhibits a stronger catch-up effect in the central and western regions, which resonates with theories on technological leapfrogging. Unlike traditional infrastructure that may induce polarization, DNI significantly lowers the entry threshold for underdeveloped regions due to its high permeability and spatial–temporal flexibility. We argue that digital technology diffusion and talent mobility act as the two core wings for achieving this: the former addresses technology accessibility, while the latter resolves factor adaptability.
These findings have profound implications for sustainable development. By demonstrating that DNI serves as a catalyst for the balanced development of the digital–real economy, our research highlights a viable pathway to mitigate regional inequalities—a core pillar of sustainable development. The evidence suggests that when digital infrastructure is supported by a mature market environment and strategic resource allocation (e.g., the “East Data, West Computing” initiative), it functions as a powerful tool for inclusive growth. Ultimately, DNI is not merely an isolated hardware investment, but a transformative force that reshapes factor markets. It provides underdeveloped regions with the potential to compete on an equal footing, supporting a transition toward a more resilient economic structure where digital technology acts as an essential element in ensuring equitable and sustainable socio-economic progress across all regions.

6.2. Synergistic Mechanism and Evolutionary Logic of Technology Diffusion and Talent Mobility

The empirical results demonstrate that both digital technology diffusion and digital talent mobility exert significant mediating effects. However, deeper analysis suggests that these two mechanisms are not simply additive; rather, they exhibit synergistic operations and dynamic evolution across different development stages.
Synchronous Synergy Nationwide. The findings show that both DTD and DTM remain significant across regional regressions, confirming the characteristic of factor coupling in the digital era. The investment in DNI first mitigates the asymmetry of geographic information (i.e., DTD), subsequently providing a hardware carrier for digital talent to apply their skills. We argue that in the nascent stage of digital–real integration, DTD and DTM act as dual drivers: DTD provides tool availability, while DTM provides usage capability. Together, they constitute the necessary conditions for central and western regions to achieve a catch-up effect.
Evolutionary Characteristics Across Stages. Incorporating the threshold effect analysis of marketization, we observe that the dominant role of these mechanisms shifts across development stages:
Primary Stage: DTD occupies the dominant position. In this stage, underdeveloped regions primarily face technological blockades caused by the digital divide. The intervention of DNI triggers an inclusive diffusion of technology, with its marginal contribution to narrowing the disparity being most direct. At this point, due to incomplete industrial supporting facilities, talent mobility is constrained, making technological spillover the primary driver of balanced development.
Advanced Stage: The empowering depth of DTM becomes prominent. As marketization crosses the threshold (e.g., MAR > 8.6494), administrative barriers dissolve, significantly enhancing the centripetal force and mobility of talent. We argue that when technology tends toward homogenization, the depth of digital–real integration—specifically the deep integration of digital technology into the real industrial chain—depends more on management innovation and knowledge spillovers brought by high-caliber talent. Therefore, in the high-marketization interval, the DTM mechanism gradually becomes dominant, serving as a key factor driving the exponential convergence of digital–real integration (with the coefficient jumping from −0.007 to −0.081).
From Unidirectional Path to Systemic Integration. Further discussion reveals a positive feedback loop between DTD and DTM. The widespread diffusion of digital technology enhances the digitalization atmosphere in central and western regions, thereby reducing the psychological and switching costs for digital talent to enter these areas. Conversely, the inflow of talent accelerates the secondary development and application of advanced digital technologies in local real-sector industries. This interactive “technology-attracts-talent, talent-promotes-technology” mechanism explains why DNI generates such substantial equalizing dividends after crossing specific thresholds.

6.3. The Double-Edged Sword of Fiscal Intervention and Marketization

A notable finding is that government fiscal support, in certain contexts, fails to enhance the equalizing effect of DNI, and instead exhibits a positive interaction term, suggesting an attenuation of the equalizing effect. This points to the delicate balance between government intervention and market forces. Under strong government guidance, resources often flow toward star enterprises or core industrial parks with the highest immediate efficiency. This administrative logic of picking winners may trigger localized surges in digitalization in the short term, thereby widening the gap between these enterprises and the broader real sector within the province.
In contrast, the threshold analysis indicates that higher marketization levels allow for a more comprehensive release of the equalizing dividends of DNI. This leads to the conclusion that the inclusivity of DNI is highly dependent on a market environment characterized by fair competition and free factor mobility. Without the enabling power of market mechanisms, government-led blood transfusion may struggle to achieve genuine, balanced digital–real integration.

6.4. Offsetting Geographic Disadvantages Through National Strategy

Regarding the heterogeneity analysis of the computing power hub nodes (the East-to-West Computing Resource Transfer project), we argue that national strategic planning plays a key role in breaking geographic determinism. By coordinating and deploying computing resources, hub nodes not only improve local digital–real integration but also drive the digital upgrading of surrounding industries through spillover effects. This finding offers a new perspective on addressing China’s long-standing regional imbalances: the cross-regional scheduling of new production factors, such as computing power, can effectively offset the traditional geographic disadvantages of central and western regions.
While these findings highlight the efficacy of China’s top-level design in addressing regional imbalances, they also prompt a broader question: how does this “Chinese model” of digital–real integration compare to the prevailing digital development paradigms documented globally? The following section situates our results within the international academic debate to derive broader implications.

6.5. International Comparison and Implications

Our empirical findings provide a nuanced perspective on the global debate regarding the socio-economic impacts of digital infrastructure. By situating the Chinese experience within a broader international context, several key points of convergence and divergence emerge.
First, in terms of productivity enhancement, our results align with the “general-purpose technology” framework observed in advanced economies. Consistent with research in the United States and Europe [5], this study confirms that digital new infrastructure (DNI) serves as a fundamental catalyst for DRI by reducing information frictions and enhancing supply chain coordination. The “efficiency gains” identified in our analysis echo the findings of Brynjolfsson et al. [6], suggesting that the role of digital connectivity in optimizing industrial processes is a universal phenomenon that transcends institutional boundaries.
However, our study offers a distinct departure from the “polarization hypothesis” often documented in the Western literature. While studies in the US and EU often caution that digital advancements may favor high-human-capital hubs—thereby reinforcing regional disparities [5]—our findings provide robust evidence for the “convergence potential” of DNI. Unlike the market-driven models in many developed nations, which may inadvertently lead to a “skill-biased” technological trap, the Chinese model demonstrates that large-scale, proactive infrastructure deployment can effectively narrow the DRI gap between developed coastal provinces and underdeveloped inland regions.
This discrepancy can be attributed to several unique factors inherent in the Chinese context:
In many Western economies, digital infrastructure follows market demand, which naturally favors existing economic centers. In contrast, China’s “proactive deployment” (e.g., the “East Data, West Computing” project) ensures that high-quality digital resources reach late-developing regions ahead of demand, lowering the entry barriers for local industries.
Our analysis confirms that the “inclusive support” of DNI is most potent in regions with lower initial integration levels. This suggests that the law of diminishing marginal returns allows underdeveloped provinces to achieve a “leapfrogging” effect in industrial upgrading, a mechanism that may be less pronounced in countries with more homogenous infrastructure coverage.
While the World Bank [6] warns that hardware alone cannot bridge the digital divide, our study illustrates how DNI facilitates “knowledge decoding” and “talent mobility.” By overcoming geographical stickiness, DNI enables digital talent and technology to flow into central and western regions, activating local industrial stocks in a way that differs from the rigid resource concentration seen in earlier stages of the global digital revolution.
In conclusion, while the core productivity-enhancing mechanisms of digital infrastructure are universal, the spatial equalization effect observed in this study highlights the importance of strategic top-level design. This offers a new template for other emerging economies: by combining “hard” infrastructure coverage with “soft” mechanisms for technology and talent diffusion, the digital economy can become a force for regional convergence rather than a driver of further polarization.

6.6. Research Limitations and Future Prospects

Although this study employs various econometric methods to verify the research conclusions, certain limitations remain.
First, there are inherent limitations in the measurement of digital talent mobility (DTM). While the cross-provincial net transfer records of social security provide administrative authority and professional precision in capturing formal labor migration, this indicator may not fully cover the vibrant digital gig economy, freelance workers, or informal employment groups. Furthermore, while the proportional imputation for missing early-year data and the Inverse Hyperbolic Sine (IHS) transformation ensure data continuity and robustness, they may still lead to discrepancies between the estimated and actual intensity of talent flow. Future research could integrate data from online recruitment platforms, high-frequency social networks, or micro-level tracking of digital professionals to construct more granular and comprehensive indicators, thereby better capturing the dynamic evolution of digital factor allocation across regions.
Second, constrained by data availability, the measurement of DNI primarily focuses on the provincial level; future research could attempt to conduct micro-level investigations at the prefecture or even county level.
Third, digital–real integration is a dynamic evolutionary process; the long-term cumulative effects and nonlinear fluctuations of DNI warrant further tracking.
Finally, exploring the differential impacts of DNI on different industries such as manufacturing versus services will be a critical direction for future research.

7. Conclusions and Policy Implications

7.1. Conclusions

This study examines the underlying mechanisms through which digital new infrastructure influences the balanced development of digital–real integration. The empirical results demonstrate that DNI exerts a significant equalizing effect across the country, effectively promoting balanced development in digital–real integration among provinces. Regarding the transmission pathways, digital technology diffusion and digital talent mobility serve as the core dual engines for achieving this objective. Furthermore, these two mechanisms exhibit dynamic and synergistic evolutionary characteristics across different stages of development: in the initial construction phase, the inclusive spillover of technology diffusion serves as the foundational momentum for bridging the digital divide; as the digital ecosystem matures, the knowledge spillover driven by talent mobility gradually assumes a dominant position, propelling digital–real integration from superficial access toward deep-seated empowerment.
In addition, the study confirms that the moderating role of the degree of marketization (MAR) in this process exhibits clear nonlinear features. As the degree of marketization crosses the two critical threshold values of 8.2069 and 8.6494, the efficiency of the equalizing dividends released by DNI undergoes a stepwise leap. Notably, while national strategic layouts such as the “East-to-West Computing Resource Transfer” project effectively offset geographic disadvantages, fiscal intervention may, in certain specific environments, induce a “picking-the-winner” bias, which can trigger localized polarization effects in the short term. These findings collectively validate all the research hypotheses proposed in this study, providing robust empirical support for understanding how digital infrastructure can effectively narrow the development gap in digital–real integration.

7.2. Policy Implications

Based on the research findings, this study proposes the following policy recommendations to fully unleash the inclusive dividends of DNI and promote high-quality, balanced development of DRI.
First, implement a gradient guidance strategy based on the level of marketization. Regions should precisely match their resource allocation priorities according to their current marketization threshold interval. For provinces that have not yet reached the critical MAR threshold of 8.2069, policy focus should shift from simple infrastructure expansion to deep institutional governance. By dismantling administrative monopolies and barriers to factor mobility, these regions can clear institutional obstacles for the implementation of digital technology. For regions that have already crossed the MAR threshold of 8.6494, policy efforts should focus on the cultivation and retention of high-end digital talent, leveraging the strong spillover effects of intellectual capital to drive the digital reshaping of traditional industrial chains.
Second, construct an inclusive, bundled empowerment mechanism to balance efficiency and equity. To address the “Matthew effect” of fiscal intervention identified in our empirical analysis, we suggest optimizing the logic of fiscal fund allocation. Policy should pivot from solely supporting “digital star enterprises” to facilitating the digital transformation of small and medium-sized enterprises (SMEs). By integrating DNI investment with inclusive financial policies and technology adoption subsidies, the government can lower the digital access costs for entities in underdeveloped regions, prevent the monopoly of digital resources by a few dominant players, and ensure that the dividends of DRI permeate the grassroots of the economy.
Finally, deepen the collaborative scheduling of digital factors across regions. Relying on national strategies such as the “East-to-West Computing Resource Transfer,” policymakers should further strengthen the radiation and driving role of hub-node provinces over non-hub provinces. By establishing cross-regional systems for the mutual recognition of digital talent qualifications and mechanisms for sharing computing resources, regions can alleviate the inherent deficiencies in technological reserves and human capital in the central and western areas. Building such a virtuous feedback system—where technology attracts talent and talent promotes technology—can effectively offset the influence of traditional geographic determinism, ultimately achieving a high-level, dynamic equilibrium of DRI nationwide.

Author Contributions

Conceptualization, R.Y.; Methodology, R.Y.; Software, R.Y.; Validation, R.Y.; Formal analysis, R.Y.; Investigation, R.Y.; Resources, R.Y.; Data curation, R.Y.; Writing—original draft, R.Y.; Writing—review & editing, D.S.; Visualization, X.L.; Supervision, D.S.; Project administration, X.L.; Funding acquisition, X.L. All authors have read and agreed to the published version of the manuscript.

Funding

This research received no external funding.

Institutional Review Board Statement

Not applicable.

Informed Consent Statement

Not applicable.

Data Availability Statement

Data are contained within the article.

Conflicts of Interest

The authors declare no conflict of interest.

References

  1. Fan, F.Z.; Zhu, M.Y.; Peng, T.T. Measurement, spatiotemporal comparison, and obstacle identification of digital-real integration in China. J. Soc. Sci. Hunan Norm. Univ. 2026, 55, 59–67. [Google Scholar] [CrossRef]
  2. Chen, X.D.; Zhou, Z.Q.; Mu, W.L. Digital infrastructure, digital inclusive finance, and regional coordinated development. Reg. Econ. Rev. 2025, 6, 97–108. [Google Scholar] [CrossRef]
  3. Xinhua News Agency. China’s 5G Base Stations Reach 4.838 Million, Signaling Deep Integration of Digital and Real Economies. 2026. Available online: http://www.gov.cn/ (accessed on 30 March 2026).
  4. de Seta, G. China’s digital infrastructure: Networks, systems, standards. Glob. Media China. 2023, 8, 245–253. [Google Scholar] [CrossRef]
  5. Cardona, M.; Kretschmer, T.; Strobel, T. ICT and productivity: Conclusions from the empirical literature. Inf. Econ. Policy 2013, 25, 109–125. [Google Scholar] [CrossRef]
  6. Bresnahan, T.F.; Trajtenberg, M. General purpose technologies ‘Engines of growth’? J. Econom. 1995, 65, 83–108. [Google Scholar] [CrossRef]
  7. Ivanov, D.; Dolgui, A.; Sokolov, B. The impact of digital technology and Industry 4.0 on the ripple effect and supply chain risk analytics. Int. J. Prod. Res. 2019, 57, 5290–5307. [Google Scholar] [CrossRef]
  8. Goldfarb, A.; Tucker, C. Digital Economics. J. Econ. Lit. 2019, 57, 3–43. [Google Scholar] [CrossRef]
  9. Autor, D.H.; Levy, F.; Murnane, R.J. The skill content of recent technological change: An empirical exploration. Q. J. Econ. 2003, 118, 1279–1333. [Google Scholar] [CrossRef]
  10. Brynjolfsson, E.; Rock, D.; Syverson, C. The productivity J-curve: How intangibles complement capital. Am. Econ. Rev. 2021, 111, 98–135. [Google Scholar]
  11. Niebel, T. ICT and economic growth—Comparing developing, emerging and developed countries. World Dev. 2018, 104, 197–211. [Google Scholar] [CrossRef]
  12. World Bank. World Development Report 2016: Digital Dividends; World Bank Publications: Washington, DC, USA, 2016. [Google Scholar]
  13. Beck, T.; Demirguc-Kunt, A.; Levine, R. Finance, inequality, and the poor. J. Econ. Growth 2007, 12, 27–49. [Google Scholar] [CrossRef]
  14. Acemoglu, D.; Johnson, S.; Robinson, J. The colonial origins of comparative development: An empirical investigation. Am. Econ. Rev. 2001, 91, 1369–1401. [Google Scholar] [CrossRef]
  15. Barro, R.J.; Sala-i-Martin, X. Convergence. J. Polit. Econ. 1992, 100, 223–251. [Google Scholar] [CrossRef]
  16. Wang, Z.G.; Li, X.M.; Hu, N.N. Research on the impact of digital economy on regional coordinated development in China: An analysis based on the perspective of economic growth convergence. Urban Probl. 2024, 1, 75–83. [Google Scholar] [CrossRef]
  17. Yang, L.X.; Liu, Y.C. The impact of digital infrastructure on industrial chain resilience: Evidence from China’s manufacturing. Technol. Anal. Strateg. Manag. 2025, 37, 1112–1128. [Google Scholar] [CrossRef]
  18. Li, W.W.; Cui, W.L.; Yi, P.T. Digital infrastructure and industrial integration: An assessment of the coupling coordination effect between digital and real economy in China. Telecommun. Policy 2026, 50, 103196. [Google Scholar] [CrossRef]
  19. He, Y.; Zhu, Z.M.; Zhou, Q. The impact of digitalization on the transformation and upgrading of traditional SMEs. China Bus. Mark. 2025, 39, 84–97. (In Chinese) [Google Scholar] [CrossRef]
  20. Wang, S.; Wang, Y.F.; Wang, C.Q.; Dai, L.; Li, Y.Q. The coordinated development of the “center-periphery” structure in regional economy: The dual driving force of technological innovation and digital economy. Int. Reg. Sci. Rev. 2026, 49, 91–142. [Google Scholar] [CrossRef]
  21. Zhang, Z.J.; Yu, Y. The nonlinear impact of data factor flow on coordinated regional economic development: Based on the moderating effect of digital infrastructure. Financ. Res. Lett. 2025, 85, 108044. [Google Scholar] [CrossRef]
  22. Dong, K.; Sun, K.K. Digital economy, technological progress, and balanced economic development: An empirical analysis based on night-time light data. Rev. Ind. Organ. 2026, 1–23. Available online: https://link.cnki.net/urlid/cn.20260312.1424.010 (accessed on 21 April 2026).
  23. Li, Z.B.; Li, H.; Wang, S.W. How Multidimensional Digital Empowerment Affects Technology Innovation Performance: The Moderating Effect of Adaptability to Technology Embedding. Sustainability 2022, 14, 15916. [Google Scholar] [CrossRef]
  24. Wan, X.Y.; Wang, Y.F.; Zhang, W. The spatial and temporal situation of China’s digital technology innovation and its influencing factors. PLoS ONE 2024, 19, e0297401. [Google Scholar] [CrossRef]
  25. Li, X.; Wu, T.; Zhang, H.J.; Yang, D.Y. Digital technology adoption and sustainable development performance of strategic emerging industries: The mediating role of digital technology capability and the moderating role of digital strategy. J. Organ. End User Comput. 2022, 34, 1–18. [Google Scholar] [CrossRef]
  26. Fang, X.B.; Liu, M.T. How does the digital transformation drive digital technology innovation of enterprises? Evidence from enterprise’s digital patents. Technol. Forecast. Soc. Change 2024, 204, 123428. [Google Scholar] [CrossRef]
  27. OECD. OECD Employment Outlook 2023: Artificial Intelligence and the Labour Market; OECD Publishing: Paris, France, 2023. [Google Scholar]
  28. Zou, X.; Meng, S.Y.; Liu, C. Digital infrastructure construction and urban inflow of high-skilled talents: Evidence from China. Humanit. Soc. Sci. Commun. 2026, 13, 272. [Google Scholar] [CrossRef]
  29. Huang, L.; Zhao, L.H. Digital finance, talent aggregation, and urban economic resilience. Financ. Res. Lett. 2026, 98, 108823. [Google Scholar] [CrossRef]
  30. Hua, Z.S.; Kong, S.N.; Yu, Y.H. Talent magnets in China: Can talent attraction policies catalyze digital transformation in enterprises? China Econ. Rev. 2025, 90, 102376. [Google Scholar] [CrossRef]
  31. Quan, S.Q. How does talent introduction drive digital economy development? Evidence from Chinese cities. Appl. Econ. Lett. 2026. advance online publication. [Google Scholar] [CrossRef]
  32. Chen, Y.F.; Ng, K.H. Spatial network of digital talent mobility and its impact on economic growth in urban agglomerations in China. Singap. Econ. Rev. 2026. advance online publication. [Google Scholar] [CrossRef]
  33. Huang, X.; Zhang, S.P.; Zhang, J.; Yang, K. Research on the impact of digital economy on regional green technology innovation: Moderating effect of digital talent aggregation. Environ. Sci. Pollut. Res. 2023, 30, 74409–74425. [Google Scholar] [CrossRef]
  34. Li, X.M.; Chen, Z.S.; Chen, Y.Q. The impact of digital talent inflow on the co-agglomeration of the digital economy industry and manufacturing. Systems 2024, 12, 317. [Google Scholar] [CrossRef]
  35. Cai, Y.C.; Umair, M.; Adam, N.A.; Zhang, R.L.; Mirzaliev, S.; Chang, C.D. Marketization as a catalyst: Understanding the impact of digital economies on green innovation in mainland China. Manag. Decis. Econ. 2025, 46, 2895–2910. [Google Scholar] [CrossRef]
  36. Alfoul, M.N.A.; Tajaddini, R.; Gholipour, H.F.; Bashar, O.; Jamaani, F. Impacts ICT Econ. Growth MENA Countries: Does Institutional Matter? Politická Ekon. 2024, 72, 446–477. [Google Scholar] [CrossRef]
  37. Bi, S.Y.; Zhang, X.J.; Xiao, G.L.; Li, H.X. Marketization, digital economy, and industrial structure transformation: Mechanisms and regional variations. Int. Rev. Econ. Financ. 2025, 102, 104228. [Google Scholar] [CrossRef]
  38. Liu, J. Digital-real integration, new quality productive forces, and China’s new industrialization. Stat. Decis. 2024, 40, 19–24. [Google Scholar]
  39. Wang, J.W. Statistical test on the impact of digital new infrastructure on regional economic growth disparities. Stat. Decis. 2025, 41, 100–105. [Google Scholar]
  40. Li, H.G. Digital new infrastructure, spatial spillover, and high-quality economic development. Inq. Into Econ. Issues 2022, 6, 28–39. [Google Scholar]
  41. Wu, F.; Hu, H.Z.; Lin, H.Y.; Ren, X.Y. Enterprise digital transformation and capital market performance: Empirical evidence from stock liquidity. Manag. World 2021, 37, 130–144. [Google Scholar] [CrossRef]
  42. Bellemare, M.F.; Wichman, C.J. Elasticities and the inverse hyperbolic sine transformation. Oxf. Bull. Econ. Stat. 2020, 82, 50–61. [Google Scholar] [CrossRef]
  43. Wang, X.L.; Hu, L.P.; Fan, G. The Marketization Index of China’s Provinces; Social Sciences Academic Press: Beijing, China, 2021; Volume 250. [Google Scholar]
  44. Hansen, B.E. Threshold effects in non-dynamic panels: Estimation, testing, and inference. J. Econom. 1999, 93, 345–368. [Google Scholar] [CrossRef]
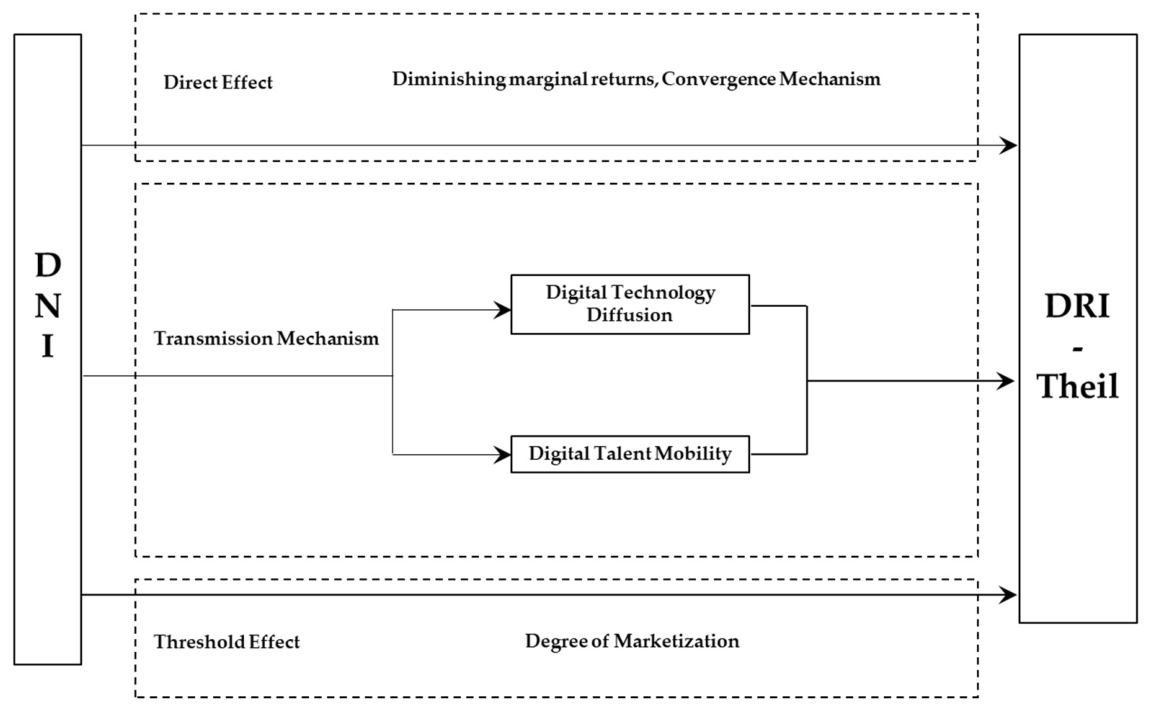
Figure 1. Analytical framework of the impact of DNI on the balanced development of DRI.
Sustainability 18 04636 g001
Figure 2. Spatial distribution of the digital–real integration level in China (2013–2023). Note: The map is constructed based on the standard map service provided by the Map Technology Review Center of the Ministry of Natural Resources (Review Number: GS(2019)1651). The original base map remains unaltered.
Sustainability 18 04636 g002
Table 1. Evaluation index system for digital–real integration.
DimensionIndicatorUnitWeightAttribute
Infrastructure IntegrationMobile phone penetration rateSets per 100 persons0.0781+
Internet broadband access rate%0.0775+
Optical cable densitykm/sq·km0.0745+
Innovation IntegrationTech transfer rate of industrial enterprises%0.0594+
Software revenue/GDP%0.0464+
Per capita telecommunication service volumeYuan/person0.0571+
R&D personnel (FTE) in electronic mfg.Person-years0.0625+
Application IntegrationShare of firms with e-commerce activities%0.0781+
Share of IT-enabled manufacturing firms%0.0752+
Websites per 100 enterprisesUnits0.0805+
Computers per 100 personsSets0.0755+
Financial IntegrationLevel of online mobile paymentsIndex0.0799+
Breadth of digital financial inclusionIndex0.0784+
Depth of digital financial inclusionIndex0.0769+
Table 2. Evaluation index system for digital infrastructure.
DimensionIndicatorUnitWeightAttribute
Information InfrastructureNumber of 4G/5G base stations10,000 units0.0901+
Number of large-scale data centersUnits0.1317+
Number of intelligent computing centersUnits0.0999+
Converged InfrastructureMileage of smart highwayskm0.0669+
Number of EV charging piles10,000 units0.0995+
Application InfrastructureNumber of nat’l key sci-tech facilitiesUnits0.1393+
Number of nat’l sci-edu facilitiesUnits0.1266+
Number of nat’l new industrialization basesUnits0.1018+
Infrastructure SupportFrequency of DI-related terms in gov’t reportsTimes0.0771+
Share of DI-related terms in gov’t reports%0.0661+
Table 3. Descriptive statistics for key variables.
VariableObsMeanSdMinMax
DRI_Theil3410.0010.012−0.0210.093
DRI3410.3310.1220.0940.716
DNI3410.2230.0910.0320.458
DTD3418.5081.3992.26714.272
DTM3417.2352.145−10.51211.664
MAR3416.0871.4911.8679.307
GDP34110.9690.43910.00312.208
HC3419.2741.1254.22212.782
FI3410.0180.0190.0000.121
FII3410.0130.0090.0010.086
GOV3410.2790.2460.0211.237
IS3411.4430.7620.6655.689
Note: DRI_Theil = The Digital–Real Integration Gap; DRI = Digital–Real Integration; DNI = Digital New Infrastructure; DTD = Diffusion of Digital Technology; DTM = Mobility of Digital Talent; MAR = Marketization Degree; GDP = Economic Development Level; HC = Human Capital Level; FI = Foreign Investment Level; FII = Fixed Asset Investment in Information Industry; GOV = Government Fiscal Intervention; IS = Industrial Structure.
Table 4. Pearson correlation matrix of main variables.
DRI_TheilDNIDTDDTMMARGDPHCFIFIIGOVIS
DRI_Theil1
DNI−0.0351
DTD0.452 *0.245 *1
DTM0.239 *−0.1030.256 *1
MAR0.563 *0.0760.627 *0.532 *1
GDP0.234 *0.132 *0.607 *0.553 *0.670 *1
HC0.189 *0.145 *0.644 *0.438 *0.368 *0.688 *1
FI0.264 *−0.0510.374 *0.310 *0.400 *0.265 *0.357 *1
FII0.345 *0.207 *0.657 *0.0740.536 *0.433 *0.276 *0.134 *1
GOV0.320 *0.141 *0.593 *0.519 *0.570 *0.771 *0.640 *0.478 *0.304 *1
IS0.050−0.0550.1030.549 *0.223 *0.551 *0.527 *0.154 *0.0250.522 *1
Note: DRI_Theil = The Digital–Real Integration Gap; DNI = Digital New Infrastructure; DTD = Diffusion of Digital Technology; DTM = Mobility of Digital Talent; MAR = Marketization Degree; GDP = Economic Development Level; HC = Human Capital Level; FI = Foreign Investment Level; FII = Fixed Asset Investment in Information Industry; GOV = Government Fiscal Intervention; IS = Industrial Structure. *, indicates statistical significance at the 10%, levels, respectively.
Table 5. Baseline regression results.
Variable (1) Full Sample
D R I _ T h e i l
(2) Lagging Subsample
D R I _ T h e i l < 0
(3) Leading Subsample
D R I T h e i l > 0
DNI−0.106 ***
(−3.62)
0.015 **
(2.77)
−0.171 *
(−2.27)
GDP−0.566 ***
(−6.55)
0.079 ***
(3.49)
−0.850 ***
(−4.19)
HC0.374 **
(2.88)
0.013
(0.48)
0.356
(0.85)
FI−0.105 **
(−2.96)
0.028 **
(3.06)
−0.145
(−1.97)
FII−0.029
(−0.64)
0.039 ***
(4.21)
0.033
(0.20)
GOV−0.071
(−0.84)
0.025
(1.04)
−0.047
(−0.29)
IS−0.137
(−1.31)
0.236 ***
(9.71)
0.341
(1.19)
_cons0.362 ***
(43.13)
−0.351 ***
(−32.06)
1.542 ***
(8.09)
YearYESYESYES
ProvinceYESYESYES
N341238103
R20.9320.8950.873
Notes: t-statistics are reported in parentheses. ***, **, and * denote significance at the 1%, 5%, and 10% levels, respectively.
Table 6. Endogeneity test.
Variable (1)
First Stage
(2)
Second Stage
(3)
First Stage
(4)
Second Stage
DNI −0.957 ***
(−3.90)
−1.553 ***
(−3.57)
IV10.396 ***
(6.56)
IV2 0.342 ***
(4.19)
ProvinceYESYESYESYES
YearYESYESYESYES
Kleibergen–Paap rk LM statistic 24.737
(0.000)
15.234
(0.000)
Kleibergen–Paap rk Wald F statistic 43.029
{16.38}
17.625
{16.38}
N341341341341
Notes: t-statistics are in parentheses. *** denotes significance at the 1% levels, respectively. The same notation applies to subsequent tables. The Kleibergen–Paap rk Wald F statistic is reported to test for weak instruments. Numbers in curly brackets {} are the Stock-Yogo critical values.
Table 7. Robustness checks.
Variable (1)
Excluding Municipalities
(2)
Winsorizing at 2%
(3)
Lagged Explanatory Variable
(4)
Dynamic Panel Model
DNI−0.061 *
(−2.06)
−0.062 ***
(−3.53)
−0.072 ***
(−4.26)
−0.066 *
(−1.99)
_cons−0.101 *
(−2.20)
−0.038 ***
(−3.66)
−0.032 **
(−2.66)
−0.081 ***
(−3.99)
ControlsYESYESYESYES
ProvinceYESYESYESYES
YearYESYESYESYES
N297217310310
N0.8920.9310.9120.886
Notes: t-statistics are reported in parentheses. ***, **, and * denote significance at the 1%, 5%, and 10% levels, respectively.
Table 8. Mediating effect of digital technology diffusion.
Variable Central & WesternEastern
(1)
DTD
(2)
D R I _ T h e i l
(3)
DTD
(4)
D R I _ T h e i l
DNI1.591 ***
(5.696)
−0.002 **
(−2.108)
0.687 *
(1.768)
−0.013 *
(−1.755)
DTD −0.003 ***
(−13.162)
−0.011 ***
(−5.779)
_cons18.120 ***
(27.326)
0.055 ***
(14.724)
18.414 ***
(20.113)
0.211 ***
(6.270)
ControlsYESYESYESYES
ProvinceYESYESYESYES
YearYESYESYESYES
N220220121121
R20.85190.85250.82790.8752
Notes: t-statistics are reported in parentheses. ***, **, and * denote significance at the 1%, 5%, and 10% levels, respectively.
Table 9. Mediating effect of digital talent mobility.
Variable Central & WesternEastern
(1)
DTM
(2)
D R I _ T h e i l
(3)
DTM
(4)
D R I _ T h e i l
DNI1.134 ***
(4.107)
−0.002 **
(−2.132)
1.233 ***
(3.363)
−0.014 *
(−1.783)
DTD −0.001 ***
(−8.665)
−0.004 **
(−2.064)
_cons−0.068
(−0.884)
0.005 ***
(18.636)
−0.961 ***
(−8.390)
0.020 ***
(6.714)
ControlsYESYESYESYES
ProvinceYESYESYESYES
YearYESYESYESYES
N220220121121
R20.83520.84960.85170.8472
Notes: t-statistics are reported in parentheses. ***, **, and * denote significance at the 1%, 5%, and 10% levels, respectively.
Table 10. Heterogeneity test.
Variable D R I _ T h e i l
(1) PI
D R I _ T h e i l
(2) ITL
D R I _ T h e i l
(3) FIN
D R I _ T h e i l
(4) SH
DNI−0.023 ***
(−4.213)
−0.011 ***
(−4.393)
−0.006 **
(−2.067)
−0.005
(−1.180)
HET−0.027 ***
(−3.058)
−0.005 ***
(−5.246)
−0.001
(−0.239)
DNI × HET0.050 ***
(3.148)
−0.018 ***
(−6.536)
−0.005 *
(−1.695)
−0.018 **
(−2.851)
_cons0.017 ***
(6.548)
0.010 ***
(16.491)
0.009 ***
(12.330)
0.007 ***
(8.982)
ControlsYESYESYESYES
ProvinceYESYESYESYES
YearYESYESYESYES
N341341341341
R0.82140.79320.82010.8654
Notes: t-statistics are reported in parentheses. ***, **, and * denote significance at the 1%, 5%, and 10% levels, respectively.
Table 11. Test for threshold effects.
Threshold Effect TestF-Statistic5% Critical Valuep-Value
Single Threshold50.9733.27610.0000
Double Threshold34.4638.89680.0267
Table 12. Threshold estimates and confidence intervals.
Threshold Effect TestThreshold Estimate95% Confidence Interval
Single Threshold8.2069[8.1999, 8.2863]
Double Threshold8.6494[8.6456, 8.6908]
Table 13. Result of the panel threshold model.
VariableCoefficient
DNI (MAR ≤ γ 1)−0.0072 ***
DNI ( γ 1 < MAR ≤ γ 2)−0.0441 ***
DNI ( γ 2 < MAR)−0.0805 ***
_cons0.0099 ***
ControlsYes
R20.7811
N341
Notes: t-statistics are reported in parentheses. *** denotes significance at the 1% levels, respectively.
Disclaimer/Publisher’s Note: The statements, opinions and data contained in all publications are solely those of the individual author(s) and contributor(s) and not of MDPI and/or the editor(s). MDPI and/or the editor(s) disclaim responsibility for any injury to people or property resulting from any ideas, methods, instructions or products referred to in the content.