1. Introduction
The evolution of China’s urban innovation networks constitutes a critical research frontier in regional development and national innovation strategy. In recent years, the deepening implementation of innovation-driven policies has significantly strengthened intercity innovation linkages. However, substantial disparities persist in the distribution of innovation resources across cities of different tiers [
1,
2]. This enduring inequality necessitates a deeper structural analysis of the innovation networks that channel these resource flows, moving beyond mere descriptive accounts to uncover the underlying mechanisms of differentiation.
To systematically investigate this structural differentiation, we focus on two primary networks that encapsulate distinct innovation processes: the Knowledge Innovation Network (KIN) and the Technology Innovation Cooperation Network (TIN). Between 2015 and 2024, these networks exhibited pronounced structural divergence, reflecting different logics of innovation factor flow [
3]. The KIN transitioned from a monocentric pyramid toward a polycentric mesh, albeit with persistent hierarchical gaps [
4]. In contrast, the TIN evolved into a polycentric structure demonstrating stronger hierarchical integration and patterns of uneven leapfrog development, where cooperation often transcends traditional administrative boundaries [
5]. A comparative analysis of their robustness, transmission efficiency, and spatial organization reveals how knowledge accumulation and technological collaboration respond differentially to policy, economic, and educational contexts. Understanding this differentiation is vital not only for optimizing resource allocation but also for addressing the persistent “core-periphery” dilemma to foster balanced regional development.
Furthermore, a sectoral perspective can provide concrete insights into how these macro-level networks function. The tourism sector, as a significant and knowledge-intensive urban activity, serves as a salient case in point. Its innovation dynamics are inherently embedded within the broader structures of KINs and TINs, offering a microcosm for examining the interplay of knowledge flows and technological co-creation. For instance, research on tourism knowledge networks examines structural attributes like stakeholder cohesion that affect information diffusion, which is directly relevant to understanding KINs [
6]. Concurrently, phenomenological frameworks that classify tourist experiences inform the nature of knowledge production in the sector [
7]. From a technological perspective, the rise of smart tourism ecosystems exemplifies digital technology-driven value co-creation, aligning with the operational logic of TINs [
8], while varied patterns of technology adoption among travelers reflect differentiated integration into such networks [
9]. Moreover, analyses of the sector’s resource intensity underscore the need for sustainable innovation [
10], and explorations of frontiers like the metaverse point to technology-mediated experience models [
11]. Thus, tourism innovation, being both knowledge-driven and technology-mediated, provides a pertinent lens through which the abstract structures of KINs and TINs can be concretely examined.
Beyond formation and structure, the resilience of these networks—their ability to withstand and adapt to shocks—is crucial for sustainable regional innovation. Different network types exhibit distinct resilient properties: KINs, built on long-term ties, may show strong structural stability, whereas TINs, being more dynamic, could display greater adaptive capacity [
12]. These differences carry important policy implications for maintaining system stability.
Despite these considerations, a significant research gap persists in the comparative, resilience-focused analysis of China’s dual innovation networks (KIN and TIN) within their dynamic context. Prior studies have often examined these networks in isolation or focused on singular attributes. A systematic comparison that concurrently analyzes their structural evolution, driving mechanisms, and resilience profiles is lacking. This study aims to fill this gap by providing a comparative analysis of the KIN and TIN in China from 2015 to 2024, examining their structural differentiation, the multi-proximity factors driving their evolution, and their distinct resilience characteristics. In doing so, it seeks to contribute to both the theoretical understanding of innovation network differentiation and the formulation of policies for more robust and balanced regional innovation development.
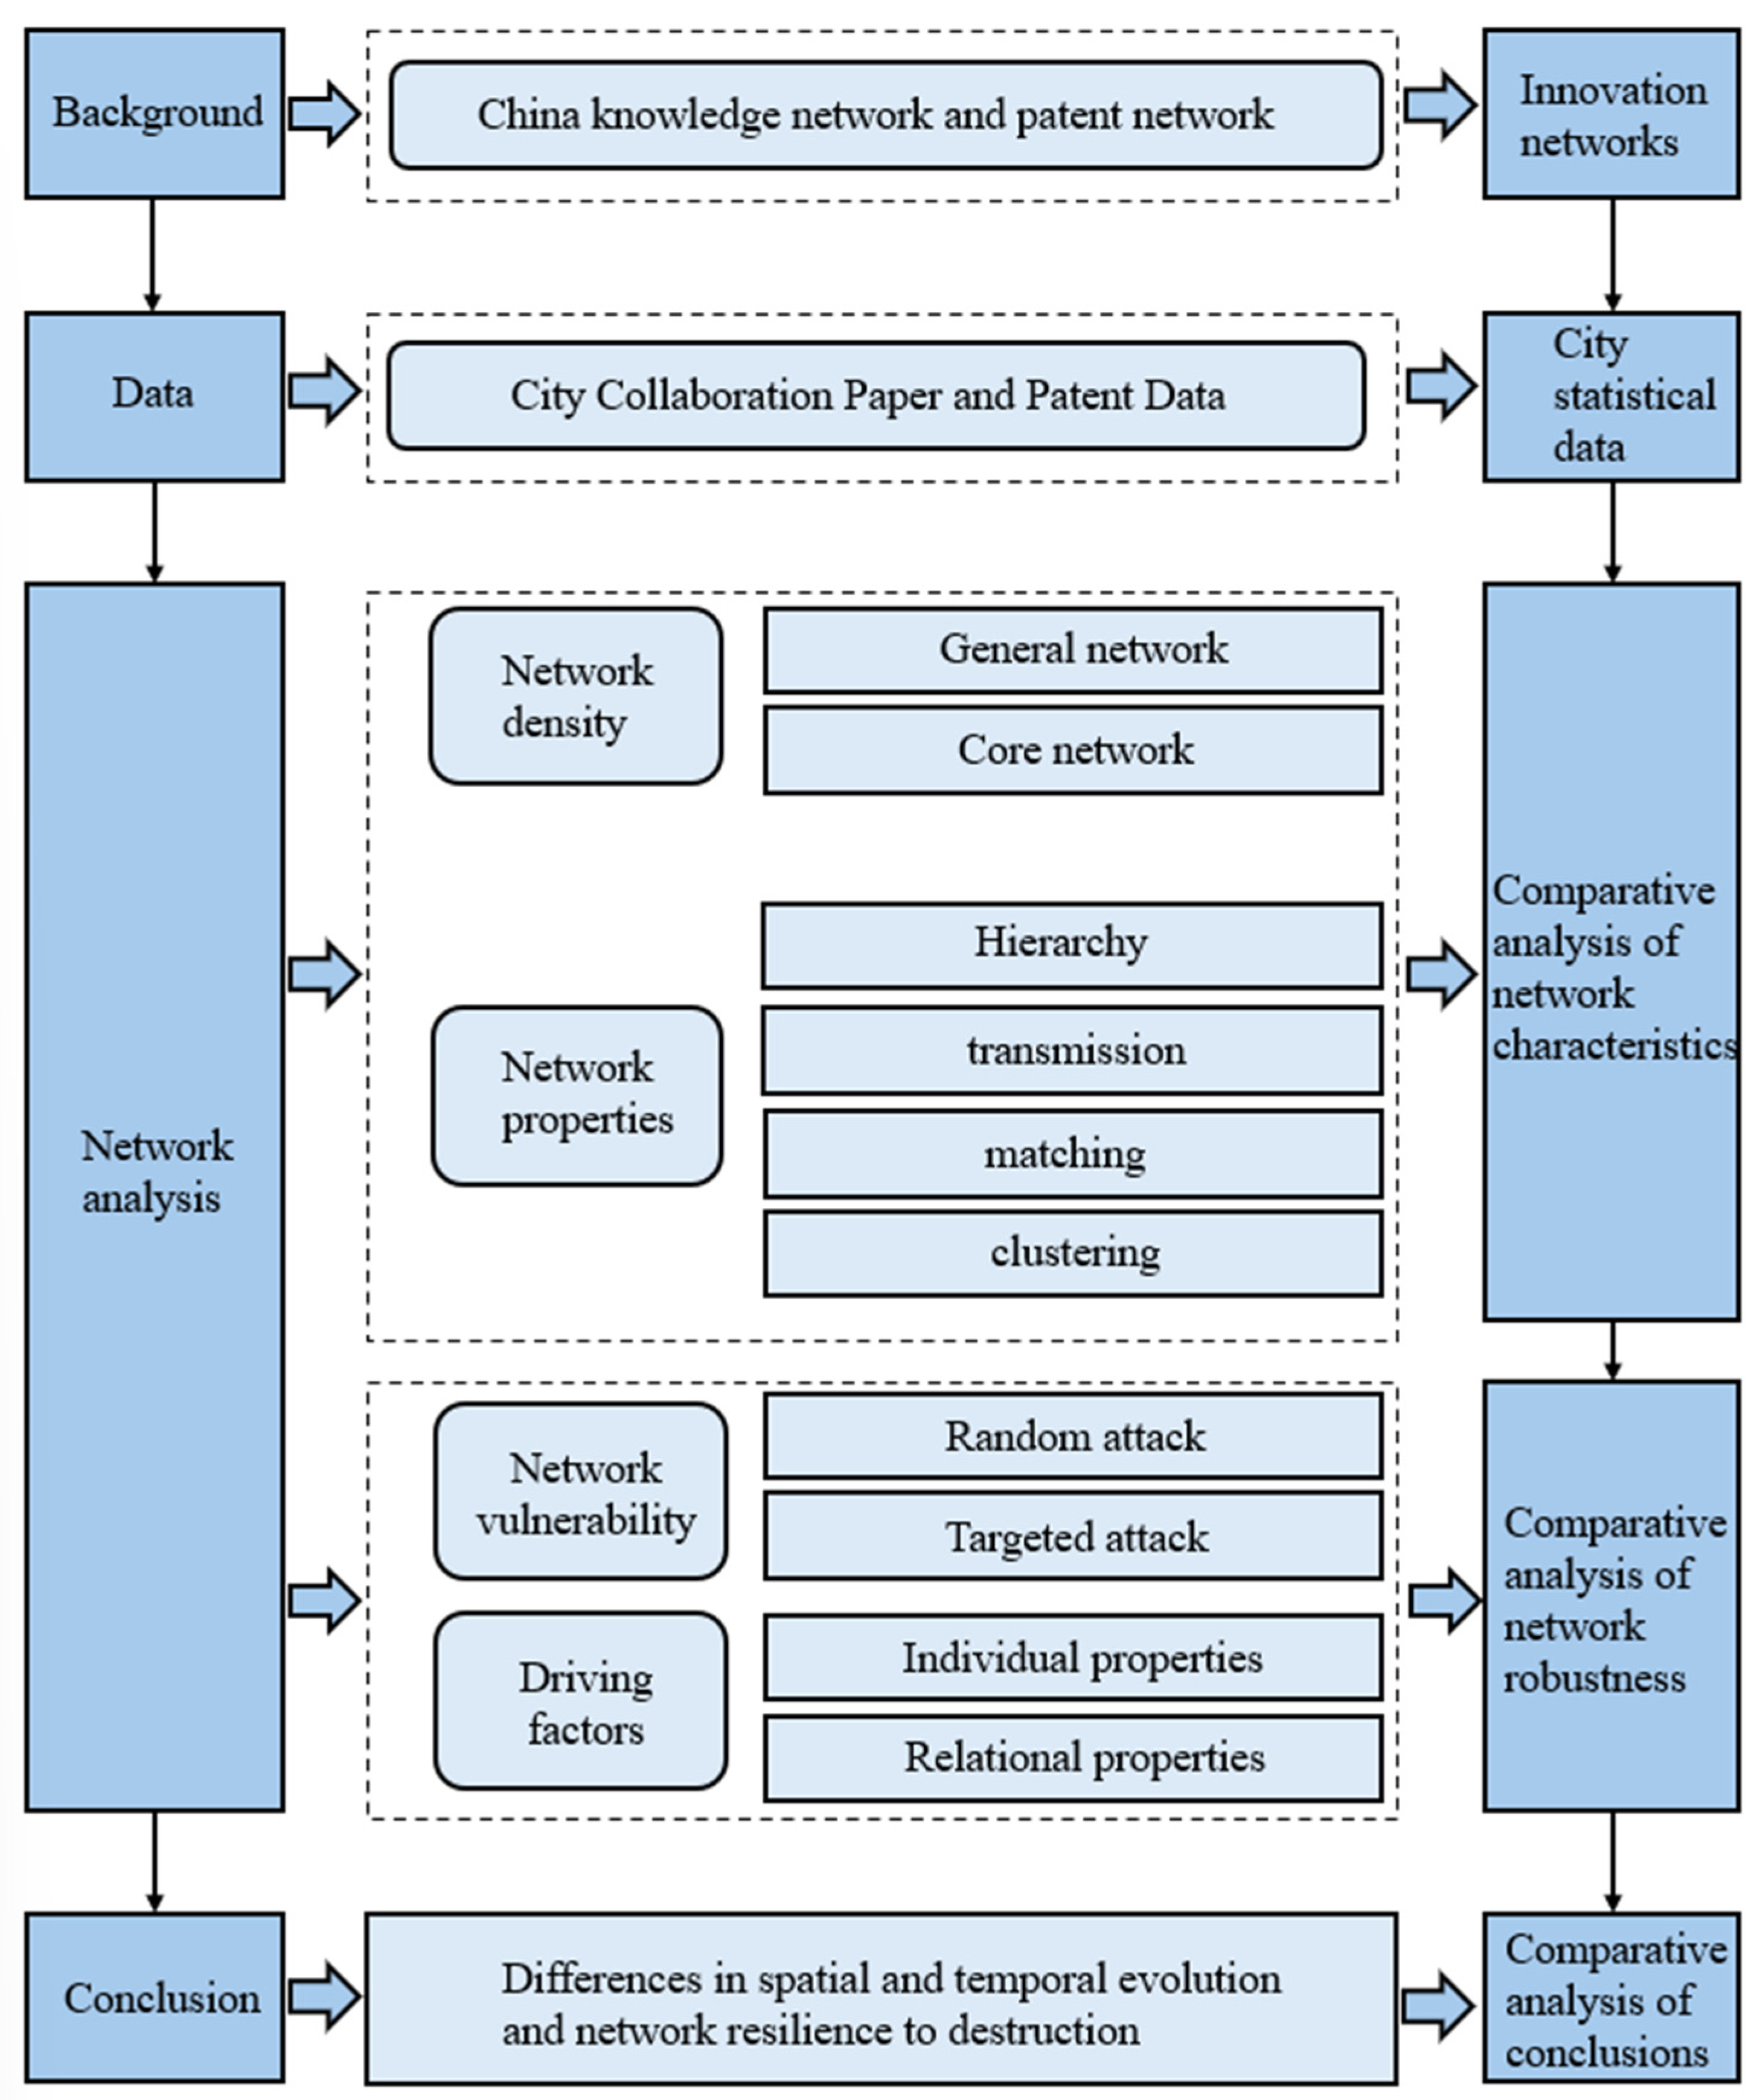
This study compares the structural evolution, resilience, and drivers of China’s Knowledge Innovation Networks (KIN) and Technology Innovation Networks (TIN) from 2015 to 2024. It addresses three research questions: how their structural paths differ, how their resilience mechanisms vary, and how multidimensional proximities differentially shape collaboration. Hypothesizing that KINs are more hierarchically rigid and attack-sensitive, while TINs are more adaptively polycentric yet prone to efficiency collapse, and that proximity facilitates collaboration in KINs but constrains it in TINs, the study employs complex network analysis, disruption simulations, and MRQAP modeling to test these propositions, ensuring methodological alignment with each research question. Based on the rationale outlined above, the following hypothesis is formulated:
H1: The positive interaction between economic and geographic proximity facilitates collaboration in KIN, but the same interaction constrains collaboration in TIN due to intensified competition.
This study presents a significant methodological advancement by introducing a dual-network comparative framework that integrates complex network analysis with spatial econometric modeling, thereby overcoming limitations inherent in conventional single-network approaches. The primary empirical contributions are threefold: First, network disruption experiments reveal fundamentally distinct resilience mechanisms, with knowledge innovation networks exhibiting hub-dependent stability while technology innovation networks demonstrate adaptive collaborative resilience—interaction effects between these mechanisms were quantified using MRQAP analysis, providing novel insights for multidimensional proximity theory. Second, empirical analyses identify a critical structural divergence in China’s innovation ecosystems, where knowledge networks evolve through path-dependent gradual flattening whereas technology networks undergo dynamic restructuring with identifiable efficiency mutation thresholds, offering explanatory power for instability in emerging technological domains. Third, regression results uncover a paradoxical proximity effect: the interaction of economic and geographic proximity enhances innovation performance in knowledge networks through facilitated tacit knowledge flows and collaborative synergies (manifesting positive agglomeration externalities), yet simultaneously undermines efficiency in technology networks by intensifying patent competition, resource crowding, and innovation homogenization (demonstrating negative proximity externalities).
2. Literature Review
Research on innovation networks provides the essential theoretical lens for understanding the operational mechanics of regional innovation systems. In an era of globalization and digitalization, urban innovation linkages are increasingly characterized by complex network properties that extend beyond simple geographic proximity [
13,
14]. These networks comprise node cities and the flows between them, with distinct activities—such as knowledge production versus technological co-creation—exhibiting different spatial and relational patterns [
15,
16].
In China’s specific context, the evolution of innovation networks is shaped by a unique interplay of market forces and state-led strategic planning [
17,
18,
19], leading to structural shifts that challenge conventional core-periphery models. A pivotal factor in this evolution is the enduring yet evolving influence of China’s urban administrative hierarchy. The hierarchical structure of cities remains a key, though contested, determinant of innovation network topology. Cities at different administrative levels traditionally possess varying capacities for resource allocation, imprinting pronounced hierarchical features on innovation networks [
20]. While higher-tier cities often concentrate resources and occupy core network positions, some lower-tier cities have rapidly upgraded their innovation capabilities through specialized pathways, improving their network centrality [
21,
22]. These dynamics suggest a restructuring where the administrative hierarchy’s direct influence may be weakening relative to market mechanisms and autonomous factor flows.
This shift brings to the fore the critical role of multi-dimensional proximities in enabling or constraining collaborative ties. The determinants of intercity innovation cooperation are multidimensional, where various forms of proximity interact to shape network formation. While geographic proximity was historically fundamental, advances in ICT and transportation have reduced its imperative [
23]. Similarly, coordinated regional policies have mitigated the barrier effect of economic disparities. Concurrently, the role of educational resources and talent mobility has become more salient for knowledge diffusion [
24]. Crucially, these dimensions interact; for instance, geographic proximity gains importance among cities with similar economic levels [
25,
26,
27]. This complex, evolving interplay necessitates a dynamic, multi-factor assessment of what drives cooperation in different types of innovation networks, setting the stage for the comparative investigation undertaken in this study.
4. Empirical Analysis
4.1. Urban Innovation Network
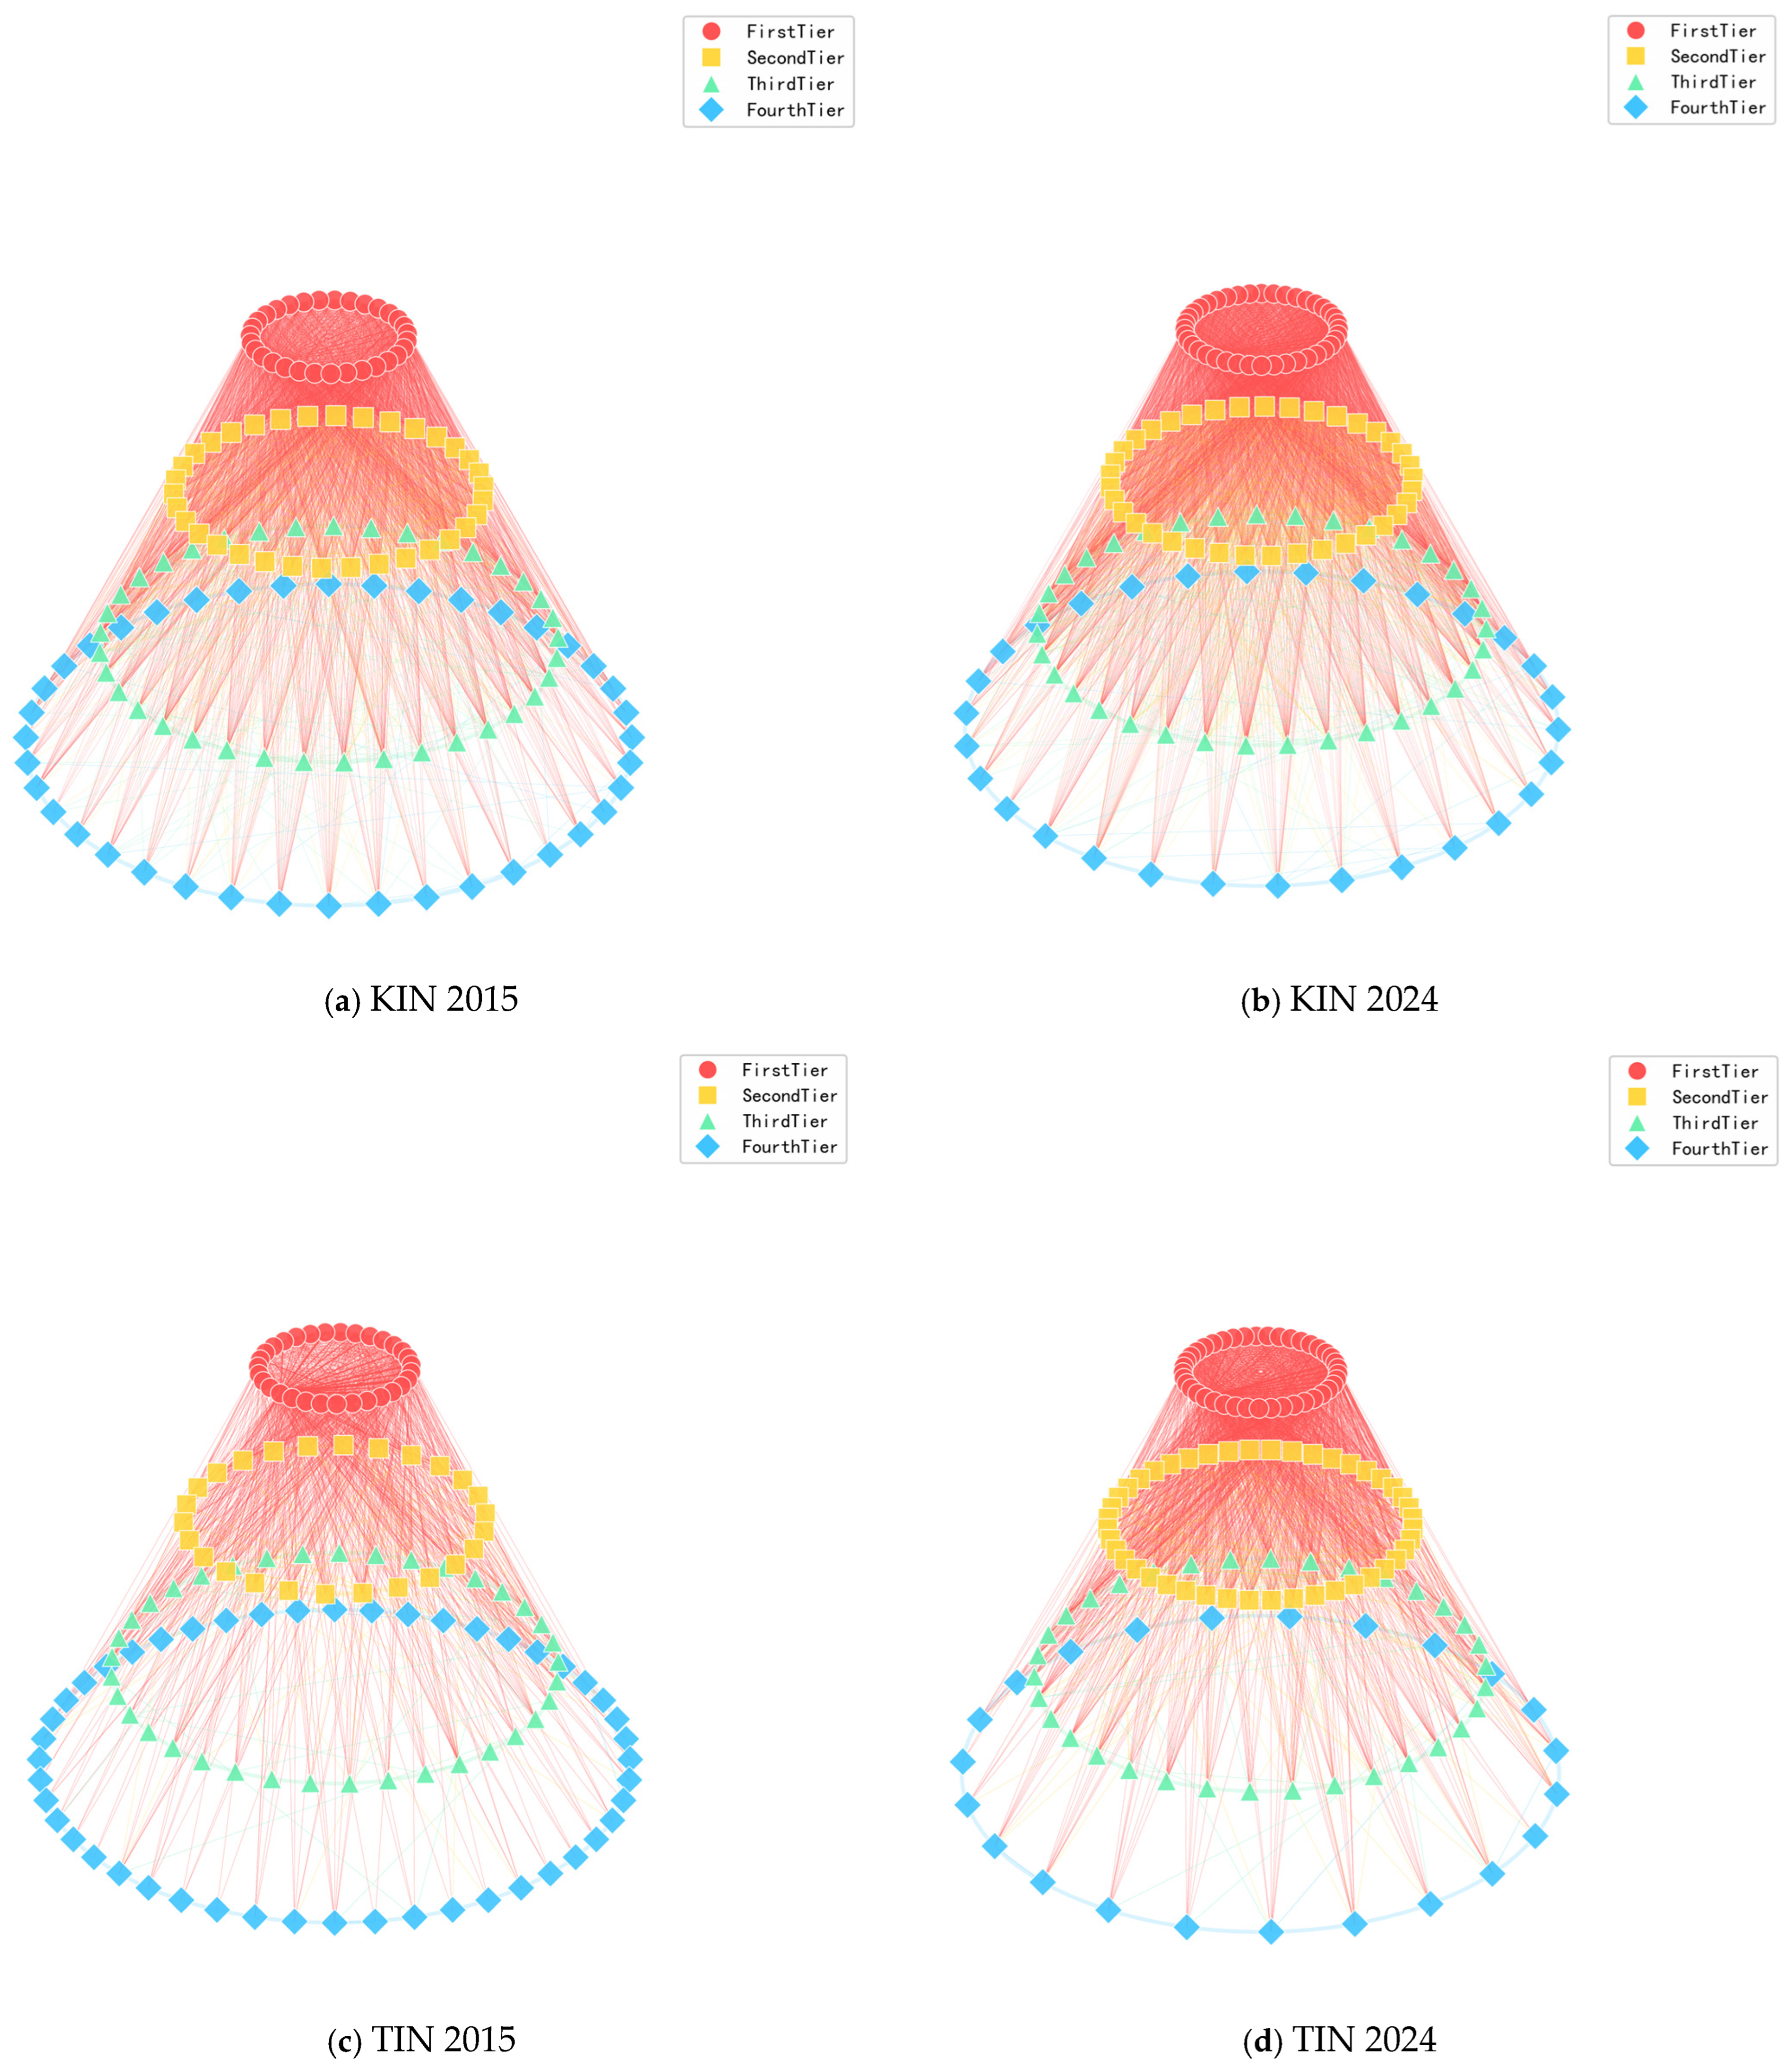
Figure 3 illustrates the node hierarchical graph. To prevent overcrowding, nodes in each layer are randomly selected in pairs. The four layers of nodes are then categorized based on a quadratic classification criterion.
Between 2015 and 2024, the KIN exhibits significant tier-based restructuring and connectivity shifts. The dominance of Tier 1 cities has further consolidated, while cross-tier linkages with Tier 2 have intensified over the decade, forming a radial pattern of knowledge diffusion. Meanwhile, Tier 3 and Tier 4 cities have evolved from isolated nodes into sub-hubs. For instance, Tier 4 relied on a single connection to the core tier in 2015 but engaged in multi-path cross-tier interactions by 2024, reflecting deeper penetration of innovation resources into lower-tier cities. Although the network has transitioned from a monocentric pyramid to a polycentric mesh structure, inter-tier disparities persist, with Tier 2 playing a pivotal bridging role between upper and lower tiers.
During the same period, the TIN demonstrates stronger hierarchical convergence and blurred tier boundaries. While Tier 1 nodes retain technological control, their direct collaboration with Tier 3 surged by 2024, signaling that knowledge spillovers increasingly transcend traditional tier barriers. Notably, Tier 4 cities now integrate into the innovation chain through cross-tier shortcuts, a rare phenomenon in 2015, highlighting dynamic network evolution. However, enhanced small-world properties coincide with intra-tier polarization: some Tier 2 nodes emerge as regional gateways, whereas others face marginalization, creating a bidirectional divergence within the tier.
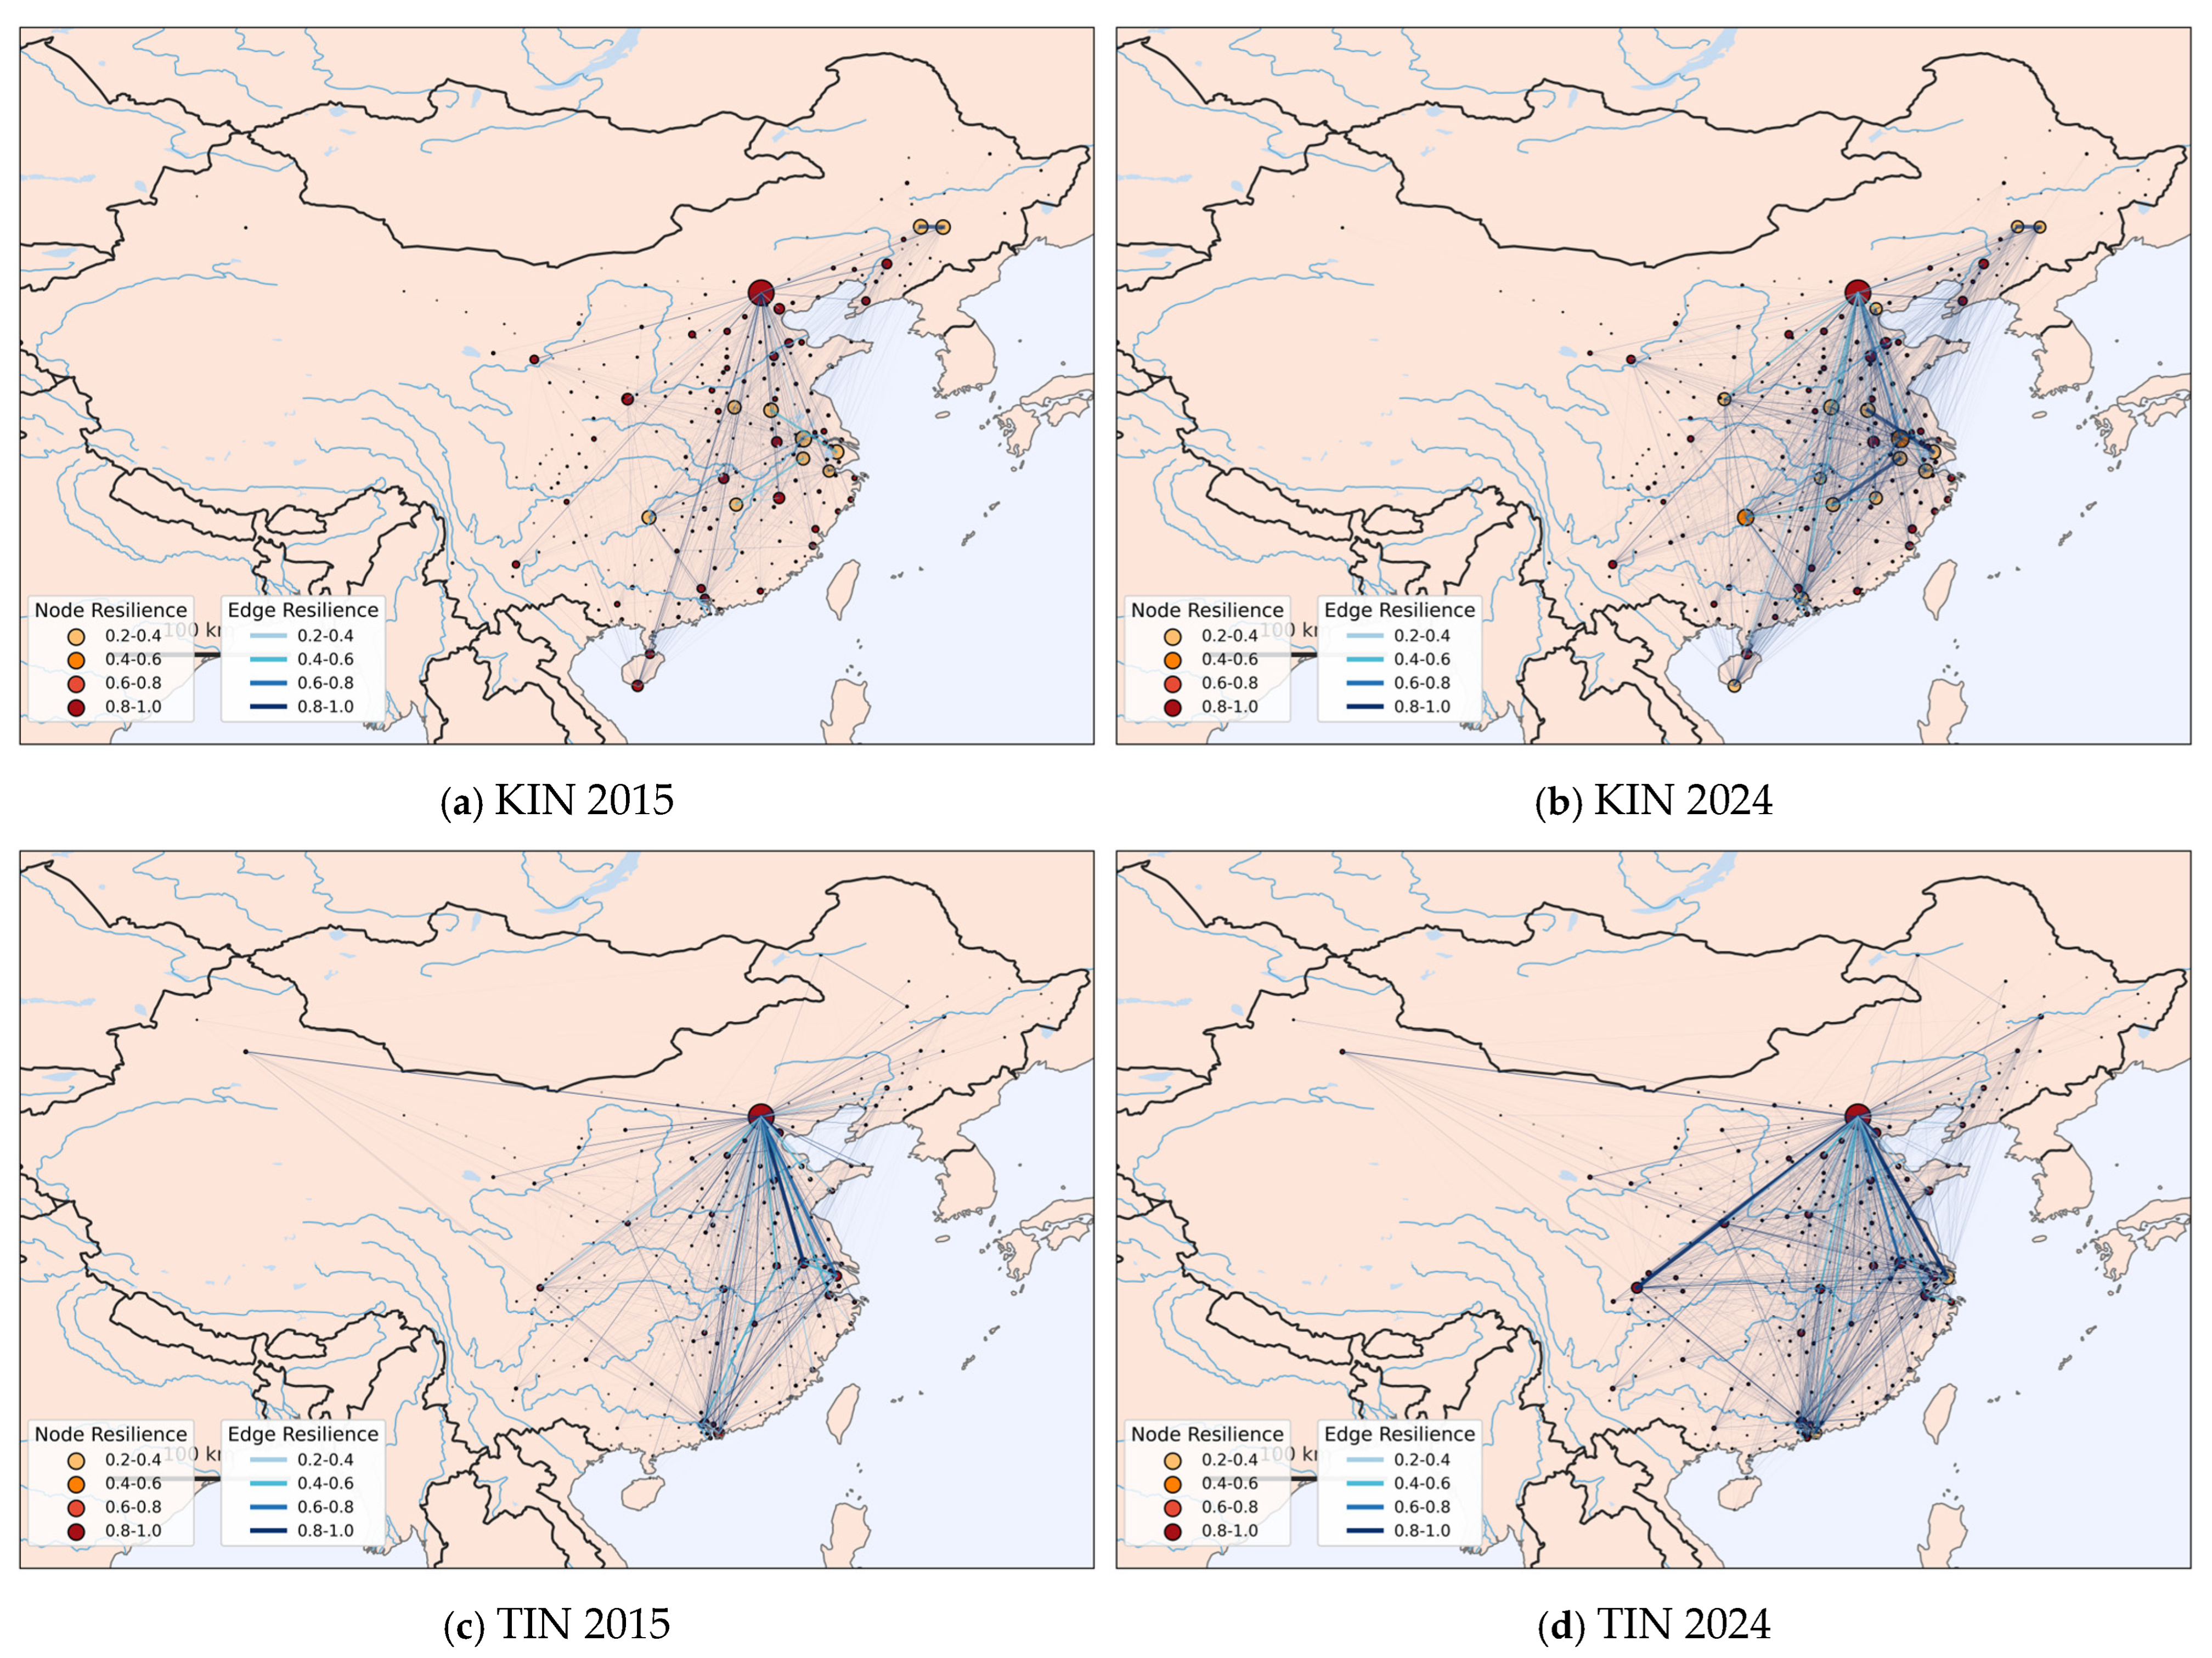
In 2015, the Knowledge Innovation Network (KIN) exhibited a well-defined monocentric structure radiating from primary hubs in Beijing and Shanghai. Major Tier 1 cities, such as Guangzhou and Shenzhen, were tightly connected to these cores, while cities in central and western China, including Chengdu and Xi’an, occupied peripheral positions characterized by weaker, primarily unidirectional links. From 2015 to 2024, the structure transitioned through several distinct phases. The initial core-periphery pattern began to decentralize around 2018–2020, marked by the emergence of supplementary hubs in cities like Hangzhou and Nanjing, which gradually solidified the “Beijing-Shanghai-Guangzhou-Shenzhen” innovation corridor. By 2024, a clear polycentric mesh had formed, highlighted by the establishment of new cross-regional innovation corridors—such as the Chengdu-Chongqing and Wuhan-Changsha axes—that effectively bridged traditional hierarchical divides. Importantly, previously marginal cities, including Urumqi and Kunming, achieved direct and stable linkages to core hubs, reflecting tangible upward mobility within the network hierarchy over the decade.
Similarly, in 2015, the Technology Innovation Cooperation Network (TIN) was characterized by sparse, peer-to-peer collaborations concentrated among a few dominant city pairs, most notably Beijing-Shenzhen. Many other intercity ties were fragile and intermittent. Its evolution between 2015 and 2024 displayed accelerated restructuring, particularly after 2020. The network gradually shifted from a star-like pattern toward a polycentric cluster model. While Beijing, Shanghai, and Shenzhen retained their central roles, strong regional innovation dyads—such as Shanghai-Suzhou and Shenzhen-Dongguan—emerged as significant complementary hubs by the early 2020s. Notably, new and sustained technology partnerships formed between second-tier cities, exemplified by the Hefei-Wuhan corridor, driven by shared specialization in fields such as optoelectronics and advanced manufacturing. However, this evolution also revealed deepening disparities; while some peripheral city pairs managed to integrate into regional clusters, others, particularly in less developed regions, experienced weakening ties and progressive marginalization. By 2024, the overall collaboration pattern had therefore transitioned from a core-dominated, absorptive model toward a more diversified—yet still uneven—complementary structure [
35] (
Figure 4).
4.2. Network Topology Analysis
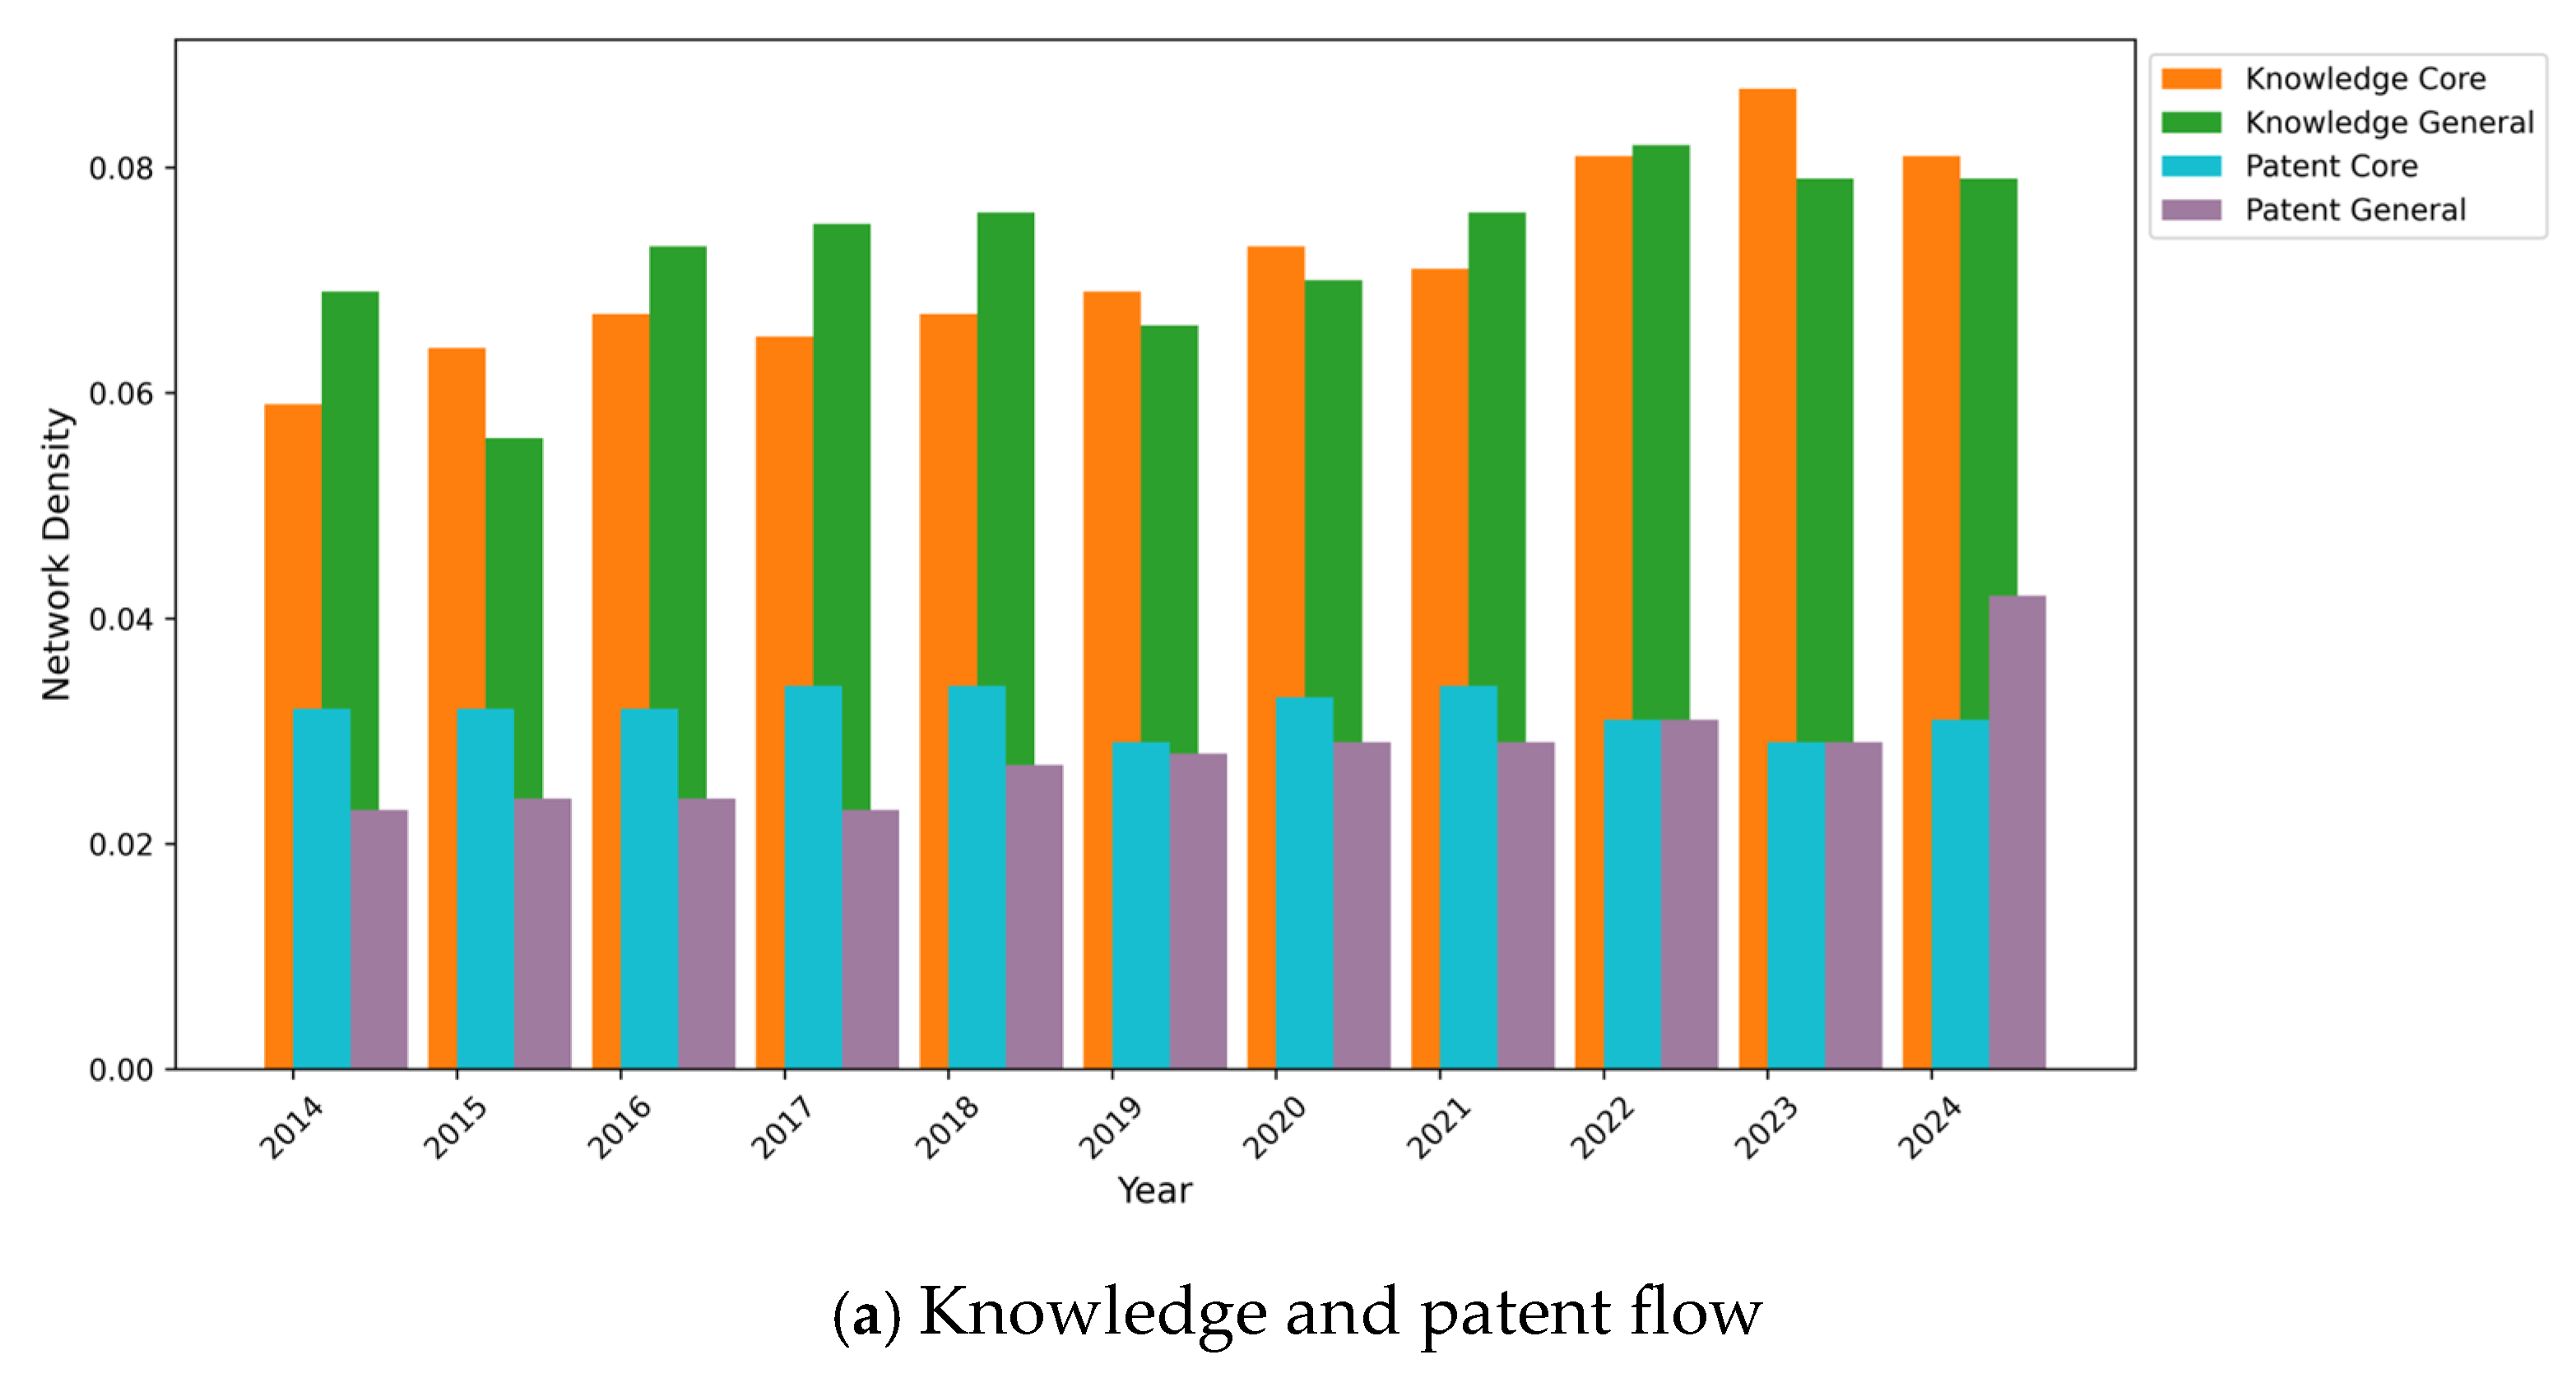
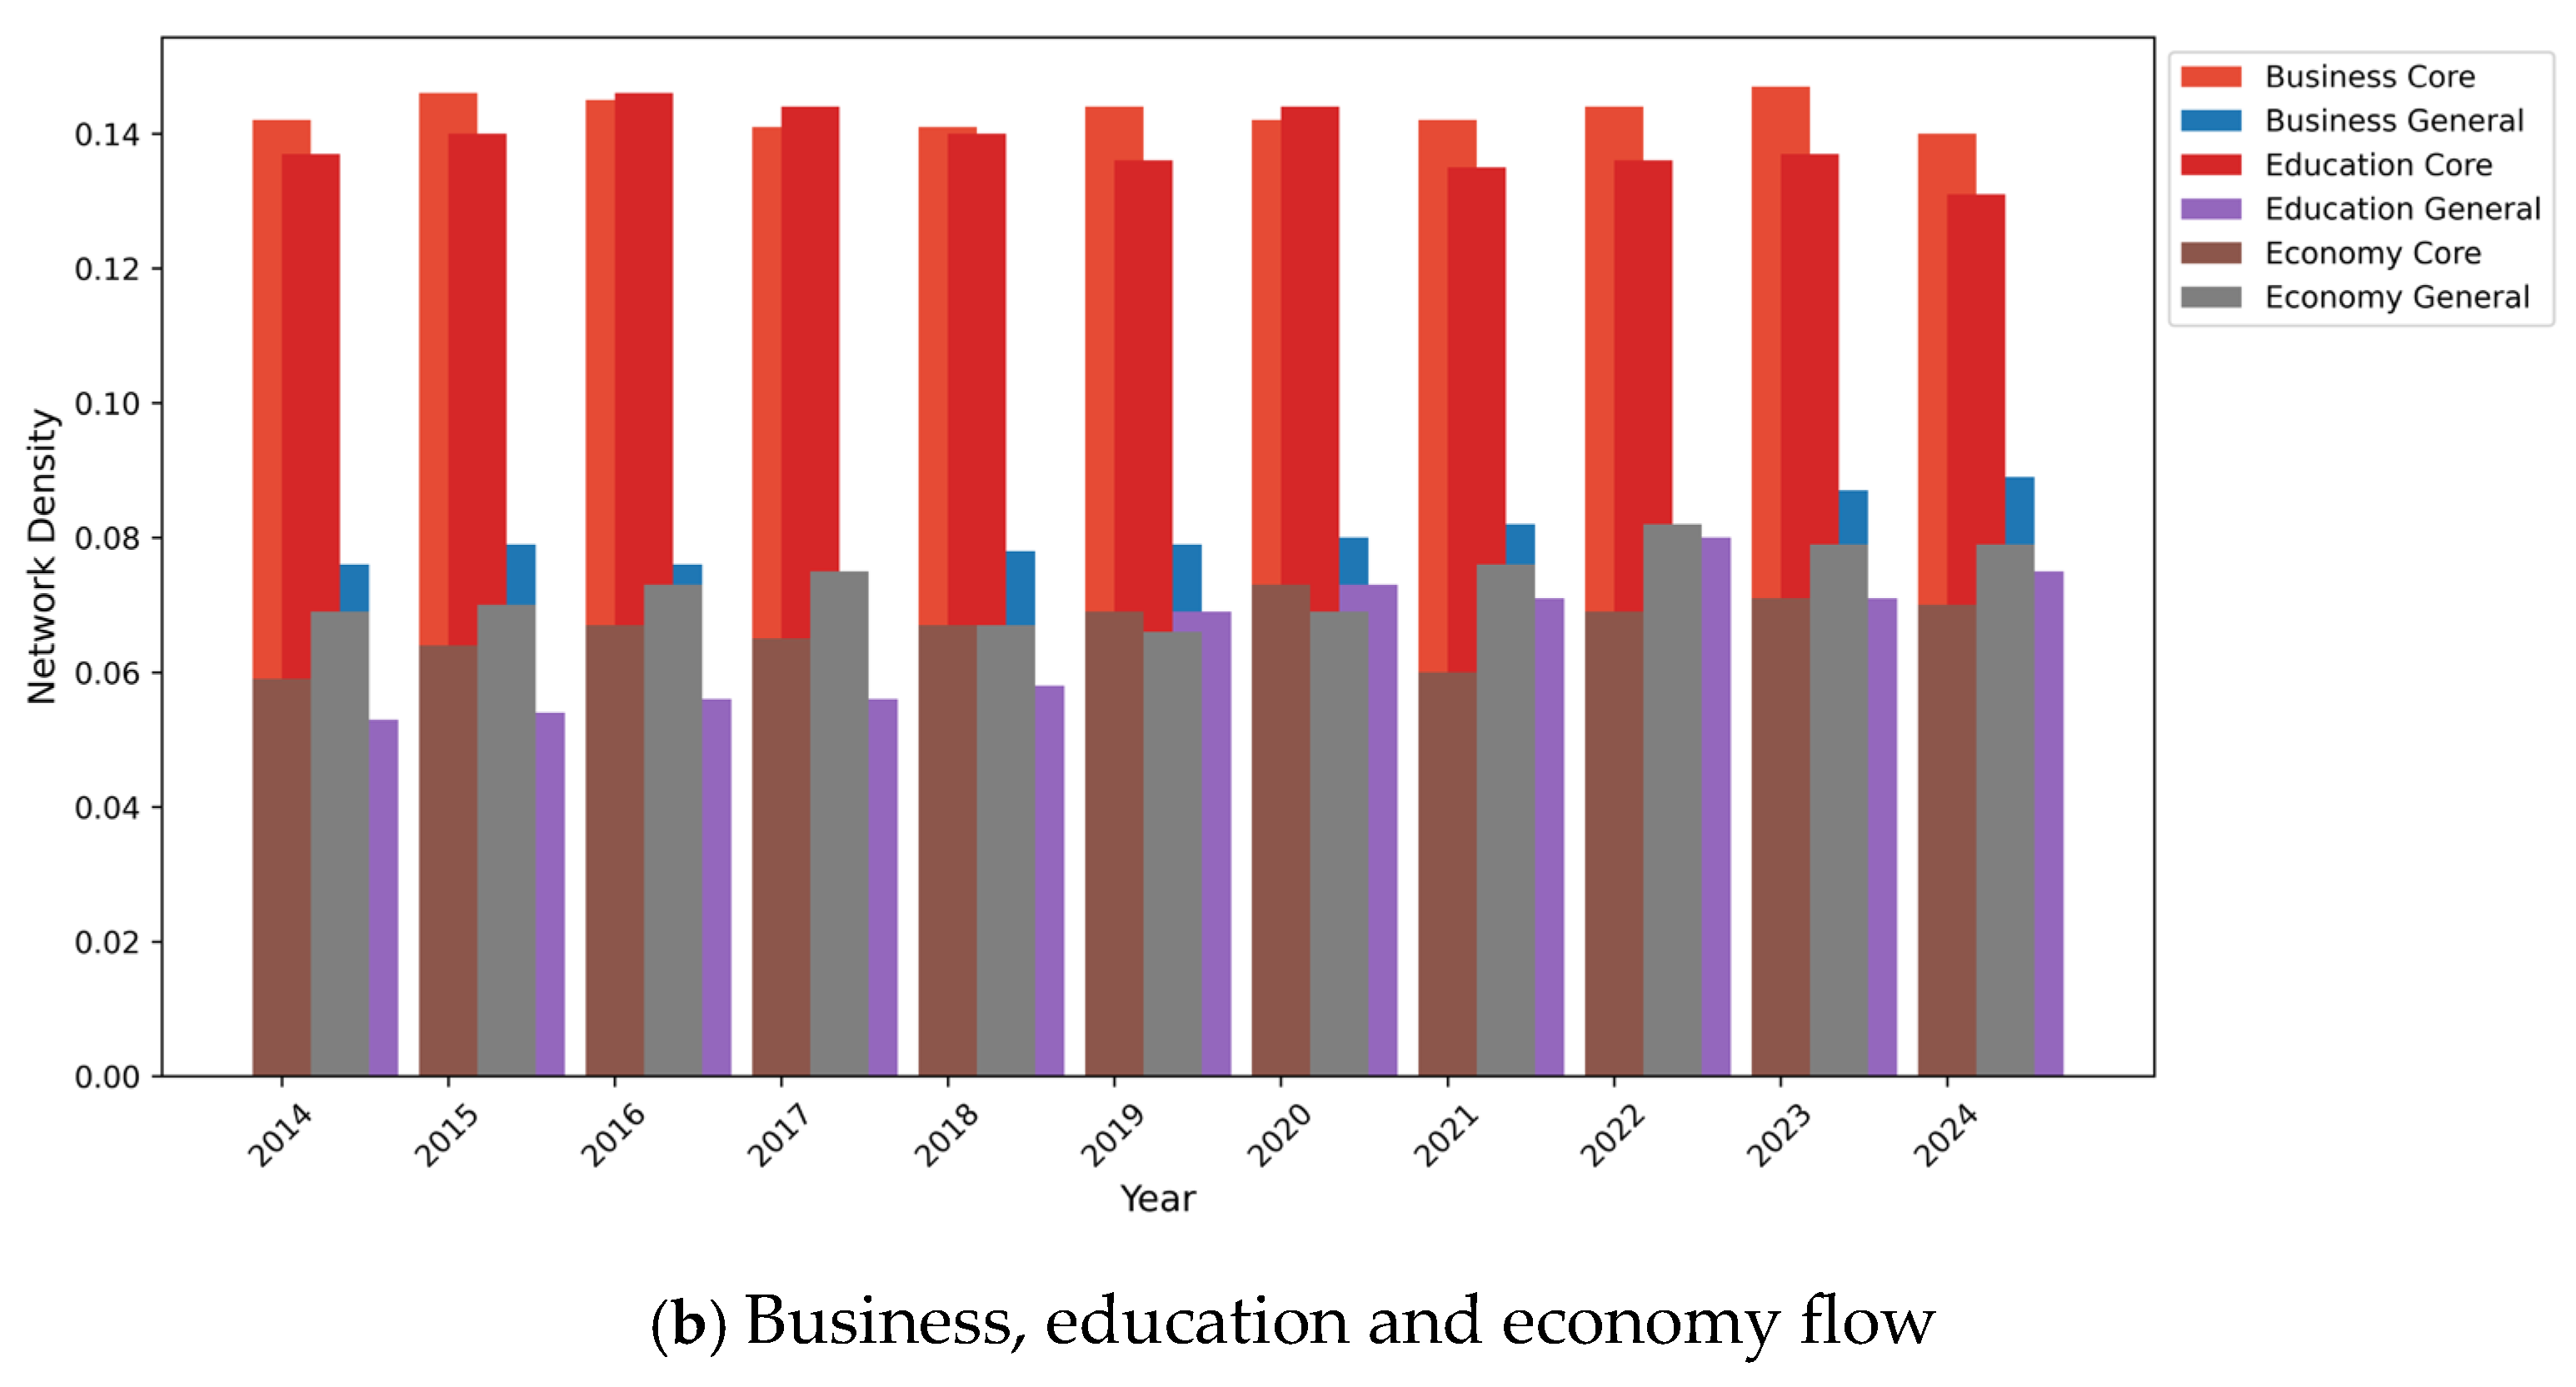
Based on multi-dimensional data from China’s urban KIN, this study examines changes in the network density of different innovation elements, including business flows, knowledge flows, education flows, economy flows and patent flows among cities between 2015 and 2024, which is shown in
Figure 5. Overall, the network density of each type of flow exhibits an upward trend; however, significant differences exist in the diffusion patterns of various innovation factors, reflecting the heterogeneity among cities in terms of foreign capital inflows, knowledge spillovers, education collaboration, economic linkages and patent collaboration.
The core network density of business flows remains stable between 0.140 and 0.147, indicating sustained concentration of multinational investment in core cities, while the general network density shows a slight upward trend, reflecting gradual diffusion to non-core cities. Knowledge flows exhibit steady growth in core density, rising from 0.059 to 0.069, alongside fluctuating general network density, suggesting stronger innovation connectivity among core cities with variable spillover effects. Education flows display notable volatility in core density, peaking in 2016 before declining, while general density remains relatively stable, highlighting persistent reliance on core cities for research collaboration. Economic flows demonstrate the most significant core density increase, surging from 0.059 to 0.081, yet general density stagnates, revealing intensified economic linkages among core cities without proportional peripheral expansion. Patent flows maintain consistently low densities in both core and general networks, indicating limited cross-regional innovation diffusion. Overall, China’s urban innovation network remains strongly core-centric in economic and educational flows, with moderate knowledge spillovers and constrained patent circulation, underscoring the need for balanced resource allocation to enhance regional synergy [
36,
37].
4.3. Temporal Evolution of KIN Structural Resilience
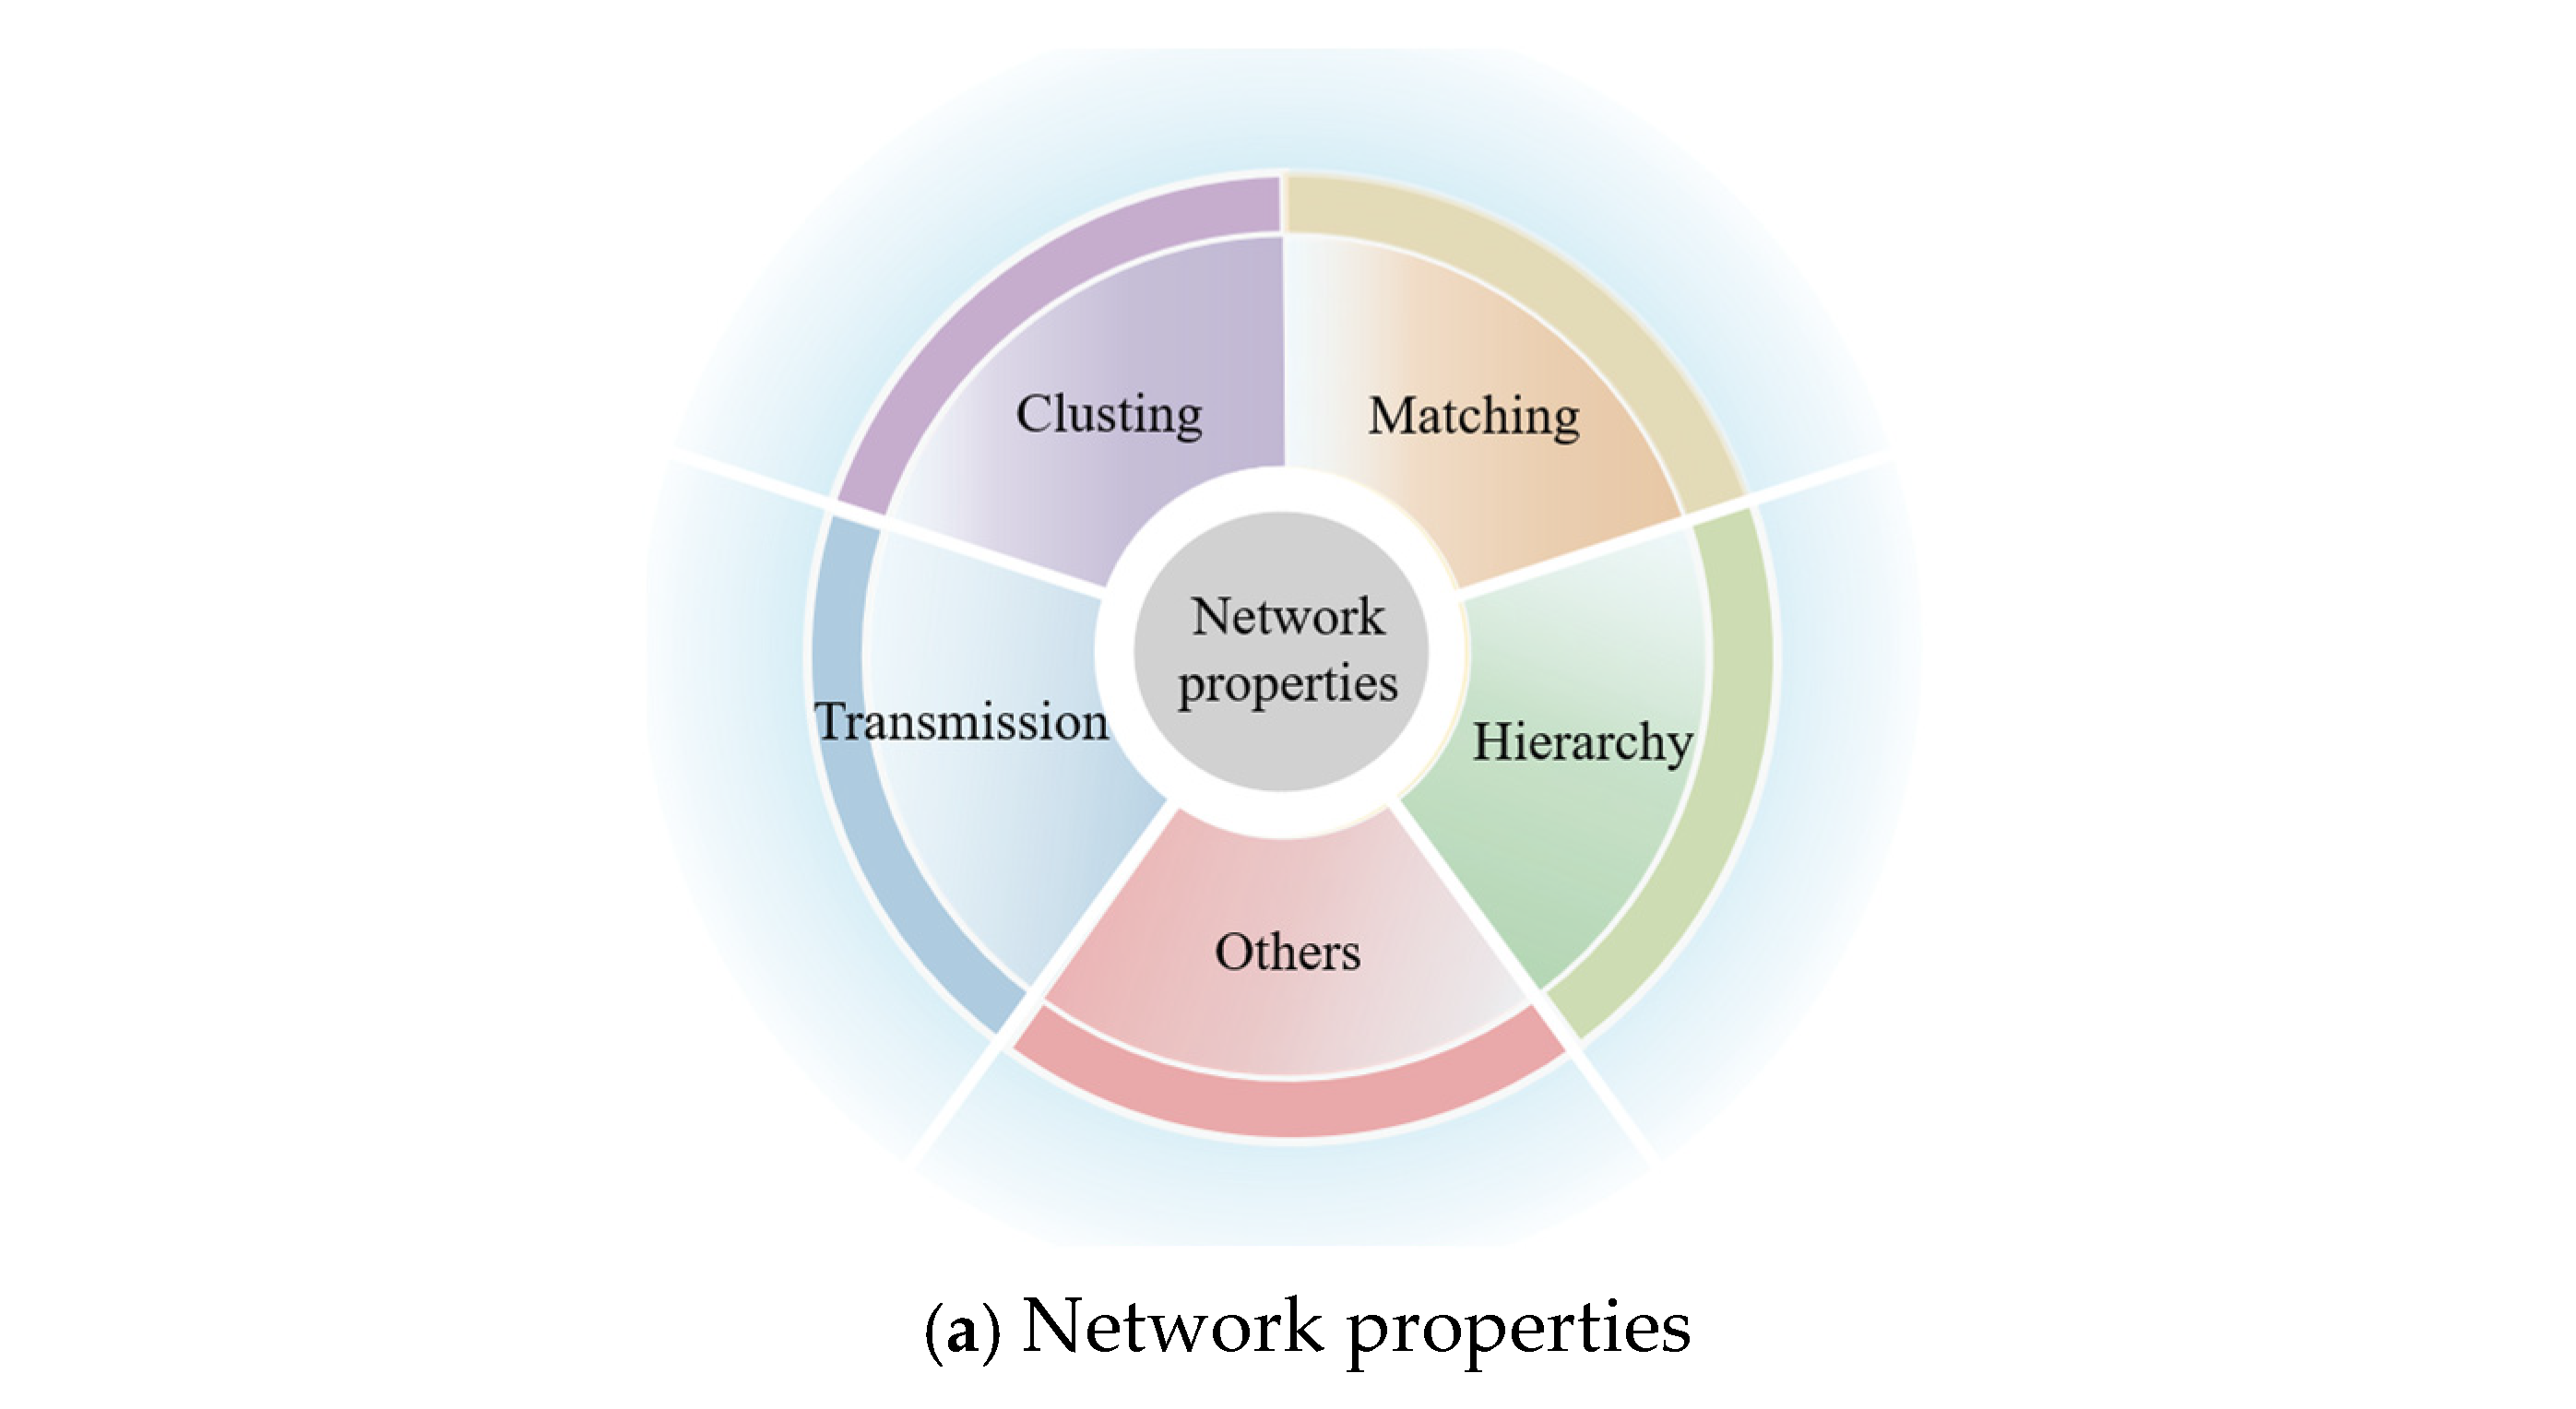
This study employs a suite of network metrics—including clustering coefficient, average path length, and global efficiency—to quantify the structural evolution of innovation networks. The rationale for selecting these metrics stems from their ability to capture distinct aspects of network functionality: clustering coefficient reflects local collaboration density, path length indicates knowledge transmission efficiency, and global efficiency measures overall network integration. Against the backdrop of China’s rapidly evolving innovation policies, these metrics help uncover how hierarchical structures adapt to resource redistribution. Their robustness in capturing both connectivity patterns and hierarchical disparities makes them particularly suitable for comparing knowledge-driven (KIN) and technology-driven (TIN) networks.
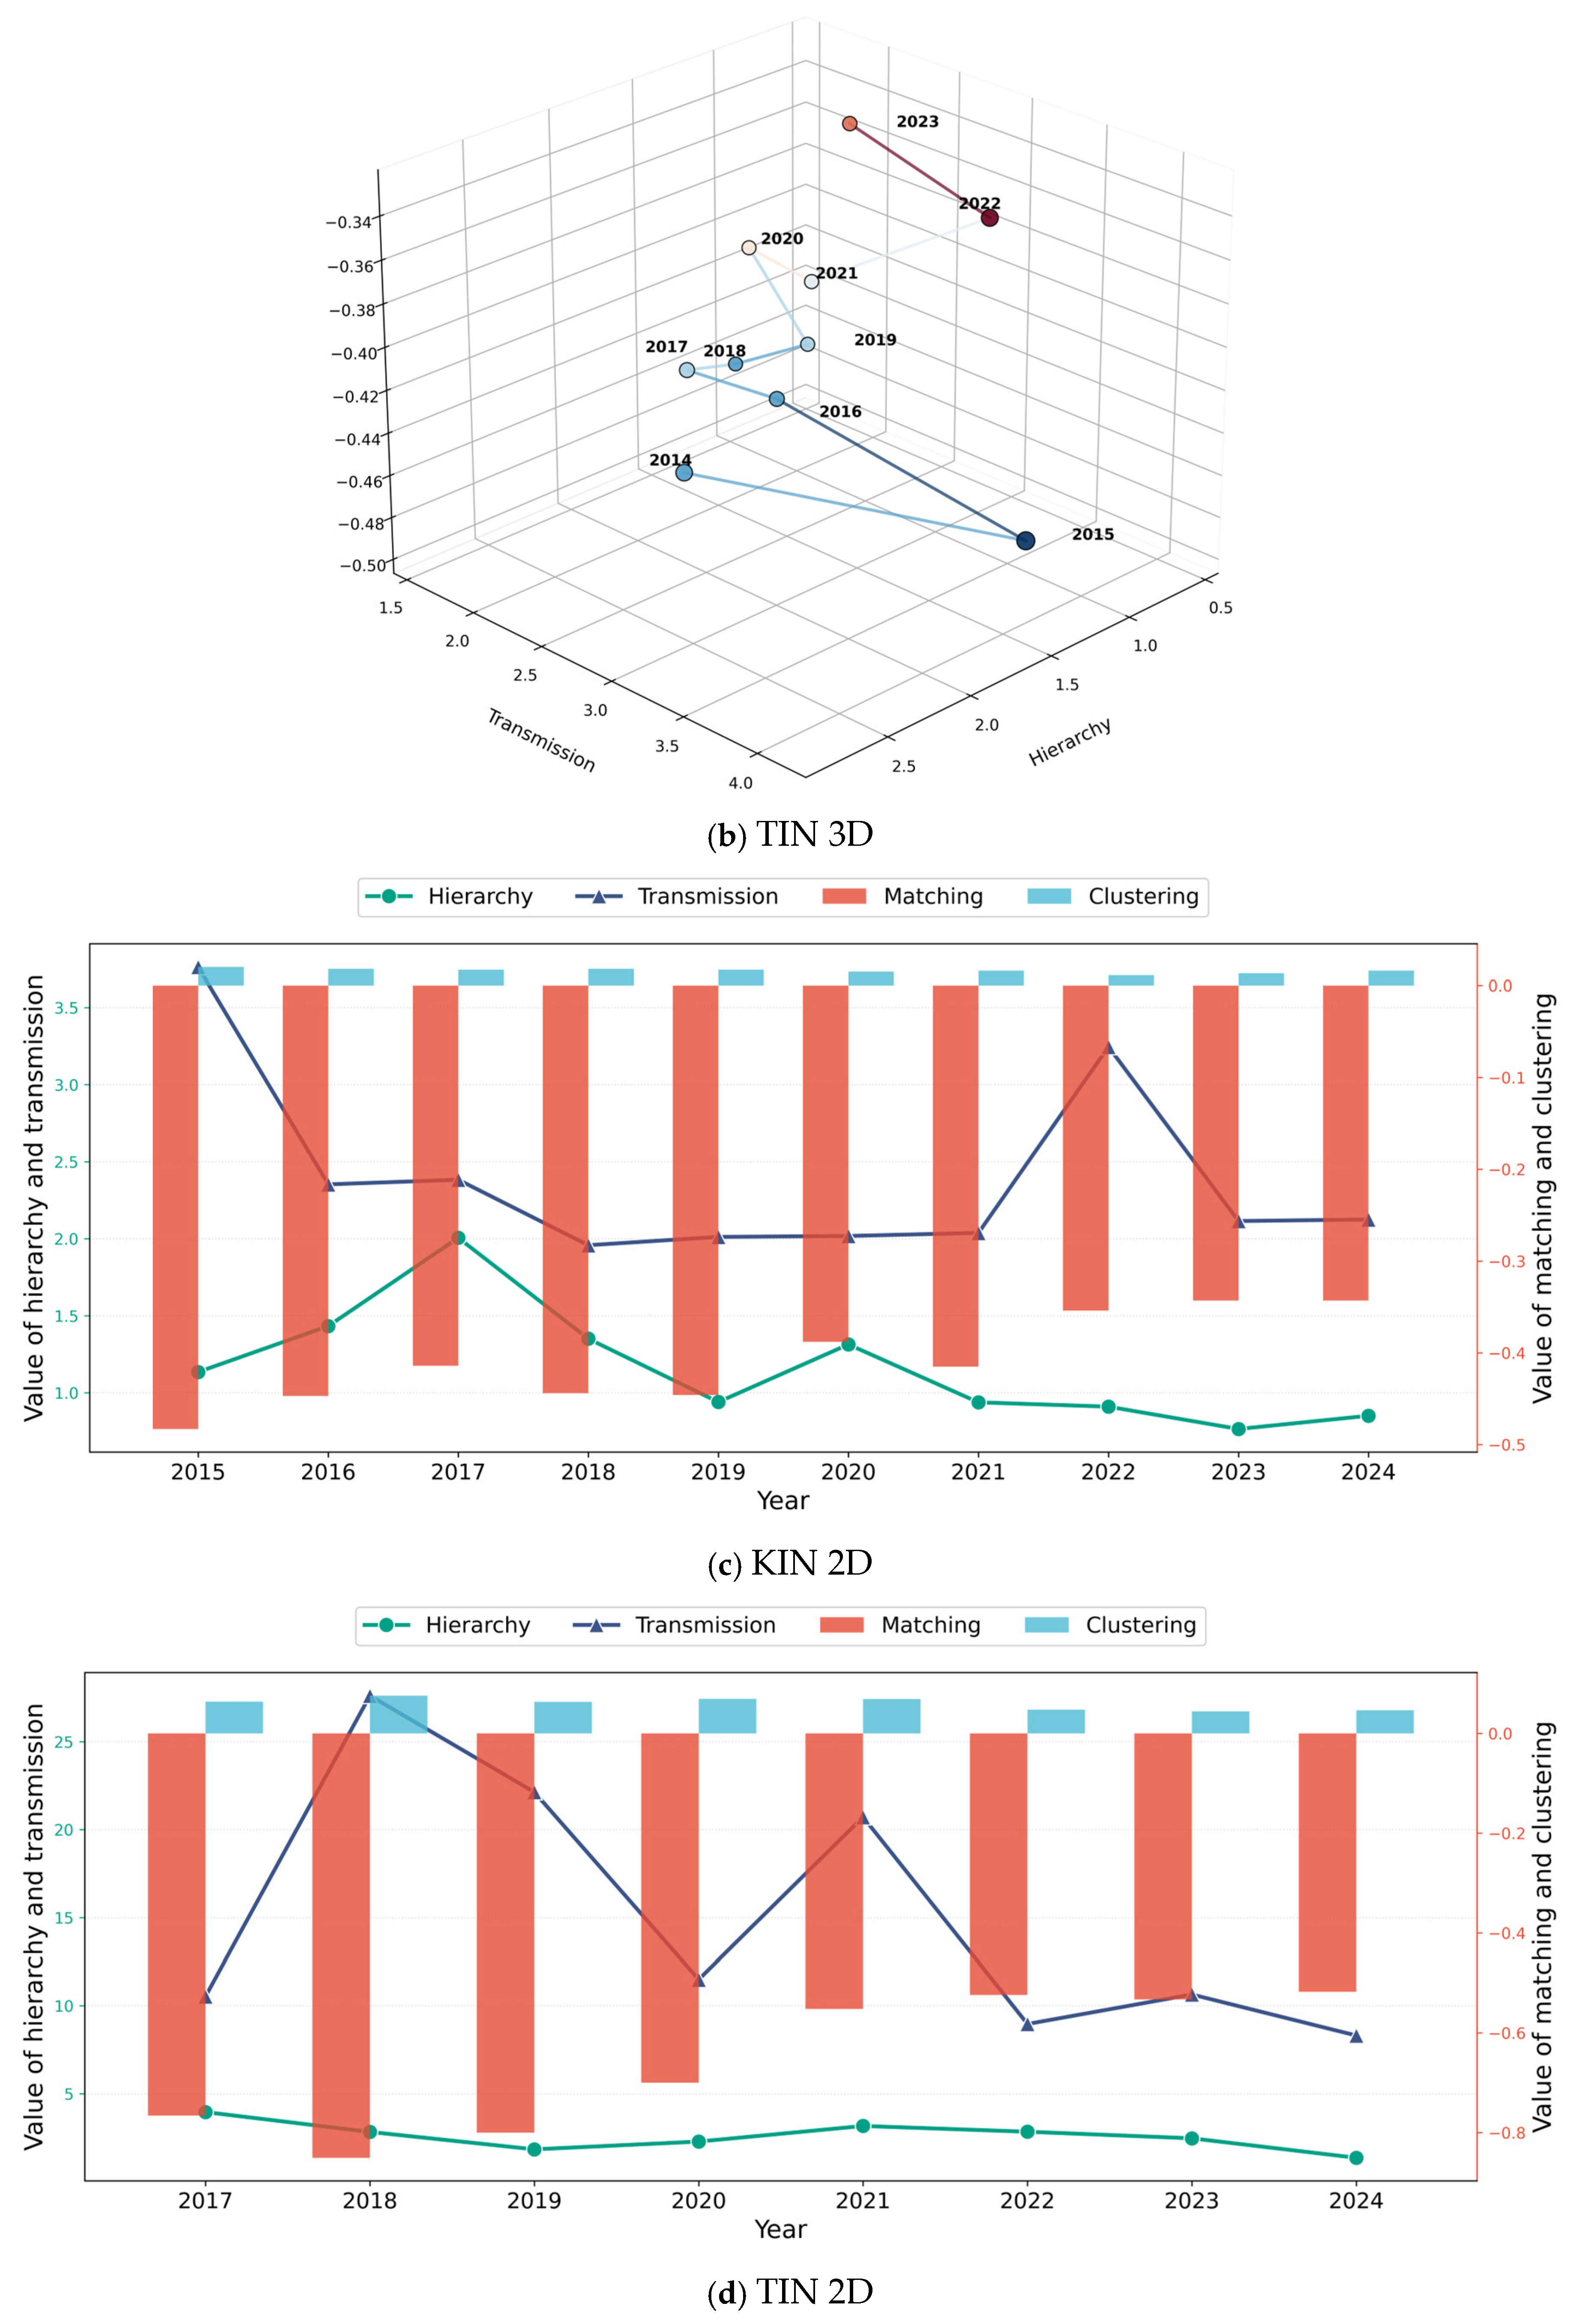
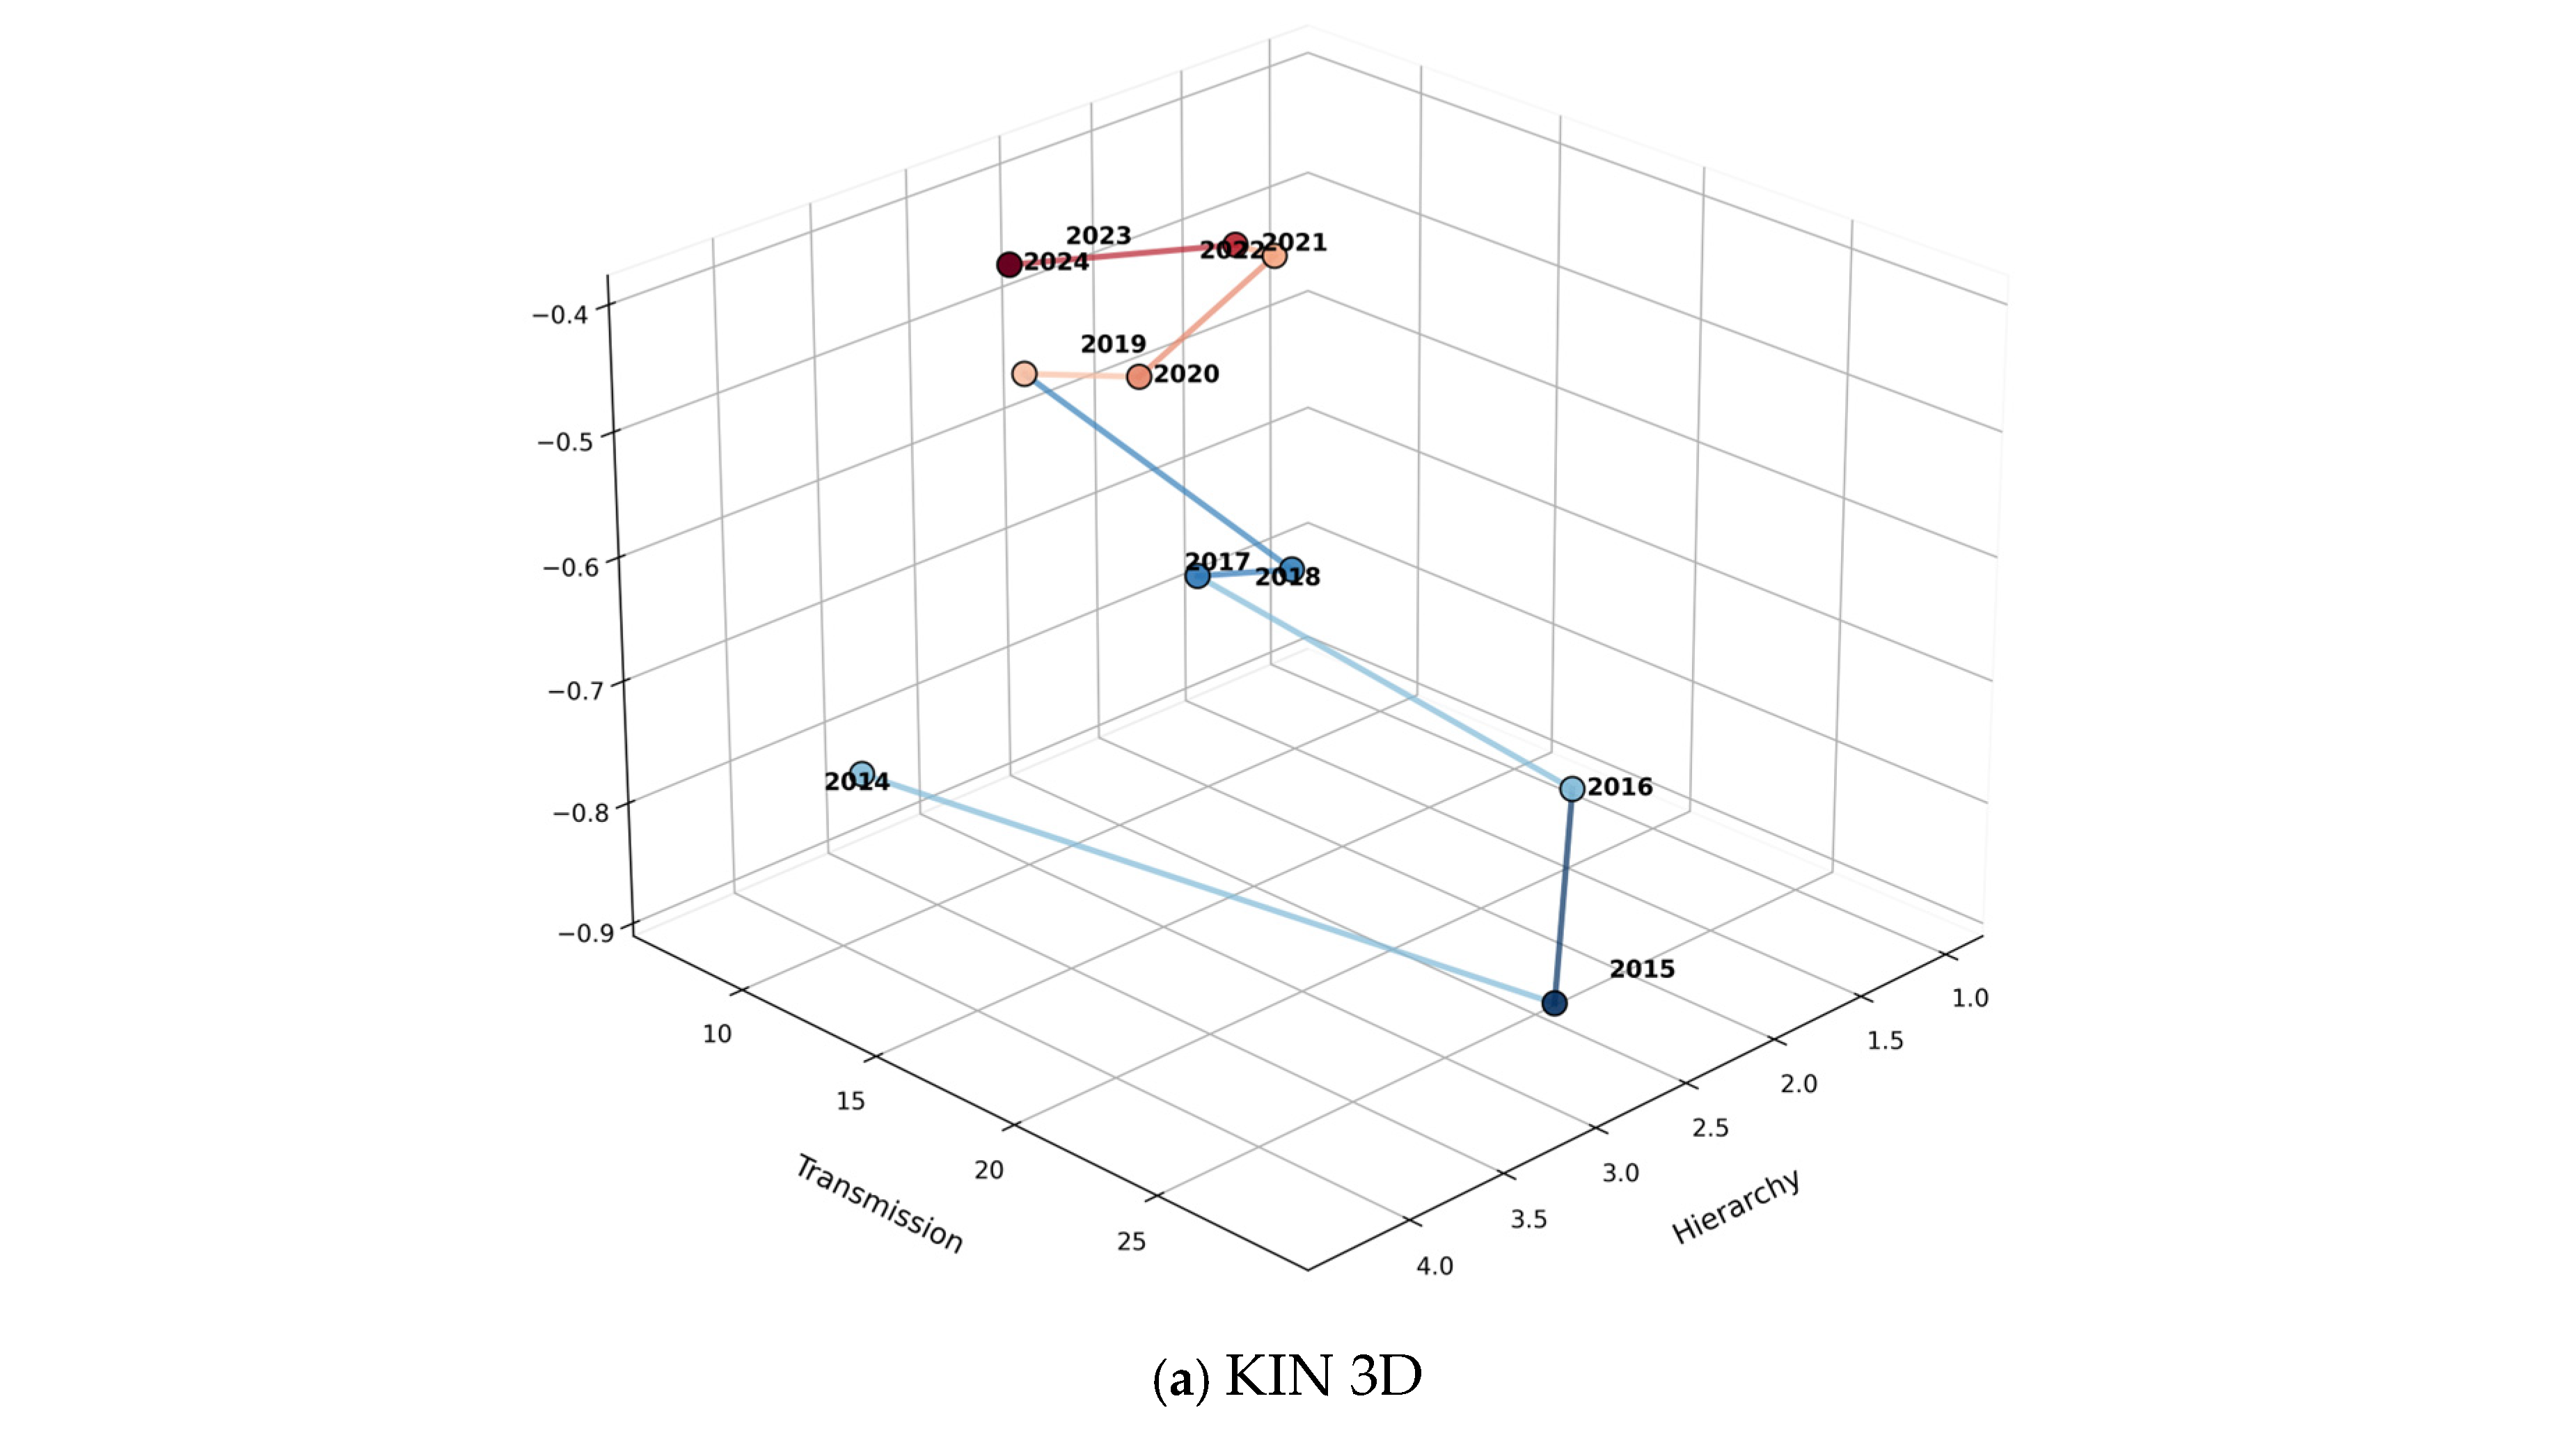
Figure 6 below illustrate the evolutionary characteristics of the network structure metrics. Both hierarchy and matching show the slope term. The primary coordinates of
Figure 5 are line graphs, and the secondary coordinates are bar graphs.
The KIN demonstrated a gradual decline in hierarchical control and knowledge transmission efficiency, reflecting the weakening dominance of core nodes and reduced cross-city knowledge flow. Its matching and clustering characteristics remained remarkably stable, suggesting persistent patterns in inter-city innovation cooperation without significant changes in localized clustering effects. This overall stability indicates KIN’s tendency toward structural flattening with limited dynamic changes.
In contrast, TIN displayed much more volatile structural transformations. Its hierarchical structure experienced substantial fluctuations with intermittent rebounds, while transmission efficiency showed extreme variations, likely indicating periodic reorganizations of hub cities and sudden shifts in technology transfers [
38]. Although matching and clustering maintained relative stability, their fluctuations exceeded those observed in the KIN, revealing improved technological alignment alongside slightly weakened regional concentration. These patterns highlight the TIN’s dynamic adaptability and non-equilibrium characteristics [
39].
Comparative analysis reveals significant differences in the structural evolution of these networks. The KIN exhibited overall stability, with gradual declines in Hierarchy and Transmissibility, reflecting the path-dependent nature and incremental diffusion of knowledge flow. Conversely, the TIN displayed stronger volatility and jump-like development, particularly in Transferability’s dramatic changes, suggesting technological cooperation is more sensitive to policy shifts or major innovation projects. Although both networks maintained stability in Matching and Agglomeration, the TIN showed clearer improving trends, potentially due to patent cooperation’s stronger technological orientation. Overall, the KIN demonstrates higher structural resilience, while the TIN exhibits better dynamic responsiveness. This divergence reflects distinct mechanisms in innovation systems: knowledge flows favor continuous accumulation, whereas technology flows are more susceptible to external shocks [
40].
Figure 6 shows the time-series changes in KIN and TIN metrics.
Figure 6a–d demonstrate clear structural divergence between Knowledge Innovation Networks (KIN) and Technology Innovation Networks (TIN) over 2015–2024. KIN follows a smooth, path-dependent evolutionary trajectory: hierarchy declines steadily from around 2.0 in 2017 to below 1.0 after 2021, transmission efficiency decreases moderately from approximately 3.7 in 2015 to about 2.1 in 2024, while matching remains highly stable near −0.35 and clustering fluctuates only slightly around 0.05. This indicates gradual hierarchical flattening with strong structural inertia and sustained local cohesion. In contrast, TIN exhibits pronounced nonlinear dynamics, with hierarchy fluctuating sharply (peaking near 3.8 in 2017 and falling to around 1.5 by 2024) and transmission efficiency undergoing extreme swings, rising to about 27.5 in 2018 before dropping below 10 after 2022. Matching and clustering in TIN also show noticeably larger interannual volatility. Overall, the figures suggest that KIN is characterized by high structural resilience and incremental evolution driven by institutionalized knowledge accumulation, whereas TIN displays threshold-driven reorganization and greater adaptability but lower structural stability under external shocks.
4.4. Network Destruction Resilience Simulation
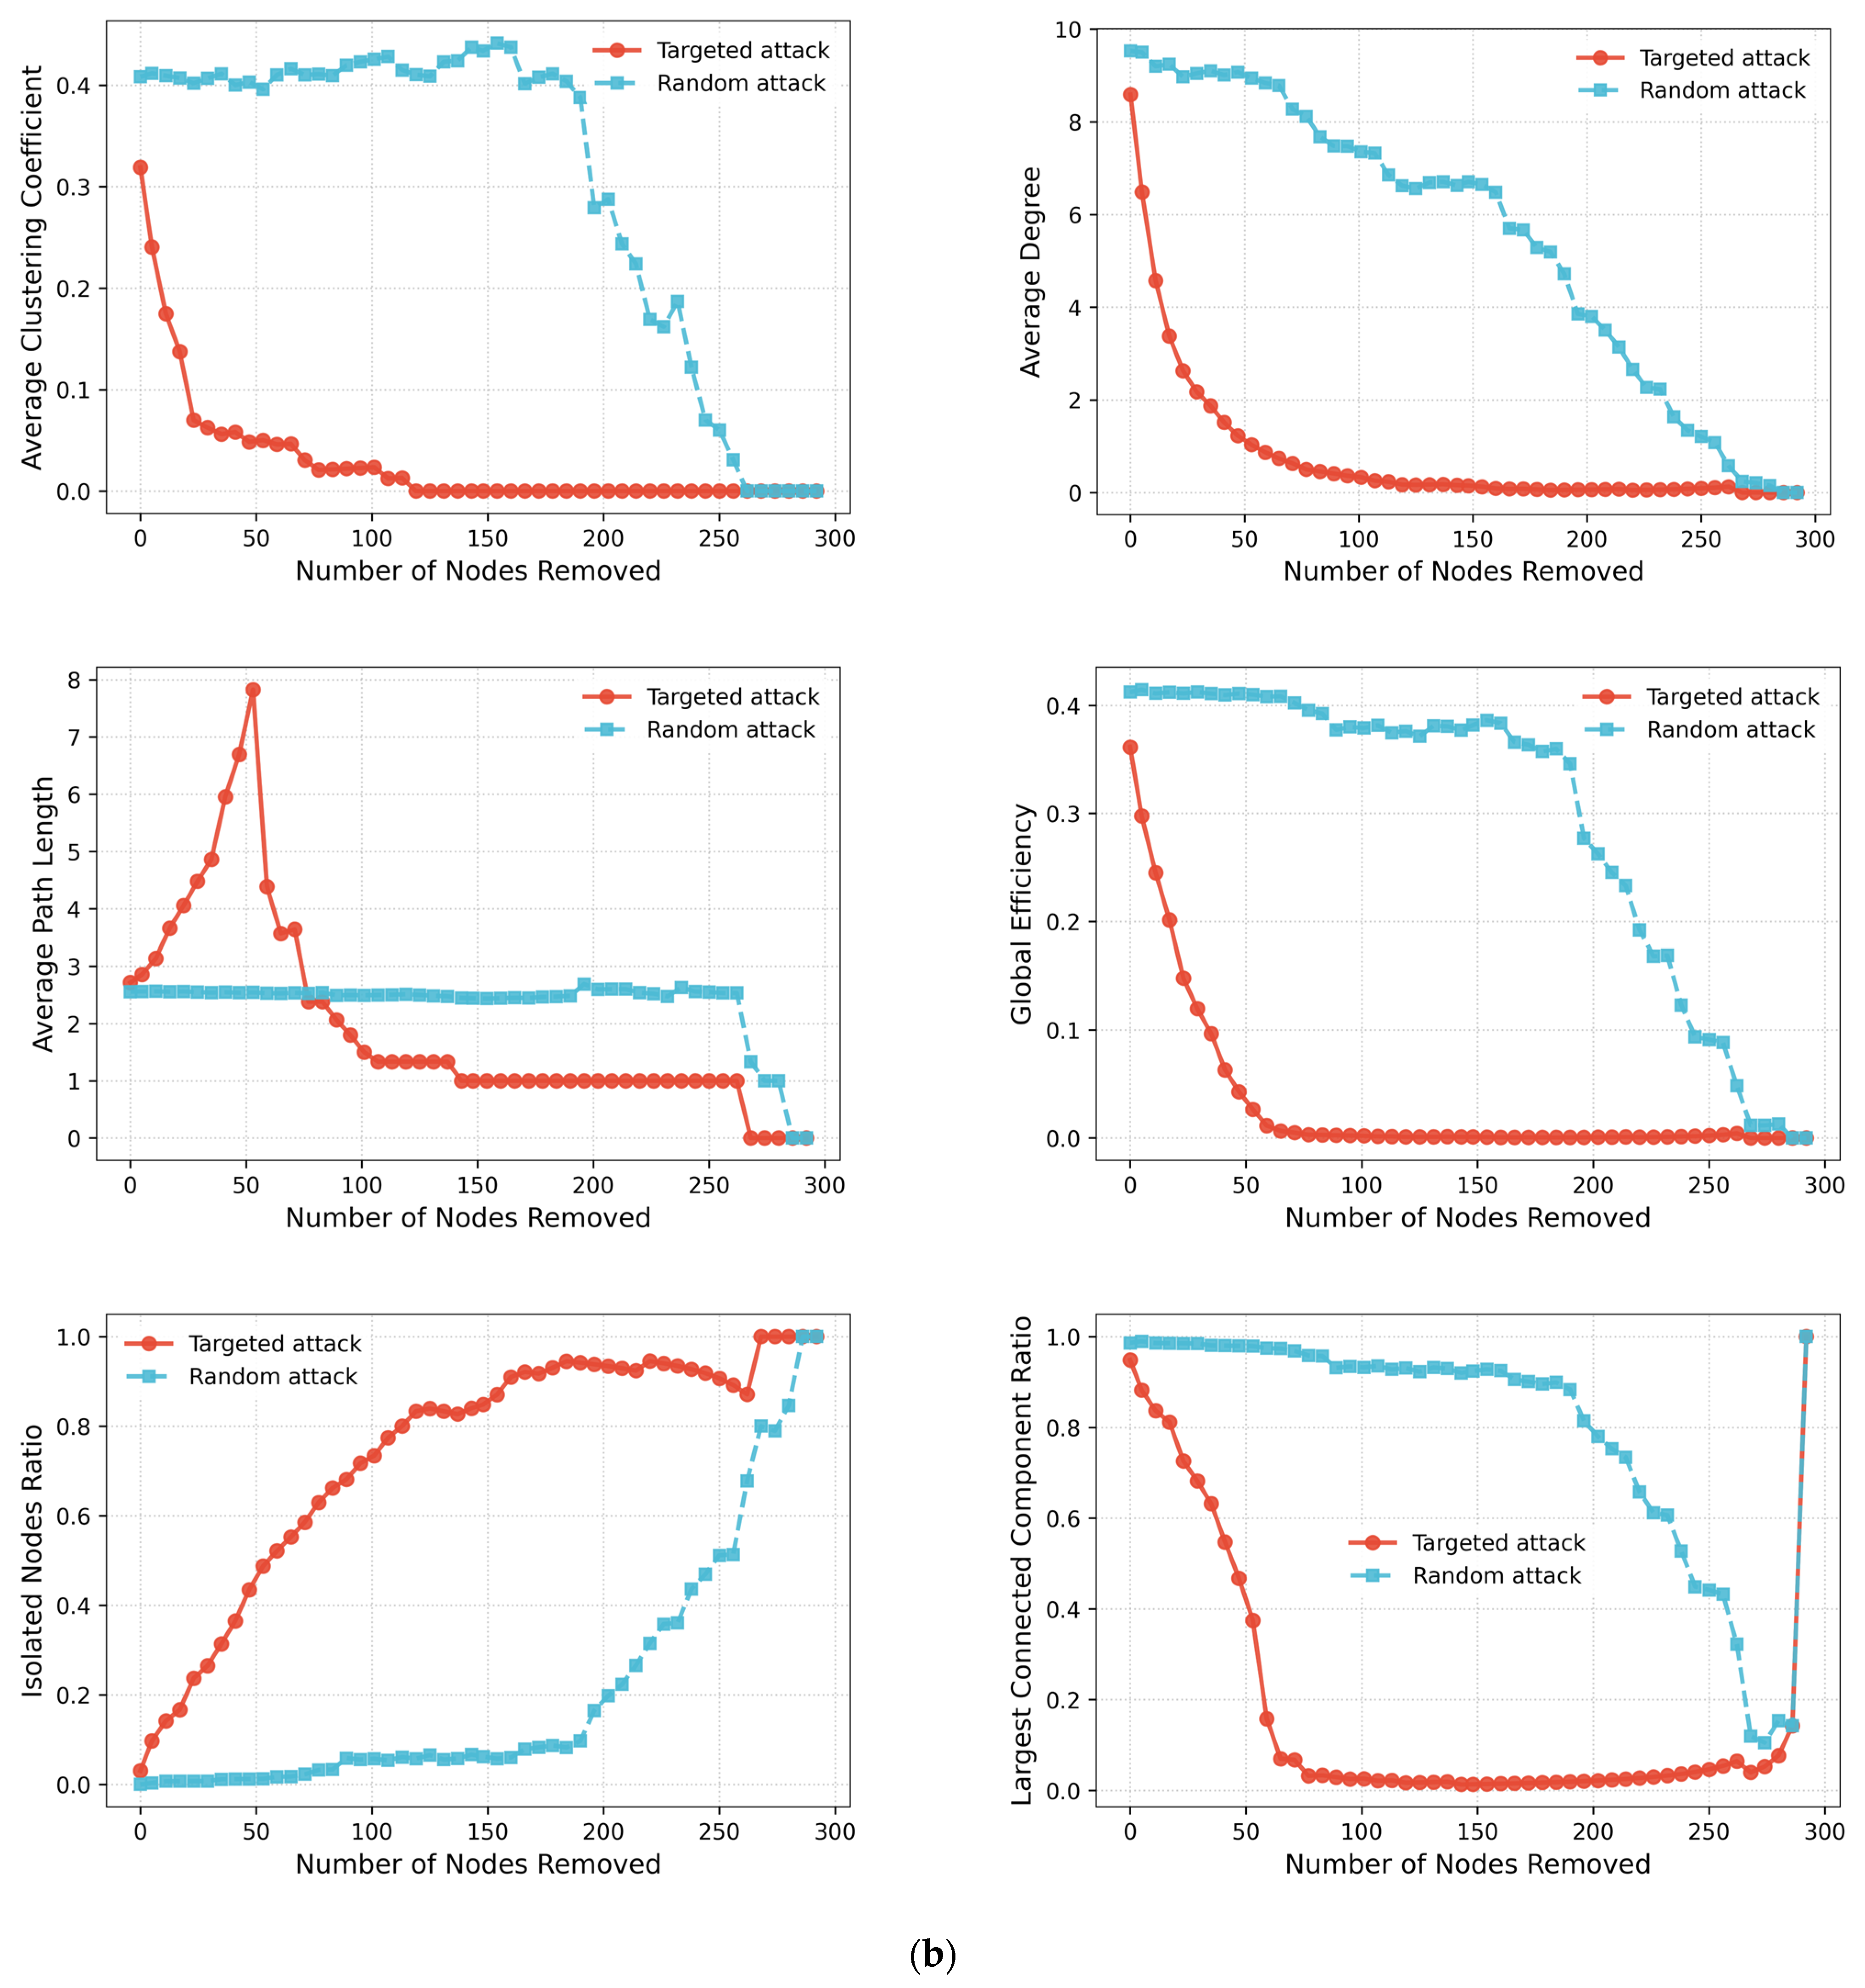
In this study, I conducted the simulation using Python 3 and its NetworkX library. After 30 min of computation, the results were obtained, as summarized in
Figure 6 and
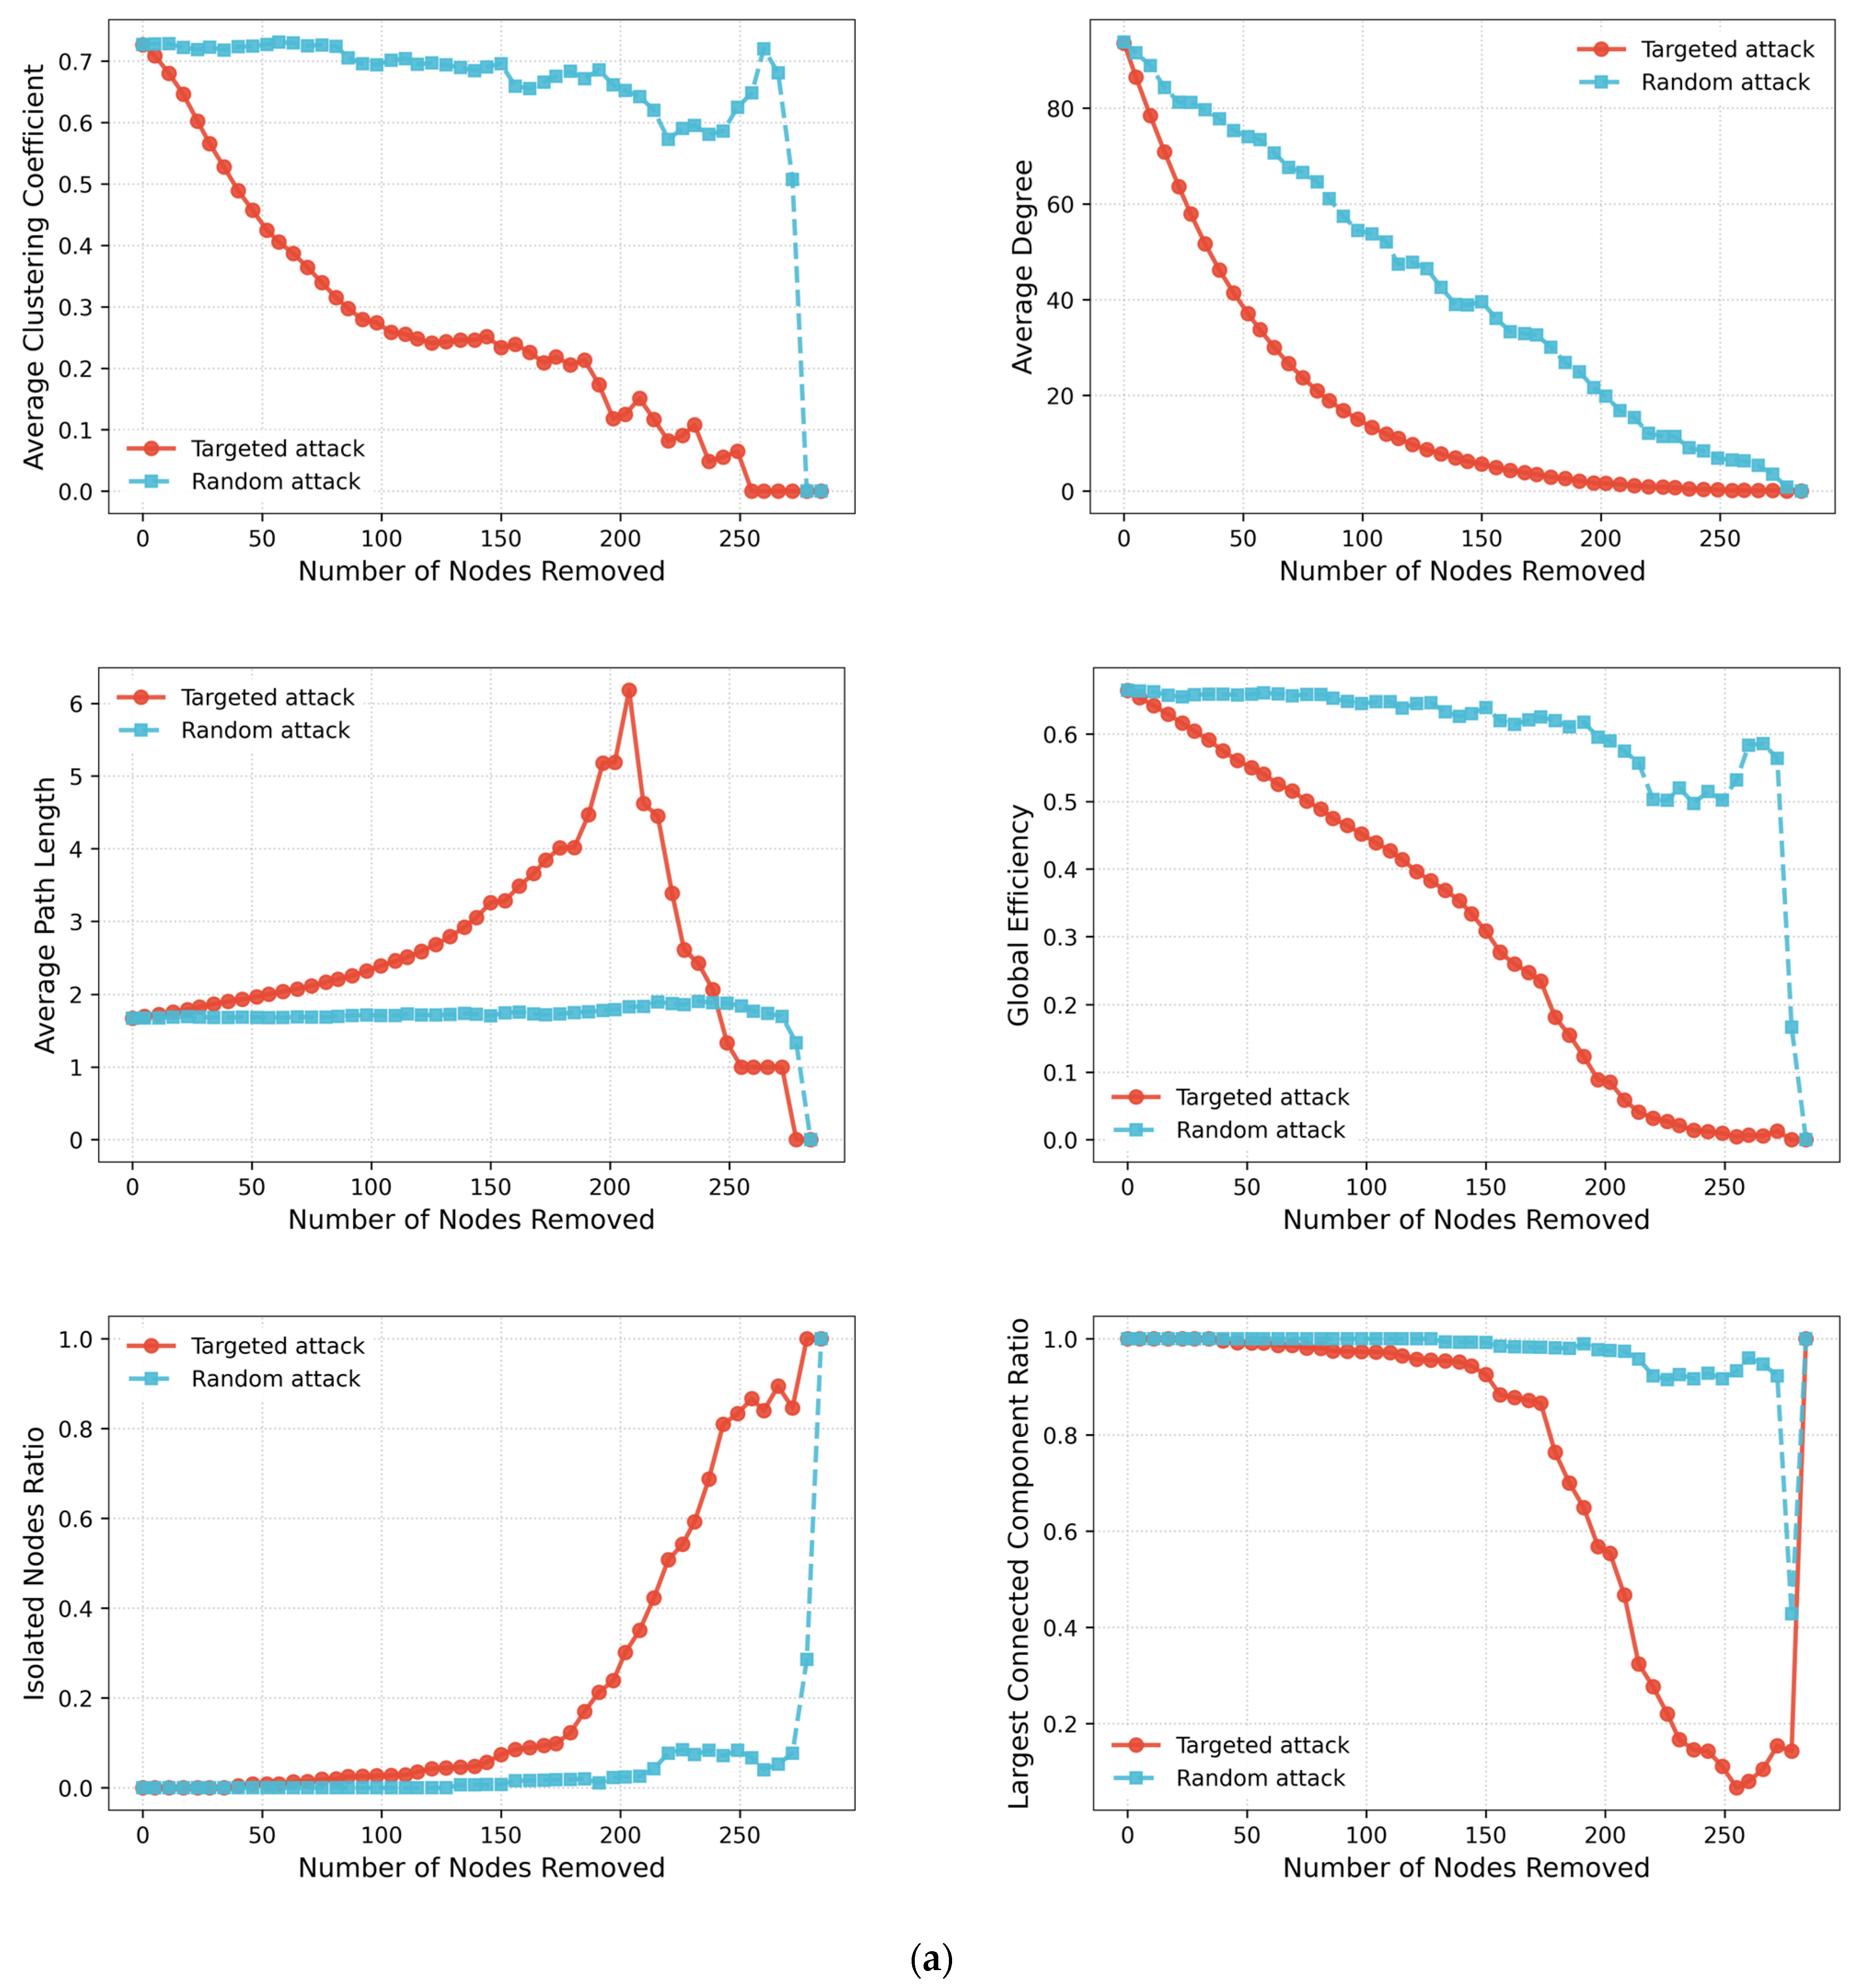
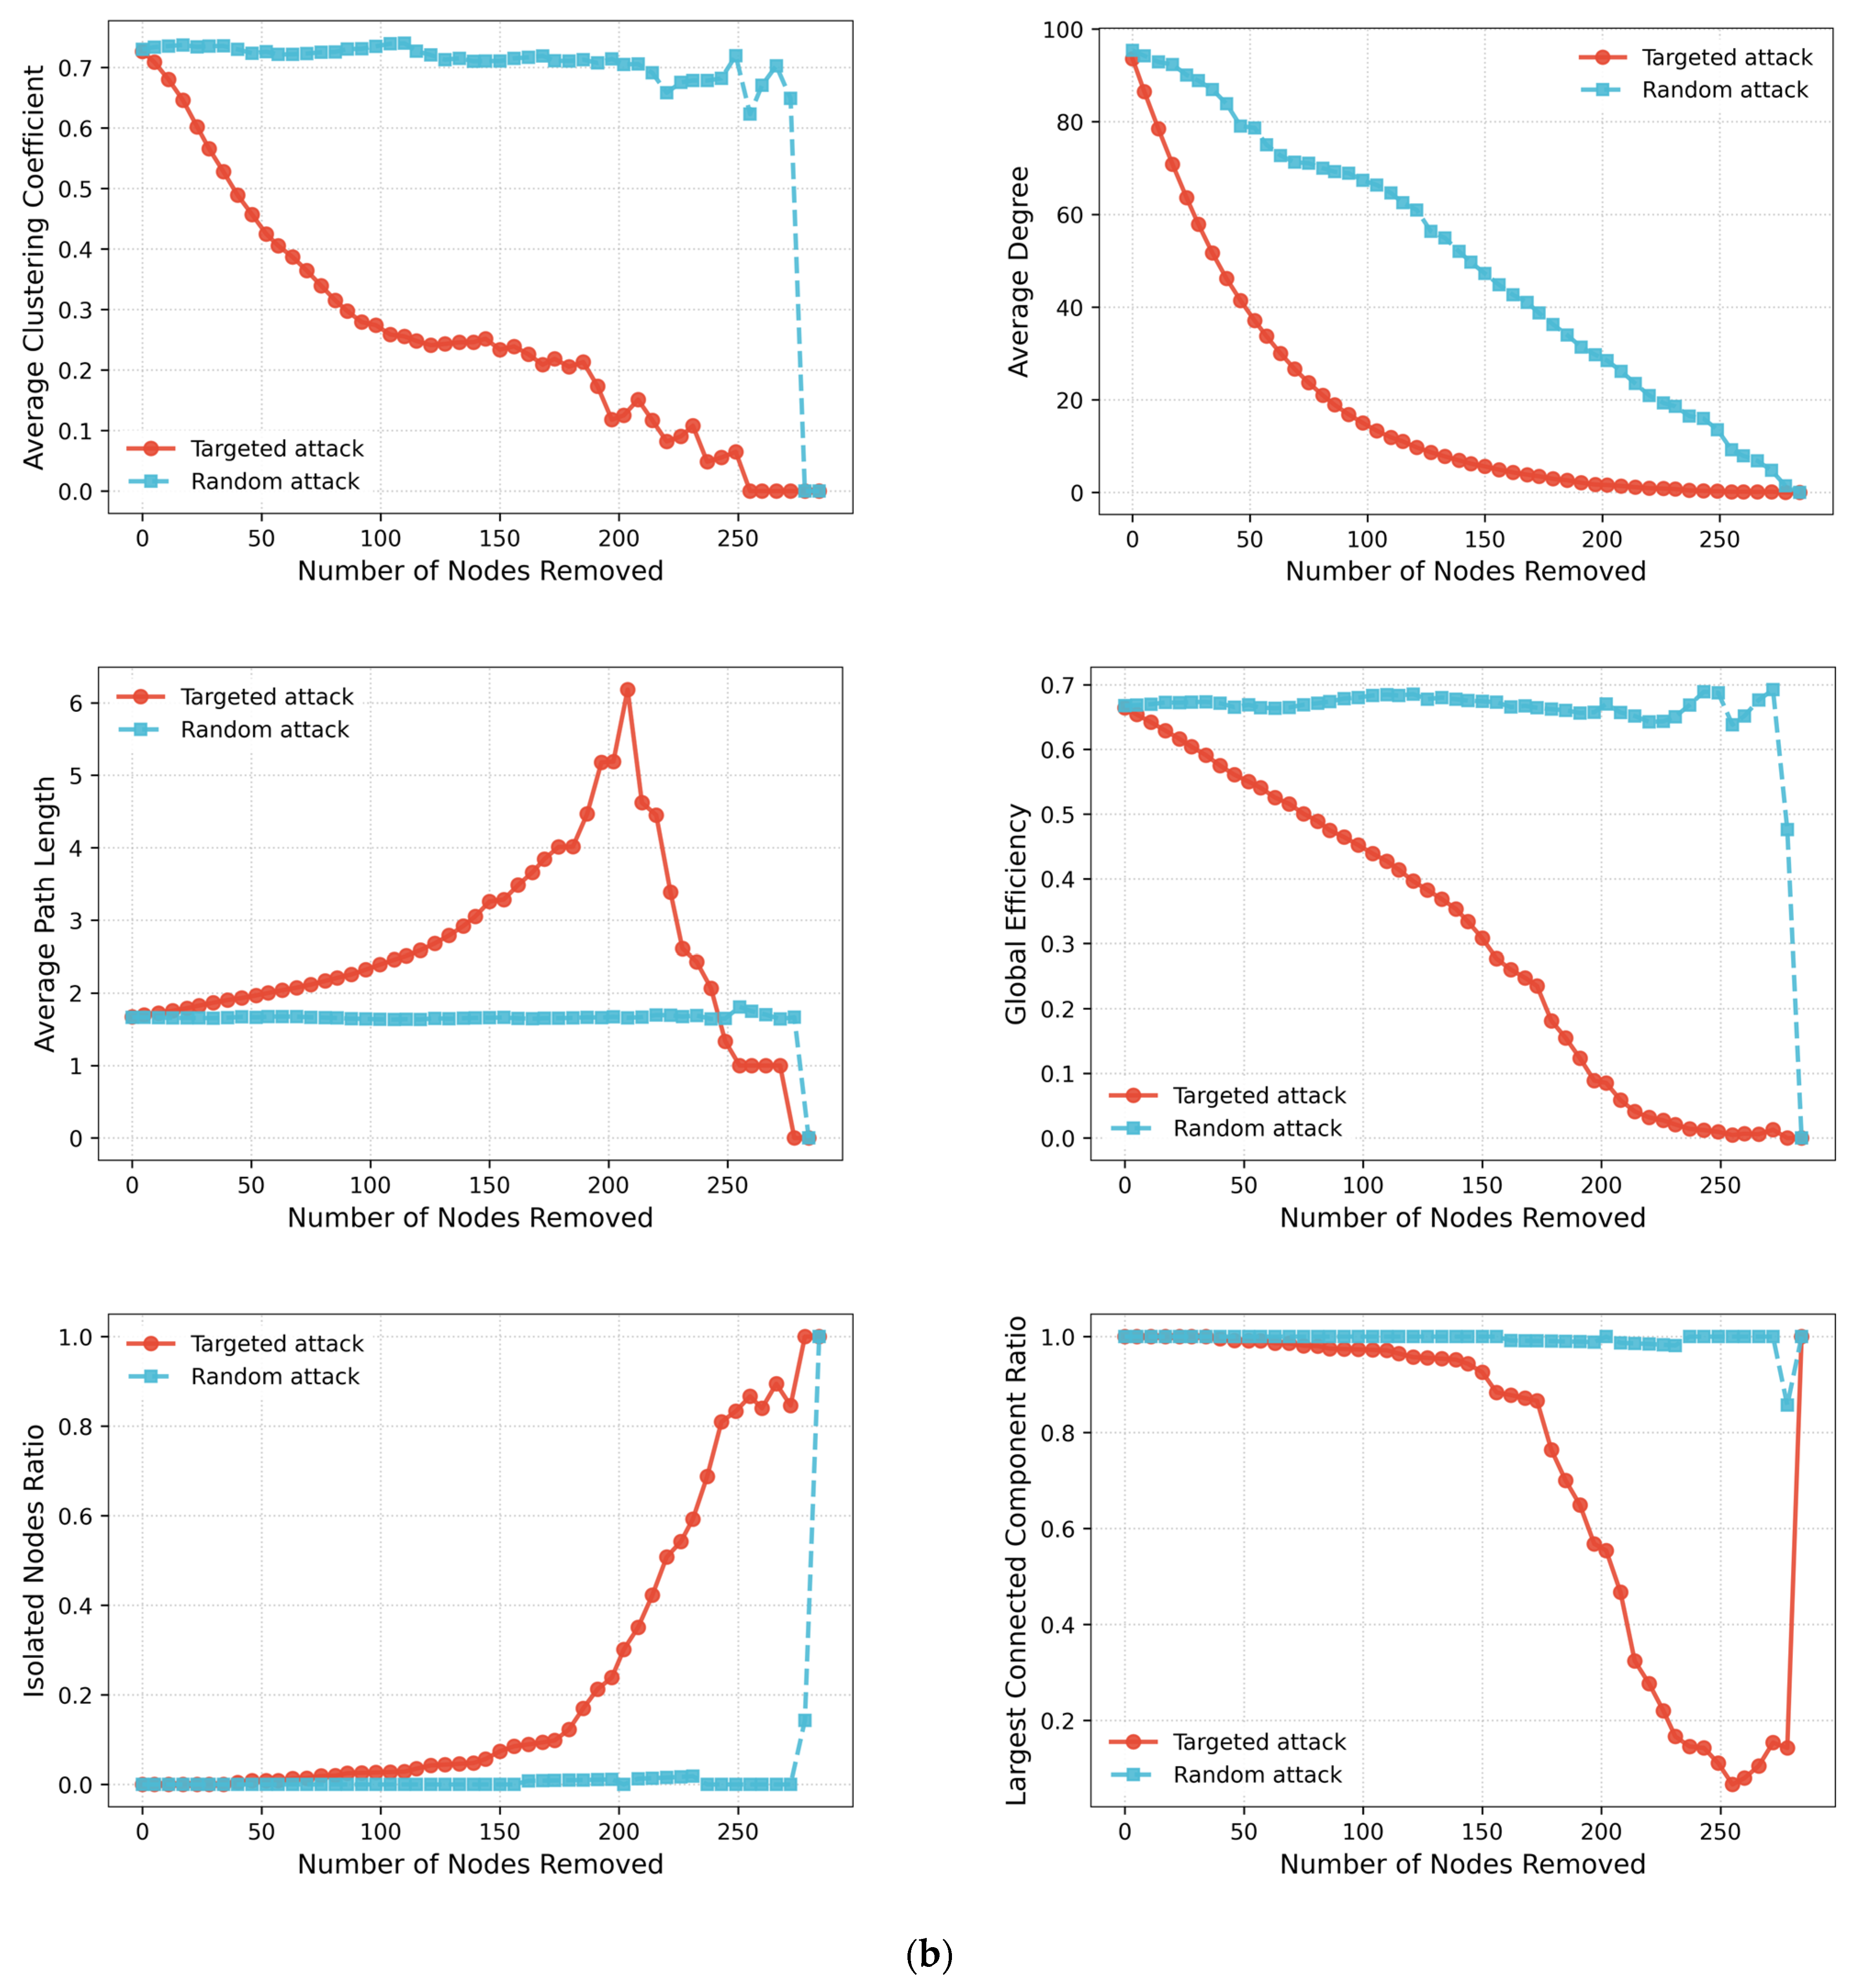
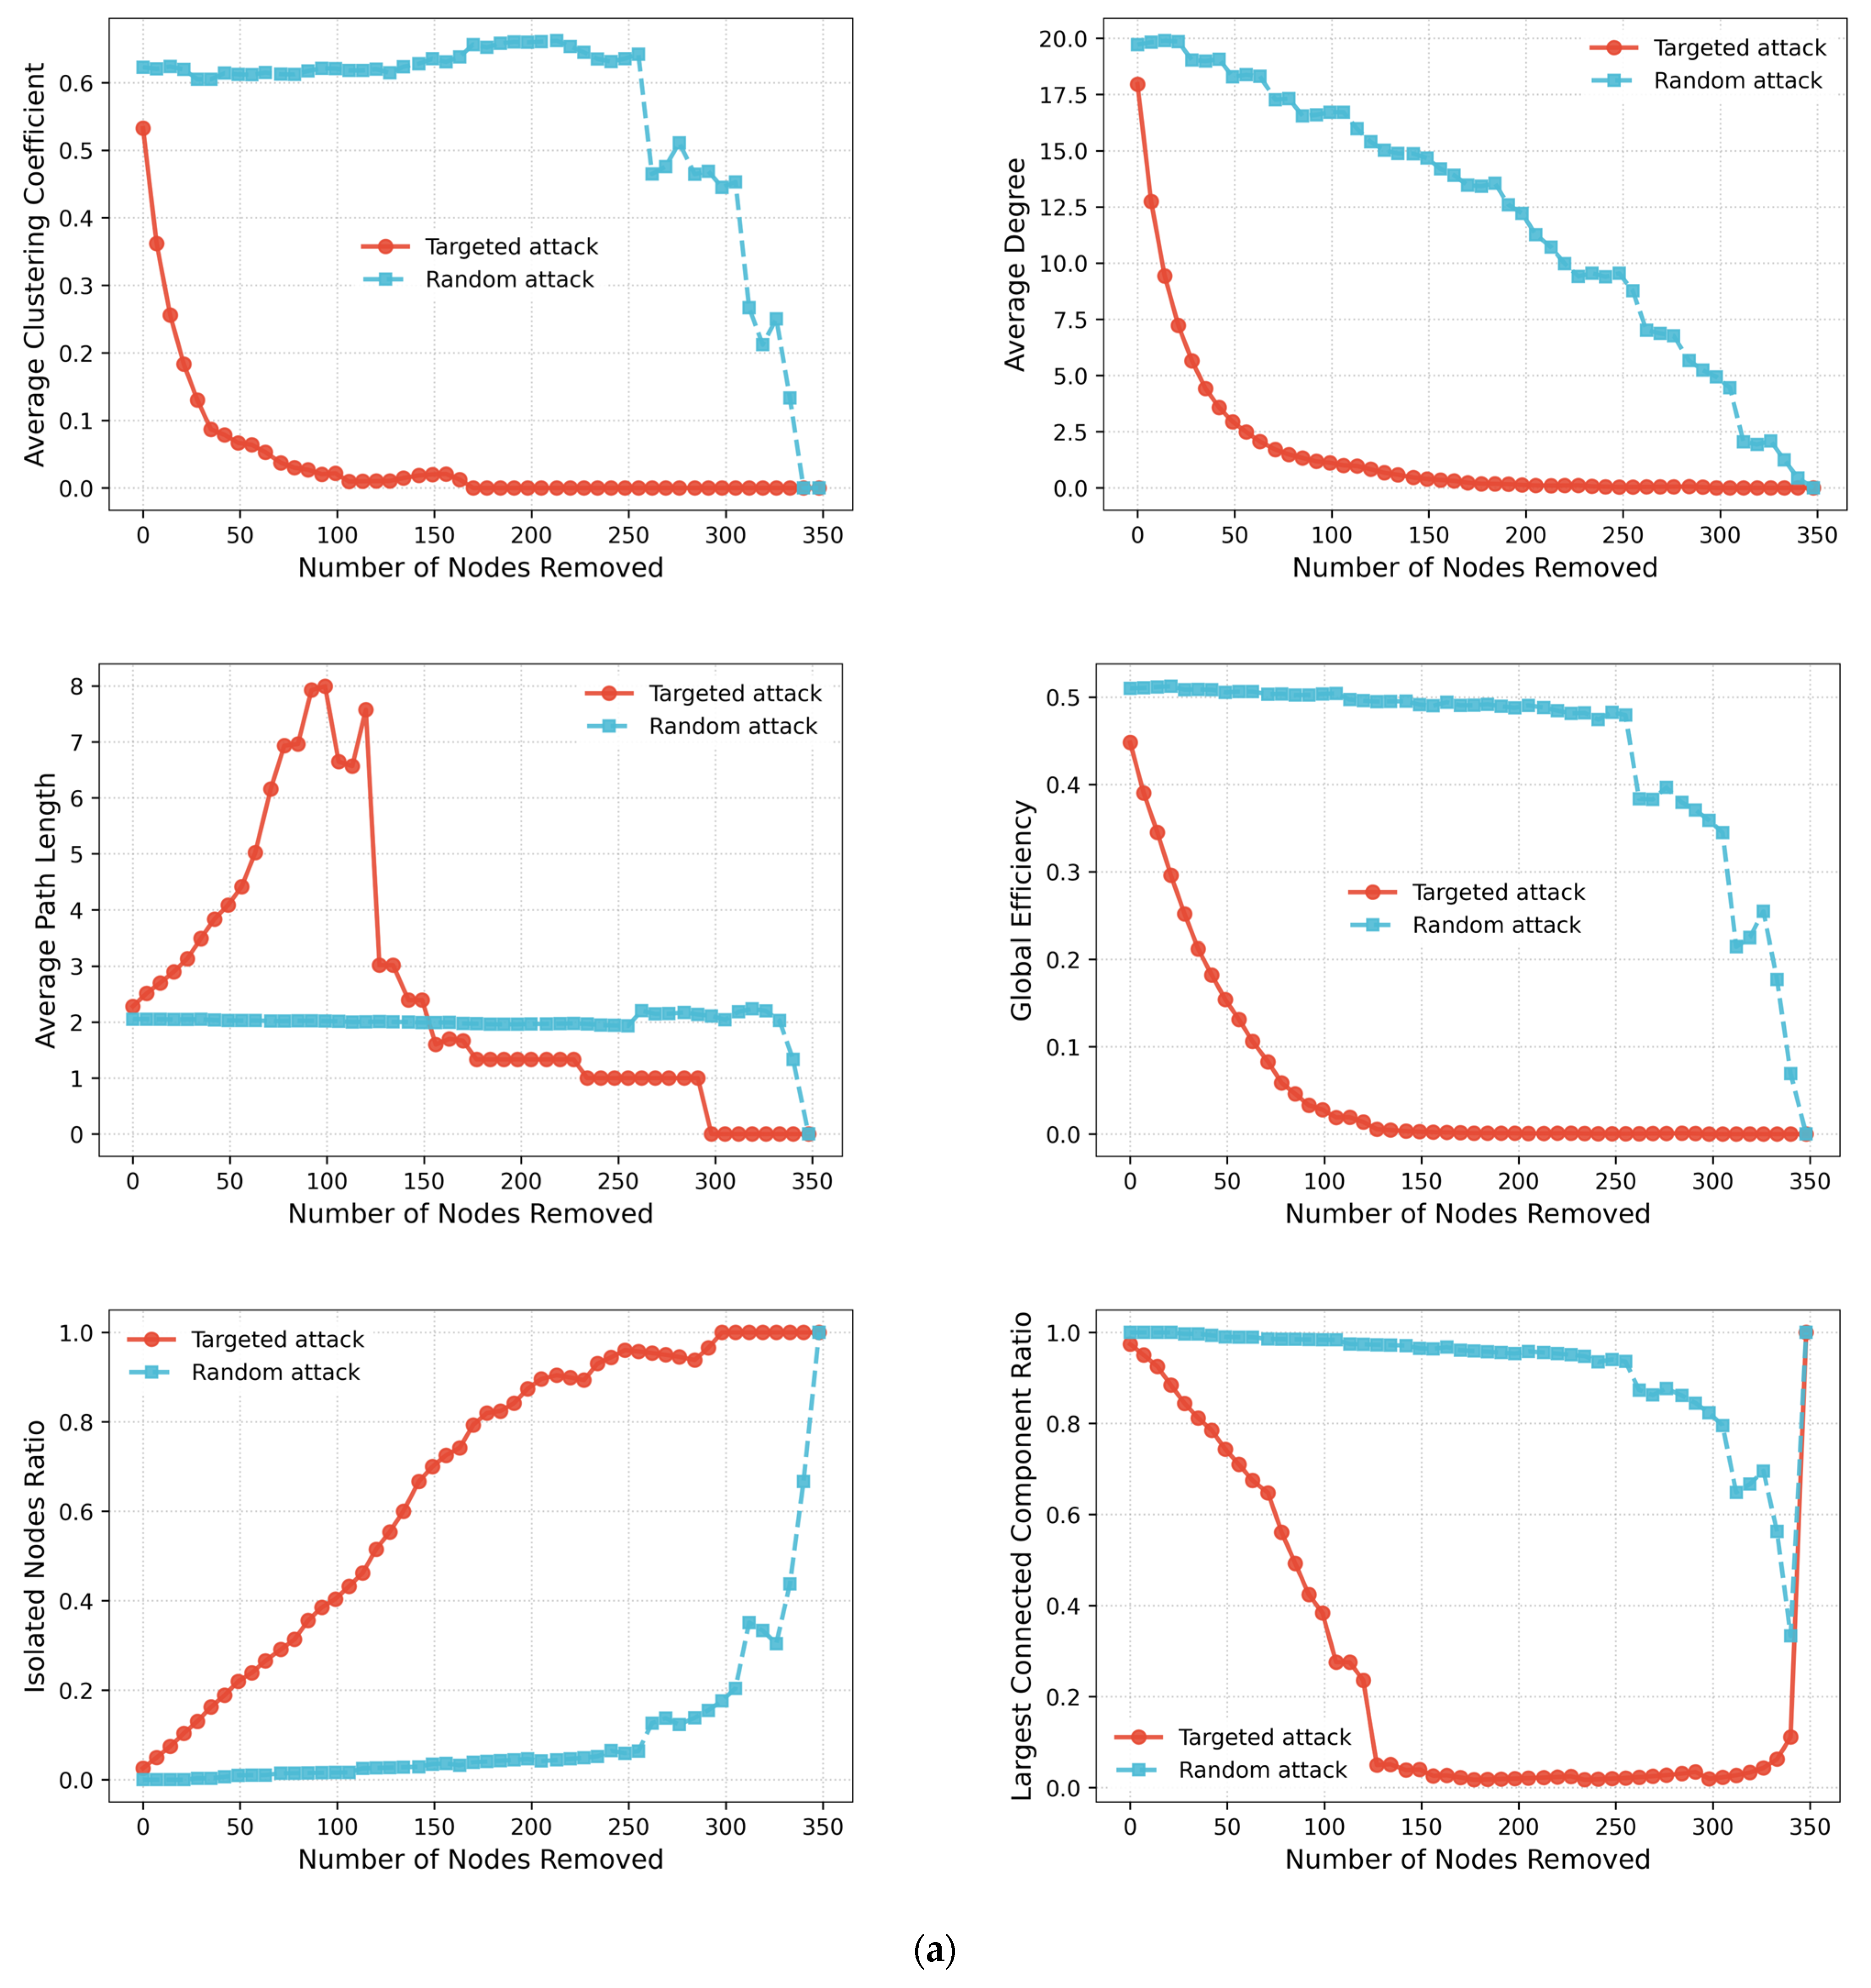
Figure 7 below. We simulated network destruction under targeted attacks (e.g., hub node removal) and random failures to assess systemic resilience. This approach is grounded in complex network theory, where robustness is tested under extreme scenarios to identify vulnerabilities. The background for this analysis lies in the need to evaluate how innovation networks withstand shocks—such as policy shifts or economic disruptions—that may disproportionately affect core cities. The rationality of using attack simulations lies in their capacity to reveal critical nodes and cascading failure risks, providing insights for designing fault-tolerant innovation systems. By comparing KIN and TIN responses, we highlight how knowledge flows (stable but rigid) differ from technology flows (dynamic but fragile) under stress.
The network resilience analysis employed a comprehensive attack simulation framework implemented through Python’s NetworkX library, featuring a sequential node removal protocol that extended to complete network deconstruction (0–100% node removal). This exhaustive approach enabled tracking network metric degradation beyond critical thresholds to capture full structural collapse patterns. Following each iterative removal, we recalculated the complete set of network metrics—including global efficiency, clustering coefficient, largest-component ratio, and isolated node percentage—to document the dynamic structural response to both targeted attacks (degree-based, betweenness-based) and random failures. The simulation design specifically allowed for identifying phase transition points where networks shift from functional to fragmented states, while also capturing post-critical threshold behaviors that inform recovery potential assessments. All simulation codes and configuration parameters have been archived in a public repository to ensure computational reproducibility.
Figure 7a,b demonstrates that the KIN exhibits distinct structural degradation patterns under different attack scenarios. Targeted attacks (degree attacks) cause substantial deterioration in network connectivity, evidenced by sharp declines in clustering coefficients and rapid increases in path lengths. This vulnerability becomes particularly pronounced when removing critical nodes, suggesting a strong dependence on hub nodes. In contrast, random failures show limited impact, indicating the network’s inherent resilience against non-targeted disruptions [
40]. The 2024 network configuration reveals intensified fragmentation effects, with core node removal leading to disproportionate disintegration of the largest connected component and increased isolation of peripheral nodes. These patterns collectively indicate an evolving hierarchical structure in regional knowledge flows.
Figure 8a,b illustrates the TIN’s unique adaptive capabilities. While degree-based attacks still produce the most severe connectivity reduction, the network demonstrates remarkable preservation of global efficiency under betweenness attacks, maintaining functionality despite substantial node removal. A critical threshold phenomenon emerges during random attacks, where network metrics undergo abrupt deterioration beyond a specific disruption level. The period between 2015 and 2024 shows progressive enhancement in resistance to proximity-based attacks, likely attributable to improved technological standardization. However, volatile fluctuations in isolated node ratios reveal underlying instability, particularly evident in emerging technology sectors.
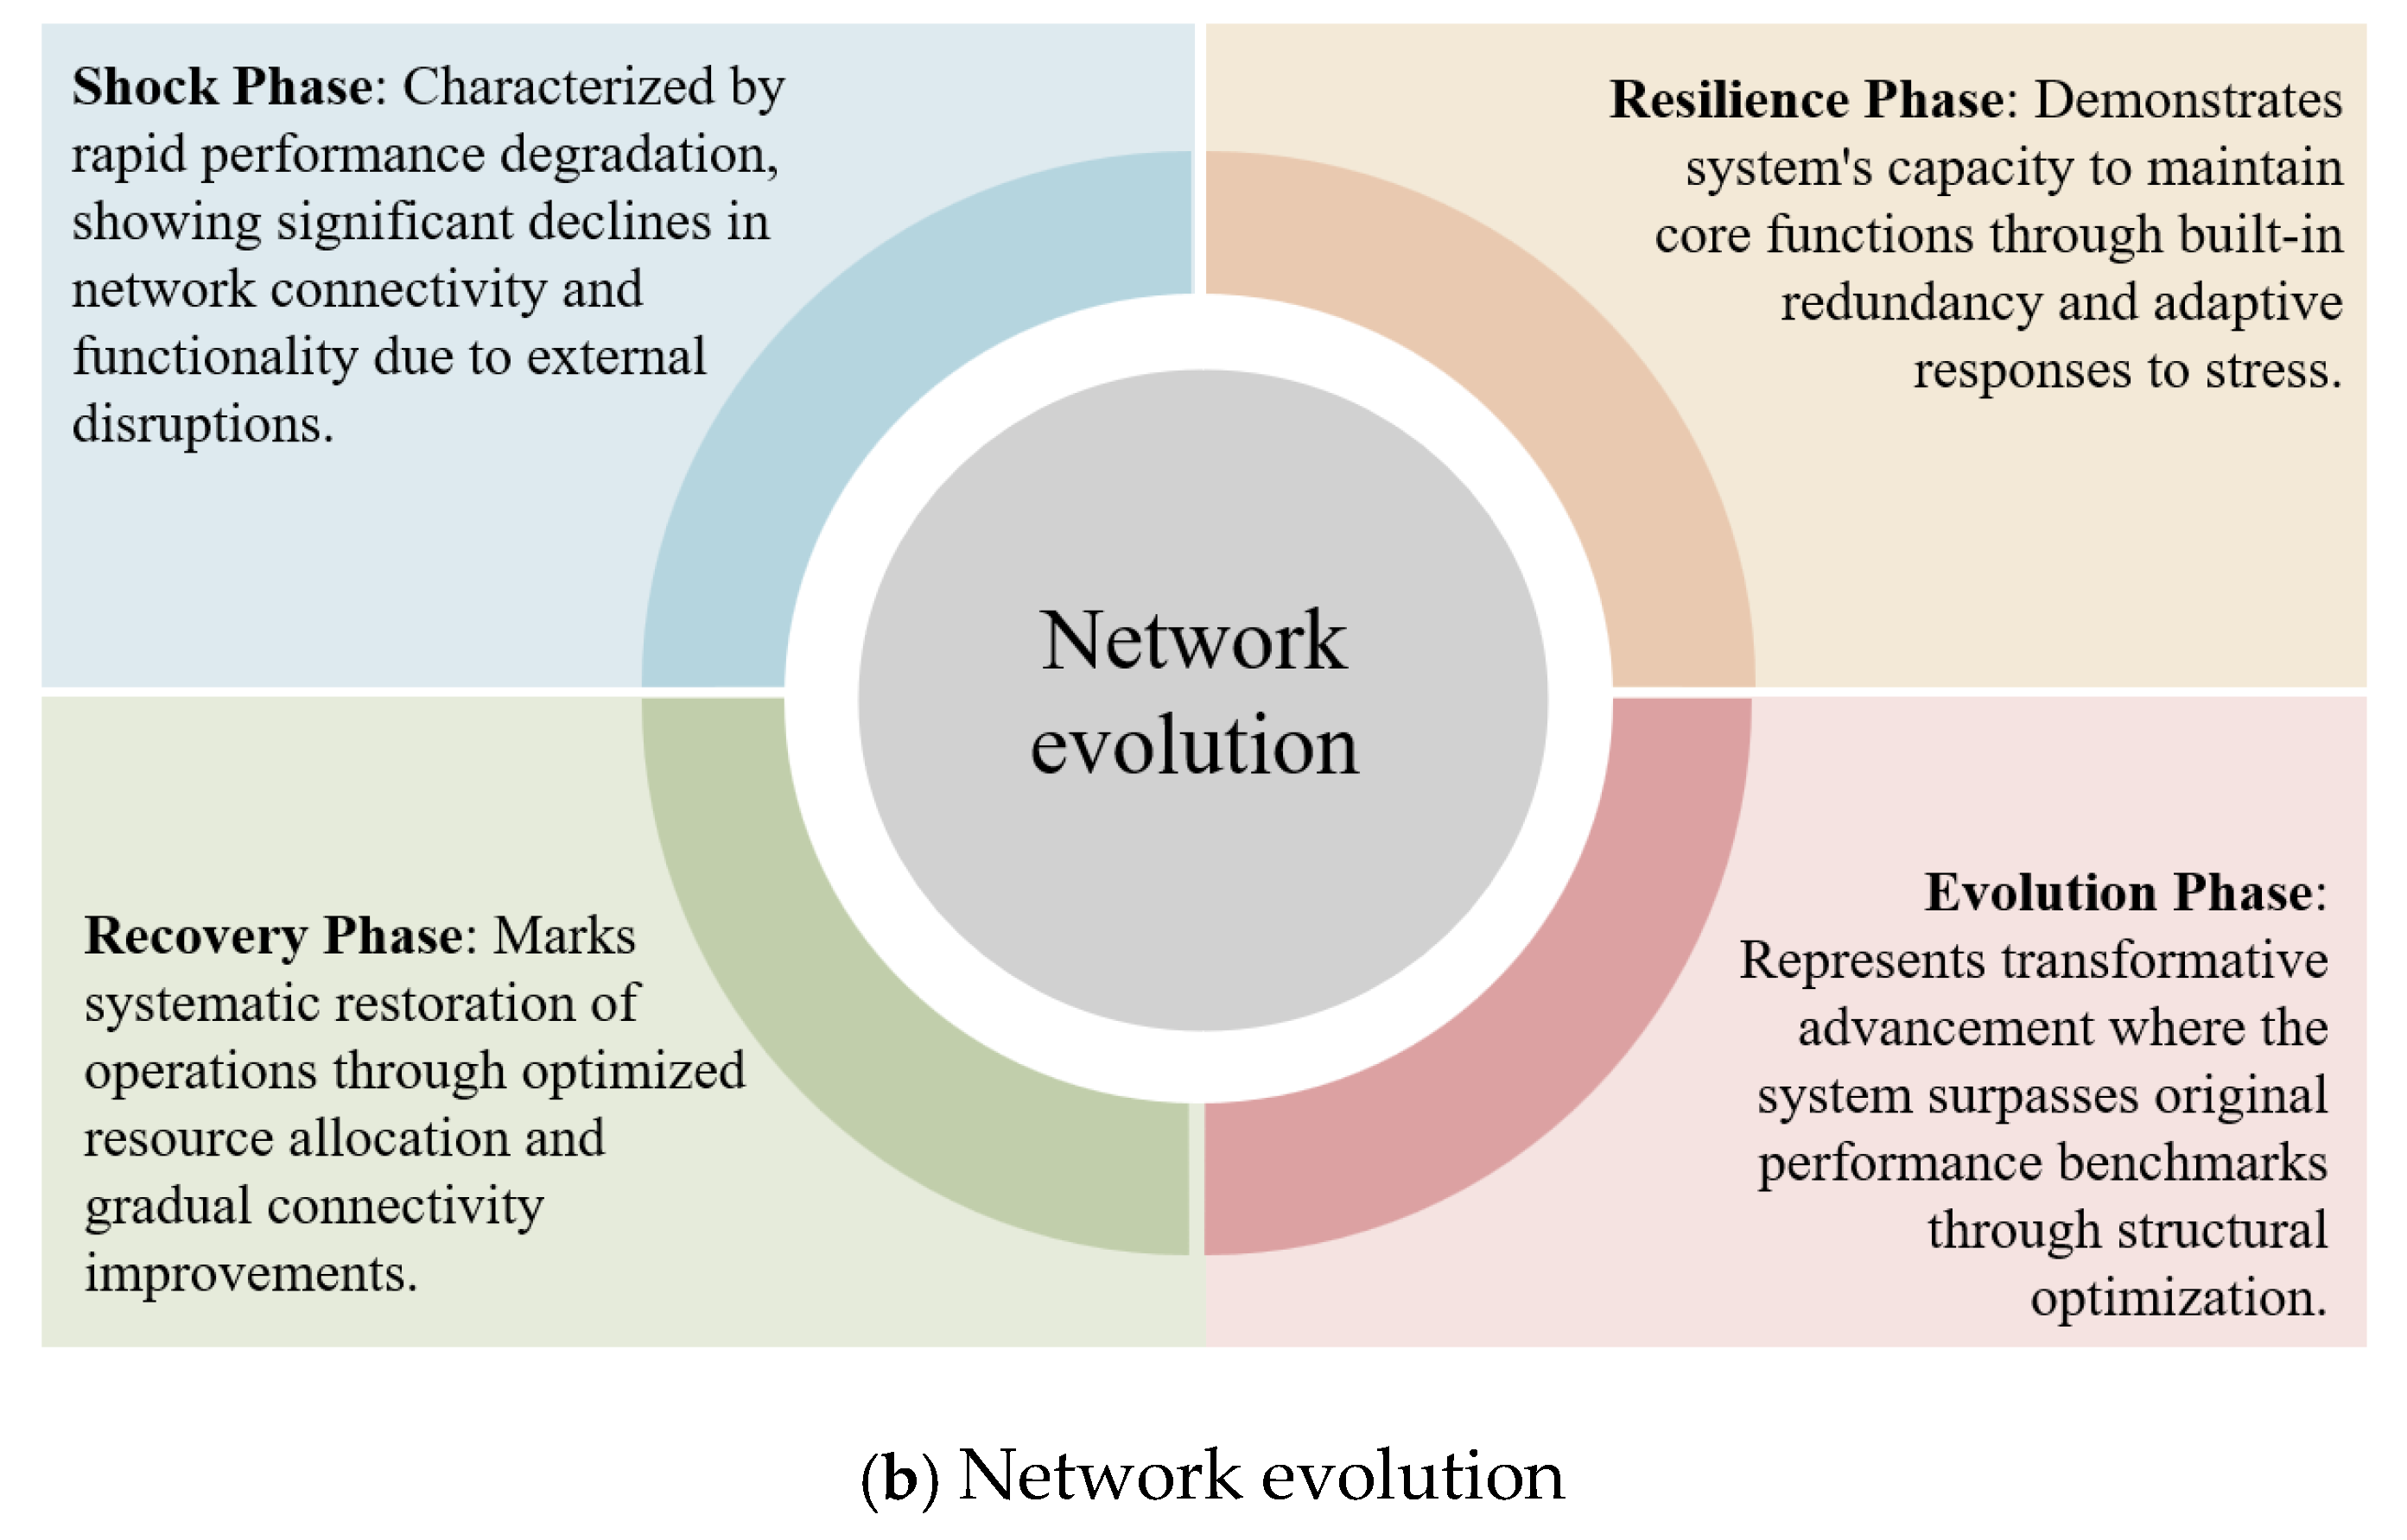
The two networks exhibit fundamentally different robustness mechanisms (
Figure 1,
Figure 2,
Figure 3 and
Figure 4). The KIN displays gradual, synchronized degradation across all metrics, reflecting the path-dependent nature of knowledge diffusion. Conversely, the TIN manifests nonlinear phase transitions, with performance thresholds marking abrupt changes in network behavior. While maintaining lower maximal component connectivity, the TIN shows slower efficiency decay, highlighting its elastic properties. This dichotomy stems from contrasting flow mechanisms: knowledge networks rely on stable institutional linkages that create structural rigidity, whereas technology networks thrive on dynamic project-based collaborations that foster adaptability despite volatility. These insights provide valuable guidance for developing tailored protection strategies for regional innovation ecosystems.
4.5. Driving Factors
MRQAP (Multiple Regression Quadratic Assignment Procedure) is adopted to examine how multidimensional proximities—economic, educational, geographic, and cultural—shape innovation collaborations. This method is chosen because it accounts for network autocorrelation, a common issue in relational data where city pairs are not independent observations. The background for this analysis stems from debates on whether geographic proximity remains relevant in digitalized innovation systems. MRQAP’s rationale lies in its permutation-based inference, which avoids biased significance tests caused by interdependencies. By testing interaction effects (e.g., Economic × Geographic proximity), we uncover why KIN benefits from spatial agglomeration while TIN suffers from competition under the same conditions.
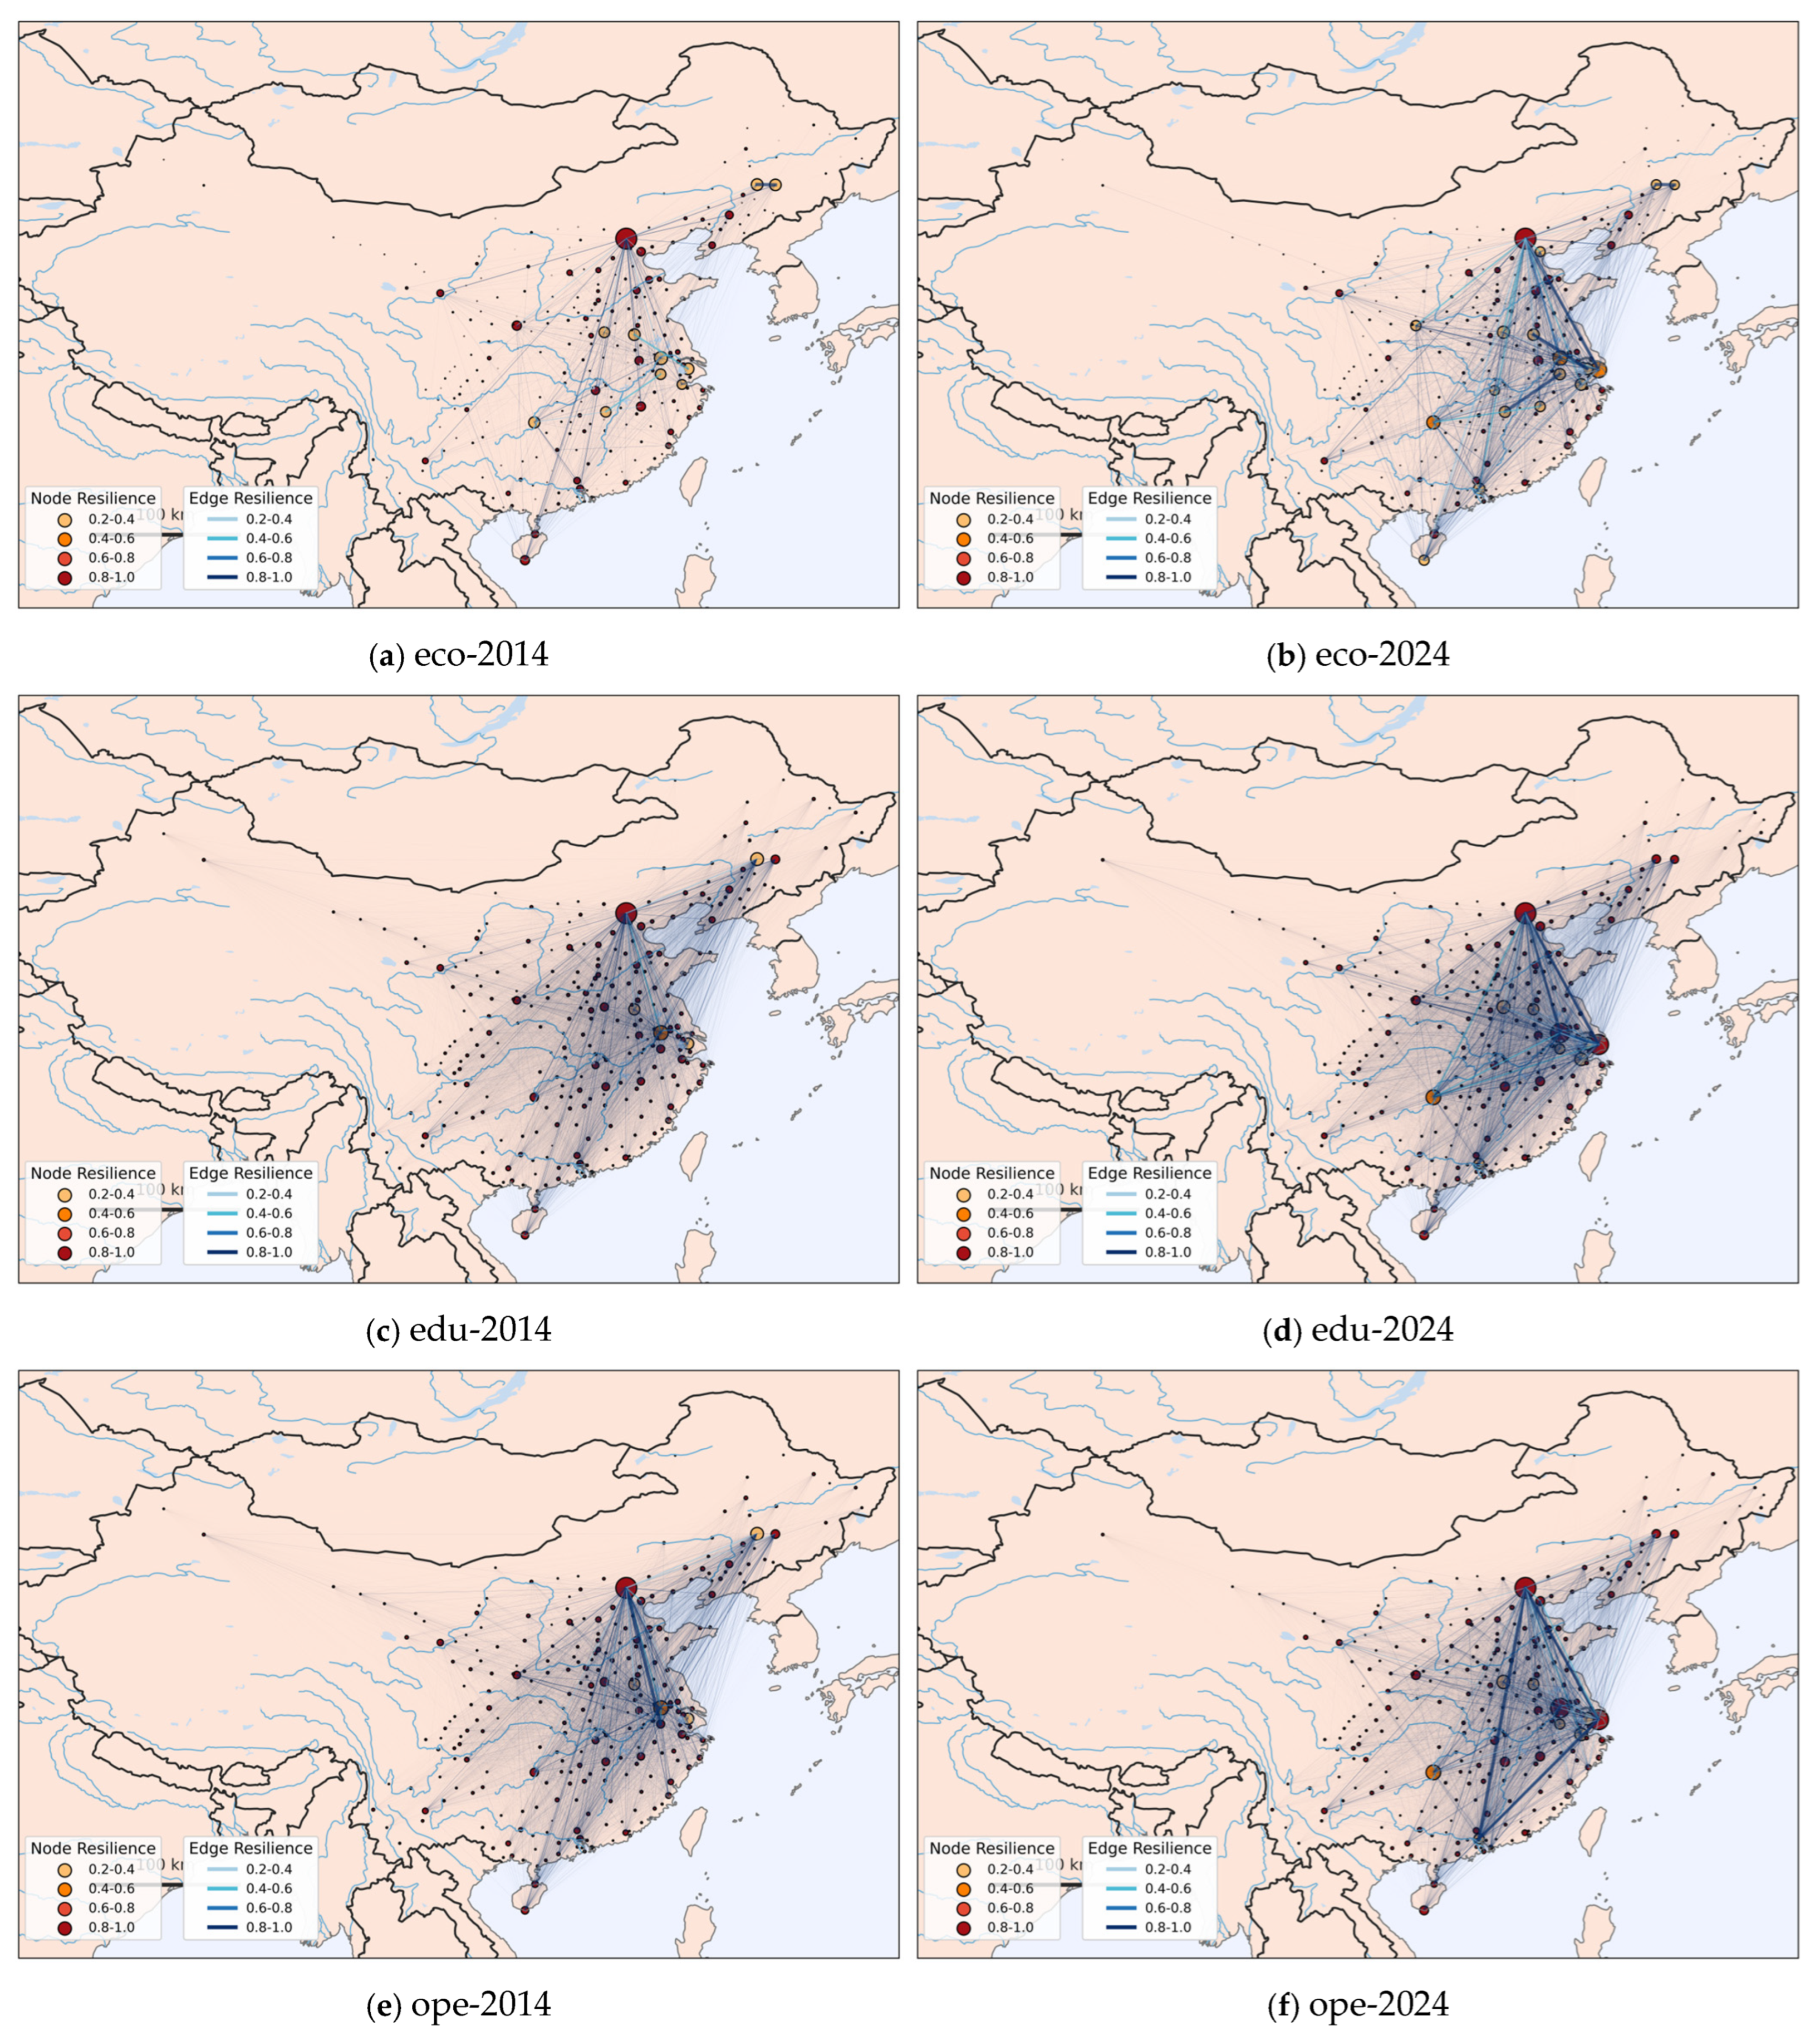
Figure 9 presents the evolution of node resilience and edge resilience under different contextual factors, specifically, (a) and (b) represent the economic proximity, (c) and (d) correspond to the educational proximity, and (e) and (f) illustrate the opening proximity. Additionally,
Table 3 reports the MRQAP regression results obtained using UCINET software (6.186) with 2000 permutations, a random number seed of 474, and significance values calculated using the Permutation Test.
The dependent variable in this study is defined as the normalized intensity of inter-city innovation collaboration, specifically operationalized as edge-level collaborative resilience within both Knowledge Innovation Networks (KIN) and Technological Innovation Networks (TIN). This variable is constructed using SCI/SSCI co-authorship data and prefecture-level patent collaboration records, with standardization implemented through a two-stage methodological approach.
Figure 9 below shows all the nodes, and to avoid overly dense lines, only the top 2.5% of contributing connected edges are shown, economic proximity (eco), the educational proximity (edu), and the opening proximity (ope) exhibit significant changes in the structure of innovation cooperation networks between 2014 and 2024. While economic proximity exhibited a sparse network in 2014, with only a few core cities (e.g., Beijing and Shanghai) maintaining strong ties with other cities and an overall loose structure, the network density increased substantially in 2024, particularly in the eastern coastal region, indicating that the convergence of economic development has mitigated the barrier posed by economic disparity to innovation cooperation. The educational proximity exhibited a smaller-scale innovation cooperation network in 2014, with nodes and edges more decentralized; however, by 2024, the network expanded significantly, with closer ties established between cities with stronger higher education resources. This trend suggests that the increased influence of the educational environment on innovation cooperation may be linked to enhanced talent mobility, strengthened academic collaboration, and the greater sharing of research resources. In contrast, the opening proximity continued to play a facilitating role in 2014, but its influence was relatively limited and primarily concentrated in a few core cities. By 2024, its influence had diminished, with links weakening or even disappearing in certain regions, which may be attributed to policy adjustments, reduced reliance on foreign investment, or shifts in the international environment [
41]. Overall, these findings suggest that while economic and educational factors are increasingly driving innovation cooperation, external factors have become less influential over time.
The dynamic MRQAP regression results presented in
Table 3 reveal significant spatio-temporal evolution in the mechanisms driving collaboration within China’s innovation networks. Three key patterns emerge from the analysis.
First, educational proximity consistently exerts a positive and statistically significant influence on Knowledge Innovation Network (KIN) collaboration across the study period. The coefficient for educational proximity (Edu) increases from 0.0276 in the baseline 2015 Model 1 to 0.0494 in the full 2024 Model 3, suggesting a strengthening role over time. Conversely, in Technology Innovation Networks (TIN), educational proximity shows no statistically significant effect in any model, highlighting a fundamental functional divergence between the two network types.
Second, the role of geographic proximity (Geo) and its interaction with economic proximity (Geo × Eco) reveals opposing network logics. For KINs, geographic proximity is a strong, positive driver, with its coefficient rising from 2.9130 in 2015 to 3.9490 in 2024 (Model 2). Furthermore, the significant positive coefficient for the Geo × Eco interaction term (0.0242 in 2015, rising to 0.0454 in 2024, Model 3) indicates a synergistic effect where co-location and economic similarity jointly enhance collaboration. In stark contrast, the same interaction term is significantly negative for TINs (−0.0043 in 2015, −0.0038 in 2024), demonstrating that geographic and economic proximity together constrain technological co-creation, likely by intensifying localized competition.
Finally, the models exhibit distinct explanatory power for each network. The adjusted R2 values for KIN models are substantially higher (e.g., 0.130 in 2015, 0.173 in 2024, Model 3) than those for TIN models (0.037 in 2015, 0.033 in 2024, Model 3). This suggests that the specified proximity variables explain a much greater proportion of variance in knowledge-based collaboration, while technological collaboration appears to be driven by a more complex set of factors beyond the core dimensions measured here.
These results empirically validate the hypothesized divergent pathways: KINs thrive on agglomerative synergies tied to place-based resources, whereas TINs are inhibited by the competitive externalities of similar actors in close proximity. The findings underscore the necessity for differentiated policy frameworks that leverage spatial synergy for knowledge diffusion while mitigating competitive lock-in in technology commercialization.
5. Discussion, Conclusions, Recommendations and Limitations
5.1. Discussion
This study elucidates the distinct structural and dynamic pathways of China’s Knowledge Innovation Networks (KIN) and Technology Innovation Networks (TIN), offering a comparative perspective that extends current theoretical frameworks. The observed polycentric shift in KIN, characterized by the rise of secondary hubs, aligns with broader narratives of regional rebalancing [
4,
28]. However, it contrasts with earlier emphases on the unwavering dominance of first-tier cities [
1,
21], suggesting that institutional linkages, rather than market forces alone, can foster a more distributed innovation geography. This structural evolution stands in clear distinction to the hierarchical integration observed within the TIN. While traditional models posit stable urban hierarchies [
20,
35], our findings reveal a concurrent process of boundary-blurring collaboration across tiers, indicating a more fluid and integrative technological landscape than previously captured.
Building on these structural contrasts, the mechanisms of innovation diffusion further delineate the two networks. The persistent concentration of economic and educational resources in core hubs reinforces the well-documented Matthew effect [
29], confirming the enduring power of cumulative advantage. Yet, the volatility of knowledge spillovers among these same hubs—modulated by institutional proximity and policy cycles—introduces a critical temporal and institutional contingency to classic spillover models [
5,
34]. This nuanced picture of KIN contrasts sharply with the constrained diffusion within TIN, where sparse patent flows point to more substantial barriers to technological collaboration than some innovation studies imply [
18,
42]. This divergence underscores a fundamental disconnect: where knowledge circulates, albeit unevenly, commercializable technology exchange remains heavily circumscribed. The inverted U-shaped relationship we identify between openness and innovation empirically grounds and refines theoretical propositions about the nonlinear benefits of external linkages [
23], suggesting a network-specific optimal level of integration.
These differential diffusion patterns directly inform the networks’ contrasting resilience profiles, a link that bridges structural analysis with dynamic robustness. The vulnerability of KIN to targeted attacks corroborates theories on the fragility of hub-dependent, small-world architectures [
40,
43]. Conversely, the TIN’s greater tolerance for random failures—yet its susceptibility to collapse beyond a critical threshold—reflects and nuances the understanding of decentralized, project-based networks [
36,
44]. This comparative resilience analysis moves beyond general network theory by distinguishing between knowledge-driven and technology-driven vulnerability pathways [
12,
22]. It demonstrates that the very structural features enabling efficient knowledge flow (e.g., key hubs) may become critical points of failure, whereas the flexible project alliances in TIN diffuse risk but rely on a foundational density of connections [
45].
The role of geographic proximity further clarifies this resilience dichotomy and its underlying logic. Its positive effect in facilitating tacit knowledge exchange within KIN is a cornerstone of agglomeration economics [
31]. Its paradoxical potential to foster patent competition and homogenization within TIN, however, aligns with emerging critiques on the negative externalities of excessive clustering [
17,
33]. This dual effect underscores that spatial agglomeration generates externalities whose valence—positive or negative—is determined by the network’s primary function: knowledge exploration versus technology exploitation [
3,
13]. Thus, proximity consolidates the cooperative foundations of KIN while potentially exacerbating the competitive tensions inherent in TIN.
When interpreted through the lens of tourism, these intertwined structural, dynamic, and geographic logics gain concrete sectoral relevance. The hub-stabilized KIN mirrors the sector’s dependence on academic centers for knowledge and human capital [
46], while the adaptive-yet-fragile TIN reflects the project-cycle reality of tourism technology innovation [
42]. Notably, the proximity-induced risk of innovation homogenization within TIN directly manifests as competition among similar destinations for generic patents, a tangible example of the theoretical negative externality discussed above [
17,
33]. This application confirms that sectoral innovation is deeply embedded in these overarching urban network dynamics, governed by distinct yet interconnected knowledge and technology regimes.
5.2. Conclusions
Based on the findings and discussion of this study, the following conclusions are drawn regarding the structural evolution, functional dynamics, and resilience of urban innovation networks in China.
Structural Evolution: From Monocentric to Polycentric Networks. The knowledge innovation network (KIN) has transitioned from a single-core radial structure to a more distributed, multi-hub grid, with Beijing and Shanghai retaining dominance, while cities like Hangzhou and Nanjing emerge as influential secondary nodes. Conversely, the technology innovation network (TIN) demonstrates a pattern of hierarchical integration, where direct collaborations between core and peripheral cities increase, blurring traditional tier boundaries. Despite this polycentric shift, significant disparities persist in resource allocation and nodal influence across city tiers.
Network Dynamics: Heterogeneous Diffusion of Innovation Factors. Economic and educational flows remain heavily concentrated in core cities, reflecting a persistent Matthew effect. Knowledge flows, though intensified among core hubs, exhibit volatile spillover. Patent flows remain sparse, indicating limited progress in cross-regional collaboration. Additionally, the impact of openness on innovation follows an inverted U-shaped trajectory, highlighting the sensitive interplay between external conditions, policy shifts, and network behavior.
Robustness and Vulnerability: Contrasting Responses to Disruption. KIN displays high reliance on core nodes, rendering it vulnerable to targeted attacks but resilient to random failures. In contrast, TIN exhibits greater dynamic adaptability, maintaining basic connectivity under substantial node removal, yet remains susceptible to critical threshold effects that may trigger abrupt functional collapse. This divergence stems from KIN’s dependence on stable institutional ties versus TIN’s reliance on flexible, project-driven collaborations.
Impact of Proximity: Divergent Effects on Collaborative Innovation. Geographic proximity exerts opposing influences across networks. In KIN, it facilitates tacit knowledge exchange, trust-building, and collaborative synergy, thereby enhancing innovation performance. In TIN, however, proximity tends to intensify patent competition, resource crowding, and homogeneity, ultimately suppressing innovation efficiency. This contrast underscores the dual role of spatial agglomeration as both an enabler of knowledge diffusion and a potential inhibitor of technology co-creation.
Through a tourism lens, the distinct robustness and proximity effects observed in Knowledge Innovation Networks (KINs) and Technological Innovation Networks (TINs) reveal fundamentally different mechanisms through which knowledge and technology drive sectoral innovation. The hub-dependent stability of KINs reflects the role of major tourism academic and research institutions in generating foundational knowledge and cultivating human capital—processes that thrive on sustained collaboration and geographic concentration [
47]. In contrast, the adaptive, project-led nature of TINs corresponds to the volatile cycles of technological innovation in tourism, such as the development of booking platforms and smart tourism applications, which rely on agile, often short-lived cross-regional partnerships [
48]. The negative externality of proximity within TINs manifests in tourism as intense patent competition over generic services, which risks technological homogenization and marginalizes place-based, culturally attuned innovations. These findings suggest that while spatial clustering supports knowledge-intensive tourism research, fostering technological innovation in the sector may require policies that encourage differentiation and safeguard intellectual diversity beyond agglomeration alone.
5.3. Recommendations
Based on the findings of this study, I propose the following policy recommendations to optimize China’s urban innovation networks and enhance their efficiency and resilience.
Implement a pilot Knowledge Hub Pairing Program: This program would establish structured, long-term institutional collaborations between primary and secondary innovation hubs. Under the coordination of relevant ministries, formal five-year partnership agreements would be forged between leading research organizations in core cities (e.g., Beijing, Shanghai) and key academic or R&D institutions in emerging hubs (e.g., Hangzhou, Nanjing). Each agreement would include quantifiable annual deliverables, such as targets for jointly supervised postdoctoral researchers, shared utilization protocols for specialized research infrastructure, and coordinated submissions to international scientific initiatives. Such an initiative is designed to institutionalize knowledge diffusion, create redundant pathways for scientific exchange, and reduce the systemic vulnerability associated with over-reliance on a limited number of core knowledge nodes.
Establish a Cross-Regional Knowledge Mobility Subsidy scheme: To mitigate the spatial concentration of human capital and foster sustained academic interaction, a dedicated funding mechanism should be created to support extended research visits between partner institutions. This scheme would cover the full costs associated with travel, accommodation, and subsistence for collaborative visits exceeding one week. A critical complementary measure would involve formally incorporating participation in such mobility programs into the evaluation and promotion frameworks of researchers’ home institutions. By reducing both logistical and career-related disincentives, this policy aims to enhance the density and durability of inter-organizational networks, thereby facilitating the flow of tacit knowledge and strengthening the overall resilience of the knowledge ecosystem.
Develop a standardized framework for Joint Patent Portfolio Development and Revenue Sharing: To address fragmentation and promote collaborative innovation in technology-intensive networks, a formalized system governing intellectual property co-creation and commercialization is necessary. National intellectual property authorities should develop and disseminate model legal agreements that clearly define co-ownership rights, licensing terms, and revenue distribution models for patents resulting from inter-city R&D projects. Adoption of these standardized agreements should be incentivized through fiscal measures, such as reductions in patent maintenance fees and supplementary R&D tax credits. This integrated approach—combining clear contractual guidelines with financial incentives—is expected to lower transaction costs, align the interests of geographically dispersed partners, and stimulate the formation of stable, cross-regional innovation consortia, thereby enhancing the robustness of technology collaboration networks.
Knowledge Exchange Platforms for Sustainable Tourism: Establish nationally coordinated platforms for tourism-related knowledge exchange, focusing on sustainable destination governance, low-impact tourism development, and community-based tourism models. These platforms should facilitate interaction between academic institutions, destination management organizations, and tourism enterprises across city tiers, with an emphasis on translating research into locally adaptable implementation frameworks.
Technology Testbeds for Smart Tourism Systems: Develop regional technology testbeds that enable cross-city experimentation with smart tourism solutions, such as real-time visitor flow management, energy-efficient hospitality systems, and augmented reality heritage interpretation. These testbeds should prioritize open innovation approaches and data sharing protocols to prevent technological silos and encourage collaborative problem-solving beyond traditional patent-driven competition.
Resilience-Oriented Tourism Innovation Clusters: Foster specialized tourism innovation clusters in ecologically and culturally significant regions, integrating KIN and TIN elements to support climate adaptation, disaster risk reduction, and post-crisis recovery planning. These clusters should link universities, technology firms, and destination stakeholders in co-designing innovations that enhance both environmental sustainability and systemic resilience, with particular attention to the capacity of secondary and tertiary cities to serve as innovation anchors in their respective regions.
These recommendations aim to create a more balanced, adaptive, and sustainable urban innovation ecosystem in China, aligning with national goals of high-quality development and technological self-reliance. Future policies should also consider dynamic monitoring and adaptive governance to respond to evolving network structures and external uncertainties
5.4. Limitations
Based on the findings and structure of the present study, the following limitations should be acknowledged, which also point to avenues for future research.
While the comparative analysis of Knowledge Innovation Networks (KIN) and Technology Innovation Networks (TIN) provides novel insights, the study relies on co-authorship and patent co-application data as proxies for innovation collaboration. Although these are widely accepted measures, they may not fully capture informal knowledge exchanges, tacit learning, or early-stage collaborative activities that do not result in publications or patents. Future research could incorporate alternative data sources, such as firm-level R&D partnerships, talent mobility records, or qualitative case studies, to provide a more nuanced understanding of collaborative dynamics.
The findings regarding network resilience are derived from simulation experiments under stylized attack scenarios (e.g., targeted node removal, random failure). While these methods effectively reveal structural vulnerabilities, they may not fully reflect the complex, adaptive responses of real-world innovation systems to multifaceted shocks—such as simultaneous policy shifts, economic downturns, or public health crises. Subsequent studies could develop more context-sensitive simulation frameworks that incorporate agents’ behavioral adaptation and institutional feedback mechanisms.
The analysis focuses primarily on the role of economic, educational, and geographic proximity, yet other dimensions of proximity—such as institutional, cultural, and cognitive proximity—may also significantly influence collaboration patterns, especially in a culturally and institutionally diverse context like China. Although the MRQAP approach accounts for relational interdependencies, the omission of these less quantifiable forms of proximity may limit the explanatory power of the models. Further research could employ mixed methods to better capture and measure these intangible dimensions.
Lastly, the study period (2015–2024) captures a dynamic phase in China’s innovation policy landscape, particularly under the “Made in China 2025” initiative. While this enhances the contemporary relevance of the findings, the relatively condensed timeframe may not fully reflect longer-term evolutionary trajectories or cyclical fluctuations in network development. Longitudinal analyses spanning broader historical periods would help distinguish between transient policy effects and enduring structural transformations.
These limitations notwithstanding, the study offers a systematic and comparative lens through which to analyze the differentiated logic of knowledge and technology networks, providing a foundation for more contextually embedded and methodologically pluralistic future inquiries.