1. Introduction
As the backbone of modern transportation, the safety and sustainability of high-speed railways are crucial to the national economy and serve as the foundation for efficient and reliable cross-regional passenger and freight transportation [
1]. With the promotion of the intelligent high-speed railway development plan, an intelligent operation and maintenance system based on Beidou positioning, drone inspection, and other technologies has been gradually established, and the operation and maintenance of high-speed trains have been transformed from “planned repair” to “state repair”. As the core power unit of high-speed trains, the traction motor comprises a stator, rotor, bearings, cooling system, and other components. Traditional maintenance methods rely on frequent inspections, which waste resources and may disrupt normal train operations. State repair, however, offers significant advantages in terms of cost savings, risk reduction, efficiency enhancement, and the optimization of maintenance resource utilization, among other benefits, and has been increasingly adopted. Despite its growing application [
2,
3], several challenges remain in state prediction: initially, many existing predictions depend on single sensor data, limiting the ability to capture multi-dimensional state features. Secondly, the large number of parameters in traditional models such as Long Short-Term Memory (LSTM) networks limits their capacity to meet real-time prediction requirements.
With the rapid development of intelligent operation and maintenance technologies, lightweight deep learning models such as the Gated Recurrent Unit (GRU) are increasingly favored in industrial prediction tasks [
4,
5], with a reduced number of parameters compared to Long Short-Term Memory (LSTM) networks [
6]. However, limitations persist in current research, as temperature-based univariate prediction models are unable to capture the coupling effects of operating conditions and environmental factors. Additionally, the traditional offline training modes are often inadequate in adapting to the dynamic variations of operating parameters.
This paper analyzes the traction motor dataset by examining its structural composition and working principles. Firstly, the influencing factors of temperature are integrated, followed by an investigation into the state parameter characteristics of the traction motor from a data statistical perspective. The study further explores the information embedded within the data to facilitate more accurate predictions. Based on this data analysis and background, a traction motor state prediction method for high-speed trainsets is proposed. This method employs the OGRU network, aiming to incorporate multiple influencing factors for temperature prediction, thereby enhancing maintenance efficiency, reducing costs, and ensuring the safe operation of trains.
The contribution of this paper is reflected in two aspects: (1) a multidimensional feature fusion framework is constructed to fuse 6-dimensional time series features such as temperature, current, and speed, taking into account the effects of multiple factors on the state of the traction motor; (2) a real-time prediction method based on the on-line GRU is proposed, and a dynamic parameter updating mechanism is designed, which allows the model to be learned in real time with the changes in working conditions. Experiments show that its prediction accuracy is greatly improved compared with the offline model, and it performs well under various working conditions.
The rest of the paper is organized as follows. In
Section 2, the background of the study and related works in the field are reviewed. In
Section 3, an online prediction model for the traction motor is constructed. In
Section 4, it is presented and analyzed around a high-speed train example.
Section 5 discusses the methodology and results of this paper. In
Section 6, we draw conclusions.
2. Literature Review
High-speed trains have become one of the main tools for people’s transportation by virtue of their reliability, speed, comfort, and environmental protection. However, along with this come higher requirements for their safe operation [
7,
8]. In the process of high-speed train operation, with the traction motor being one of its core components, its stability and reliability is the key to the safe operation and sustainability of the entire train system [
9].
Scholars have studied many traction motor condition prediction techniques [
8,
10,
11], and some scholars have carried out real-time monitoring and prediction of equipment health status by formulating and optimizing on-board alarm thresholds [
12]. Although such techniques can realize basic early warning, they are limited by static threshold setting and are difficult to adapt to dynamic working conditions [
13]. With the gradual increase in the number of sensors arranged on intelligent high-speed railways, it has become mainstream in current research to construct a prediction model using the data collected by sensors, through which the changes in the information elements of the equipment can be sensed earlier, thus providing more timely information for train operation and maintenance [
14]. The actual operation process of trains and the working environment of traction motors are complex and varied, and their states are influenced by multiple factors. Considering only a single factor or change often fails to detect and prevent potential faults in a timely manner and cannot meet the high requirements of intelligent high-speed railways for safety and fault tolerance. Multidimensional inputs can learn more information. The actual operation process of trains and the working environment of traction motors are complex and varied, and their states are affected by multiple factors. Considering only a single factor or a single change often fails to detect and prevent potential faults in a timely manner and cannot meet the high requirements of intelligent high-speed railways for safety and fault tolerance. Therefore, in-depth analysis of factors affecting motor status and the combination of predictive maintenance techniques with data collected by motor sensors have become a hot topic in current research and application [
8,
15,
16].
In the field of intelligent high-speed rail, technologies such as fault prediction and health management (PHM) [
17] and digital twins [
18,
19] are developing rapidly. PHM technology evaluates the health status of equipment in real time and predicts its future performance degradation and potential failures by collecting and analyzing its operational data [
20]. This technology is able to detect small changes in equipment performance and signs of potential failures in a timely manner through real-time monitoring and analysis of equipment operation data [
21]. At the same time, a multifactor-based fault prediction model can be constructed based on historical data and machine learning algorithms to realize the prediction and prevention of potential faults. This helps the operation and maintenance personnel to take maintenance measures in advance to avoid failures and improve the sustainability and safety of trains.
The traction motor is an important device in high-speed trains, which is mainly composed of a stator, rotor, sensor, and so on, and the stator and rotor of the traction motor are its key components [
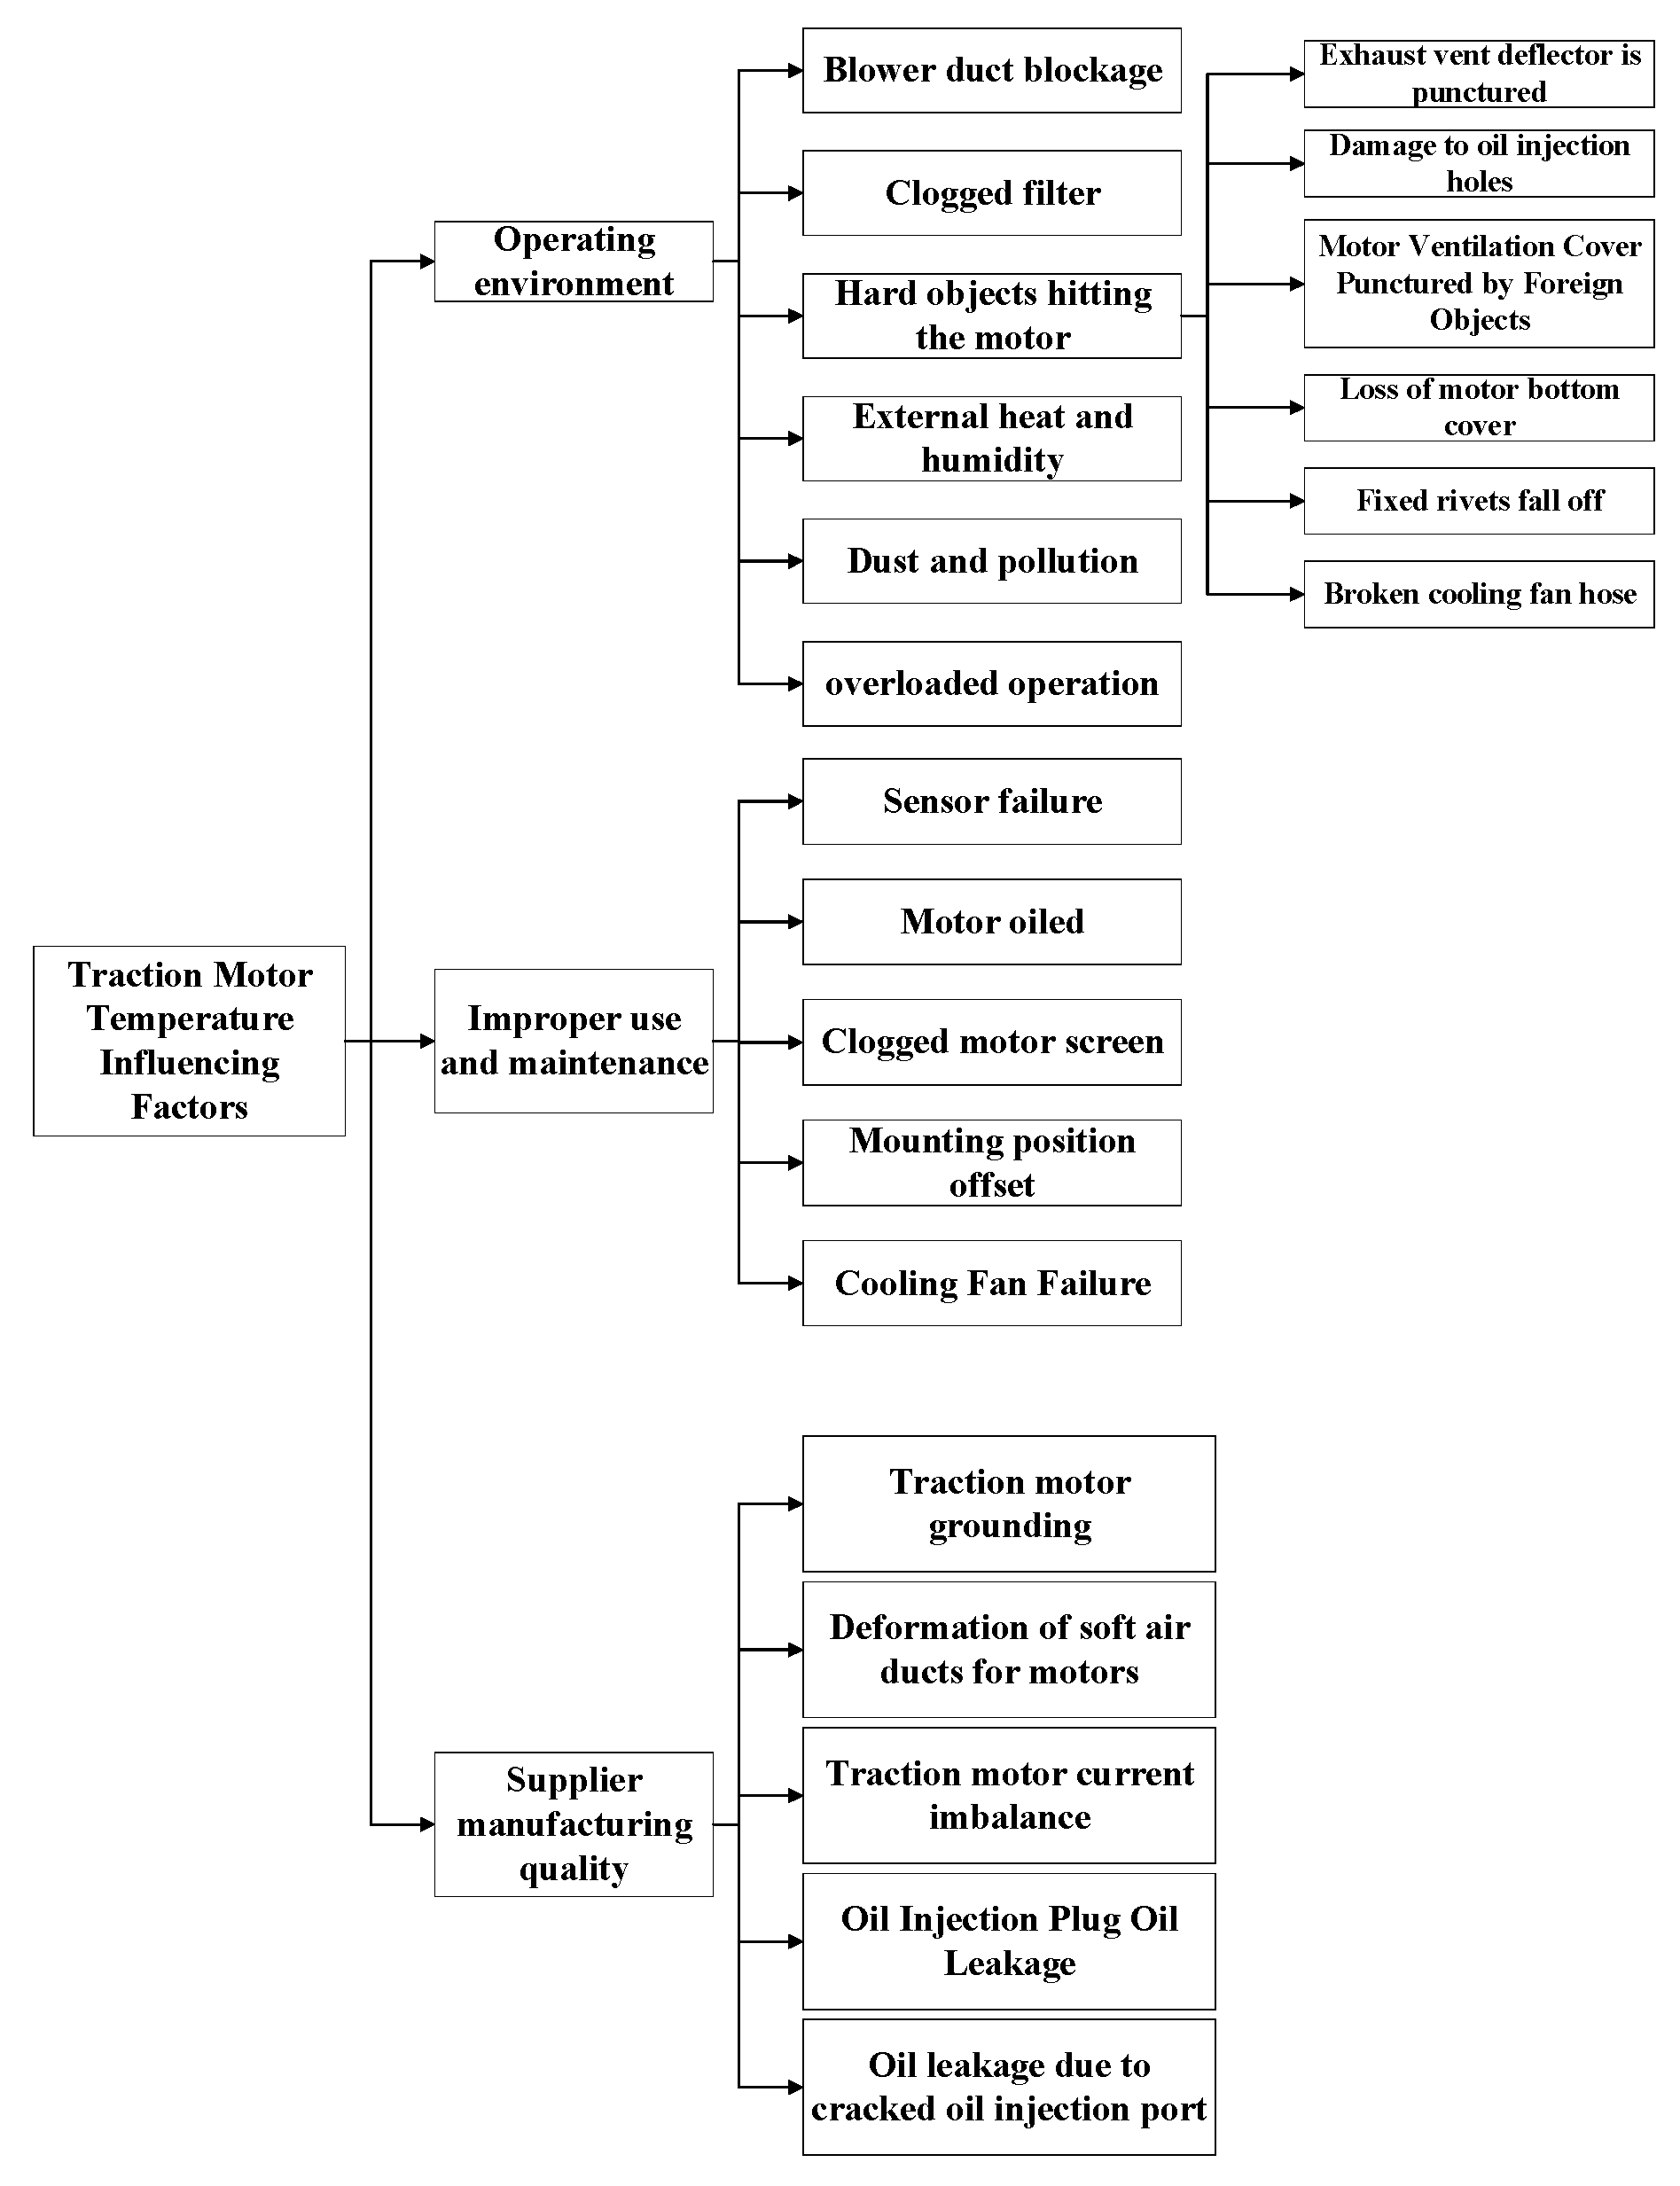
22]. Because the traction motor has a complex structure and operates in variable environments, there are many factors affecting its temperature change. For example, seasonal changes, regional differences, and other external conditions will have an impact on the operation of the traction motor, which may lead to high temperatures in the traction motor and affect the safe operation of the train. Therefore, predicting the state of traction motors based on the consideration of internal and external factors is of great significance for improving their operational efficiency and safety. In this study, various factors affecting the temperature of traction motors are investigated to provide a theoretical basis for improving the reliability and maintenance efficiency of traction motors. Based on the existing fault data, we summarize the factors affecting the temperature of traction motors into three major categories, as shown in
Figure 1.
As shown in
Figure 1, temperature variations can indicate numerous state abnormalities. Utilizing temperature signals as an objective function for analyzing and predicting the state changes of traction motors facilitates the early detection of potential faults, optimizes maintenance schedules, reduces risks, and enhances the safety and efficiency of the entire train system.
Due to the complexity and variability of the factors affecting the temperature of traction motors and the operating environment, data-driven methods may be more applicable than physical model-based methods for motor fault prediction [
23]. Data-driven methods do not require a priori knowledge and have good scalability and generalization capabilities, which can improve the accuracy of prediction [
24]. Choosing a suitable prediction method has a great impact on the accuracy of traction motor state prediction, and existing studies have explored the use of various types of fault prediction methods in a variety of fields. Wang et al. [
25] utilized an improved feedforward-long short-term memory method to achieve whole-life-cycle charge state prediction of lithium-ion batteries, taking into account the variations in current, voltage, and temperature, which improves energy management and safety. Hošovský et al. [
26] proposed an advanced prediction model referred to as genetic-algorithm-optimized regression wavelet neural network. This method first decomposes the temperature time series residuals via wavelet analysis. Subsequently, it constructs a multivariate nonlinear auto regressive model using an S-based neural network. Hua et al. [
27] proposed a wind speed prediction method. The raw wind speed data were first decomposed into multiple subsequences using Variational Mode Decomposition. Then, feature extraction was performed using partial least squares to obtain the best test set. A simulated annealing algorithm was added to the atomic search optimization to enhance the local search capability, and then the Extreme Learning Machine was optimized using the improved atom search optimization algorithm, making the prediction more accurate. Lin et al. [
28] proposed a short-term traffic flow prediction method based on the Maximal Information Coefficient feature selection, Support Vector Regression, and K-Nearest-Neighbors, which introduced a time delay to construct the time-delayed traffic volume sequence. Due to the existence of outliers and missing values in the data collected by sensors, Chen et al. [
29] proposed a method combining Bayesian temporal decomposition and vector autoregressive process for modeling multidimensional time series data, especially spatio-temporal data, in the presence of missing values. By integrating the low-rank matrix tensor decomposition and the vector autoregressive process into a single probabilistic graphical model, probabilistic forecasting and generation of uncertainty estimates can be efficiently performed without the need to interpolate missing values.
The above methods are mainly offline prediction methods, while high-speed trains are equipped with multiple sensors to collect data, which can transmit some important parameters in real time for analysis, and processing these real-time data based on online models and updating the prediction model parameters in real time can improve the prediction accuracy, which is of great significance for real-time fault prediction. There are many scholars studying online learning methods. Shi Wenjun et al. [
30] proposed an on-planet adaptive power control method based on online-gated recurrent unit channel prediction, which prevents the offline algorithms from generating cumulative errors by real-time training data in order to update the network parameters. Yaojian Wang et al. [
31] proposed a short-term wind power probability distribution prediction model based on the online Gaussian Process (GP), which greatly improves the GP-solving efficiency while ensuring accurate GP inference. Wang F K et al. [
32] proposed a bidirectional long- and short-term memory model with an attention mechanism, which predicts the online RUL by continuously updating the model parameters. Tantisripreecha T [
33] proposed a Linear Discriminant Analysis (LDA) online learning method that incrementally fits a learning model using historical inventory as a training set for LDA. Thomas Bohnstingl et al. [
34] proposed a biologically inspired Online Spatio-Temporal Learning algorithmic framework aimed at solving the problem of deep neural networks with traditional limitations of backpropagation through time and Real-time recursive learning (RTRL) methods when dealing with continuous data streams. Dong H et al. [
8] proposed an online health monitoring framework using temperature signals to predict the health status of traction motors, where the prediction model can be optimized online to continuously extract information from historical and real-time data.
However, offline prediction models struggle to balance real-time performance and accuracy issues. In the field of railway transportation, the operation safety and efficiency of high-speed trains are crucial, while the operating environment of high-speed locomotive motors is complex and diverse, and their prediction needs to satisfy the requirements of timeliness and accuracy at the same time.
In order to ensure the optimal comprehensive efficiency of the intelligent operation and maintenance system of high-speed railways, a large number of scholars have studied the PHM technology and extended it to the railway field [
35,
36,
37], but the research on the online state prediction technology for intelligent train equipment is still insufficient, and the online prediction model has a certain advantage over the offline model for the prediction under the intelligent high-speed railway operation scenario. Therefore, this paper is of great significance for analyzing the traction motor temperature signal and carrying out research based on a multi-factor online learning model.
3. Methods
In the online learning method, the data arrive sequentially and the prediction parameters are updated gradually, which is suitable for the case of dynamic data and time function generation [
38]. High-speed trains can transmit data to the wireless data transmission device system (WTDS) in real time, so they can analyze the data in real time, input the real-time data into the model, optimize the model parameters online, and get the next prediction results; due to the high timeliness requirements of the fault prediction problem and the strict national requirements on the safety of high-speed railway transportation, it is necessary to put forward a higher requirement for the accuracy of high-speed railway fault prediction, and online learning can better satisfy the above two requirements.
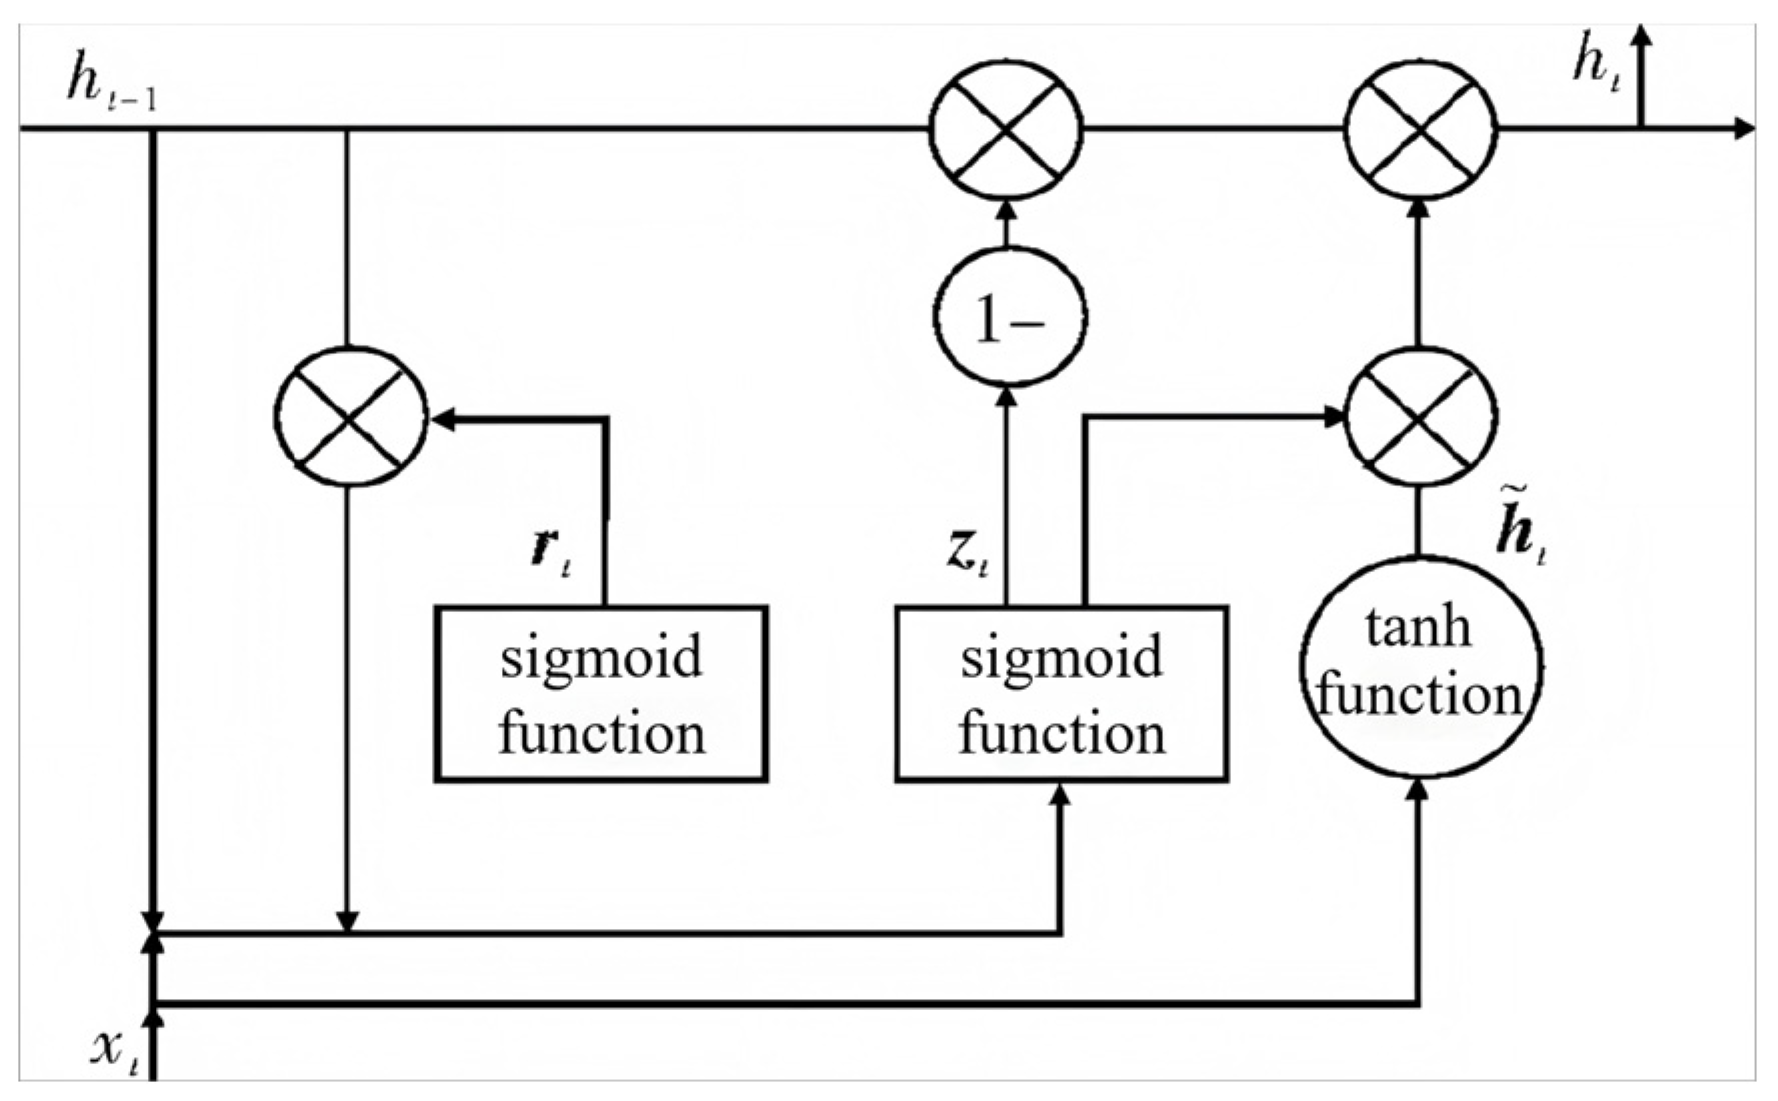
RTRL has high computational complexity and is prone to problems such as gradient vanishing or gradient explosion, and there are many algorithms investigating how to reduce its time complexity [
39], but they are not sufficiently adapted to the scenario of this paper, where the interval of data transmission is 1 min. In order to ensure the timeliness and accuracy of the problem studied in this paper, this paper uses the OGRU model for prediction, and the traditional GRU is shown in
Figure 2.
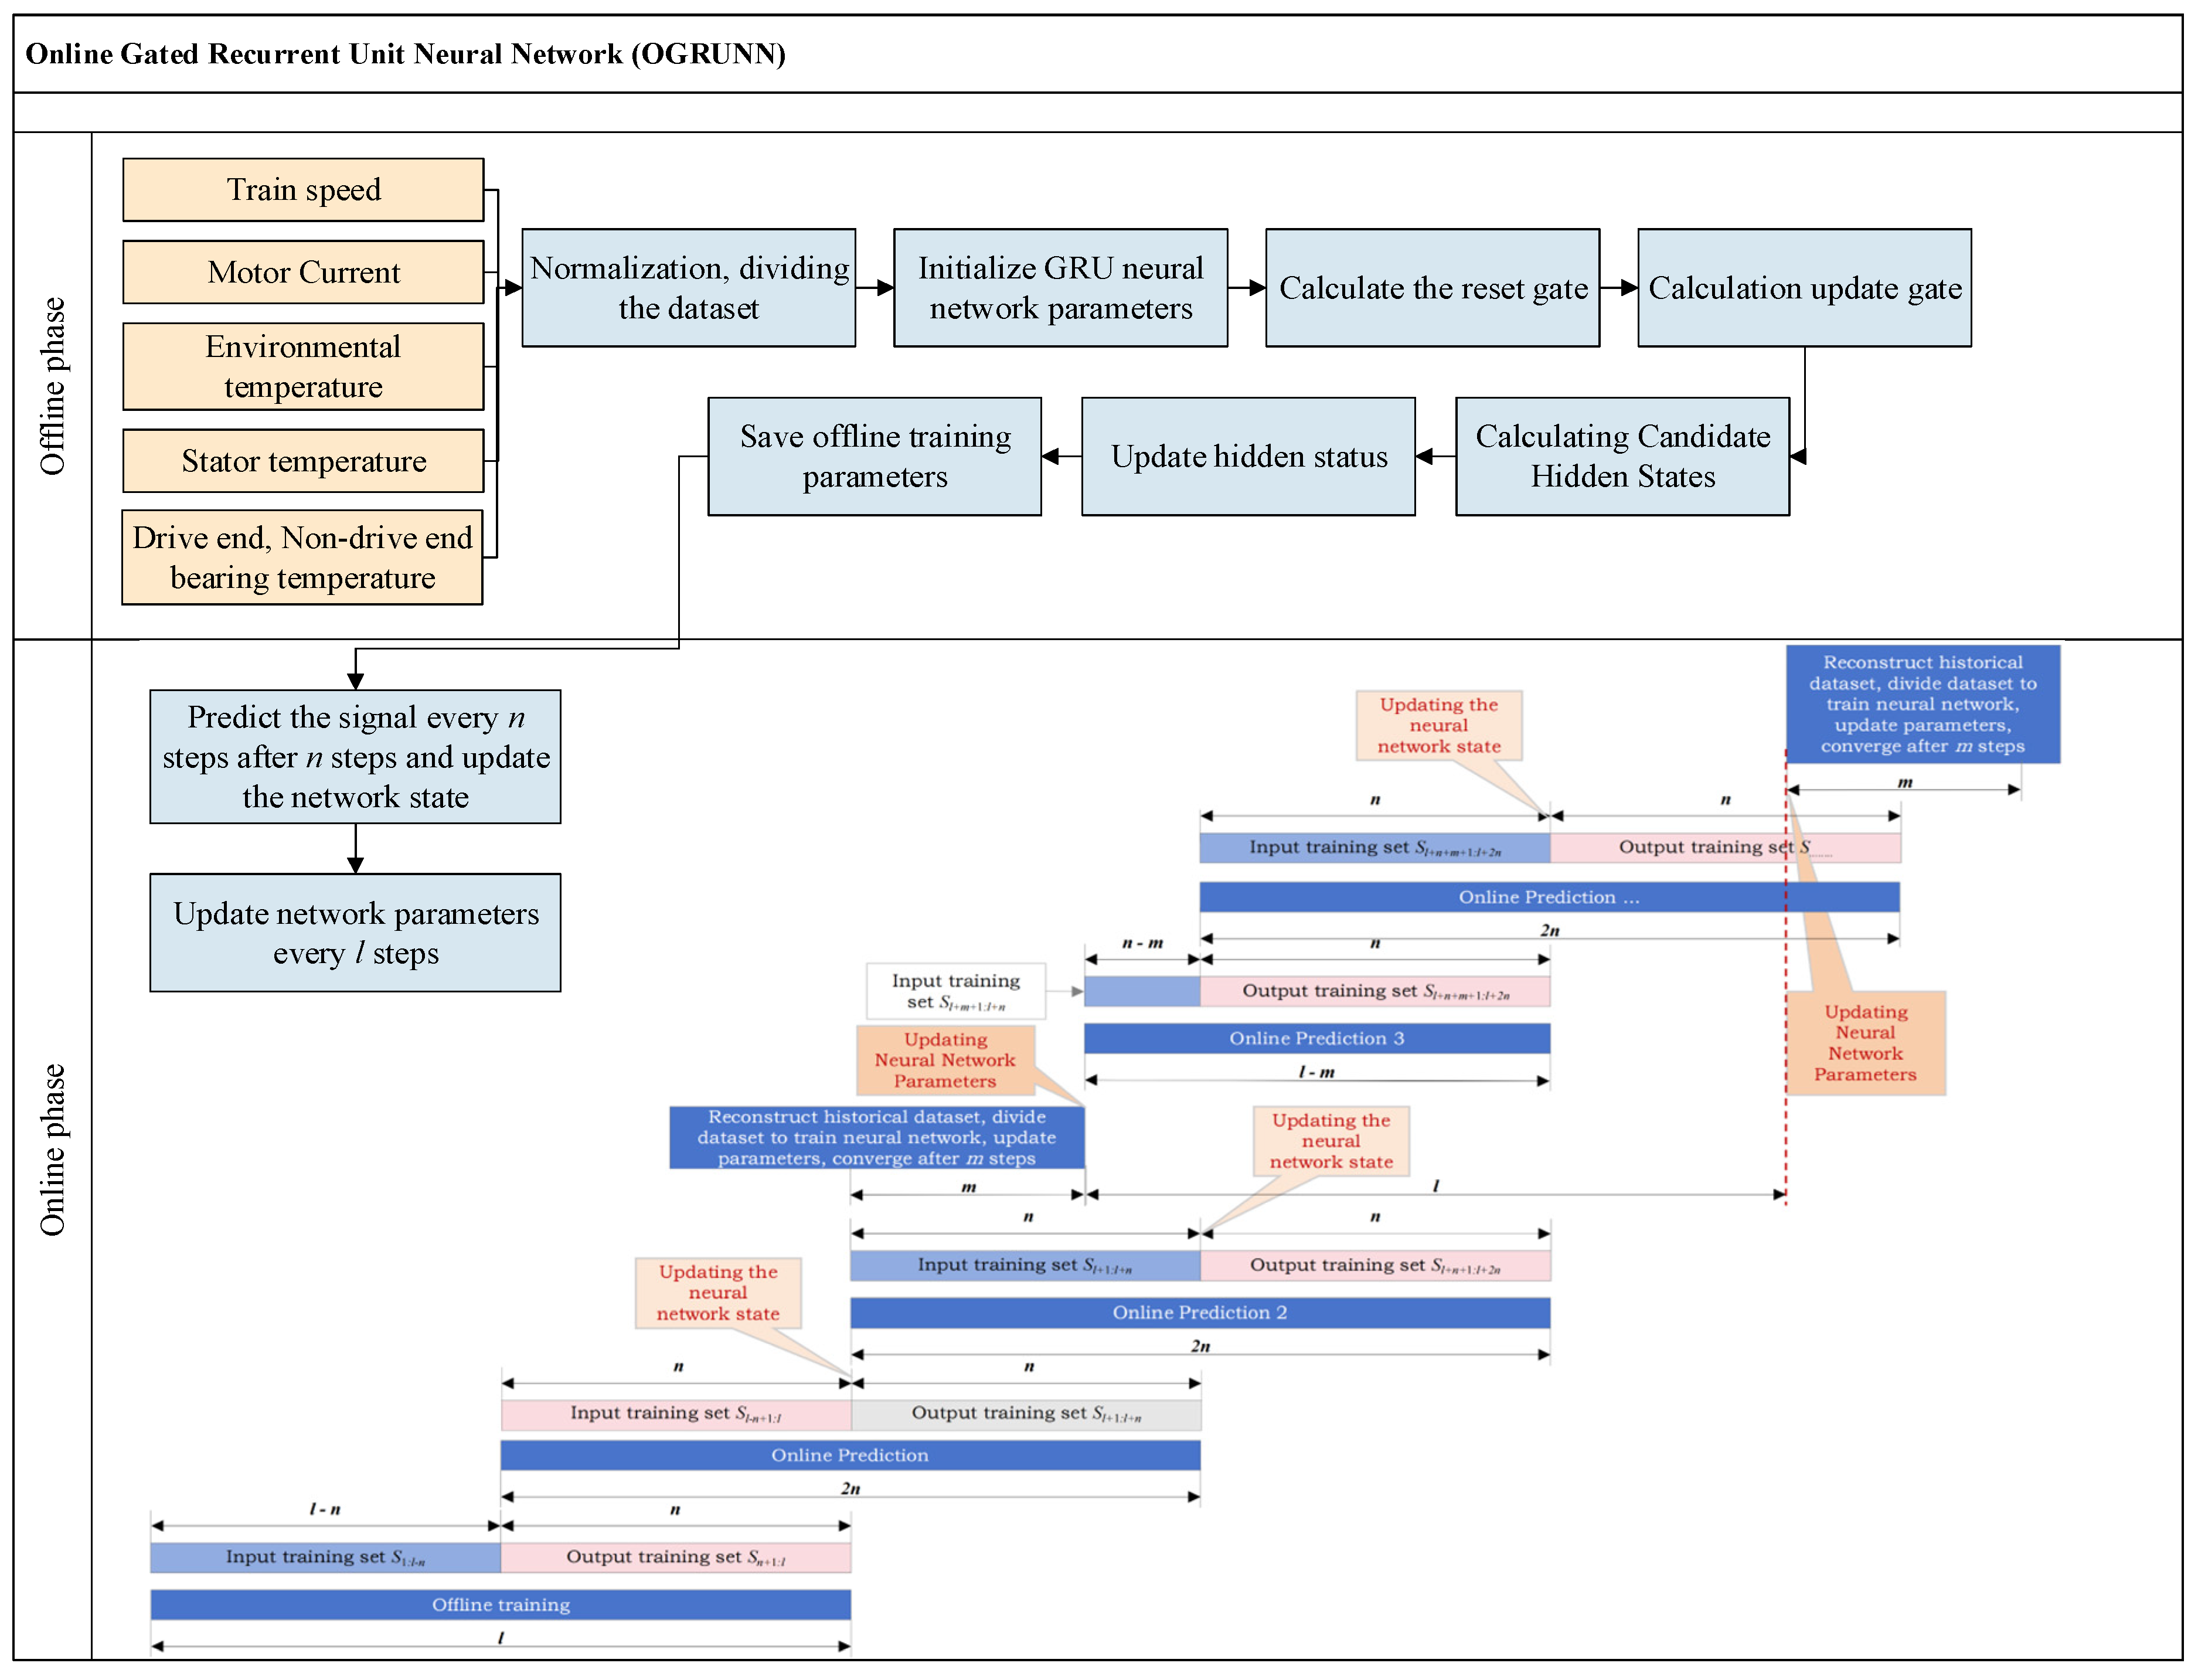
The online optimization prediction model proposed in this paper is divided into two phases. The first phase involves offline learning, where a large volume of data is fed into the neural network to train it, resulting in initial parameters for the online gated recurrent neural network at each update through offline training. The subsequent phase is the online stage, where the initial model parameters are adapted based on real-time data collected by traction motor sensors, enabling parameter updates and predictions. The online prediction results are derived, and the workflow of this online optimized prediction model is illustrated in
Figure 3.
When online, the prediction results of the subsequent steps are predicted every steps, and the training results of the subsequent steps returned from the ground are used to predict the results of the further steps. At the same time, the overall parameters of the neural network are updated every steps using the data from the previous steps and converge after steps, as follows:
In the offline training part, the traction motor temperature data set is divided, and the neural network is trained offline using the input-output training set and data set, where is the signal transmission interval, and since the signal transmission interval in this paper is 1 min, and the sampling interval is also 1 min, the interval is set to be the prediction step, taking 1.
Calculate the update gate
as in Equation (1) [
40]:
Calculate the reset gate
as in Equation (2) [
40]:
Calculate the candidate hidden state
as in Equation (3) [
40]:
Calculate the hidden state
as in Equation (4) [
40]:
Calculate the output signal
as in Equation (5) [
40]:
In Equations (1)–(5), [ ] denotes the vectors connected,
denotes the product of matrices,
denotes the information of the previous time series,
denotes the input of the current time step, which is the influencing factor of the traction motor temperature in the example of this section, and
denotes the output of the current time step, which is the traction motor temperature signal in the example of this section.
,
,
, and
are the model parameters which denote the update gate weight, reset gate weight, candidate set weight, and output weight, respectively, and
and
denote the activation function of the neural network, which is calculated as shown in Equations (6) and (7):
The training optimization update is performed separately for the splice vectors
,
,
as in Equations (8)–(10):
The input of the output layer is
, the output is
, and
is the final output.
Considering the error term at the current time step and setting it as
, then back propagating the error in time requires calculating the error
at the moment
, which is as in Equation (12).
With the above equation, the partial derivatives of each weight are calculated and the learning rate is chosen, the parameters are optimized using stochastic gradient descent in order to inversely adjust the structure of the GRU network, and the trained model can be used for prediction in this paper.
The input training set is used as input to predict the output sequence after steps.
After steps, the network state is updated according to the uploaded input and the output sequence is predicted after steps, and at the same time, the previous input-output dataset is reconstructed to be used for training the neural network to update all the parameters of the network, which converges after steps, and in the process of reconstructing the neural network training, in order to ensure the online prediction model runs normally, all the data transmitted during the training period are are predicted using the original GRU neural network parameters, while after the training is completed, the input training set is used to predict under the new parameters to obtain the output sequence .
Afterwards, the first steps of data are still used to predict the next steps of data, and the first steps of signal data are inputted every steps to train the neural network and update the overall parameters of the neural network. The above process is repeated.
The model pseudo code is shown in Algorithm 1.
Algorithm 1. Online prediction of pseudo code.
| Algorithm 1 Online Gated Recurrent Neural Network Prediction |
| Import torch, torch.nn, GRU, pandas, numpy, scipy.io, matplotlib.pyplot, matplotlib, torch.autograd, math, csv, adabound, time |
| Input: The current of the motor, drive end bearing temperature, non-drive end bearing temperature, speed of the train and the external temperature are defined as data_x; |
| Output: Define the stator temperature of traction motor as data_y |
| use a sequence for offline training and save the initial parameters of GRU model |
| loading initial parameters of GRU model |
| Initialize variables list, m, data_begin, and data_end |
| for i in range(len(data_x)): |
| if (i + 1) % 1000 == 0: |
| train the model with data of a sequence length and update the model parameters |
| if (i + 1) % 1 == 0: |
| pred_output = gru_model(input_tensor).to(device) |
| For each data point, make predictions and calculate error metrics (, , , ) |
| update the model parameters |
| save the predicted results to the list, convert it to a numpy array, and save it to the Excel file ‘pred.xlsx’ |
| calculate the code execution time |
| end |
4. Data and Analysis
4.1. Dataset Introduction
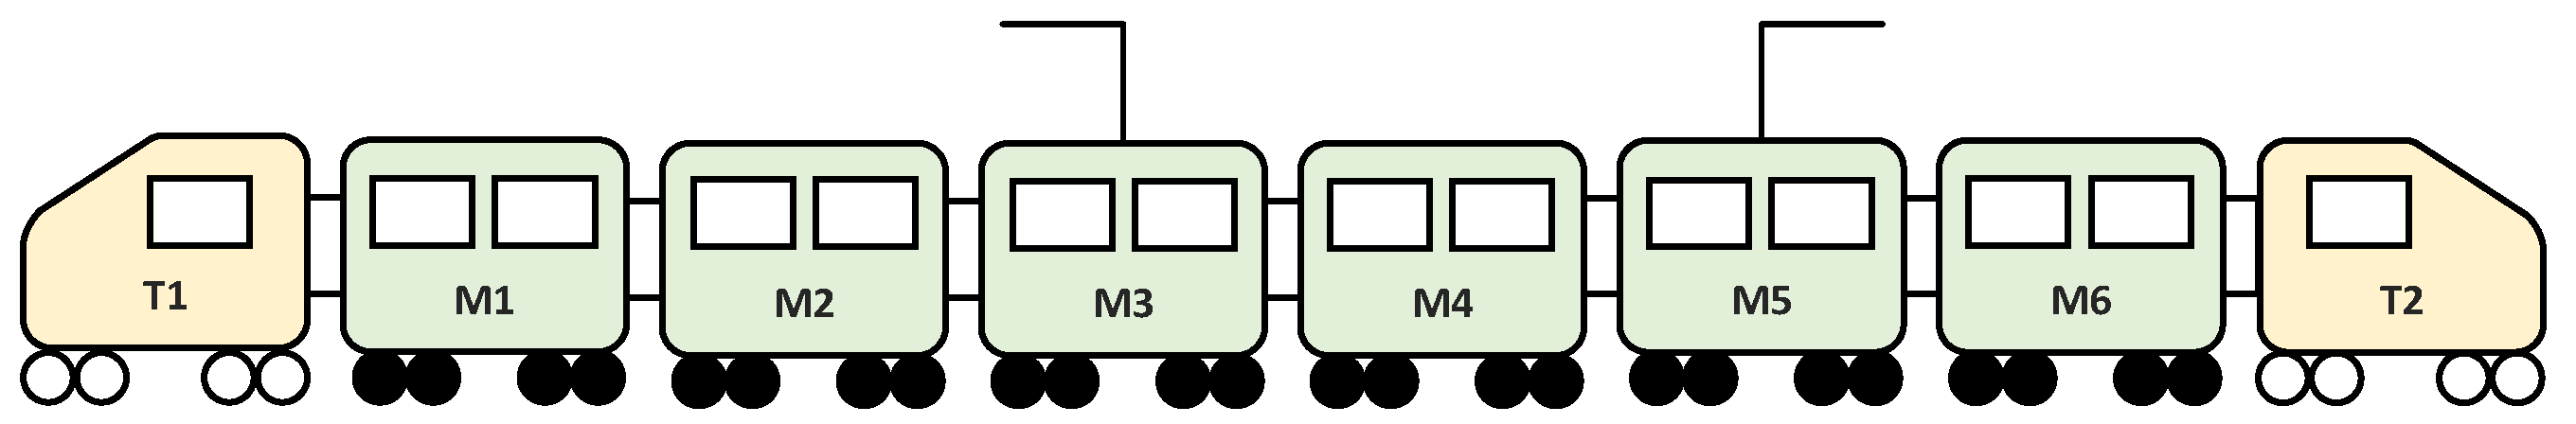
The high-speed train set studied in this paper consists of an eight-carriage formation, comprising two trailer carriages (T1 and T2) and six motor carriages (M1–M6). Pantograph devices are installed on the roofs of carriages M3 and M6 (corresponding to vehicles 4 and 6 in
Table 1). Carriages 2 to 7 are each equipped with four traction motors, while carriages 1 and 8 are fitted with external environmental temperature sensors. As a result, the entire train includes a total of 24 traction motors and 2 external environmental temperature sensors. The simplified diagram of the train set used in this study is shown in
Figure 4, and
Table 1 displays the distribution of key electrical components in the traction system.
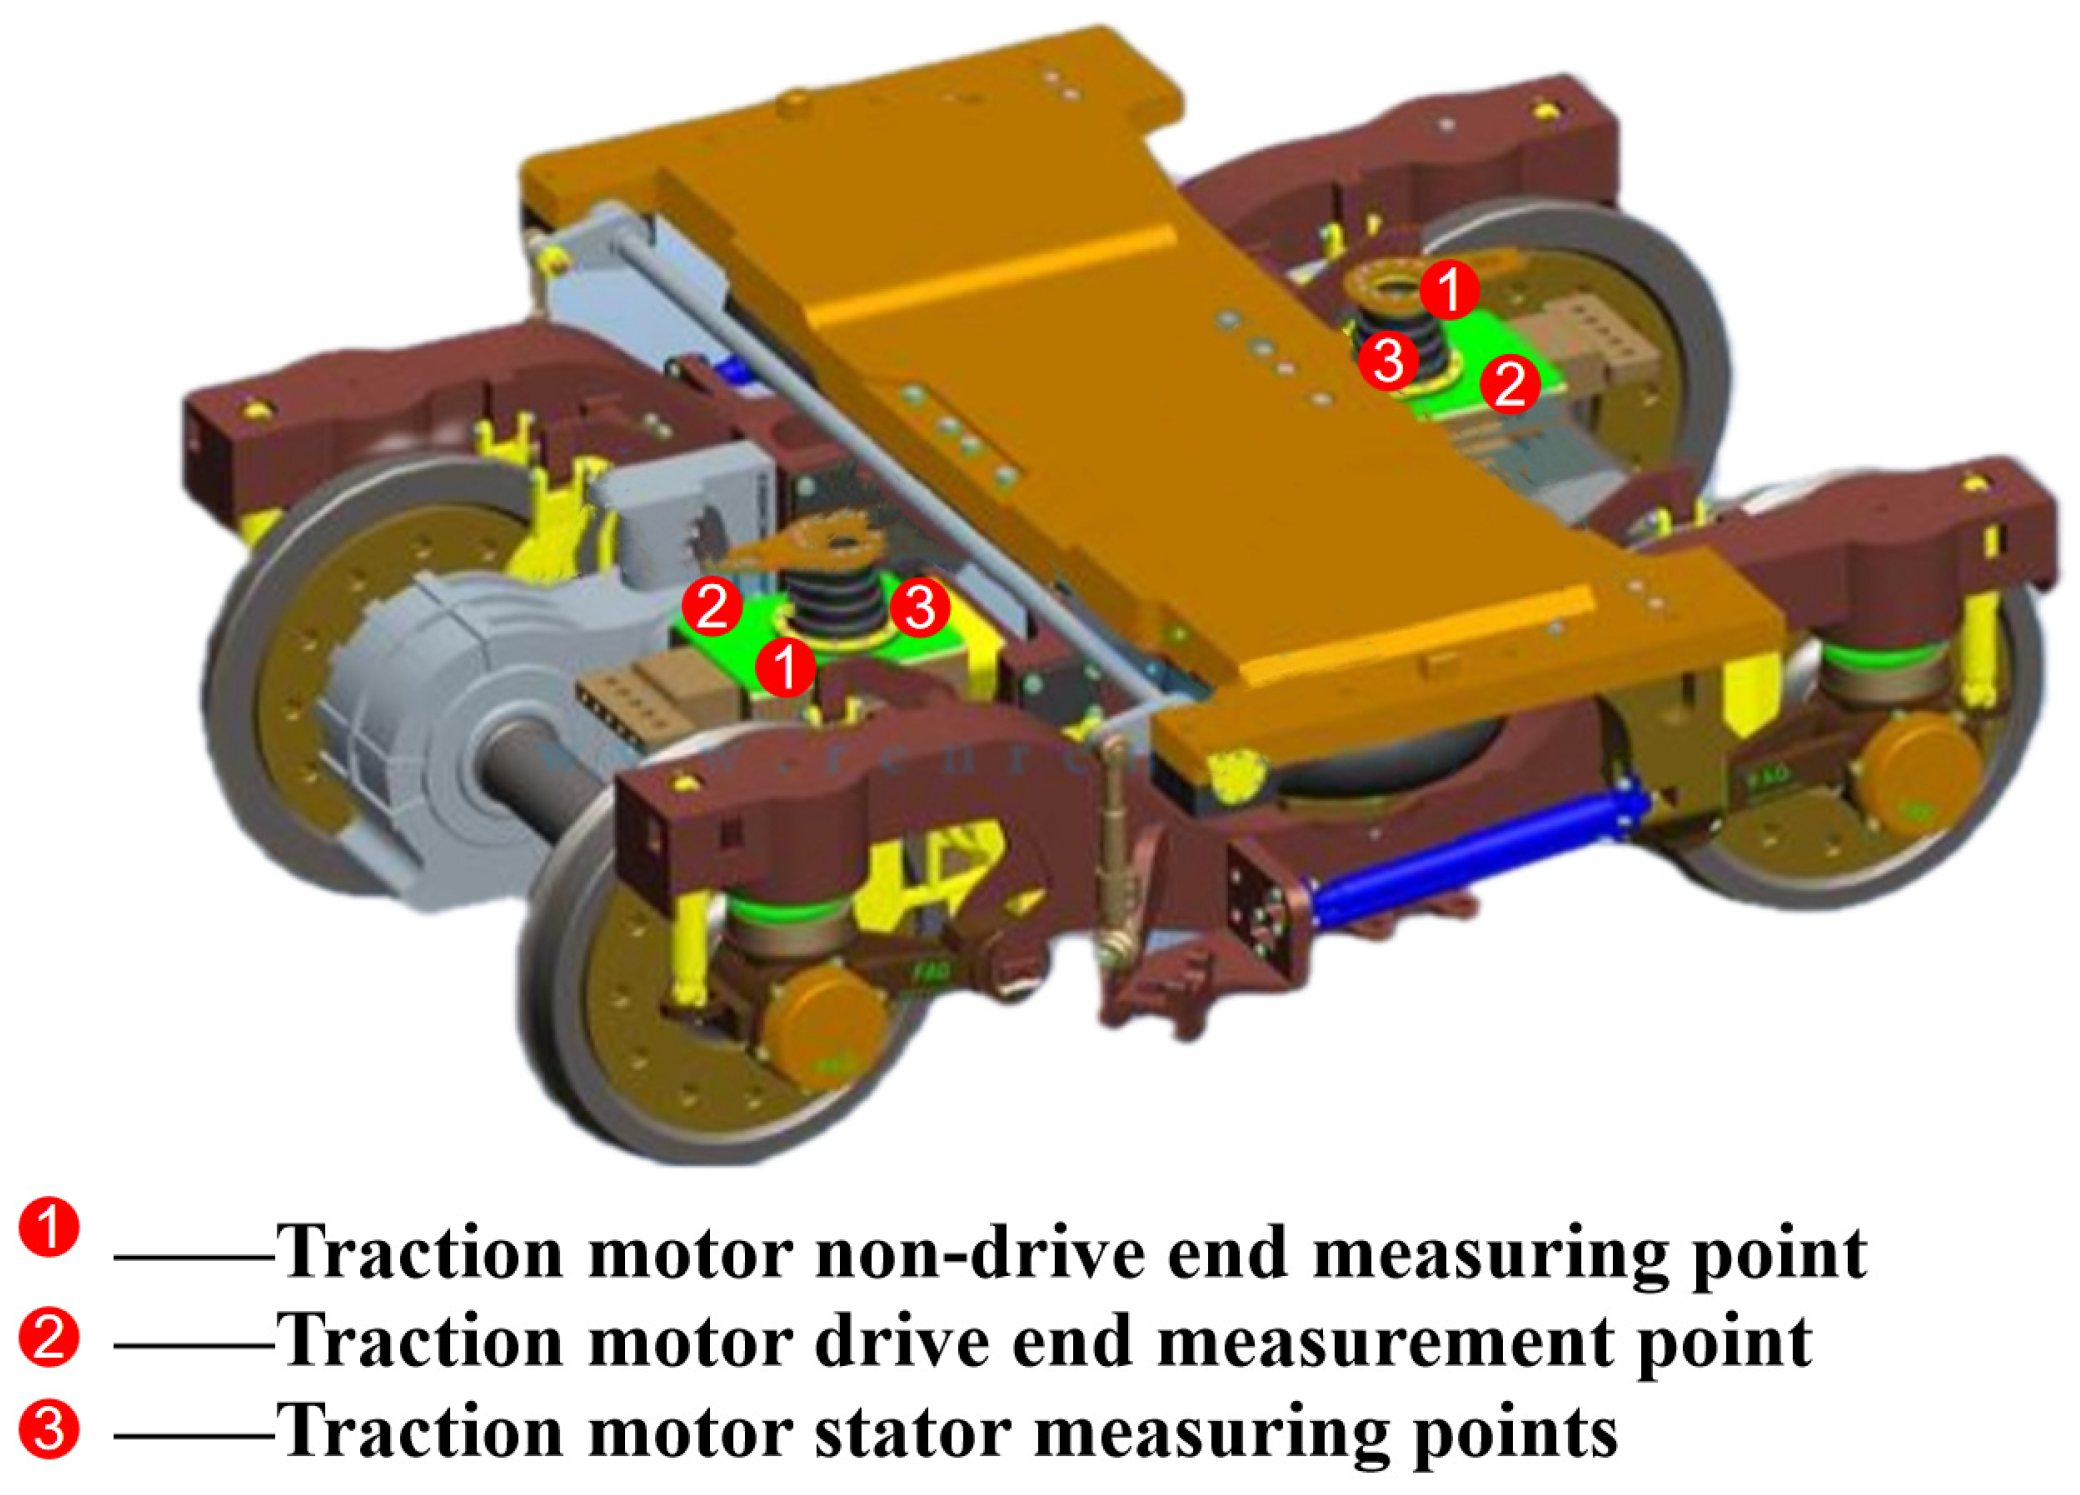
The high-speed train set analyzed in this paper is equipped with a YJ92B/YQ-365 traction motor. The locations of the temperature measurement points on the traction motor are shown in
Figure 5.
The dataset comprises six-dimensional data collected from the eight-carriage high-speed train set. During real-time operation, data are sampled at a rate of 0.2 s per sample. When stored offline in the database, the data are transmitted to the data center at intervals of 1 min per sample. During online operation, data are transmitted to the data center in real time at intervals of 1 s per sample.
Data acquisition primarily relies on various advanced sensor technologies. For high-speed train sets, the number of sensors is substantial, with typical types including temperature, voltage, current, and speed sensors.
In this study, the temperature sensors mainly measure three types of temperature signals from the traction motors and external temperature signals, with units in degrees Celsius (°C). The current sensors primarily record the magnitude of the current passing through the traction motors, with units in amperes (A). The speed sensors primarily capture the train’s velocity, with units in kilometers per hour (km/h). Sensors mounted on high-speed train components collected parameters such as non-drive-end bearing temperature, drive-end bearing temperature, stator temperature, motor current, external ambient temperature, and train speed of the traction motor, which were processed and used in the data format shown in
Table 2. The experiments involved collecting temperature and current signals from all traction motors of the high-speed train set within a single day, as well as the train set’s speed signal and external environmental temperature signal. The sampling interval was 1 min. In total, the dataset comprises sensor signals from 62 days, covering 24 motors from 6 motor carriages (M1–M6). Therefore, a one-day sequence includes a total of 72 (24 × 3)-dimensional motor temperature features, 6 (6 × 1) dimensions of motor current features, 2 (2 × 1) dimensions of external environmental temperature features, and 1 (1 × 1) dimension of the train speed feature.
Table 2 presents a subset of data from August. The dataset used for model training comprises full-day data from August and January over a 62-day period, sampled at 1 min intervals. As the train operates, all dimensional data in
Table 2 continuously fluctuate: speed and current decline sharply as the train approaches a station, while temperature varies gradually.
4.2. Characterization of State Parameters of Traction Motors
Before applying deep learning techniques to learn the parameters, the traction motor state parameter dataset is first subjected to further analysis. By examining the characteristics and correlations of these data, an understanding of the train’s actual operating condition is obtained, and the specific performance and features of the traction motor under various working conditions are identified. Based on this analysis, parameters related to the influencing factors of the traction motor temperature are selected to significantly enhance the accuracy of traction motor condition prediction.
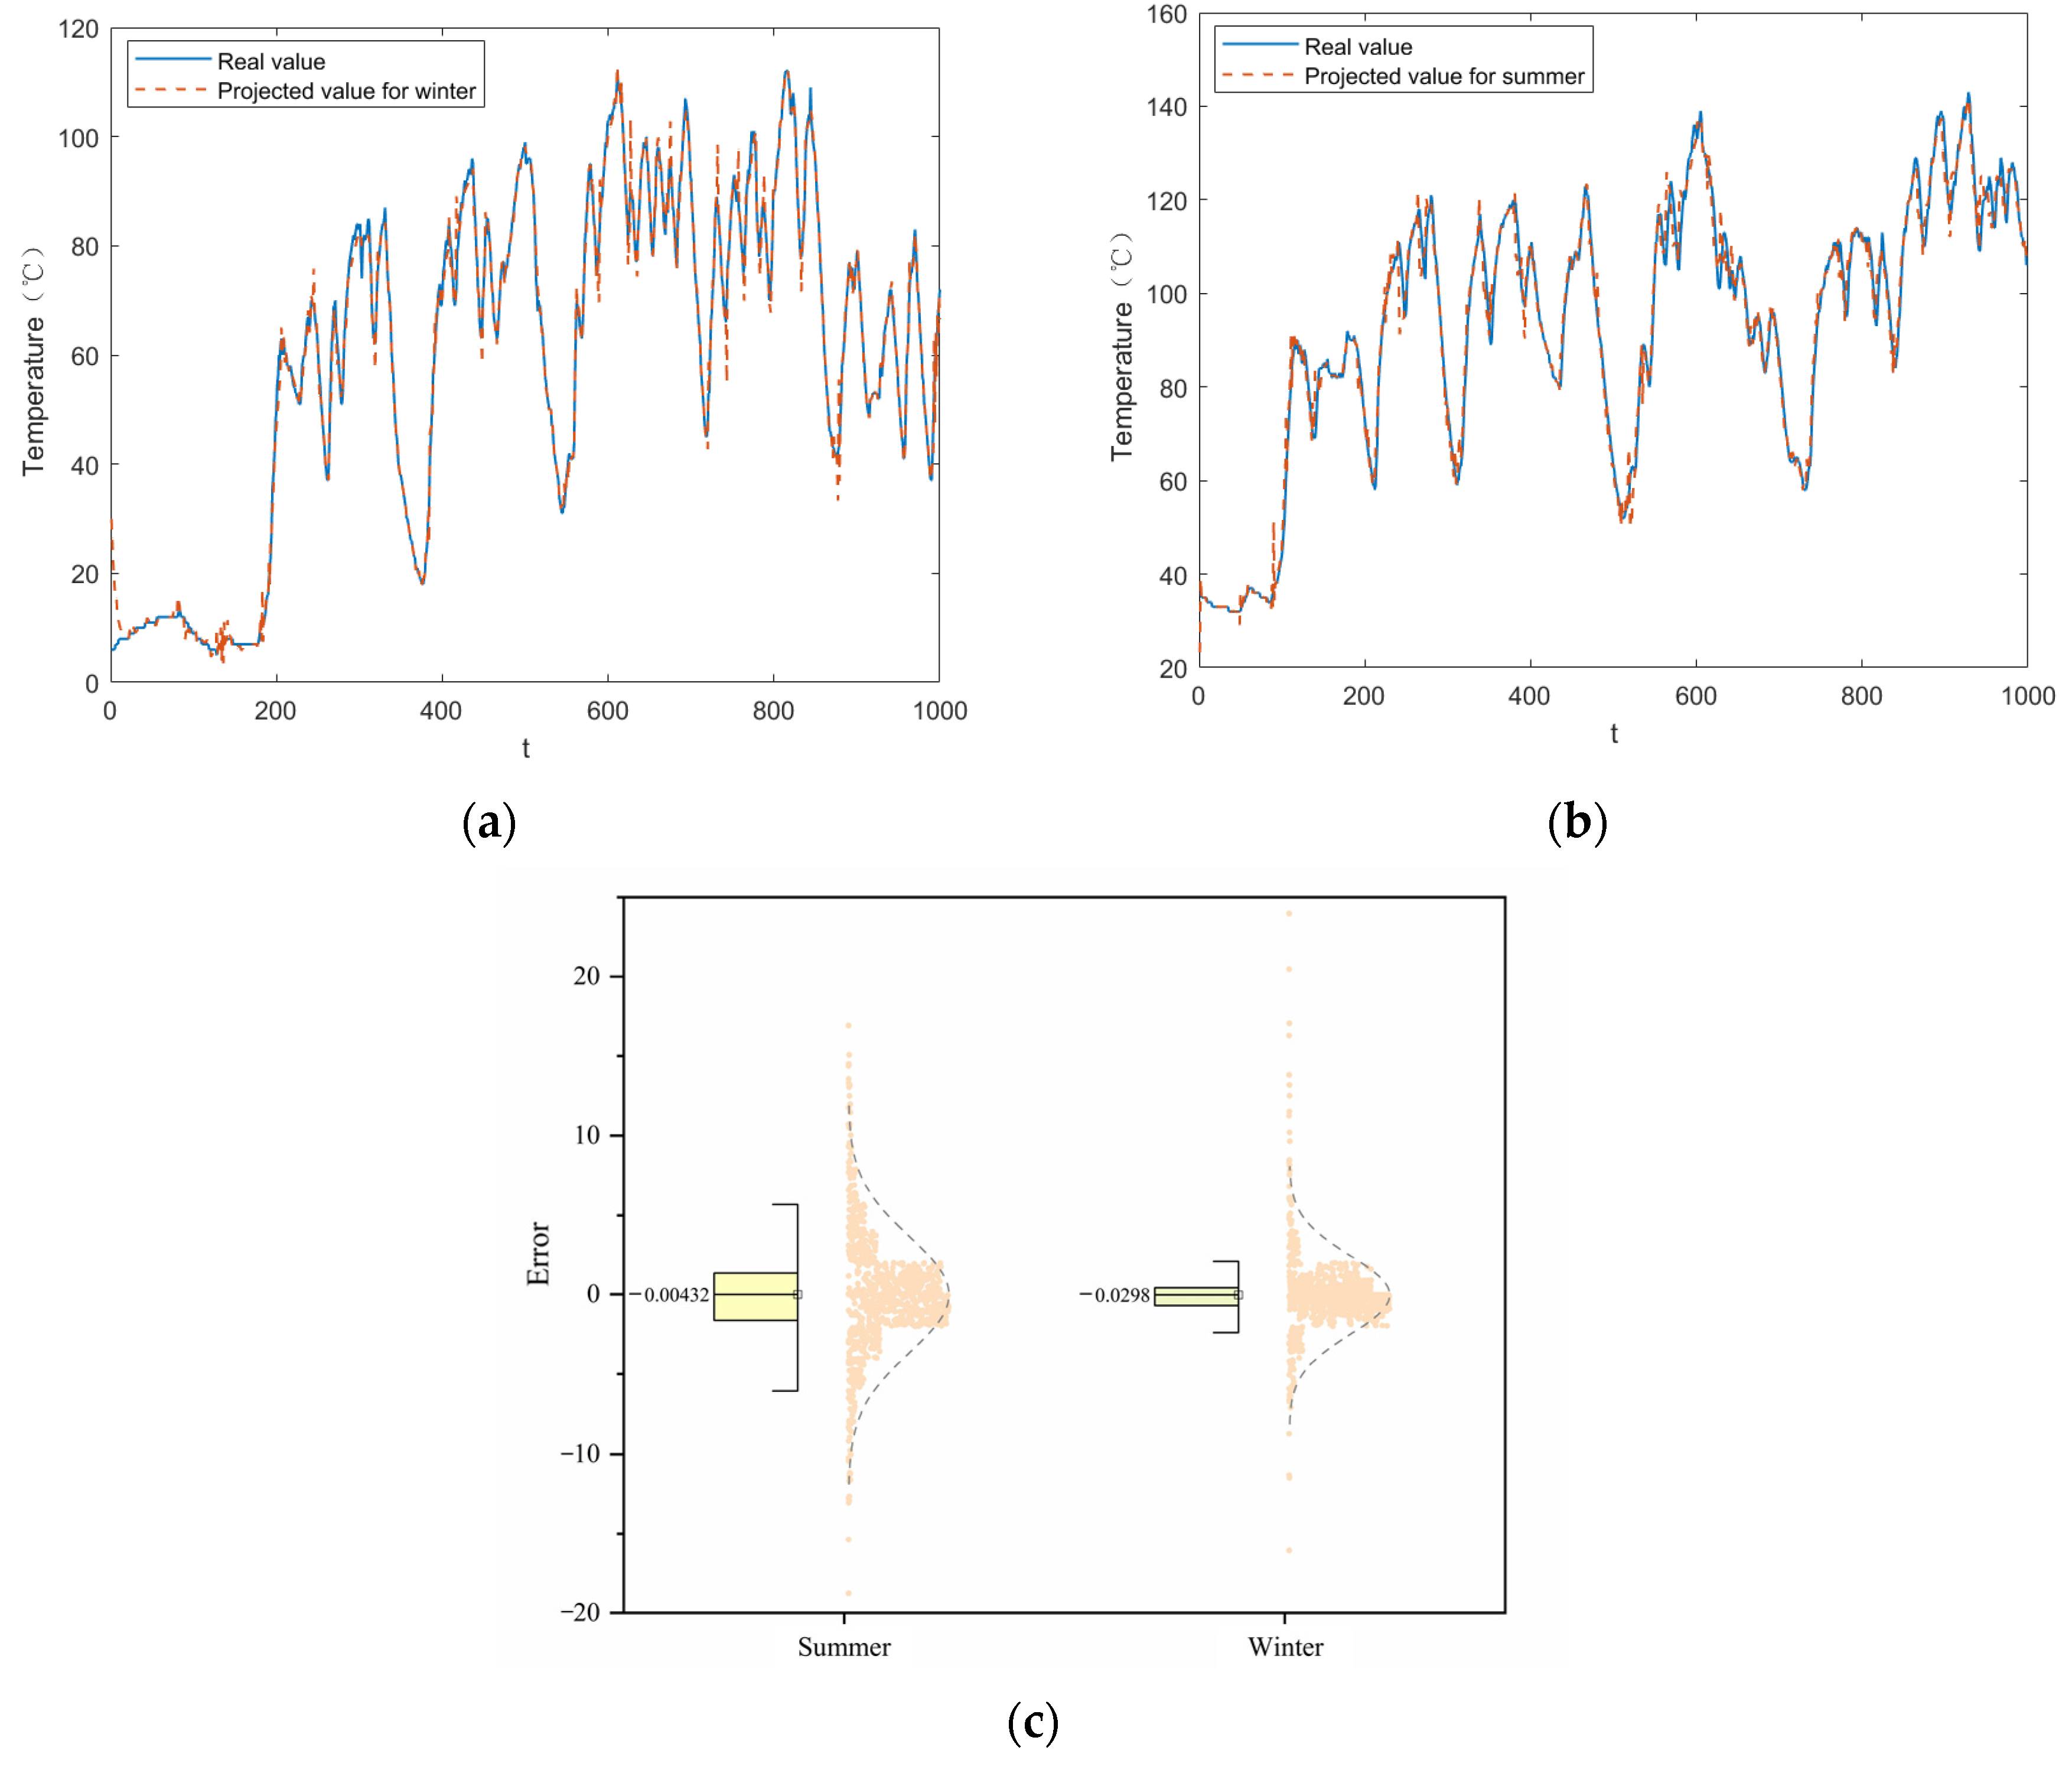
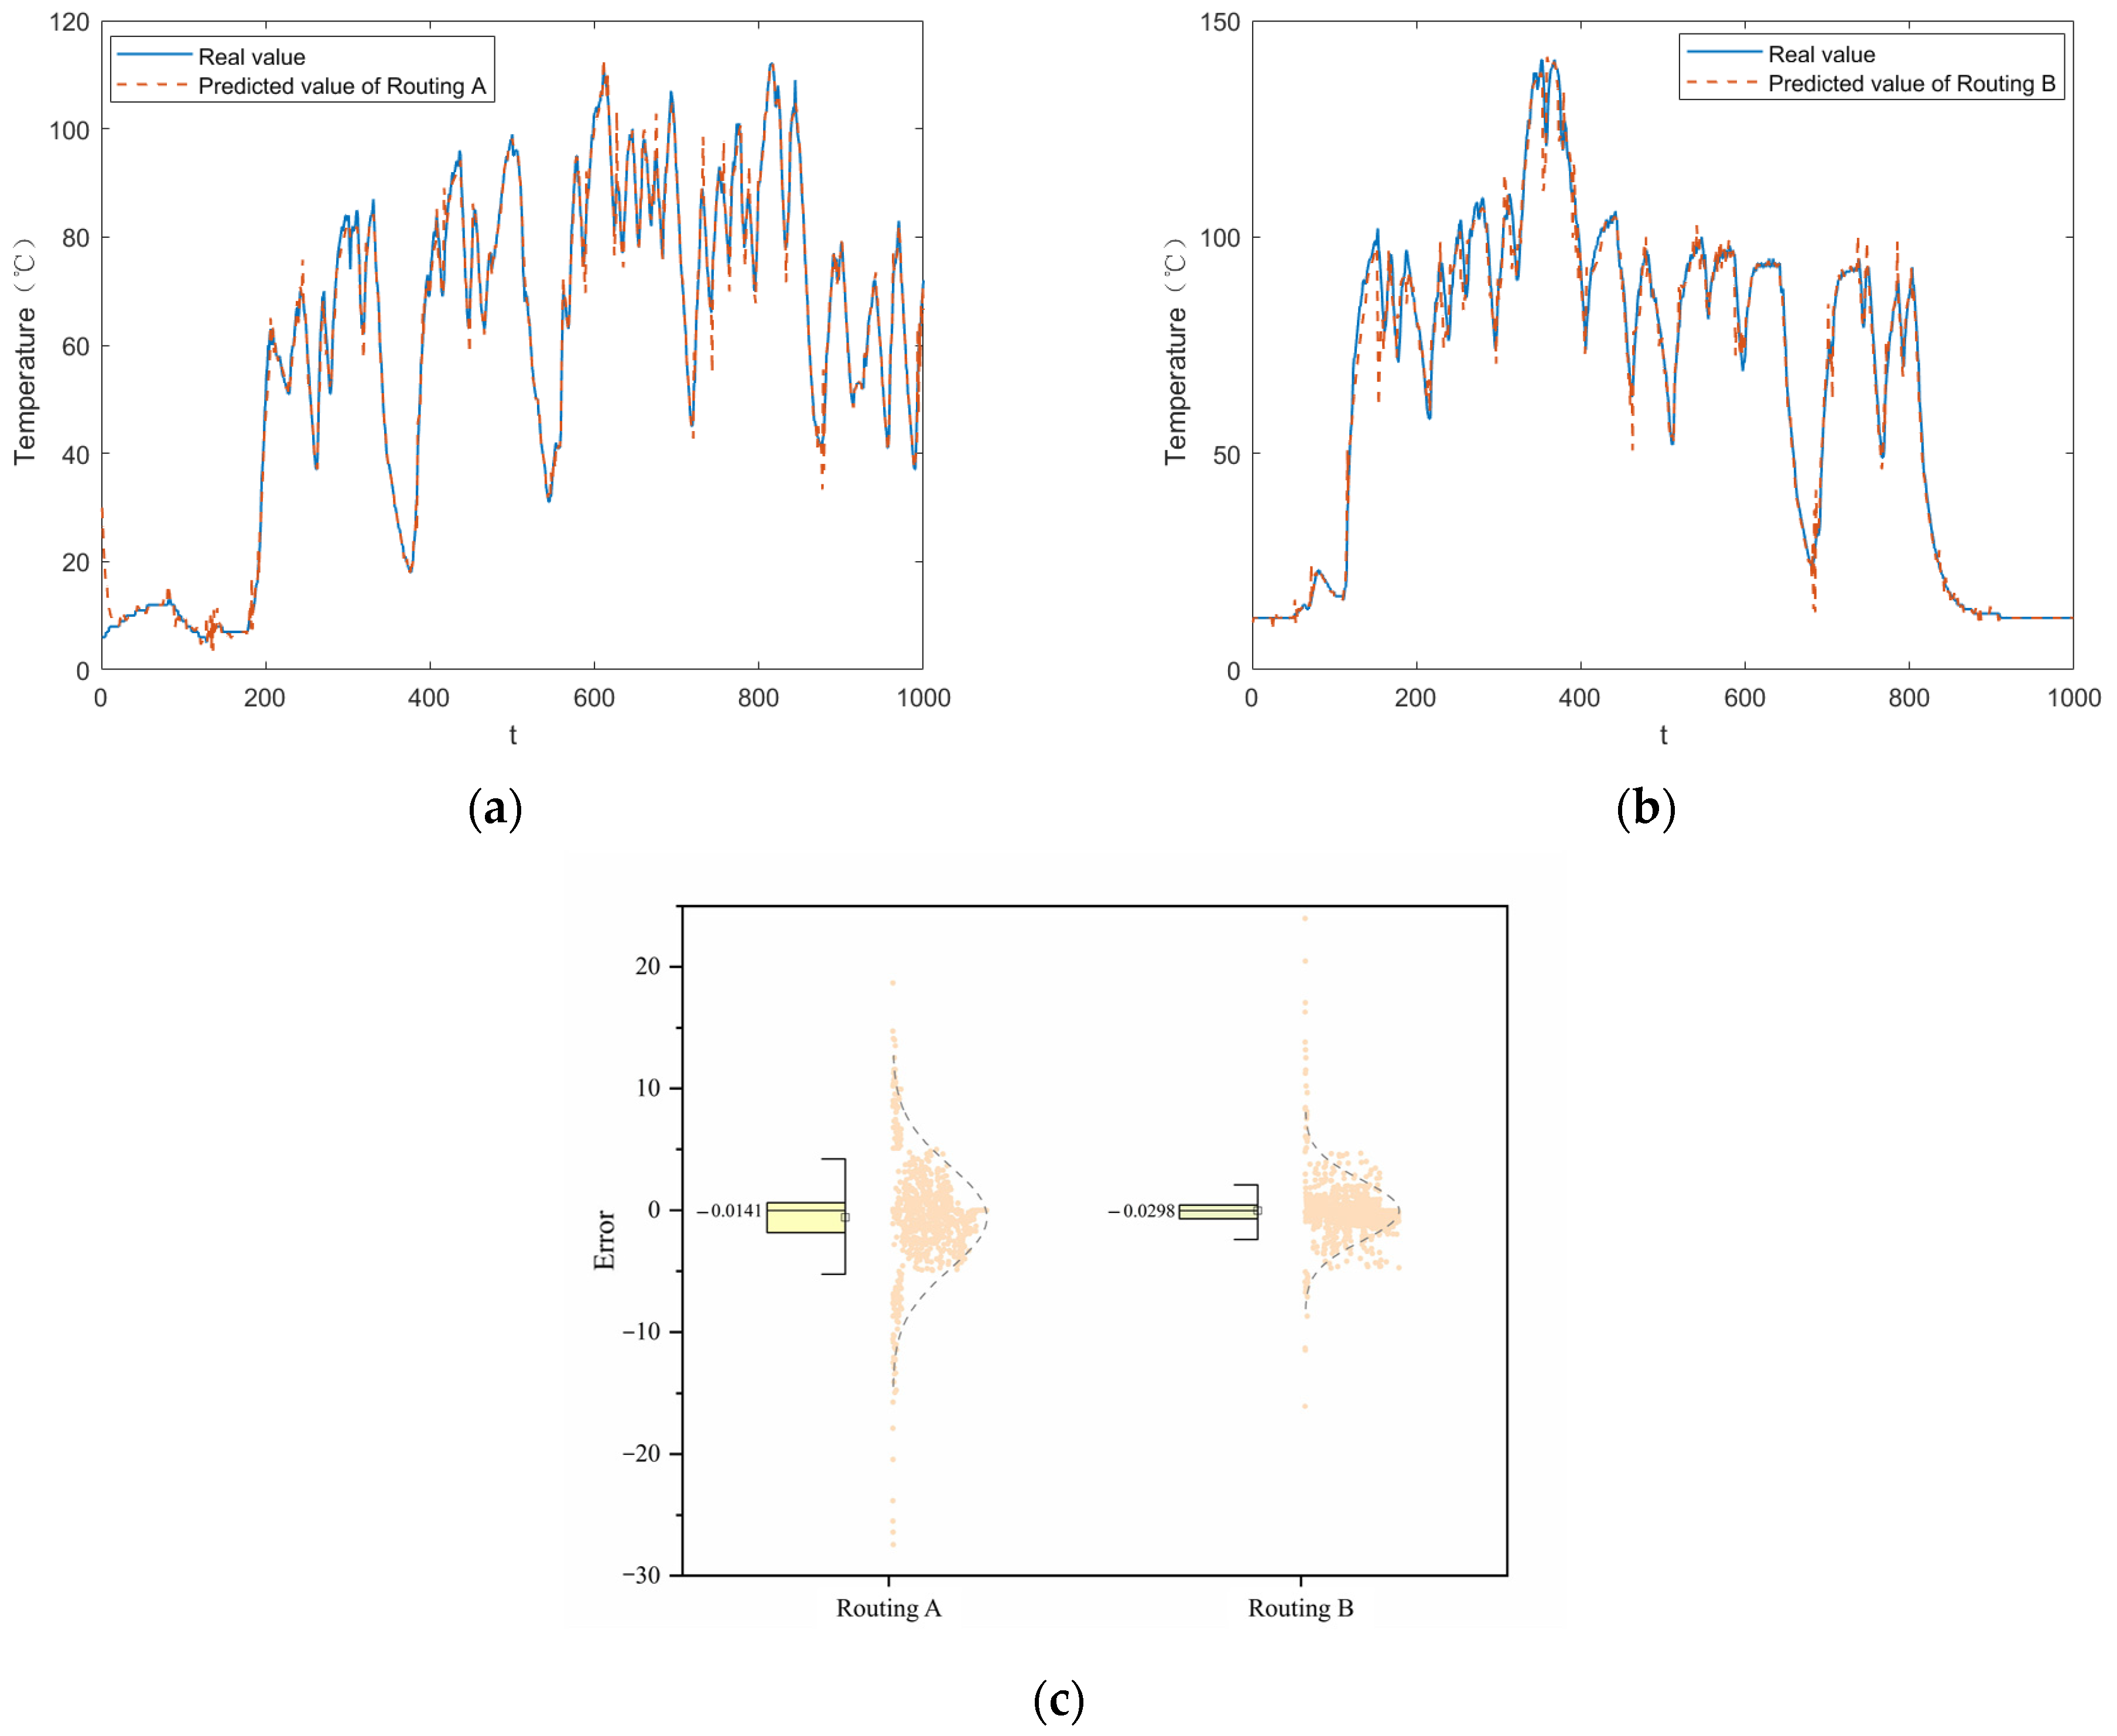
Because of the large temperature variations across different seasons for the same train routing, and because external environmental temperatures also influence the average temperature of the traction motor, these factors affect the prediction model. There are differences among the drive end bearing temperature, non-drive end bearing temperature, and stator temperature of the traction motor. The selection of different output parameters as the model’s target also impacts the effectiveness of the prediction. Moreover, train performance indices may vary across different routings at the same time due to environmental conditions such as humidity and wind, further influencing model accuracy. Therefore, to account for these factors, analyses are conducted on the same index of traction motors across different seasons, different indices of the same rolling stock on the same day, and the indexes of various routings within the same day.
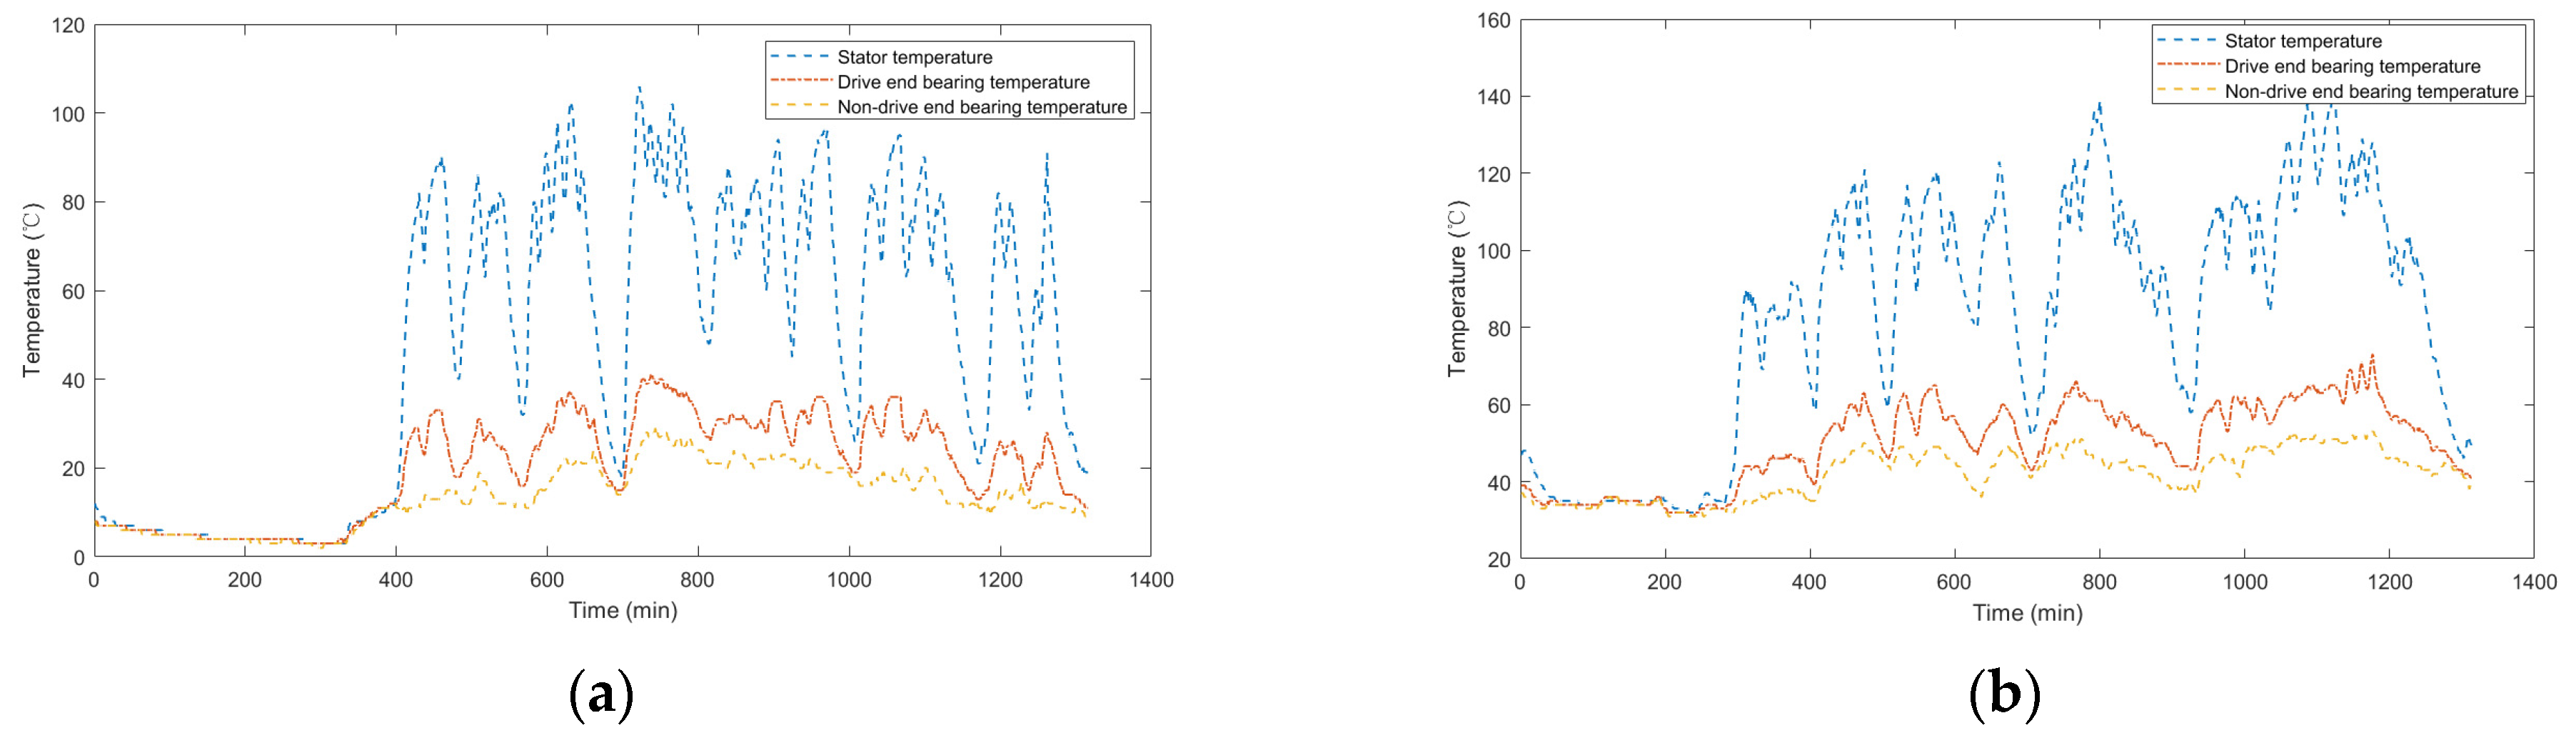
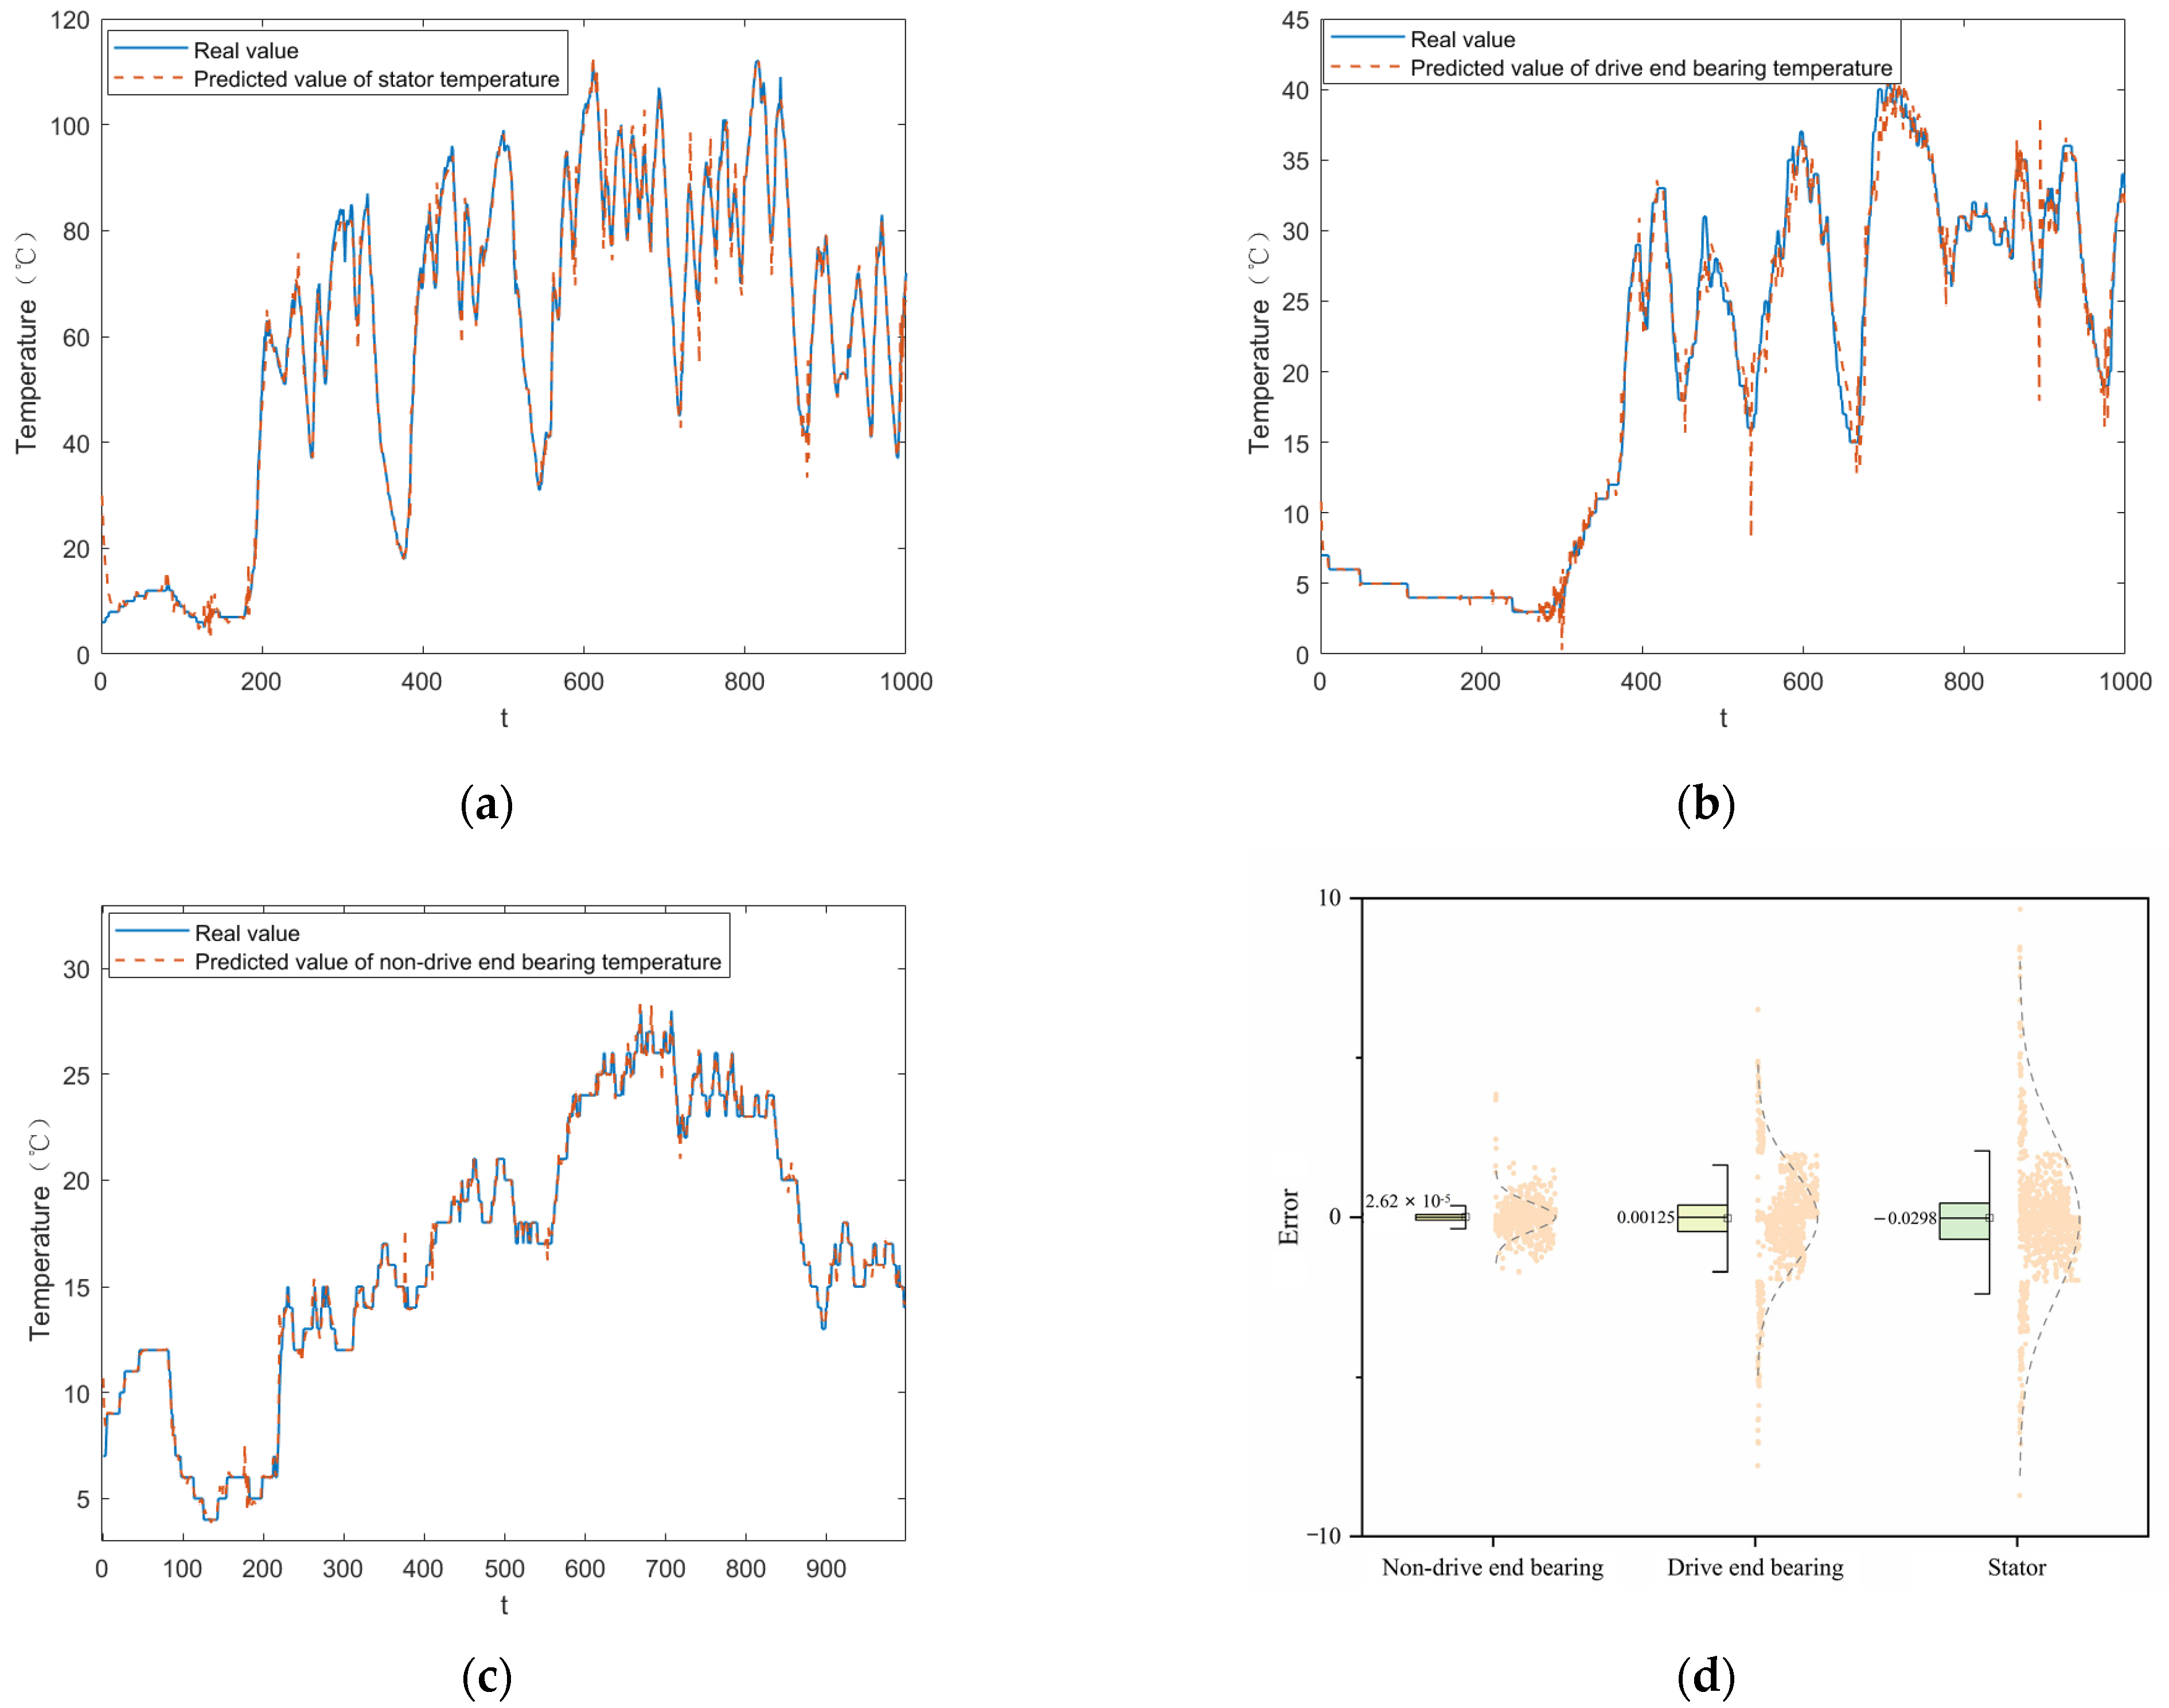
This paper begins with a comparison of various traction motor parameters across different seasons. Typically, during the train’s operation, the stator temperature exceeds the drive end temperature, which is higher than the non-drive end temperature. However, when the train is stationary, the differences among the three temperatures are minimal. Analysis of the temperature parameters for the stator, drive end, and non-drive end bearings reveals that the stator’s temperature exhibits relatively large fluctuations, decreasing most rapidly when the train stops. In August, the average values for the stator, drive end, and non-drive end bearing temperatures were 83 °C, 50 °C, and 42 °C, respectively. Given that high temperatures can easily lead to various abnormalities, this study uses the stator temperature with the highest average temperature among the three as the objective function.
Comparing the same indicator in different seasons in
Figure 6, the results show that the temperature change of the stator, drive end, and non-drive end of the traction motor is not obvious when the train is not started, which is mainly related to the season. When the train starts running, the average temperature at the three measurement points is higher in August than in January due to the ambient temperature. However, during train operation, the average variation of temperature in January is greater than that in August for all the three parameters. The stator, which is inside the motor, is relatively minimized by environmental factors during operation, and its temperature change should have a greater correlation with the train operating speed, while the bearing temperature, which is relatively closer to the outside, is more significantly affected by the ambient temperature. On the same day, different train routings may be due to large differences in ambient temperature, humidity, wind, and differences in operating speeds, resulting in very different temperature averages and trends. Therefore, the specific conditions of the train routings in different seasons should be fully considered in the forecast.
During train operation, the temperature trends of the stator and drive-end bearings are generally similar. However, the temperature trend of the non-drive end differs slightly from the other two measurement points. This variation is likely caused by the fact that the stator and drive-end bearings are more strongly influenced by train operating speed, whereas the non-drive-end bearings are more significantly affected by external environmental factors. Therefore, alarm signals for the stator-end and transmission-end bearings can be more effectively issued by considering the joint trend of both parameters.
6. Conclusions
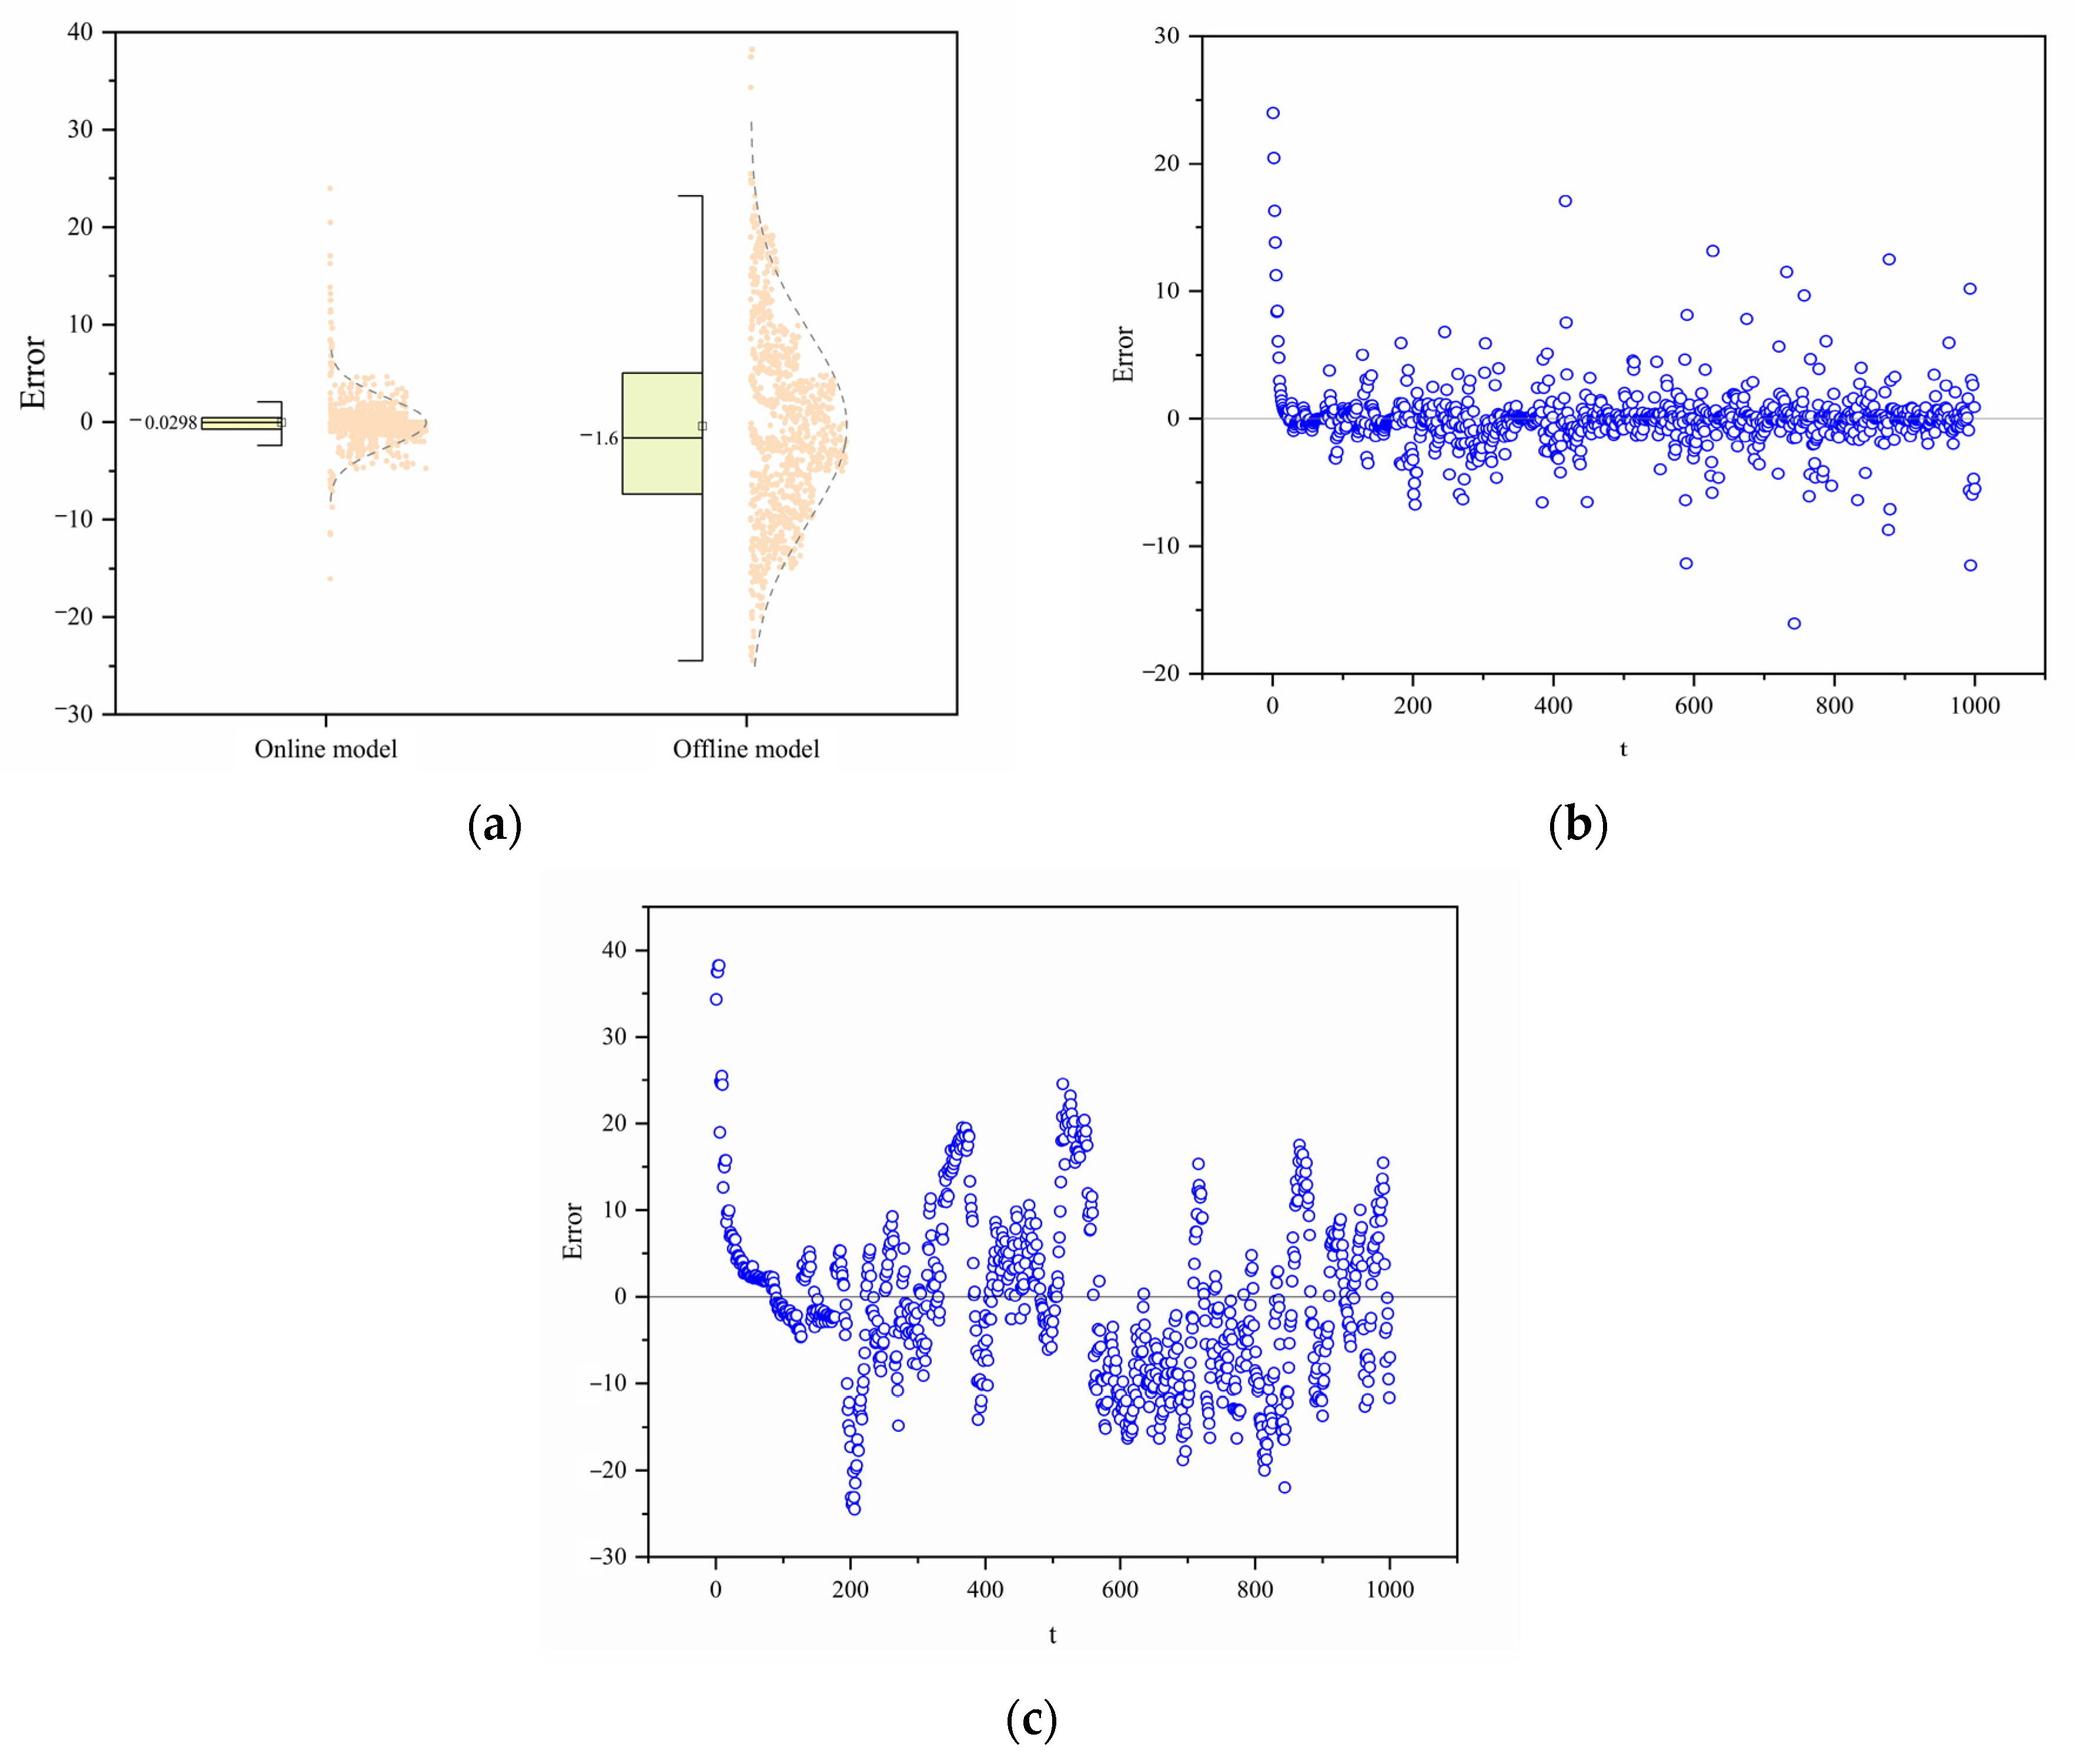
In this paper, an optimized prediction method for the traction motor temperature signal in rolling stock is proposed based on an online gated recurrent neural network. The methodology involves the following steps: collecting multidimensional time-series data via sensors and integrating environmental and operational factors to construct features, with stator temperature selected as the target variable; training a GRU model offline using historical datasets to optimize weight matrices and minimize ; in the online stage, receiving real-time data at 1 min intervals, employing multi-step rolling forecasts for future states, and dynamically updating model parameters periodically with the latest data to balance new knowledge and historical experience. Model accuracy and bias are evaluated using metrics such as and , while the model’s generalization ability is validated across different seasons, routings, and measurement points. Additionally, the computational efficiency of OGRU is compared with other online methods like OLSTM.
This method enables real-time processing of the traction motor temperature signal, allowing the online model to update its parameters and achieve real-time prediction. The approach improves prediction accuracy by approximately 70% compared to the offline method and demonstrates strong adaptability to various traction motor operating scenarios. The model’s adaptability under different working conditions is notable, although the speed of adaptation varies across environments. The offline training component of the model can be further improved to reduce prediction errors. When applied to different monitoring points, it is observed that the prediction performance for the stator temperature, which exhibits significant fluctuations, is slightly inferior to that of other measurement points. Nonetheless, the results remain stable and within acceptable ranges, confirming the model’s applicability across different scenarios and indicating its practical value.
Furthermore, when comparing the present model with OLSTM, the proposed model can reduce computation time by 23.3% or even less as the amount of data increases. Timeliness is critical for online prediction in high-speed train components, the current model essentially meets these timeliness requirements, thereby enhancing predictive maintenance efficiency and contributing to the broader goal of improving the sustainability of high-speed railways.
Future research will focus on exploring the operation mechanisms of trains and motors in greater depth, incorporating more comprehensive data such as vibration signals and historical fault records. This will aim to improve the accuracy of motor status predictions and allow for detailed fault cause analysis.


