Article

Will Participation in Dual Value Chains Promote Manufacturing Upgrades and Green Development?

1
School of Economics and Finance, Xi’an International Studies University, Xi’an 710128, China
2
Global South Economic and Trade Cooperation Research Center, Xi’an 710128, China
3
Institute of Area Studies, Xi’an International Studies University, Xi’an 710128, China
4
Center for Studies on Central Asia and the Caspian Rim, Xi’an International Studies University, Xi’an 710128, China
*
Author to whom correspondence should be addressed.
Sustainability 2025, 17(9), 4234; https://doi.org/10.3390/su17094234
Submission received: 3 March 2025 / Revised: 22 April 2025 / Accepted: 5 May 2025 / Published: 7 May 2025
(This article belongs to the Special Issue Advances in Economic Development and Business Management)

Abstract

The global and domestic divisions of labor have had a great influence on the economy and environment in China during the last decade. With the refinement of production processes, national value chains (NVCs) coexist with global value chains (GVCs), enabling regions to participate in dual value chains (DVCs) simultaneously. This study calculates the NVCs and GVCs participation of manufacturing sectors in China’s provinces. On this basis, this research adopts a fixed effects model to analyze the impact of GVCs and NVCs participation and their interaction effect on manufacturing upgrades and green development. The results show, first, that significant regional differences in GVCs participation exist among provinces in China. In comparison, provincial NVCs participation demonstrates fewer regional differences. Second, there are significant sectoral differences of GVCs participation in China’s manufacturing industry—high-tech manufacturing is more embedded than other manufacturing industries. The sectoral differences in NVCs participation are relatively small. Third, GVCs and NVCs participation and their interaction effect have significantly promoted the upgrading and green development of manufacturing sectors in provinces of China, and this impact exhibits significant heterogeneity across regions, industries, and NVCs participation modes. The conclusions of this study provide empirical evidence and policy recommendations for the upgrading and green development of China’s manufacturing industry.

1. Introduction

Since the reform and opening up, China has relied on its demographic dividend and resource abundance to accumulate a comparative advantage in product processing and assembly when embedded in global value chains (GVCs). However, due to technology limitations, multinational enterprises from developed countries monopolize high-value-adding components, whereas Chinese enterprises remain focused on low-value-adding components, a situation also known as “low-end locking”. On the other hand, under current world economic conditions, China cannot rely solely on foreign markets for sustained growth. It is necessary for China to utilize the domestic market and actively extend its national value chains (NVCs).
GVCs refer to cross-border production networks led by multinational enterprises to realize the value of goods or services, covering the whole process from research and development design, raw material procurement, production and manufacturing, to marketing and recycling. Their core feature is the global layout of production, such as American companies leading the design, China being responsible for manufacturing, and Germany providing precision parts. NVCs are a value chain system based on local market demand and dominated by domestic enterprises, emphasizing inter-regional cooperation and independent innovation. When an enterprise is embedded in both GVCs and NVCs, this study refers to it as participation in dual value chains (DVCs). For example, in the field of new energy vehicles, the Chinese enterprise, Build Your Dream, not only participates in the international battery supply chain (participating GVCs) but also leads domestic vehicle manufacturing (participating NVCs).
It should be noted that some other Asian countries, such as South Korea, have successfully used global value chains and national value chains to upgrade their manufacturing industries. When participating in GVCs, South Korea adopted a technology-led embeddedness approach and supply chain diversification strategy. Specifically, Korea dominates the upper reaches of GVCs through a vertical division of labor system led by large companies, with high-tech industries such as semiconductors, ships, and liquid crystal displays as the core. Production bases were transferred to Vietnam and India, while strengthening technical cooperation with the United States and Germany helped build a “decentralized” supply chain. When participating in NVCs, South Korean large enterprises and small- and medium-sized enterprises adopt a differentiated development strategy: large enterprises lead cutting-edge technology research and development, while small- and medium-sized enterprises transform into specialized and high-value-added firms through government support.
South Korea is also actively adopting an innovative model of joint research and development by government-owned research institutes, universities, and companies. In contrast, China’s manufacturing industry is mostly concentrated in the processing and assembly link in GVCs, facing the problem of “low-end locking”. In recent years, through policy promotion and digital transformation, it has gradually extended to high-value-added links such as research and development design and brand services. When participating in NVCs, Chinese enterprises, based on the domestic market, actively use government-led industrial funds and technology research programs to accelerate core technology breakthroughs and promote the “advanced industrial base and modernization of the industrial chain”.
As a major transition economy, China needs to cultivate core competitiveness with its unique advantages to break through the dilemma of manufacturing upgrading. Can the development of NVCs promote China’s manufacturing upgrading and green development when integrating into global value chains? How will the interaction between global and national value chain participation impact manufacturing upgrading and green development? Are there significant differences between regions and sectors? This study aims to answer these questions.
This study links with two branches of the literature. The first branch is the impact of GVCs and/or NVCs on manufacturing upgrades. Participation in global value chain division can promote industrial upgrading [1,2]. Developing countries can participate in GVCs by undertaking outsourcing and industrial transfer activities in developed countries. When outsourcing and industrial transfer occur, participation in the production of low-end links in the GVCs can enable these developing economies to actively utilize imported advanced technology and capital, leverage the advantages of existing resource endowments, develop labor-intensive industries, and promote rapid economic development. In addition, developing countries can improve the quality of export products and achieve industrial upgrading through “learning by doing” and the spillover effect of knowledge in the GVCs [3,4,5]. However, these studies do not consider the influence of the interaction between GVCs and NVCs.
The second branch is the influence of GVCs and/or NVCs on green development in manufacturing. Copeland and Taylor [6] put forward the “pollution paradise hypothesis”, stating that trade helps to improve the environmental performance in developed countries but deteriorates the environment in developing countries, mainly due to the transfer of polluting industries. Based on the theory of comparative advantage, different scholars have drawn opposite conclusions. Grossman and Kruger [7] believe that free trade will have an negative effect on the environmental performance in low-income countries, because these countries tend to produce pollution-intensive products according to their comparative advantages, and the intensity of environmental regulations is weak. However, Cole et al. [8] point out that developing countries tend to produce labor-intensive products with less environmental burden, so embedding in GVCs can improve environmental quality. Again, these studies do not consider the influence of the interaction of GVCs and NVCs on green development in manufacturing, with the exception of Li et al. [9].
As mentioned above, previous studies mainly analyzed the impact of GVCs participation on manufacturing upgrades and green development and rarely considered the impact of the interaction between GVCs and NVCs participation. However, in reality, enterprises will not only participate in GVCs but also participate in the production division system within a country, and there may be mutual influence between the two. Therefore, this study adopts a fixed effects model of three-dimensional panel data from 16 manufacturing sectors in 30 provinces of China in 2002, 2007 and 2012 to analyze the interaction effect of GVCs and NVCs on manufacturing upgrades and green development, which is the main contribution of this research.
The rest of this article is arranged as follows. Section 2 reviews the literature related to this study. Section 3 measures the indicators of global and national value chain participation within China’s manufacturing industry. Section 4 empirically tests the influence of GVCs and NVCs participation and their interaction effect on China’s manufacturing upgrading and green development. Section 5 concludes and raises some policy recommendations.

2. Literature Review and Theoretical Analysis

2.1. Literature Review

2.1.1. The Measurement of GVCs

The basis of GVCs measurement is the calculation of value added in trade, which originates from research on typically fragmented vertical specialization. Hummels et al. [10] (hereinafter referred to as HIY) define vertical specialization and study vertical specialization trade with cases. With the evolution of GVCs and continuous division of international production, vertical specialization indicators were criticized due to their inability to depict the sources of values in sectors in GVCs or to distinguish the stages of production. Therefore, some scholars use input–output (I-O) analysis to measure indicators of GVCs. In particular, the establishment of a global I-O table greatly facilitated in-depth global value chain research, and researchers propose a method to calculate value-added trade.
The research by Johnson and Noguera [11] provides a formal definition of value-added export (VAX), calculated as the proportion of value-added exports to total exports. Koopman et al. [12] (hereinafter referred to as KWW) stepwise relaxed the assumptions in HIY, decomposing the country’s total exports into national added value absorbed by foreign countries, added value returned home from exports, foreign added value, and recalculated value. On this basis, Wang et al. [13] decomposed total exports into intermediate products, final products, and final absorption and constructed participation indices based on forward and backward GVCs integration, respectively.
In addition to global value chain participation indicators, scholars have also constructed the GVCs status index and upstreamness index to facilitate trade analysis and policymaking. From the perspective of decomposing total trade volume, Koopman et al. [14] (hereinafter referred to as KPWW) proposed an indicator to measure GVCs. Following KPWW, Antràs et al. [15] proposed a concept of industry upstreamness, which measures the relative position of an industry in the upstream or downstream of global production by measuring the average distance between output and final consumption. Some other recent studies include Wang et al. [16], Delera et al. [17], Agostino et al. [18], Reddy et al. [19], Boschma [20], Agostino et al. [21], Benkovskis et al. [22] and Del Prete et al. [23].

2.1.2. NVCs Research

Extant studies mainly focus on GVCs, and some scholars have begun to explore the value chain network structure within the country, matching NVCs to GVCs. Hioki et al. [24] use Minimal Flow Analysis to analyze the structural changes in the input–output linkage between China’s regions from 1987 to 1997. It was found that some major changes in China’s inter-regional linkage structure were related to the rising degrees of self-sufficiency in many regions. Adopting the concept of value-added trade, Meng et al. [25] remeasured the inter-industry and inter-regional linkages of China’s NVCs. Seung [26] decomposed the total domestic export value of seafood in eight regions of South Korea and examined the distribution along domestic value chains in different regions as well as the changes in spatial distribution over time.
Chen et al. [27] found the following: (1) inter-provincial trade in intermediate inputs increased; (2) the fragmentation of inter-provincial production of different products; (3) replacing foreign intermediates with domestic products resulted in increased domestic export value. Using the network analysis tool, Wang et al. [28] analyzed the industrial structure of China. The community detection method was used to identify the growth-driven provincial clusters. Influential provincial departments are ranked based on weighted PageRank scores. The results reveal some compelling insights. The level of inter-provincial economic activities increases rapidly, but it is not as fast as that of intra-provincial economic activities. The regional community structure is closely related to geographical factors. Some other recent studies include He et al. [29], Yang and Kou [30], Keijser et al. [31], Fedyunina et al. [32] and Sun et al. [33].

2.1.3. GVCs/NVCs Participation and Industrial Upgrading

This section first reviews the studies that aim at the successful experience of other Asian economies (e.g., Vietnam, Malaysia and South Korea) that have transitioned from low-end to high-end manufacturing. Nguyen et al. [34] believed that the role of leading enterprises, competitive advantages and institutional factors are key factors for Vietnamese small- and medium-sized enterprises to participate in global value chains and upgrade. Dahlan et al. [35] found that Malaysian companies in the aviation industry were moving up the GVCs by manufacturing higher-value-added products or more important components. The study of Lee et al. [36] focused on the local component requirements (LCRs) and the GVCs participation models in industrial policy and compared and analyzed the development paths of the automotive industry in Malaysia, Thailand, China and South Korea. Although the LCRs policy has achieved some success in improving the localization rate of the three countries, its final development results show significant differences. The evaluation of the three core indicators of GVCs upgrade—the proportion of domestic/foreign value added in exports, export orientation and international competitiveness of intermediate goods—shows that China performs best in the two indicators, followed by Thailand with its export-oriented advantages, and Malaysia’s GVCs upgrade is relatively lagging behind.
As for the effect of GVCs or NVCs participation on China’s industrial upgrading, Kong et al. [3] examined the effect of GVCs on technological upgrading in China’s semiconductor industry, and an empirical study showed that trade positively affected technological capabilities. With data of China’s new technology enterprises, Jer [4] found that international trade and quality advantages promoted functional upgrades. Los et al. [37] suggested that China had gradually climbed upstream in the global value chains. Sun and Grimes [5] found that China’s information and communication technology (ICT) participation in GVCs was deepening, which was related to product structure modularization, the globalization of production, and manufacturing outsourcing. Although corporations in China were growing fast, most companies were still “locked” in low-value-added components due to their reliance on foreign technology and intellectual property rights. Zhang [38] analyzed the influence of digitalization on upgrading and specific transmission routes of the manufacturing value chain and proposed appropriate countermeasures. Some other recent studies include Xu et al. [39], Li et al. [40] and Liu et al. [41].
The existing literature suggests that digitization and automation may affect the effect of DVCs participation on manufacturing upgrades. Digital technology helps to enhance the modularity of the value chain, enabling traditional industries to achieve inter-regional collaboration by way of offshoring and ultimately promoting production efficiency and manufacturing upgrades [42]. Feng et al. [43] pointed out that digital transformation is an opportunity for developing country companies to move up the GVCs. Based on the data of Chinese listed companies, they found that digital transformation has significantly improved the position of Chinese manufacturing enterprises in the GVCs. Based on China’s provincial panel data, Li et al. [44] found that GVCs positively moderate the impact of the digital economy on manufacturing upgrades. Digital platforms can precisely match products or services to potential customer groups through data correlation and pattern recognition, helping to achieve personalized marketing and product positioning and promoting global market segmentation.
The research of Antràs [45] showed that the digital economy can enhance global exchanges and collaboration by promoting the optimization of supply and demand matching and promote the promotion of the division of labor in GVCs. In contrast, some scholars believe that the digital economy restricts the promotion of GVCs. For example, Artuc et al. [46] showed that, driven by the digital economy, the substitution of industrial intelligence for labor will lead to the contraction of some international trade, which is not conducive to the promotion of GVCs. The rational adoption of artificial intelligence, such as automation and intelligence, can replace some standardized labor tasks, create new labor jobs and industries, and contribute to improvements in productivity, thus helping to promote the evolution of GVCs [47].
The existing policies may also affect the effect of DVCs participation on manufacturing upgrades. Lebdioui [48] found that industrial policy facilitated Malaysia’s oil, rubber and palm oil industries to move up in the GVCs. The reason is that there are lots of barriers to joint development in developing countries, which proves the necessity of industrial policy. Rand et al. [49] found that Myanmar’s policy reforms have failed to achieve economic and environmental upgrades to the timber value chain. Kissi and Herzig [50] found that governance factors such as production and procurement policies influence process upgrading in Ghana’s cocoa value chain, while governance factors such as controlling resources and bargaining power are the reasons for product upgrading.

2.1.4. GVCs/NVCs Participation and Green Development

This part is related to studies concerning the effects of trade openness on the environment. In recent years, with the rise of GVCs research, scholars have studied the influence of GVCs and NVCs participation on the environment. Grossman and Krueger [7] classified the environmental effects of trade into scale effects, structural effects and technological effects, proposing that the total effect depends on the aggregate of these three effects. Ahmed and Long [51] and Lau et al. [52] found that the structural effect of GVCs participation was negative. In comparison, the scale and technology effects were positive, and the aggregate effect was negative.
Calculating the GVCs participation and carbon dioxide emissions at the country and industry levels for 12 Regional Comprehensive Economic Partnership (RCEP) countries from 2000 to 2017, Qian et al. [53] analyzed the influence of GVCs on carbon dioxide emissions through scale, structure and technology effects. The results showed that, at the country level, increased forward participation in GVCs reduced carbon dioxide emissions, while increased backward participation led to higher carbon dioxide emissions. Li et al. [9] quantified the environmental impact of China’s international trade through value chain specialization. Instead of focusing on promoting participation in global value chains, they sought to expand their scope to include NVCs. They found that improving NVCs position increased regional green economy performance index (GEPI), while the participation of GVCs and NVCs inhibited GEPI. Some other recent studies include Huang and Zhang [54], Zheng et al. [55], Wu et al. [56], Ali et al. [57], Yan et al. [58] and Espinosa-Gracia et al. [59].

2.1.5. A Summary

A review of the literature suggests that, firstly, to measure NVCs participation, the earliest studies mainly adopted the vertical specialization index proposed by HIY, which cannot demonstrate the input–output linkage between regions. Stemming from HIY, the method raised by KWW can better show the I-O linkage between regions and calculate the derivative indicators of value chains. Therefore, this research used the KWW method to measure NVCs participation.
Secondly, to measure the GVCs participation, most previous studies adopted a macro-estimation method based on non-competitive I-O tables. Predicated on I-O tables, this method is usable at industry level only but inapplicable to more detailed research on enterprise-level heterogeneity and value-added trade. This research adopted the improved method by Upward et al. [60] to measure the GVCs participation of Chinese manufacturing enterprises at the corporate level as the first step. Then, the GVCs participation at the provincial/industry level was obtained by taking the mean values of provinces and industries, increasing the accuracy of GVCs participation measurement.
Thirdly, previous studies mainly analyzed the influence of GVCs on manufacturing upgrades and green development, while largely neglecting NVCs participation. However, enterprises participate not only in the GVCs division of the labor network but also in the domestic production division system of a country. Furthermore, there may be mutual influence between the two networks. Therefore, this study simultaneously analyzed the influence of enterprise GVCs and NVCs participation and their interaction effect on manufacturing upgrades and green development, a key supplement to the extant literature in this field.

2.2. Theoretical Analysis

2.2.1. The Interaction Effect of GVCs and NVCs Participation on Manufacturing Upgrading

In recent decades, China has played more of a processing trade role in the globalized division of labor. Embedding GVCs is conducive to domestic enterprises to learn international advanced technology and management experience, and the construction of a sound domestic value chain means the strengthening of the closeness of various industries in various regions, which improves the free flow of production factors and is also conducive to the spread and diffusion of technology and management experience. Therefore, embedding NVCs enhances the technology spillover effect embedded in GVCs.
On the basis of giving full play to the “learning by doing” effect, enterprises participating in GVCs can improve their own technology absorption capacity through production–learning–research and development and other models, so as to improve production efficiency and technological progress and lay the foundation for promoting industrial upgrading. In NVCs, the product production process progresses through the organic combination of inter-regional inflow and outflow trade, so that capital, knowledge, information technology, and other advanced production factors can fully interact with different regions of the country along the value chain.
Hypothesis H1: 
The interaction effect of GVCs and NVCs participation can promote the upgrading of the manufacturing industry.

2.2.2. The Interaction Effect of GVCs and NVCs Participation on Green Development in Manufacturing

The interaction effect of GVCs and NVCs participation on green development is uncertain. On the one hand, the construction of a sound NVCs facilitates breaking the barriers between domestic provinces and making overall use of various resources in the domestic market, thereby contributing to the expansion of economies of scale, which, in turn, enhances the scale effect of embedded GVCs on green development. On the other hand, embedding NVCs may also crowd out market space and production resources, which is not conducive to the economies of scale formed by embedding GVCs, therefore inhibiting the scale effect of embedding GVCs on green development.
Therefore, hypothesis H2 is assumed: the interaction effect of GVCs and NVCs participation on green development is uncertain.

3. GVCs and NVCs Participation Measurement

3.1. Measurement Methods

To measure NVCs participation, the early literature mainly used the vertical specialization index proposed by HIY to calculate the NVCs participation at the regional or provincial level. This method mainly used data of inter-provincial transfer in and out and import/export from the I-O table of a single region, which can, to some extent, show the economic dependence of the region on other regions. However, it cannot calculate the region’s status in the value chains and, therefore, fails to show the I-O linkage between regions. Stemming from HIY, the KWW method uses input–output tables to decompose value-added outflows into multiple parts and measure the participation in the value chains of each region or department. This method can better show the I-O linkage between regions and calculate the derivative indicators of the value chains. Therefore, this study used the method to measure NVCs participation.
The basis of the KWW method is the inter-regional input–output (IRIO) table. Presenting the I-O table with the matrix, Equation (1) can be expressed as:
X 1 X m = A 11 A 1 m A m 1 A m m X 1 X m + q = 1 m F 1 q + E 1 + R 1 q = 1 m F m q + E m + R m
In Equation (1), X p ( p = 1 , , m ) stands for the total output vector of province p with n × 1 dimensions. The direct consumption coefficient matrix of the I-O table is denoted as A with dimensions of m n × m n . A p q ( p , q = 1 , , m ) is the direct consumption coefficient matrix of province q on province p with dimensions n × n . F p q ( p = 1 , , m ) stands for the final usage vector of province q from province p with dimensions of n × 1 . E p ( p = 1 , , m ) is the export vector of province p with dimensions n × 1 . R p ( p = 1 , , m ) is the equilibrium vector of province p with dimension n × 1 .
After rearrangement, Equation (2) can be obtained:
X 1 X m = I A 11 A 1 m A m 1 I A m m q = 1 m F 1 q + E 1 + R 1 q = 1 m F m q + E m + R m = B 11 B 1 m B m 1 B m m Y 1 Y m
In Equation (2), Y p = q = 1 m F p q + E p + R p , ( p = 1,2 , , m ) represents the final sum used and its vector, and B p q ( p , q = 1,2 , , m ) is the block matrix of the Leontief inverse matrix B = ( I A ) 1 of the direct consumption coefficient matrix A with dimensions of n × n . It is the total output to be increased in region p per unit increase in final demand in region q .
Next, by expanding the total output X p and the final use Y p by region, Equation (3) can be obtained, where X p q is the total output of province p used for province q , and Y p q is the final use by province q from province p .
X 11 X 1 m X m 1 X m m = B 11 B 1 m B m 1 B m m Y 11 Y 1 m Y m 1 Y m m
We define the value-added matrix of V as in Equation (4), where V p ( p = 1,2 , , m ) is the diagonalized matrix of the value-added vectors for each sector in province p , with dimensions of n × n . Consequently, the dimensions of V are m n × m n .
V = V 1 0 0 V m
By left-multiplying the total output matrix by the value-added matrix, the value-added output matrix is as shown in Equation (5):
V X = V 1 q = 1 m B 1 q Y q 1 V 1 q = 1 m B 1 q Y q m V m q = 1 m B m q Y q 1 V m q = 1 m B m q Y q m
In Equation (5), the elements on the diagonal represent the added value generated by the province that is absorbed by the province itself. For example, V 1 q = 1 m B 1 q Y q 1 indicates added value created by province 1 that is absorbed by itself. The elements on the off-diagonal represent the added value created by this province that flows out to another province. For example, V 1 q = 1 m B 1 q Y q m represents the outflow of the added value created by province 1 to province m . The added value outflow from province p to province q is recorded as V T p q , and the total added value outflow from province p can be recorded as V T p * . The two can be expressed as Equations (6) and (7).
V T p q = V p g = 1 m B p g Y g q
V T p * = V p q = 1 , q p m g = 1 m B p g Y g q
Based on how the added value flows out, Equation (7) can be further decomposed into Equation (8).
V T p * = V p q = 1 , q p m B p p Y p q + V p q = 1 , q p m B p q Y q q + V p q = 1 , q p m g = 1 , g p , q m B p q Y g q
The total outflow of value added from a province can be expressed as Equation (9), including outflows in the forms of intermediate and final products.
E p * = q = 1 , q p m E p q = q = 1 , q p m ( A p q X q + Y p q )
Considering the many levels of indirect consumption between provinces, it is necessary to multiply the added value matrix of the complete consumption coefficient on the left side of Equation (9) to decompose the added value. The complete added value coefficient matrix is shown in Equation (10), and the decomposition results are shown in Equation (11).
u = q = 1 m V q B p q
u E p * = V p B p p E p * + q = 1 , q p m V q B p q E p *
Equation (11) decomposes the total added value outflow of province p into two parts. The first part is the total added value created to satisfy the outflow of province p from itself, and the second part is the added value created to satisfy the outflow of province p from another province. By calculating and sorting out the first part of Equation (11), the final decomposition results can be obtained:
u E p * = V p q = 1 , q p m B p p Y p q + V p q = 1 , q p m B p q Y q q + V p q = 1 , q p m g = 1 , g p , q m B p q Y g q + V p q = 1 , q p m B p q Y p q + V p q = 1 , q p m B p q A q q ( I A p p ) 1 Y p p + V p q = 1 , q p m B p q A p q ( I A p p ) 1 E p * + q = 1 , q p m g = 1 , g p m V q B p q Y p g + q = 1 , q p m g = 1 , g p m V q B p q A p g ( I A g g ) 1 Y g g + q = 1 , q p m g = 1 , g p m V q B p q A p g ( I A g g ) 1 E g *
It can be seen from Equation (12) that the added value output caused by outflows from a province is decomposed into nine parts. The first three items of Equation (12), i.e., the content in the first parentheses, represent the added value outflow of the province. The third item represents the indirect added value outflow, because it is the province’s added value outflow processed through a second province, which then flows into a third province. This part of the added value is recorded as I V .
The fourth and fifth items of Equation (12), i.e., the content in the second parentheses, represent the added value that flows out of the province in the form of intermediate products but eventually flows back to the province. Specifically, the fourth item represents the value added that flows out to another province in the form of intermediate products and, after being processed in another province, returned to this province as the added value of final products. The fifth item is the added value that flows out to another province and, after being processed in another province, returned to this province as intermediate products. Then, it is processed into final products used by this province. As the rebate part of total added value, these two items do not indicate the value chain relationship between one province and the others.
The seventh and eighth items in Equation (12), i.e., the contents in the third parentheses, represent the added value from another province that is included in the outflow from this province and is recorded as F V . Specifically, the seventh item represents the added value of another province in the final product that is included in the outflow from this province, and the eighth item is the added value of another province.
The sixth item is a duplicate item of added value flowing out of this province, and the ninth item is a duplicate item of added value of another province flowing out of this province in the form of intermediate products. These two items were excluded from further calculation. Based on the above decomposition, this research constructs the national value chain participation index N V C as follows:
N V C p i = I V p i X p i + F V p i X p i
In Equation (13), N V C p i represents the national value chain participation of sector i in province p . X p i is the total outflow. I V p i is the indirect outflow of added value, i.e., this part of added value flows out from this province to another province in the form of intermediate products, which are then processed into final products and flow into a third province for final consumption. F V p i represents the part of added value from another province that is included in the outflow by sector i in province p . This part of the outflow of added value needs to be created by another province, and the calculation methods for I V p i and F V p i are explained above.
According the types of NVCs participation, NVCs participation can be decomposed into forward linkage-based NVCs participation ( N V C _ f ) and backward linkage-based NVCs participation ( N V C _ b ). The first term on the right-hand side of Equation (13) is the forward linkage-based NVCs participation by sector i in province p , as shown in Equation (14):
N V C _ f p i = I V p i X p i
This index represents the proportion of indirect outflow of added value to the total outflow from a certain sector in a certain province. The second term on the right-hand side of Equation (13) represents the backward linkage-based NVCs participation, as shown in Equation (15):
N V C _ b p i = F V p i X p i
This index represents the proportion of added value of another province included in the outflow added value of a certain sector in a certain province, showing the degree of dependence of this province’s sectoral outflow on other provinces.
When calculating the NVCs participation of a province or a sector, it can be achieved according to Equations (16) and (17), where N V C p represents the NVCs participation of province p , and N V C i represents the NVCs participation of sector i . m and n are the number of provinces and sectors in the I-O table.
N V C p = i = 1 n I V p i i = 1 n X p i + i = 1 n F V p i i = 1 n X p i
N V C i = p = 1 m I V p i p = 1 m X p i + p = 1 m F V p i p = 1 m X p i
Concerning GVCs participation, the measurement of GVCs participation can be summarized into two major approaches according to data type. The first is a macro-estimation method based on a non-competitive I-O table. This approach is represented by the HIY method and the KWW method. The second approach is a micro-calculation method based on the Chinese enterprise data [60]. With the availability of China’s enterprise-level customs trade data, it becomes possible to directly estimate the foreign value-added rate (FVAR) of enterprise exports at the micro level. Because the first measurement approach for GVCs participation is mainly based on input–output tables, the analysis can only be conducted at the industry level and cannot satisfy the more detailed research on enterprise-level heterogeneity and value-added trade.
This study first used the second approach to measure corporate GVCs participation and then obtained GVCs participation at province-industry levels with the mean values of provinces and industries. Specifically, the calculation method of Upward et al. [60] was improved as follows. First, the intermediate input assumption was improved. Upward et al. [60] believed that all imports would be used for intermediate inputs including imports by general trading enterprises. This may not be rigorous because, for general trading enterprises, imports were used not only as intermediate inputs but also for domestic sales. Therefore, this study adjusted the product code from HS to BEC to exclude imported products used as capital goods (K) and consumer goods (C) and then obtained the part that was really used for intermediate inputs and marked as M m o .
Second, the indirect import problem was solved. Considering that “excessively exporting enterprises” and “excessively importing enterprises” might convolute the measurement of foreign added value, the existence of intermediary traders would lead to the underestimation of foreign added value in enterprise exports. Therefore, this study identified and excluded “excessively exporting enterprises” and “excessively importing enterprises”. Then, by using keywords, such as economy, trade, import and export, to further eliminate intermediate traders in the data, we obtained the actual values of foreign added value V A F , processing trade imports M A p , and general trade imports M A m o . The latter two values were calculated as shown in Equations (18) and (19):
M A p = k M k p 1 m k
M A m o = j M m j o 1 m j
Specifically, k is the product imported through processing trade, and j is the intermediate input imported through general trade. In addition, m k is the share of accumulated imports of intermediate traders in total imports. Assuming the share of indirect import through intermediate trade in the total amount of a product’s imports by other enterprises is equal to m k , then Equations (18) and (19), respectively, estimate the actual processing trade import volume and the actual general trade intermediate input import volume.
The third improvement was the issue of domestic inputs containing non-domestic components. Koopman et al. [12] believed that domestic intermediate inputs that enterprises obtain through purchases may contain 5–10% overseas content. This study assumed that the share was 5%, i.e., the domestic intermediate inputs of enterprises contained 5% foreign added value.
The improved formula for measuring enterprise value chains participation is:
F V A R = V A F X = M A p + X o [ M A m o / ( D + X o ) ] + 0.05 M T M A p [ M A m o / ( D + X o ) ] X
Specifically, FVAR stands for the foreign value-added rate of exports, i.e., the enterprise’s GVCs participation. D is the domestic sales of the enterprise. M , X and V A F represent the added value of the enterprise’s import, export, and actual export, respectively. M T stands for the enterprise’s amount of intermediate investment. Finally, the GVCs participation at the regional-industry level was obtained by taking the mean values of provinces and industries.

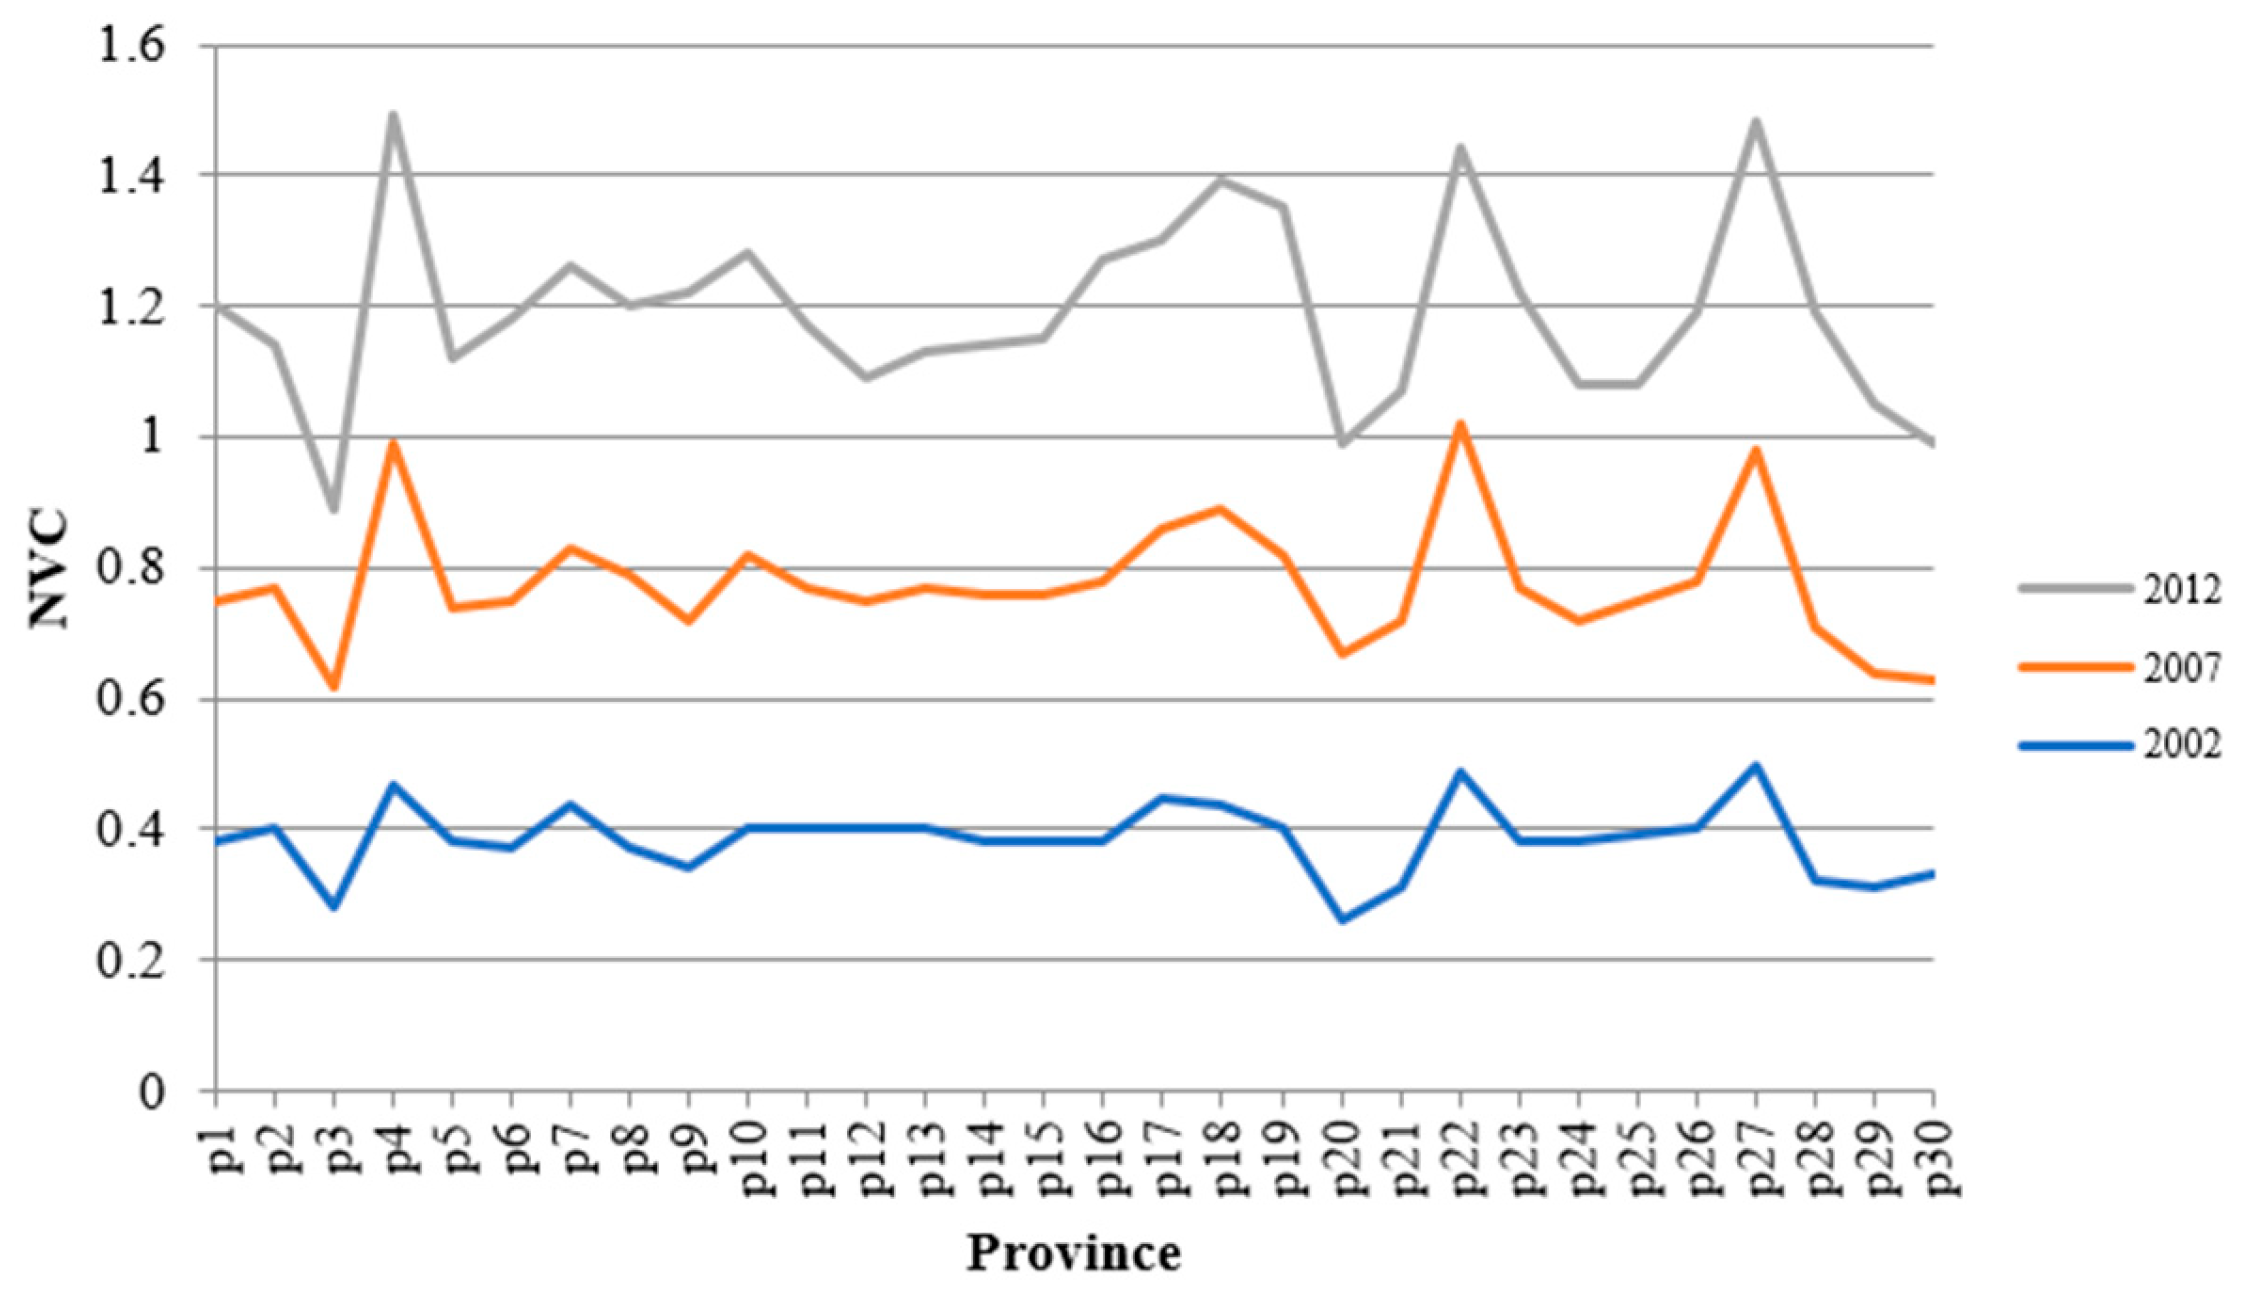
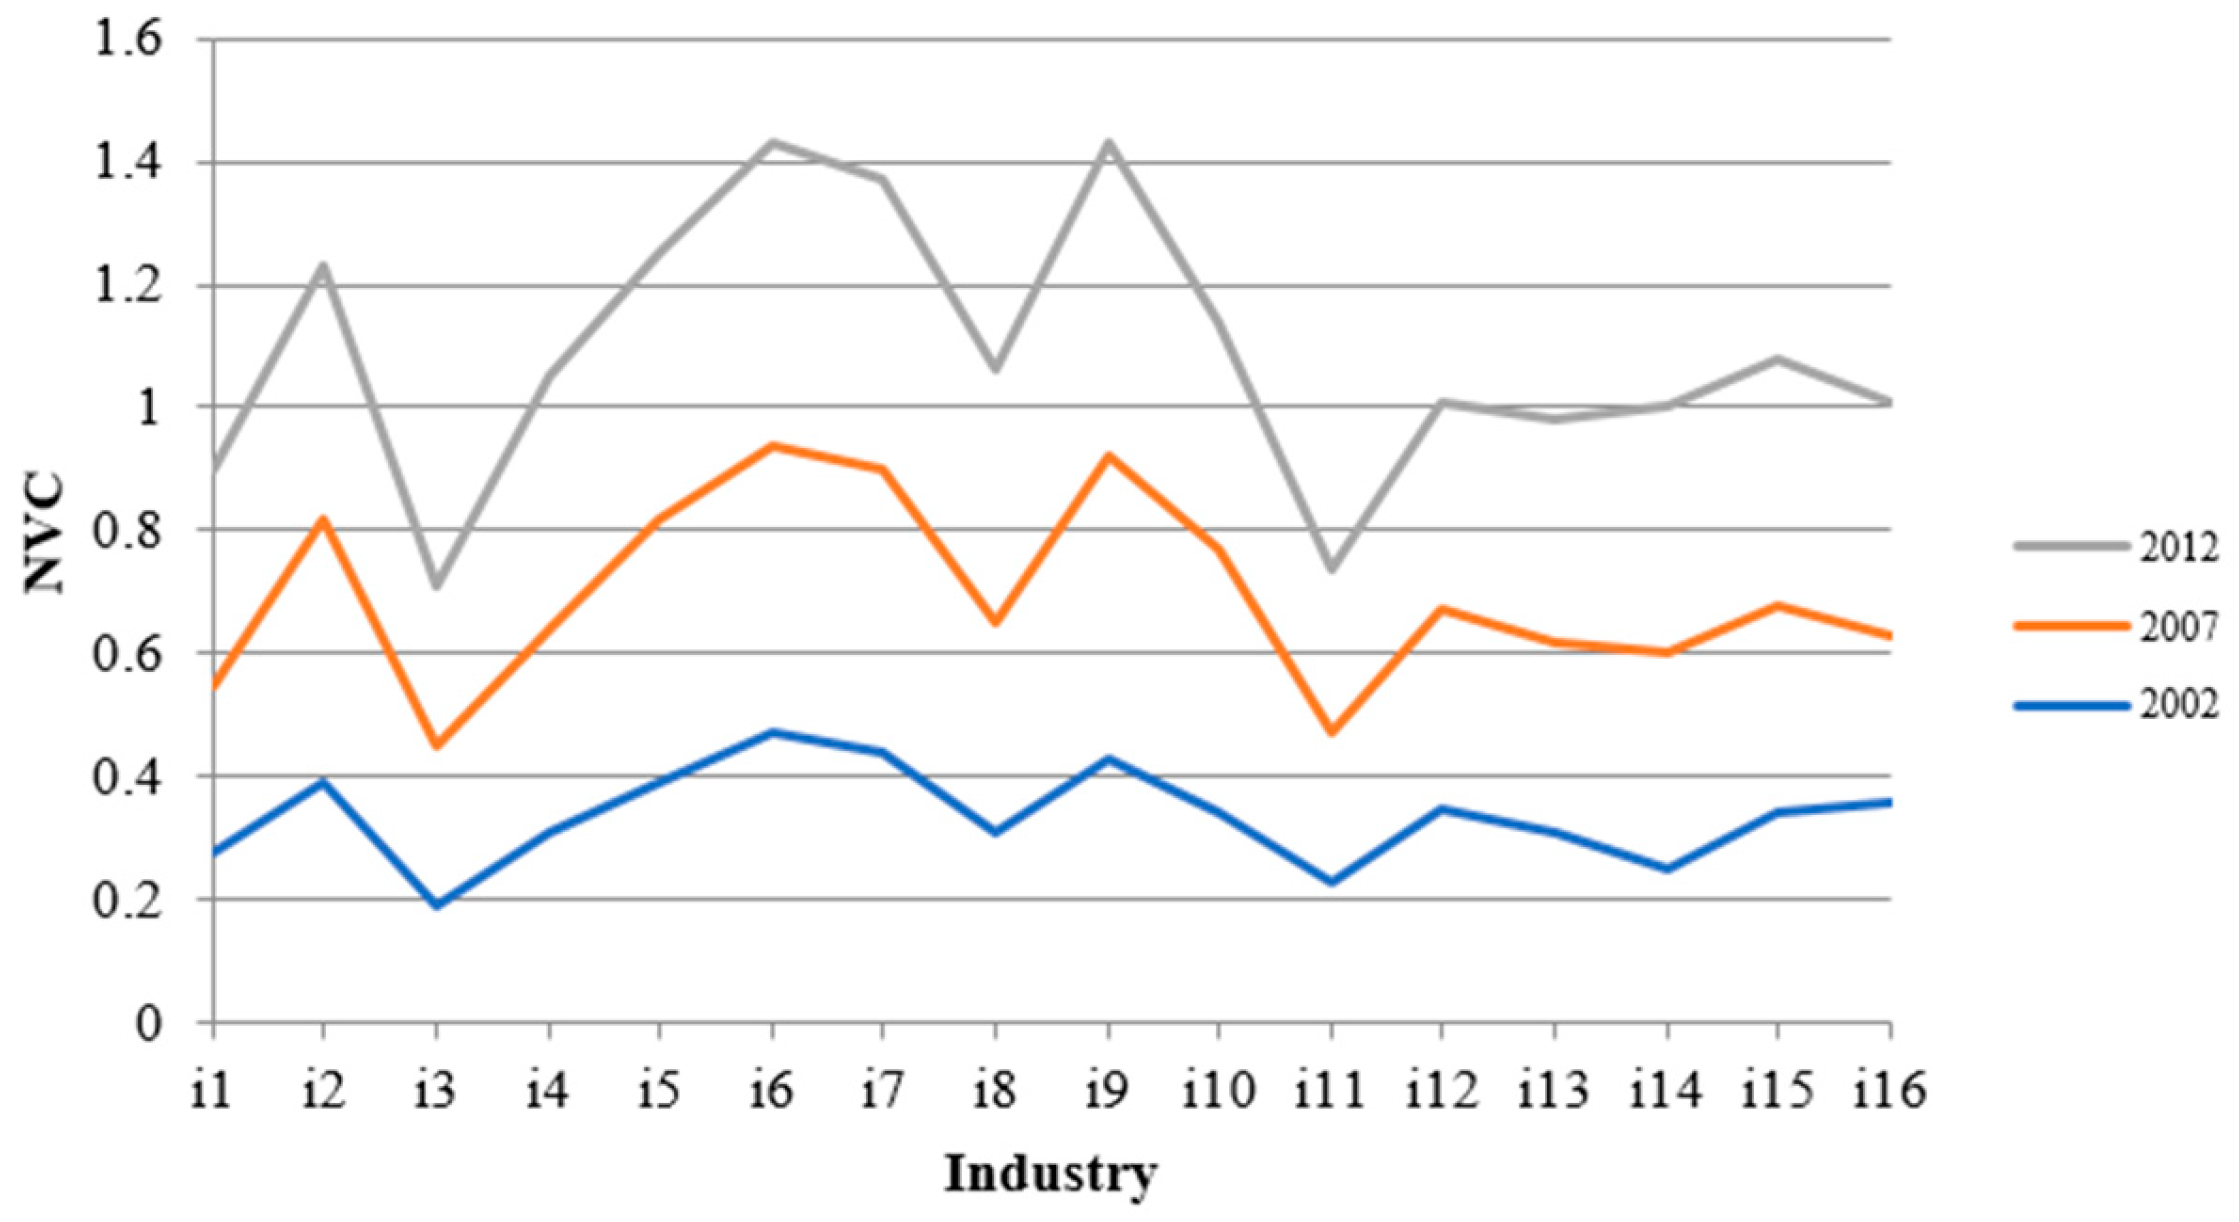
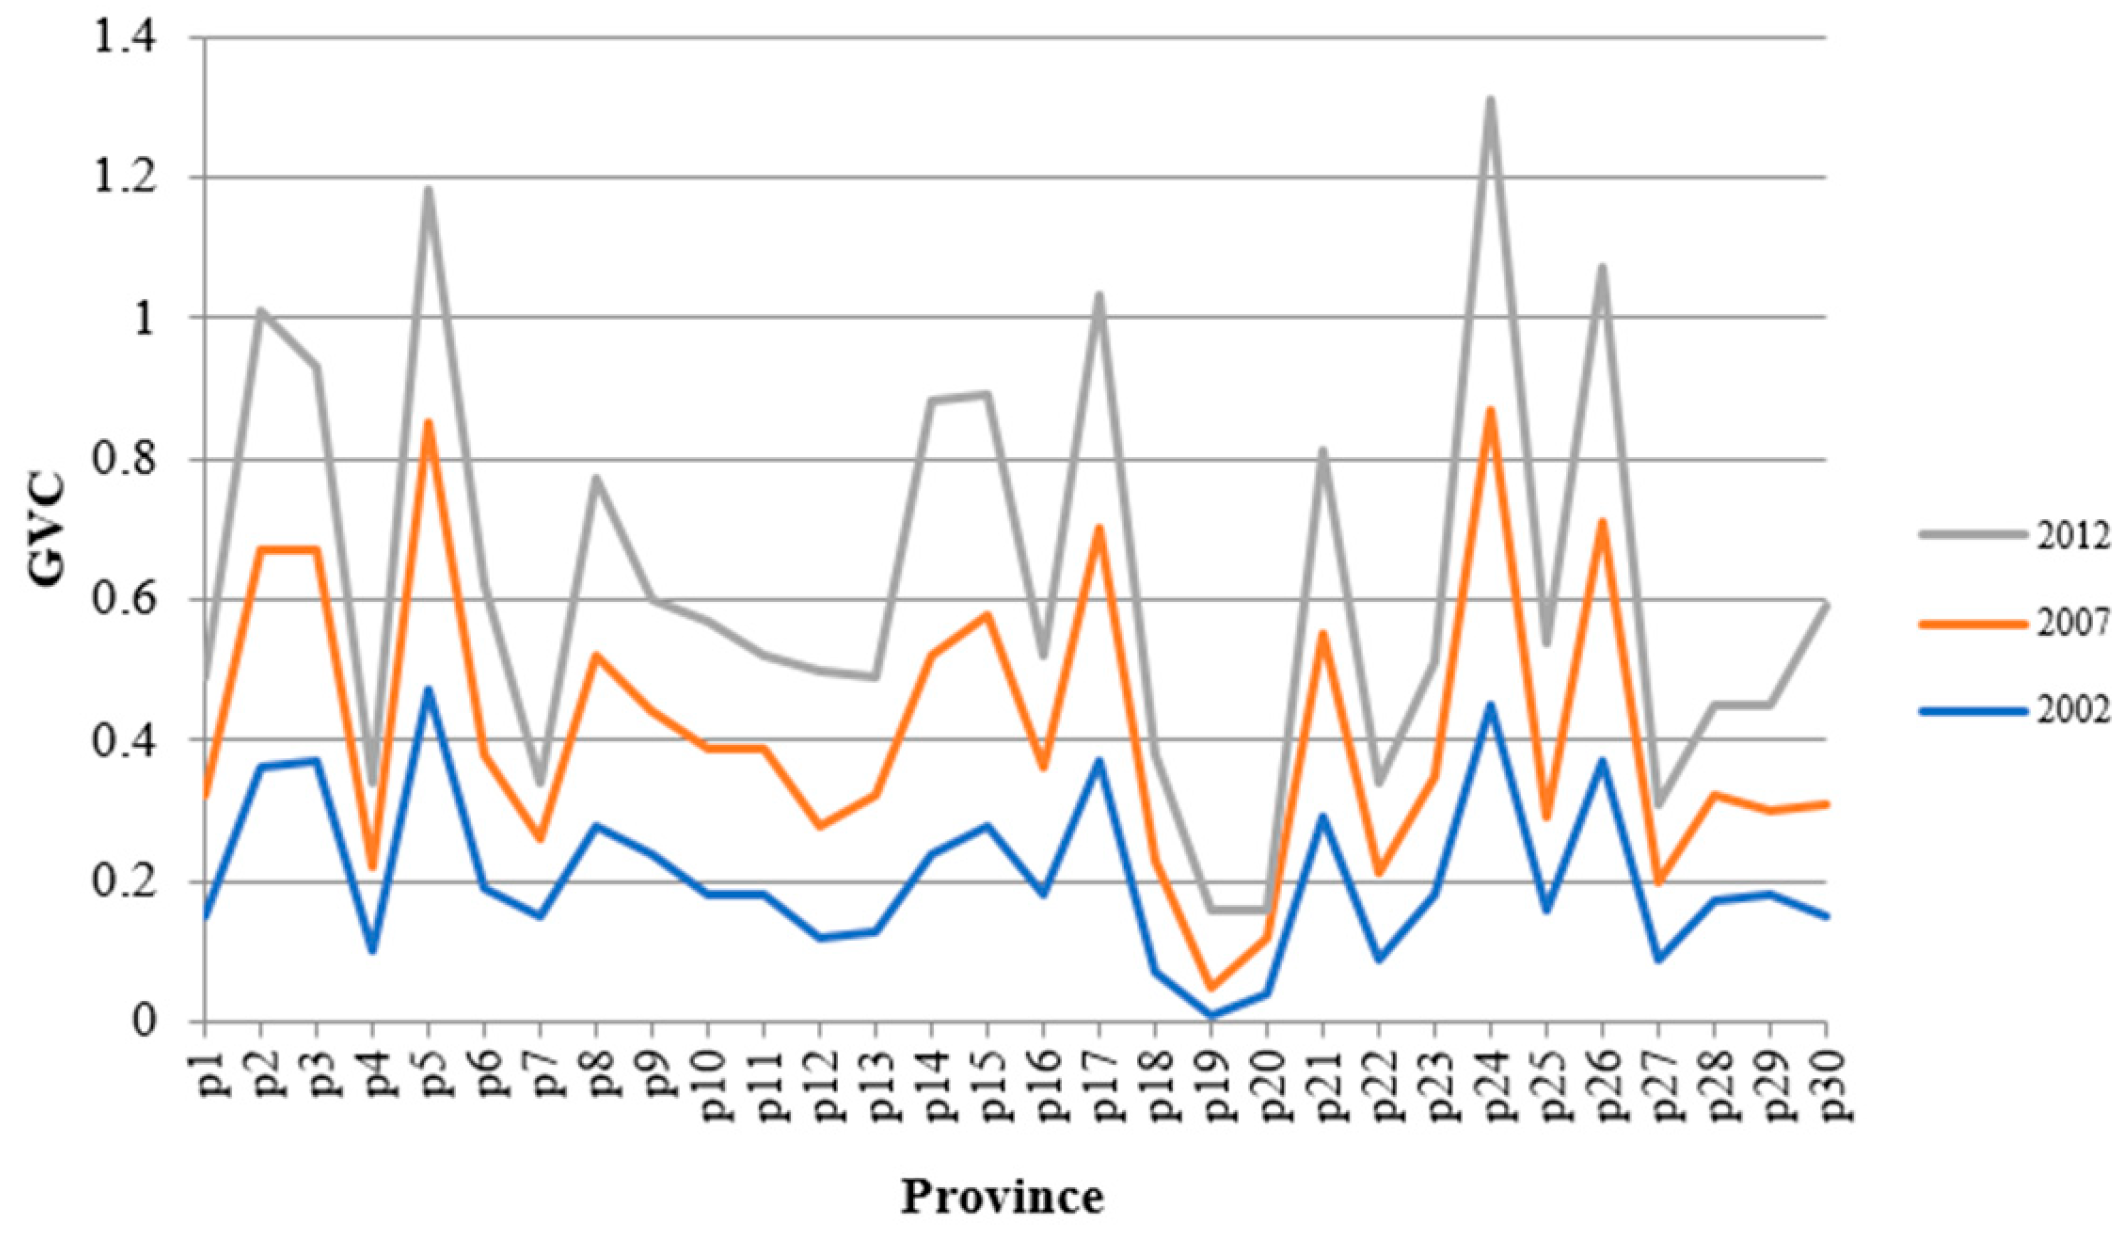
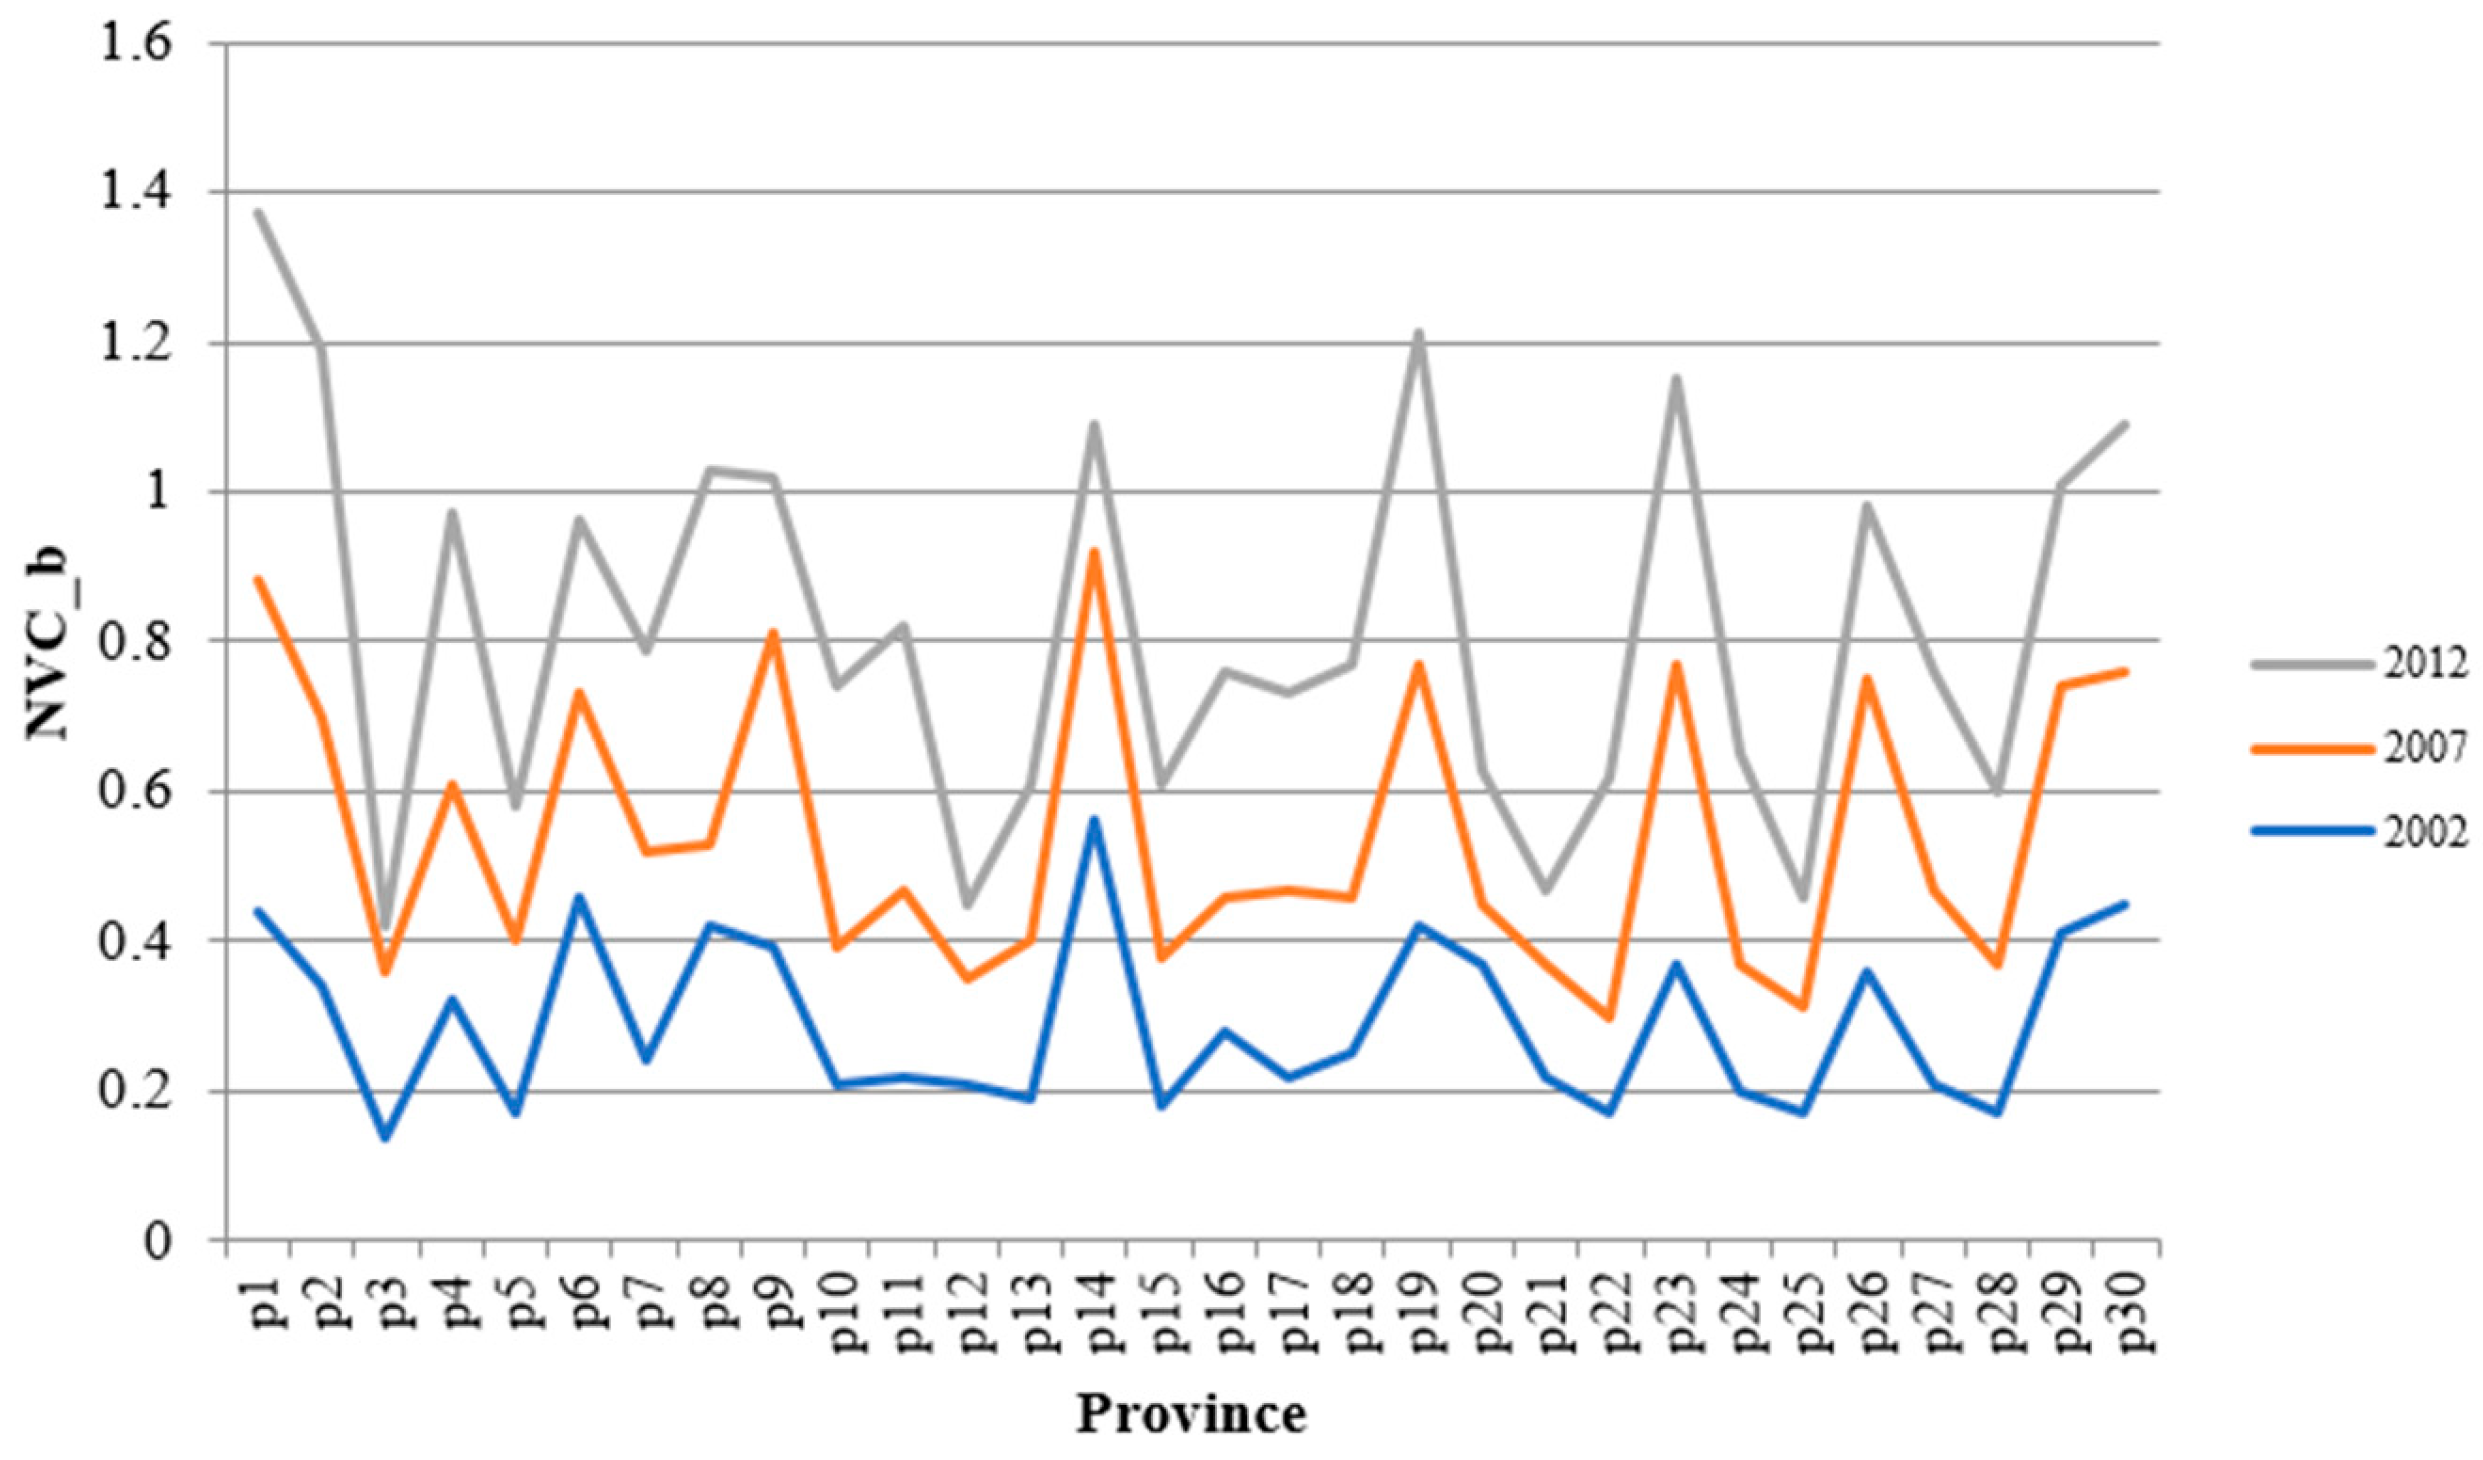
3.2. Data and Measurement Results

Since this study aims to analyze the influence of GVCs and NVCs participation and their interaction on manufacturing upgrading and green development in China, this study will use region-industry-level data. On the one hand, for GVCs, this is different from the country-sector-level analysis used in the traditional literature [39,40,53], which can use input–output tables from the Asian Development Bank to estimate results up to 2021. The measurement of GVCs at the region-industry level should be made using the method raised by Upward et al. [60] and the corporate-level data of the China Industrial Enterprise Database and the China Customs Trade Database, which have only been updated to 2016 (these two databases have been widely used in the literature, for example, Zhang et al. [61], Li et al. [62], Lin and Xu [63] and Yang et al. [64]).
On the other hand, for NVCs, this study uses the KWW method for calculation, which is based on the IRIO table. China’s IRIO table is compiled and published every five years, such as in 2002 and 2007, and the latest inter-regional input–output table is the 2017 version (see https://www.ceads.net/data/input_output_tables/ for regional input–output table of China) (accessed on 9 January 2025). Based on the availability of GVCs and NVCs data, this study finally uses the three-dimensional panel data of 16 manufacturing industries in 30 provinces (Tibet was not included due to data limitations) in 2002, 2007 and 2012 for analysis, which is also consistent with the existing literature [9]. Although the data used in this study may be somewhat old for China, on the one hand, these data have been widely used. On the other hand, the research conclusions are very important for those developing countries who want to learn from the experience of China’s economic growth.
Using the IRIO tables in 2002, 2007 and 2012 provided by China Emission Accounts and Datasets, this study analyzed the NVCs participation of 30 provinces and 16 manufacturing industries in China. The results are shown in Figure 1 and Figure 2, respectively.
Concerning GVCs, the sample in this study combined data from the China Industrial Enterprise Database and China Customs Import and Export Trade Database. We followed Upward et al. [60] for data combination, which was matched in two steps with the original industrial enterprise data, without excluding any enterprises and customs data. The first step was to match enterprise name and year. Because the name of an enterprise may vary over the years, and a newly included enterprise could still use its previous name, the year variable was necessary for matching. In the second step, the postal code location and the last seven digits of the phone number of the enterprise were used to combine data of the enterprises that carried the names but were unidentified. This research assumed an enterprise that remained in the same zip code area would use the same phone number. Due to the different digits in phone numbers in different regions and the upgrade of additional digits in phone numbers in some cities, this study used the universal last seven digits of the phone numbers for matching.
The successfully matched data were further processed as follows. The first step was industry conversion. Drawing on the method of Brandt et al. [65], this study converted the industry classifications in 2002 and 2012 into China’s Industrial Classification for National Economic Activities. Second, customs data in USD were converted into RMB units. Third, the relevant indicators were deflated to 2002. Specifically, total industrial output, sales value, sales revenue, sales cost, and export delivery value were deflated with the producer price index (PPI) of each province. Wage payments were deflated with the consumer price index (CPI) of each province. CPI and PPI data were taken from the China Bureau of Statistics. Fourth, data from enterprises located in Tibet were deleted to keep the data consistent with the regional scope of NVCs participation. The calculated GVCs participation index results for each province and industry in China are shown in Figure 3 and Figure 4, respectively.
As Figure 1 and Figure 3 show, there were significant regional differences in GVCs participation in China. There was a decreasing pattern from the east to the central and west regions, and GVCs participation in coastal areas was higher than in inland areas. Specifically, Shanghai, Guangdong and Tianjin ranked in the top three, while Xinjiang, Qinghai and Ningxia ranked bottom in GVCs participation. In addition, resource-rich inland provinces such as Liaoning and Jilin exhibited higher GVCs participation. In terms of difference degree, GVCs participation in the east and west was rather varied and unevenly geographically distributed. Possibly thanks to location, transportation and human resource advantages, the coastal and eastern regions encountered less difficulty trading with other countries and directly integrating into GVCs.
The provincial geographic distribution of NVCs participation was relatively more balanced, and the regional differences of NVCs participation were smaller than that of GVCs. With Gansu, Qinghai, and Xinjiang as typical examples, NVCs participation in underdeveloped inland regions was higher than in the coastal region, possibly due to the lower level of economic development and less export trade. Consequently, production was mainly driven by domestic demand.
Figure 2 and Figure 4 indicate that, first, GVCs participation in China’s manufacturing industry shows significant sectoral differences. GVCs participation in high-tech manufacturing was higher than that of all other sectors. Specifically, GVCs participation from manufactures of communications equipment, computers and other electronic equipment, of instrument and cultural office machinery, and of transport equipment was higher. GVCs participation in petroleum processing, coking and nuclear fuel processing, food manufacturing, and tobacco processing and other manufacturing was lower. This may be because production processes in high-tech manufacturing are complex, and the production of a single product requires the cooperation of multiple countries to complete. According to the formula for measuring GVCs mentioned above, the GVCs participation index will be higher. In comparison, the production processes of medium-tech and low-tech manufacturing are simpler, the domestic industrial chains are relatively complete, and a product can be produced separately in one country, leading to a low GVCs participation index.
Second, the industry differences in NVCs participation in various sub-sectors of China’s manufacturing industry were small. Fundamental energy industries had higher NVCs participation. The NVCs participation of light industries such as textiles was low, possibly because the domestic production locations of fundamental energy industry were relatively fixed, and the industry was essential for provincial economic development. Therefore, its NVCs participation was often high. The technical complexity of light industries was lower, and local industrial chains were relatively complete. In addition, regional production was more self-sufficient. Consequently, their NVCs participation was lower.
Figure 5 and Figure 6, respectively, show the results of forward and backward linkage-based NVCs participation in China’s provinces. First, the absolute values of forward and backward linkage-based NVCs participation show that underdeveloped inland provinces such as Xinjiang, Gansu, and Guizhou were more embedded than developed coastal provinces such as Guangdong and Zhejiang, a pattern consistent with the regional characteristics of overall NVCs participation. That is, for either forward or backward linkage-based NVCs participation, underdeveloped inland provinces were more dependent on national value chains, whereas more developed coastal provinces traded more with other countries. Coastal provinces have more choices for both raw material procurement and product sales; therefore, forward and backward linkage-based NVCs participation was low.
Secondly, the difference between forward and backward linkage-based NVCs participation indicates that the forward linkage-based NVCs participation of underdeveloped inland provinces was generally higher than backward linkage-based NVCs participation, whereas developed coastal provinces showed the opposite. It may be because underdeveloped inland provinces mainly embedded in NVCs through fundamental resources and spare parts production, and the degree of forward linkage-based participation was relatively high. However, it should be noted that this higher degree of forward linkage-based participation did not necessarily mean advantages in R&D and innovation. Developed coastal provinces had comparative advantages in technology, location, and human capital and achieved forward and backward linkage-based NVCs embedding mainly through R&D and processing, respectively. In summary, economically developed coastal provinces should focus on improving R&D and extending to the front end of the value chains. They could gradually transfer the processing trade businesses into inland provinces. Accordingly, inland provinces should actively introduce processing industries from developed provinces to boost regional economic development.

4. Empirical Analysis

4.1. Model Setting, Variable Description and Data Sources

4.1.1. Model Setting

This study investigated the influence of GVCs and NVCs participation on manufacturing upgrades and green development in China. It used a three-dimensional panel data fixed effect model of time, region and industry for estimation. The econometric model is constructed as follows:
I N D U p i t = β 0 + β 1 G V C p i t + β 2 N V C p i t + γ X + σ p + σ i + σ t + ε p i t
G r e e n p i t = β 0 + β 1 G V C p i t + β 2 N V C p i t + φ Y + σ p + σ i + σ t + ε p i t
In the above equations, I N D U represents the upgrading of the manufacturing industry, and G r e e n represents the green development level. G V C and N V C represent global and national value chain participation, respectively. X and Y are vectors composed of control variables. The subscript   p stands for province, i for manufacturing industry, and t for year. σ p , σ i and σ t are fixed effects of province, industry, and year, respectively. β 0 , β 1 , β 2 , γ and φ are parameters to be estimated.
There may be an interaction effect between NVCs and GVCs participation. That is, when promoting upgrading and green development, GVCs participation may be affected by the NVCs, and vice versa. GVCs participation may also moderate the influence of NVCs on manufacturing upgrades and green development. To explore the interaction effect, this study included an interaction term between GVCs and NVCs participation with benchmark regression. The model is as follows:
I N D U p i t = β 0 + β 1 G V C p i t + β 2 N V C p i t + β 3 ( G V C p i t × N V C p i t ) + γ X + σ p + σ i + σ t + ε p i t
G r e e n p i t = β 0 + β 1 G V C p i t + β 2 N V C p i t + β 3 ( G V C p i t × N V C p i t ) + φ Y + σ p + σ i + σ t + ε p i t
In Equation (23), β 3 measures the interaction effect between NVCs and GVCs participation on manufacturing upgrades. In Equation (24), β 3 measures the interaction effect of NVCs and GVCs participation on green development.

4.1.2. Variable Description and Data Sources

To measure the manufacturing upgrading I N D U , this study used the provincial value-added revealed comparative advantage index V A R C A of exports. When V A R C A 1 , the industry had relatively strong competitiveness and ample upgrading potential; if V A R C A < 1 , the industry had relatively weak competitiveness and inadequate upgrading potential. The specific calculation method is as follows:
V A R C A p i t = v a e x p p i t / i , t v a e x p p i t p , t v a e x p p i t / p , i , t v a e x p p i t
In Equation (25), v a e x p p i t is the regional added value of industry i in province p in period t . The development level of manufacturing industry variable G r e e n is calculated using the natural logarithm of carbon dioxide emissions of each province and sector. The raw data for the above variables came from China Emission Accounts and Datasets (CEADs). GVCs and NVCs participation variables G V C and N V C were calculated as explained above.
The selection of control variable X in Equation (21) should take into account both the theoretical basis and empirical feasibility. Based on the classical literature and empirical research [4,38,44], this study constructs a control variable system with two dimensions: factor endowment and industrial characteristics. K is the stock of material capital measured with the net value of fixed assets. It can reflect the marginal contribution of capital intensity to manufacturing upgrades. L is the labor force measured with the annual average number of all employees, which can capture the scale effect of labor factors. T e c represents the level of technological progress calculated with the Data Envelopment Analysis (DEA) method. Specifically, the output variable is the value of industrial sales, and the input variable is labor and material capital stock. Technological progress may promote the upgrading of the manufacturing industry through digital, intelligent and green transformation. The above three variables can measure the industry factor endowment.
S c a l e is the size of the enterprise, which could affect manufacturing upgrades through economies of scale. O S stands for ownership structure. The ownership structure may influence manufacturing upgrades through resource allocation, innovation incentives and governance. There is regional heterogeneity in its impact on manufacturing upgrades, and the technology spillover effect is more significant in the eastern region due to the higher degree of marketization. E P stands for the performance of the enterprise, measured with the ratio of total profit to industrial sales. T I stands for technology intensity measured with the ratio of fixed asset net value/(industrial sales value + fixed asset net value). F D I refers to foreign direct investment measured with the proportion of the sum of Chinese capital from Hong Kong, Macao and Taiwan and foreign countries to the total paid in capital of the industry. FDI may promote the upgrading of manufacturing through technology spillover, capital supply and industrial chain synergy. These variables can measure industrial characteristics.
In Equation (22), referring to existing research [9,53,54], the control variable Y was selected as follows: energy consumption structure (ES), energy efficiency (EE), ownership structure (OS) and FDI. ES is measured by the proportion of coal consumption, and its high pollution characteristics require reducing coal dependence and shifting to clean energy to increase green development. EE is measured with the ratio of industry sales to total energy consumption. Optimizing energy efficiency can directly reduce emissions. OS is reflected in the proportion of state-owned capital, and the relationship between OS and green development is different in different regions. The eastern region can more easily realize technology spillover because of the higher degree of marketization. FDI influences green development through technological, scale and structural effects, but empirical results are mixed, with some studies showing an inhibitory effect (such as the pollution refuge hypothesis), while the synergistic effect of digital trade and green FDI can strengthen the positive effect.
This study used three-dimensional panel data of time, region, and industry for empirical research, focusing on 16 manufacturing sectors in 30 provinces of China in 2002, 2007, and 2012. In addition, due to different industry classification standards for the original data, this study classified all variables into 16 manufacturing sectors based on the industry classification of China’s I-O table.

4.2. Regression Results and Analysis

This study used a panel data fixed effects model to analyze the influence of GVCs and NVCs on manufacturing upgrades and green development. The benchmark regression results of Equations (21) and (22) are listed in Table 1 and Table 2, respectively.
The regression results of the effect of GVCs and NVCs participation on manufacturing upgrades are listed in Table 1. Because column (6) contains GVCs, NVCs and control variables simultaneously, this study mainly analyzed the regression results in column (6). It indicated that the coefficients of GVCs and NVCs were both significantly positive, showing that GVCs and NVCs participation significantly promoted manufacturing upgrades. With the deepening of GVCs participation, Chinese enterprises could effectively utilize the rich funds, cutting-edge technology, and advanced management expertise of developed country multinational corporations. In this process, enterprises could improve production efficiency by introducing technology, equipment, and high-quality intermediate products from developed countries. In this way, Chinese enterprises exogenously improved product quality and achieved production process and product upgrades with less difficulty, laying the foundation for industrial upgrading.
Greater participation in GVCs does not necessarily lead to dependence on foreign companies for key technologies but, rather, to synergy between participation patterns and innovation capabilities. In general, when the backward participation of GVCs is high (that is, relying on imported intermediates and technologies), enterprises can easily form dependence on foreign core technologies. Chinese companies can gain rapid access to technology through participation in GVCs (such as processing trade) in the early stages, but in the long run, they may fall into “low-end lock-in”. Multinational companies will suppress local research and development through technical standards, resulting in limited capacity for independent innovation. The deep integration of GVCs forward participation and NVCs can enhance technology autonomy.
NVCs participation optimized the allocation of domestic resources. Enterprises from economically developed provinces transferred their industries to relatively underdeveloped provinces, making room for their own industrial transformation and upgrading. Enterprises in underdeveloped provinces need to actively introduce and utilize technology, equipment, and high-quality intermediate products from developed province enterprises to improve production efficiency and product quality and promote industrial upgrading.
Among the control variables, the coefficients of physical capital stock K, labor force L, technological progress level Tec and enterprise performance EP were all significantly positive, indicating that increases in physical capital stock, labor force, technological progress level and enterprise performance were all able to promote manufacturing upgrades. The coefficients of enterprise size Scale and technology intensity TI were both significantly negative, showing that increases in enterprise size and technology intensity had an inhibitory effect on manufacturing upgrades. The coefficient of ownership structure OS was negative but not statistically significant, indicating that changes in ownership structure had a non-significant influence on manufacturing upgrades.
The coefficients of FDI were significantly positive, indicating that the inflow of FDI can promote the upgrading of Chinese manufacturing. FDI significantly promotes the upgrading of the manufacturing industry through technology spillover, capital supply and industrial chain synergy. First of all, the introduction of advanced technologies and high-efficiency management models by FDI enterprises has directly enhanced the technological level and production efficiency of local enterprises. Secondly, FDI intensifies market competition, compelling domestic enterprises to accelerate innovation. Meanwhile, through the extension of the industrial chain, it forms an agglomeration effect, promoting the extension of manufacturing into high-tech fields. In addition, FDI enterprises have increased their investment in research and development and established innovation centers, cooperating with local universities and enterprises to promote the localization and iteration of technologies as well as the transformation of achievements. At the policy level, China has continuously optimized its business environment and relaxed foreign investment access, further attracting foreign investment to flow into high-end manufacturing, thus forming a virtuous cycle of “attracting FDI—manufacturing upgrading—attracting investment FDI”.
The regression results of the effect of GVCs and NVCs participation on manufacturing green development are listed in Table 2. This study mainly analyzed the regression results in column (6) in Table 2, which indicate that participation in the GVCs and NVCs significantly reduced carbon dioxide emissions from manufacturing in provinces of China, thus promoting manufacturing green development. In the process of GVCs and NVCs participation, enterprises could gain more learning and exchange opportunities and obtain more technology spillovers.
Among the control variables, the coefficient of energy consumption structure (ES) is significantly positive (at least at the 1% level), indicating that an increase in the share of coal consumption will significantly increase CO2 emissions from the manufacturing sector in China’s provinces, thus impeding the green transition of the manufacturing sector. Since the reform and opening up, China’s extensive economic growth has led to a continuous rise in the total energy consumption, mainly coal. As the carbon emission intensity of coal is the highest among fossil energy sources, its negative impact on the environment is particularly prominent, which has a significant inhibitory effect on the green development of the manufacturing industry. The coefficient of energy efficiency (EE) is significantly negative in all models (at least at the 10% level), indicating that improving energy efficiency can effectively promote the green development of the manufacturing industry. This shows that by optimizing the way energy is used and improving the efficiency of energy conversion, the sustainable development of the manufacturing industry can be promoted while reducing carbon emissions.
Ownership structure (OS) did not show a significant effect in all regression models. Although state-owned enterprises can improve production efficiency with the advantage of economies of scale, their production efficiency improvement has not been translated into a driving force for green development due to problems such as insufficient impetus for technological innovation. Therefore, the change of ownership structure has a limited effect on the green transformation of the manufacturing industry. The regression coefficient of foreign direct investment (FDI) is significantly positive (at least at the 5% level), indicating that the increase in foreign participation has inhibited the green development of the manufacturing industry. During the sample study period, China attracted a large amount of foreign investment through tax breaks, land concessions and other policies. However, these investments were mainly concentrated in the high-energy and high-emission manufacturing links transferred by developed countries, which objectively increased the carbon emissions of China’s manufacturing industry and had a negative impact on the green transformation.
This study used Equations (23) and (24) to analyze the interaction effect between GVCs and NVCs participation on China’s manufacturing upgrading and green development. The results are listed in Table 3 and Table 4, respectively.
The regression results in Table 3 and Table 4 show that the interaction effect between GVCs and NVCs participation significantly promoted the upgrading of manufacturing and green development in provinces of China. This confirms hypothesis H1 and determines the impact of the interaction effects of GVCs and NVCs participation on green development in hypothesis H2. In addition, NVCs participation amplified the promoting effect of Chinese enterprises’ integration into GVCs on manufacturing upgrading and green development. The underlying reason could be that NVCs participation moderated GVCs participation’s effects of technology spillover, structure, scale and environmental regulation on manufacturing upgrades and green development.

4.3. Robustness Test

To analyze the influence of GVCs and NVCs on manufacturing upgrades, this study conducted robustness tests by replacing core explanatory variables and changing the model settings.
For the global value chains indicator, this study replaced it with the variable of upstreamness in global value chains proposed by Antràs et al. [15]. The calculation method is the upstreamness in GVCs at the product level, which can be calculated as shown in Equation (26):
G V C _ u p s = 1 × C s X s + 2 × w = 1 W a s w C w X s + 3 × w = 1 W t = 1 W a s t a t w C w X s +
In the above equation, s , r and θ are the product, enterprise, and product set, respectively. C w is the scale of product w being consumed as a final product. X s is the output of product s , and a s w stands for the direct I-O coefficient of s and w , that is, the input of product w required to produce one unit of s .
Second, the upstreamness in GVCs at the enterprise level can be calculated as shown in Equation (27):
G V C _ u p r = s θ r G V C _ u p s × E r s s θ r E r s
In Equation (27), E r s is the scale of enterprise r ’s export of product s . Finally, the upstreamness in GVCs at the enterprise level was averaged by region and industry to obtain the upstreamness in the GVCs at the regional-industry level.
Replacing the original GVCs participation index with upstreamness in GVCs, this study reanalyzed the impact and interaction effects of GVCs and NVCs participation on manufacturing upgrades. The results are shown in column (1) of Table 5. This study also replaced the benchmark regression model with a panel Tobit model for robustness analysis, and the results are listed in column (2) of Table 5.
Table 5 suggests that whether replacing the key explanatory variable or changing the model setting, the coefficients of GVCs, NVCs, and their interaction terms were significantly positive at the level of 10% at least and were close to the benchmark regression results in Table 3, verifying the robustness of the conclusions.
This study also conducted robustness tests by replacing the dependent variable. The green development variable G r e e n was replaced with carbon productivity. There was no unified measurement standard or method for carbon productivity. In addition, international conventions and China’s emission reduction plans all used single-factor indicators. Therefore, to compare with the relevant emission reduction targets set by the Chinese Government, this study used single-factor carbon productivity to measure the manufacturing carbon productivity. The specific calculation method is as follows:
G r e e n _ c p p i t = l n s a l e p i t C O 2 p i t
In the above equation, G r e e n _ c p p i t is the carbon productivity , which served as an alternative measure of green development .   s a l e p i t represents the sales output value, and C O 2 p i t stands for carbon dioxide emissions. To eliminate the influence of dimensionality, natural logarithms were taken in calculation. The robustness test results from replacing the key explanatory variable, changing the model setting, and replacing the dependent variable are listed in columns (1)–(3) of Table 6, respectively.
Columns (1)–(2) in Table 6 indicate that after replacing the core explanatory variable and changing the model setting, the interaction effect between GVCs and NVCs participation significantly reduced the carbon dioxide emissions of manufacturing. The results of replacing the dependent variable in column (3) in Table 6 indicate that the interaction effect between GVCs and NVCs participation significantly increased the carbon productivity of manufacturing in China’s provinces, verifying the robustness of the conclusion.

4.4. Heterogeneity Analysis

4.4.1. Regional Heterogeneity

Due to the considerable differences in geographical location, opening-up level and economic development among provinces in China, it is necessary to analyze the regional heterogeneity of the effect of GVCs and NVCs participation on manufacturing upgrades and green development. This study divided 30 provinces in China into three subsamples: the eastern region, the central region and the western region. The regional heterogeneity regression results of the effect of GVCs and NVCs participation on manufacturing upgrades are shown in columns (1)–(3) of Table 7.
The regional heterogeneity test results of the effect of GVCs and NVCs participation on China’s green development are shown in columns (1)–(3) of Table 8.
Columns (1)–(3) of Table 7 and Table 8 show that the main effect and interaction effect of GVCs and NVCs participation significantly promoted manufacturing upgrades and green development in the eastern and central regions of China, but the effects were non-significant in the western region (eastern region includes Beijing, Tianjin, Hebei, Liaoning, Shanghai, Jiangsu, Zhejiang, Fujian, Shandong, Guangdong and Hainan; central region includes Shanxi, Jilin, Heilongjiang, Anhui, Jiangxi, Henan, Hubei and Hunan; western region includes Inner Mongolia, Guangxi, Chongqing, Sichuan, Guizhou, Yunnan, Shaannxi, Gansu, Qinghai, Ningxia and Xinjiang). This may be due to the lower level of participation in GVCs in the western region, making it difficult to absorb technology from developed countries. In addition, the western region mainly embedded in the upstream of NVCs with raw materials and in midstream and downstream NVCs with spare parts production, processing and assembly. Moreover, the western region’s upstream participation in NVCs was higher than mid- and downstream participation, resulting in lower added value and higher energy consumption. Therefore, value chain participation was unable to promote manufacturing upgrades and green development.

4.4.2. Sectoral Heterogeneity

This section analyzes the heterogeneity of different types of manufacturing sectors. This study divided the 16 manufacturing sectors into high-, medium-, and low-tech manufacturing industries. The sector heterogeneity regression results of the influence of GVCs and NVCs participation on manufacturing upgrades are listed in columns (4)–(6) of Table 7, and the sector heterogeneity regression results of the impact of GVCs and NVCs participation on green development are listed in columns (4)–(6) of Table 8.
Columns (4)–(6) of Table 7 and Table 8 show that the main and interaction effects of GVCs and NVCs participation significantly promoted the upgrading and green development of China’s high- and medium-tech manufacturing industries, but the effects were non-significant on the low-tech manufacturing industries. High-tech manufacturing industries include the chemical industry, general and special equipment manufacturing, manufacture of transport equipment, manufacture of electrical machinery and equipment, manufacture of communications equipment, computers and other electronic equipment and manufacture of instrument and cultural office machinery. Medium-tech manufacturing industries include petroleum processing, coking and nuclear fuel processing industries, manufacture of non-metallic mineral products, metal smelting and rolling industry, manufacture of metal products and other manufacturing. Low-tech manufacturing industries include food manufacturing and tobacco processing, textile industry, textile, garment, footwear, hat, leather, down and its products, wood processing and furniture manufacturing and paper printing and cultural, educational, and sporting goods manufacturing. A possible reason for this is that most high-tech manufacturing industries were of low energy consumption and high outputs and were relatively environmentally friendly. Therefore, whether embedded in GVCs or NVCs division of labor networks, value chain participation significantly improved manufacturing upgrades. It also increased output value and technology investment and reduced carbon emissions, which promoted green development. However, low-tech manufacturing industries had lower added value and higher energy consumption, making it difficult to promote manufacturing upgrades and green development. Therefore, it is necessary to strengthen the technology spillover effect of high- and medium-tech manufacturing industries and drive technological innovation in low-tech manufacturing industries.

4.4.3. Heterogeneity of NVCs Participation Modes

The modes of NVCs participation can be classified into forward ( N V C _ f ) and backward ( N V C _ b ) correlation. The specific calculation methods are shown in Equations (14) and (15) above. Under different NVCs participation modes, the regression results of the heterogeneous effect of GVCs and NVCs participation on the upgrading of China’s manufacturing industry are listed in columns (7)–(8) of Table 7, and the regression results of the heterogeneous impact on green development are in columns (7)–(8) of Table 8.
Columns (7)–(8) of Table 7 and Table 8 show that, compared to backward linkage-based NVCs participation, the main effect of forward linkage-based NVCs participation as well as its interaction effect with GVCs participation could more significantly promote upgrading and green development. The result is the same as the conclusion of Koopman et al. [14], that forward linkage-based NVCs participation will generate more added value and less pollution than backward linkage-based NVCs participation, thus better promoting upgrading and green development in manufacturing.

5. Conclusions and Policy Recommendations

Using the China Regional Input–Output Table and the method proposed by KWW, this study measured the NVCs participation of manufacturing sectors in China’s provinces and decomposed it into forward and backward linkages. Based on the extended method of Upward et al. [60], this study also calculated the GVCs participation of manufacturing sectors in China’s provinces. Subsequently, applying a three-dimensional panel data fixed effects model to 16 manufacturing sectors in 30 provinces of China in 2002, 2007, and 2012, this study analyzed the influence of GVCs and NVCs participation on manufacturing upgrading and green development. This study found that the main effects and interaction effect of GVCs and NVCs participation significantly promoted the upgrading and green development of manufacturing, indicating that NVCs participation amplified the driving effect of Chinese enterprises’ integration into the GVCs on manufacturing upgrading and green development. The conclusion was still supported after replacing the key explanatory variable, the dependent variable and changing the model settings. In addition, there was significant heterogeneity across regions, industries and NVCs participation modes in the influence of GVCs and NVCs and their interactive effect on manufacturing upgrades and green development.
The main contribution of this study is to expand and improve the research scope of value chain participation, manufacturing upgrading and green development. Current studies on the value chain and manufacturing upgrading and green development only consider the GVCs participation and often ignore the NVCs division, which is an important influencing factor. In this study, NVCs are included in the analysis framework, and the influence of participation in the value chain division network on manufacturing upgrades and green development is more comprehensively explored, which extends the research perspective related to the value chain participation and manufacturing upgrading and green development.
The shortcoming of this study is that the influence of foreign markets is not taken into account when calculating the participation of NVCs. In future studies, one can build a world I-O model embedded with China’s multi-regional I-O table, consider the impact of foreign markets to measure NVCs participation, and analyze the influence of GVCs and NVCs embedding on manufacturing upgrades and green development.
If this study could have one message, it would be that this research analyzed the impact of GVCs and NVCs participation on manufacturing upgrading and green development. And, for policy, the result can be summarized as follows [66]: China’s manufacturing industry should actively participate in GVCs and strengthen GVCs association with developing countries. China’s manufacturing enterprises could outsource simple product assembly and processing and improve capabilities in high-end components and modern services sectors. China should focus on its domestic “big cycle” by actively cultivating NVCs, strengthening regional industrial connections, and actively breaking down regional and sectoral barriers to promote the flow of production factors. In this way, China could achieve more efficient integration and utilization of domestic resources. China should coordinate the domestic and international markets and resources to avoid a closed, rat-race development path. China could build a production network that effectively connects the GVCs and NVCs and better leverage the positive interaction effect on manufacturing upgrades.
When Chinese enterprises participate in the GVCs and NVCs, they need to break the “low-end lock” through the three core strategies of double-chain collaboration, technological breakthroughs, and ecological restructuring and realize the transition of manufacturing to high-end and intelligent production. Specifically, enterprises should consolidate the industrial base through the NVCs and drive technology iteration and brand upgrading with local market demand; realize international resource integration and market expansion through GVCs; apply industrial Internet, digital twin and other technologies to achieve transparent and intelligent production processes; and promote the manufacturing industry from “scale driven” to “data driven”. Through policy guidance (such as tax incentives, integration of industry and finance), the government should support leading enterprises to build industry-level platforms, integrate global resources and export standards, and cultivate global value chain leaders. The government should develop producer services such as industrial design and supply chain finance to increase the overall value added in the value chain.
In terms of green development, China should strengthen the level of environmental regulations and raise the entry criteria for foreign investment to improve the quality of FDI. Moreover, China should introduce more clean production technologies to enhance clean production standards.

Author Contributions

Conceptualization, S.W. (Shi Wang); data curation, S.W. (Shi Wang) and S.W. (Shanshan Wang); formal analysis, S.W. (Shi Wang) and S.W. (Shanshan Wang); funding acquisition, S.W. (Shi Wang); methodology, S.W. (Shi Wang) and S.W. (Shanshan Wang); software, S.W. (Shi Wang) and S.W. (Shanshan Wang); visualization, S.W. (Shi Wang) and S.W. (Shanshan Wang); writing—original draft, S.W. (Shi Wang); writing—review and editing, S.W. (Shi Wang) and S.W. (Shanshan Wang). All authors have read and agreed to the published version of the manuscript.

Funding

This research was funded by the Humanities and Social Science Fund of the Ministry of Education of China, grant number 20XJC790007; Natural Science Basic Research Program of Shaanxi, grant number 2024JC-YBQN-0752; Social Science Fund Project of Shaanxi Province, grant number 2021D065; Research Fund of Xi’an International Studies University, grant number 22XWG03.

Institutional Review Board Statement

Not applicable.

Informed Consent Statement

Not applicable.

Data Availability Statement

Please contact the corresponding author.

Acknowledgments

The authors would like to thank the anonymous reviewers for their constructive comments and valuable suggestions on this article.

Conflicts of Interest

The authors declare no conflicts of interest.

References

  1. Kano, L.; Tsang, E.W.; Yeung, H.W.-c. Global value chains: A review of the multi-disciplinary literature. J. Int. Bus. Stud. 2020, 51, 577–622. [Google Scholar] [CrossRef]
  2. Li, X.; Zhou, W.; Hou, J. Research on the impact of OFDI on the home country’s global value chain upgrading. Int. Rev. Financ. Anal. 2021, 77, 101862. [Google Scholar] [CrossRef]
  3. Kong, X.X.; Zhang, M.; Ramu, S.C. China’s semiconductor industry in global value chains. Asia Pac. Bus. Rev. 2016, 22, 150–164. [Google Scholar] [CrossRef]
  4. Jer, R. What makes export manufacturers pursue functional upgrading in an emerging market? A study of Chinese technology new ventures. Int. Bus. Rev. 2014, 23, 741–749. [Google Scholar]
  5. Sun, Y.; Grimes, S. China’s increasing participation in ICT’s global value chain: A firm level analysis. Telecommun. Policy 2016, 40, 210–224. [Google Scholar] [CrossRef]
  6. Copeland, B.R.; Taylor, M.S. North-South trade and the environment. In International Trade and the Environment; Routledge: London, UK, 2017; pp. 205–238. [Google Scholar]
  7. Grossman, G.M.; Krueger, A.B. Environmental Impacts of a North American Free Trade Agreement; National Bureau of Economic Research: Cambridge, MA, USA, 1991. [Google Scholar]
  8. Cole, M.A.; Elliott, R.J. Determining the trade–environment composition effect: The role of capital, labor and environmental regulations. J. Environ. Econ. Manag. 2003, 46, 363–383. [Google Scholar] [CrossRef]
  9. Li, J.; Meng, G.; Liu, J.; Li, Z. Value chain specialization and green economy performance: China’s regional evidence. Environ. Impact Assess. Rev. 2023, 103, 107217. [Google Scholar]
  10. Hummels, D.; Ishii, J.; Yi, K.-M. The nature and growth of vertical specialization in world trade. J. Int. Econ. 2001, 54, 75–96. [Google Scholar]
  11. Johnson, R.C.; Noguera, G. Accounting for intermediates: Production sharing and trade in value added. J. Int. Econ. 2012, 86, 224–236. [Google Scholar] [CrossRef]
  12. Koopman, R.; Wang, Z.; Wei, S.-J. Tracing value-added and double counting in gross exports. Am. Econ. Rev. 2014, 104, 459–494. [Google Scholar]
  13. Wang, Z.; Wei, S.-J.; Yu, X.; Zhu, K. Measures of Participation in Global Value Chains and Global Business Cycles; National Bureau of Economic Research: Cambridge, MA, USA, 2017. [Google Scholar]
  14. Koopman, R.; Powers, W.; Wang, Z.; Wei, S.-J. Give Credit Where Credit Is Due: Tracing Value Added in Global Production Chains; National Bureau of Economic Research: Cambridge, MA, USA, 2010. [Google Scholar]
  15. Antràs, P.; Chor, D.; Fally, T.; Hillberry, R. Measuring the upstreamness of production and trade flows. Am. Econ. Rev. 2012, 102, 412–416. [Google Scholar] [CrossRef]
  16. Wang, H.; Si, I.; Chen, Z. Does the Belt and Road Initiative promote China and the countries along the route to reconstruct the global value chain? Evidence from value-added trade. Econ. Anal. Policy 2024, 81, 63–83. [Google Scholar] [CrossRef]
  17. Delera, M.; Pietrobelli, C.; Calza, E.; Lavopa, A. Does value chain participation facilitate the adoption of industry 4.0 technologies in developing countries? World Dev. 2022, 152, 105788. [Google Scholar] [CrossRef]
  18. Agostino, M.; Giunta, A.; Ruberto, S.; Scalera, D. Global value chains and energy-related sustainable practices. Evidence from Enterprise Survey data. Energy Econ. 2023, 127, 107068. [Google Scholar] [CrossRef]
  19. Reddy, K.; Sasidharan, S.; Chundakkadan, R. Firm automation and global value-chain participation: Cross-country analysis. Appl. Econ. 2024, 57, 317–337. [Google Scholar] [CrossRef]
  20. Boschma, R. Global value chains from an evolutionary economic geography perspective: A research agenda. Area Dev. Policy 2022, 7, 123–146. [Google Scholar] [CrossRef]
  21. Agostino, M.; Brancati, E.; Giunta, A.; Scalera, D.; Trivieri, F. Firms’ efficiency and global value chains: An empirical investigation on Italian industry. World Econ. 2020, 43, 1000–1033. [Google Scholar] [CrossRef]
  22. Benkovskis, K.; Masso, J.; Tkacevs, O.; Vahter, P.; Yashiro, N. Export and productivity in global value chains: Comparative evidence from Latvia and Estonia. Rev. World Econ. 2020, 156, 557–577. [Google Scholar] [CrossRef]
  23. Del Prete, D.; Giovannetti, G.; Marvasi, E. Global value chains participation and productivity gains for North African firms. Rev. World Econ. 2017, 153, 675–701. [Google Scholar] [CrossRef]
  24. Hioki, S.; Hewings, G.J.; Okamoto, N. Identifying the structural changes of China’s spatial production linkages using a qualitative input-output analysis. J. Econom. Study Northeast Asia 2009, 6, 25–55. [Google Scholar]
  25. Meng, B.; Fang, Y.; Guo, J.; Zhang, Y. Measuring China’s domestic production networks through Trade in Value-added perspectives. Econ. Syst. Res. 2017, 29, 48–65. [Google Scholar] [CrossRef]
  26. Seung, C.K. Spatial distribution of the value added from seafood exports: A domestic value chain analysis for Korea. Fish. Res. 2022, 247, 106181. [Google Scholar] [CrossRef]
  27. Chen, Q.; Gao, Y.; Pei, J.; de Vries, G.; Wang, F. China’s domestic production networks. China Econ. Rev. 2022, 72, 101767. [Google Scholar] [CrossRef]
  28. Wang, T.; Xiao, S.; Yan, J.; Zhang, P. Regional and sectoral structures of the Chinese economy: A network perspective from multi-regional input–output tables. Phys. A Stat. Mech. Its Appl. 2021, 581, 126196. [Google Scholar] [CrossRef]
  29. He, Y.; Huo, W.; Yu, J. Tracing the regional dual value chains: Measurement on the production position and evidence from China. J. Asian Econ. 2023, 85, 101591. [Google Scholar] [CrossRef]
  30. Yang, J.; Kou, Y. The effect of multiple shocks on domestic production network: Evidence from China’s manufacturing industries. Appl. Econ. 2023, 56, 4315–4328. [Google Scholar] [CrossRef]
  31. Keijser, C.; Belderbos, R.; Goedhuys, M. Governance and learning in global, regional, and local value chains: The IT enabled services industry in South Africa. World Dev. 2021, 141, 105398. [Google Scholar] [CrossRef]
  32. Fedyunina, A.A.; Gorodnyi, N.A.; Simachev, Y.V. How the adoption of Industry 4.0 technologies is related to participation in global and domestic value chains: Evidence from Russia. Int. J. Innov. Stud. 2024, 8, 93–108. [Google Scholar] [CrossRef]
  33. Sun, K.; Xiao, H.; Jia, Z.; Tang, B. Estimating the effects of regional value chains of the RCEP in a GVC-CGE model. J. Asian Econ. 2023, 88, 101647. [Google Scholar] [CrossRef]
  34. Nguyen, T.Q.; Pham, H.C.; McClelland, R. Participating and upgrading in global value chains: The case of small and medium enterprises in Vietnam. In The Economy and Business Environment of Vietnam; Palgrave Macmillan: Cham, Switzerland, 2020; pp. 75–92. [Google Scholar]
  35. Dahlan, J.M.; Samat, O.; Othman, A.A. Upgrading in global value chain of Malaysian aviation industry. Procedia Econ. Financ. 2015, 31, 839–845. [Google Scholar] [CrossRef]
  36. Lee, K.; Qu, D.; Mao, Z. Global value chains, industrial policy, and industrial upgrading: Automotive sectors in Malaysia, Thailand, and China in comparison with Korea. Eur. J. Dev. Res. 2021, 33, 275–303. [Google Scholar] [CrossRef]
  37. Los, B.; Timmer, M.P.; De Vries, G.J. How global are global value chains? A new approach to measure international fragmentation. J. Reg. Sci. 2015, 55, 66–92. [Google Scholar] [CrossRef]
  38. Zhang, Q. The Impact of Digitalization on the Upgrading of China’s Manufacturing Sector’s Global Value Chains. J. Knowl. Econ. 2024, 15, 15577–15600. [Google Scholar] [CrossRef]
  39. Xu, X.; Wang, X.; Zhang, R. The research on influence factors of the servitization of the equipment manufacturing industry under the global value chain (GVC) perspective. Int. J. Secur. Its Appl. 2015, 9, 289–296. [Google Scholar]
  40. Li, Y.; Zhang, X.; Hao, J.; Huang, Q. The impact of green technology innovation on global value chain upgrading in China’s equipment manufacturing industry. Front. Environ. Sci. 2022, 10, 1044583. [Google Scholar] [CrossRef]
  41. Liu, H.; Zhao, H.; Li, S. Future social change of manufacturing and service industries: Service-oriented manufacturing under the integration of innovation-flows drive. Technol. Forecast. Soc. Change 2023, 196, 122808. [Google Scholar] [CrossRef]
  42. Sturgeon, T.J. Upgrading strategies for the digital economy. Glob. Strategy J. 2021, 11, 34–57. [Google Scholar] [CrossRef]
  43. Feng, S.; Zhang, R.; Di, D.; Li, G. Does digital transformation promote global value chain upgrading? Evidence from Chinese manufacturing firms. Econ. Model. 2024, 139, 106810. [Google Scholar] [CrossRef]
  44. Li, W.; Li, Q.; Chen, M.; Su, Y.; Zhu, J. Global Value Chains, Digital Economy, and Upgrading of China’s Manufacturing Industry. Sustainability 2023, 15, 8003. [Google Scholar] [CrossRef]
  45. Antràs, P. Conceptual aspects of global value chains. World Bank Econ. Rev. 2020, 34, 551–574. [Google Scholar] [CrossRef]
  46. Artuc, E.; Bastos, P.; Rijkers, B. Robots, tasks, and trade. J. Int. Econ. 2023, 145, 103828. [Google Scholar] [CrossRef]
  47. Acemoglu, D.; Restrepo, P. The wrong kind of AI? Artificial intelligence and the future of labour demand. Camb. J. Reg. Econ. Soc. 2020, 13, 25–35. [Google Scholar] [CrossRef]
  48. Lebdioui, A. The political economy of moving up in global value chains: How Malaysia added value to its natural resources through industrial policy. Rev. Int. Political Econ. 2022, 29, 870–903. [Google Scholar] [CrossRef]
  49. Rand, J.; Rodriguez, P.C.; Tarp, F.; Trifkovic, N. Economic and environmental upgrading after a policy reform: The case of timber value chain in Myanmar. J. Rural Stud. 2023, 99, 20–34. [Google Scholar] [CrossRef]
  50. Kissi, E.A.; Herzig, C. The implications of governance factors for economic and social upgrading in Ghana’s cocoa value chain. Agric. Food Econ. 2024, 12, 1. [Google Scholar] [CrossRef]
  51. Ahmed, K.; Long, W. An empirical analysis of CO2 emission in Pakistan using EKC hypothesis. J. Int. Trade Law Policy 2013, 12, 188–200. [Google Scholar] [CrossRef]
  52. Lau, L.-S.; Choong, C.-K.; Eng, Y.-K. Investigation of the environmental Kuznets curve for carbon emissions in Malaysia: Do foreign direct investment and trade matter? Energy Policy 2014, 68, 490–497. [Google Scholar] [CrossRef]
  53. Qian, Z.; Zhao, Y.; Shi, Q.; Zheng, L.; Wang, S.; Zhu, J. Global value chains participation and CO2 emissions in RCEP countries. J. Clean. Prod. 2022, 332, 130070. [Google Scholar] [CrossRef]
  54. Huang, Y.; Zhang, Y. Digitalization, positioning in global value chain and carbon emissions embodied in exports: Evidence from global manufacturing production-based emissions. Ecol. Econ. 2023, 205, 107674. [Google Scholar] [CrossRef]
  55. Zheng, M.; Ni, J.; Wen, D. Has GVC participation exacerbated inequality of the embodied carbon in fossil energy industry export trade? Front. Environ. Sci. 2024, 11, 1293462. [Google Scholar] [CrossRef]
  56. Wu, W.; Zhang, N.; Li, A.; Chen, Y. The path to global climate justice: From the perspective of regional discrepancy in embodied carbon emissions. Environ. Impact Assess. Rev. 2024, 105, 107410. [Google Scholar] [CrossRef]
  57. Ali, E.; Bataka, H.; Wonyra, K.O.; Awade, N.E.; Braly, N.N. Global value chains participation and environmental pollution in developing countries: Does digitalization matter? J. Int. Dev. 2024, 36, 451–478. [Google Scholar] [CrossRef]
  58. Yan, Y.; Li, X.; Wang, R.; Pan, A. Global value chain and export-embodied carbon emissions: New evidence from foreign-invested enterprises. Econ. Model. 2023, 127, 106449. [Google Scholar] [CrossRef]
  59. Espinosa-Gracia, A.; Almazán-Gómez, M.Á.; Jiménez, S. CO2 emissions and global value chains indicators: New evidence for 1995–2018. J. Environ. Manag. 2023, 343, 118239. [Google Scholar] [CrossRef]
  60. Upward, R.; Wang, Z.; Zheng, J. Weighing China’s export basket: The domestic content and technology intensity of Chinese exports. J. Comp. Econ. 2013, 41, 527–543. [Google Scholar] [CrossRef]
  61. Zhang, W.; Xu, N.; Li, C.; Cui, X.; Zhang, H.; Chen, W. Impact of digital input on enterprise green productivity: Micro evidence from the Chinese manufacturing industry. J. Clean. Prod. 2023, 414, 137272. [Google Scholar] [CrossRef]
  62. Li, H.; Zhang, Y.; Li, Y. The impact of digital inputs on pollution reduction in Chinese manufacturing enterprises. J. Clean. Prod. 2023, 428, 139393. [Google Scholar] [CrossRef]
  63. Lin, B.; Xu, C. Does environmental decentralization aggravate pollution emissions? Microscopic evidence from Chinese industrial enterprises. Sci. Total Environ. 2022, 829, 154640. [Google Scholar] [CrossRef]
  64. Yang, S.; Jahanger, A.; Hossain, M.R. How effective has the low-carbon city pilot policy been as an environmental intervention in curbing pollution? Evidence from Chinese industrial enterprises. Energy Econ. 2023, 118, 106523. [Google Scholar] [CrossRef]
  65. Brandt, L.; Van Biesebroeck, J.; Zhang, Y. Creative accounting or creative destruction? Firm-level productivity growth in Chinese manufacturing. J. Dev. Econ. 2012, 97, 339–351. [Google Scholar] [CrossRef]
  66. Meyer, K.E.; Estrin, S.; Bhaumik, S.K.; Peng, M.W. Institutions, resources, and entry strategies in emerging economies. Strateg. Manag. J. 2009, 30, 61–80. [Google Scholar] [CrossRef]
Figure 1. Manufacturing industry’s NVCs participation of China’s provinces.
Sustainability 17 04234 g001
Figure 2. NVCs participation of China’s manufacturing industries.
Sustainability 17 04234 g002
Figure 3. Manufacturing industry’s GVCs participation of China’s provinces.
Sustainability 17 04234 g003
Figure 4. GVCs participation of China’s manufacturing industries.
Sustainability 17 04234 g004
Figure 5. Forward linkage-based NVCs participation of China’s provinces.
Sustainability 17 04234 g005
Figure 6. Backward linkage-based NVCs participation of China’s provinces.
Sustainability 17 04234 g006
Table 1. Benchmark regression results—effect of GVCs and NVCs participation on manufacturing upgrades.
VariableINDU
(1)(2)(3)(4)(5)(6)
G V C 0.08 **
(0.04)
0.08 ***
(0.01)
0.05 **
(0.02)
0.07 ***
(0.02)
N V C 0.07 **
(0.03)
0.07 *
(0.04)
0.06 **
(0.03)
0.06 **
(0.03)
K 0.17 *
(0.10)
0.57 ***
(0.04)
0.47 ***
(0.01)
L 0.42 *
(0.22)
0.38 **
(0.19)
0.26 *
(0.15)
Tec 0.49 ***
(0.06)
0.10 **
(0.04)
0.21 ***
(0.02)
Scale −0.17 ***
(0.05)
−0.14 ***
(0.02)
−0.11 ***
(0.00)
OS −0.02
(0.07)
−0.03
(0.09)
−0.02
(0.07)
EP 2.17 ***
(0.21)
2.01 ***
(0.32)
2.78 ***
(0.16)
TI −3.81 ***
(0.62)
−9.23 ***
(0.57)
−1.39 **
(0.64)
FDI 2.31 *** 1.77 * 3.15 **
(0.82)(0.91)(1.39)
Constant1.56 **
(0.70)
0.76 *
(0.42)
1.88 ***
(0.52)
0.93 ***
(0.26)
2.13 **
(0.98)
1.15 **
(0.56)
Sector Fixed EffectYesYesYesYesYesYes
Province Fixed EffectYesYesYesYesYesYes
Year Fixed EffectYesYesYesYesYesYes
Note: Robust standard errors in parentheses. ***, ** and * mean significance at 1%, 5% and 10% levels in this table and hereafter.
Table 2. Benchmark regression results—effect of GVCs and NVCs participation on manufacturing green development.
VariableGreen
(1)(2)(3)(4)(5)(6)
G V C −0.46 *
(0.27)
−0.53 *
(0.31)
−0.31 **
(0.14)
−0.35 **
(0.15)
N V C −0.55 **
(0.26)
−0.57 **
(0.27)
−0.13 **
(0.06)
−0.14 **
(0.07)
ES 3.35 ***
(0.08)
3.66 ***
(0.03)
3.79 ***
(0.05)
EE −0.11 *
(0.06)
−0.15 *
(0.08)
−0.16 *
(0.09)
OS 0.13
(0.12)
−0.28
(0.29)
−0.53
(0.33)
FDI 2.98 ***
(0.02)
2.55 ***
(0.01)
3.06 ***
(0.03)
Constant7.33 ***
(0.01)
7.91 **
(0.01)
6.89 ***
(0.02)
6.13 ***
(0.02)
5.03 ***
(0.02)
5.11 ***
(0.03)
Sector, Province and Year Fixed EffectYesYesYesYesYesYes
Table 3. Interaction effect between GVCs and NVCs participation on manufacturing upgrades.
VariableINDU
(1)(2)
G V C 0.07 ***
(0.02)
0.15 ***
(0.02)
N V C 0.21 ***
(0.03)
0.16 ***
(0.01)
G V C × N V C 0.03 *
(0.16)
0.02 *
(0.01)
Control VariableNoYes
Sector, Province and Year Fixed EffectYesYes
Table 4. Interaction effect between GVCs and NVCs participation on green development.
VariableGreen
(1)(2)
G V C −0.03 **
(0.01)
−0.08 **
(0.04)
N V C −0.36 ***
(0.05)
−0.55 ***
(0.01)
G V C × N V C −0.77 ***
(0.01)
−0.56 ***
(0.02)
Control VariableNoYes
Sector, Province and Year Fixed EffectYesYes
Table 5. Robustness test—interaction effect between GVCs and NVCs participation on manufacturing upgrades.
VariableINDUINDU
Panel Tobit Model
(1)(2)
G V C _ u p 0.02 *
(0.01)
G V C 0.11 ***
(0.03)
N V C 0.03 ***
(0.01)
0.37 *
(0.22)
G V C _ u p × N V C 0.07 **
(0.03)
G V C × N V C 0.03 **
(0.01)
Control VariableYesYes
Sector, Province and Year Fixed EffectYesYes
Table 6. Robustness test—interaction effect between GVCs and NVCs participation on green development of China’s manufacturing industry.
VariableGreenGreen
Panel Tobit Model
G r e e n _ c p
(1)(2)(3)
G V C _ u p −0.91 *
(0.48)
G V C −0.13 **
(0.06)
0.43 **
(0.21)
N V C −0.05 **
(0.02)
−0.86 **
(0.41)
0.17 ***
(0.01)
G V C _ u p × N V C −0.33 ***
(0.03)
G V C × N V C −1.09 **
(0.52)
0.11 **
(0.05)
Control VariableYesYesYes
Sector, Province and Year Fixed EffectYesYesYes
Table 7. Heterogeneity test—effect of GVCs and NVCs participation on manufacturing upgrades.
VariableINDU
(1)
EAST
(2)
CENTRAL
(3)
WEST
(4)
HIGH
(5)
MEDIUM
(6)
LOW
(7)
N V C _ f
(8)
N V C _ b
G V C 0.04 ***
(0.01)
0.03 *
(0.02)
0.04
(0.03)
0.08 **
(0.03)
0.09 **
(0.04)
0.16
(0.15)
0.04 **
(0.02)
0.06 **
(0.03)
N V C 0.12 ***
(0.04)
0.20 ***
(0.07)
0.15
(0.19)
0.11 **
(0.05)
0.28 **
(0.11)
0.35
(0.24)
0.29 ***
(0.06)
0.17 *
(0.09)
G V C × N V C 0.39 ***
(0.05)
0.04 *
(0.02)
0.21
(0.19)
0.27 **
(0.13)
0.15 *
(0.09)
0.32
(0.44)
0.59 **
(0.28)
0.08 *
(0.05)
Control VariableYesYesYesYesYesYesYesYes
Sector, Province and Year Fixed EffectYesYesYesYesYesYesYesYes
Table 8. Heterogeneity test—effect of GVCs and NVCs participation on manufacturing green development.
Variable Green
(1)
EAST
(2)
CENTRAL
(3)
WEST
(4)
HIGH
(5)
MEDIUM
(6)
LOW
(7)
N V C _ f
(8)
N V C _ b
G V C −0.11 ***
(0.03)
−0.01 **
(0.01)
−0.09
(0.24)
−0.19 ***
(0.07)
−0.51 ***
(0.02)
−0.04
(0.03)
−0.04 **
(0.02)
−0.03 **
(0.02)
N V C −0.88 **
(0.38)
−0.07 ***
(0.02)
−0.04
(0.06)
−0.33 ***
(0.05)
−0.70 ***
(0.01)
−0.82
(0.60)
−0.69 ***
(0.02)
−0.41 **
(0.16)
G V C × N V C −0.90 **
(0.42)
−0.17 *
(0.10)
−0.49
(0.40)
−0.08 ***
(0.01)
−0.09 ***
(0.01)
−0.66
(0.81)
−0.72 ***
(0.01)
−0.01 *
(0.01)
Control VariableYesYesYesYesYesYesYesYes
Sector, Province and Year Fixed EffectYesYesYesYesYesYesYesYes
Disclaimer/Publisher’s Note: The statements, opinions and data contained in all publications are solely those of the individual author(s) and contributor(s) and not of MDPI and/or the editor(s). MDPI and/or the editor(s) disclaim responsibility for any injury to people or property resulting from any ideas, methods, instructions or products referred to in the content.

