1. Introduction
In recent years, the accelerated expansion of urban areas has significantly increased the complexity of managing water distribution systems (WDS), leading to high water loss rates. To mitigate these challenges, a promising strategy involves applying a “divide and conquer” approach, in which the original complex network is subdivided into smaller subnetworks, each independently controlled, known as district-metered areas (DMA) [
1].
Sectorization has been successfully implemented globally, enabling water loss assessment through flow balance comparisons between the inlet of the DMA and the total consumption within the district’s coverage area. This water balance calculation serves as the foundation for bottom-up techniques used to evaluate water losses. Additionally, it allows the control of service pressures within acceptable limits, the detection of visible and invisible leaks, the facilitation of rehabilitation works, better management of water quality, and protection against accidental or intentional contamination.
Identifying the optimal sectorization strategy for WDS is a complex task due to the vast number of combinations, even for small networks. Currently, most real-world sectorization projects are based on designers’ experience, often relying on trial and error. Thus, there is a growing need for more efficient and automated solutions for DMA design.
Sectorization design presents a significant challenge because at least three crucial requirements must be met: (1) network connectivity, ensuring that all nodes are connected to at least one water source; (2) compliance with minimum pressure requirements; and (3) minimizing the number of flowmeters and valves to reduce both costs and management complexity [
2]. Normally, the process is accomplished in two main steps: clustering and dividing [
3]. Clustering (or cluster analysis) involves grouping water demand nodes into areas based on their characteristics and connections, while the division step entails installing flowmeters or valves at the boundary pipes between areas to enable independent metering.
In the last decades, numerous methods have emerged for clustering water demand nodes and determining the placement of boundary pipes. The methods and concepts applied in the clustering phase include graph theory [
4,
5,
6,
7], community structure [
8,
9,
10], modularity-based algorithms [
11], multi-level partitioning [
12], spectral graph algorithms [
2,
13], and multi-agent approaches [
14]. The methods applied in the dividing phase include single-objective programming [
15,
16] and multiple-objective programming [
17,
18,
19].
The principles of graph theory are widely adopted for clustering nodes and, consequently, for forming districts in WDS [
20]. One of the first works on sectorization was published by Herrera et al. [
13], who proposed a method using spectral clustering. The study results demonstrate that it is possible to divide the network into non-isolated districts with quantities pre-established by the designer. However, the model focuses solely on minimizing the number of pipe sections that need to be closed (valves) for partitioning, without considering other potential benefits for the system.
Another approach to sectorization found in the literature involves detecting community structures in WDS using the modularity index. This technique was first proposed by Diao et al. [
8], focusing on minimizing the number of pipelines between districts. Subsequently, Ciaponi et al. [
10] presented a methodology that combines a modularity-based algorithm for the automated creation of DMA boundaries.
Although there is a wide variety of methods in the literature, many have practical limitations. For instance, results from clustering-based methods tend to yield similar attributes, such as elevation, pressure, or DMA size. Community detection methods often require adjustments to key parameters, such as the number of sectors and modularity limits, to optimize outcomes. Additionally, using pipe diameters as weights frequently overlooks relevant hydraulic factors. Optimizing hydraulic performance and leakage reduction efficiency remains essential, regardless of the method used.
DMA establishment studies are multi-objective and preferred over single-objective strategies, since they explore a variety of solutions, resulting in more realistic decisions [
21]. Many-objective optimization tools, such as swarm intelligence algorithms (e.g., multi-objective agent swarm optimization) and evolutionary algorithms (e.g., NSGA-II, NSGA-III, BORG algorithm), are gaining attention [
22]. Zhang et al. [
20] and Shekofteh et al. [
23] proposed multi-objective optimization sectorization methods based on NSGA-II. Zhang et al. [
20] developed a method that comprehensively considers hydraulic performance, water quality, and economic factors while incorporating human expertise into the process. Shekofteh et al. [
23], in turn, utilized graphs with NSGA-II to optimize the number of flowmeters and valves while simultaneously reducing computational effort by employing a more efficient algorithmic structure. These advancements highlight the growing relevance of multi-objective approaches in addressing the complexities of water distribution system sectorization.
Santonastaso et al. [
24] and Sharma et al. [
21] proposed models to refine sectorization algorithms using topological matrices, enabling the reuse of pre-existing valves in the network for DMA design. Santonastaso replaced the traditional node-and-pipe-based topological description with a dual topology based on network segments and isolation valves. Sharma et al. [
21] identified DMAs in three stages: cluster identification, boundary optimization or sectorization, and performance evaluation of the sectorized network.
Brentan et al. [
25] proposed a performance analysis of DMA generation that considers such indicators as resilience index, demand similarity, pressure uniformity, water age (and thus water quality), solution implementation costs, and electrical consumption. Bianchofti et al. [
26] compared different performance indices in multi-source sectorization design and concluded that the loss of resilience criterion performed better for each district in terms of pressure uniformity and demand similarity when compared to other specific performance criteria.
Sharma et al. [
27] proposed using NSGA-III to generate a set of optimal DMA configurations, allowing the selection of the most suitable configuration based on preferences assigned to each objective. Simultaneous handling of such parameters or multiple objectives significantly increases computational complexity and may limit the practical applicability of the methodology from a network operations perspective.
Spizzo et al. [
28] presented the application of an optimization approach based on complex network theory coupled with a genetic algorithm (GA). The methodology consists of a clustering phase performed with two different algorithms (Girvan–Newman and spectral clustering) and a dividing phase that determines whether a valve or a flow meter should be installed in a pipe. The final phase employs a GA to optimize the system objectives. Anchieta et al. [
29] developed hybrid algorithms that combine established methods, such as the Fast–Greedy and Louvain algorithms, with PSO. The hybrid algorithms based on Louvain achieved the best results; however, Louvain produces only a limited number of solutions, some of which may not satisfy the imposed constraints [
30].
Recently, Vasilic et al. [
31,
32] presented the DeNSE method (distribution network sectorization method), which is based on a heuristic procedure where sectorization is performed through the efficient tracking of water balance data, determining the lowest investment cost required to maintain the operational performance of the network. The methodology consists of two main stages: a clustering stage, based on the network uniformity index, and a dividing stage, in which a genetic algorithm (GA) is used to minimize implementation costs. The dividing stage also considers the presence of pre-installed valves in the WDN and water supply security criteria, providing a more accurate estimate of implementation costs and the operational efficiency of the network after sectorization.
Considering this context, this study proposes a hybrid model that integrates graph theory, using the Dijkstra algorithm (DSP), with the meta-heuristic binary particle swarm optimization (BPSO) algorithm. Among the meta-heuristic techniques applicable to the problem, particle swarm optimization (PSO) stands out as one of the most popular. Over the past two decades, PSO has been successfully applied to a wide variety of complex optimization problems in science and technology, demonstrating its versatility and effectiveness [
33,
34]. The model is inspired by the dynamics and behavior of socially organized populations in nature, influenced by both the individual’s personal experience and the group’s collective knowledge [
35,
36].
This approach was adopted considering the simplicity and effectiveness of solving complex problems by graph structures. The DSP algorithm was used to define the initial sectorization solution by identifying the shortest paths that water travels from the reservoir to the consumption points, considering both the topology and hydraulic analysis of the network. Furthermore, since the sectorization problem is characterized by structural and hydraulic requirements, BPSO was employed to obtain the optimal solution within a reasonable computational time. The algorithm determines the best combination of segment conditions (open or closed) while satisfying the established constraints.
This work also supports the Sustainable Development Goals (SDGs), particularly SDG 6, which aims to ensure the availability and sustainable management of water and sanitation for all. By proposing a model that contributes to reducing water losses and improving the operational efficiency of WDS, this study promotes the responsible use of water resources and contributes to the resilience of water supplies, which are fundamental in addressing climate change and water scarcity.
2. Materials and Methods
The proposed hybrid sectorization model was developed in the Python programming language using the free integrated development environment (IDE) PyCharm Community version 2019.3.1, with the assistance of the Epynet library, a package that allows users to utilize all functions of the EPANET 2.00.12 toolkit in Python scripts.
To obtain a solution to the proposed problem, the methodology consisted fundamentally of: (1) Definition of the main pipe; (2) Transformation of the water distribution network topology into graph structures and clustering of nodes using the DSP algorithm [
37]; and (3) Determination of the DMA.
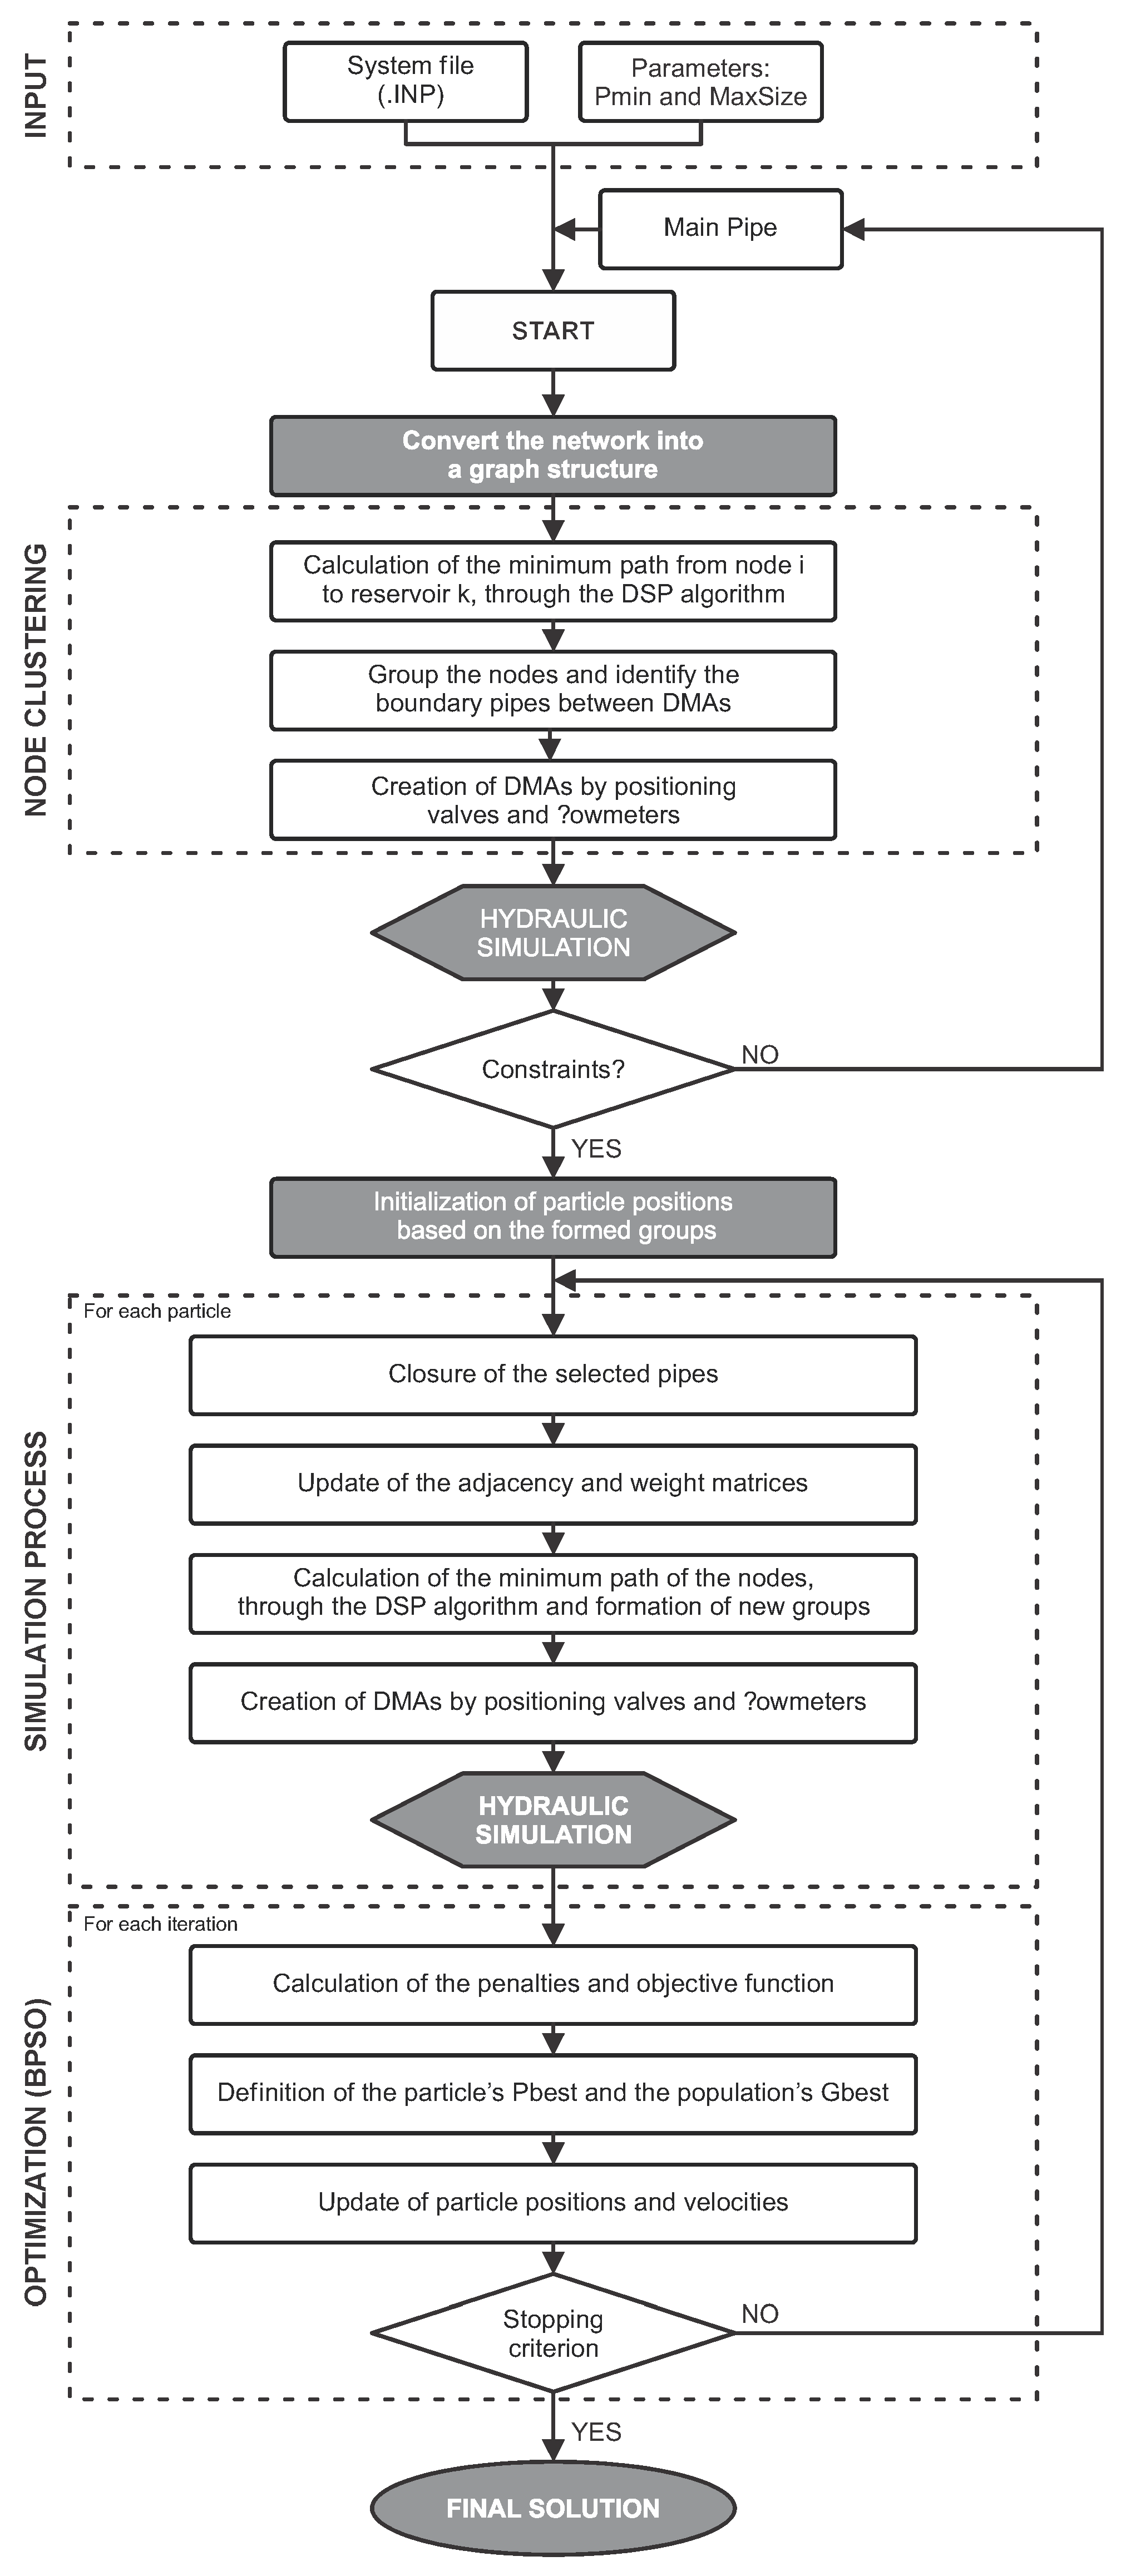
Figure 1 presents the flowchart of the proposed model.
The BPSO algorithm was adopted because the problem is characterized as discrete and binary, where the configuration of a pipe can take the value 0 (closed pipe) or 1 (open pipe). This approach has stood out in optimization problems since fewer individuals and iterations are required to converge to an optimal solution. The application of this algorithm to this type of problem has not been found in the literature.
2.1. Main Pipe
The main pipe is identified by the designer based on hydraulic criteria, consisting of large-diameter pipes that transport the largest flows. It originates from the reservoir and must supply the DMA. Once this pipe was defined, the pipes that would be decision variables (branching pipes) were identified, i.e., pipes that could receive valves or flowmeters. These pipes are directly connected to the main pipe.
2.2. Node Clustering
This step is based on the study by Zhang et al. [
20], which proposes an innovative approach adapted from Dijkstra’s algorithm. After defining the main pipe, the topology of the network was transformed into undirected graph structures, where the vertices represent nodes, and the edges represent pipes without a defined direction. For this representation, an adjacency matrix was constructed to relate the existing connections between nodes, where
In addition to the adjacency matrix, a weighted matrix was required to cluster the nodes. The weighted matrix was defined as:
From the representation of the topology by matrices, the nodes were grouped to share the same branching pipe connected directly to the main pipe. For this, the DSP algorithm was used to find the optimal water path between node
and the endpoint
(reservoir). In combination with the weighted matrix and the pipe weights, the shortest path was obtained using Equation (1):
where
is pipe weight
; {
} is the set of pipes corresponding to the shortest path between the initial node
(reservoir) and node
.
The pipe resistance coefficient, calculated using the Hazen–Williams formula, was used as the weight value for the pipe, as in Equation (2):
where
is the Hazen–Williams roughness coefficient of the pipe
;
is pipe diameter in
;
is pipe length
, and
is the number of pipes.
The districts formed represent the set of paths (pipes) with the lowest resistances. The number of DMA generated represents the maximum number of sectors that the analyzed network could support, implying high operating costs and technical infeasibility. Therefore, an additional step was necessary to merge the districts to obtain the final solution.
It is also worth noting that the branching pipes that are part of the shortest path of any node are the decision variables, and they can indicate a district entry. Pipes not selected in any shortest path should remain closed, reducing the number of decision variables.
2.3. Optimization of District Metered Areas
Given the characteristics of the problem, the BPSO algorithm proposed by Khanesar et al. [
38] was implemented to find the best combination of pipe conditions (open or closed) while satisfying the imposed constraints. For each iteration, the WDS simulation characterized by the new sectorization was performed using the Epynet library, and the new performance was investigated by calculating the objective function. The parameters of BPSO used for the sectorization were:
= 1;
= 1;
= 0.5; number of particles = 4; number of iterations = 20;
= 2;
= 10; and
= 5.
The particle’s position informs the condition of the branching pipes, indicating whether the pipe should remain open (1) or closed (0). In each iteration, a new network topology was formed with new connections, so the adjacency and weighted matrices were updated, and new shortest paths were calculated using the DSP algorithm, forming new districts. From the newly created districts, the boundary pipes—those connecting two DMA—were identified.
After making the necessary changes to the water distribution networks, including inserting valves in the pipes that should remain closed and flowmeters at the district entry pipes, simulations were conducted, and constraint and objective function calculations were performed for all iterations.
2.4. Binary Particle Swarm Optimization
The PSO algorithm employs two sociometric principles: and . connects all members of a population and corresponds to the best position in the search space traversed by any of the particles associated with the entire swarm, while is the best individual position each particle has visited in the search space.
In this technique, the position of each particle represents a possible solution (
) to the problem. Initially, this position and each velocity (
) are determined randomly. At each time step (iteration), the quality of each particle’s position is evaluated according to the objective function, and a new velocity is calculated using Equation (3):
where
is inertia weight;
and
are the cognitive and social components, respectively;
generates random values between 0 and 1.
Once the particle’s velocity is calculated, the particle’s position in the next iteration is updated as an additive influence of the previous position and the calculated velocity (Equation (4)). This guarantees some randomness in the search process while considering both individual and group performance, making the method fast and efficient.
To limit the velocity of a particle and prevent the system from overshooting the search space, velocity limits (
) are imposed in each dimension of the search space:
The PSO algorithm is repeated until a termination criterion is met or the changes in particle velocities are close to zero. Additionally, the initial set of particles
is randomly generated and spread across the search space according to Equation (5):
where
and
are the lower and upper bounds of the particle positions, respectively. The particle dimensions are determined by the problem to be optimized based on the number of design variables.
The inertia weight added by Shi and Eberhart [
39] modifies the velocity update calculation. This parameter balances global and local exploration, resulting in fewer iterations to find a good solution. The inertia significantly impacts the algorithm’s behavior, indicating the particle’s ability to maintain its current trajectory. Shi and Eberhart demonstrated that:
The findings on the inertia led to the proposal of reducing weights as the algorithm progresses. Shi and Eberhart [
40] proposed a linear variation of inertia, with an initial value of 0.9 and a final value of 0.4, as shown in Equation (6):
where
and
are the initial and final inertia weights, respectively;
is the total number of iterations; and
is the current iteration.
Cognitive and social factors also influence particle exploration in the search space and are commonly set to a value of 2 [
41]. The random factor helps the particle avoid getting trapped in local minima. Additionally, Clerc [
42] proposed the use of a constriction factor
to ensure PSO convergence, as demonstrated in Equation (7):
Eberhart and Shi [
41] showed that the constriction approach outperforms the standard approach with
if
> 4 and
is the upper limit for each element of the velocity vector, and
is the maximum initialization range for each element of the position vector.
should be multiplied by the velocity as in Equation (8):
Since the problem under evaluation has discrete binary variables, the BPSO algorithm presented by Khanesar et al. [
38] was chosen, since it has been widely used in recent studies. In this new method, the particle’s velocity is the rate at which the particle changes its bit value, as in the classical version of PSO.
Two vectors for each particle are introduced:
and
.
is the probability that the particle changes to 0, while the
is the probability that the particle changes its value to 1. Thus, the probability of changing the
i-th particle bit is simply defined by Equation (9):
To guide the
i-th particle’s bit to its best position, the velocity of change to 1 (
) for that particle increases, and the velocity of change to zero (
) decreases. Using this concept, the following rules can be derived by Equation (10):
where
and
store temporary values. Then, the vectors
and
can be updated by Equations (11) and (12):
Indeed, in this algorithm, if the best global variable or the best local variable is 0, the velocity
will increase, and the probability of switching to 1 will decrease at the same rate. In this approach, the previously found direction is maintained and used, meaning that the particles retain memory of the previous direction. After updating the particle velocities, the change velocity is obtained using Equation (9), and a normalization process is performed. Then, the next particle state is calculated using Equation (13):
where
= 1 if
= 0 and
= 0 if
= 1. The meaning of the parameters used in the velocity calculation (Equation (8)) is the same as in the classic PSO. The inertia weight preserves the particle’s previous bit direction for the best personal bit or the best global bit, whether it is 1 or 0.
2.4.1. Objective Function
The objective function of the model is described by Equation (14), which aims to minimize the implementation costs of the project, considering the pressures at the consumption points and the size of the DMA. The costs (
) were calculated using Equation (15), while the penalties are described by Equation (16) to (18).
where
is the objective function to be minimized;
is the cost of the devices (valves and flowmeters);
corresponds to the penalty function;
is the cost of the valve as a function of pipe diameter
;
is the cost of the flowmeter;
is the total number of valves;
is the total number of flowmeters;
is the total number of nodes;
is the penalty factor;
is the minimum required pressure;
is the pressure at node
;
is the number of districts;
is the penalty factor;
is the maximum size of the districts; and
is the size of district
.
The penalty factors and were determined by verification tests. It is important that these values are significant enough for the optimization algorithm to recognize the optimal solution. Unlike other optimization algorithms that present a set of feasible solutions, the model converges to a single feasible solution. This was made possible by assigning values to the penalty factors, prioritizing the most important criterion considered by the designer.
2.4.2. Decision Variables
The optimal DMA design problem is a combination problem regarding the condition of the pipes. When defining the DMA, the boundary pipes, which are pipes whose initial and final nodes are in different districts, were identified. These pipes were closed according to Equation (19):
Meanwhile, the pipes branching from the main pipe and connecting the possible districts (branching pipes) are the decision variables of the problem. By combinations, the best solutions were identified. In this set, the pipes that remained open received flowmeters, while the others received valves. These pipes are expressed by Equation (20):
2.4.3. Constraint Conditions
The following constraints were imposed on the hybrid model:
Isolated Districts: To create independent and efficient districts, there must be no node intersections between two DMA.
Hydraulic Requirements: Mass and energy conservation must be ensured. The model guarantees hydraulic requirements through the calculations performed by the Epynet library integrated into the PyCharm environment.
Minimum Pressure: The pressure at all nodes must be greater than the required minimum pressure. The model ensured minimum pressure by the penalty function coupled with the objective function.
DMA Size: The minimum dimensions were considered in the technical and economic feasibility analysis of the objective function. Like the minimum pressure constraint, the district size constraint is guaranteed through the penalty function.
3. Results
The hybrid model was applied to the sectorization of three water distribution systems located in the city of João Pessoa, Northeast Brazil. The systems—Pressure Zones R1–R23, R5, and R37—were selected due to their complexity and diversity in terms of pipe lengths, diameters, and network topology. The analysis was conducted under the operational condition of maximum hourly demand. The results were compared with a project developed by Hidrainfo, a specialized company contracted by the local water utility.
Table 1 summarizes the key data from each system, including the number of nodes, pipes, and the population served.
Table 2 shows the costs of the flowmeters and valves.
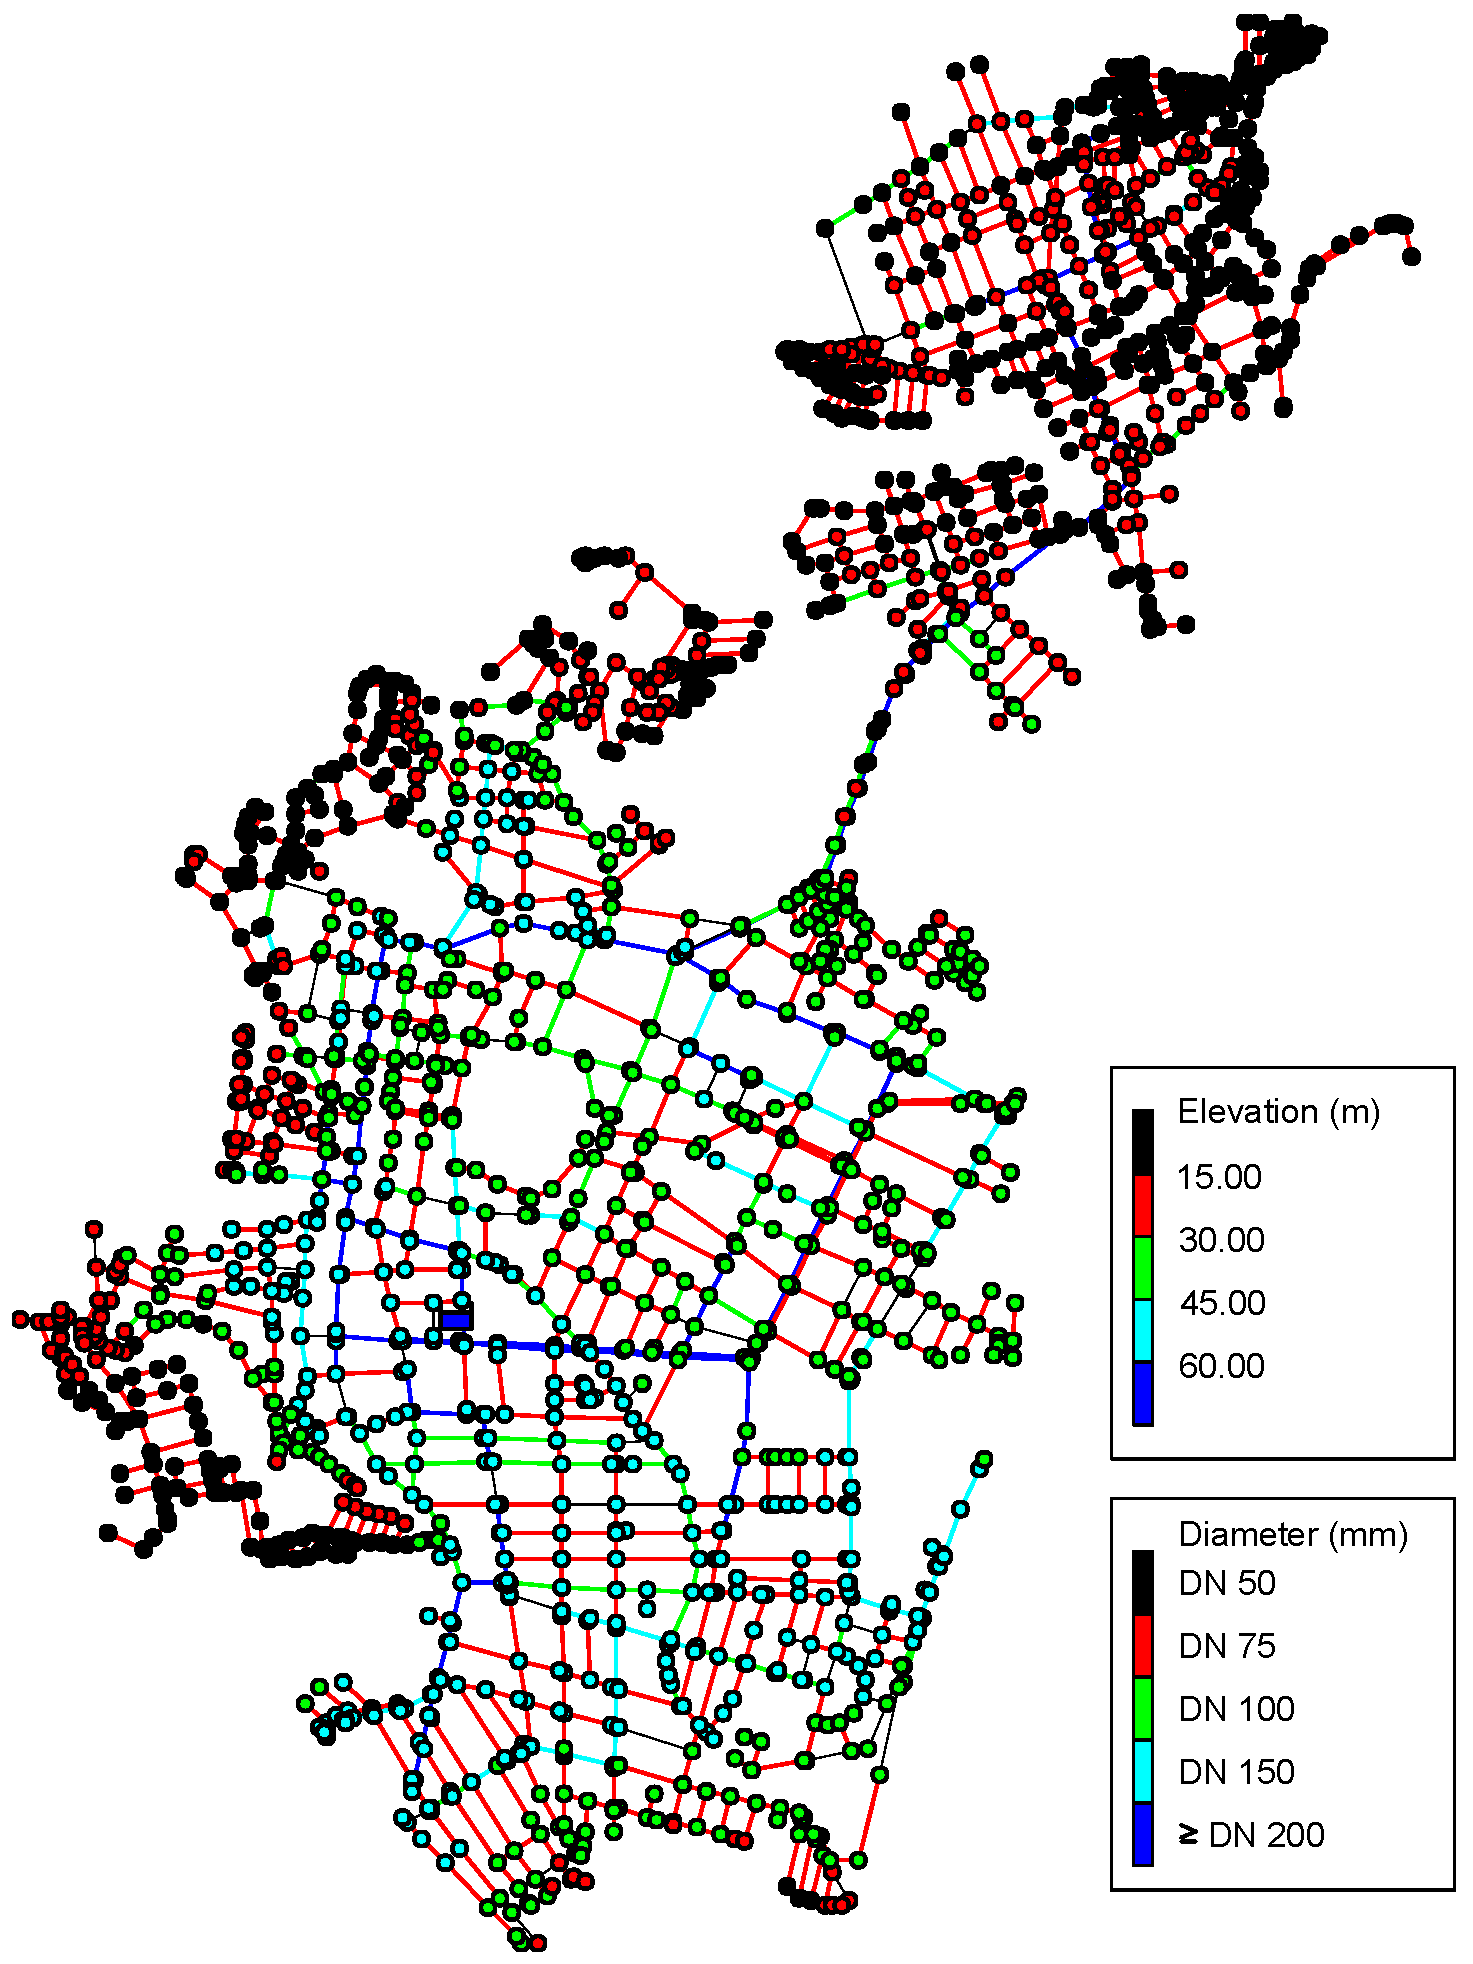
3.1. Pressure Zone R1
Pressure Zone R1 covers an area of 878 km
2 and has 2029 nodes and 2380 pipes, totaling 1207 km of pipes with diameters ranging from DN 50 to DN 400 (PVC, asbestos cement, and cast iron).
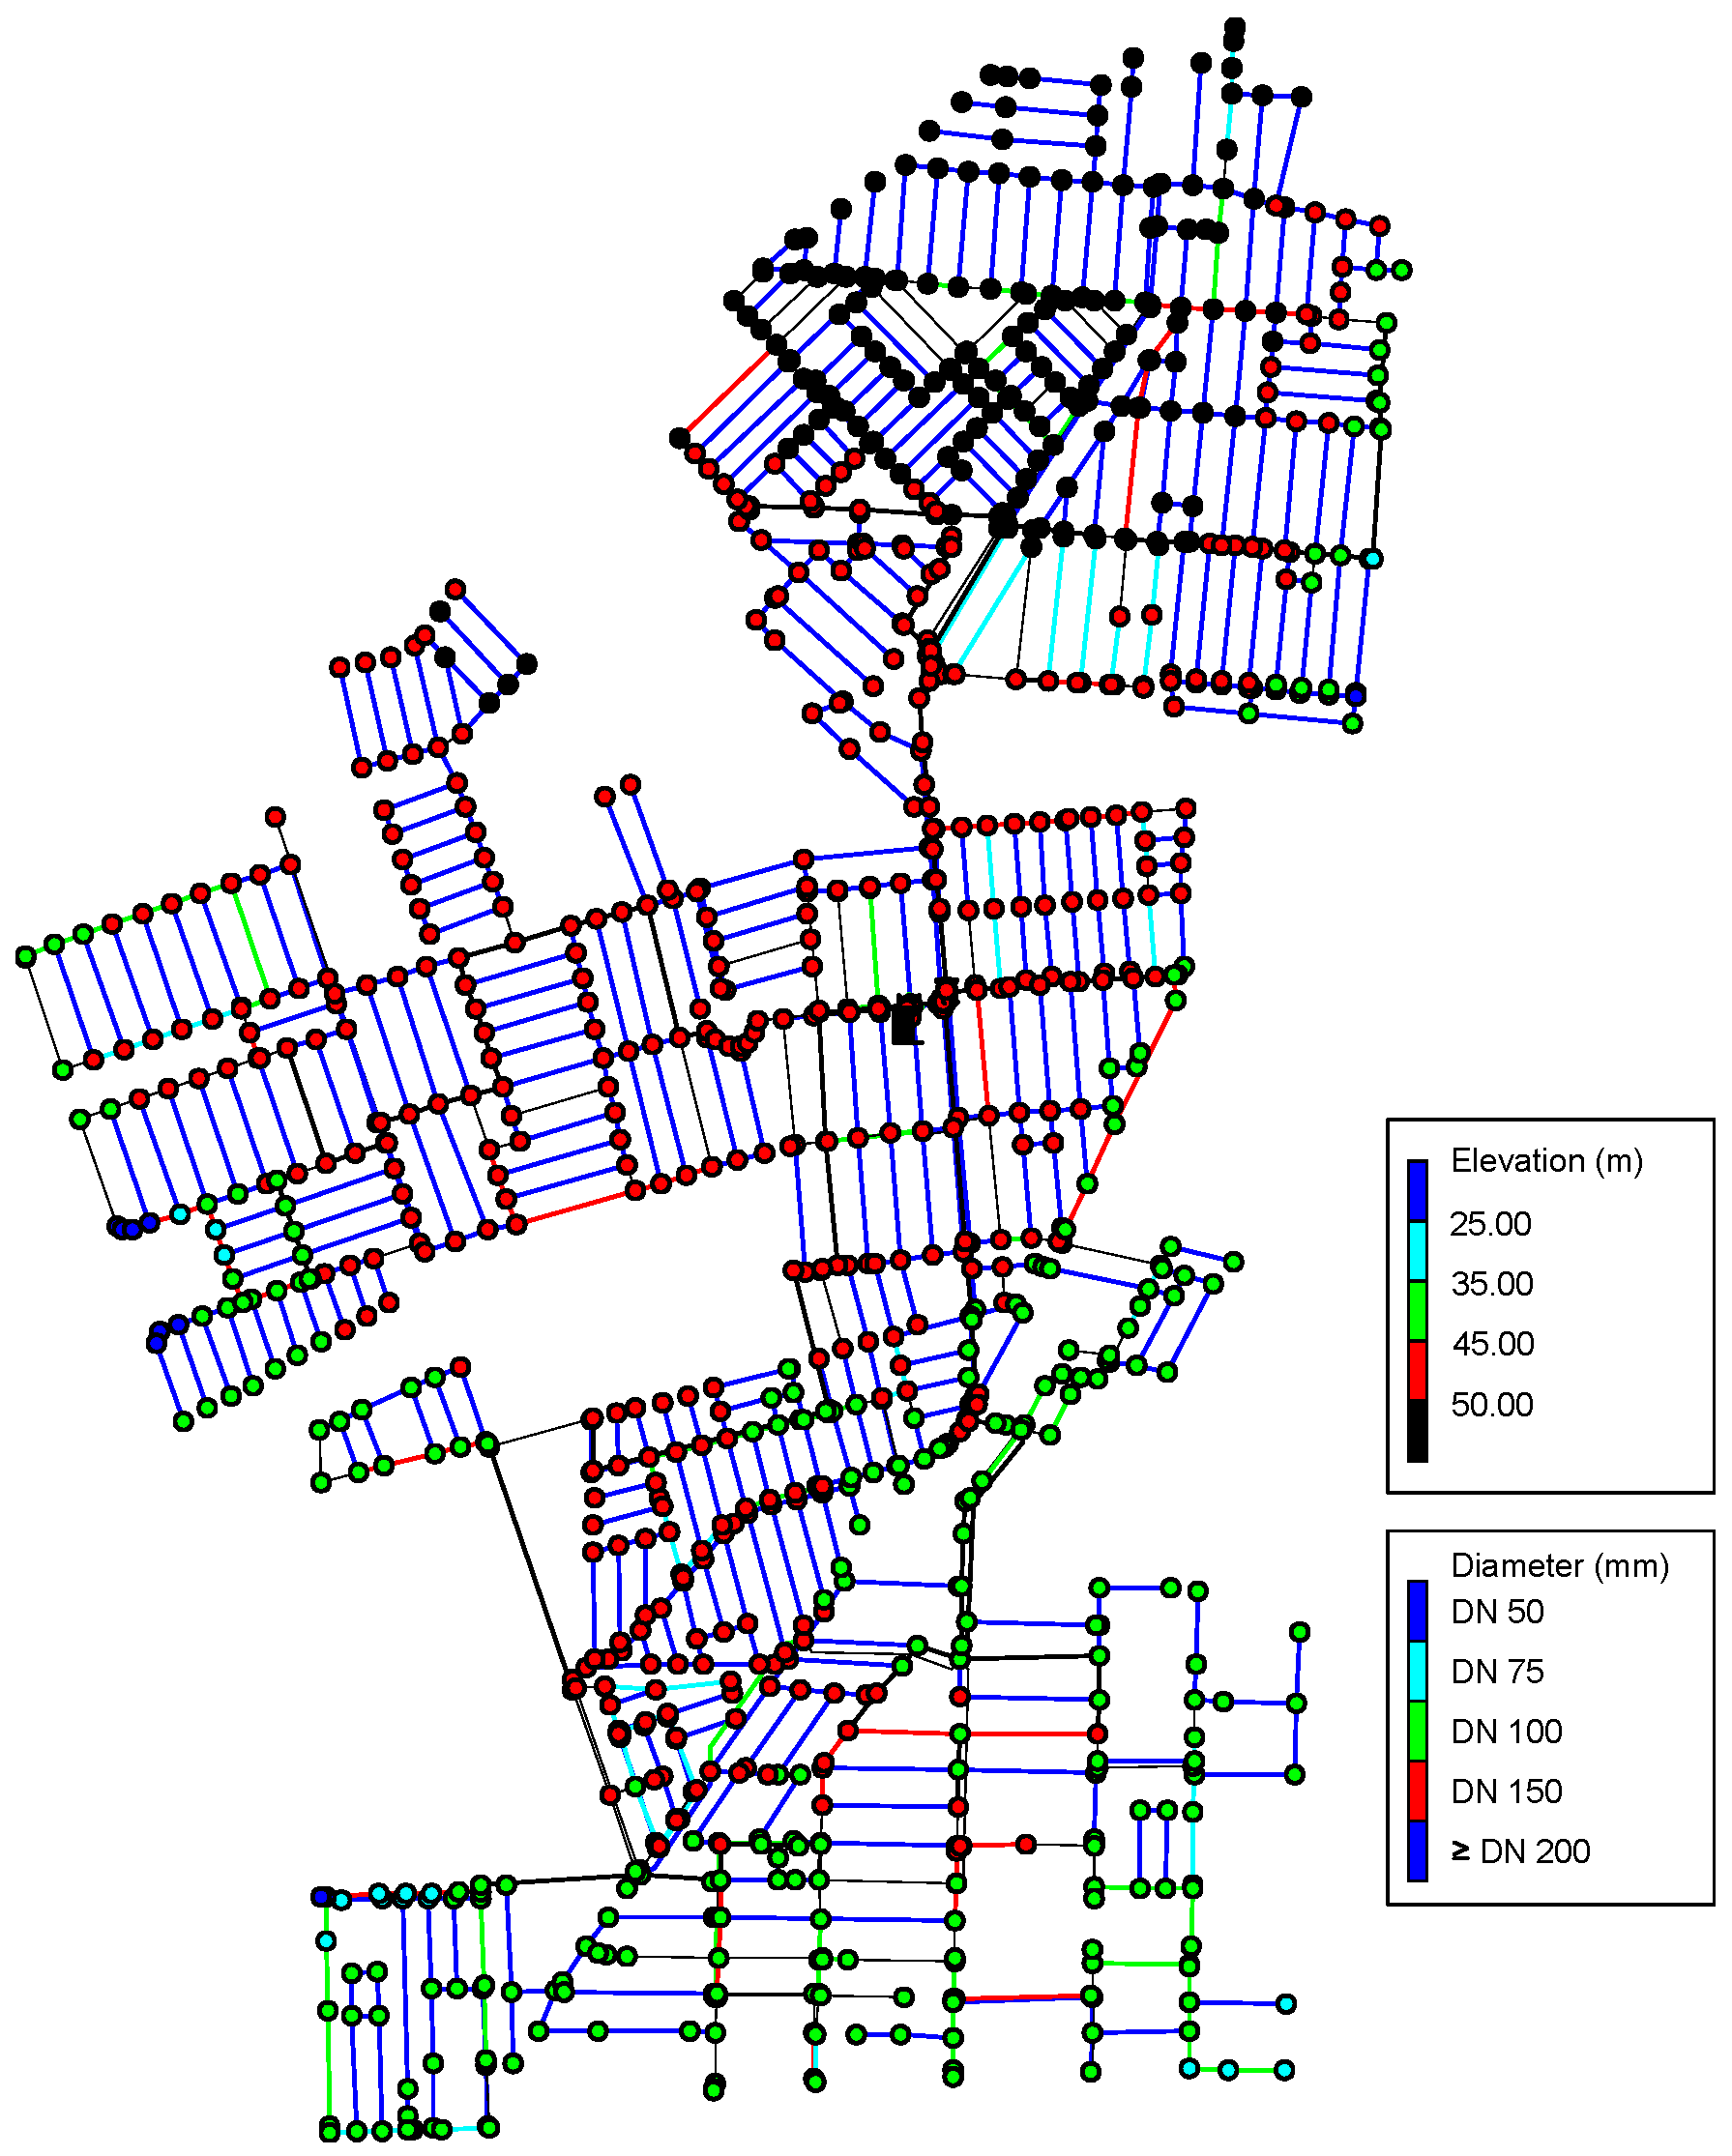
Figure 2 shows the network’s layout, highlighting the reservoir at the origin (R1), the network pipes (colored lines), and their georeferenced nodes. The piezometric head of the elevated reservoir R1 is 70.12 mca. The colored points correspond to the network nodes with their respective elevations. The lines in dark blue represent PVC/PBA DN 50 pipes; in light blue, PVC/PBA DN 75; in green, PVC/PBA DN 100 mm; in yellow, PVC DEFoFo DN 150 mm; and in red, PVC DEFoFo and asbestos cement pipes varying from DN 200 to DN 400 mm.
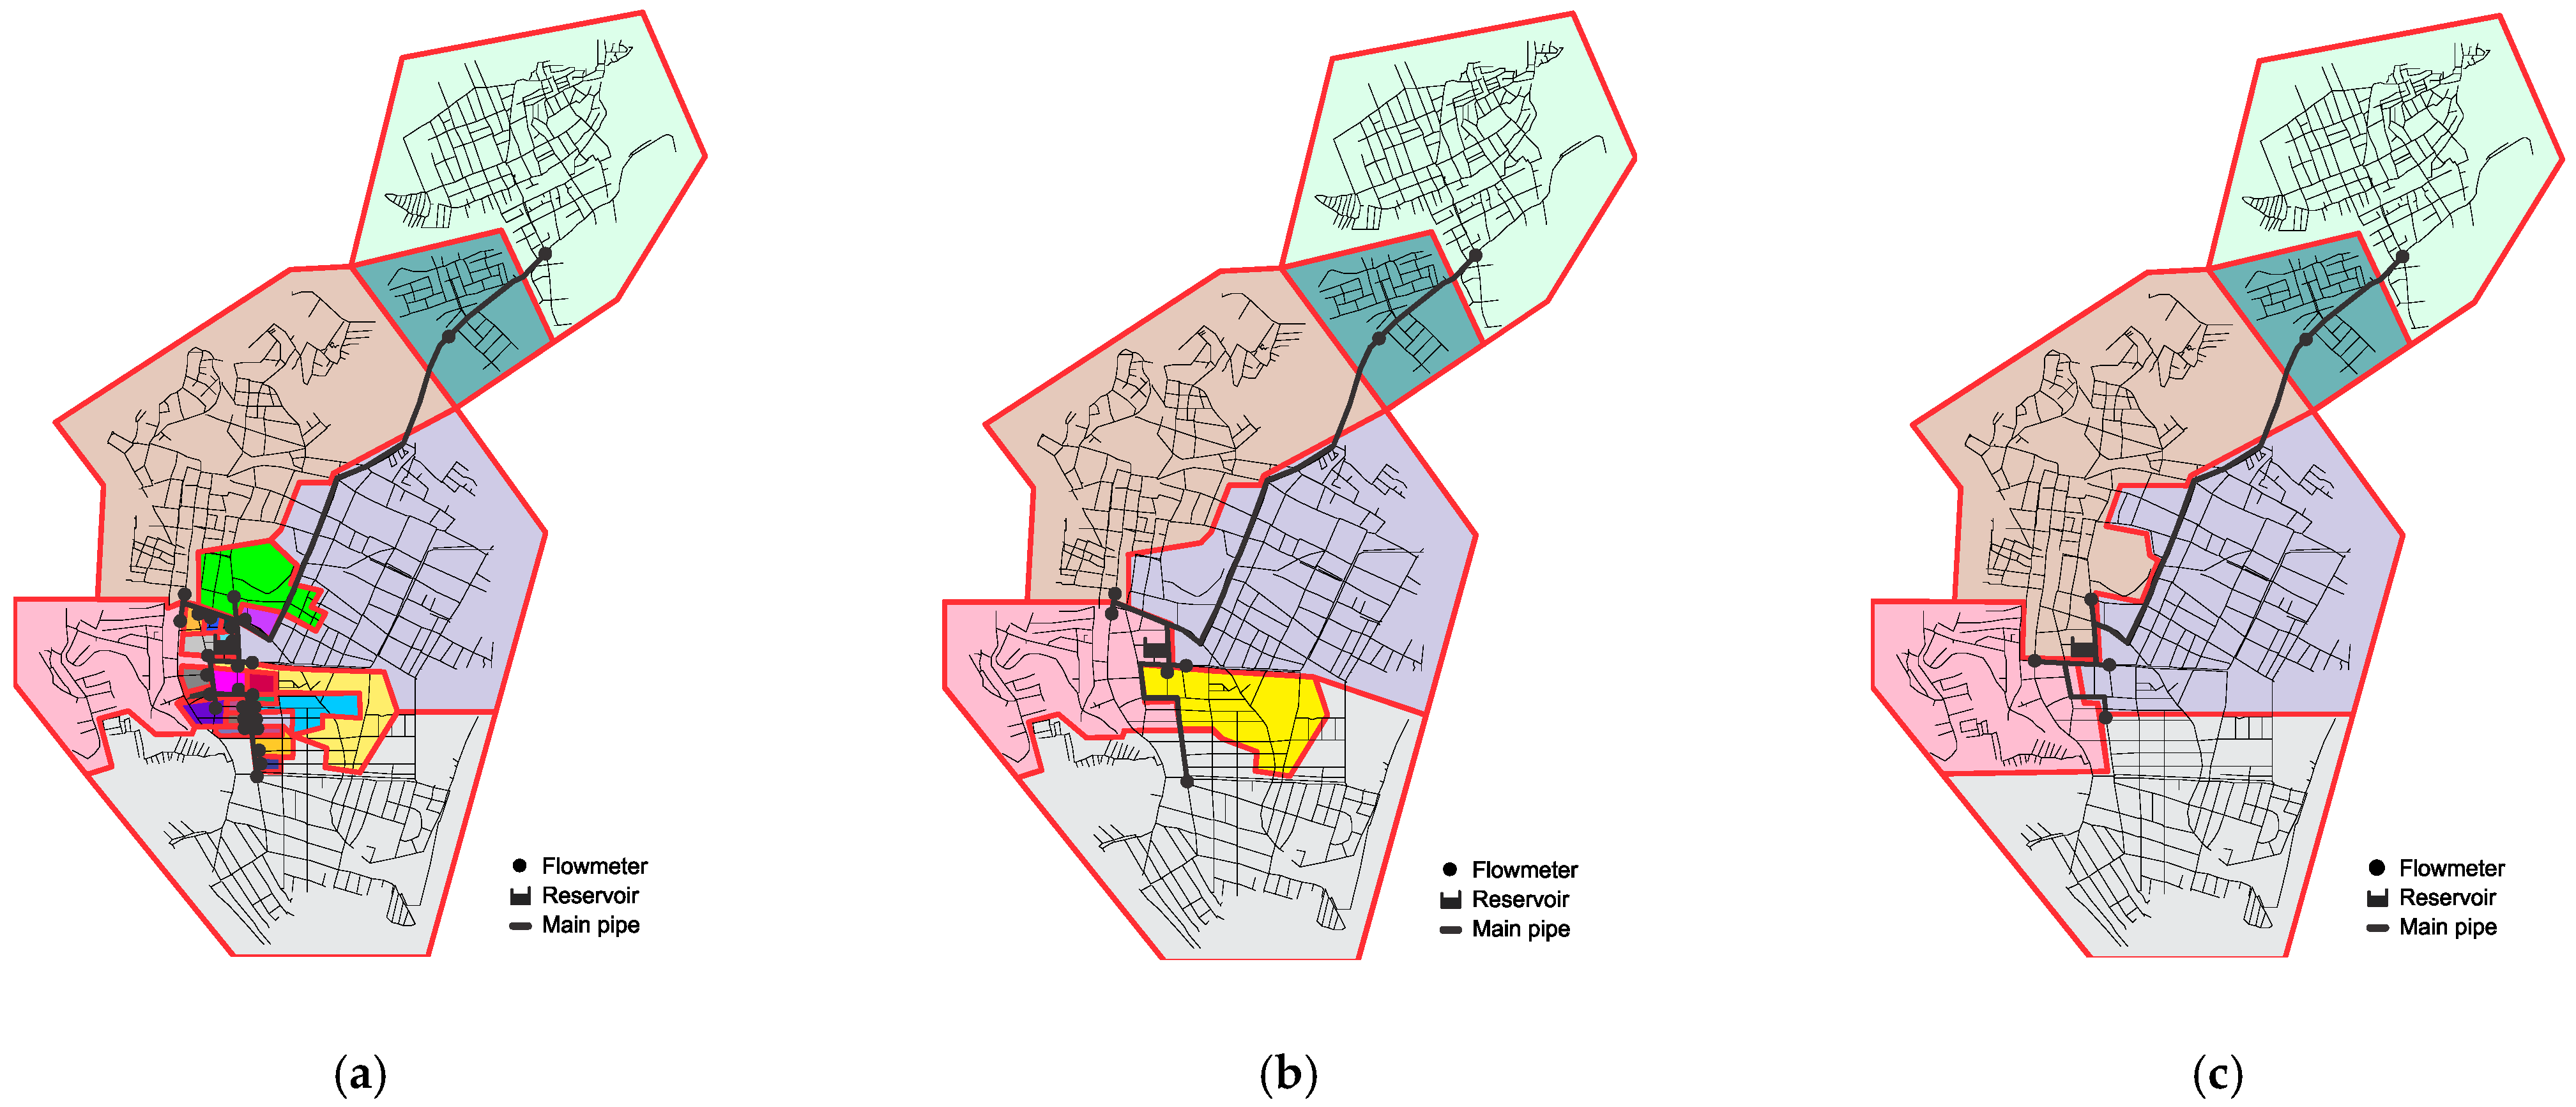
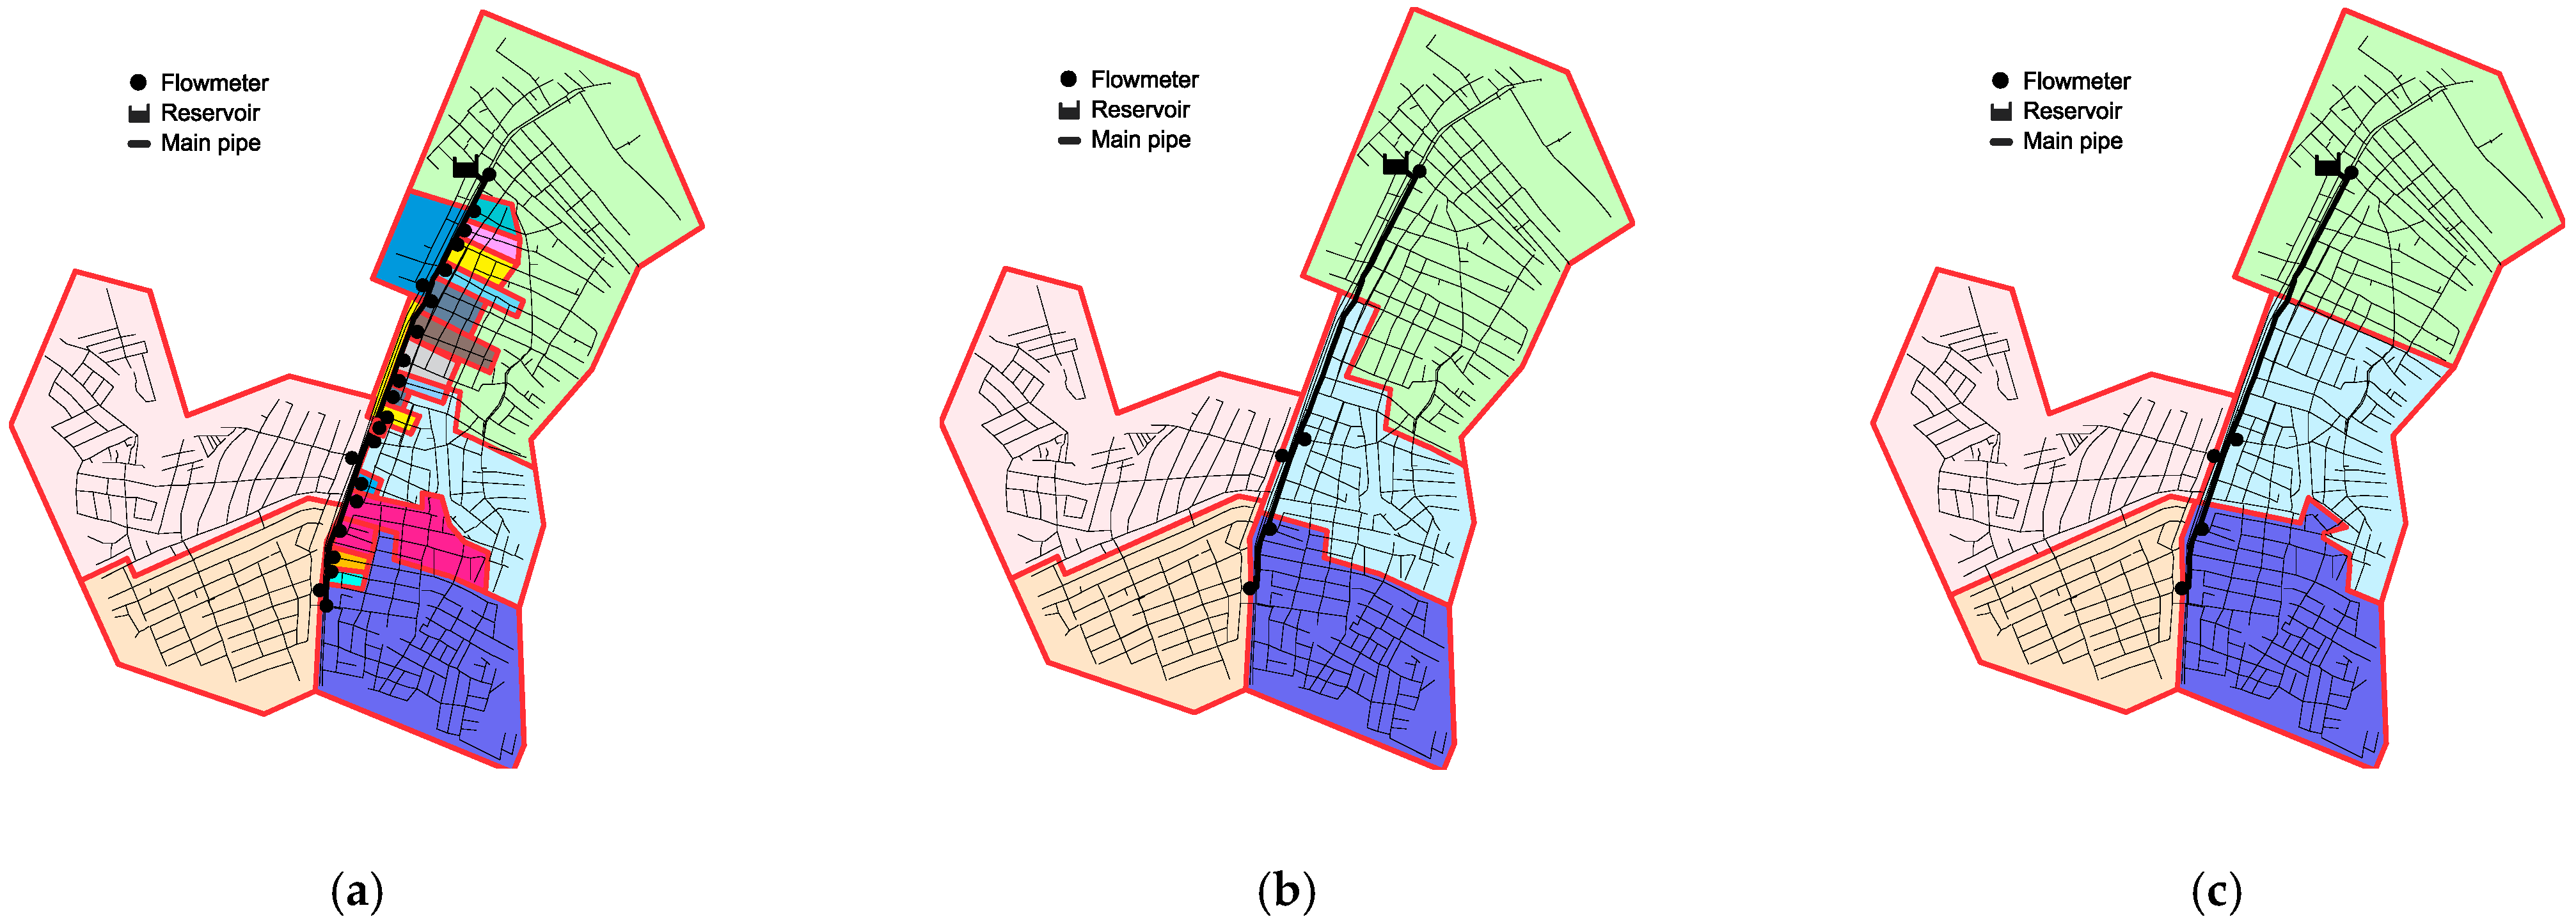
The main network was defined with 41 pipes, while the decision variables included 31 pipes. Network data were processed using the input file (.INP) generated in EPANET. After processing, matrices were created to represent the network topology as a graph, and 27 DMAs were defined through node clustering (
Figure 3a). Consequently, this sectorization option would require 27 flowmeters and 59 valves. At all stages of the model, the flows and pressures of the network were obtained by hydraulic simulation using the EPANET 2.2 software.
The DMA defined by the DSP algorithm was merged to find an economically and technically viable solution. It is noteworthy that four pipes connected to the main pipe were not part of the shortest path set of any network node and were thus excluded from the set of decision variables. The problem then had 27 decision variables, resulting in a search space with 227 = 134,217,728 combinations. To ensure the model converged to the optimal solution, particles were initialized in pre-selected positions. The pipes feeding the larger districts were initialized in position 1, while the pipes feeding the smaller districts were initialized in position 0.
The model converged to the optimal solution, as shown in
Figure 3b. The application of BPSO resulted in the creation of seven districts with lengths of 7.68 km, 30.47 km, 26.30 km, 5.97 km, 28.32 km, 26.02 km, and 11.05 km. The solution closely resembles the sectorization designed by Hidrainfo, a company contracted by the local water utility (
Figure 3c). The total cost for implementation was
$311,854.13, with
$184,786.00 allocated for valve installation and
$160,160.52 for flowmeter costs.
3.2. Pressure Zone R5
Pressure Zone R5 covers an area of 6 km
2 and contains 1154 nodes and 1417 pipes, totaling 794 km of pipes with diameters ranging from DN 50 to DN 350 (PVC and asbestos cement).
Figure 4 shows the network’s layout, highlighting the reservoir (R5), the network pipes (colored lines), and their georeferenced nodes. The piezometric head of the elevated reservoir R5 is 82.94 mca. The colored points correspond to the network nodes with their respective elevations. The dark blue lines represent PVC/PBA DN 50 pipes, the light blue represent PVC/PBA DN 75, the green represent PVC/PBA DN 100 mm, the yellow represent PVC DEFoFo DN 150 mm, and the red represent PVC DEFoFo and asbestos cement pipes ranging from DN 200 to DN 350 mm.
The main pipe was defined with 33 pipes, and the decision variables of the problem were 23 pipes. After reading the input file, matrices were created to represent the topology as a graph, and then 23 DMA were defined by clustering nodes (
Figure 5a). Therefore, 23 flowmeters and 79 valves would be required for this sectorization option. Based on the solution provided by the DSP algorithm, the optimization problem resulted in a search space with 2
23 = 8,388,608 combinations.
The model converged to the optimal solution, as shown in
Figure 5b. This solution consists of five DMAs with lengths of 29.19 km, 12.49 km, 18.74 km, 14.69 km, and 11.73 km. The model’s results closely resemble the sectorization designed by Hidrainfo (
Figure 5c). The total cost of implementing this sectorization was
$311,854.13, with
$184,786.00 for valve installation and
$160,160.52 for flowmeters. This cost analysis highlights the economic feasibility of the model, especially when considering the potential reduction in water losses and the operational improvements facilitated by the new sectorization.
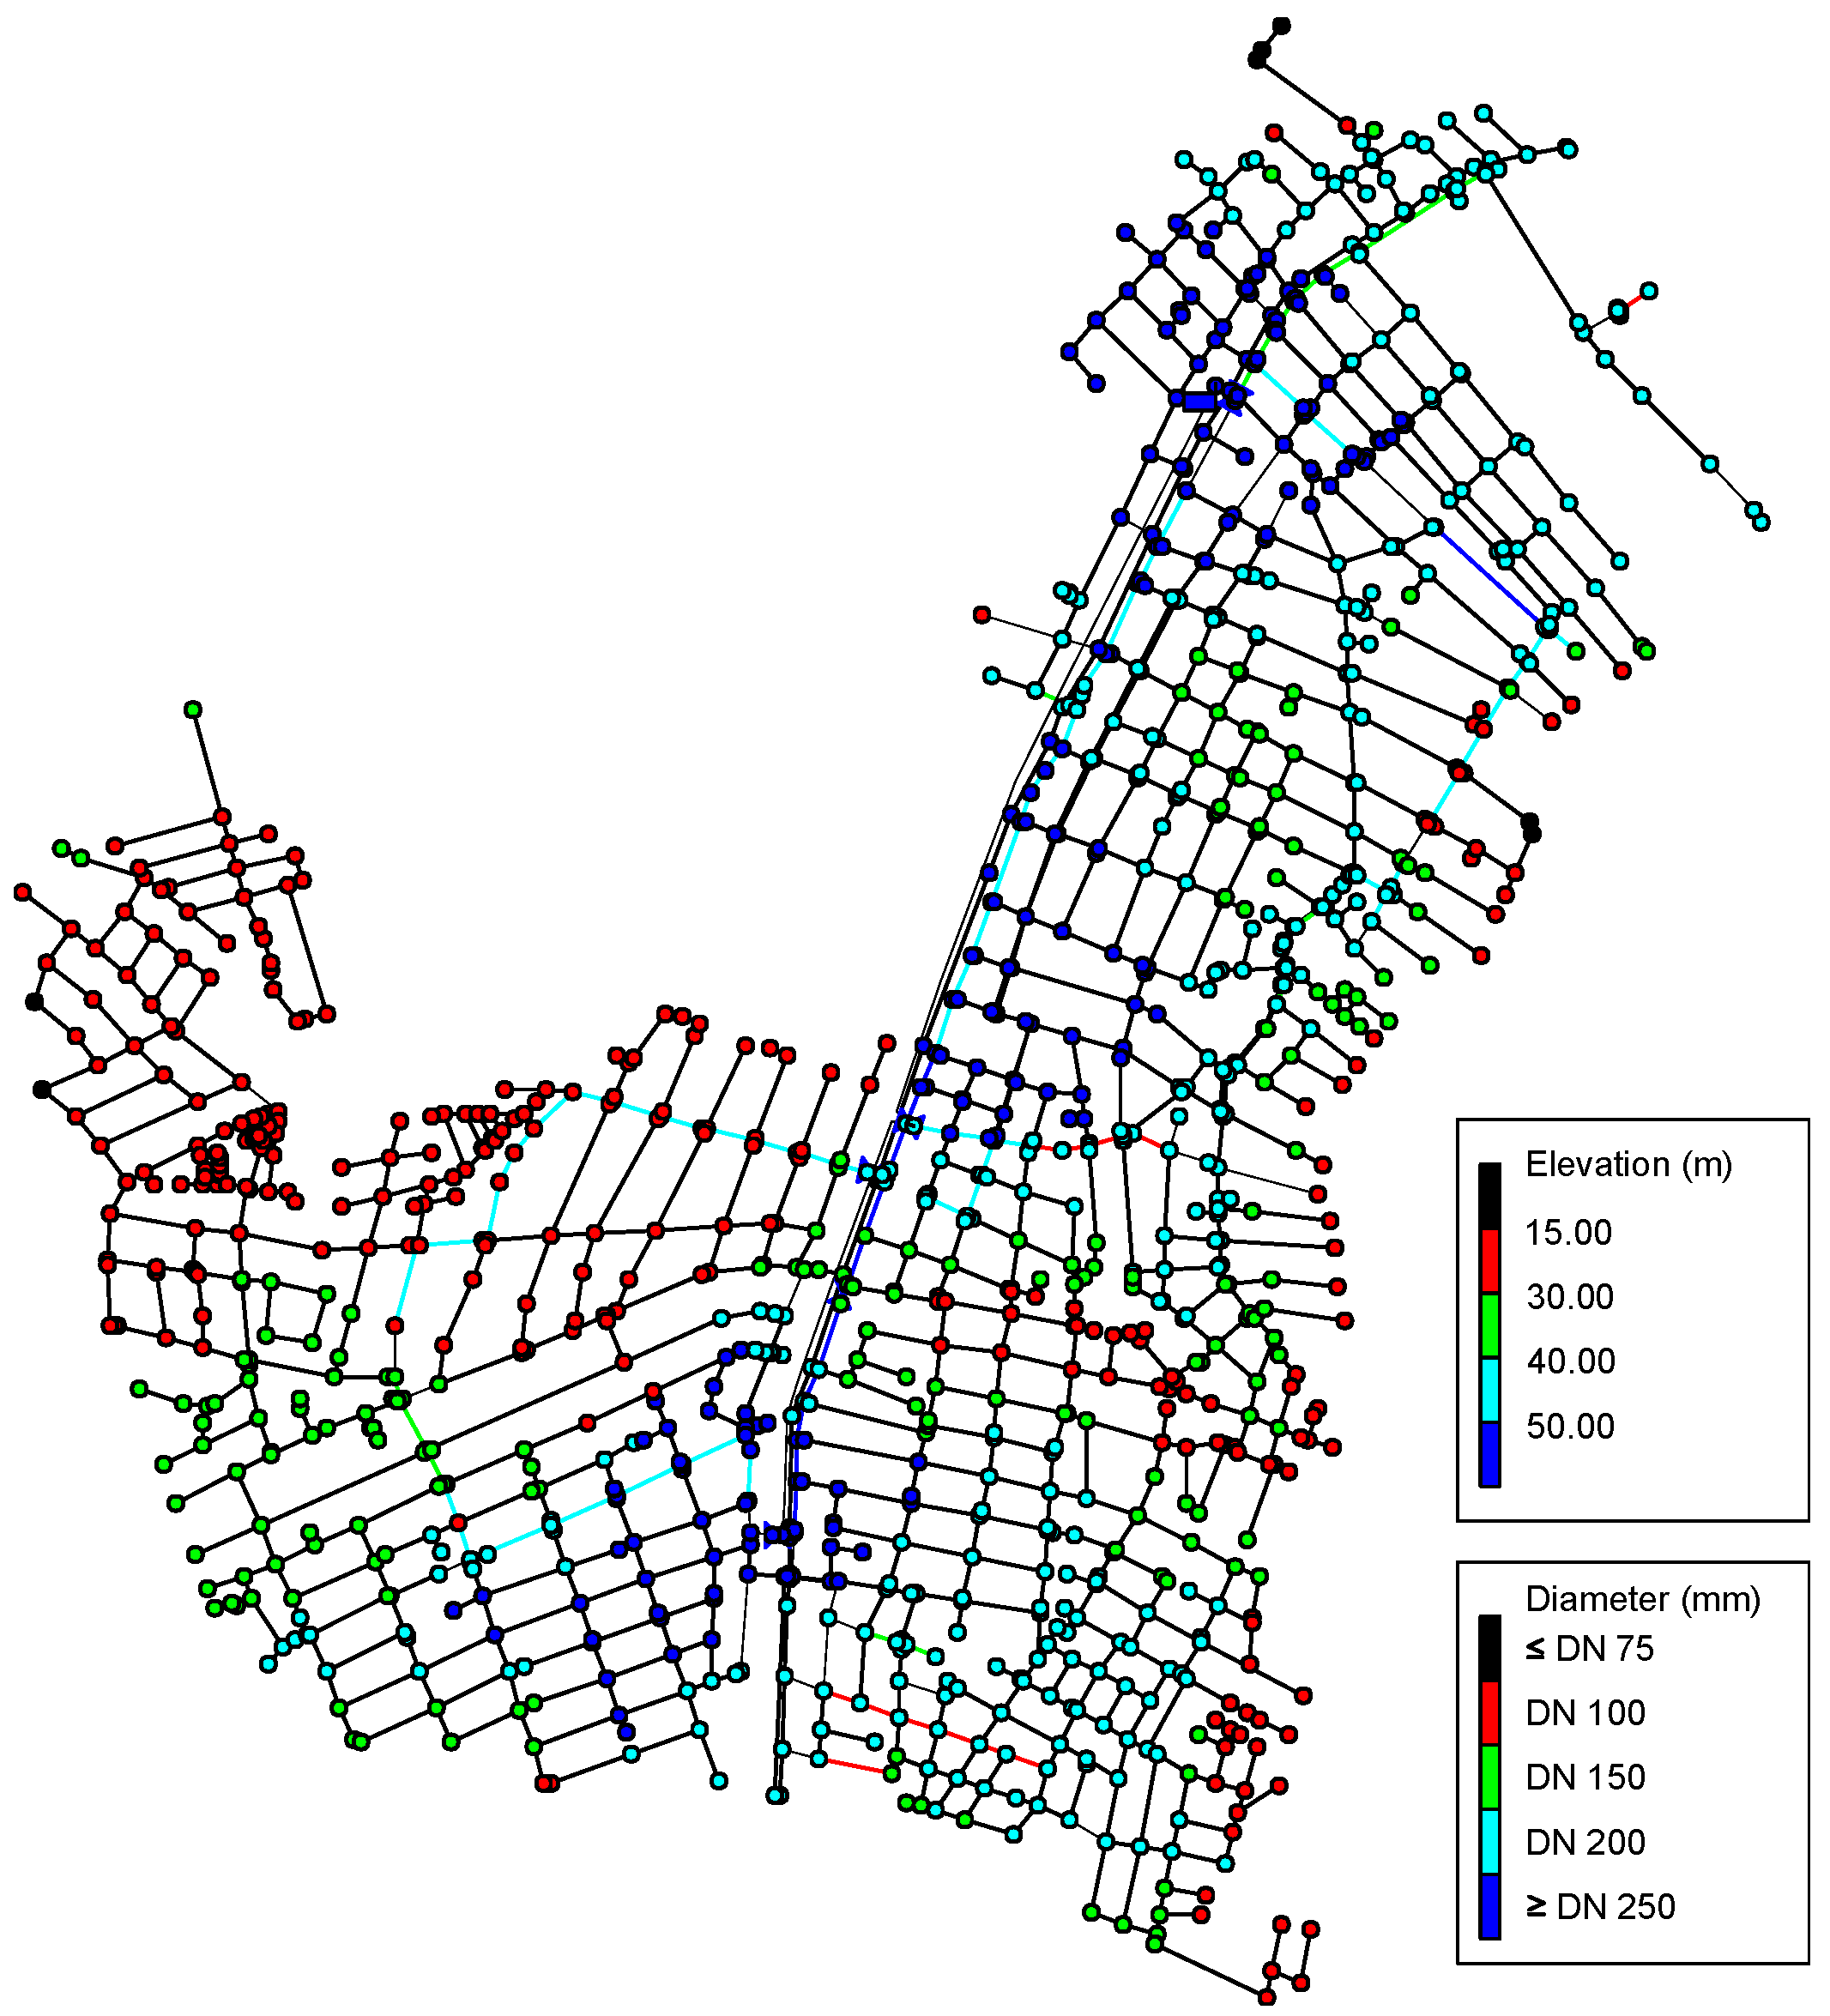
3.3. Pressure Zone R37
Pressure Zone R37 covers an area of 17 km
2 and contains 1043 nodes and 1249 pipes, totaling 1149 km of pipes with diameters ranging from DN 50 to DN 600 (PVC and cast iron).
Figure 6 shows the network’s layout, highlighting the reservoir (R37), the network pipes (colored lines), and their georeferenced nodes. The piezometric head of the elevated reservoir R37 is 75.15 mca. The colored points correspond to the network nodes with their respective elevations. The lines in dark blue are PVC/PBA DN 50 mm; in light blue, PVC/PBA DN 75 mm; in green, PVC/PBA DN 100 mm; in yellow, PVC DEFoFo DN 150 mm; and in red, PVC DEFoFo and cast-iron pipes, ranging from DN 200 mm to DN 600 mm.
The main pipeline consisted of 18 pipes, and the decision variables for the problem involved 10 pipes.
Figure 7a shows the solution obtained using the DSP algorithm, which includes ten DMAs isolated by 16 valves. The hybrid model converged to the optimal solution, as shown in
Figure 7b, resulting in five DMAs with lengths of 24.89 km, 17.56 km, 25.08 km, 16.45 km, and 29.97 km. The model’s results closely resemble the sectorization designed by Hidrainfo (
Figure 5c). The total cost was R
$ 147,934.99, with
$38,923.90 allocated for valve installation and
$109,011.09 for flowmeters.
The pre-selection of particles in the BPSO algorithm proved to be an effective strategy for accelerating convergence. This allowed the algorithm to quickly identify the most promising configurations, reducing computational time while ensuring high-quality solutions.
3.4. Discussion of the Results
The hybrid model demonstrated significant potential for optimizing water distribution networks, effectively balancing economic and technical aspects of DMA design. The solution presented can streamline decision-making for water utilities since the model provides an economically viable and technically sound solution.
The decision to formulate the problem as a single-objective optimization was motivated by the intended application of the methodology as a practical tool for professionals in the sector. In many cases, utilities and engineers seek actionable, direct solutions rather than a range of possibilities that require further interpretation. However, we acknowledge that exploring trade-offs in decision-making is crucial for understanding different system configurations. In this context, future extensions of the model could incorporate multi-objective optimization strategies to offer decision-makers additional flexibility in defining DMA sizes while balancing cost considerations.
Unlike the approach adopted in some countries, where utilities aim to have multiple connection points to ensure resilience, the practice in Brazil typically prioritizes having a single entry point for each DMA. This preference is driven by operational and management concerns. When implementing DMAs, the segments that need to be closed are often physically cut to prevent unauthorized openings in the future. This approach ensures the effective isolation of the DMA, as multiple possible entries could compromise the isolation. While this strategy reduces operational flexibility, it addresses specific management challenges present in the local context.
The cost analysis of the three water distribution systems revealed that the model’s solutions were not only technically feasible but also cost-effective. The ability to reduce the number of required flowmeters and valves while maintaining system performance highlights the practical applicability of the hybrid model for real-world sectorization projects. The integration of existing valves can further reduce intervention costs. When a valve is already installed in a proposed section, the algorithm assigns a zero cost for its closure. However, this possibility was not considered in the case studies due to the lack of detailed information regarding valve locations in the utility database.
The consistency of the results across different large-scale systems—each with distinct topological and hydraulic characteristics—demonstrates the robustness and versatility of the model. Although the similarity between the solutions generated by the model and those obtained by a specialized sectorization company (Hidrainfo) validates the approach, it raises the question of the additional value that this automation provides. The model’s main advantage lies in its ability to streamline and automate the design process, making it accessible to professionals with varying levels of experience. For less experienced technicians, the model provides a structured framework for creating viable sectorization designs, reducing reliance on intuition and the tacit knowledge of specialists. For experienced professionals, the tool represents a significant advancement in terms of time savings and efficiency, particularly for large and highly complex networks, where manual trial-and-error approaches are impractical. Moreover, the integration of PSO-based economic optimization helps minimize intervention costs, reinforcing the model’s cost-effectiveness and extending its applicability beyond merely replicating solutions previously conceived by experts.
In the analysis of the case studies, two key constraints were imposed to ensure the feasibility of the proposed solutions. First, the minimum network pressure was set at 10 m to guarantee adequate service levels for all consumers (
Figure 8), with the minimum pressures observed in pressure zones R1, R5, and R37 being 10.7 m, 10.16 m, and 10.01 m, respectively. Second, the maximum allowable extension for each DMA was limited to 30 km. These constraints were incorporated into the optimization process, ensuring that the proposed solutions adhered to technical requirements.
This model provides a practical solution to the immediate needs of water utilities. The proposed approach offers a valuable tool for increasing the efficiency and reliability of water supply systems in cities facing rapid growth and increasing demand.
4. Conclusions
This study presented a hybrid model for the optimized sectorization of water distribution systems, combining graph theory with the BPSO algorithm. The application of the model to three real water distribution systems in the city of João Pessoa, Northeast Brazil, demonstrated its effectiveness in identifying economically viable solutions that meet imposed hydraulic and operational constraints.
In practical terms, the model demonstrated significant potential for application in sectorization projects, particularly in medium- and large-scale water distribution systems. The solutions obtained were consistent with the expected results from specialists, reinforcing the robustness of the method.
Therefore, the presented methodology offers an efficient and practical tool for the sectorization design, contributing to water loss reduction and operational cost optimization. It also aligns with the Sustainable Development Goals (SDG), particularly SDG 6, promoting sustainable management of water resources and reinforcing water supply resilience in the face of climate change and water scarcity.
As a proposal for future work, it is suggested to include network rehabilitation actions in the methodology. In this context, the hybrid model, in addition to defining the districts, would identify the actions necessary to technically enable sectorization. These actions may involve the cleaning, replacement, and duplication of pipes. Consequently, the objective function should be reformulated to incorporate the costs associated with the rehabilitation actions.


