Article

Climate Policy Uncertainty and Enterprise Working Capital Management Efficiency

1
School of Accounting, Dongbei University of Finance and Economics, Dalian 116025, China
2
The Research Center for Internal Control in China, No. 217 Jianshan Street, Shahekou District, Dalian 116025, China
Sustainability 2025, 17(9), 4229; https://doi.org/10.3390/su17094229
Submission received: 27 March 2025 / Revised: 2 May 2025 / Accepted: 5 May 2025 / Published: 7 May 2025

Abstract

:
This study explores the effect of climate policy uncertainty on corporate working capital management efficiency. Investigating this problem may provide advice to mitigate the impact of climate policy uncertainty on firms. We used Chinese A-share listed companies’ data, spanning from 2007 to 2023, and discovered that climate policy uncertainty reduced companies’ working capital management efficiency. Mechanism research found that climate policy uncertainty reduced firms’ working capital management efficiency by increasing the transaction costs, lowering specific asset investment, and increasing inventory turnover days. Furthermore, our heterogeneity analysis indicated that the impact of climate policy uncertainty on working capital management efficiency was more pronounced in enterprises in the western and central regions, areas with lower marketization levels, and regions with lower highway density. By exploring the influence of climate policy uncertainty on working capital management efficiency, we have expanded the understanding of how climate policy uncertainty affects corporations and enriched research about corporate working capital management efficiency. We recommend that the government enhance the transparency of climate policies and reduce the frequency of policy changes. Furthermore, we advise enterprises to maintain close relationships with their customers and suppliers to mitigate the impact of climate policy uncertainty on working capital management efficiency.

1. Introduction

The Global Risks Report, released by the World Economic Forum in 2023, highlights that global efforts to address climate change have been slow and have not met expectations, posing a significant risk for the future. Climate change has impacted ecosystems, human production, and living conditions, prompting countries to take more actions to cope with climate change [1]. Over the past years, various countries’ governments have enacted many climate- and environment-related policies to mitigate climate change by reducing pollutant emissions [2,3]. However, reducing pollutant emissions and slowing down the speed of climate change require time and many policy adjustments [4].
From a practical perspective, China has announced some policies to cope with climate change and has enacted numerous climate and environmental governance policies, such as low-carbon transition policies [5,6], renewable energy subsidy policies [7,8,9,10], and carbon trading market policies [11], promoting green consumption [12] and the use of low-carbon technologies [13]. Specifically, China implemented carbon market pilot policies in 2013, and multiple pilot programs have been carried out between 2013 and 2024. The carbon trading market has expanded during this time, effectively reducing corporate emissions [11]. From 2006 to 2020, the Chinese government introduced many renewable energy subsidy policies [14], and research has found that the government subsidies have improved firms’ energy transition performance [8].
The above policies indicate that China’s climate policies have effectively reduced carbon emissions and promoted progress toward carbon neutrality. However, it is not easy for companies to cope with climate policy changes, which may introduce uncertainty for enterprises. Once a policy is implemented, firms that have just received the information may need to rapidly modify their production processes to comply with relevant climate policy requirements. This could alter the product types and the length of their production cycles. The criteria of climate policies may also affect firms’ sales activities, thereby influencing the efficiency of working capital management.
From an empirical research perspective, studies on the impact of policy uncertainty on supply chain management have found that domestic policy uncertainty prompts firms to seek suppliers internationally [15]. When policy uncertainty is high, companies tend to accumulate more inventory [16]. Other research has shown that firms with predominantly domestic sales will reduce their number of foreign suppliers when U.S. trade policy uncertainty increases. In contrast, firms with predominantly foreign sales will increase their number of foreign suppliers [17]. Research on policy uncertainty has found that economic policy uncertainty significantly reduced financial stability and increased firms’ voluntary disclosure [18,19]. Other studies have shown that political and regulatory uncertainty diminishes corporate merger and acquisition activities [20]. Furthermore, economic policy uncertainty has been found to decrease corporate investment [21].
Overall, economic policy uncertainty, much like climate policy uncertainty, tends to decrease firms’ investment [21,22,23]. However, unlike other forms of uncertainty, climate policy uncertainty tends to impact firms’ production and operational activities directly [24]. Some research has found that climate policy uncertainty may increase material costs, extend delivery times for goods, and upgrade production facilities [25,26]. These factors may affect firms’ working capital management. Furthermore, a relatively large amount of research on economic policy uncertainty covers many topics [18,19,20,21]. In contrast, studies focusing on climate policy uncertainty are comparatively scarce, which leaves an opportunity for our research.
Our study’s primary question is whether climate policy uncertainty affects corporate working capital management efficiency. How does climate policy uncertainty impact corporations’ production and operational activities? We used data from Chinese A-share listed companies from 2007 to 2023 to explore these questions. The results reveal that climate policy uncertainty reduces a firm’s working capital management efficiency. Mechanism testing reveals that climate policy uncertainty raises transaction costs, prolongs inventory turnover periods, and reduces specific asset investment, thereby decreasing firms’ working capital management efficiency. Heterogeneity analysis reveals that the effect of climate policy uncertainty on corporate working capital management efficiency is more pronounced in firms located in the western and central regions, areas with lower levels of marketization, and regions with lower highway density. Based on the above results, the government should enhance the transparency of climate policies and avoid frequent policy fluctuations within short periods. On the other hand, enterprises should strengthen communication with customers and suppliers to stabilize production and sales, thereby reducing the impact of climate policy uncertainty on their operations.
Our research has three significant contributions. First, we expand the scope of studies about working capital management efficiency. Existing research has found that the corporation’s characteristics [27], supply chain’s features [28,29], and relationships with suppliers and customers can influence working capital management efficiency [30]. However, research has focused little on how climate policy uncertainty affects working capital management efficiency. Our study extends the boundaries to the dimension of the business environment in which enterprises operate, thereby enriching research about working capital management efficiency.
Second, by extending the focus of climate policy uncertainty beyond corporate financing [31], investment [22,32], production [24], and asset returns to include companies’ working capital management efficiency [33], our study enriches the understanding of its impact on corporations. Few studies examining the impact of climate policy uncertainty on company operations highlight the need for this research, which expands and supplements the existing literature. Overall, we have expanded the scope of research on the impact of climate policy uncertainty on firms and provided advice for climate policy.
Third, our study examines how climate policy uncertainty affects the efficiency of corporate working capital management. We find that climate policy uncertainty increases firms’ transaction costs, reduces specific assets investment, and lengthens inventory turnover periods. These factors collectively influence the transactional activities between firms, their customers, and suppliers, thereby impacting the efficiency of working capital management. Our research offers advice to mitigate the impact of climate policy uncertainty on enterprises. In the face of such uncertainty, companies can improve their working capital management efficiency by rationally organizing production, reducing costs, and actively maintaining customer relationships.

2. Literature Review

Existing research has extensively examined the impact of climate policy uncertainty on corporate investment, financing, production, asset returns, and risk spillovers across markets. Regarding financing, some research affirms that climate policy uncertainty has increased companies’ financing costs [2,31]. However, the conclusions about investment are inconsistent. Some studies assert that climate policy uncertainty can reduce companies’ investment [22,32,34,35,36], while others argue that it stimulates investment [37]. From the perspective of companies’ production and operational activities, studies have found that climate policy uncertainty may lead to changes in consumption and production behaviors [24], significantly impact energy-related industries, as well as affect companies’ operations and increase the uncertainty of future project returns [38]. Furthermore, climate policy uncertainty has been found to decrease returns on fossil energy assets and influence stock returns and market volatility [33,39,40]. It also exacerbates extreme risk spillover effects [41]. In summary, while there is some research about the impact of climate policy uncertainty on various corporate activities, there remains a relative paucity of studies focusing on its effects on production and operations, and there is a lack of research about corporate working capital management efficiency. Production, sales, and operation are important parts of working capital management. Therefore, it is essential for companies to explore the influence of working capital management from the perspective of climate policy uncertainty.
In studies on the efficiency of working capital management, the proxy variables for working capital management efficiency have undergone a series of changes. Mao (1995) explored the optimal levels of various working capital items [42], while Knight (1972) examined the overall optimal level of multiple working capital components [43]. Subsequently, more research focused on using the operating cycle, working capital requirements, net trade cycle, and cash conversion cycle to measure the efficiency of working capital management. As cash conversion is a key process in working capital management, Wang (2019) defines the cash conversion cycle (CCC) as the period between the outflow of cash for purchasing material and the inflow of cash from product sales [44]. Therefore, many studies use the cash conversion cycle to measure working capital management efficiency [45].
From the perspective of the impact of working capital management efficiency on corporates, early research primarily explores the impact of working capital management efficiency on corporate profitability [46]. A study suggests an optimal level of working capital management efficiency. Achieving this optimal level can enhance companies’ performance [47]. Similarly, Habib and Dalwai (2024) have found that working capital management efficiency can increase a firm’s performance [48].
Some literature focuses on the impact of firm characteristics, suppliers and customers, and supply chain characteristics on corporate working capital management. Existing studies have examined how corporate characteristics and business decision-making behaviors influence working capital management efficiency in firms [27,49]. Other research has revealed that managers’ loss aversion, overconfidence, stubbornness, and self-serving behaviors can prevent working capital management efficiency from reaching optimal levels [50]. Sawarni et al. (2023) found that earnings management negatively affected the working capital management efficiency in Indian firms [45]. Banerjee and Guha (2024) found that managerial capabilities can enhance a corporation’s working capital management efficiency [51].
From the perspective of suppliers and customers, the close relationships between companies within a supply chain are more likely to become competitive due to conflicts of interest or constraints caused by sunk costs, which can adversely affect the efficiency of capital allocation within companies [52]. In such situations, customers may leverage their market power to demand that companies adopt credit sales as a core transaction model, which can encroach upon their working capital [53]. According to Cunat (2007) [54], customers with higher bargaining power may leverage their advantageous position in commercial transactions to increase the coercion and resource encroachment on companies at a competitive disadvantage. Similarly, aiming to convey high-quality signals or provide quality assurance to customers, companies producing differentiated products offer more commercial credit to customers, which can decrease the performance of finance [55]. To maintain product–market relationships and the stability of the supply chain, companies typically strive to meet the commercial credit requirements of their key customers whenever possible [30]. In real-world scenarios, the circulation of corporate working capital often involves stakeholders such as customers [56]. Gosman and Kohlbeck (2009) argue that customer digital transformation has not effectively improved corporate working capital management efficiency [57]. However, Luo and Kumar (2013) suggest that customer digital transformation may leverage digital technologies to strengthen inter-company connections, positively impacting firms’ working capital management efficiency [58].
From the perspective of the supply chain characteristics, Hofmann (2010) proposed collaborative ways to increase companies’ working capital management efficiency [28]. Peng and Zhou (2019) found that inter-firm collaborative management can affect enterprises’ working capital management efficiency [29].
In summary, the existing literature has explored the factors that could influence corporate working capital management efficiency, including corporate and supply chain characteristics and supplier and customer relationships. However, there is a lack of analyses from the perspective of policy uncertainty, particularly concerning climate policy. Overall, the policy environment could influence companies’ operations and production. Climate policy uncertainty, which has been focused on recently, could influence companies’ working capital management from production to operation. Therefore, our study is meaningful and valuable.

3. Theoretical Analysis and Hypotheses

Existing research finds that companies’ relationships with customers and suppliers influence working capital management efficiency [54,56,57]. Specifically, a firm and its customers and suppliers achieve production specialization through the input and output of intermediate goods, thereby providing channels for transmitting internal and external risks [59]. Therefore, when companies within the supply chain face uncertainty regarding climate policies, such uncertainty may impact their production processes and workforce management. It could also expose companies to transition risks [8,13], compelling them to adapt their production methods to reduce carbon emissions and produce sustainable goods. Consequently, changes may occur in their production, sales, and procurement activities. A firm’s relationship with its customers and suppliers is inseparable; so, company production changes may impact the relationship. When a company’s production changes, it can decrease the stability of procurement and sales activities. As a result, the company’s relationship with its suppliers and customers is less close than before, which increases the transaction cost and prolongs the transaction period, thereby decreasing the efficiency of working capital management. Furthermore, due to uncertainties in climate policy, a company’s sales activities may be affected by policy requirements, leading to a decrease in the inventory turnover rate, thereby impacting the firm’s working capital management efficiency. After the above analysis, we propose Hypothesis 1.
H1: 
Climate policy uncertainty can reduce corporate working capital management efficiency.
In terms of transaction costs, companies must promptly respond to potential changes brought about by such uncertainties when faced with high uncertainty in climate policies. These changes may include producing products required or encouraged by production policies or undergoing a green transformation [10,13]. For example, research suggests that policy uncertainty can increase companies’ management costs [60]. Furthermore, market segmentation is continuously refined and deepened in the modern social division of the labor system. Domestic and international enterprises form interdependent and closely connected supply chain networks by distributing production stages [59,61]. Once there is a strong impact from external uncertainty risks, disruptions in key customer relationships within the supply chain can cause significant losses to enterprises [59]. Working capital management involves obtaining receivables from companies’ customers. Changes and increased complexity in management processes related to production can affect a company’s communication and interaction with its customers and suppliers, thereby impacting the transaction costs.
In transaction cost theory, transactions between supply chain members are regarded as specific units of analysis [62]. Transaction uncertainty may influence a firm’s decision-making regarding future transactions. Increasing transaction uncertainty can lead to higher supervision and bargaining costs, raising the firm’s costs. Studies have found that reducing transaction costs, such as coordination costs within firms, can lead to changes in production, management, sales, and procurement models [63], thereby effectively enhancing corporate governance and operational efficiency. Therefore, as the degree of climate policy uncertainty rises, it may increase the complexity of production and management, affecting communication between companies and their customers and suppliers. This situation can lead to higher procurement, production, and sale transaction costs. In this situation, transactions between companies, their customers, and suppliers may be impacted, increasing the complexity of companies’ operations and management and reducing firms’ working capital management efficiency. Based on our analysis, we propose Hypothesis 2.
H2: 
Climate policy uncertainty can reduce companies’ working capital management efficiency by increasing the transaction costs.
Specific asset investment refers to highly specialized and durable investments made by a company to establish contracts with partners in the supply chain. Companies could use specific assets to produce goods that customers want and strengthen their relationships with them. Williamson (2007) reported that specific assets are one of the coordination mechanisms to ensure smooth transactions [64]. They are important for enhancing operational efficiency and adding value to the supply chain [65]. Increasing investments in specific assets can signal to the outside world that a company is committed to building long-term collaborations. This behavior helps enhance customer trust and satisfaction, which is beneficial for maintaining stable relationships between companies and customers [66].
According to the real options theory, companies often reduce investment when uncertainty is high [67]. When companies obtain more information, they may make decisions about future development. Research suggests that corporations may reduce investment when climate policy uncertainty is high [32,34]. Furthermore, climate policy uncertainty may pose risks related to production transformation [8,13]. Therefore, when climate policy uncertainty increases, companies may reduce specialized asset investments to mitigate the risks associated with potential product transformation. Reducing such investments may weaken the stability of a company’s relationship with customers. Customers may buy products from other companies. This situation can make it difficult for the company to sell products in time and collect customer receivables, leading to decreased working capital management efficiency. Based on the real options theory and our analysis, we propose Hypothesis 3.
H3: 
Climate policy uncertainty can reduce firms’ working capital management efficiency by decreasing specific asset investment.
From the perspective of inventory turnover days, changes in climate policies may expose companies to transition risks, such as requirements to use low-carbon technologies in production or the imposition of carbon taxes on corporations [11,13]. These policies may alter enterprises’ production processes, affecting product production and sales. An efficient inventory flow from companies to customers is a core aspect of supply chain management [68]. It has a big impact on companies’ working capital management. Furthermore, when companies face uncertainty in climate policies, they may encounter the risk of supply chain disruptions. For instance, existing research suggests that when companies are exposed to risks, their partners may reduce product transactions with the affected companies, leading to a decline in sales performance and a deterioration in their supply chain position [69,70]. Therefore, climate policy uncertainty may impact production and sales throughout the supply chain.
According to the supply chain management theory, rational planning and coordination of material flows, information transmission, and financial transactions among enterprises can effectively enhance operational efficiency [71]. During production and operating activities, companies purchase raw materials from suppliers, process them into goods, and then sell them to customers. A company’s inventory turnover days represent the cycle speed of this process. Research has found that climate policy uncertainty increases fluctuations in raw material supply [72], which may affect firms’ inventory turnover days. When climate policy uncertainty is high, such uncertainty may compel companies to upgrade the production processes, reduce pollutant emissions, and face delays in delivering intermediate goods [25]. Under these circumstances, companies’ production speed may decrease, potentially impacting product sales and extending the sale cycle. Consequently, this could increase firms’ inventory turnover days, thereby reducing working capital management efficiency. Based on our analysis, we propose Hypothesis 4.
H4: 
Climate policy uncertainty can reduce firms’ working capital management efficiency by increasing inventory turnover days.
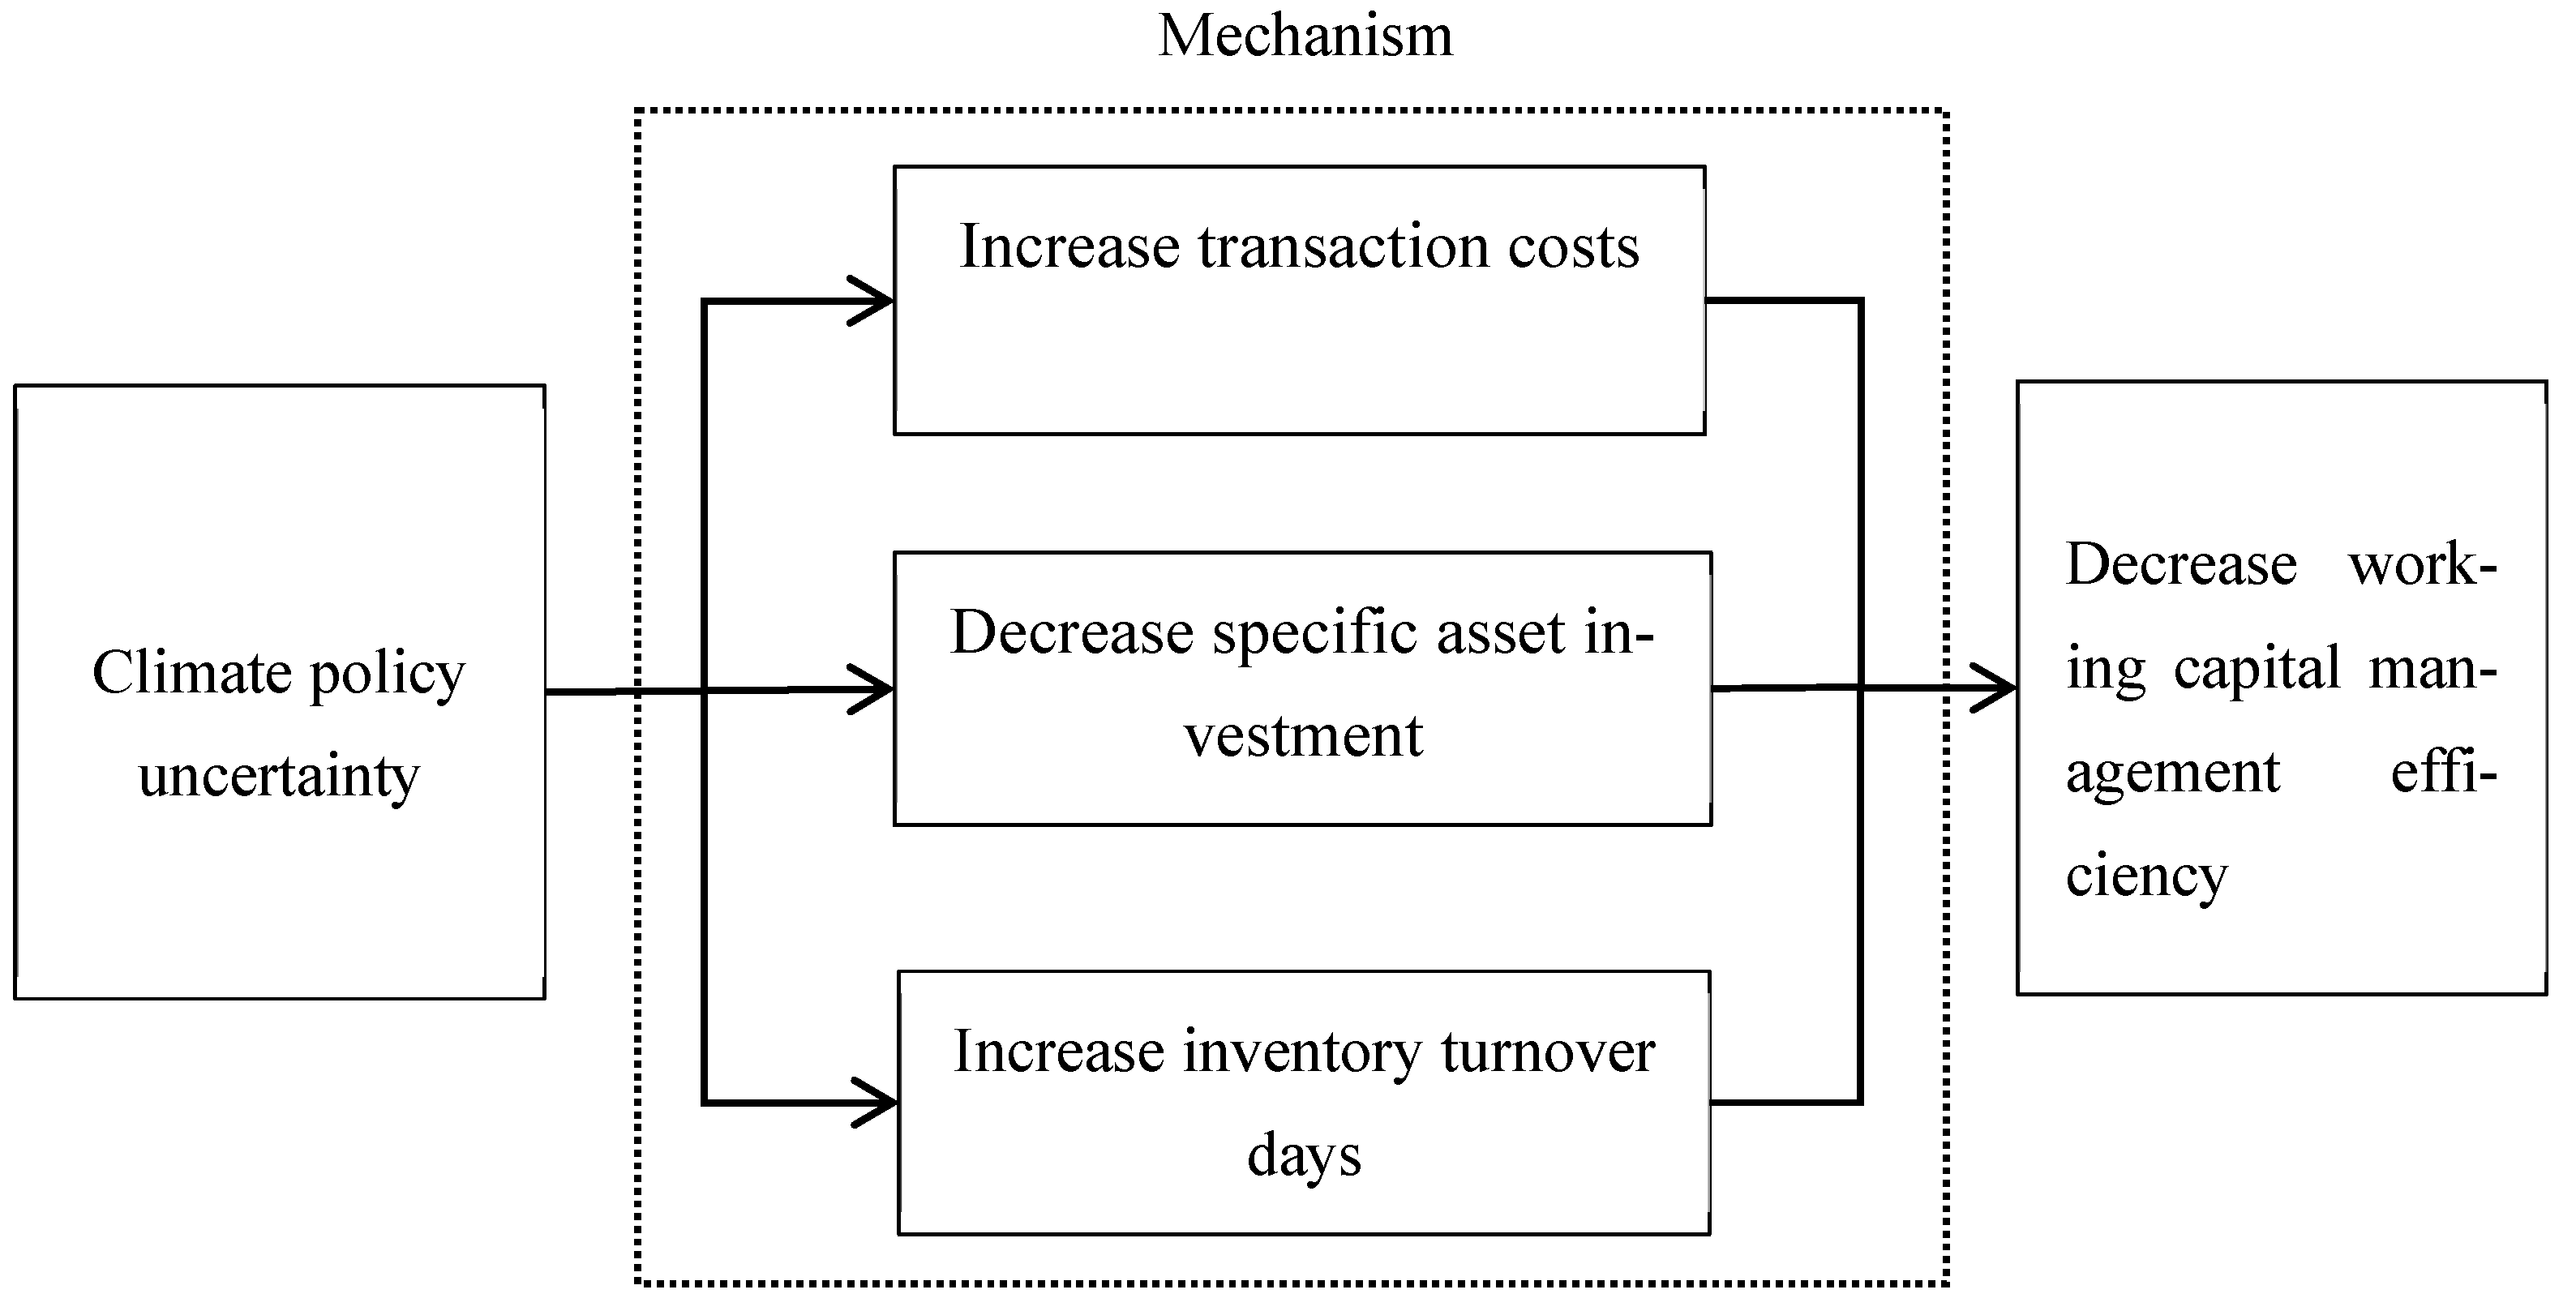
Based on the above analysis and hypothesis, we drew Figure 1 to illustrate the mechanism proposed in this paper.

4. Research Design

4.1. Research Data

Lee and Cho (2023) calculated China’s climate policy uncertainty index by extracting articles related to climate policy uncertainty from social media [73]. Following the methodology of Lee and Cho (2023) [73], we used the city-level climate policy uncertainty index to measure the independent variable. Our study utilized data from Chinese listed companies from 2007 to 2023. China updated its accounting standards in 2007; so, we selected 2007 as the starting point for our sample. We mainly used data from the China Stock Market and Accounting Research (CSMAR) database to obtain information on working capital management efficiency and all other relevant data. We processed the data as follows: (1) companies with special treatment status (ST or *ST) were excluded; (2) firms in the financial industry were removed; (3) firms with missing variables were excluded; (4) all continuous variables were winsorized at the 1% level. (5) We excluded samples with missing values. Data processing was conducted using Stata 17.

4.2. Variable Definition and Model Specification

Dependent variable. The proxy variables for working capital management efficiency have undergone several changes. Knight (1972) examined the overall optimal level of multiple working capital components [43]. Subsequently, more research began to use the operating cycle, working capital requirements, net trade cycle, and cash conversion cycle to measure the efficiency of working capital management. As cash conversion is a key process in working capital management, Wang (2019) defines the cash conversion cycle (CCC) as the period between the outflow of cash for purchasing material and the inflow of cash from selling products [44]. The cash conversion cycle (CCC) is usually used to measure the working capital management efficiency [74]. Therefore, in the baseline analysis, we followed the approach of Wang and Wang (2024) and Shin and Soenen (1998) [75,76], incorporating prepaid and advance accounts into the CCC and using the CCC to measure the working capital management efficiency. To minimize variance, we adjusted the working capital management efficiency measure annually. A longer cash conversion cycle indicates lower working capital management efficiency.
Independent variable. Gavriilidis (2021) constructed a monthly U.S. macro-level climate policy uncertainty (CPU) index by analyzing reports from eight major American newspapers containing keywords related to climate policy, carbon emissions, uncertainty, and regulation [77]. Lee and Cho (2023) argued that emerging media platforms such as social media are less affected by bias [73]. Accordingly, they developed a climate policy uncertainty index based on data from climate policy-related posts on Chinese social media. We used Lee and Cho’s (2023) findings to measure climate policy uncertainty [73]. Since the index is a monthly time series, we further computed its annual average to serve as the measurement indicator for the explanatory variable in our study.
In the robustness checks, we measured the degree of climate policy uncertainty using the provincial-level climate policy uncertainty index for China constructed by Ma et al. (2023) [78].
Control variables. We used the following variables as control variables. Size: the size of the firms; age: the age of the establishments; growth: the ability of a firm to develop; lev: corporate leverage; Top1: the largest shareholder’s shareholding ratio; Roe: return on equity; dual: equals 1 if the firm’s general manager and chairman are the same person, otherwise it equals 0; board: the natural logarithm of the total number of directors; managerhld: the percent ratio of shares held by supervisors, directors, and senior executives relative to the total number of shares; Soe: if the enterprise is state-owned, the value is set to 1, whereas if it is not state-owned, the value is set to 0; Fl: the firm’s financial leverage; Gdp: the natural logarithm of per capita GDP in each city; Fin: city’s fiscal expenditure/city’s fiscal revenue. Table 1 reports the definitions of the primary variables.
We constructed the following regression model to examine the effect of climate policy uncertainty on working capital management efficiency:
W C M _ E F F i , t = β 0 + β 1 C P U t 1 + γ C o n t r o l + I n d u s t r y i + Y e a r t + ε i , t
In this model, WCM_EFFi,t denotes companies’ working capital management efficiency, and CPUt is the climate policy uncertainty index, indicating the degree of climate policy uncertainty in the city where the company is located. Control indicates control variables, Industryi is the industry fixed effect, Yeart is the year fixed effect, and εi,t is a random disturbance term. We used i to represent the company and t to represent the year. Considering the lag effect of climate policy uncertainty on companies’ working capital management efficiency, we lagged the climate policy uncertainty by one period. In addition, we conducted clustering at the city level.

5. Empirical Results and Analysis

5.1. Descriptive Statistics Results

Table 2 shows our study’s descriptive statistics results. It suggests that Chinese firms’ working capital management efficiency differed in the period examined. The minimum value of WCM_EFF was −0.376, the maximum was 2.600, and the standard deviation was 0.423, suggesting that the fluctuations in working capital management efficiency were relatively small. The mean value was 0.322, indicating that the average cash conversion cycle for the sample firms was 117 days. In addition, an industry-level analysis showed that the standard deviation of the industry mean for working capital management efficiency was 0.332, implying that a considerable proportion of the variation in working capital management efficiency occurred at the industry level. The minimum value of climate policy uncertainty was 0.192, the maximum reached 3.082, the mean was 1.558, and the median was 1.596, indicating that the distribution of climate policy uncertainty was relatively significant. Overall, the descriptive statistics are similar to those of previous research.

5.2. Baseline Results

In Table 3, we present the baseline results. The regression analysis in column (1) revealed a climate policy uncertainty coefficient of 0.010. Upon the inclusion of the control variables, as displayed in column (2), the CPU coefficient increased to 0.027 and was statistically significant at the 1% level. The results in column (2) indicate that firms’ working capital management efficiency decreased by 0.027 units when climate policy uncertainty increased by one unit. These results revealed that climate policy uncertainty reduced companies’ working capital management efficiency. Hypothesis 1 was validated.

5.3. Robustness Tests

5.3.1. Alternative Ways to Measure the Dependent and Independent Variables

We employed alternative approaches to measure climate policy uncertainty and working capital management efficiency to mitigate the impact of the measurement methods on our empirical results. First, we considered two alternative ways to measure the dependent variable:
(1) Revised cash conversion cycle (WCM_EFF1). Referring to the approach of Deloof (2003) [79], the turnover for the account receivable turnover period is set as operating revenue, while the turnover for the account payable and inventory turnover period is set as operating costs. The working capital management efficiency is measured using the formula (average balance of accounts receivable + average balance of notes receivable − average balance of advance payments received)/operating revenue + (average balance of prepaid accounts + average inventory balance − average balance of notes payable − average balance of accounts payable)/operating costs.
(2) Revised cash conversion cycle (WCM_EFF2). Based on the study by Wang (2019) [44], the cash cycle is used to measure companies’ working capital management efficiency. The cash cycle is defined as follows: cash cycle = 365 ∗ (average inventory balance/operating costs − average balance of accounts payable/operating costs + average balance of accounts receivable/operating revenue). As shown in columns (1) and (2) of Table 4, the coefficients were significantly positive at the 1% and 5% levels, indicating that our results are robust. The results in column (1) indicate that a 1-unit increase in climate policy uncertainty led to a 0.045-unit decrease in firms’ working capital management efficiency. The results in column (2) show that a one-unit increase in climate policy uncertainty extended the cash conversion cycle by 14.185 days, implying a decline in firms’ working capital management efficiency.
Second, we used the provincial-level climate policy uncertainty index to measure our independent variable. The coefficient was significant at the 5% level, demonstrating the robustness of our findings.

5.3.2. Instrumental Variable Method

We used the instrumental variable method to alleviate the potentially mutual causality problem between climate policy uncertainty and firms’ working capital management efficiency, which means that companies with lower working capital management efficiency are more likely to be affected by climate policy uncertainty. Additionally, our research might have an omitted variable problem, and using the instrumental variable method could mitigate its impact on our results. An instrumental variable should affect the dependent variable and not affect the independent variable, thereby mitigating the impact of the mutual causality problem. We used the pollutant emissions of the city where the examined company was located as an instrumental variable. When pollutant emissions increase, they may affect the uncertainty of climate policies. However, the impact of urban pollutant emissions on firms’ working capital management efficiency is relatively minor, which satisfies the relevance and exclusivity conditions for instrumental variables. The results, shown in columns (1) of Table 5, indicate that the coefficient of the instrumental variable was 0.021 and was statistically significant at the 1% level, suggesting that urban pollutant emissions increased the city’s climate policy uncertainty. The coefficient of climate policy uncertainty was 0.136 and remained significant at the 10% level, further confirming the robustness of our findings. After using the instrumental variable approach, it was found that for every 1-unit increase in climate policy uncertainty, the efficiency of corporate working capital management decreased by 0.136 units.

5.3.3. Removing Some Samples

Given the potential impacts of the 2008 financial crisis, the 2015 Chinese stock market crash, and the COVID-19 pandemic beginning in late 2019, we excluded data from our sample from 2008, 2015, 2020, 2021, and 2022. As demonstrated in column (1) of Table 6, the climate policy uncertainty’ coefficient was 0.028, which was statistically significant at the 10% level. This result underscores the robustness of our findings.

5.3.4. Propensity Score Matching Method

We applied the propensity score matching (PSM) method to control for differences across firms impacted by climate policy uncertainty. The results in columns (2) of Table 6 indicate that our results were robust after using PSM. In column (2) of Table 6, the coefficient for climate policy uncertainty is 0.022, significant at the 5% level. After applying the PSM method, these results indicated that each 1-unit increase in climate policy uncertainty decreased the firms’ working capital management efficiency by 0.022 units.

5.4. Mechanism Tests

5.4.1. Transaction Cost

Regarding the measurement of the transaction costs, some scholars argue that the processes involved in transaction costs include information gathering, negotiation, and contracting. Although it is difficult to calculate the transaction costs precisely, they can be estimated indirectly. Some researchers use proxy variables to measure the transaction costs, such as a single indicator like administrative expenses or multiple indicators such as selling expenses, financial expenses, and administrative expenses [80,81]. Following the approach of Li and Zhao (2024) [81], we used the parameter administrative expense + sales expense + financial expense)/operating income to measure the transaction costs. As demonstrated in column (1) of Table 7, the coefficient was significantly positive at the 5% level. These findings suggest that climate policy uncertainty can increase the transaction costs. Hypothesis 2 was validated.

5.4.2. Specific Asset Investment

The most common and established method for measuring investment in specific assets is the long-term assets approach. Following the studies of Mao et al. (2024) [82], we adopted the following ratio to measure the specific asset investment: (net fixed assets + net amount of construction in progress + net value of intangible assets + long-term deferred expenses)/total assets. The findings are presented in column (2) of Table 7. The coefficient was −0.004, which was statistically significant at the 10% level. This result suggests that climate policy uncertainty decreased firms’ specific asset investment. The above empirical results support Hypothesis 3.

5.4.3. Inventory Turnover Days

We used the following formula to measure the inventory turnover days: 365 ∗ (ending balance of inventories/operating costs). As indicated in column (3) of Table 7, the inventory turnover days’ coefficient was significant at the 1% level. This finding revealed that uncertainty in climate policy can increase enterprises’ inventory turnover days. The above empirical results support Hypothesis 4.

5.5. Heterogeneity Analysis

5.5.1. Regions

On the one hand, the infrastructure conditions of enterprises in the western and middle regions are not as advanced as those in the eastern regions. Enterprises in the middle and western regions may face more significant difficulties in inventory transportation and sales processes than those in the eastern regions; they may have to rely on more traditional transport methods. On the other hand, the roads in middle and western China are generally more rugged, and delivering products to customers often requires more time; the enterprises in these regions typically have higher costs for selling products or purchasing raw materials. Therefore, the efficiency of working capital management for enterprises in the western and middle regions is more susceptible to the impact of climate policy uncertainty. The results are presented in columns (1) and (2) of Table 8. The coefficient was significantly positive at the 1% level when the firms were located in the western and middle regions. In contrast, the coefficient was insignificant when the firms were located in the eastern region.

5.5.2. Degree of Marketization

When a city’s degree of marketization is low, it is difficult for companies to do business with customers and suppliers. These companies will be impacted when the climate policy uncertainty increases. As presented in columns (3) and (4) of Table 8, when a company was located in a low marketization degree city, the coefficient was significantly positive at the 1% level. In contrast, when the degree of marketization was high, the coefficient was 0.013, which was insignificant. The Chow test’s p value was 0.000, which indicated that the difference in the coefficient between the two groups was significant.

5.5.3. Road Density

The lower the road density, the more difficult it is for companies to transport their inventory. Therefore, in regions with lower road density, the impact of climate policy uncertainty on companies’ working capital management efficiency is higher. As shown in columns (5) and (6) of Table 8, the results indicated that the impact of climate policy uncertainty on corporate working capital management efficiency was more pronounced in regions with lower road density. However, the coefficient was insignificant for enterprises located in areas with high road density. The Chow test’s p value was 0.000, which revealed that the difference in the coefficient between the two groups as significant.

6. Conclusions

This study used data from Chinese A-share listed companies from 2007 to 2023 to investigate the impact of climate policy uncertainty on firms’ working capital management efficiency. Our results demonstrate that climate policy uncertainty significantly diminished the working capital management efficiency. Mechanism analyses suggested that this reduction in efficiency was attributable to increased transaction costs, inventory turnover days, and reduced investment in specific assets. Furthermore, the heterogeneity analysis revealed that the negative effects of climate policy uncertainty on working capital management efficiency were more pronounced in companies located in regions with lower levels of marketization, in the western and central areas, and in regions with lower highway density.
Previous studies have found that climate policy uncertainty can reduce corporate investment [22,32,34,35,36], increase firms’ financing costs [2,31], and alter corporate production behaviors [24], e.g., by raising raw material costs and prompting upgrades to production equipment [25,26]. We further extended this research from the perspective of corporate production and operations. By focusing on the production process, our study revealed that climate policy uncertainty, by reducing investment in production activities and increasing operational and managerial costs, ultimately decreases the efficiency of firms’ working capital management. Overall, our empirical results validated our hypothesis. We found that a 1-unit increase in climate policy uncertainty led to a 0.027-unit decrease in firms’ working capital management efficiency. Our study extends the existing research about climate policy uncertainty and the efficiency of corporate working capital management and offers advice for formulating and implementing climate policies. Furthermore, it provides advice for companies on how to cope with the challenges of climate policy uncertainty.
Based on the above results and analysis, we propose the following advice. The government should recognize that while climate change significantly impacts society, future climate-related policies should fully consider the potential effects of policy uncertainty on companies. For example, the frequency change in climate change-related policies may influence companies’ products and business environment, thereby influencing companies’ production activities and working capital management. The government should minimize policy fluctuations and avoid significant changes quickly, thereby creating a more stable policy environment for company operational management and promoting company development. Furthermore, the government needs to increase the transparency of its climate policy to reduce the information asymmetry between firms and government, which could help companies better deal with the uncertainty of climate policies.
In terms of enterprises, companies should closely monitor climate policies relevant to their operations and promptly adjust production and management decisions to minimize the impact of climate policy uncertainties. Furthermore, companies should communicate closely with their customers and suppliers to stabilize supply chain relationships, reducing the impact of climate policy uncertainties on the supply chain, thereby alleviating their effect on working capital management efficiency.
There are some limitations to our research. For instance, we only examined the impact of climate policy uncertainty on the working capital management efficiency of Chinese listed companies without considering the effects of foreign climate policy uncertainty. Additionally, our study did not investigate non-listed companies. In the future, researchers could continue to explore the impact of climate policy uncertainty on corporate working capital and supply chains and pay attention to non-listed companies.

Funding

This research received no external funding.

Institutional Review Board Statement

Not applicable.

Informed Consent Statement

Not applicable.

Data Availability Statement

Data are contained within the article.

Conflicts of Interest

The author declares no conflicts of interest.

References

  1. Liu, W.; McKibbin, W.J.; Morris, A.C.; Wilcoxen, P.J. Global economic and environmental outcomes of the Paris Agreement. Energy Econ. 2020, 90, 104838. [Google Scholar] [CrossRef]
  2. Ilhan, E.; Sautner, Z.; Vilkov, G. Carbon tail risk. Rev. Financ. Stud. 2021, 34, 1540–1571. [Google Scholar] [CrossRef]
  3. Fan, Y.; Liang, Z.; Yao, X. Regional power system transitions towards carbon neutrality: The case of North China. Econ. Political Stud. 2022, 10, 416–441. [Google Scholar] [CrossRef]
  4. Su, C.-W.; Yuan, X.; Tao, R.; Umar, M. Can new energy vehicles help to achieve carbon neutrality targets? J. Environ. Manag. 2021, 297, 113348. [Google Scholar] [CrossRef]
  5. Guilhot, L. An analysis of China‘s energy policy from 1981 to 2020: Transitioning towards to a diversified and low-carbon energy system. Energy Policy 2022, 162, 112806. [Google Scholar] [CrossRef]
  6. Hao, Y.; Zhang, Z.-Y.; Yang, C.; Wu, H. Does structural labor change affect CO2 emissions? Theoretical and empirical evidence from China. Technol. Forecast. Soc. Change 2021, 171, 120936. [Google Scholar] [CrossRef]
  7. Zhang, W.; Chiu, Y.-B.; Hsiao, C.Y.-L. Effects of country risks and government subsidies on renewable energy firms’ performance: Evidence from China. Renew. Sustain. Energy Rev. 2022, 158, 112164. [Google Scholar] [CrossRef]
  8. Qi, X.; Guo, Y.; Guo, P.; Yao, X.; Liu, X. Do subsidies and R&D investment boost energy transition performance? Evidence from Chinese renewable energy firms. Energy Policy 2022, 164, 112909. [Google Scholar]
  9. Liu, X.; Ronn, E.I. Using the binomial model for the valuation of real options in computing optimal subsidies for Chinese renewable energy investments. Energy Econ. 2020, 87, 104692. [Google Scholar] [CrossRef]
  10. Bai, R.; Lin, B.; Liu, X. Government subsidies and firm-level renewable energy investment: New evidence from partially linear functional-coefficient models. Energy Policy 2021, 159, 112610. [Google Scholar] [CrossRef]
  11. Cui, J.; Wang, C.; Zhang, J.; Zheng, Y. The effectiveness of China’s regional carbon market pilots in reducing firm emissions. Proc. Natl. Acad. Sci. USA 2021, 118, e2109912118. [Google Scholar] [CrossRef] [PubMed]
  12. Lin, Y.; Qin, Y.; Wu, J.; Xu, M. Impact of high-speed rail on road traffic and greenhouse gas emissions. Nat. Clim. Change 2021, 11, 952–957. [Google Scholar] [CrossRef]
  13. Helveston, J.; Nahm, J. China‘s key role in scaling low-carbon energy technologies. Science 2019, 366, 794–796. [Google Scholar] [CrossRef] [PubMed]
  14. Tu, Q.; Mo, J.L.; Fan, Y. The evolution and evaluation of China’s renewable energy policies and their implications for the future. China Popul. Resour. Env. 2020, 30, 29–36. [Google Scholar]
  15. Namdar, J.; Modi, S.; Blackhurst, J. Diversify or Concentrate? Supply chain responses to policy uncertainty. J. Supply Chain Manag. 2025, 61, 62–82. [Google Scholar] [CrossRef]
  16. Darby, J.L.; Ketchen, D.J., Jr.; Williams, B.D.; Tokar, T. The implications of firm-specific policy risk, policy uncertainty, and industry factors for inventory: A resource dependence perspective. J. Supply Chain Manag. 2020, 56, 3–24. [Google Scholar] [CrossRef]
  17. Charoenwong, B.; Han, M.; Wu, J. Trade and foreign economic policy uncertainty in supply chain networks: Who comes home? Manuf. Serv. Oper. Manag. 2023, 25, 126–147. [Google Scholar] [CrossRef]
  18. Phan, D.H.B.; Iyke, B.N.; Sharma, S.S.; Affandi, Y. Economic policy uncertainty and financial stability—Is there a relation? Econ. Model. 2021, 94, 1018–1029. [Google Scholar] [CrossRef]
  19. Nagar, V.; Schoenfeld, J.; Wellman, L. The effect of economic policy uncertainty on investor information asymmetry and management disclosures. J. Account. Econ. 2019, 67, 36–57. [Google Scholar] [CrossRef]
  20. Bonaime, A.; Gulen, H.; Ion, M. Does policy uncertainty affect mergers and acquisitions? J. Financ. Econ. 2018, 129, 531–558. [Google Scholar] [CrossRef]
  21. Kang, W.; Lee, K.; Ratti, R.A. Economic policy uncertainty and firm-level investment. J. Macroecon. 2014, 39, 42–53. [Google Scholar] [CrossRef]
  22. Golub, A.A.; Fuss, S.; Lubowski, R.; Hiller, J.; Khabarov, N.; Koch, N.; Krasovskii, A.; Kraxner, F.; Laing, T.; Obersteiner, M. Escaping the climate policy uncertainty trap: Options contracts for REDD+. Clim. Policy 2018, 18, 1227–1234. [Google Scholar] [CrossRef]
  23. Sun, G.; Fang, J.; Li, T.; Ai, Y. Effects of climate policy uncertainty on green innovation in Chinese enterprises. Int. Rev. Financ. Anal. 2024, 91, 102960. [Google Scholar] [CrossRef]
  24. Fuss, S.; Johansson, D.J.A.; Szolgayova, J.; Obersteiner, M. Impact of climate policy uncertainty on the adoption of electricity generating technologies. Energy Policy 2009, 37, 733–743. [Google Scholar] [CrossRef]
  25. Işık, C.; Ongan, S.; Ozdemir, D.; Jabeen, G.; Sharif, A.; Alvarado, R.; Amin, A.; Rehman, A. Renewable energy, climate policy uncertainty, industrial production, domestic exports/re-exports, and CO2 emissions in the USA: A SVAR approach. Gondwana Res. 2024, 127, 156–164. [Google Scholar] [CrossRef]
  26. Wang, K.-H.; Kan, J.-M.; Qiu, L.; Xu, S. Climate policy uncertainty, oil price and agricultural commodity: From quantile and time perspective. Econ. Anal. Policy 2023, 78, 256–272. [Google Scholar] [CrossRef]
  27. Valipour, H.; Moradi, J.; Farsi, F.D. The impact of company characteristics on working capital management. J. Appl. Financ. Bank. 2012, 2, 105. [Google Scholar]
  28. Hofmann, E.; Kotzab, H. A supply chain-oriented approach of working capital management. J. Bus. Logist. 2010, 31, 305–330. [Google Scholar] [CrossRef]
  29. Peng, J.; Zhou, Z. Working capital optimization in a supply chain perspective. Eur. J. Oper. Res. 2019, 277, 846–856. [Google Scholar] [CrossRef]
  30. Campello, M.; Gao, J. Customer concentration and loan contract terms. J. Financ. Econ. 2017, 123, 108–136. [Google Scholar] [CrossRef]
  31. Sautner, Z.; Van Lent, L.; Vilkov, G.; Zhang, R. Pricing climate change exposure. Manag. Sci. 2023, 69, 7540–7561. [Google Scholar] [CrossRef]
  32. Hu, Y.; Bai, W.; Farrukh, M.; Koo, C.K. How does environmental policy uncertainty influence corporate green investments? Technol. Forecast. Soc. Change 2023, 189, 122330. [Google Scholar] [CrossRef]
  33. Wang, J.; Li, L. Climate risk and Chinese stock volatility forecasting: Evidence from ESG index. Financ. Res. Lett. 2023, 55, 103898. [Google Scholar] [CrossRef]
  34. Ren, X.; Shi, Y.; Jin, C. Climate policy uncertainty and corporate investment: Evidence from the Chinese energy industry. Carbon Neutrality 2022, 1, 14. [Google Scholar] [CrossRef]
  35. Hoang, K. How does corporate R&D investment respond to climate policy uncertainty? Evidence from heavy emitter firms in the United States. Corp. Soc. Responsib. Environ. Manag. 2022, 29, 936–949. [Google Scholar]
  36. Blyth, W.; Bradley, R.; Bunn, D.; Clarke, C.; Wilson, T.; Yang, M. Investment risks under uncertain climate change policy. Energy Policy 2007, 35, 5766–5773. [Google Scholar] [CrossRef]
  37. Bai, D.; Du, L.; Xu, Y.; Abbas, S. Climate policy uncertainty and corporate green innovation: Evidence from Chinese A-share listed industrial corporations. Energy Econ. 2023, 127, 107020. [Google Scholar] [CrossRef]
  38. Lee, C.-C.; Lee, C.-C.; Xiao, S. Policy-related risk and corporate financing behavior: Evidence from China’s listed companies. Econ. Model. 2021, 94, 539–547. [Google Scholar] [CrossRef]
  39. Siddique, M.A.; Nobanee, H.; Hasan, M.B.; Uddin, G.S.; Hossain, M.N.; Park, D. How do energy markets react to climate policy uncertainty? Fossil vs. renewable and low-carbon energy assets. Energy Econ. 2023, 128, 107195. [Google Scholar] [CrossRef]
  40. Pástor, Ľ.; Veronesi, P. Political uncertainty and risk premia. J. Financ. Econ. 2013, 110, 520–545. [Google Scholar] [CrossRef]
  41. Gao, W.; Wei, J.; Zhang, H.; Zhang, H. Does climate policy uncertainty exacerbate extreme risk spillovers between green economy and energy metals? Resour. Policy 2024, 91, 104946. [Google Scholar] [CrossRef]
  42. Mao, F. On the Fundamental Principles of Working Capital Management. Account. Res. 1995, 1, 38–40. [Google Scholar]
  43. Knight, W.D. Working Capital Management-Satisificing Versus Optimization. Financ. Manag. 1972, 1, 33. [Google Scholar] [CrossRef]
  44. Wang, B. The cash conversion cycle spread. J. Financ. Econ. 2019, 133, 472–497. [Google Scholar] [CrossRef]
  45. Sawarni, K.S.; Narayanasamy, S.; Padhan, P.C. Impact of earnings management on working capital management efficiency. Financ. Res. Lett. 2023, 54, 103778. [Google Scholar] [CrossRef]
  46. Rafuse, M.E. Working capital management: An urgent need to refocus. Manag. Decis. 1996, 34, 59–63. [Google Scholar] [CrossRef]
  47. Aktas, N.; Croci, E.; Petmezas, D. Is working capital management value-enhancing? Evidence from firm performance and investments. J. Corp. Financ. 2015, 30, 98–113. [Google Scholar] [CrossRef]
  48. Habib, A.M.; Dalwai, T. Does the efficiency of a firm’s intellectual capital and working capital management affect its performance? J. Knowl. Econ. 2024, 15, 3202–3238. [Google Scholar] [CrossRef]
  49. Gill, A.; Kang, P.; Amiraslany, A. Information technology investment and working capital management efficiency: Evidence from India survey data. South Asian J. Bus. Stud. 2023, 12, 559–574. [Google Scholar] [CrossRef]
  50. Ramiah, V.; Zhao, Y.; Moosa, I.; Graham, M. A behavioural finance approach to working capital management. Eur. J. Financ. 2016, 22, 662–687. [Google Scholar] [CrossRef]
  51. Banerjee, P.; Guha Deb, S. Working capital management efficiency, managerial ability, and firm performance: New insights. Appl. Econ. 2024, 56, 4001–4018. [Google Scholar] [CrossRef]
  52. Nguyen, B. The dark side of CRM. Mark. Rev. 2011, 11, 137–149. [Google Scholar] [CrossRef]
  53. Fisman, R.; Raturi, M. Does competition encourage credit provision? Evidence from African trade credit relationships. Rev. Econ. Stat. 2004, 86, 345–352. [Google Scholar] [CrossRef]
  54. Cunat, V. Trade credit: Suppliers as debt collectors and insurance providers. Rev. Financ. Stud. 2007, 20, 491–527. [Google Scholar] [CrossRef]
  55. Fabbri, D.; Menichini, A.M.C. Trade credit, collateral liquidation, and borrowing constraints. J. Financ. Econ. 2010, 96, 413–432. [Google Scholar] [CrossRef]
  56. Whipple, J.M.; Wiedmer, R.; K. Boyer, K. A dyadic investigation of collaborative competence, social capital, and performance in buyer–supplier relationships. J. Supply Chain Manag. 2015, 51, 3–21. [Google Scholar] [CrossRef]
  57. Gosman, M.L.; Kohlbeck, M.J. Effects of the existence and identity of major customers on supplier profitability: Is Wal-Mart different? J. Manag. Account. Res. 2009, 21, 179–201. [Google Scholar] [CrossRef]
  58. Luo, A.; Kumar, V. Recovering hidden buyer–seller relationship states to measure the return on marketing investment in business-to-business markets. J. Mark. Res. 2013, 50, 143–160. [Google Scholar] [CrossRef]
  59. Acemoglu, D.; Carvalho, V.M.; Ozdaglar, A.; Tahbaz-Salehi, A. The network origins of aggregate fluctuations. Econometrica 2012, 80, 1977–2016. [Google Scholar] [CrossRef]
  60. Ren, X.; Zhang, X.; Yan, C.; Gozgor, G. Climate policy uncertainty and firm-level total factor productivity: Evidence from China. Energy Econ. 2022, 113, 106209. [Google Scholar] [CrossRef]
  61. Elliott, M.; Golub, B.; Leduc, M.V. Supply network formation and fragility. Am. Econ. Rev. 2022, 112, 2701–2747. [Google Scholar] [CrossRef]
  62. Williamson, O.E. Transaction cost economics: The natural progression. Am. Econ. Rev. 2010, 100, 673–690. [Google Scholar] [CrossRef]
  63. Milgrom, P.; Roberts, J. The economics of modern manufacturing: Technology, strategy, and organization. Am. Econ. Rev. 1990, 80, 511–528. [Google Scholar]
  64. Williamson, O.E. The Economic Institutions of Capitalism. Firms, Markets, Relational Contracting; Springer: Berlin/Heidelberg, Germany, 2007. [Google Scholar]
  65. Williamson, O.E. Transaction-cost economics: The governance of contractual relations. J. Law Econ. 1979, 22, 233–261. [Google Scholar] [CrossRef]
  66. Yang, S. Understanding B2B customer loyalty in the mobile telecommunication industry: A look at dedication and constraint. J. Bus. Ind. Mark. 2015, 30, 117–128. [Google Scholar] [CrossRef]
  67. Dixit, A.K.; Pindyck, R.S. Investment Under Uncertainty; Princeton university press: Princeton, NJ, USA, 1994. [Google Scholar]
  68. Billington, C. Cycles are cycles. J. Supply Chain Manag. 2010, 46, 5–7. [Google Scholar] [CrossRef]
  69. Kashmiri, S.; Nicol, C.D.; Hsu, L. Birds of a feather: Intra-industry spillover of the Target customer data breach and the shielding role of IT, marketing, and CSR. J. Acad. Mark. Sci. 2017, 45, 208–228. [Google Scholar] [CrossRef]
  70. Kamiya, S.; Kang, J.-K.; Kim, J.; Milidonis, A.; Stulz, R.M. Risk management, firm reputation, and the impact of successful cyberattacks on target firms. J. Financ. Econ. 2021, 139, 719–749. [Google Scholar] [CrossRef]
  71. Cooper, M.C.; Lambert, D.M.; Pagh, J.D. Supply chain management: More than a new name for logistics. Int. J. Logist. Manag. 1997, 8, 1–14. [Google Scholar] [CrossRef]
  72. Bag, S.; Rahman, M.S.; Rogers, H.; Srivastava, G.; Pretorius, J.H.C. Climate change adaptation and disaster risk reduction in the garment industry supply chain network. Transp. Res. Part E Logist. Transp. Rev. 2023, 171, 103031. [Google Scholar] [CrossRef]
  73. Lee, K.; Cho, J. Measuring Chinese climate uncertainty. Int. Rev. Econ. Financ. 2023, 88, 891–901. [Google Scholar] [CrossRef]
  74. Braun, M.; Raddatz, C. The politics of financial development: Evidence from trade liberalization. J. Financ. 2008, 63, 1469–1508. [Google Scholar] [CrossRef]
  75. Wang, J.; Wang, F. Customer Digital Transformation and Enterprise Working Capital Management Efficiency: Based on the Dual Perspectives of Competition Encroachment and Constraint Defense. South China J. Econ. 2024, 8, 115–136. [Google Scholar]
  76. Shin, H.H.; Soenen, L. Efficiency of Working Capital and Corporate Profitability. Financ. Pract. Educ. 1998, 8, 37–45. [Google Scholar]
  77. Gavriilidis, K. Measuring Climate Policy Uncertainty. 2021. Available online: https://ideas.repec.org/a/inm/ormsom/v25y2023i1p126-147.html (accessed on 15 January 2025).
  78. Ma, Y.-R.; Liu, Z.; Ma, D.; Zhai, P.; Guo, K.; Zhang, D.; Ji, Q. A news-based climate policy uncertainty index for China. Sci. Data 2023, 10, 881. [Google Scholar] [CrossRef]
  79. Deloof, M. Does working capital management affect profitability of Belgian firms? J. Bus. Financ. Account. 2003, 30, 573–588. [Google Scholar] [CrossRef]
  80. Ang, J.S.; Cole, R.A.; Lin, J.W. Agency costs and ownership structure. J. Financ. 2000, 55, 81–106. [Google Scholar] [CrossRef]
  81. Li, P.; Zhao, X. The impact of digital transformation on corporate supply chain management: Evidence from listed companies. Financ. Res. Lett. 2024, 60, 104890. [Google Scholar] [CrossRef]
  82. Mao, S.L.; Xiao, M.; Li, G. Supply Chain Relationships and Digital Transformation of Enterprises: A Dual Perspective of Motivation and Ability. Res. Econ. Manag. 2024, 45, 98–124. [Google Scholar]
Figure 1. Mechanism research.
Sustainability 17 04229 g001
Table 1. Variable definitions.
TypeNameDefinition
Dependent variableWCM_EFF(Average balance of accounts receivable + average balance of notes receivable + average balance of prepaid accounts + average inventory balance-average balance of advance payments received-average balance of notes payable-average balance of accounts payable)/operating revenue
Independent variableCPUClimate policy uncertainty index
Control variablesSizeFirm size
AgeSubtract the firm’s establishment year from the sampling year
Top1The largest shareholder’s shareholding ratio
GrowthThe growth rate of total assets
LevTotal liabilities/total assets
RoeReturn on equity
DualEquals 1 if the firm’s general manager and chairman are the same person, otherwise, it equals 0
BoardThe natural logarithm of the total number of directors
ManagerhldThe percent ratio of shares held by supervisors, directors, and senior executives relative to the total number of shares
SoeIf the enterprise is state-owned, the value is set to 1; if it is not state-owned, the value is set to 0.
Fl(Net profit + income tax expense + financial expenses)/(net profit + income tax expense)
GdpThe natural logarithm of per capita gross domestic product in each city
FinCity’s fiscal expenditure/city’s fiscal revenue
Table 2. Descriptive statistics results.
VariableNMaxMinMeanSDp50
WCM_EFF24,7172.600−0.3760.3220.4230.233
CPU24,7173.0820.1921.5580.6491.596
Size24,71725.82919.91622.1791.23422.018
Age24,71736.0006.00018.5186.24518.000
Growth24,7171.193−0.1890.1530.2200.098
Lev24,7170.8610.0590.4160.1960.409
Top124,71773.1408.80034.12614.57932.090
Dual24,7171.0000.0000.2780.4480.000
Fl24,7178.3810.3441.3851.0801.072
Board24,7172.7081.6092.1290.1982.197
Managerhld24,71767.6290.00013.27819.4190.605
Roe24,7170.329−0.0220.0890.0650.077
Soe24,7171.000.0000.3580.4790.000
Gdp24,71719.66215.18717.8441.05117.924
Fin24,7175.1920.9141.6310.7951.356
Table 3. Baseline regression.
(1)(2)
WCM_EFFWCM_EFF
CPU0.010 **0.027 ***
(1.994)(2.897)
Size −0.011 *
(−1.775)
Age −0.001
(−0.572)
Growth 0.027 **
(2.513)
Lev −0.231 ***
(−6.100)
Top1 −0.001 ***
(−2.673)
Dual −0.002
(−0.213)
Fl 0.014 ***
(2.652)
Board −0.085 ***
(−2.673)
Managerhld −0.000
(−0.016)
Roe −0.994 ***
(−13.918)
Soe −0.046 ***
(−3.299)
Gdp −0.012
(−1.104)
Fin 0.016
(1.591)
_cons0.305 ***1.104 ***
(35.062)(4.797)
N19,09019,090
industryYes
yearYes
r2_a0.3830.430
Note: *** p < 0.01; ** p < 0.05; * p < 0.1.
Table 4. Alternative dependent variable and independent variable.
(1)(2)(3)
WCM_EFF1WCM_EFF2WCM_EFF
CPU0.045 ***14.185 **
(3.181)(2.527)
CPU1 0.017 **
(2.308)
Size−0.009−3.391−0.011 ***
(−0.871)(−0.958)(−4.041)
Age0.0010.103−0.000
(0.780)(0.158)(−0.956)
Growth0.0330.5530.037 ***
(1.444)(0.058)(3.102)
Lev−0.349 ***−18.979−0.191 ***
(−5.058)(−0.803)(−9.926)
Top1−0.001 *−0.389 *−0.001 ***
(−1.777)(−1.679)(−5.579)
Dual0.0227.8450.008
(1.042)(1.085)(1.358)
Fl0.023 **3.5290.015 ***
(2.331)(0.930)(3.635)
Board−0.156 ***−59.762 ***−0.101 ***
(−2.948)(−3.140)(−6.896)
Managerhld−0.0000.0640.000
(−0.377)(0.264)(0.769)
Roe−0.974 ***−338.318 ***−1.165 ***
(−7.276)(−6.925)(−25.892)
Soe−0.072 ***−28.218 ***−0.049 ***
(−2.977)(−3.470)(−6.711)
Gdp−0.022−5.3090.005
(−1.397)(−0.924)(0.678)
Fin0.028 *7.1250.020 ***
(1.717)(1.189)(5.445)
_cons1.446 ***479.420 ***0.889 ***
(3.793)(3.477)(8.446)
N15,56615,56625,260
industryYes
yearYes
r2_a0.4960.5530.449
Note: *** p < 0.01; ** p < 0.05; * p < 0.1.
Table 5. Instrumental variable method.
(1) First(2) Second
CPUWCM_EFF
iv0.021 ***
(28.769)
CPU 0.136 *
(1.767)
Size0.001−0.006
(0.248)(−1.059)
Age0.001−0.001
(1.469)(−1.423)
Growth−0.0130.12 6 ***
(−0.699)(3.780)
Lev−0.019−0.272 ***
(−0.828)(−5.969)
Top10.000−0.001 **
(0.419)(−1.976)
Dual−0.0020.007
(−0.365)(0.778)
Fl0.0040.024
(0.481)(1.036)
Board−0.011−0.122 ***
(−0.621)(−3.012)
Managerhld−0.0000.000
(−0.137)(0.992)
Roe0.059−1.615 ***
(0.973)(−13.215)
Soe0.002−0.051 ***
(0.200)(−3.489)
Gdp0.470 ***0.049
(22.860)(0.947)
Fin0.070 ***0.003
(3.643)(0.110)
N17,06717,067
Kleibergen–PaaprK LM457.652
p0.000
Kleibergen–PaapWald F827.659
industryYes
yearYes
Note: *** p < 0.01; ** p < 0.05; * p < 0.1.
Table 6. Results after removing some samples and propensity score matching.
(1) After Removing Some Samples(2) Propensity Score Matching
WCM_EFFWCM_EFF
CPU0.028 *0.022 **
(1.919)(2.235)
Size−0.007−0.006
(−1.023)(−0.919)
Age−0.000−0.001
(−0.208)(−1.002)
Growth0.0150.014
(0.787)(0.942)
Lev−0.190 ***−0.249 ***
(−4.081)(−5.538)
Top1−0.001−0.001 **
(−1.355)(−2.384)
Dual0.007−0.011
(0.454)(−0.820)
Fl0.0090.010
(1.190)(1.555)
Board−0.123 ***−0.103 ***
(−3.032)(−2.688)
Managerhld0.0000.000
(0.216)(0.161)
Roe−1.113 ***−1.009 ***
(−11.595)(−14.854)
Soe−0.060 ***−0.042 ***
(−3.110)(−2.639)
Gdp−0.024 *−0.011
(−1.906)(−0.941)
Fin0.0140.016
(1.108)(1.437)
_cons1.322 ***1.061 ***
(4.643)(4.001)
N876810,399
industryYes
yearYes
r2_a0.4200.435
Note: *** p < 0.01; ** p < 0.05; * p < 0.1.
Table 7. Mechanism tests.
(1)(2)(3)
TcostASInventory
CPU0.054 **−0.004 *0.010 ***
(2.043)(−1.695)(2.943)
Size−0.0250.001−0.007 ***
(−1.563)(0.974)(−6.041)
Age−0.004−0.000 **0.000
(−1.394)(−2.117)(1.513)
Growth0.264 ***−0.052 ***−0.009 **
(5.509)(−7.013)(−2.572)
Lev0.046−0.012−0.062 ***
(0.468)(−1.417)(−5.613)
Top1−0.002 *0.000 ***−0.000 ***
(−1.840)(5.298)(−2.714)
Dual0.0030.0020.008 ***
(0.102)(0.812)(3.302)
Fl−0.0020.081 ***0.010 ***
(−0.137)(19.113)(7.005)
Board−0.0670.033 ***0.006
(−0.874)(4.822)(0.859)
Managerhld0.001−0.0000.000 *
(1.502)(−1.268)(1.655)
Roe−1.390 ***0.009−0.081 ***
(−6.284)(0.404)(−3.045)
Soe−0.114 **0.002−0.010 ***
(−2.533)(0.840)(−2.921)
Gdp−0.000−0.010 ***0.006
(−0.007)(−5.583)(1.596)
Fin0.051 *0.0030.013 ***
(1.692)(1.109)(3.438)
_cons5.335 ***0.294 ***0.179 **
(8.030)(6.513)(2.388)
N18,87519,09018,794
industryYes
yearYes
Sobel test0.0000.0100.000
r2_a0.4330.4590.425
Note: *** p < 0.01; ** p < 0.05; * p < 0.1.
Table 8. Heterogeneity analysis.
(1) Eastern Regions(2) Middle and Western Regions(3) Low Degree of Marketization(4) High Degree of Marketization(5) Low Road Density(6) High Road Density
WCM_EFFWCM_EFFWCM_EFFWCM_EFFWCM_EFFWCM_EFF
CPU0.0140.063 ***0.042 ***0.0130.050 ***0.013
(1.569)(2.841)(3.293)(1.262)(2.659)(1.212)
Size−0.004−0.059 ***−0.023 ***−0.004−0.011 *−0.009
(−0.624)(−4.465)(−2.729)(−0.644)(−1.676)(−0.980)
Age0.000−0.005−0.000−0.001−0.001−0.001
(0.152)(−1.604)(−0.206)(−0.609)(−0.600)(−0.506)
Growth0.024 **0.078 ***0.044 *0.023 *0.045 ***0.011
(2.027)(2.725)(1.936)(1.907)(3.328)(0.810)
Lev−0.214 ***−0.319 ***−0.304 ***−0.187 ***−0.165 **−0.253 ***
(−5.382)(−4.101)(−5.880)(−4.709)(−2.514)(−5.547)
Top1−0.001 ***0.001−0.001−0.001 ***−0.000−0.001 ***
(−3.018)(1.211)(−1.098)(−2.791)(−0.470)(−2.965)
Dual0.0010.0000.0010.0030.008−0.002
(0.103)(0.018)(0.061)(0.259)(0.443)(−0.168)
Fl0.011 **0.030 **0.016 **0.015 **0.0090.012 *
(2.055)(2.248)(2.080)(2.195)(1.108)(1.931)
Board−0.111 ***0.006−0.083−0.099 ***−0.120 **−0.073 **
(−3.238)(0.121)(−1.582)(−2.882)(−2.067)(−2.004)
Managerhld0.0000.0000.001−0.000−0.0010.000
(0.171)(0.301)(1.286)(−0.142)(−0.898)(0.520)
Roe−1.069 ***−0.576 ***−0.930 ***−1.018 ***−1.131 ***−0.889 ***
(−13.487)(−4.789)(−8.872)(−11.764)(−8.753)(−10.664)
Soe−0.051 ***−0.022−0.051 **−0.040 **−0.028−0.067 ***
(−3.272)(−0.534)(−2.168)(−2.320)(−1.243)(−3.263)
Gdp−0.012−0.0040.001−0.017−0.038 ***0.013
(−1.089)(−0.223)(0.050)(−1.307)(−2.837)(0.888)
Fin0.017−0.0020.019−0.004−0.0040.031 **
(1.379)(−0.125)(1.638)(−0.272)(−0.312)(2.179)
_cons1.027 ***1.791 ***1.145 ***1.118 ***1.664 ***0.599 *
(4.151)(3.583)(4.152)(3.990)(5.646)(1.838)
N16,4362651740811,68070379939
industryYes
YearYes
Chow Test16.9717.315.96
p-Value0.0000.0000.000
r2_a0.4510.4010.4020.4750.4450.433
Note: *** p < 0.01; ** p < 0.05; * p < 0.1.
Disclaimer/Publisher’s Note: The statements, opinions and data contained in all publications are solely those of the individual author(s) and contributor(s) and not of MDPI and/or the editor(s). MDPI and/or the editor(s) disclaim responsibility for any injury to people or property resulting from any ideas, methods, instructions or products referred to in the content.

