Article

Utilizing Remote Sensing and Random Forests to Identify Optimal Land Use Scenarios and Address the Increase in Landslide Susceptibility

1
Department of Soil Science, Faculty of Agriculture, Brawijaya University, Malang 65145, Indonesia
2
Geospatial Information Agency of Indonesia, Bogor 16911, Indonesia
*
Author to whom correspondence should be addressed.
Sustainability 2025, 17(9), 4227; https://doi.org/10.3390/su17094227
Submission received: 27 January 2025 / Revised: 1 March 2025 / Accepted: 3 March 2025 / Published: 7 May 2025
(This article belongs to the Topic Natural Hazards and Disaster Risks Reduction, 2nd Edition)

Abstract

:
Massive land use changes in Indonesia driven by deforestation, agricultural expansion, and urbanization have significantly increased landslide susceptibility in upper watersheds. This study focuses on the Sumber Brantas and Kali Konto sub-watersheds where rapid land conversion has destabilized slopes and disrupted ecological balance. By integrating remote sensing, Cellular Automata-Markov (CA-Markov), and Random Forest (RF) models, the research aims to identify optimal land use scenarios for mitigating landslide hazards. Three scenarios were analyzed: business as usual (BAU), land capability classification (LCC), and regional spatial planning (RSP) using 400 field-validated landslide data points alongside 22 topographic, geological, environmental, and anthropogenic parameters. Land use analysis from 2017 to 2022 revealed a 1% decline in natural forest cover, which corresponded to a 1% increase in high and very high landslide hazard areas. From 2017 to 2022, landslide risk increased as the “High” category rose from 33.95% to 37.59% and “Very High” from 10.24% to 12.18%; under BAU 2025, they reached 40.89% and 12.48%, while RSP and LCC reduced the “High” category to 44.12% and 34.44%, respectively. These findings highlight the critical role of integrating geospatial analysis and machine learning in regional planning to promote sustainable land use, reduce landslide hazards, and enhance watershed resilience with high model accuracy (>81%).

1. Introduction

Land use changes in Indonesia have happened massively, driven by the growing human population and complex interests in political, social, and economic fields [1]. This phenomenon has led to climate change and increased natural disasters [2]. From 1990 to 2005, 29.1 million hectares of forest were converted into agricultural land [3], plantations [4], and settlements [5]. Deforestation in Indonesia in upper watersheds can trigger the risk of natural disasters, including landslides [6]. The increasing pressure on watersheds in Indonesia highlights the urgent need for community-driven conservation strategies to ensure the sustainable management of soil and water resources [7].
Globally, land use changes have caused landslides, affecting 16% of the area in just ten years. This situation is similar to Indonesia, where changes in land use have led to 1681 landslides and the loss of 259 lives [8]. Research in Pujon, East Java, demonstrated that slope and rainfall intensity are key factors influencing landslide susceptibility, highlighting the critical role of precise mapping techniques such as AHP in mitigating risks [9]. Despite regional spatial planning laws, the implementation process often faces conflicts between interests [10]. Another previous study demonstrated the superiority of high-resolution remote sensing data, such as LiDAR and orthophoto images, for improving landslide susceptibility mapping; it primarily focused on data accuracy rather than making a simulation of the land use change [11]. Sinčić et al. [12] show in their article that vegetation plays a crucial role in landslide risk mitigation by intercepting rainfall, enhancing evapotranspiration, and stabilizing slopes through root reinforcement, yet its integration into traditional landslide modeling remains challenging due to the complex and dynamic interactions between plant systems and environmental factors. Land use is crucial for minimizing landslide hazards and supporting stable ecosystem services [8], with research showing a reduction of over 16% [13].
Land use changes have been extensively studied by global researchers for their impact on landslide susceptibility [14,15]. However, most existing studies primarily focus on current land use conditions, leaving a gap in identifying optimal land use scenarios to mitigate landslide hazards [16]. Advanced models, such as the Artificial Neural Network Cellular Automata-Markov Chain (ANN-CA-Markov) and Random Forest (RF), offer significant potential for addressing this gap. The ANN-CA-Markov model predicts future land use changes by integrating spatial and temporal dynamics, while the RF model analyzes landslide susceptibility using decision-tree regression. However, they are often used separately, limiting their potential. This study combines remote sensing, ANN-CA-Markov, and RF to improve predictive accuracy, optimize land use scenarios, and enhance landslide risk mitigation. Remote sensing, ANN-CA-Markov, and Random Forest are combined to effectively analyze land use changes and landslide susceptibility while balancing accuracy and computational efficiency. Unlike deep learning, this approach requires less data and processing power, making it more practical for GIS-based applications.
The Sumber Brantas and Kali Konto sub-watersheds in East Java Province, part of the Brantas watershed, are critical areas that frequently experience landslides [17]. These landslides are primarily driven by land use changes [18], which disrupt tree roots that play a crucial role in soil stabilization and ecological balance [19]. While local governments have implemented regional spatial plans (RSP) to mitigate these risks [20], the effectiveness of these plans in reducing landslide susceptibility remains uncertain. This research evaluates the integration of ANN-CA-Markov and RF models with remote sensing to develop optimal land use scenarios and assess their application in mitigating landslide hazards in this highly vulnerable region.
This research aims to develop a comprehensive landslide prediction model by integrating Cellular Automata, regional spatial planning, and land capability classification. The model will incorporate spatially distributed data and non-driven factors using the Random Forest algorithm to enhance prediction accuracy. By identifying optimal land use scenarios that minimize landslide susceptibility, this approach has the potential to provide valuable insights for informing government policies and improving regional land use governance.

2. Materials and Methods

2.1. Study Area

The study was conducted in the Sumber Brantas and Kali Konto sub-watersheds (Figure 1). These sub-watersheds are situated within the geographical coordinates of 112°19′22.00″ to 112°35′22.80″ east longitude and 7°44′47.88″ to 7°56′52.02″ south latitude, located in East Java, Indonesia. These volcanic regions are surrounded by active and inactive volcanoes, with Mount Anjasmara mountain in the north and Mount Kawi-Butak on the southeast side. The Sumber Brantas sub-watershed has a longer circumference and higher flow density than the Kali Konto sub-watershed. The study site experiences an average rainfall of 2276 mm per year and is part of the “C” climate type [21]. The development of soil types in the Kali Konto sub-watershed is influenced by the volcanic activity of Mount Anjasmara and Mount Kawi-Butak, and creates soils such as Andisols and Inceptisols. The geomorphology of the site location is divided into several groups, with the upper part forming a volcanic scarp, barranco, slope, middle slope, lower slope, and inter-volcanic plains. Similar studies in the Upper Brantas Watershed have demonstrated the significance of integrating community empowerment and participatory approaches in managing land degradation effectively [7].

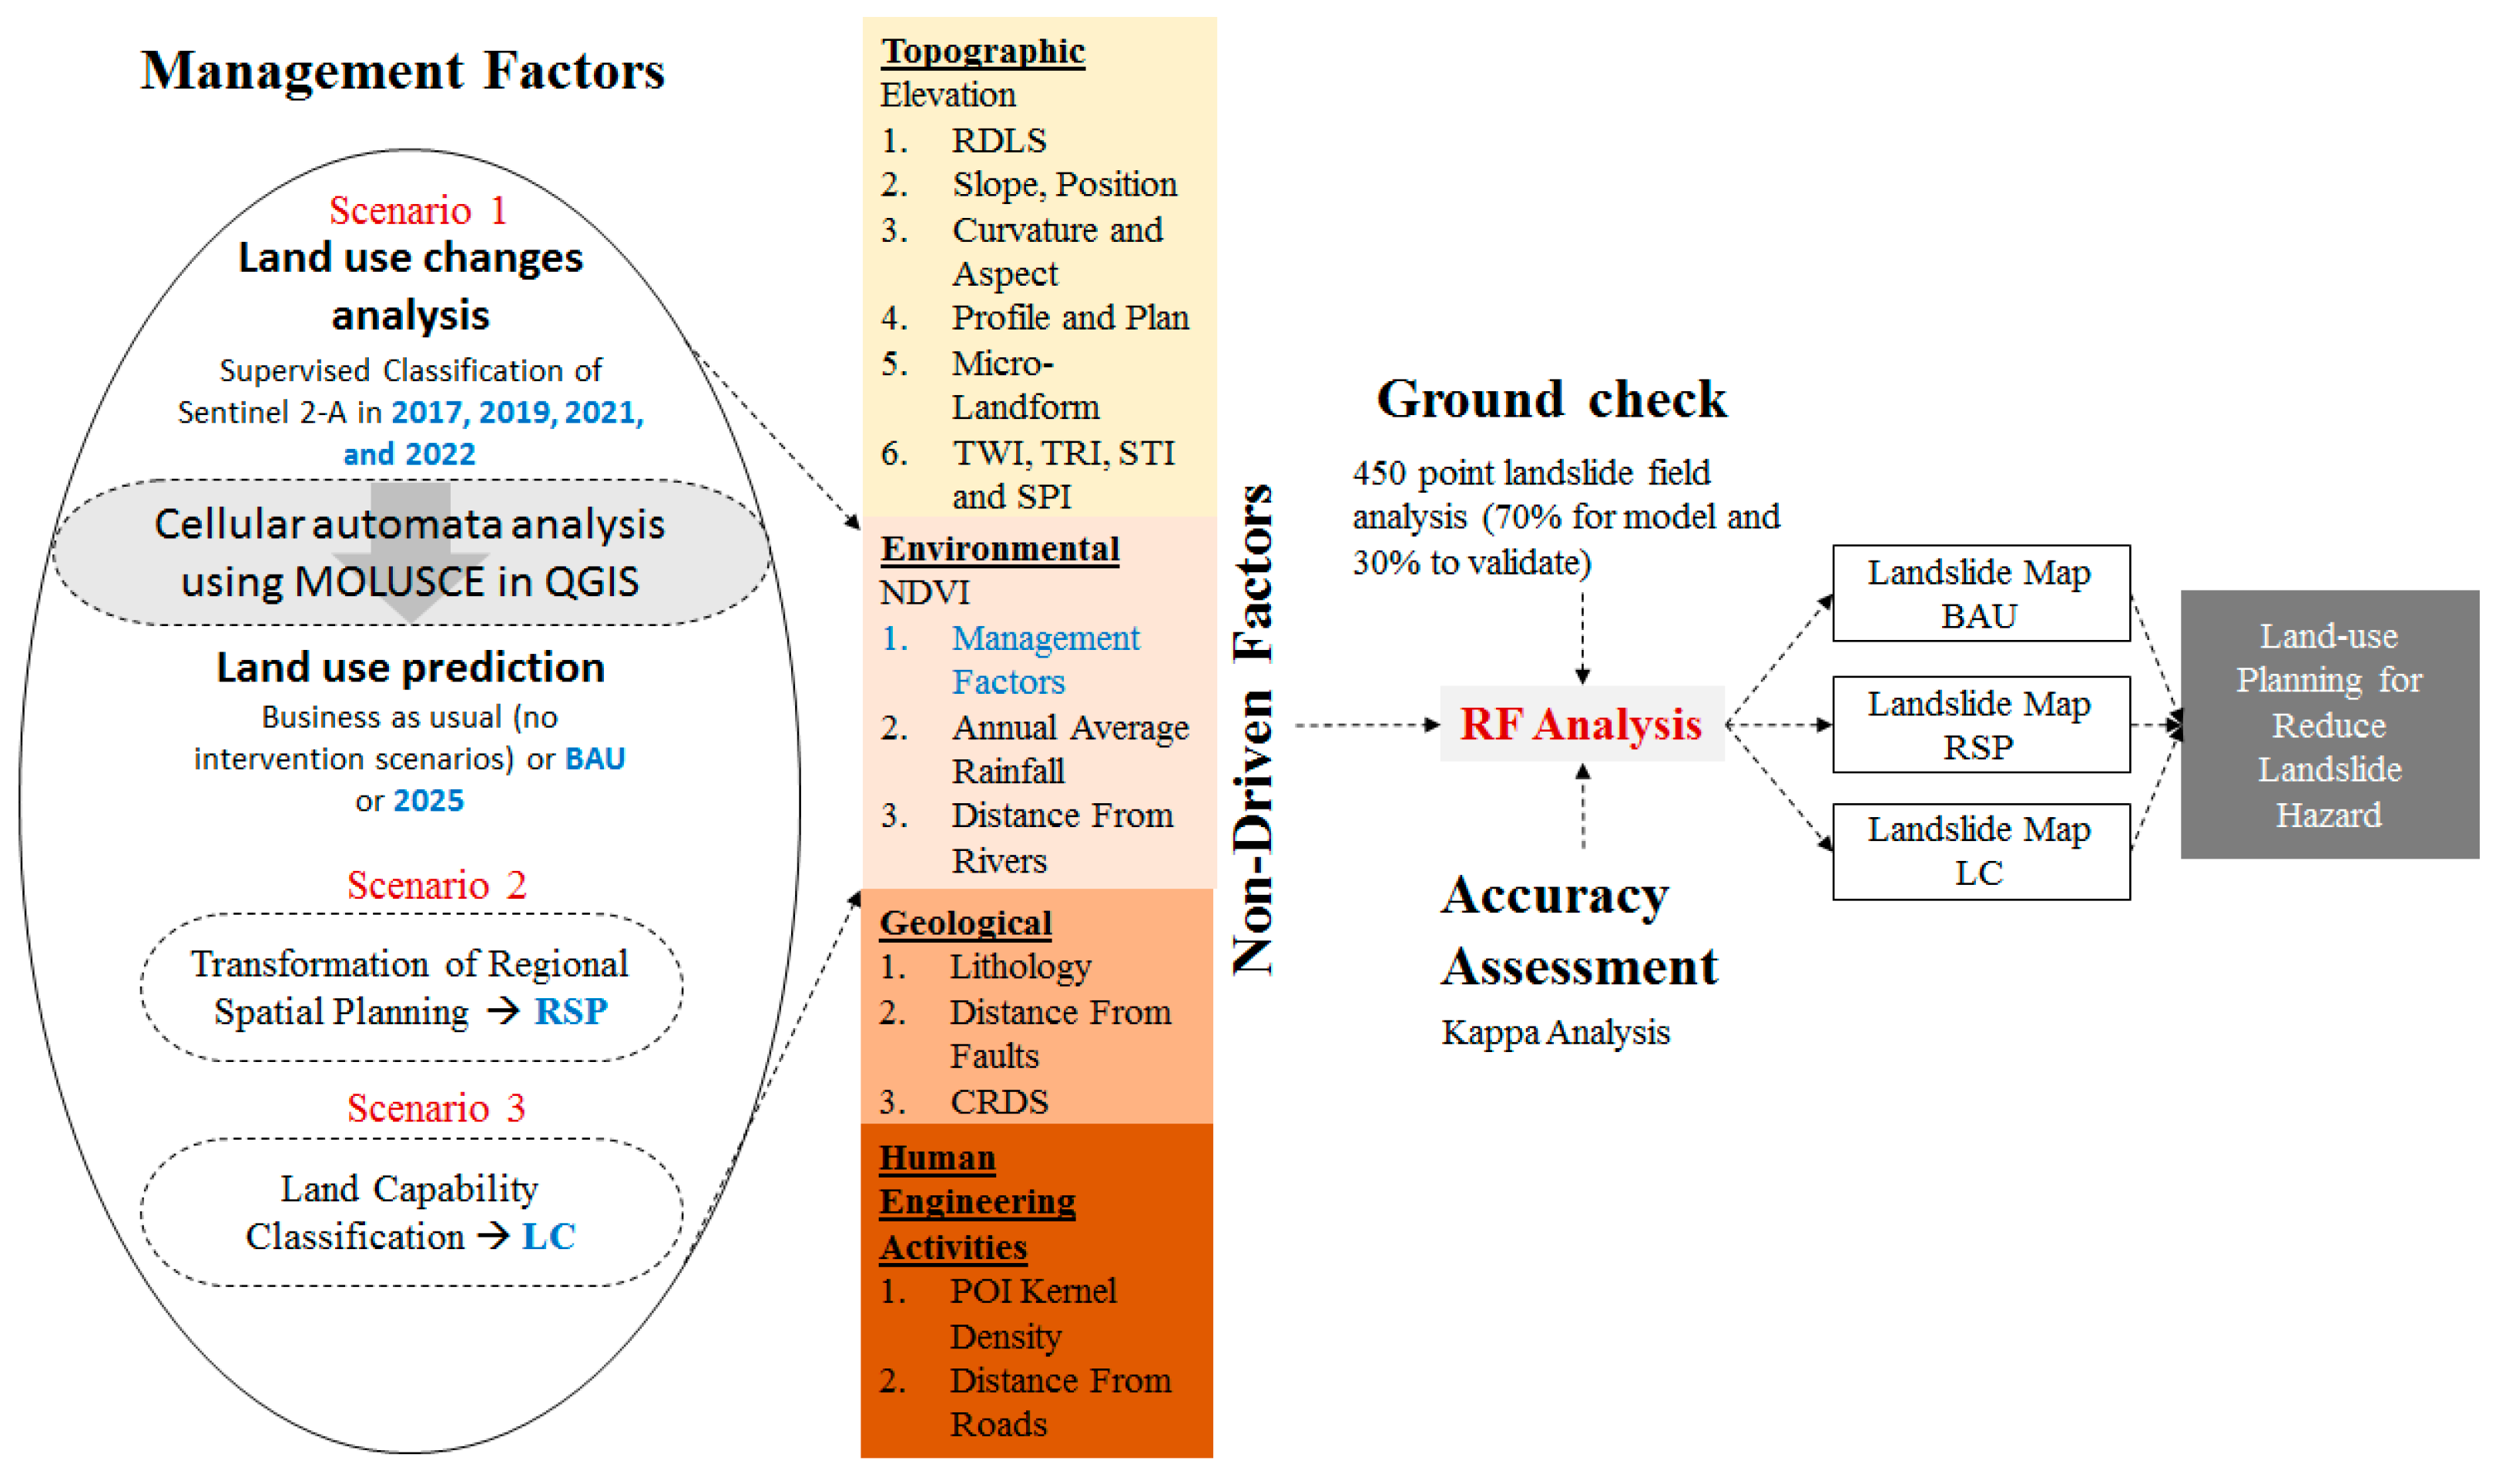
2.2. Research Framework

The research focuses on selecting optimal land use scenarios to prevent future landslide events. Factors like land capability, rainfall intensity, and slope gradient influence changes. Land use is crucial for modeling landslides. In our modeling of landslides, we provide three scenario factors: business as usual (BAU), regional spatial planning (RSP), and land capability classification (LCC). In this study, Random Forest Analysis (RF) was utilized to run simulations for each land use map and scenario, incorporating various driving factors, including topographic, environmental, geological, and human engineering activity factors. The RF model was employed to generate landslide susceptibility maps across different years and scenarios. Subsequently, the accuracy of the RF-generated maps was evaluated using the Kappa coefficient to assess model performance and reliability (Figure 2). A well-planned micro-watershed management approach can serve as a critical strategy to restore degraded landscapes and mitigate landslide hazards in highly vulnerable areas [7].

2.3. Land Use Classification

Sentinel 2-A imagery for the years 2017, 2019, 2021, and 2023, acquired via the Copernicus website (https://browser.dataspace.copernicus.eu/, accessed on 1 August 2023), was used to produce land use maps. Before classification and analysis, the Sentinel-2A imagery underwent pre-processing to improve data quality and accuracy, including radiometric correction [22], haze and cloud removal [23], and atmospheric correction [24]. ArcGIS 10.8 software was used in a supervised classification method. The various land use types were divided into categories such as rice fields, bush, agroforestry, natural forests, production forests, meadows, marginal/empty land, and water bodies. The land use map for 2023 was validated using kappa analysis, through the examination of field observation sites and the 2022 land use classification. Data validation was carried out to evaluate the image’s correctness compared to the field observations. The analytical equation utilizing the Kappa value is as follows:
K a p p a   c o e f f i c i e n t = i = 1 k n i i = 1 k n i   ( G t C i ) n 2 i = 1 k n i   ( G t C i )
where k is the code number, i is the class number, n is the total number of classified pixels that compare to the actual data, ni is the number of the actual data pixels that were classified with class i, Ci is the total number of classified class i pixels, and Gt is the total number of actual data class i pixels. Kappa values, as described by Rwanga and Ndambuki [25], are adjusted for validation results, allowing for predictions for the land use map in 2025. If the generated value is more than 70%, the land use map can be approved and projections for the map in 2025 can be created.

2.3.1. Business as Usual Scenario Prediction

The Cellular Automata predicts land use for 2025 using road maps and built-up area data from the RSP. The 2023 built-up area classification results are exported with the Euclidean distance tool. The 2025 business as usual analysis predicts land use changes in the Sumber Brantas and Kali Konto sub-watershed areas using QGIS 3.28 software and the MOLUSCE plugin [26]. The Artificial Neural Network-Cellular Automata-Markov Chain (ANN-CA-Markov) system integrates machine learning, spatial dynamics, and probabilistic modeling to simulate and predict land use changes. In this study, it is used to predict the 2025 BAU (business as usual) land use scenario based on baseline land use data from 2017 to 2022, ensuring accurate and realistic projections of future landscape dynamics. The 2025 BAU land use, predicted using ANN-CA-Markov based on 2017–2022 baseline data, is then integrated with other environmental and topographical parameters using Random Forest analysis to assess its impact on landslide susceptibility.

2.3.2. Regional Spatial Planning Scenario

Regional spatial planning (RSP) is a government-led initiative designed to regulate land use at provincial, district, and regional levels in a comprehensive and long-term manner. In this study, the RSP scenario was based on the RSP for the Malang and Batu Regency and was acquired from the Regional Spatial Planning Office or the Public Works Department. Its primary objective is to align land use with sustainable development principles, ensuring balance and suitability across various sectors, particularly agriculture and forestry [27]. RSP decisions integrate considerations of government priorities and community needs, playing a crucial role in mitigating natural disaster risks by addressing disturbances in vegetation cover and land use patterns [28].

2.3.3. Land Capability Class Scenario

The land capability class (LCC) system categorizes land into eight classes based on factors like topography, soil, climate, and land use planning to support sustainable crop production and prevent land degradation. Classes I–IV are suitable for agriculture, Class V for grasslands and shrubs, Class VI for nature reserves, Class VII for limited use, and Class VIII for preservation [29,30]. An LCC map created using land use and land cover (LULC) data can help to optimize land management and maintain long-term productivity.

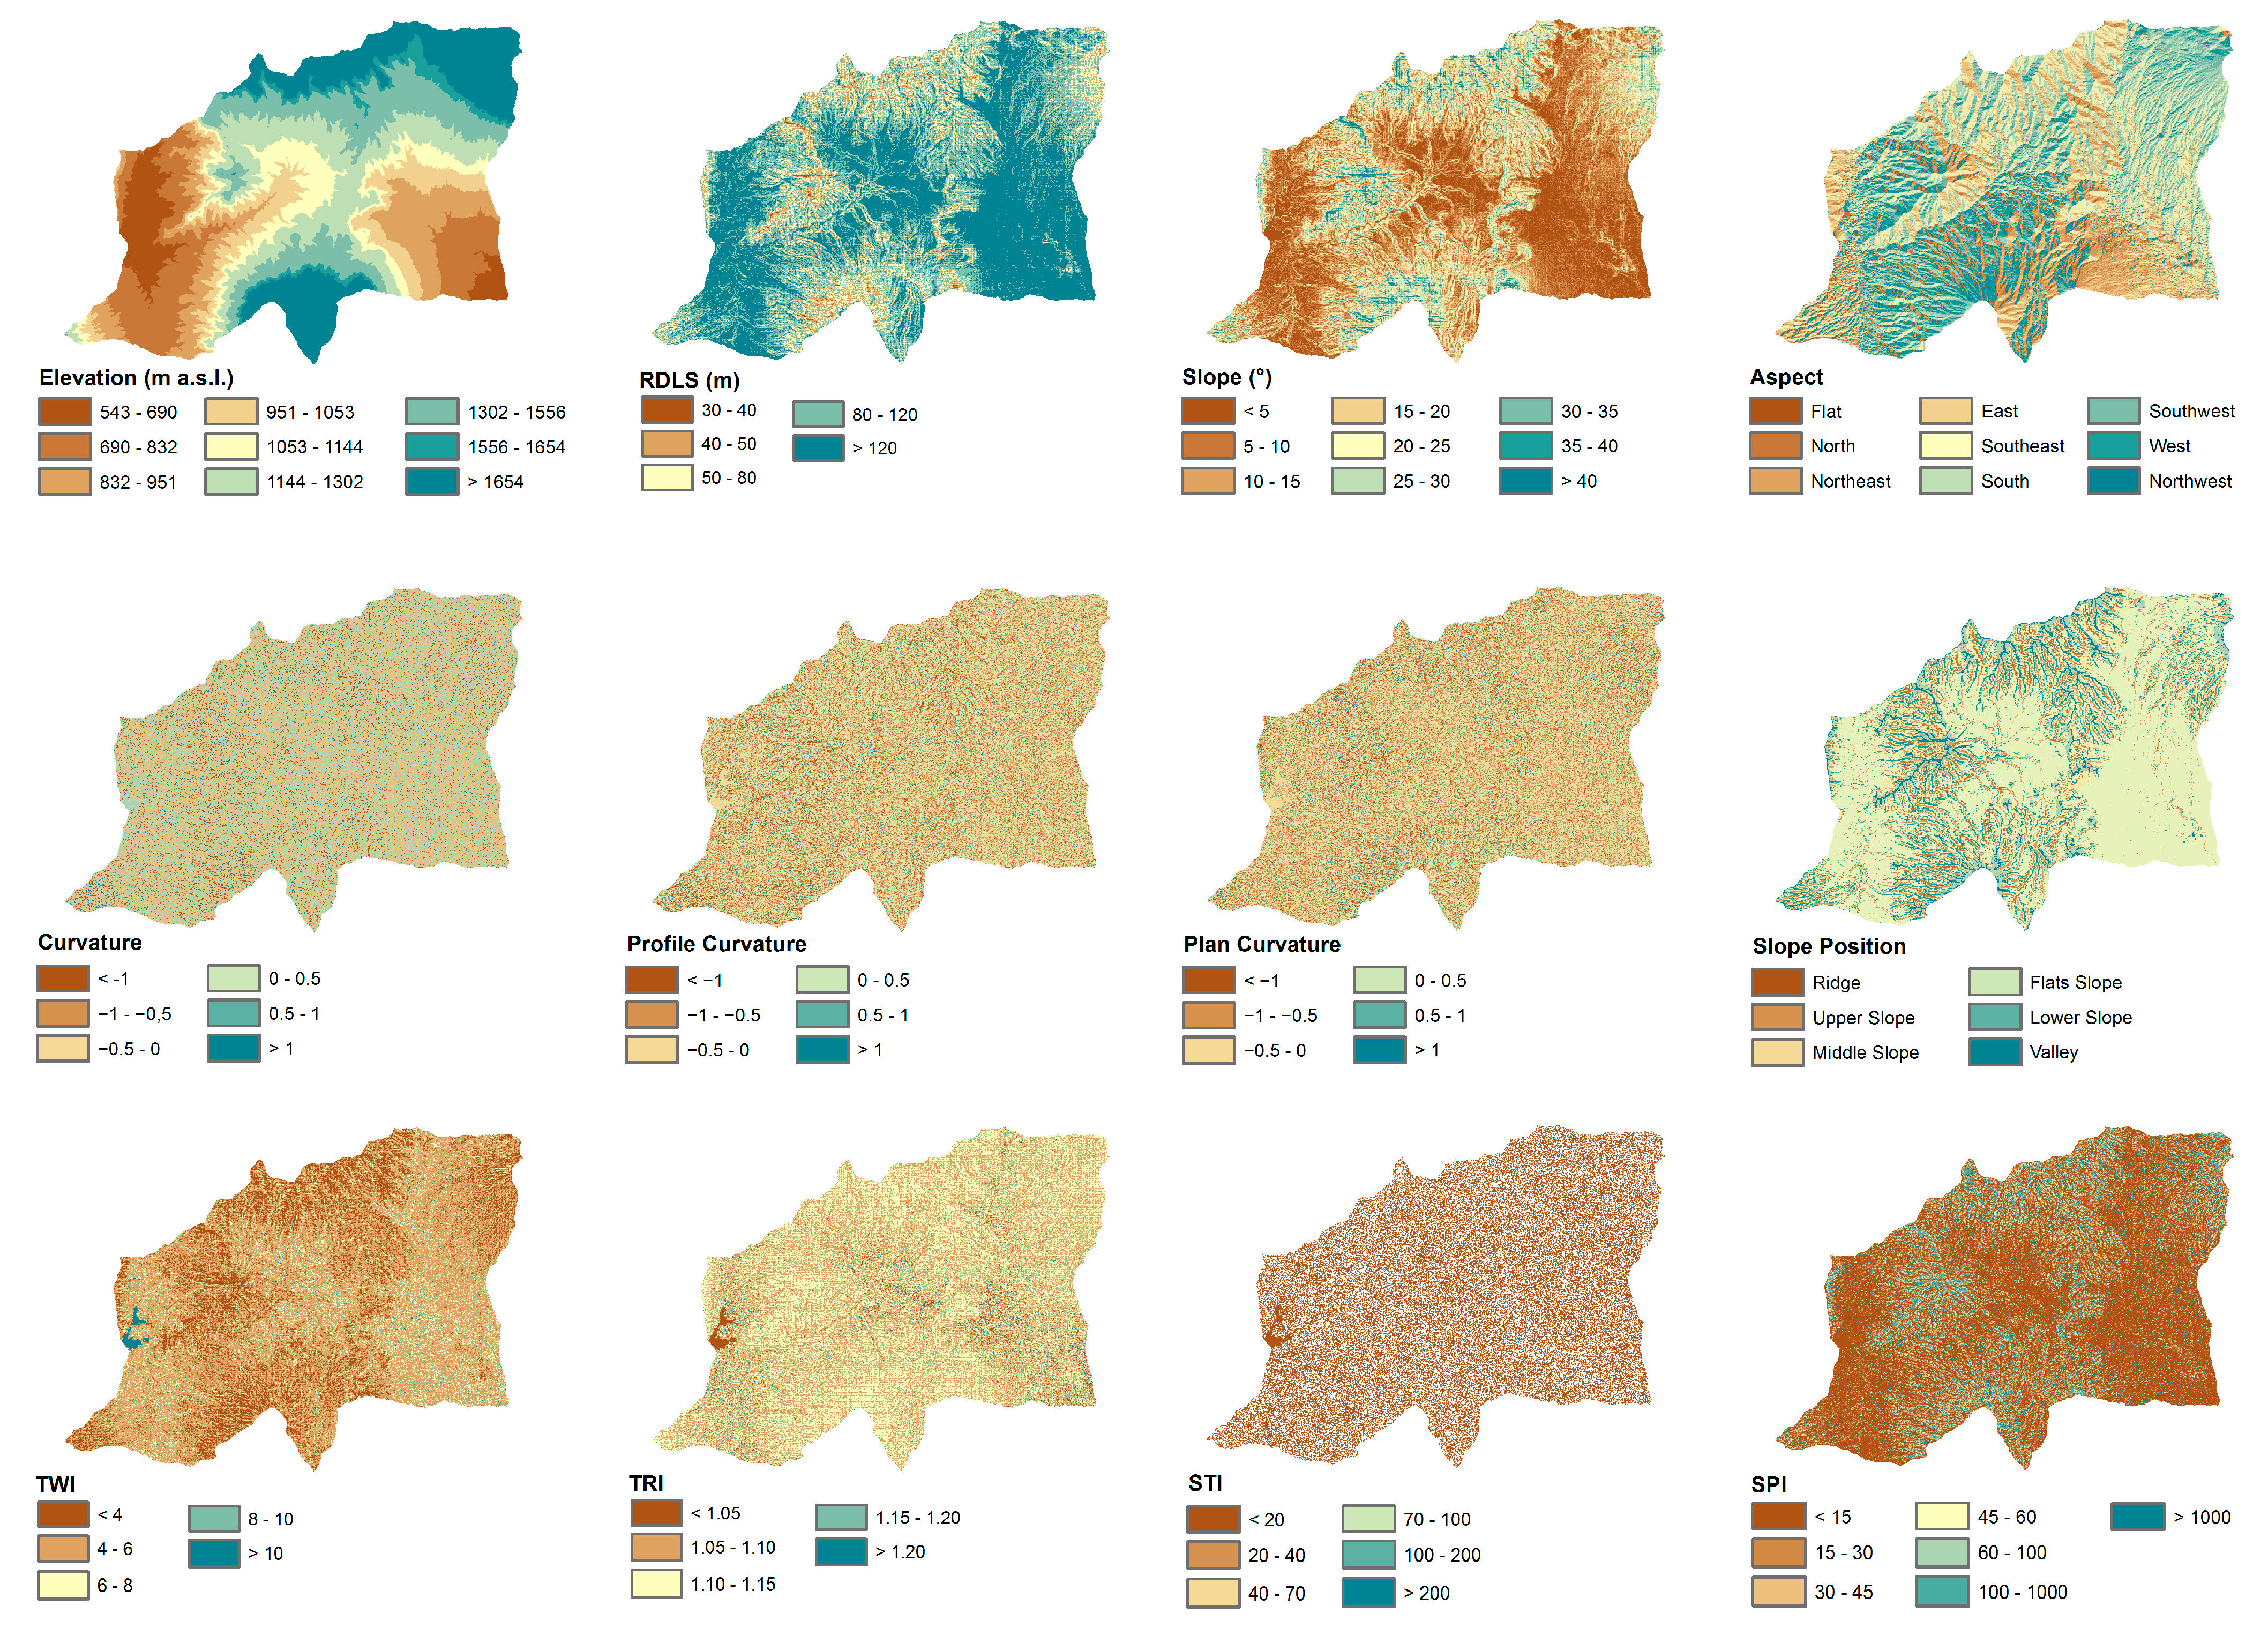
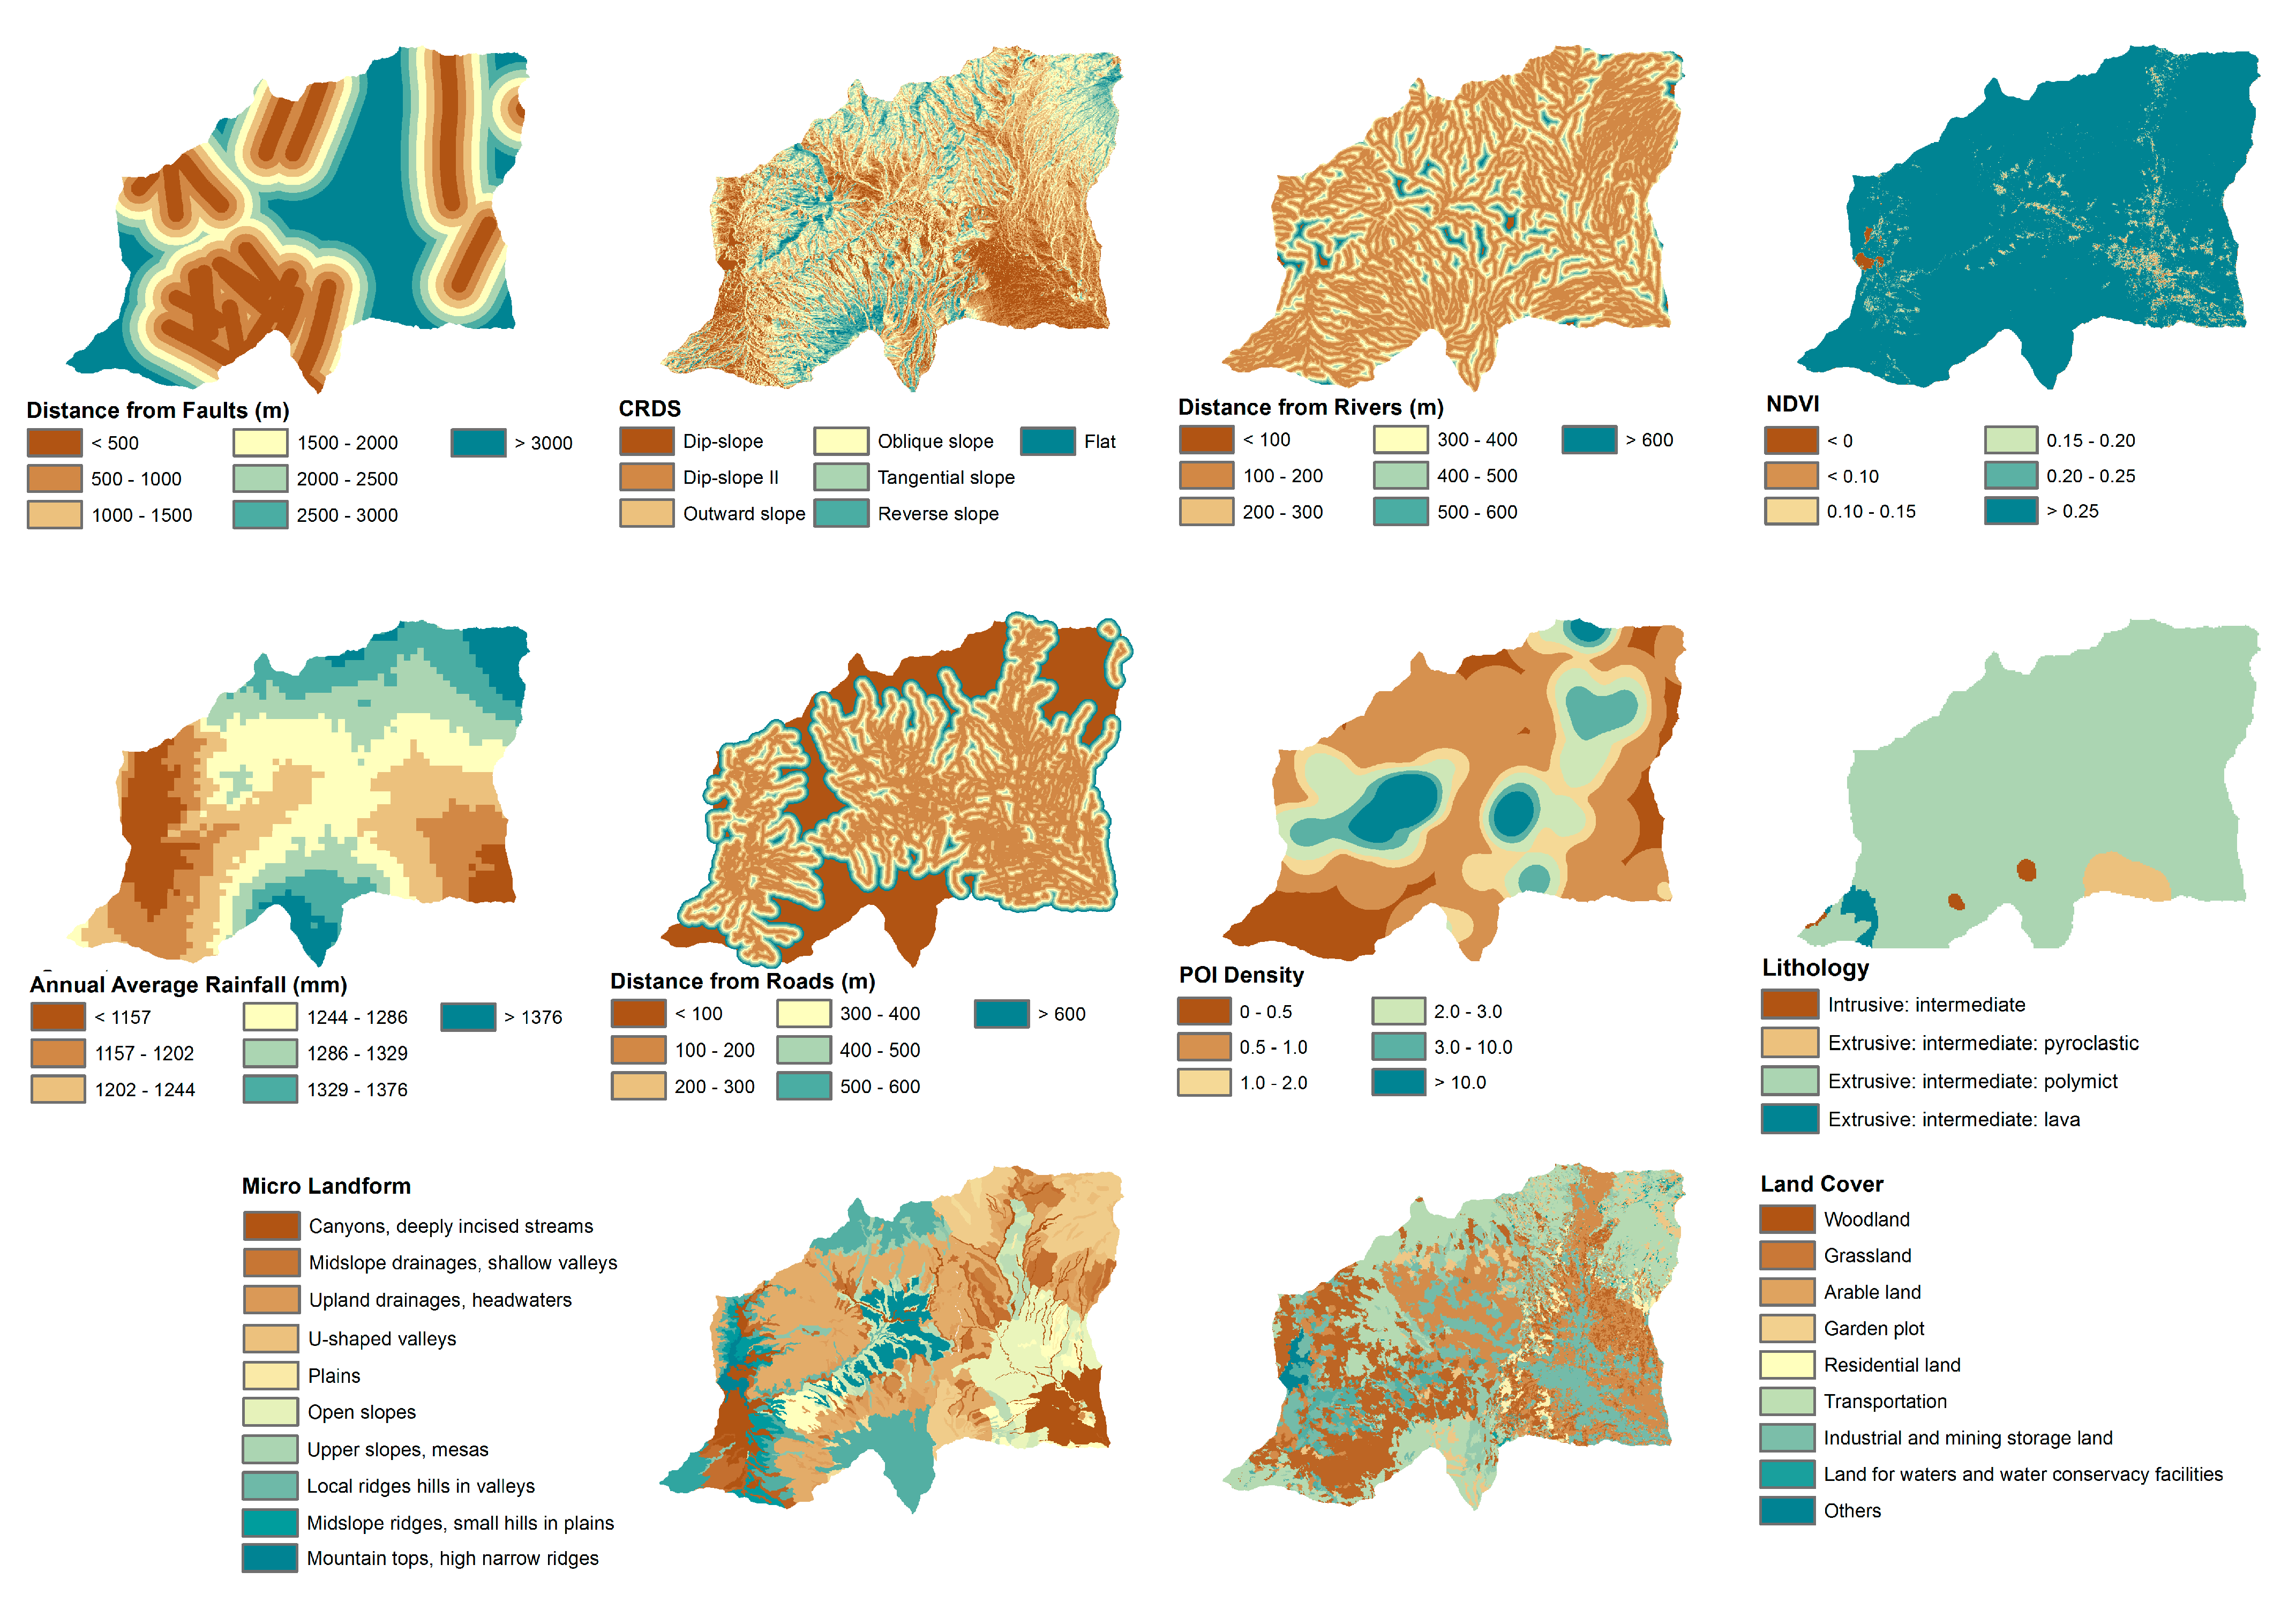
2.4. Landslide Predictor Parameter

Understanding landslide formation is complex, and is influenced by soil characteristics, landslide category, causes, data availability, and evaluation methods [31,32]. Landslides are caused by a combination of topographic elements and geological factors that determine their likelihood and susceptibility, and environmental and human activity factors that function as triggers (Table 1).
Landslide formation is influenced by multiple parameters that can be categorized into three main dimensions: geological conditions, environmental factors, and human factors. Geological conditions include factors that define the physical characteristics of the terrain, such as lithology (LITH), which determines soil mechanical strength and weathering susceptibility; distance from faults (DF), which affects the likelihood of seismic-induced landslides; slope (SLP), which influences gravitational stress and instability; aspect (ASP), which impacts solar radiation exposure and erosion processes; curvature (CURV), which affects water drainage and accumulation influencing slope stability; and relief degree of land surface (RDLS), which represents topographic variations affecting erosion and slope stability.
Environmental factors pertain to climatic and hydrological influences that affect land stability. These include rainfall intensity (RAIN), which can saturate soil and trigger slope failure; topographic wetness index (TWI), which measures water accumulation affecting soil strength and susceptibility to landslides; stream power index (SPI), which quantifies the erosive capacity of flowing water and its potential to destabilize slopes; sediment transport index (STI), which assesses the potential for soil displacement and accumulation in downstream areas; and distance from rivers (DR), where areas closer to water bodies are more prone to bank erosion, changes in hydrological dynamics, and increased risk of slope failure.
Human factors refer to anthropogenic influences that alter landscape stability and contribute to landslide susceptibility. These include land cover (LC), which represents the type of vegetation or built-up land that impacts soil retention and erosion control; proximity to roads (PR), as infrastructure development can modify drainage patterns and weaken slopes through excavation and vibration; POI kernel density (PKD), which identifies regions with high levels of human activity that may lead to deforestation, excavation, or construction that destabilizes slopes; and normalized difference vegetation index (NDVI), which assesses vegetation health and density, playing a crucial role in stabilizing slopes by preventing erosion and landslide initiation.

2.5. Random Forest Landslide Susceptibility Modeling

The Random Forest method is used to analyze landslide hazards using data from 2017 to 2022, 2025 scenarios, regional spatial planning, and rainfall intensity. The analysis predicts tree numbers and correlates with landslide hazards. The landslide map is categorized into five vulnerability classes using ArcGIS Pro 2.8 software, enhancing the understanding of susceptibility [45]. The Random Forest model is a robust and accurate tool for assessing landslide susceptibility due to its robust performance in complex data processing [41].

2.6. Landslide Classification

According to Nugroho and Nugroho [46], the soil landslide susceptibility zone map is developed using land texture data at a scale of 1:50,000. Landslide zones are classified into five categories based on vulnerability values: very low (<0.001–0.3), low (>0.3–0.7), moderate (>0.7–1.2), high (>1.2–1.5), and very high (>1.5).

2.7. Validation of Landslide Map

Landslide validation points are determined using active field surveys, ranging from 1:100,000 to 1:25,000 scales. These points are distributed based on vulnerability classes, landslide history, and road access. Ground checks are essential for validating landslide hazards. Land titles in various provinces range from 7 to 64, with 25 being the most popular. Landslide-prone areas are classified based on plot and landscape units, slopes, and soil material.
The hazards associated with landslides are severe for human health, and the Random Forest prediction accuracy is evaluated using a confusion matrix model. A number greater than 0.5 implies a landslide, and a prediction of 1 indicates no landslide. The threshold for landslide prediction is set at 0.5. As model validation indicators, the landslide prediction matrix is split into three sections: accuracy (ACC), recall (SST), and F1 score (FS). This formula is applied to the validation of landslides [41].
A C C = T P + T N T P + F P + T N + F N
S S T = T P T P + F N
P R E = T P T P + F P
F S = 2 P R E × S S T P R E + S S T
The model’s accuracy is determined by the difference between actual and predicted values, with positive values indicating higher accuracy. SST, FS, and ACC values range from 0.1 to 1, with ACC closer to 1 indicating better model accuracy.

3. Results

3.1. Land Use Changes in the Sumber Brantas and Kali Konto Sub-Watersheds

The model’s accuracy is determined by the difference between actual and predicted values, with positive values indicating higher accuracy. SST, FS, and ACC values range from 0.1 to 1, with an ACC closer to 1 indicating better model accuracy. The accuracy of landslide hazard maps can be ascertained by dividing the Sum number of landslide points by the number of relevant vulnerability points, which yields the overall accuracy of possible hazards. The kappa analysis result comparing the ground check data from the field with the produced map is 81%, surpassing the minimum threshold established by Rwanga and Ndambuki [25].
Based on Figure 3, regarding the results of land use classification, it was found that there were land use types that experienced significant changes in 2017, 2019, 2021, and 2022. Between 2017 and 2022, significant changes occurred across various land use categories in the Sumber Brantas and Kali Konto sub-watersheds. Natural forest coverage experienced the most pronounced decline, dropping from 38.16% in 2017 to 22.86% in 2022, indicating substantial deforestation and land conversion. Similarly, production forest decreased significantly, from 25.44% to 9.72% over the same period. Meanwhile, coffee pine agroforestry also saw a reduction from 2.22% to 1.59%, reflecting a shift in agricultural practices. In contrast, built-up areas increased steadily, from 10.03% in 2017 to 12.16% in 2022, illustrating ongoing urbanization. Gardens experienced one of the largest proportional increases, growing from 10.43% in 2017 to 21.21% in 2022, highlighting an expansion in horticultural activities.
Other notable changes include the rise in moorlands from 2.53% in 2017 to 23.07% in 2022, indicating significant land use conversion. Shrubland also expanded, increasing from 2.86% to 3.67% over the years, while rice fields grew from 2.76% to 3.78%, reflecting an emphasis on food production. Categories such as mahogany coffee agroforestry fluctuated, peaking at 0.05% in 2021 before dropping to 0.02% in 2022, while mahogany talas agroforestry remained consistently low at 0.003% throughout. These trends underscore a dynamic interplay between urbanization, agriculture, and deforestation, necessitating strategic land management to address environmental and socio-economic challenges (Table 2).

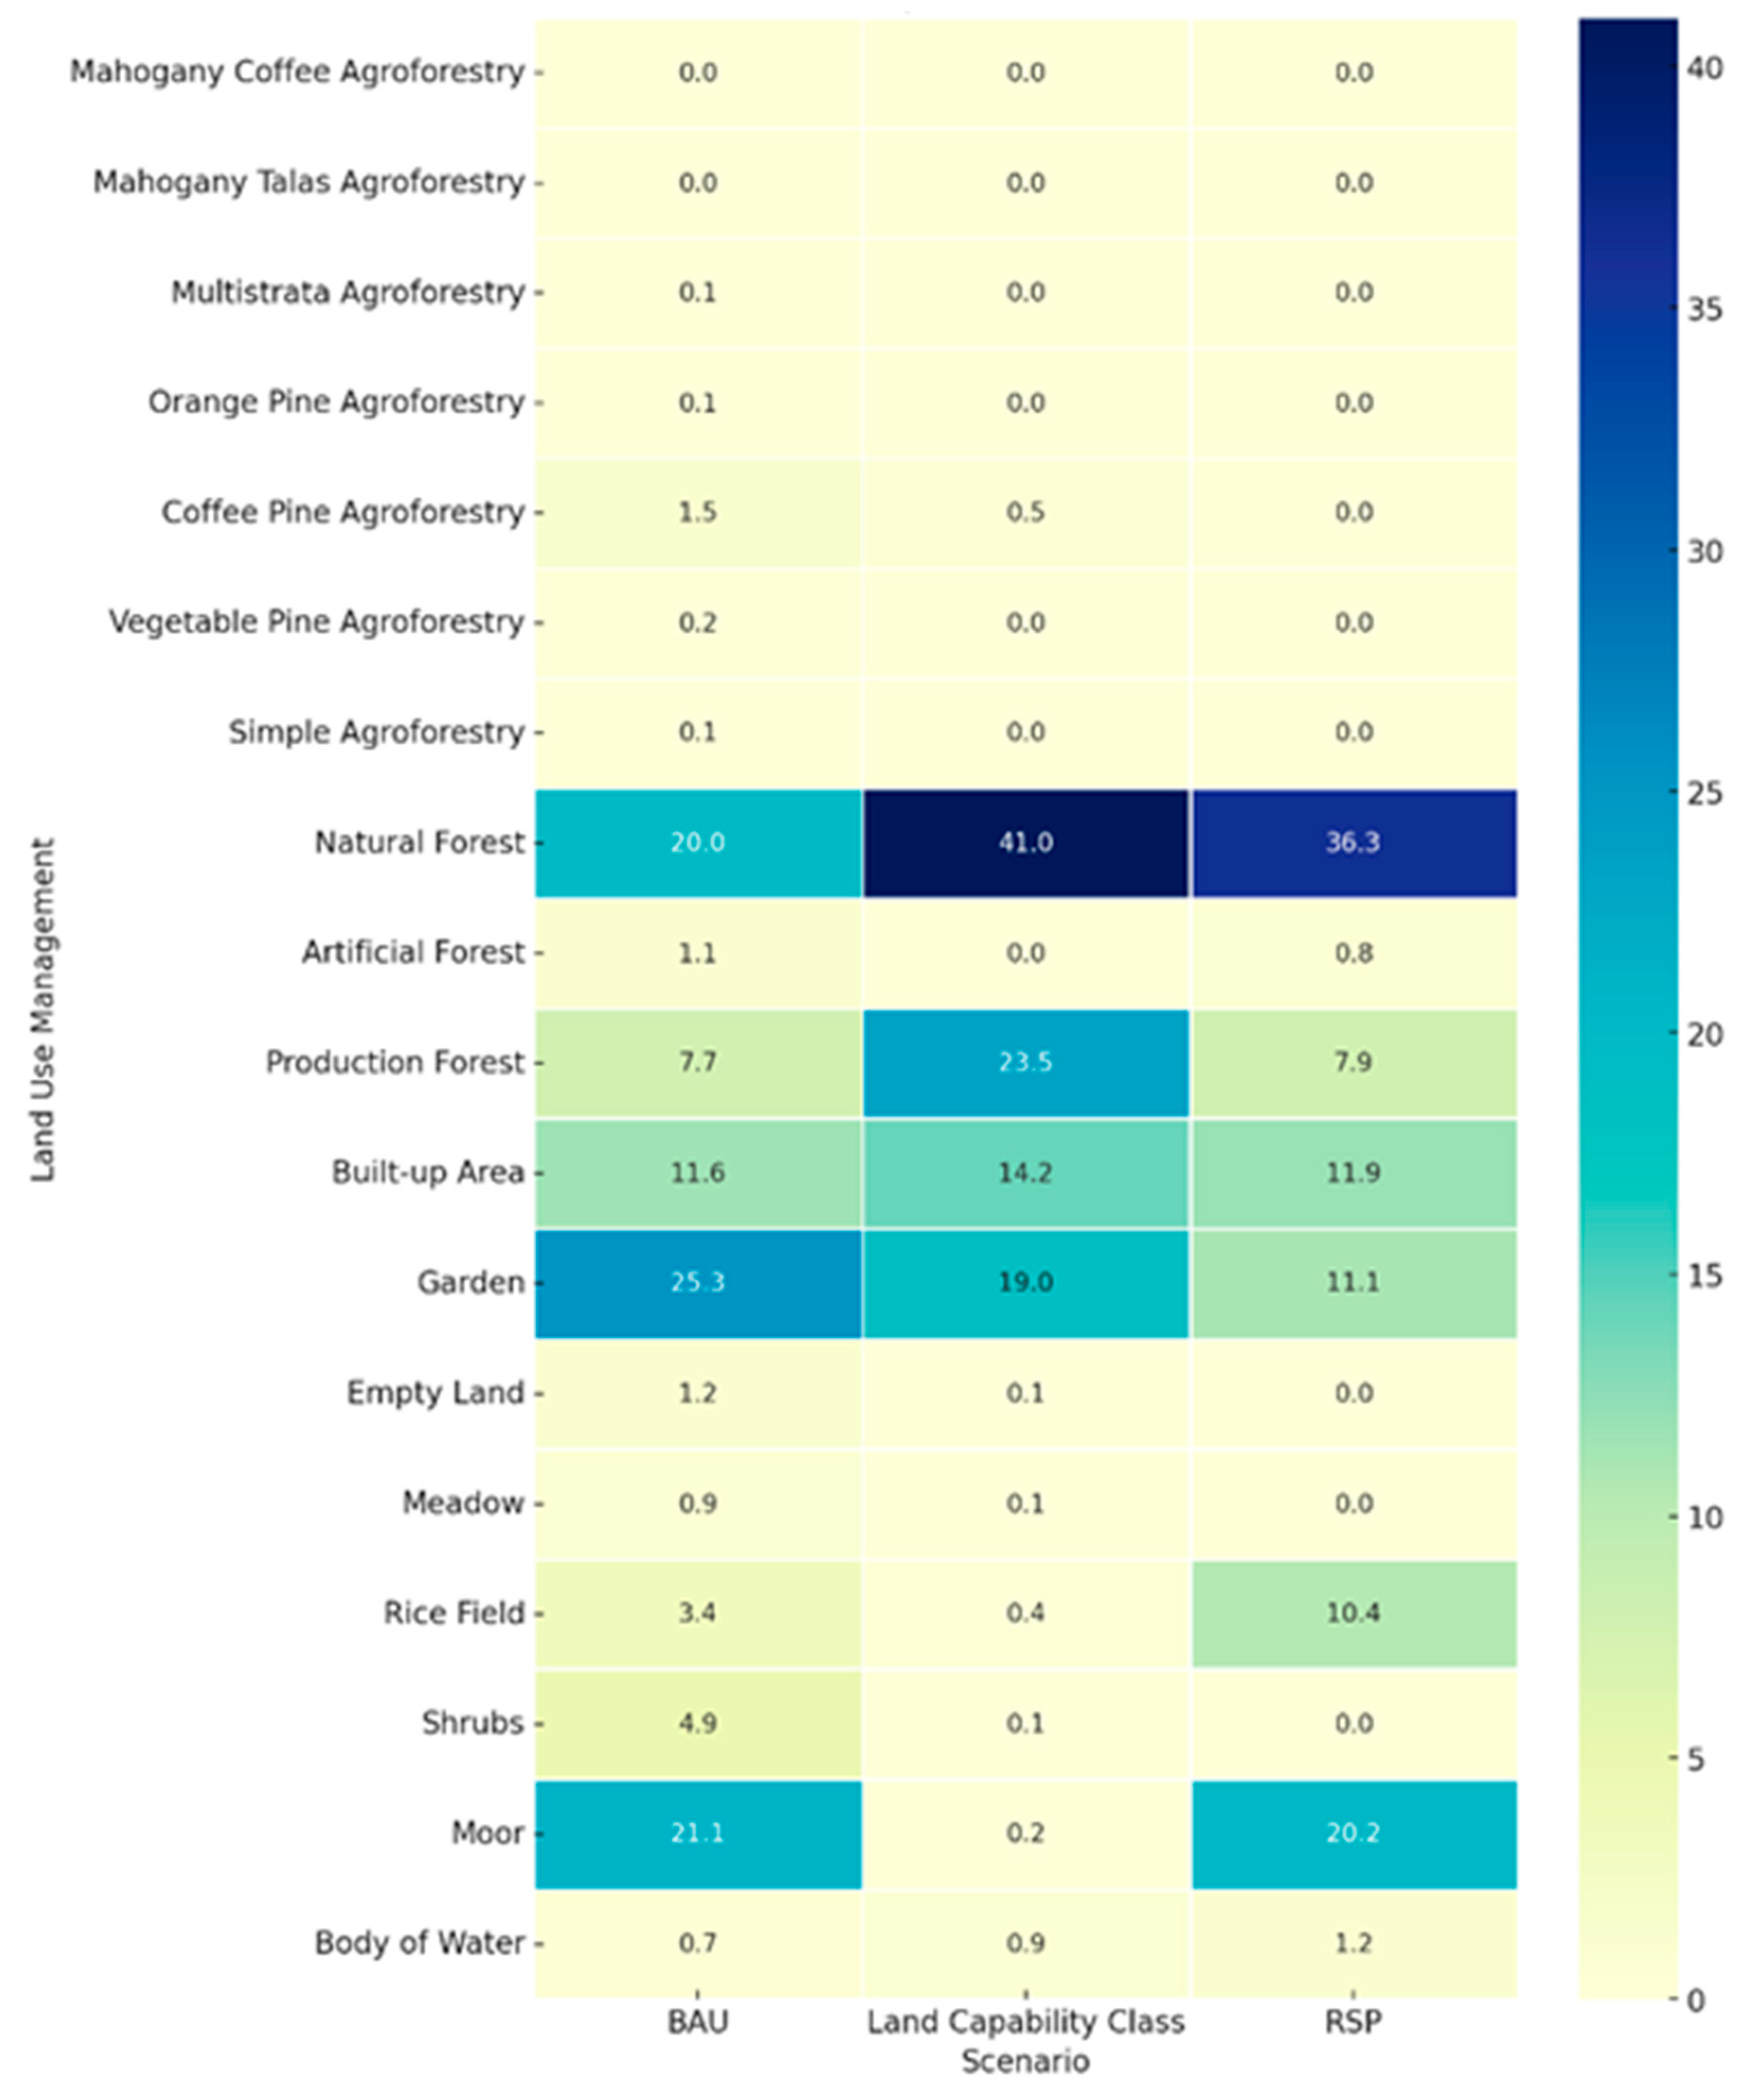
3.2. Land Use Management Scenario

The 2025 land use analysis uses three scenarios: business as usual (BAU), land capability class (LCC), and regional spatial planning (RSP). The ANN-CA-Markov chain method is used to analyze changes in land use, particularly in built-up areas. A land use management scenario map is provided in Figure 4.
The land use classification carried out in Figure 4 shows that there are very significant differences in land use using the scenario-based ANN-CA-Markov method, which consists of business as usual in 2025, land capability classes, and regional spatial planning. The extent of the classification results carried out is available in Figure 5.
The visualization depicts the distribution of land use management types under three distinct scenarios: BAU, LCC, and RSP. Each scenario reflects a unique approach to managing land resources, illustrating shifts in allocation for natural, agricultural, and urban uses. In the BAU scenario, gardens (25.3%) and moorlands (21.1%) dominate land use, while natural forests occupy 20.0%. This scenario maintains current land management trends, which could lead to the moderate use of natural and semi-natural ecosystems. However, the reliance on existing practices may limit the potential for significant ecological improvements or adaptation to environmental challenges.
The LCC scenario emphasizes conservation and sustainable land utilization. Natural forest coverage increases substantially to 41.0%, while production forests rise to 23.5%, reflecting a strategic focus on managed forestry for sustainable resource extraction. This scenario prioritizes land use planning based on land capability, aiming to enhance ecological balance and reduce pressure on vulnerable ecosystems. However, garden areas decline to 19.0%, indicating a trade-off that could affect agricultural productivity. The RSP scenario prioritizes ecological restoration and sustainability. Natural forests are allocated 36.3%, while moorlands cover 20.2%. Notably, rice fields reemerge as a significant land use category, occupying 10.4%, reflecting an effort to balance food security with ecosystem restoration. Garden areas, however, see a sharp decline to 11.1%, signaling a shift toward prioritizing ecological restoration over agricultural expansion.
The analysis of land use scenarios across BAU, LCC, and RSP highlights significant variations in land use distribution. Natural forests dominate in the LCC (34.96%) and RSP (36.32%) scenarios, compared to only 19.96% under BAU, reflecting strong conservation efforts in these frameworks. Similarly, production forests account for 20.02% in LCC and 7.93% in RSP, but only 7.74% in BAU. Built-up areas are slightly higher in BAU (11.59%) than in RSP (11.89%) and LCC (12.08%). Gardens, which make up the largest proportion in BAU (25.26%), decline significantly under RSP (11.14%) and LCC (16.21%). Moorlands also show a notable presence in BAU (21.09%) but are optimized in RSP (20.20%) and LCC (0.15%). The results emphasize the need for strategic planning to balance conservation, agricultural use, and urbanization across these scenarios.

3.3. Driving Parameters for Landslide Susceptibility

Landslide occurrences arise from a combination of topographical, geological, hydrological, and anthropogenic factors that serve as critical driving parameters (Figure 6). Setiawan et al. [9] emphasize that slope steepness accounts for up to 45% of landslide susceptibility, underscoring its dominance among driving factors in regions with steep and mountainous terrains. Elevation and slope are primary determinants, as steep slopes are particularly susceptible to gravitational soil movement [47]. The Relief Degree of Land Surface (RDLS) accentuates this vulnerability by highlighting abrupt elevation changes that can destabilize landforms [48]. Slope-related features, such as aspect, curvature, profile curvature, and plan curvature, are instrumental in understanding geomorphological characteristics that influence water flow, soil stability, and material displacement during landslides. Additionally, slope position and micro landform variables capture localized terrain properties, aiding in identifying areas with higher instability potential [49].
Hydrological parameters are equally vital in landslide triggering mechanisms. Indices such as the Topographic Wetness Index (TWI), Stream Power Index (SPI), and Sediment Transport Index (STI) quantify water accumulation and its capacity to erode or saturate soils. When combined with proximity to rivers, these indices identify zones prone to increased pore water pressure, a key factor in slope failure. Intense rainfall is another significant driver, as it saturates soils, increases weight, reduces shear strength, and ultimately precipitates landslides [50].
Geological influences, including lithology and fault line proximity, shape the terrain’s inherent stability [51]. Weak or fractured lithological units are more susceptible to failure, while faults introduce structural weaknesses that may act as slip planes. Anthropogenic factors, such as land cover changes, proximity to roads, and Point of Interest (POI) kernel density, exacerbate landslide hazards. Urbanization, deforestation, and infrastructure development destabilize slopes, alter drainage, and increase susceptibility to failure [52].
Vegetation, measured using the Normalized Difference Vegetation Index (NDVI), plays a dual role. Dense vegetation stabilizes soil, reducing landslide hazards, while sparse vegetation or degraded cover highlights increased vulnerability [53]. Finally, the Compound Relative Difference in Slope (CRDS) and Terrain Ruggedness Index (TRI) add insights into the terrain’s heterogeneity and roughness, providing a comprehensive framework for assessing slope instability across scales [54].

3.4. Distribution of Landslide Level Based on Land Use Scenarios

The analysis of landslide hazards using the Random Forest (RF) method was conducted across land use scenarios from 2017, 2019, 2021, and 2022, as well as management scenarios such as BAU 2025, regional spatial planning (RSP), and land capability classes (LCC). This analysis incorporated 22 parameters and land use aspects from seven scenarios. The RF method automatically classified landslide categories into five levels: very low, low, medium, high, and very high. Figure 7 illustrates the distribution of these categories, while Figure 8 compares landslide area values across the different scenarios and management approaches.
Figure 8 illustrates the distribution of landslide-prone areas across five categories—very low, low, moderate, high, and very high—over several years (2017, 2019, 2021, 2022, BAU 2025, RSP, and LCC). The very low category exhibits a steady decline in area, decreasing from 13,531 ha in 2017 to 9711 ha under the BAU 2025 scenario, reflecting increasing vulnerability in these regions. However, under the RSP and LCC frameworks, this category recovers to 11,032 ha and 13,490 ha, respectively, indicating better land management practices. Similarly, the low category remains relatively stable across all scenarios, with minor fluctuations ranging between 8646 ha (LCC) and 9378 ha (2019).
Moderate areas show a sharp reduction, decreasing from 42 ha in 2017 to just 7 ha under the BAU 2025 scenario, but increase significantly under RSP (56 ha) and LCC (64 ha), suggesting targeted mitigation efforts. The high category, on the other hand, steadily increases over the years, growing from 13,863 ha in 2017 to 16,698 ha under BAU 2025, but experiences a slight reduction under RSP (18,016 ha) and LCC (14,062 ha). Similarly, the very high category rises from 4183 ha in 2017 to 5096 ha in BAU 2025 but shows stability under RSP and LCC. These trends highlight the potential of RSP and LCC strategies in reducing landslide hazards, particularly in the most vulnerable categories, while stabilizing the overall distribution of land use.
In conclusion, from 2017 to 2022, landslide susceptibility increased, with the “Very Low” category decreasing from 33.14% to 27.31% and the “Low” category remaining relatively stable around 22.87%. Meanwhile, the “High” category grew from 33.95% to 37.59%, and the “Very High” category increased from 10.24% to 12.18%, indicating worsening conditions. Under the BAU 2025 scenario, the “High” category further rises to 40.89%, while the “Very Low” category drops to 23.78%, showing an escalating risk. The RSP scenario shifts risk significantly, increasing the “Moderate” category to 137.14%, while the LCC scenario redistributes landslide susceptibility, reducing the “High” category to 34.44% but increasing the “Moderate” category to 156.73% and the “Very Low” category to 33.04%.

3.5. Distribution of Landslide Hazards Based on Land Use Scenarios

The random forest (RF) model was employed to assess landslide distribution across three scenarios, revealing distinct differences in the affected areas. Under the business as usual (BAU) scenario, high landslide hazards areas dominate, accounting for 40.89% of the region, followed by very low, low, and very high categories. The medium class, representing only 0.02% (7 ha), is minimal due to the presence of water bodies. This uniform distribution under BAU reflects insufficient mitigation efforts, with landslides predominantly concentrated in high-risk zones.
In the regional spatial planning (RSP) scenario, the high-risk category covers an even larger proportion at 44.12% (18,016 ha), followed by very low, low, very high, and medium categories. While RSP aims to align land use with planned mitigation measures, conflicts between competing interests often hinder its effectiveness, leading to persistent high landslide susceptibility. These conflicts exacerbate land use expansion trends observed in 2017–2022, contributing to the dominance of high-risk areas.
The land capability class (LCC) scenario, designed to optimize land use based on land capability, demonstrates a significant reduction in landslide hazards. The high-risk category decreases to 34.44%, while the very low and low categories increase to 33.04% and 21.17%, respectively. The very high category accounts for 11.20%, and the medium category remains minimal at 0.16%. Compared to BAU and RSP, LCC provides the most balanced distribution due to increased forest and agroforestry areas. Simultaneously, reductions in grasslands, shrubs, moorlands, rice fields, gardens, and built-up areas further enhance stability. Water bodies remain stable across all scenarios, contributing to a lower susceptibility in the medium category under LCC. This highlights the LCC scenario’s potential as the most effective strategy for mitigating future landslide hazards.

3.6. Accuracy Assessment

The accuracy of the landslide map is based on the land use and landslide hazards criteria found in the field in 2022. The landslide map yields 46 suitable points out of 50, and the landslide accuracy test yielded an 81% value, indicating good accuracy. This value is acceptable, as the calculation range in studies typically falls between 81% and 100%, enabling it to be considered accurate and close to perfect [25].
The accuracy of landslide hazard maps can be ascertained by dividing the Sum number of landslide points by the number of relevant vulnerability points, which yields the overall accuracy of possible hazards. The accuracy assessment equation can be applied in this situation.
A a = p o i n t s   m a t c h e s   t h e   g r o u n d   c h e c k t h e   t o t a l   n u m b e r   o f   o b s e r v a t i o n   p o i n t s   ×   100 %
Accuracy assessment results can be said to be accurate if the resulting value is >80%, and conversely, if the resulting value is <80%, it is said to be inaccurate [55].

4. Discussion

4.1. The Influence of Land Use on Landslide Susceptibility

Land use in 2017–2022 fluctuated between increasing and decreasing areas, with forests decreasing and grasslands, shrubs, and gardens increasing. This led to an increase in landslide hazards in high and very high categories, while the very low and low landslide hazards categories declined. Land conversion from natural forests to other uses caused a decline in the hydrological cycle, as the clearing forest land for other uses leads to the loss of tree function and an increased risk of landslides [56,57]. However, maintaining land use without changes to other land uses can reduce landslide hazards since this maintains a dense land canopy and traps water in the canopy during intense rain, reducing the risk of landslides at high to very high levels. This ongoing change in land use contributes to the decline in the hydrological cycle [58]. The hydrological cycle involves rainfall impacting the soil layer, with open land conditions prone to surface runoff and soil erosion, resulting in landslides and flooding. Covered land, with a tight canopy, reduces disaster risk by blocking rainwater, allowing water to absorb into the soil through infiltration and flow as groundwater, thus preventing landslides and floods [59].
Changes in land use are closely related to the magnitude of the risk of landslides that may occur. The wider the area of land conversion, the greater the potential for landslides to occur [60]. Landslides are highly likely to occur in areas with fertile land and grasslands due to changes in land use, particularly in sloping areas in the Sumber Brantas and Konto River sub-watersheds. These landslides are more likely to occur in areas with sloping terrain, such as grasslands, bushes, moorlands, rice fields, and built-up areas. Field checks have shown that 17 points with a very high landslide susceptibility class are located in areas of grassland and bushes, while 34 points with a high landslide class are in natural forests, production forest areas, transportation routes, plantation land, open land, residential land, agricultural land, and bush areas.
Our findings align with previous studies that highlight the influence of land use and land cover (LULC) changes on landslide susceptibility. Similar to Hürlimann et al. [56], who demonstrated that increased forest cover improves slope stability while deforestation exacerbates landslide hazards, this research confirms that the conversion of natural forests into other land uses significantly reduces hydrological function, leading to increased disaster potential. Additionally, these findings support Bernardie et al.’s [57] conclusion that climate change, particularly increased soil water content, negatively affects slope stability. However, while both previous studies provide broad regional analyses and future projections, this research offers a more detailed assessment by incorporating three predictive scenarios to monitor and evaluate ongoing LULC dynamics and their direct impact on landslide susceptibility. These scenarios allow us to capture the varying degrees of land conversion, their interaction with hydrological processes, and their influence on landslide hazards in a more structured and predictive manner. This structured approach provides a more precise evaluation of how different land management strategies influence hydrological processes and slope stability. By combining these scenarios with on-the-ground field validation, our study enhances landslide hazard assessments, bridging the gap between theoretical projections and real-world applications for disaster risk reduction.

4.2. Best Scenario in Landslide Susceptibility Mitigation

The land capability class (LCC) scenario analysis indicates that high forest areas in this class can potentially suppress landslide hazards. The regional spatial plan (RSP) results in a high landslide hazards area of 44.12% (18,016 hectare), followed by a business as usual (BAU) area of 40.89% (16,698 hectare). The lowest level falls into the land capability class with 34.44% (14,062 hectare). The growth of built-up areas and human population hectares increased the area of land use, making areas with high levels of land conversion more vulnerable to landslides [61].
The government’s 2025 land use plan, based on the regional spatial planning (RSP) scenario, shows a high landslide distribution of 44.12% (18,016 hectare), followed by 40.89% (16,698 hectare) in the BAU scenario. The landslide hazard area is 34.44% (14,062 hectare) in the LCC scenario. The decrease in high landslide class area is due to differences between government plans and actual conditions, mainly due to differences in forest area. The discrepancy in land use is attributed to a lack of regulation and law enforcement between governments regarding the implementation of RSP. This could potentially trigger future high landslide hazards [62].
Landslides in the Sumber Brantas and Konto River sub-watersheds have been increasing due to changes in land use. In 2017, the forest area reached 55.08%, with a high landslide hazard area of 33.95% and a very high disaster area of 10.24%. In 2019, the forest area decreased to 49.09%, a 6.0% decrease from 2017. However, the area of high landslide hazards increased to 34.44% (1063 hectare), and very high landslide hazards increased to 11.19% (4.69 hectare). In 2021, the forest area decreased further to 38.39% (15,676 hectare), with an increase in high landslide hazards to 37.38% (15,265 hectare). The very high landslide hazards reached 11.29% (4609 hectare), an increase of 0.10% from 2019.
The 2022 land use scenario shows a forest area decrease of 3.63% from 2021, with a 34.75% increase in high landslide area. The landslide area was very high, reaching 12.18% (4973 hectare), an increase of 0.89% (364 hectare). In the 2025 land use scenario, forest area decreased to 33.46 percent (13,665 hectare), with an increase of 1.29% (527 hectare). High landslide areas increased to 40.89% (16,698 hectare), while very high landslide areas reached 12.48% (5096 hectare). The regional spatial plan (RSP) scenario shows a forest area increase of 1.32% (538 hectare) from 2025, with high category landslides increasing to 44.12% (18,016 hectare) and very high category landslides reaching 12.47% (5094 hectare). The land use scenario based on land capability classes (LCC) shows a forest area increase of 19.20% (7840 hectare) and 20.52% (8378 hectare) from the BAU scenario. High landslide areas increased to 34.44% (14,062 hectare), decreasing by 9.68% (3954 hectare) and 6.45% (2636 hectare) from the RSP and BAU scenarios.
Implementing land use strategies based on land capability effectively mitigates landslide risks by aligning land utilization with the inherent characteristics and limitations of the terrain [63]. By assessing factors such as soil type, slope gradient, geology, and vegetation cover, planners can identify areas susceptible to instability [64]. For instance, steep slopes with loose soil are more prone to landslides and may be designated for conservation or reforestation rather than agriculture or construction [65]. This approach not only prevents activities that could exacerbate erosion but also promotes vegetation growth, which stabilizes the soil through root systems [66]. A study highlighted that forest conservation and restoration in vulnerable mountainous regions can be cost-effective measures to reduce landslide risks [67]. By tailoring land use to the land’s capability, we maintain ecological balance and enhance slope stability, thereby reducing the likelihood of landslides.

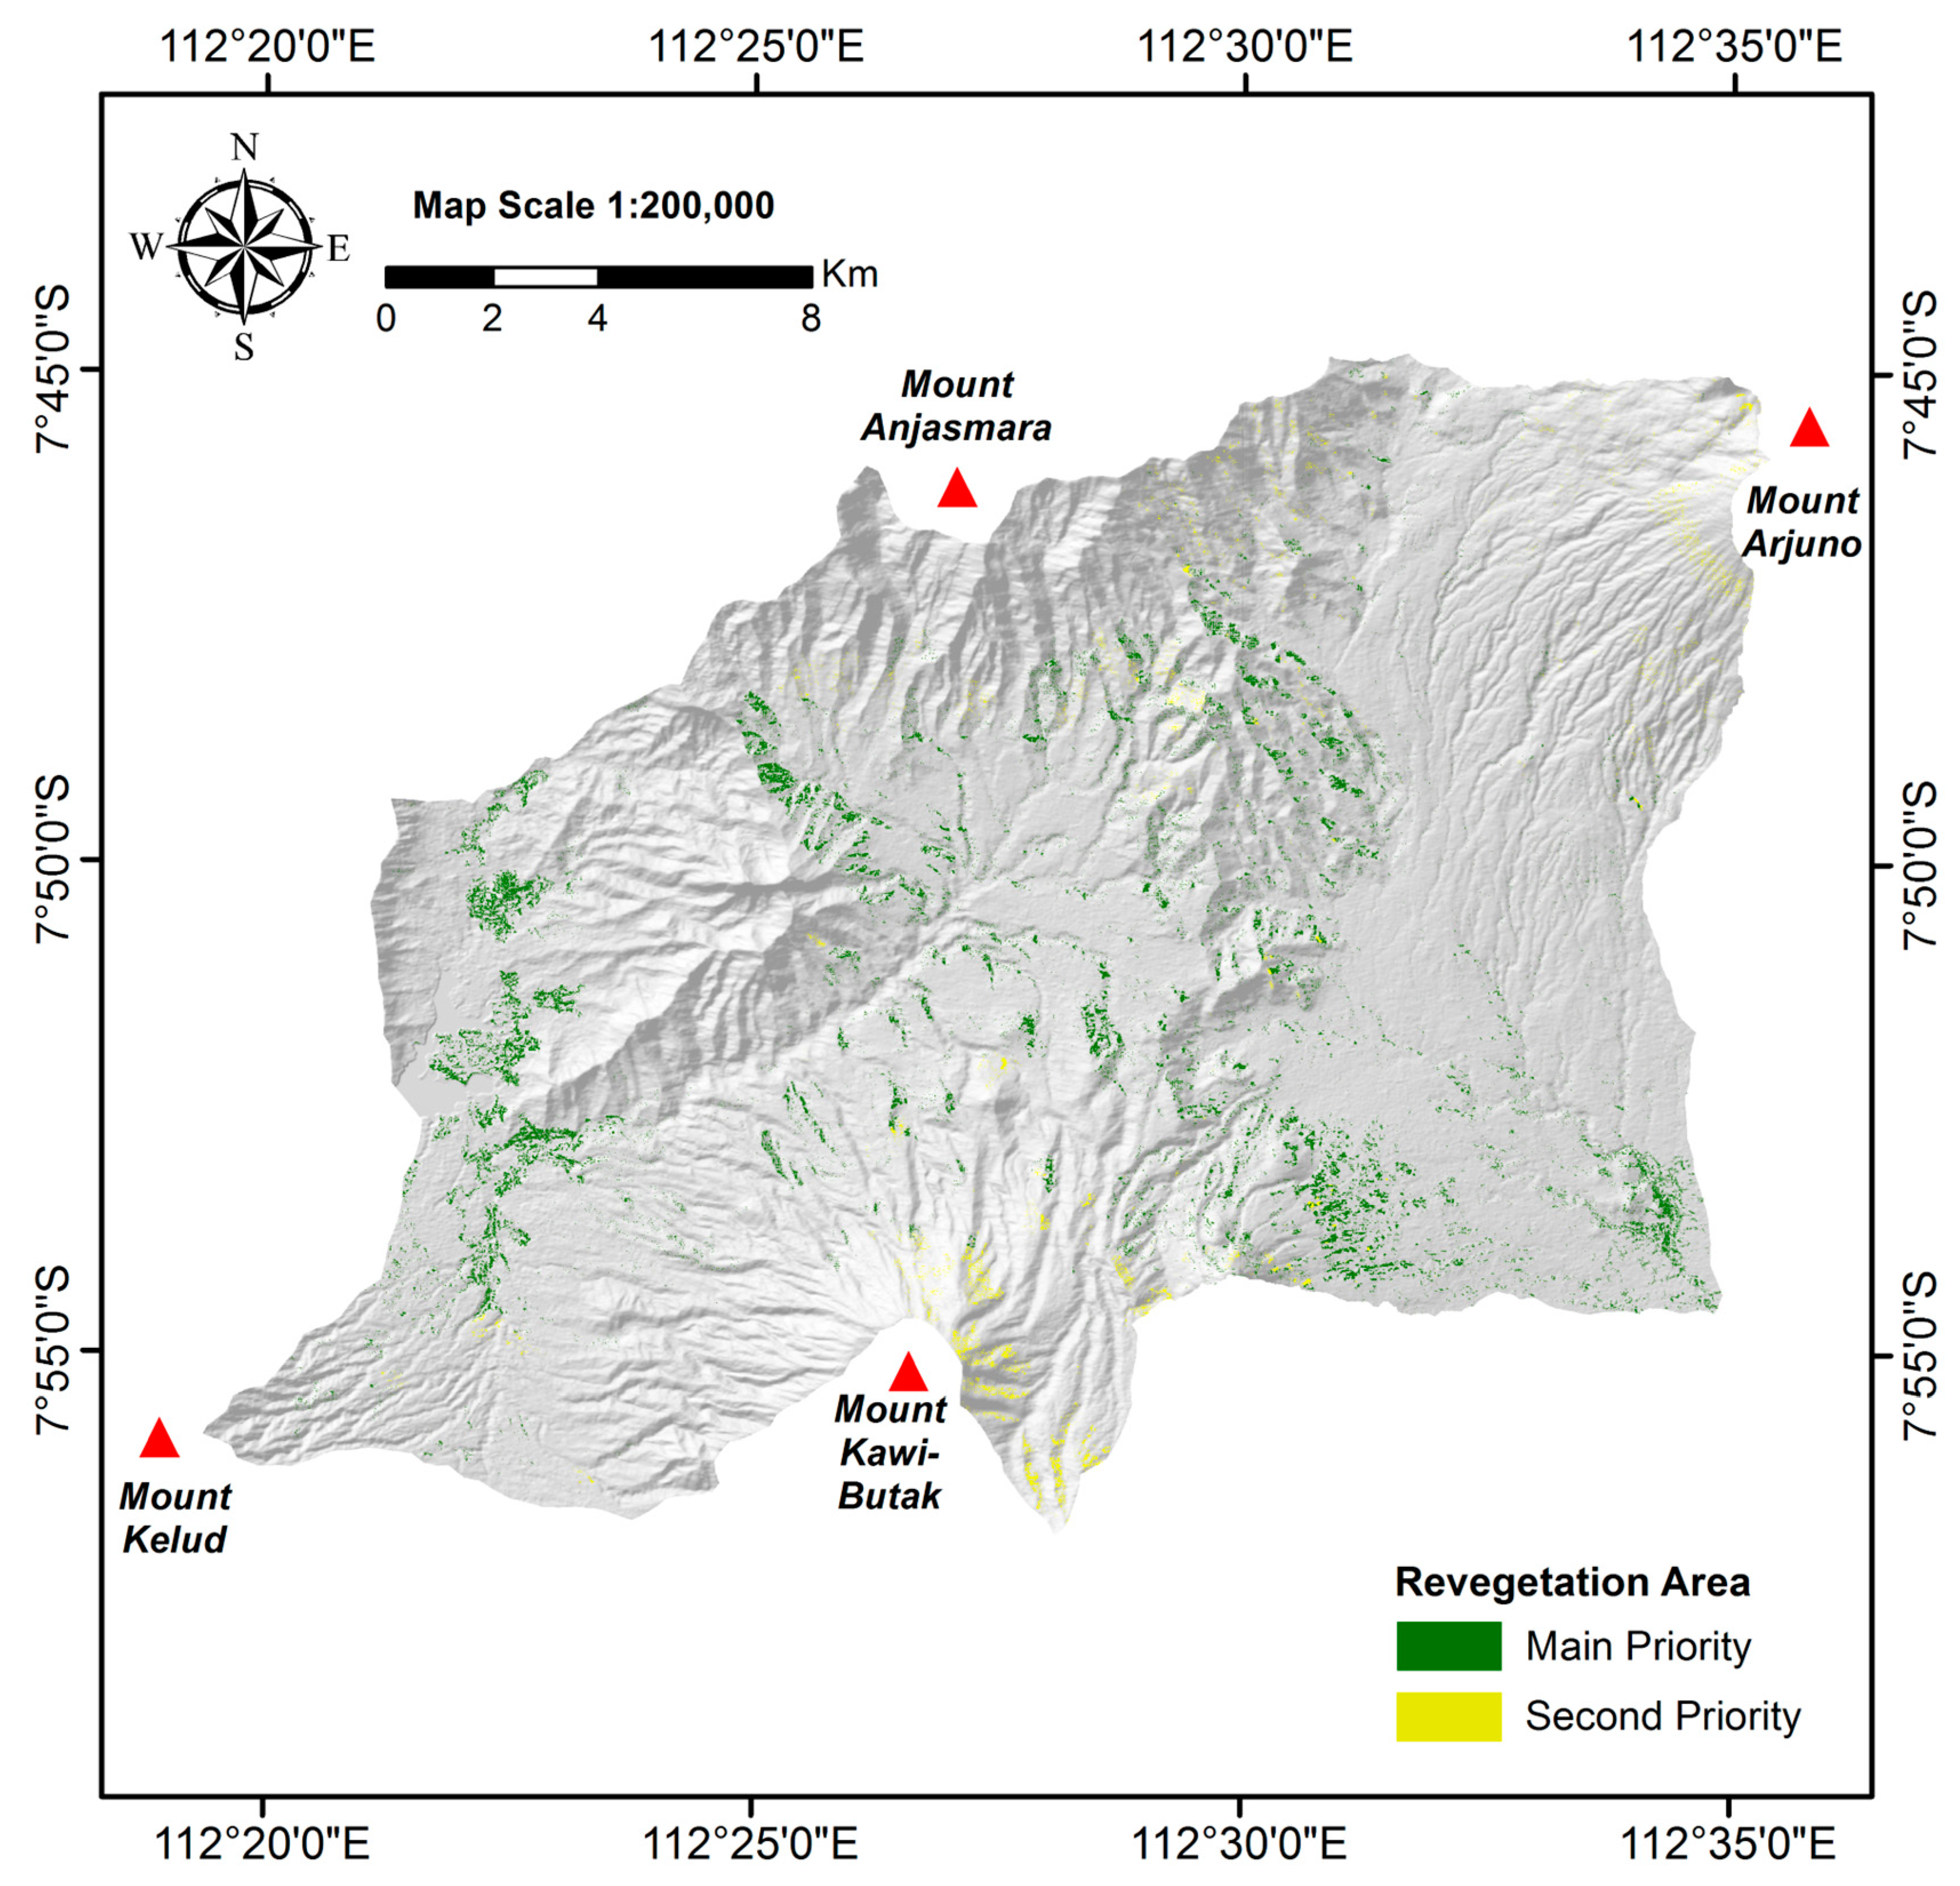
4.3. Recommendations for Revegetation Areas

The primary focus is on identifying critical areas for ecosystem restoration through replanting, particularly those vulnerable to landslides or soil erosion, or on steep slopes. Our recommendations also cover areas crucial for water and soil conservation, where vegetation can reduce erosion, maintain soil moisture, and prevent future landslides. A map of the recommended revegetation areas is provided; see Figure 9.
Figure 9 highlights the prioritization of areas requiring revegetation to mitigate landslide hazards. The main priority areas, including villages like Bendosari, Sukomulyo, Pujon Kidul, and others, urgently need revegetation due to the high landslide potential caused by land shifts to moorlands and rice fields in 2022. Secondary priority areas, such as Pagersari, Sidodadi, Banjarejo, and others, require moderate revegetation efforts due to their grassland- and shrub-dominated land use, with forests and agroforestry already integrated into land capability classes (LCC). Revegetation efforts should focus on selecting plant species compatible with local soil and climate conditions, involving local communities to enhance program success and sustainability. These recommendations aim to restore degraded ecosystems, reduce landslide hazards, and ensure effective land management through strategic planning and community participation.

4.4. Potential Use of the Model to Predict Landslide

This study presents a novel approach to landslide hazard assessment by integrating remote sensing, Cellular Automata-Markov (CA-Markov), and Random Forest (RF) models to simulate future land use scenarios with high accuracy (>81%). Unlike traditional studies that focus solely on historical trends, this research incorporates 400 field-validated landslide data points and 22 diverse parameters, offering a more comprehensive and data-driven perspective on land use dynamics. The inclusion of multiple land use scenarios—business as usual (BAU), land capability classification (LCC), and regional spatial planning (RSP)—provides actionable insights into sustainable land management strategies. The study’s key novelty lies in its ability to quantify and predict the impact of land conversion on landslide susceptibility, demonstrating that proper spatial planning and reforestation efforts under LCC and RSP can effectively reduce landslide risks. This approach not only enhances regional planning but also bridges the gap between geospatial analysis, machine learning, and environmental sustainability, making it a valuable reference for future hazard mitigation research.
Beyond its regional application, this integrated approach holds significant potential for adaptation and implementation in various geographic contexts with different environmental and socio-economic conditions. By calibrating the model with location-specific datasets, considering aspects such as geological characteristics, climate variability, and land use policies, the framework can be optimized to enhance landslide prediction accuracy across diverse terrains. Moreover, the methodology’s flexibility allows for further refinement through the integration of additional machine learning algorithms, higher-resolution remote sensing data, and real-time monitoring systems. Future research can explore the scalability of this approach in regions with limited historical landslide records, leveraging transfer learning and data augmentation techniques to compensate for data gaps. By continuously improving model accuracy and adaptability, this study lays the groundwork for more resilient and data-driven disaster risk management strategies globally.

5. Conclusions

The Sumber Brantas and Kali Konto sub-watersheds are undergoing significant land use changes, driven primarily by the reduction in forest area, which contribute to an increased risk of landslides. From 2017 to 2022, forest area declined by 20.33%, while grasslands, shrubs, moorlands, rice fields, gardens, and built-up areas expanded. Under the business as usual (BAU) scenario, forest area continues to decrease. In contrast, the regional spatial planning (RSP) scenario demonstrates a modest increase in forest area by 1.32% and a reduction in plantation area by 0.95%. The land capability class (LCC) scenario shows the most promising results, with forest area increasing by 19.23% and built-up areas decreasing by 3.13%. The LCC scenario also exhibits the lowest landslide disaster distribution, covering 33.04% of the sub-watersheds, which is significantly better than the BAU (23.02%) and RSP (23.78%) scenarios. Furthermore, the LCC scenario reduces the high landslide hazards area by 40.89% compared to the BAU scenario and 44.12% compared to the RSP scenario. These findings highlight the effectiveness of the LCC scenario in mitigating landslide hazards and improving land use sustainability in the Sumber Brantas and Konto River sub-watersheds.

Author Contributions

Conceptualization, A.N.P., S. and C.P.; methodology, J.; software, J. and A.N.P.; validation, J. and A.N.P.; formal analysis, J.; investigation, J.; resources, J.; data curation, J.; writing—original draft preparation, J. and A.N.P.; writing—review and editing, N.R.P., M.T.S., S., C.P., F.M. and F.T.A.; visualization, A.N.P. and N.R.P.; supervision, A.N.P., S. and C.P.; project administration, A.N.P.; funding acquisition, A.N.P. All authors have read and agreed to the published version of the manuscript.

Funding

This research received no external funding.

Institutional Review Board Statement

Not applicable.

Informed Consent Statement

Not applicable.

Data Availability Statement

Data will be made available upon reasonable request through the corresponding author.

Acknowledgments

We thank the field assistants for their assistance in conducting measurements during the fieldwork.

Conflicts of Interest

The authors declare no conflicts of interest.

Abbreviations

The following abbreviations are used in this manuscript:
BAUBusiness as Usual
LCCLand Capability Class
RSPRegional Spatial Planning
CACellular Automata
ANNArtificial Neural Network
RFRandom Forest
LULCLand Use Land Cover

References

  1. Tateishi, H.R.; Bragagnolo, C.; Almeida, A.N. Forest, agriculture and land conversion: Environmental efficiency in Brazilian Amazon rainforest. For. Policy Econ. 2021, 133, 102615. [Google Scholar] [CrossRef]
  2. Khan, M.M.H.; Bryceson, I.; Kolivras, K.N.; Faruque, F.; Rahman, M.M.; Haque, U. Natural disasters and land-use/land-cover change in the southwest coastal areas of Bangladesh. Reg. Environ. Chang. 2015, 15, 241–250. [Google Scholar] [CrossRef]
  3. Dewi, S.; van Noordwijk, M.; Ekadinata, A.; Pfund, J.-L. Protected areas within multifunctional landscapes: Squeezing out intermediate land use intensities in the tropics? Land Use Policy 2013, 30, 38–56. [Google Scholar] [CrossRef]
  4. Chen, D.; Wang, C.; Li, Y.; Liu, X.; Wang, Y.; Qin, J.; Wu, J. Effects of land-use conversion from Masson pine forests to tea plantations on net ecosystem carbon and greenhouse gas budgets. Agric. Ecosyst. Environ. 2021, 320, 107578. [Google Scholar] [CrossRef]
  5. Hallaj, Z.; Bijani, M.; Karamidehkordi, E.; Yousefpour, R.; Yousefzadeh, H. Forest land use change effects on biodiversity ecosystem services and human well-being: A systematic analysis. Environ. Sustain. Indic. 2024, 23, 100445. [Google Scholar] [CrossRef]
  6. Saco, P.M.; McDonough, K.R.; Rodriguez, J.F.; Rivera-Zayas, J.; Sandi, S.G. The role of soils in the regulation of hazards and extreme events. Philos. Trans. R Soc. B Biol. Sci. 2021, 376, 1834. [Google Scholar] [CrossRef]
  7. Suprayogo, D.; Prayogo, C.; Saputra, D.D.; Sari, R.R.; Putra, A.N.; Hadiwijoyo, E.; Andhika, Y.; Ishaq, R.M.; Purnamasari, E.; Irawan, D.B. The capacity of community on running soil and water conservation in Bangsri micro-catchment, Upper Brantas Watershed, Indonesia. IOP Conf. Ser. Earth Environ. Sci. 2019, 393, 012054. [Google Scholar] [CrossRef]
  8. Muñoz-Torrero Manchado, A.; Antonio Ballesteros-Cánovas, J.; Allen, S.; Stoffel, M. Deforestation controls landslide susceptibility in Far-Western Nepal. Catena 2022, 219, 106627. [Google Scholar] [CrossRef]
  9. Setiawan, B.; Sudarto, S.; Putra, A.N. Mapping of landslide-prone areas in Pujon District using the Analytic Hierarchy Process (AHP) method. J. Tanah Dan Sumberd. Lahan 2017, 4, 567–576. (In Indonesia) [Google Scholar]
  10. Popp, A.; Calvin, K.; Fujimori, S.; Havlik, P.; Humpenöder, F.; Stehfest, E.; Bodirsky, B.L.; Dietrich, J.P.; Doelmann, J.C.; Gusti, M.; et al. Land-use futures in the shared socio-economic pathways. Glob. Environ. Chang. 2017, 42, 331–345. [Google Scholar] [CrossRef]
  11. Kalsnes, B.; Capobianco, V. Use of vegetation for landslide risk mitigation. In Climate Adaptation Modelling; Springer International Publishing: Cham, Switzerland, 2022; pp. 77–85. [Google Scholar] [CrossRef]
  12. Sinčić, M.; Bernat Gazibara, S.; Krkač, M.; Lukačić, H.; Mihalić Arbanas, S. The use of high-resolution remote sensing data in preparation of input data for large-scale landslide hazard assessments. Land 2022, 11, 1360. [Google Scholar] [CrossRef]
  13. Li, L.; Xu, E. Scenario analysis and relative importance indicators for combined impact of climate and land-use change on annual ecosystem services in the Karst mountainous region. Ecol. Indic. 2023, 147, 109991. [Google Scholar] [CrossRef]
  14. Mousavi, S.M.; Roostaei, S.; Rostamzadeh, H. Estimation of flood land use/land cover mapping by regional modeling of flood hazard at sub-basin level case study: Marand basin. Geomat. Nat. Hazards Risk 2019, 10, 1155–1175. [Google Scholar] [CrossRef]
  15. Saing, Z.; Djainal, H.; Deni, S. Land use balance determination using satellite imagery and geographic information system: Case study in South Sulawesi Province, Indonesia. Geod. Geodyn. 2021, 12, 133–147. [Google Scholar] [CrossRef]
  16. Dash, P.; Sar, J. Identification and validation of potential flood hazard area using GIS-based multi-criteria analysis and satellite data-derived water index. J. Flood Risk Manag. 2020, 13, e12620. [Google Scholar] [CrossRef]
  17. Ma, S.; He, L.; Fang, Y.; Liu, X.; Fan, Y.; Wang, S. Intensive land management through policy intervention and spatiotemporal optimization can achieve carbon neutrality in advance. J. Clean. Prod. 2023, 385, 135635. [Google Scholar] [CrossRef]
  18. Astuti, I.S.; Sahoo, K.; Milewski, A.; Mishra, D.R. Impact of land use land cover (LULC) change on surface runoff in an increasingly urbanized tropical watershed. Water Resour. Manag. 2019, 33, 4087–4103. [Google Scholar] [CrossRef]
  19. Hairiah, K.; van Noordwijk, M.; Sari, R.R.; Saputra, D.D.; Widianto; Suprayogo, D.; Kurniawan, S.; Prayogo, C.; Gusli, S. Soil carbon stocks in Indonesian (agro) forest transitions: Compaction conceals lower carbon concentrations in standard accounting. Agric. Ecosyst. Environ. 2020, 294, 106879. [Google Scholar] [CrossRef]
  20. Stoeglehner, G.; Abart-Heriszt, L. Integrated spatial and energy planning in Styria—A role model for local and regional energy transition and climate protection policies. Renew. Sustain. Energy Rev. 2022, 165, 112587. [Google Scholar] [CrossRef]
  21. Wei, Y.M.; Kang, J.N.; Liu, L.C.; Li, Q.; Wang, P.T.; Hou, J.J.; Liang, Q.M.; Liao, H.; Huang, S.F.; Yu, B. A proposed global layout of carbon capture and storage in line with a 2 °C climate target. Nat. Clim. Chang. 2021, 11, 112–118. [Google Scholar] [CrossRef]
  22. Jenerowicz, A.; Wierzbicki, D.; Kedzierski, M. Radiometric correction with topography influence of multispectral imagery obtained from unmanned aerial vehicles. Remote Sens. 2023, 15, 2059. [Google Scholar] [CrossRef]
  23. Wang, J.; Yang, D.; Chen, S.; Zhu, X.; Wu, S.; Bogonovich, M.; Guo, Z.; Zhu, Z.; Wu, J. Automatic cloud and cloud shadow detection in tropical areas for PlanetScope satellite images. Remote Sens. Environ. 2021, 264, 112604. [Google Scholar] [CrossRef]
  24. Yin, F.; Lewis, P.E.; Gómez-Dans, J.L. Bayesian atmospheric correction over land: Sentinel-2/MSI and Landsat 8/OLI. Geosci. Model Dev. 2022, 15, 7933–7976. [Google Scholar] [CrossRef]
  25. Rwanga, S.S.; Ndambuki, J.M. Accuracy assessment of land use/land cover classification using remote sensing and GIS. Int. J. Geosci. 2017, 8, 611–622. [Google Scholar] [CrossRef]
  26. Gharaibeh, A.; Shaamala, A.; Obeidat, R.; Al-Kofahi, S. Improving land-use change modeling by integrating ANN with Cellular Automata-Markov Chain model. Heliyon 2020, 6, e05092. [Google Scholar] [CrossRef]
  27. Hou, Y.; Yang, M.; Li, Y. Coordinated effect of green expansion and carbon reduction: Evidence from sustainable development of resource-based cities in China. J. Environ. Manag. 2024, 349, 119534. [Google Scholar] [CrossRef] [PubMed]
  28. Xu, Y.; Dai, Q.Y.; Zou, B.; Xu, M.; Feng, Y.X. Tracing climatic and human disturbance in diverse vegetation zones in China: Over 20 years of NDVI observations. Ecol. Indic. 2023, 156, 111170. [Google Scholar] [CrossRef]
  29. De Feudis, M.; Falsone, G.; Gherardi, M.; Speranza, M.; Vianello, G.; Antisari, L.V. GIS-based soil maps as tools to evaluate land capability and suitability in a coastal reclaimed area (Ravenna, northern Italy). Int. Soil Water Conserv. Res. 2021, 9, 167–179. [Google Scholar] [CrossRef]
  30. Adams, V.M.; Engert, J.E. Australian agricultural resources: A national scale land capability map. Data Brief 2023, 46, 108852. [Google Scholar] [CrossRef]
  31. Sun, D.; Xu, J.; Wen, H.; Wang, D. Assessment of landslide susceptibility mapping based on Bayesian hyperparameter optimization: A comparison between logistic regression and random forest. Eng. Geol. 2021, 281, 105972. [Google Scholar] [CrossRef]
  32. Pourghasemi, H.R.; Kariminejad, N.; Amiri, M.; Edalat, M.; Zarafshar, M.; Blaschke, T.; Cerda, A. Assessing and mapping multi-hazard risk susceptibility using a machine learning technique. Sci. Rep. 2020, 10, 3203. [Google Scholar] [CrossRef]
  33. Ngo, P.T.T.; Pham, T.D.; Hoang, N.D.; Tran, D.A.; Amiri, M.; Le, T.T.; Hoa, P.V.; Bui, P.V.; Nhu, V.H.; Bui, D.T. A new hybrid equilibrium optimized SysFor based geospatial data mining for tropical storm-induced flash flood susceptible mapping. J. Environ. Manag. 2021, 280, 111858. [Google Scholar] [CrossRef]
  34. Wang, Y.; Sun, D.; Wen, H.; Zhang, H.; Zhang, F. Comparison of random forest model and frequency ratio model for landslide susceptibility mapping (LSM) in Yunyang county (Chongqing, China). Int. J. Environ. Res. Public Health 2020, 17, 4206. [Google Scholar] [CrossRef]
  35. Hong, H.; Shahabi, H.; Shirzadi, A.; Chen, W.; Chapi, K.; Ahmad, B.B.; Roodposhti, M.S.; Yari Hesar, A.; Tian, Y.; Tien Bui, D. Landslide susceptibility assessment at the Wuning area, China: A comparison between multi-criteria decision making, bivariate statistical and machine learning methods. Nat. Hazards 2019, 96, 173–212. [Google Scholar] [CrossRef]
  36. Wang, Y.; Hong, H.; Chen, W.; Li, S.; Pamučar, D.; Gigović, L.; Drobnjak, S.; Bui, D.T.; Duan, H. A hybrid GIS multi-criteria decision-making method for flood susceptibility mapping at Shangyou, China. Remote Sens. 2019, 11, 62. [Google Scholar] [CrossRef]
  37. Sun, D.; Wen, H.; Zhang, Y.; Xue, M. An optimal sample selection-based logistic regression model of slope physical resistance against rainfall-induced landslide. Nat. Hazards 2021, 105, 1255–1279. [Google Scholar] [CrossRef]
  38. Sun, D.; Wen, H.; Wang, D.; Xu, J. A random forest model of landslide susceptibility mapping based on hyperparameter optimization using Bayes algorithm. Geomorphology 2020, 362, 107201. [Google Scholar] [CrossRef]
  39. Pham, B.T.; Nguyen-Thoi, T.; Qi, C.; Van Phong, T.; Dou, J.; Ho, L.S.; Van Le, H.; Prakash, I. Coupling RBF neural network with ensemble learning techniques for landslide susceptibility mapping. Catena 2020, 195, 104805. [Google Scholar] [CrossRef]
  40. Chowdhury, M.S. Modelling hydrological factors from DEM using GIS. MethodsX 2023, 10, 102062. [Google Scholar] [CrossRef] [PubMed]
  41. Zhou, X.; Wen, H.; Zhang, Y.; Xu, J.; Zhang, W. Landslide susceptibility mapping using hybrid random forest with GeoDetector and RFE for factor optimization. Geosci. Front. 2021, 12, 101211. [Google Scholar] [CrossRef]
  42. Yi, Y.; Zhang, Z.; Zhang, W.; Jia, H.; Zhang, J. Landslide susceptibility mapping using multiscale sampling strategy and convolutional neural network: A case study in Jiuzhaigou region. Catena 2020, 195, 104851. [Google Scholar] [CrossRef]
  43. Shirzadi, A.; Soliamani, K.; Habibnejhad, M.; Kavian, A.; Chapi, K.; Shahabi, H.; Chen, W.; Khosravi, K.; Pham, B.T.; Pradhan, B.; et al. Novel GIS based machine learning algorithms for shallow landslide susceptibility mapping. Sensors 2018, 18, 3777. [Google Scholar] [CrossRef]
  44. Poddar, I.; Roy, R. Application of GIS-based data-driven bivariate statistical models for landslide prediction: A case study of highly affected landslide prone areas of Teesta River basin. Quat. Sci. Adv. 2024, 13, 100150. [Google Scholar] [CrossRef]
  45. Saad, M.; Kamel, M.; Moftah, H. Landslide susceptibility mapping for the Red Sea Mountains: A multi-criteria decision analysis approach. J. Afr. Earth Sci. 2024, 209, 105125. [Google Scholar] [CrossRef]
  46. Nugroho, D.D.; Nugroho, H. Landslide vulnerability analysis using frequency ratio method in West Bandung Regency, West Java. Geoid 2020, 16, 8. [Google Scholar] [CrossRef]
  47. Guo, W.Z.; Luo, L.; Wang, W.L.; Liu, Z.Y.; Chen, Z.X.; Kang, H.L.; Yang, B. Sensitivity of rainstorm-triggered shallow mass movements on gully slopes to topographical factors on the Chinese Loess Plateau. Geomorphology 2019, 337, 69–78. [Google Scholar] [CrossRef]
  48. Feng, Z.; Tang, Y.; Yang, Y.; Zhang, D. Relief degree of land surface and its influence on population distribution in China. J. Geogr. Sci. 2008, 18, 237–246. [Google Scholar] [CrossRef]
  49. Simulescu, D.; Mititelu-Ionuș, O.; Boengiu, S.; Nikolova, V.; Vîlcea, C.; Mazilu, M.; Popescu, S.M.; Marinescu, E. Mapping and Monitoring of Landforms Evolution. Case study: Breasta Landslide (Southwestern Romania). Pol. J. Environ. Stud. 2025, 34, 1733–1743. [Google Scholar] [CrossRef]
  50. Dutta, B.; Srivastava, P.K.; Boruah, A. Identification of soil erosion-susceptible areas using fuzzy logic and hydrological indices aided by mineralogical-granulometric analysis in lower Subansiri basin, Assam, India. Env. Earth Sci 2025, 84, 70. [Google Scholar] [CrossRef]
  51. Stead, D.; Wolter, A. A critical review of rock slope failure mechanisms: The importance of structural geology. J. Struct. Geol. 2015, 74, 1–23. [Google Scholar] [CrossRef]
  52. Gill, J.C.; Malamud, B.D. Anthropogenic processes, natural hazards, and interactions in a multi-hazard framework. Earth-Sci. Rev. 2017, 166, 246–269. [Google Scholar] [CrossRef]
  53. Foșalău, C.M.; Roșu, L.; Iațu, C.; Dinter, O.V.; Cristodulo, P.M. Mapping Urban Changes Through the Spatio-Temporal Analysis of Vegetation and Built-Up Areas in Iași, Romania. Sustainability 2024, 17, 11. [Google Scholar] [CrossRef]
  54. Yang, R.; Zheng, G.; Hu, P.; Liu, Y.; Xu, W.; Bao, A. Snowmelt flood susceptibility assessment in Kunlun Mountains based on the swin transformer deep learning method. Remote Sens. 2022, 14, 6360. [Google Scholar] [CrossRef]
  55. Saputra, M.A.; Rayes, M.L.; Nita, I. Landslide vulnerability distribution prediction mapping in Tawangmangu District, Karanganyar Regency using fuzzy logic approach. J. Tanah Dan Sumberd. Lahan 2019, 6, 1353–1359. (In Indonesia) [Google Scholar] [CrossRef]
  56. Hürlimann, M.; Guo, Z.; Puig-Polo, C.; Medina, V. Impacts of future climate and land cover changes on landslide susceptibility: Regional scale modelling in the Val d’Aran region (Pyrenees, Spain). Landslides 2022, 19, 99–118. [Google Scholar] [CrossRef]
  57. Bernardie, S.; Vandromme, R.; Thiery, Y.; Houet, T.; Grémont, M.; Masson, F.; Grandjean, G.; Bouroullec, I. Modelling landslide hazards under global changes: The case of a Pyrenean valley. Nat. Hazards Earth Syst. Sci. 2021, 21, 147–169. [Google Scholar] [CrossRef]
  58. Gunnell, K.; Mulligan, M.; Francis, R.A.; Hole, D.G. Evaluating natural infrastructure for flood management within the watersheds of selected global cities. Sci. Total Environ. 2019, 670, 411–424. [Google Scholar] [CrossRef]
  59. Nilsson, C.; Riis, T.; Sarneel, J.M.; Svavarsdóttir, K. Ecological Restoration as a Means of Managing Inland Flood Hazards. BioScience 2018, 68, 89–99. [Google Scholar] [CrossRef]
  60. Teklay, A.; Dile, Y.T.; Setegn, S.G.; Demissie, S.S.; Asfaw, D.H. Evaluation of static and dynamic land use data for watershed hydrologic process simulation: A case study in Gummara watershed, Ethiopia. Catena 2019, 172, 65–75. [Google Scholar] [CrossRef]
  61. Ilalie, M.K.B.; Rugendabanga, C.C.; Barhadosanya, C.L.; Buzera, C.K.; Tamba, C.F. Landslide susceptibility assessment by mapping and diachronic analysis: Case of Bushwira (Democratic Republic of Congo). Quat. Sci. Adv. 2023, 10, 100078. [Google Scholar] [CrossRef]
  62. Meng, M.; Dąbrowski, M.; Tai, Y.; Stead, D.; Chan, F. Collaborative spatial planning in the face of flood risk in delta cities: A policy framing perspective. Environ. Sci. Policy 2019, 96, 95–104. [Google Scholar] [CrossRef]
  63. Li, B.V.; Jenkins, C.N.; Xu, W. Strategic protection of landslide vulnerable mountains for biodiversity conservation under land-cover and climate change impacts. Proc. Natl. Acad. Sci. USA 2022, 119, e2113416118. [Google Scholar] [CrossRef]
  64. Yalcin, A.; Reis, S.; Aydinoglu, A.C.; Yomralioglu, T. A GIS-based comparative study of frequency ratio, analytical hierarchy process, bivariate statistics and logistics regression methods for landslide susceptibility mapping in Trabzon, NE Turkey. Catena 2011, 85, 274–287. [Google Scholar] [CrossRef]
  65. Reichenbach, P.; Rossi, M.; Malamud, B.D.; Mihir, M.; Guzzetti, F. A review of statistically-based landslide susceptibility models. Earth-Sci. Rev. 2018, 180, 60–91. [Google Scholar] [CrossRef]
  66. Broeckx, J.; Vanmaercke, M.; Duchateau, R.; Poesen, J. A data-based landslide susceptibility map of Africa. Earth-Sci. Rev. 2018, 185, 102–121. [Google Scholar] [CrossRef]
  67. Pourghasemi, H.R.; Rahmati, O. Prediction of the landslide susceptibility: Which algorithm, which precision? Catena 2018, 162, 177–192. [Google Scholar] [CrossRef]
Figure 1. Study area and distribution of landslide level from ground check analysis.
Sustainability 17 04227 g001
Figure 2. Research framework and scenarios based on BAU, RSP, and LC.
Sustainability 17 04227 g002
Figure 3. Land use maps in sequence, based on (a) 2017, (b) 2019, (c) 2021, (d) 2022 baseline data.
Sustainability 17 04227 g003
Figure 4. Land use scenarios in sequence (a) BAU 2025, (b) LCC, (c) RSP, with these scenarios acting as driving factors for predicting landslide susceptibility.
Sustainability 17 04227 g004
Figure 5. Visualization of land use area differences based on BAU, LCC, and RSP scenarios.
Sustainability 17 04227 g005
Figure 6. Map of indicators of topography, environment, geology, and human engineering activity as a basis for predicting landslide susceptibility.
Sustainability 17 04227 g006aSustainability 17 04227 g006b
Figure 7. Landslide susceptibility category based on baseline, BAU, LCC, and RSP.
Sustainability 17 04227 g007
Figure 8. Landslide level based on area in each scenario.
Sustainability 17 04227 g008
Figure 9. Revegetation priority map to combat landslide risks in study area.
Sustainability 17 04227 g009
Table 1. Key indicators contributing to landslides.
Factor AffectingClassClassification StandardsReferences
Elevation (m)111. <340; 2. 340–543; 3. 543–690; 4. 690–832; 5. 832–951; 6. 951–1053; 7. 1053–1144; 8. 1144–1302; 9. 1302–1556; 10. 1556–1654; 11. >1654[33]
RDLS (m)71. <20; 2. 20–30; 3. 30–40; 4. 40–50; 5. 50–80; 6. 80–120; 7. >120[34]
Slope (°)91. <5; 2. 5–10; 3. 10–15; 4. 15–20; 5. 20–25; 6. 25–30; 7. 30–35; 8. 35–40; 9. >40[35]
Aspect91. Flat; 2. North; 3. Northeast; 4. East; 5. Southeast; 6. South; 7. Southwest; 8. West; 9. Northwest[36]
Curvature61. <−1; 2. −1 to −0.5; 3. −0.5 to 0; 4. 0–0.5; 5. 0.5–1; 6. >1[4,14]
Profile Curvature61. <−1: 2. −1 to −0.5; 3. −0.5 to 0; 4. 0–0.5; 5. 0.5–1; 6. >1[4,14]
Plan Curvature61. <−1; 2. −1 to −0.5; 3. −0.5 to 0; 4. 0–0.5; 5. 0.5–1; 6. >1[4,14]
Slope Position61. Ridge; 2. Upper Slope; 3. Middle Slope; 4. Flats and Slope; 5. Lower Slope; 6. Valleys[37]
Micro-Landform101. Canyons, Deeply Incised Streams; 2. Mid-slope Drainages, Shallow Valleys; 3. Upland Drainages, Headwaters; 4. U-shaped Valleys; 5. Plains; 6. Open Slopes; 7. Upper Slopes, Mesas; 8. Local Ridges, Hills in Valleys; 9. Mid-slope ridges, Small Hills in Plains; 10. Mountain Tops, High Narrow Ridges[38]
TWI51. <4; 2. 4–6; 3. 6–8; 4. 8–10; 5. >10[38]
TRI51. <10.5; 2. 1. 05–1.1; 3. 1.1–1.15; 4. 1.15–1.2; 5. >1.2[39]
STI61. <20; 2. 20–40; 3. 40–70; 4. 70–100; 5. 100–200; 6. >200[40]
SPI71. <15; 2. 15–30; 3. 30–45; 4. 45–60; 5. 60–100; 6. 100–1000; 7. >1000[41]
Distance From Faults (m)71. <500; 2. 500–1000; 3. 1000–1500; 4. 1500–2000; 5. 2000–2500; 6. 2500–3000; 7. >3000[42]
Lithology61. Intrusive: intermediate; 2. Extrusive: intermediate: pyroclastic; 3. Extrusive: intermediate: polymict; 4. Extrusive: intermediate: lava[43]
CRDS71. Dip—Slope I; 2. Dip—Slope II; 3. Outward Slope; 4. Oblique Slope; 5. Tangential Slope; Reverse Slope; 7. Flat[37]
Distance From Rivers (m)71. < 100; 2. 100–200; 3. 200–300; 4. 300–400; 5. 400–500; 6. 500–600; 7. >600[44]
NDVI61. < 0; 2. < 0.10; 3. 0.10–0.15; 4. 0.15–0.20; 5. 0.20–0.25; 6. >0.25[44]
Land Cover81. Woodland; 2. Grassland; 3. Arable Land; 4. Garden Plot; 5. Residential Land; 6. Transportation; 7. Industrial and Mining Storage Land; 8. Land for Waters and Water Conservancy Facilities; 9. Others[36]
Annual Average Rainfall (mm)71. <115; 2. 1157–1202; 3. 1202–1244; 4. 1244–1286; 5. 1286–1329; 6. 1329–1376; 7. >1376[41]
Distance From Roads (m)71. <100; 2. 100–200; 3. 200–300; 4. 300–400; 5. 400–500; 6. 500–600; 7. >600[41]
POI Kernel Density61. 0–0.5; 2. 0.5–1; 3. 1–2; 4. 2–3; 5. 3–10; 6. >10[41]
Table 2. Land use management 2017–2022.
No.Land Use Management2017201920212022
1Mahogany Coffee Agroforestry3.93.921.68.7
2Mahogany Talas Agroforestry1.41.21.21.2
3Multistrata Agroforestry10379.359.759.9
4Orange Pine Agroforestry2928.929.329.3
5Coffee Pine Agroforestry736701.9651.3651.3
6Vegetable Pine Agroforestry82.682.683.183.8
7Simple Agroforestry2.42.42.92.9
8Natural Forest12,841.311,349.710,518.39351.2
9Artificial Forest33.231.37.67.1
10Production Forest8636.77742.64283.23978.8
11Built-up Area3525.54239.54553.254976.7
12Garden3643.25980.77841.78678.0
13Empty Land149.5107.3110.6109.4
14Meadow206.4165.4185.0184.7
15Rice Field954.0975.21017.71547.8
16Shrubs978.71160.01494.61500.8
17Moor867.3795197429434
18Body of Water305.6307307304
Total40,910.0540,910.0540,910.0540,910.05
Disclaimer/Publisher’s Note: The statements, opinions and data contained in all publications are solely those of the individual author(s) and contributor(s) and not of MDPI and/or the editor(s). MDPI and/or the editor(s) disclaim responsibility for any injury to people or property resulting from any ideas, methods, instructions or products referred to in the content.

