3. Materials and Methods
3.1. Data Sources
This research utilizes a combination of official statistical data and forecast inputs. We gathered regional demographic data and education infrastructure indicators for Kazakhstan covering the period 2000–2020. The key data sources include the Bureau of National Statistics [
52], the Information-Analytical System “Taldau” [
53], the Ministry of Education of the Republic of Kazakhstan [
54], and the National Platform for Reporting on Sustainable Development Goals (SDGs) [
55].
To forecast future trends, we incorporated birth rate projections through 2050, provided by the Ministry of Labour and Social Protection [
56], which reflect expected fertility patterns based on the recent trends and government support measures. All data were collected at the regional level and compiled into a unified database. The analysis in this study is based solely on aggregated regional data and does not include any personally identifiable information; therefore, no additional ethical approval was required.
To assess future demand for educational placements, we developed a cohort-component forecasting model specifically adapted to enrollment in preschool and primary school. The core of this approach is a method we refer to as the “cohort difference concept”.
3.2. Preschool Enrollment
We compare the size of the cohort of children turning two years old in a given year (the standard age for preschool entry) with the cohort of five-year-olds (those leaving the system or transitioning to senior groups) in the same year. In Kazakhstan, children are eligible to attend public kindergarten starting at age two. While preschool education is not mandatory, demand for places from this age onward is consistently high. One key driver of this pattern is the structure of social benefits: state-provided childcare allowances typically end at 1.5 years, prompting many mothers to return to the workforce. For most families, public kindergartens represent a significantly more affordable childcare option compared to hiring a private nanny. As a result, two-year-olds are frequently enrolled in kindergartens, and early registration—sometimes from birth—is widely practiced. This behavioral context justifies the inclusion of two-year-old cohorts in our forecasting model. If the incoming cohort of two-year-olds exceeds the outgoing cohort of five-year-olds, this indicates that the existing preschool capacity—assumed to be 100% in the baseline scenario—may be insufficient to accommodate all new entrants. The forecasting model assumes full utilization (100%) of existing preschool and school capacity. While actual occupancy rates may vary by region or institution, the lack of publicly available, disaggregated data on real-time capacity utilization necessitates this simplifying assumption. This baseline scenario allows for the identification of relative shortages across regions and over time. This “capacity gap” reflects a potential shortage of places in preschool institutions that needs to be addressed.
3.3. Primary School Enrollment (Grade 1)
A similar approach is applied to primary school enrollment. Here, we compare the number of children turning six years old (the standard school starting age) with the number of nine-year-olds (who complete the primary education cycle by the end of Grade 4). If the cohort of six-year-olds exceeds the cohort of nine-year-olds leaving the system, and no additional resources are allocated, a shortage of first-grade placements is likely to emerge in the near future.
By repeating such cohort comparisons for each region and each forecast year, the model captures the natural “aging through” of population groups and identifies where the education system may become overburdened due to new entrants. This simplified, rule-based approach accounts for the momentum of previously high birth rates that are gradually reaching preschool and school age.
Moreover, the model is easily interpretable by local decision-makers: it effectively functions as an early warning system for infrastructure-related challenges, based on the principle that a growing number of toddlers and young children will soon translate into increased demand for classrooms and educational facilities.
3.4. Teacher Demand Estimation
In parallel with forecasting the shortage of educational places, we translated the projected “excess enrollment” into an estimate of additional teaching staff required. To do this, we relied on Kazakhstan’s national standards for the student–teacher ratio to ensure that our projections align with existing regulations [
57].
According to the current standard, preschools require one teacher for every 20 children. Therefore, if a given region is expected to have X children exceeding the current preschool capacity, approximately X/20 additional preschool teachers would be needed (rounded to the nearest full-time equivalent).
For primary schools, we used the norm of one teacher per 25 students, which is typical for lower grades. Thus, a projected “excess enrollment” of Y first-grade students would imply a need for approximately Y/25 new primary school teachers. While this method is relatively simplified, it provides a clear and practical estimate for planning purposes. It is also consistent with how teaching workloads are typically calculated within educational institutions. Moreover, classroom shortages are often accompanied by staffing shortages, so translating enrollment projections into human resource needs is a logical and policy-relevant step.
3.5. Regression Analysis
In addition to the cohort analysis, we applied an econometric approach that accounts for other factors influencing the demand for education, particularly internal migration and existing infrastructure. A simple linear regression model was constructed, where the dependent variable was the projected shortage of places in a given region (for preschool or primary school), as calculated using the cohort-based method.
The model included three main predictors: the number of children born in the region over the past three years (serving as an indicator of “demographic momentum”), net internal migration, and the current supply of educational institutions in the region, expressed as the number of preschools or schools per 1000 children (as a proxy for existing infrastructure and network density).
Thus, the regression reveals how each factor contributes to the potential shortage, adjusting the “purely demographic” estimate produced by the cohort method. A region with high birth rates generally demonstrates a higher likelihood of shortage, all else being equal, while a region with a higher density of institutions per capita may partially offset the deficit. Taking migration into account is particularly important: in areas experiencing significant population inflows, the model captures the additional burden on schools that goes beyond the “local” birth rate trends.
The results showed that all three factors made a statistically significant contribution to the variance in projected demand. Moreover, the regression coefficients indicate that the impact of internal migration is, in some cases, comparable to that of natural population growth. This means that the influx of young families can exert pressure on the education system nearly as strongly as a local “baby boom”, particularly in rapidly growing urban areas.
Overall, these findings are consistent with the broader academic literature, which emphasizes the importance of both demographic and socio-economic drivers in shaping educational demand and infrastructure outcomes [
2,
14,
41,
42,
43,
44,
45]. We used the results of the regression model to refine the cohort-based forecasts: if a region exhibits atypical migration dynamics or infrastructure levels, the final estimate of shortage is adjusted upward or downward accordingly.
Although the approach is relatively simple, it adds an additional layer of “realism” to the forecasts by incorporating key variables. We acknowledge that the model does not capture all possible nuances—such as annual fluctuations in birth rates or changes in education policy—but it provides a reliable initial estimate, especially for regions with a high demographic variability.
3.6. Spatial Analysis and Business Intelligence Tools
An important feature of the methodology is the integration of GIS maps and BI dashboards for analysis and visualization. All prepared data were imported into a GIS environment (ArcGIS 10.8), where spatial layers were created for each key indicator. We used a shapefile of Kazakhstan’s regions, verifying the consistency of statistical data (including a unified coordinate system and administrative boundaries). These layers were then merged into a geodatabase (GDB), allowing statistical attributes of each region to be linked to its geometric contour.
This solution simplified spatial queries (e.g., identifying regions where the projected shortage exceeds a given threshold) and facilitated the creation of thematic maps. The GIS maps clearly highlight “hotspot” regions of potential shortages in preschool facilities.
In parallel, we used Microsoft Power BI for interactive data visualization. Dynamic dashboards were developed to enable simultaneous analysis of multiple indicators across all regions.
For instance, one dashboard component displays historical birth rate trends alongside forecasts, comparing them with the current preschool capacity for each region; another component presents a map of projected shortages, overlaid on Bing Maps within Power BI. This allows users (e.g., government agencies) to filter data by year or region and instantly observe changes in key indicators, significantly facilitating the interpretation of results.
The combined use of BI and GIS ensures both analytical power and visual clarity. Power BI provides a convenient platform for comparing indicators across regions, while ArcGIS offers a clear spatial representation of problem areas.
This approach reflects current business analytics practices in the public sector, where “data-driven governance” is becoming a policy priority.
4. Results
4.1. Regional Demographic Trends and Inequality
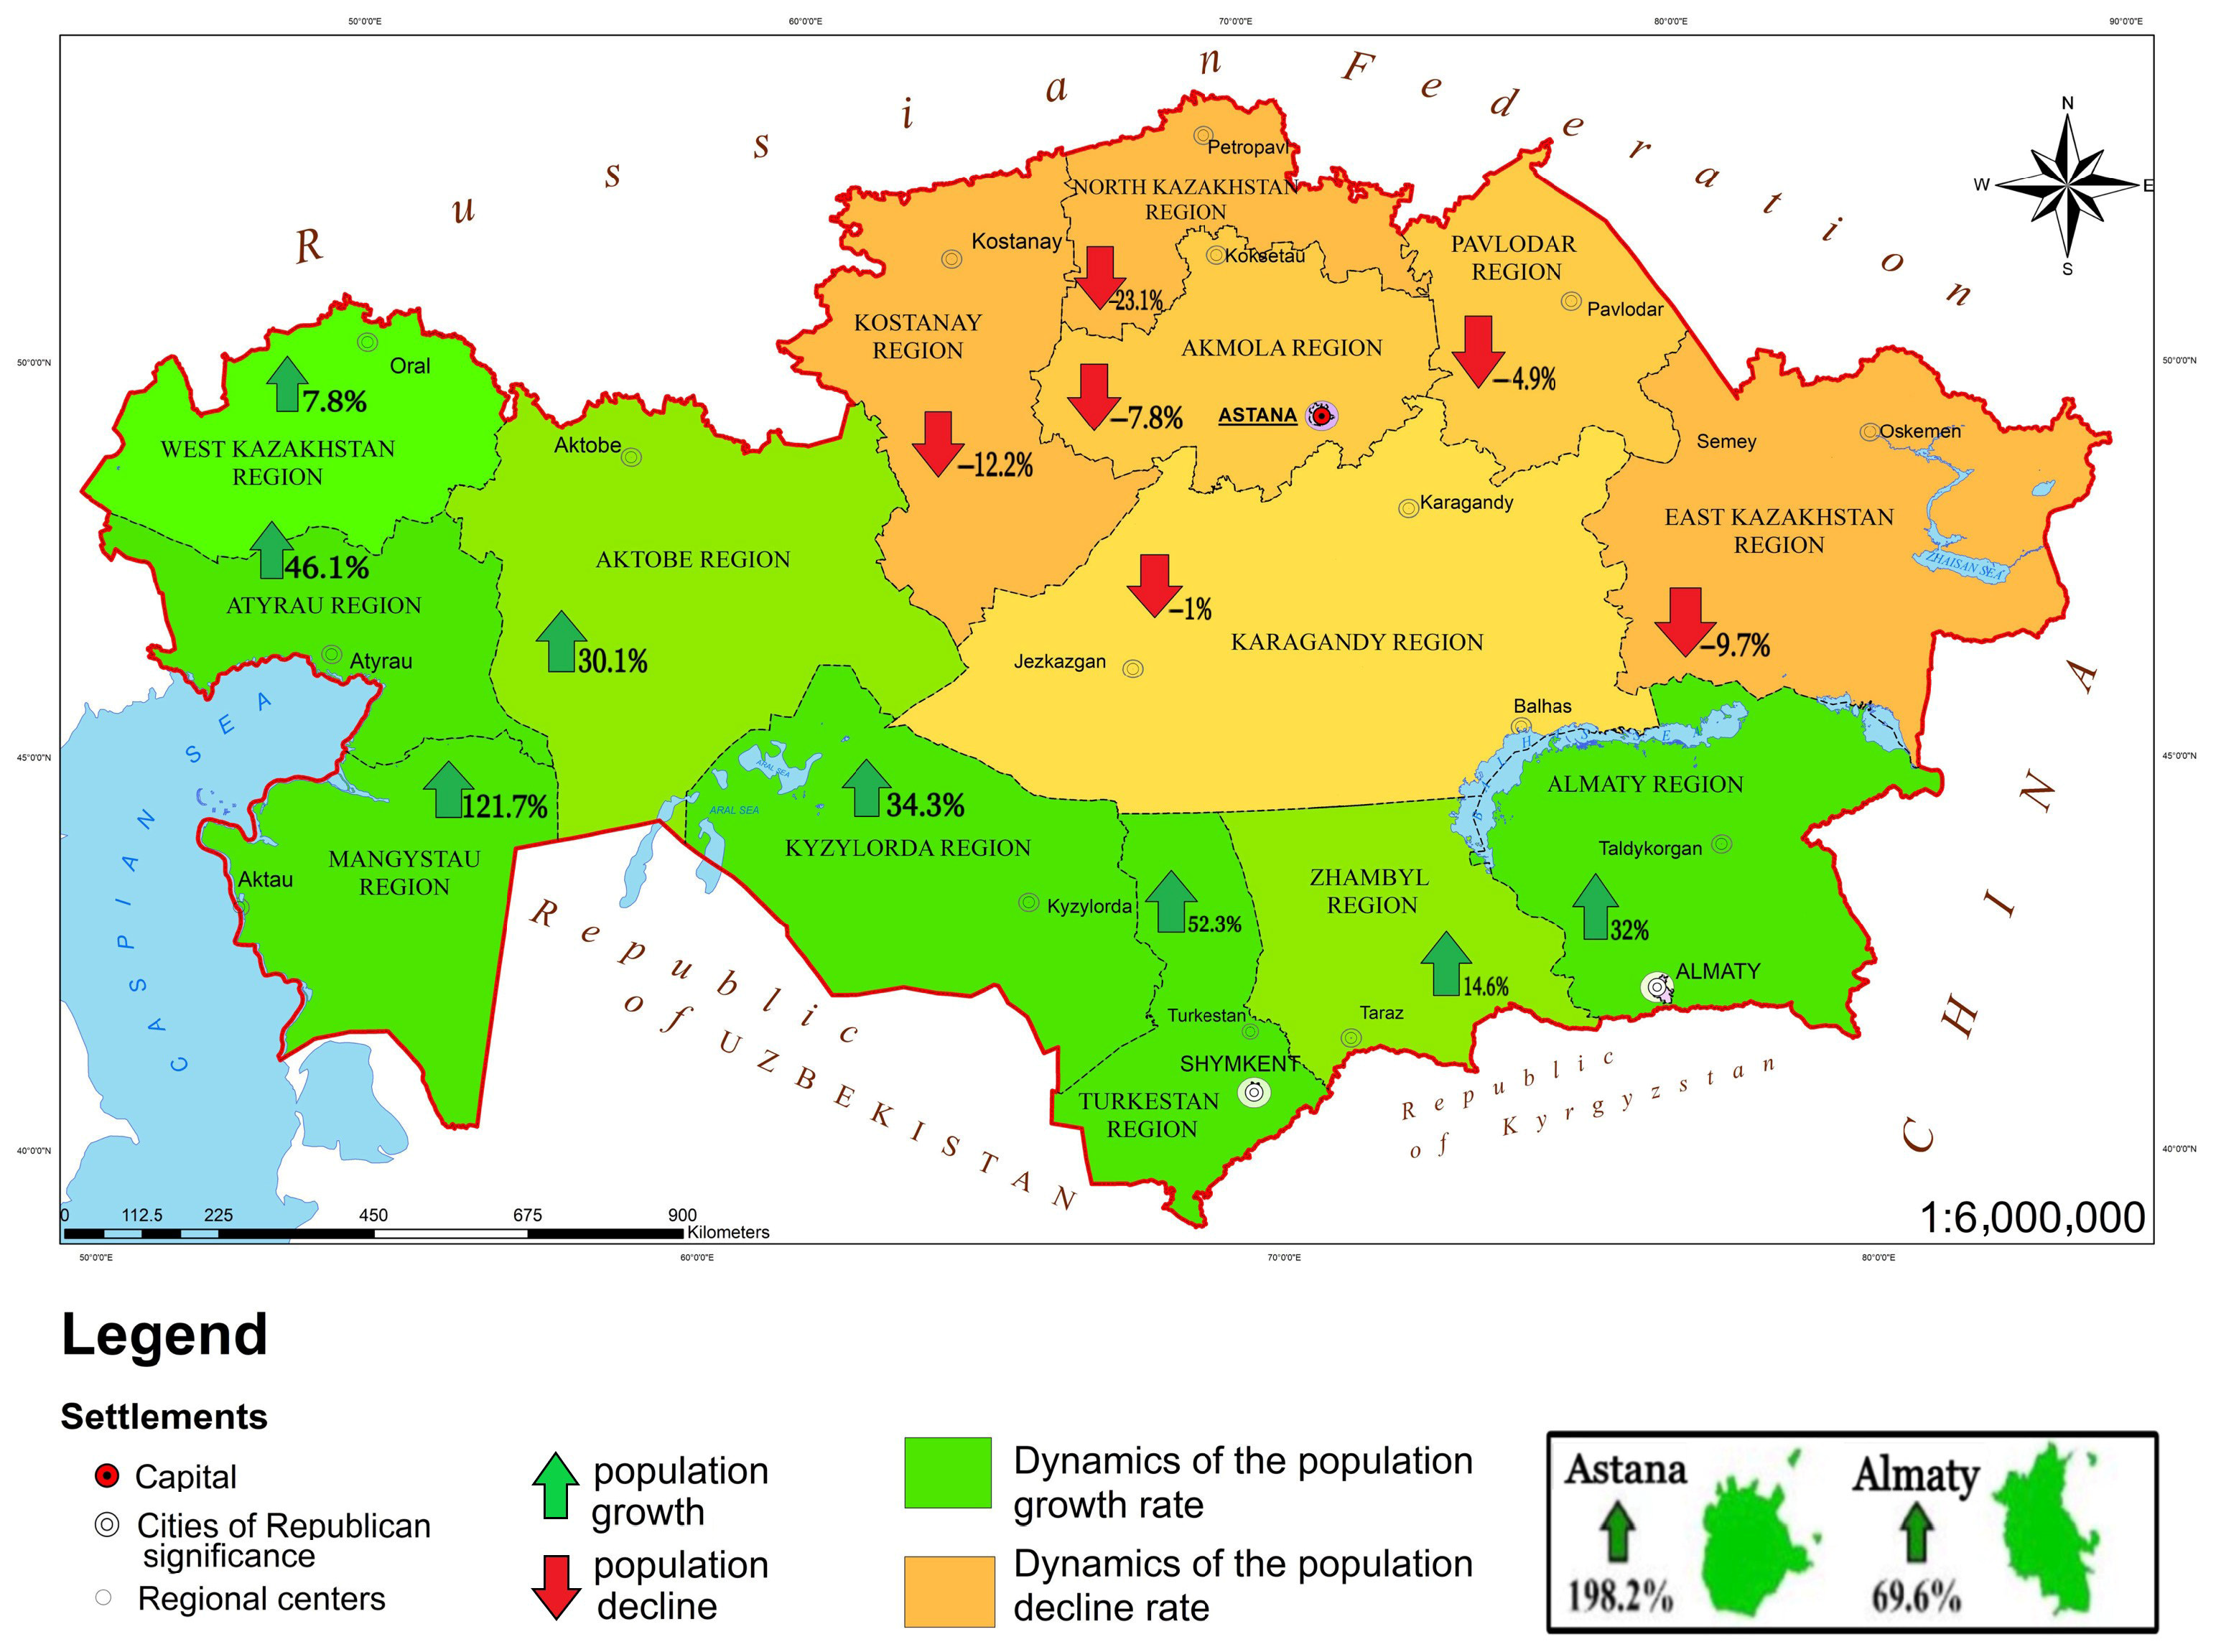
Analysis of historical data (2000–2020) confirms that the dynamics of demographic growth across the regions of Kazakhstan exhibit a “polarized” pattern. The southern and western regions—particularly Turkestan, Zhambyl, Mangystau, and Atyrau—demonstrate consistently high birth rates, leading to a continuous increase in the number of young children (
Figure 1) [
52].
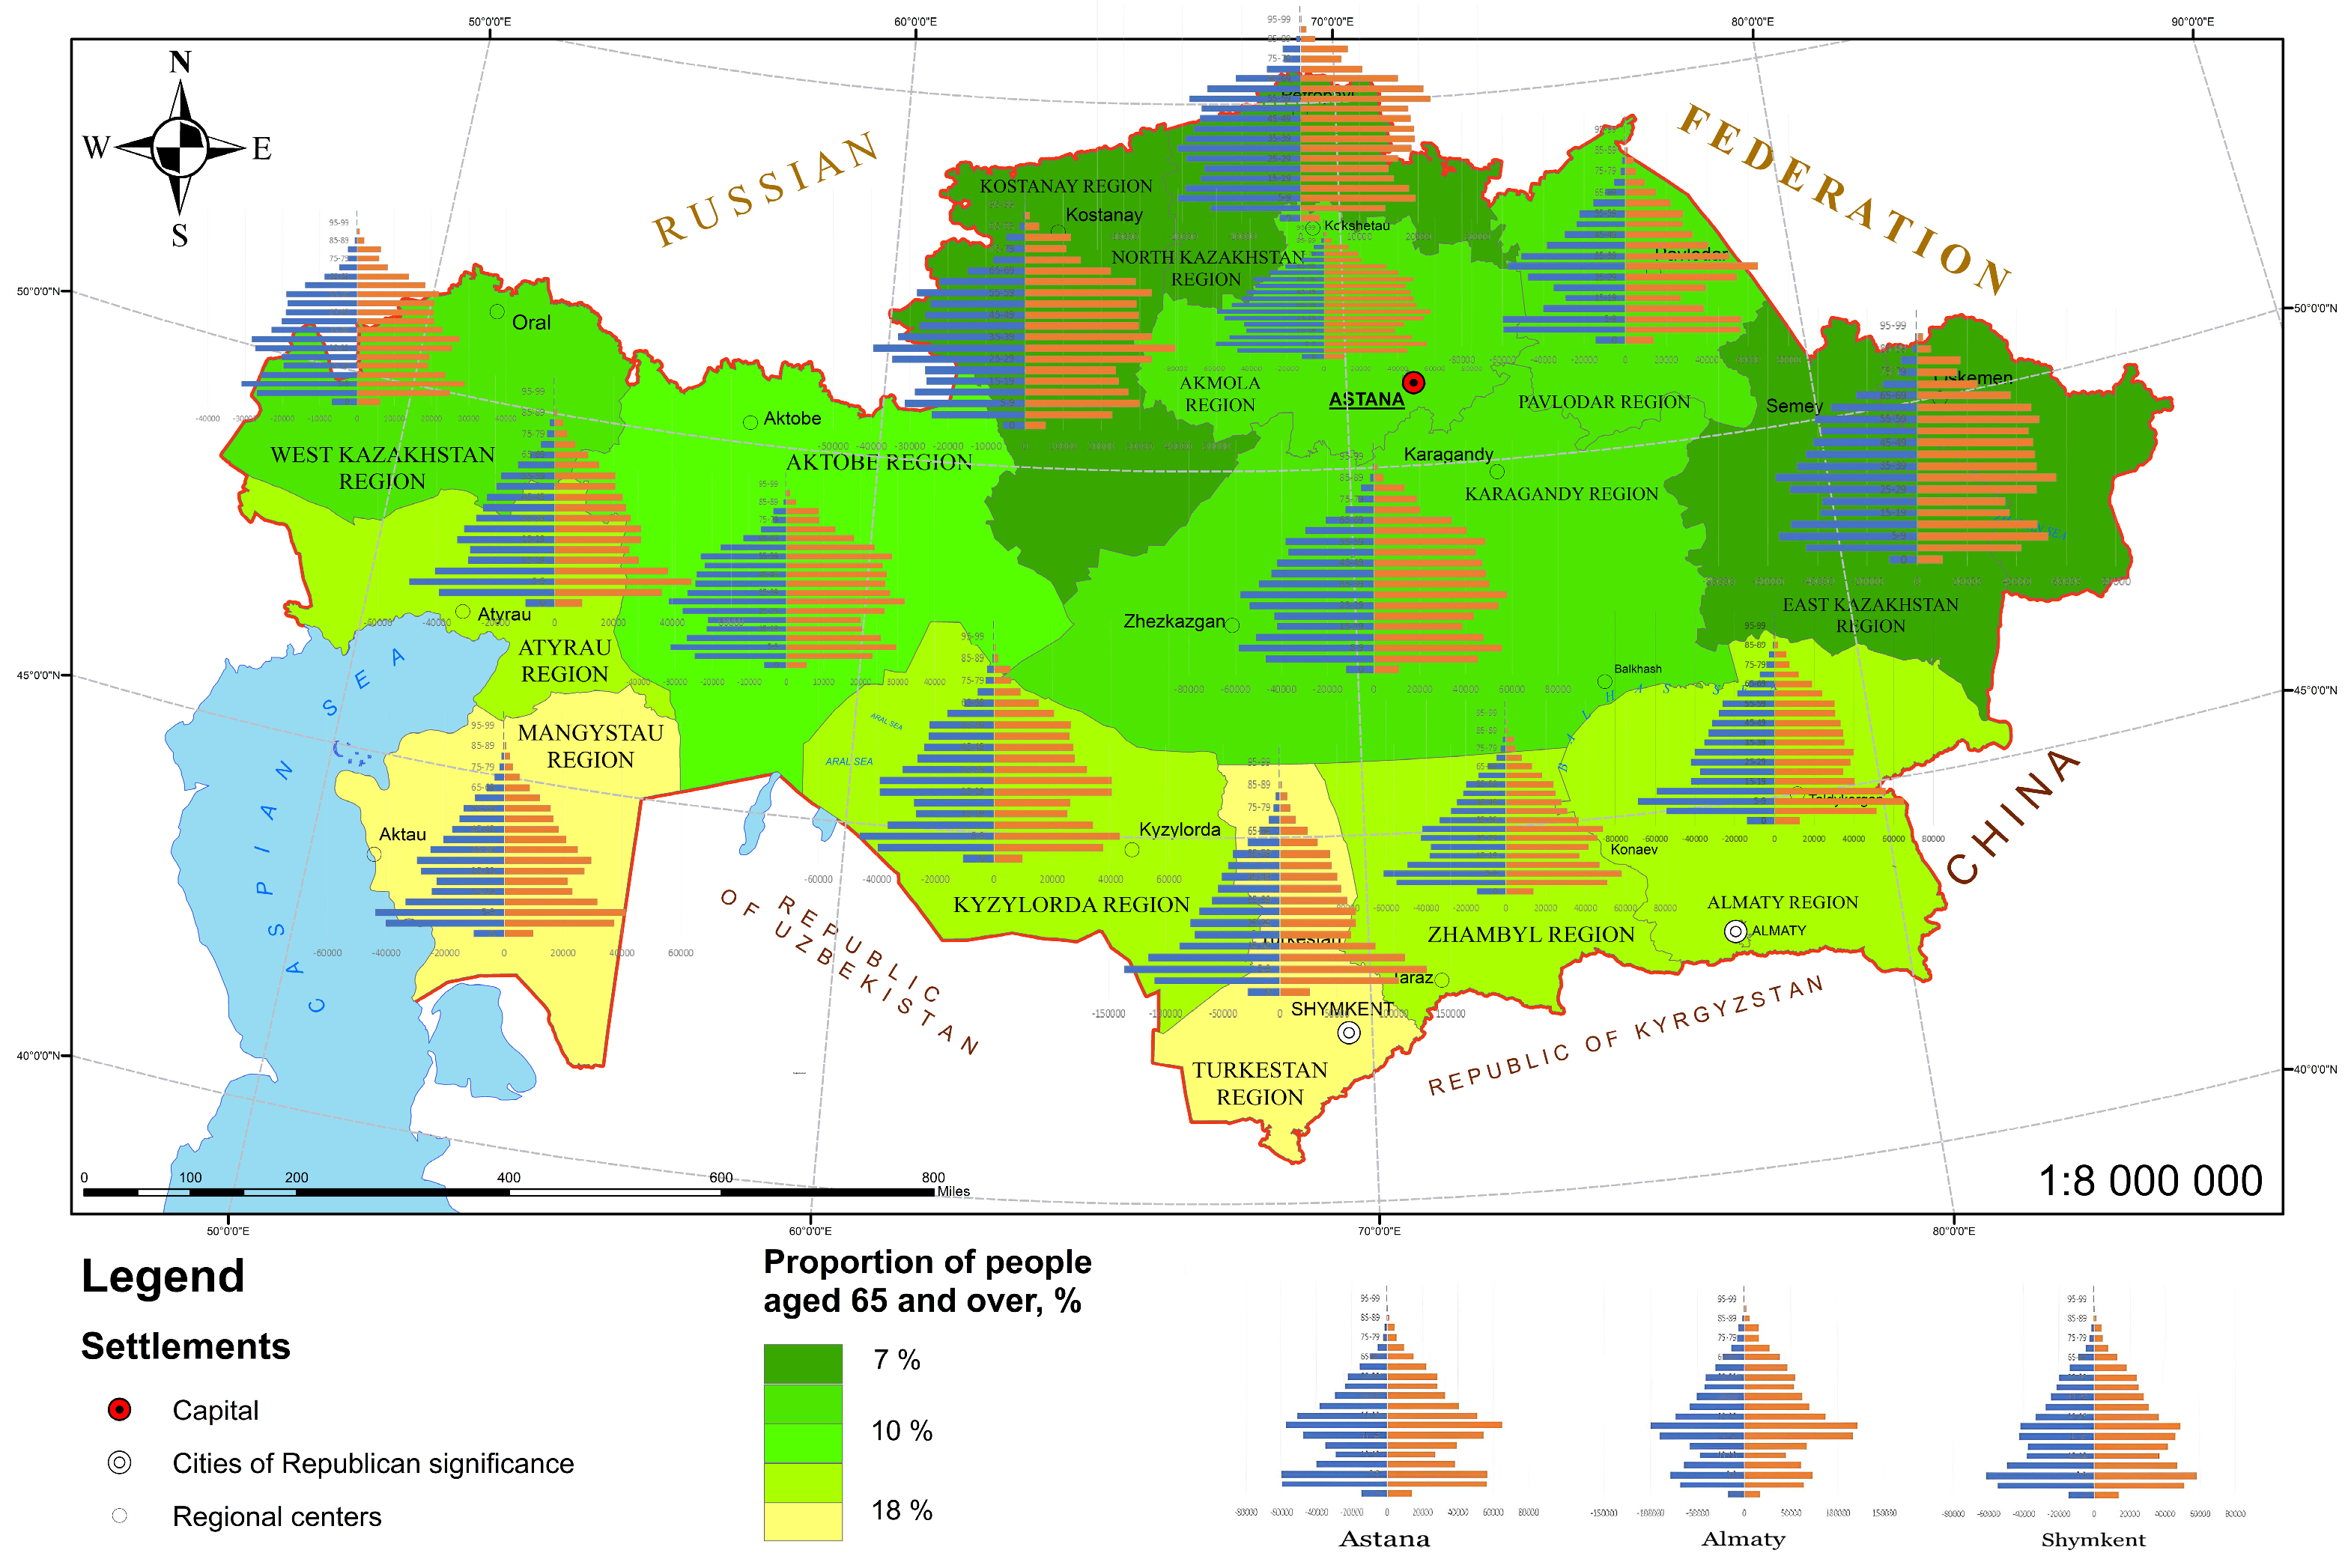
For example, in the Turkestan region, the annual number of newborns remained consistently high throughout the 2010s, allowing the region to retain its status as one of the “youngest” in terms of median age. In contrast, several northern and eastern regions—such as Kostanay, North Kazakhstan, and East Kazakhstan—exhibit low or stagnant birth rates (
Figure 2) [
52].
These regions are characterized by an aging population structure and, importantly, the outmigration of young people to major cities or more economically dynamic areas. The combination of lower fertility and youth migration has resulted in minimal growth—or even a decline—in the number of school-age children in the northern and eastern parts of the country. The geographic contrast is striking: our statistical tests (e.g., t-tests comparing regions with high and low growth rates) reveal a significant difference in average natural population increase (p < 0.01) between the two groups.
This situation is further exacerbated by internal migration flows. Southern cities such as Almaty and Shymkent, as well as western oil-producing centers like Aktobe and Atyrau, attract many young families from other parts of Kazakhstan, leading to local population growth that exceeds projections based solely on natural increase. This trend aligns with findings from other researchers who have noted the “centripetal” migration toward Kazakhstan’s urban centers [
38].
Thus, by 2020, a “young” demographic zone had formed in the south and west of Kazakhstan, while a relatively “static” demographic zone emerged in the north and east. These regional contrasts have a direct impact on educational infrastructure: in areas experiencing rapid growth in the child population, there is an urgent need to expand services, whereas in regions with zero or negative growth, it may be appropriate to repurpose or optimize existing schools.
4.2. Forecast of Demand for Preschool Education
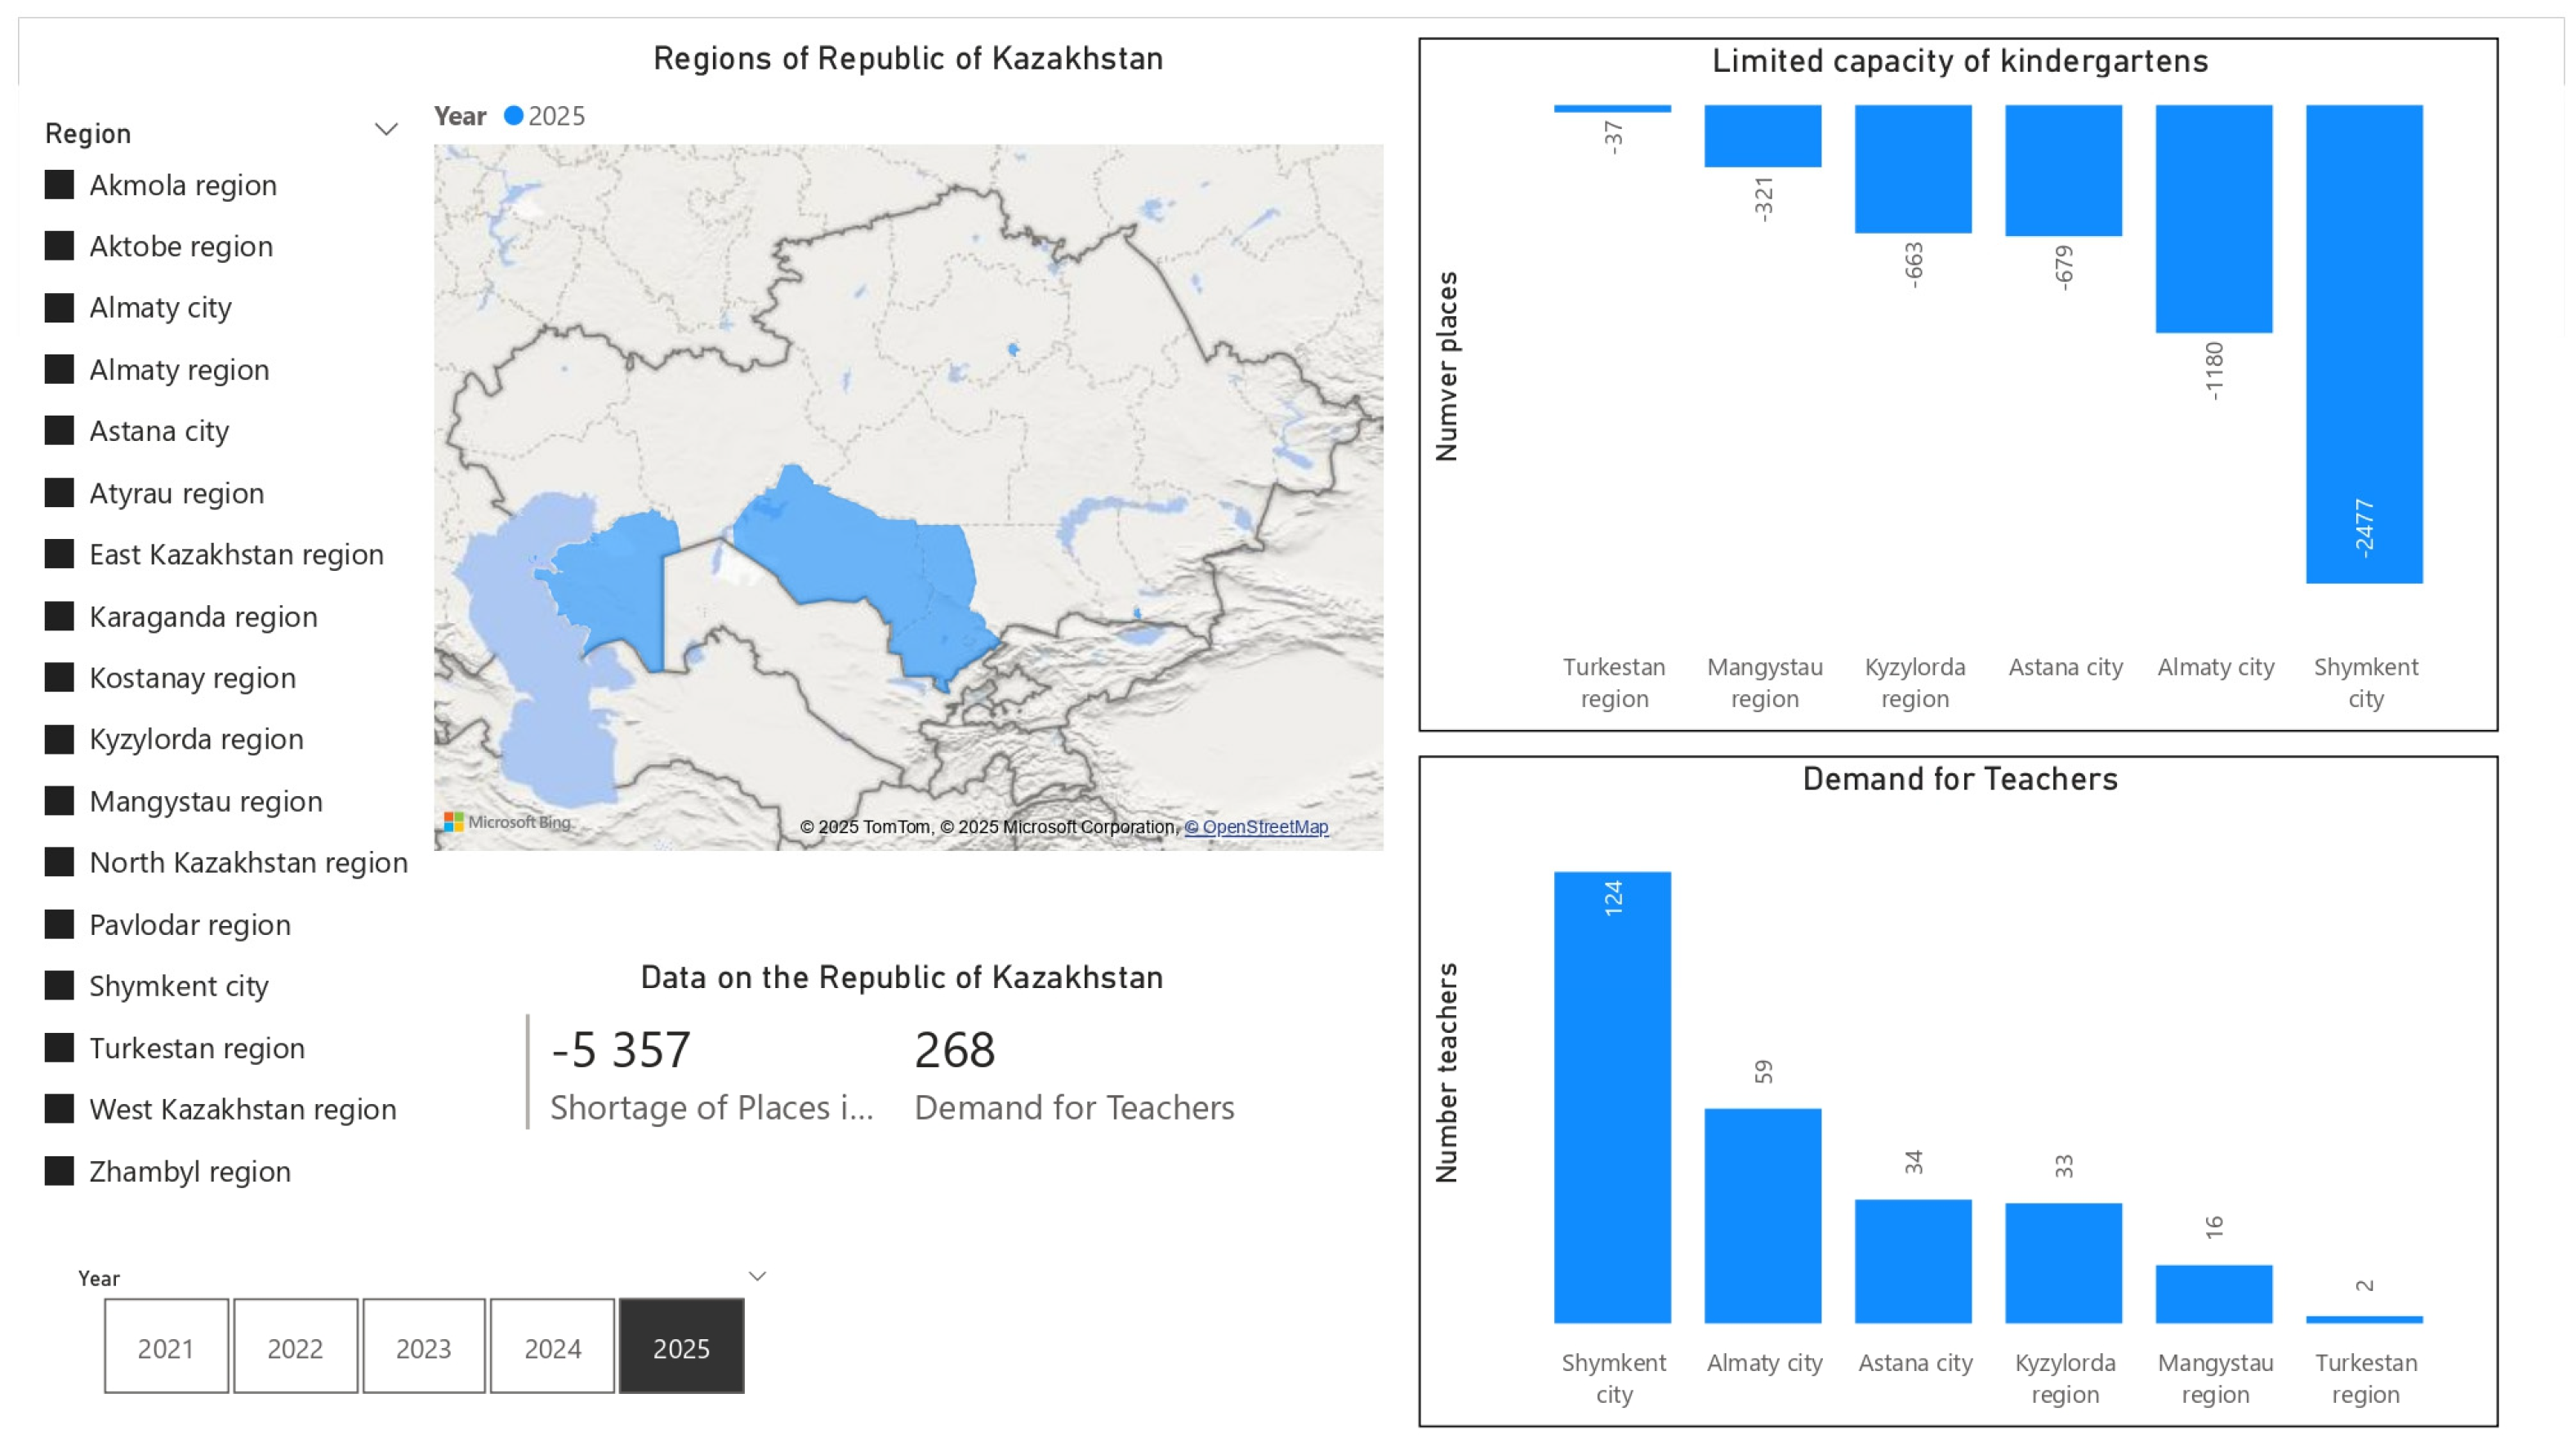
Using our cohort-based forecasting model, we estimated the projected shortage of preschool places over the long term (the next 5–7 years) for each region. The results indicate that, without targeted interventions, the shortage will become most acute in urbanized and rapidly growing centers in the south and west. Specifically, the cities of Almaty and Shymkent, as well as the Mangystau and Atyrau regions, are projected to face the most significant deficits in preschool capacity. Our model suggests that in these regions, demand will exceed the current capacity of preschool facilities within the next 3–5 years. By 2026, the potential demand for preschool places may surpass available slots by approximately 10–15% in some districts.
This represents a substantial gap, considering that many preschools are already operating at full capacity. For example, if a city currently has 10,000 preschool slots, it may need to accommodate 11,000–11,500 children by 2026, potentially leaving up to 1500 children without access to preschool unless new facilities are constructed. These projections are clearly illustrated in our Power BI dashboard, where these “hotspot” regions are prominently highlighted (
Figure 3).
These “hotspots” correspond to areas where birth rates have been particularly high in recent years and where the construction of new preschool facilities has not kept pace with demographic growth.
A useful indicator in this context is the “preschool cohort replacement ratio”—the ratio of two-year-old children (new entrants) to five-year-olds (those leaving the preschool system) in a given year. In the Turkestan region, this ratio averages around 1.3, meaning that 30% more children are entering the system than exiting, clearly signaling upcoming capacity issues. Indeed, Turkestan ranks among the top regions in terms of urgent need for preschool network expansion.
By contrast, in the Kostanay and North Kazakhstan regions, the ratio typically does not exceed 1.0. In some years, it falls below one, indicating that fewer children are entering than leaving—possibly suggesting an excess of available places or, at the very least, no immediate shortage. These findings support the notion of a “localized” nature of preschool infrastructure challenges: fast-growing regions—often in the south and west—face shortages, while some northern areas may experience underutilization of preschool facilities due to demographic decline.
Table S1 (
Supplementary Materials) provides detailed projections of preschool place shortages by region from 2022 to 2050, while
Table S2 shows the corresponding number of additional preschool teachers required based on the standard child-to-teacher ratio.
Importantly, our analysis identified not only where the shortages are greatest but also when they are expected to peak. For example, in Mangystau region, the shortage is expected to spike between 2024 and 2026, driven by a sharp increase in births and limited infrastructure. In contrast, the city of Almaty is projected to experience a more gradual build-up, with a peak around 2027, as large preschool-age cohorts reach enrollment age.
These temporal differences suggest the need for a phased approach to infrastructure expansion: urgent support should be directed to regions facing an earlier crisis, while preparatory efforts should begin in areas where shortages are expected in the medium term.
Moreover, the data confirm that urban districts and suburban zones are particularly vulnerable. Within major agglomerations, newly developed residential areas—typically inhabited by young families—suffer most acutely from the lack of preschool facilities.
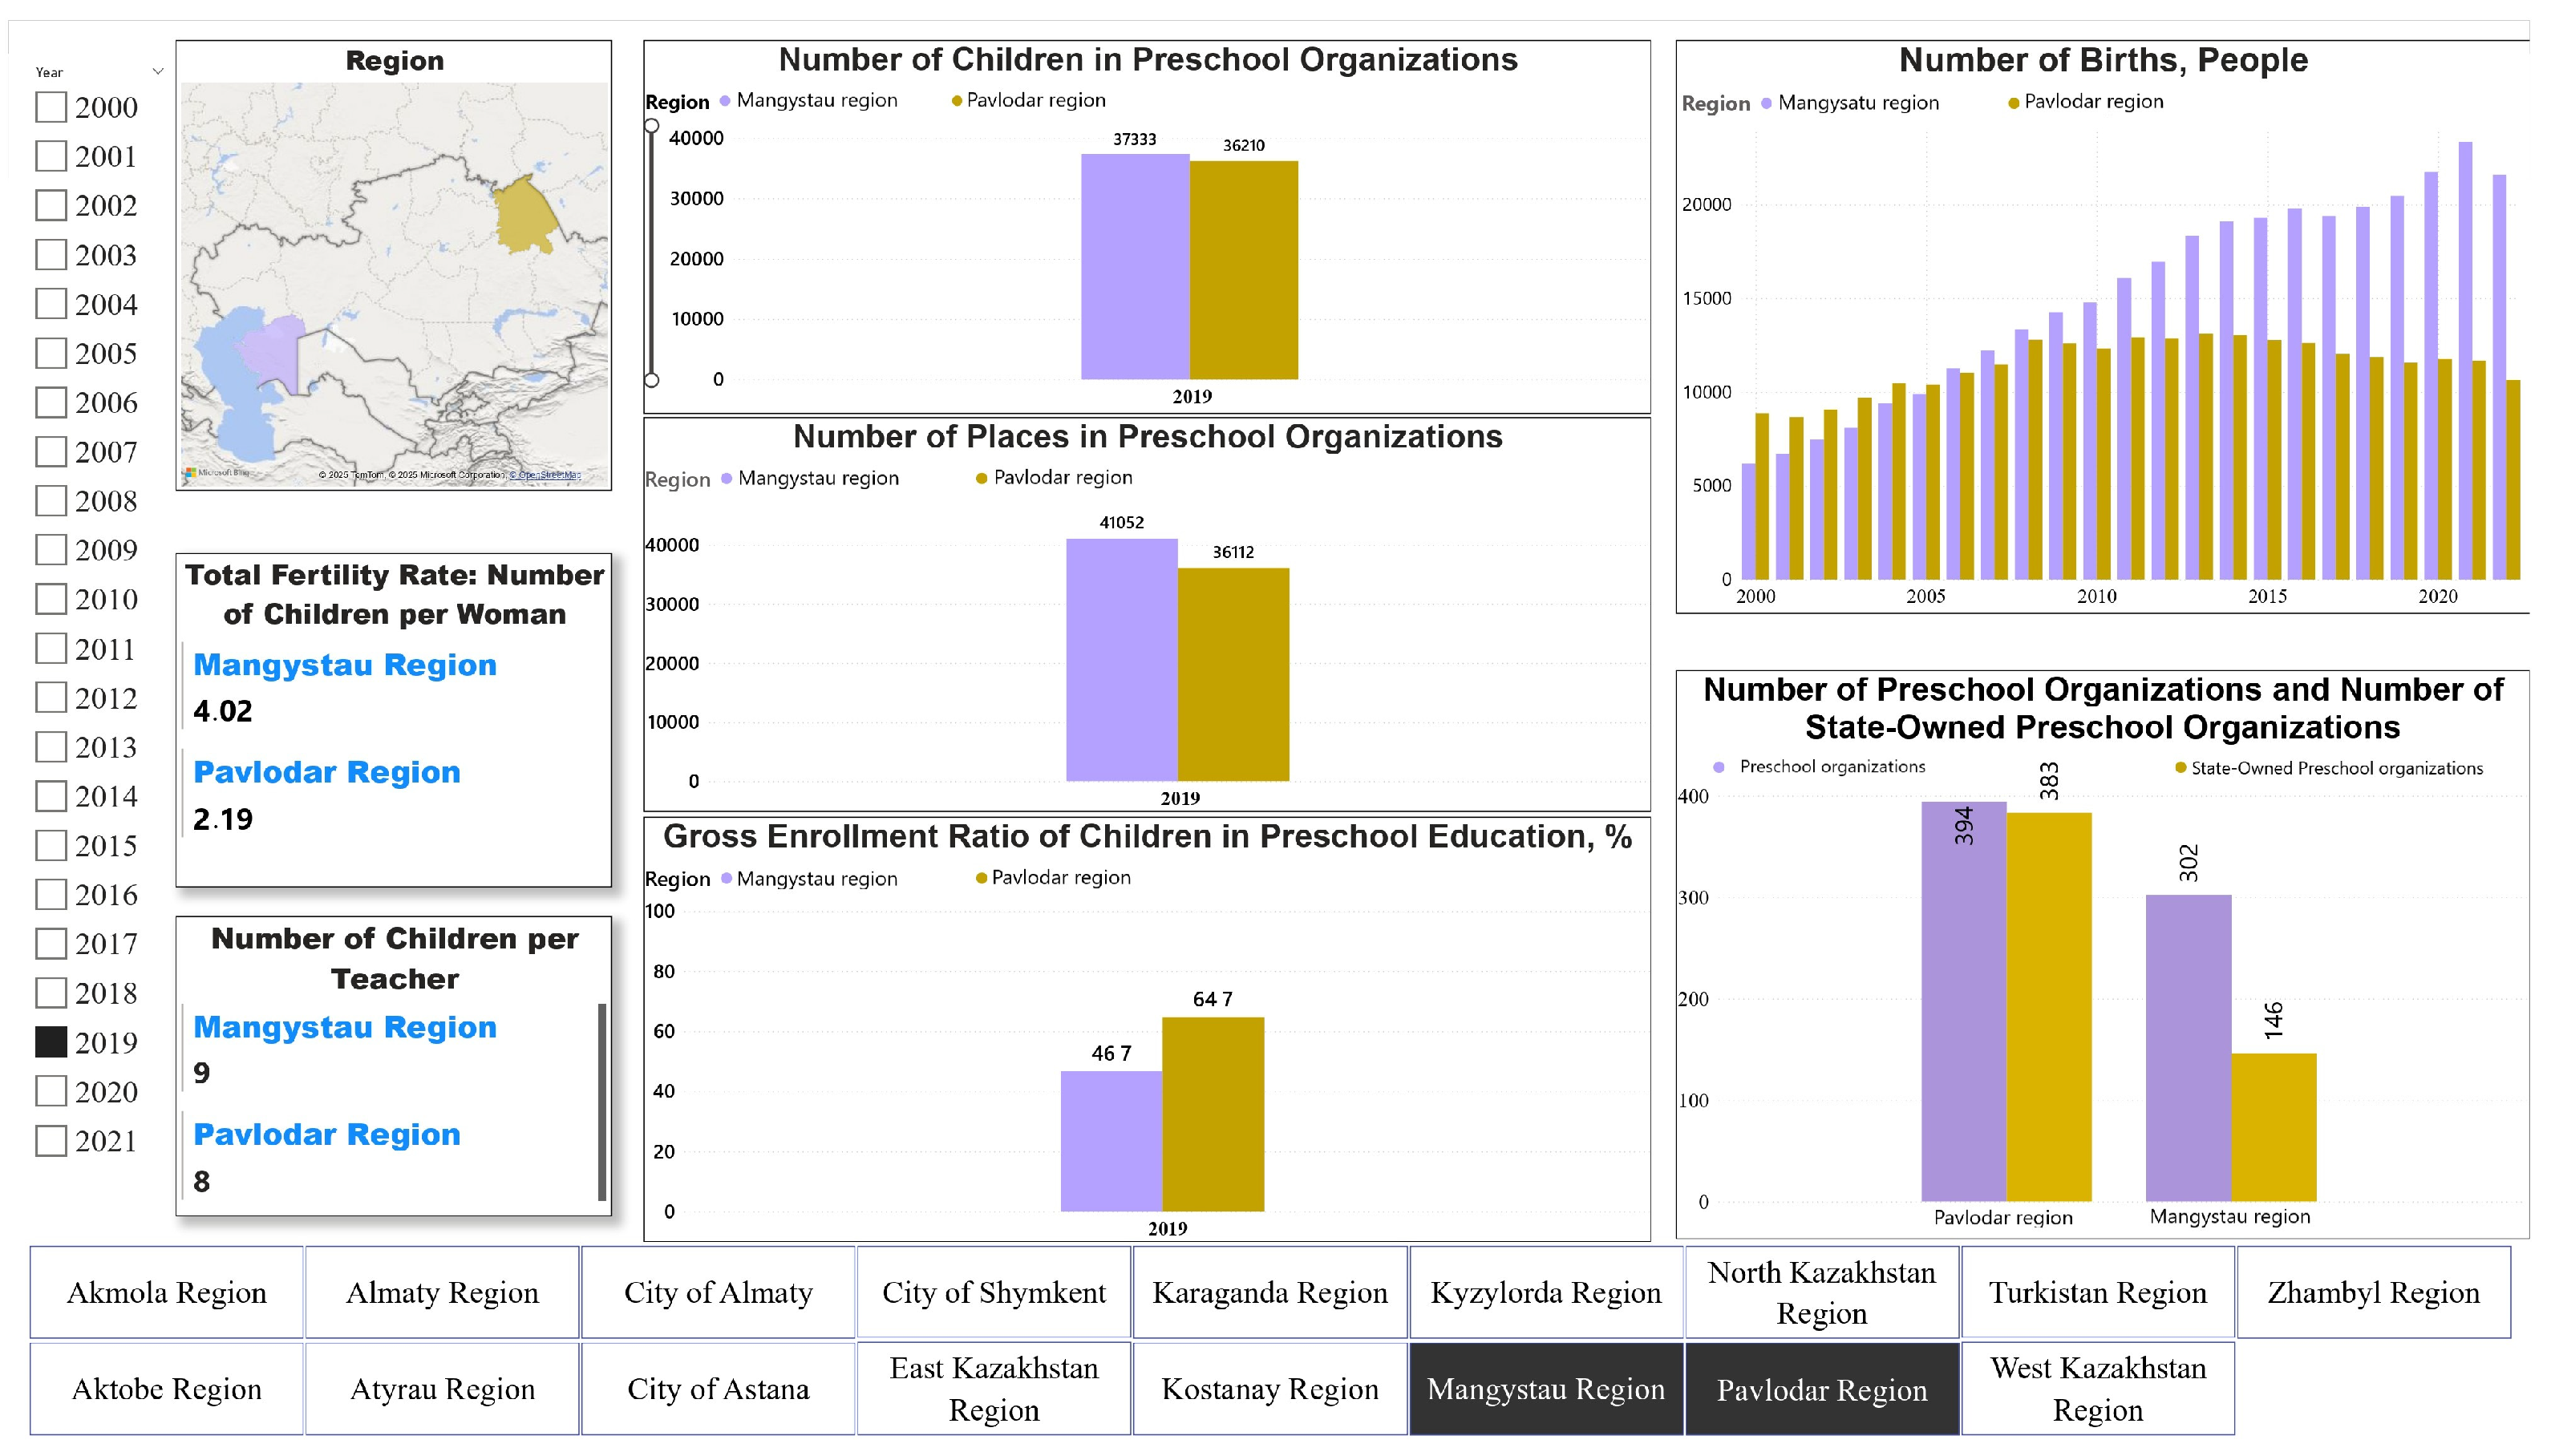
The Power BI visualization comparing Mangystau region (young population, high birth rate) with Pavlodar region (older population, lower birth rate) clearly illustrates how the regional demographic profiles correlate with preschool capacity challenges (
Figure 4).
In the Mangystau region, the charts show a steady increase in the number of births and long waiting lists for preschool institutions, whereas in Pavlodar region, birth rates are more stable and available places are generally sufficient. Such comparisons allow for cross-validation of the model against actual data reported by the Ministry of Education.
4.3. Forecast for Primary School (Grade 1)
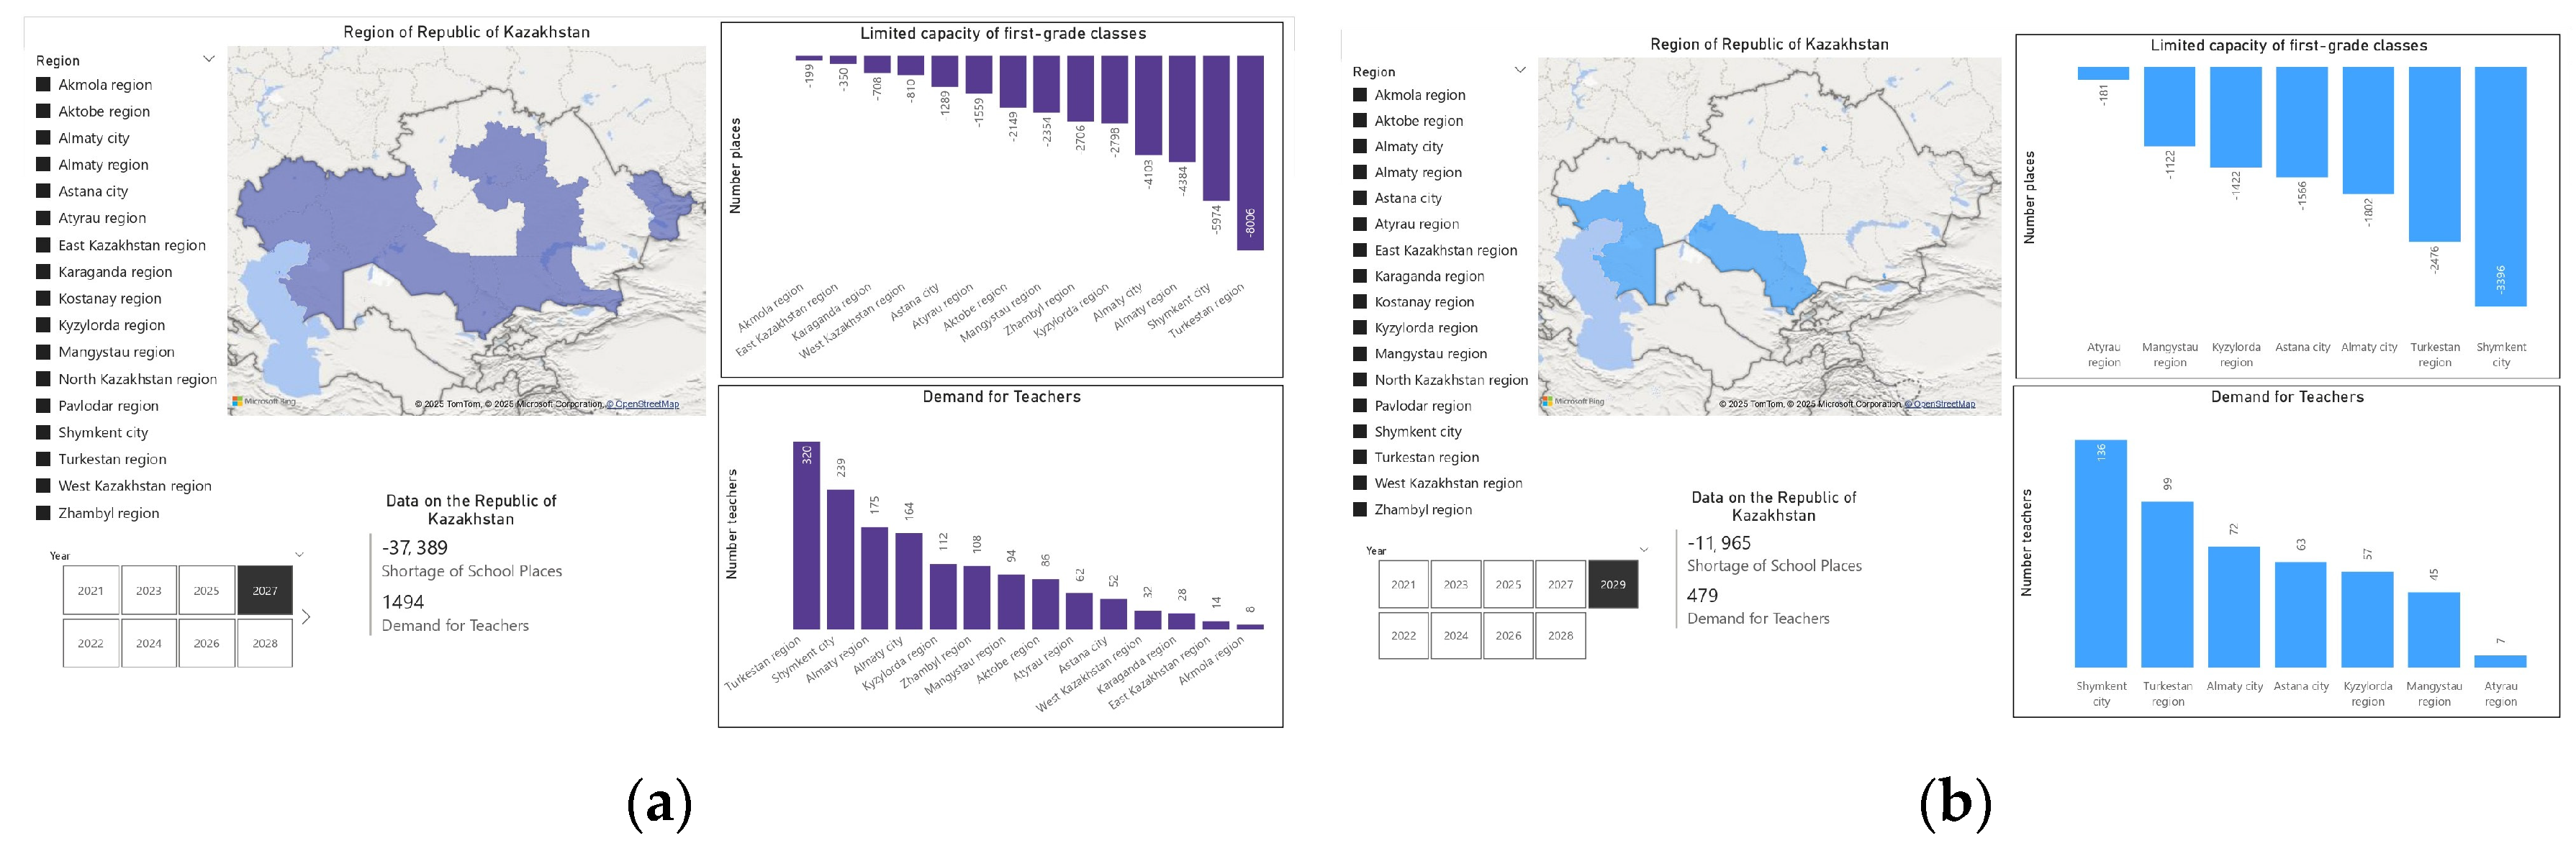
A similar pattern is observed in the primary school segment, particularly with regard to Grade 1 admissions. Regions that are already experiencing shortages in preschool capacity are facing the same issue as large preschool-age cohorts transition into primary education after a few years. Our forecast for the “Grade 1 seat deficit” between 2027 and 2030 once again identifies the same fast-growing regions—Almaty city, Shymkent city, Atyrau, Mangystau, and Turkestan regions—as those most urgently in need of expanding their primary school infrastructure.
In fact, this trend is already becoming apparent. According to the Ministry of Education, by 2027, several districts within these regions are reporting serious difficulties in placing first-grade students, forcing schools to implement additional shifts or hire teachers mid-year in response.
Our model indicates that without large-scale investment in new schools, the situation will only worsen as the current preschool-aged children reach school age. For example, by 2029, Almaty city may require around 12,000 additional Grade 1 seats—equivalent to approximately 480 new classes (assuming 25 children per class) or about 40–50 new primary schools (assuming around 10 first-grade classes per school).
Similarly, by 2029, Shymkent is projected to face a shortage of approximately 3400 first-grade places, while the Turkestan region may face a shortfall of about 2500.
These are significant figures, reflecting the cumulative effect of high birth rates that have persisted since the 2010s.
Figure 5 presents the regional distribution of the projected Grade 1 seat deficit, with panel (a) illustrating the situation in 2027 and panel (b) in 2029.
The maps reveal that the shortage is not only intensifying over time but also expanding geographically. By 2029, for example, even some “moderate birth rate” regions, such as the Almaty region (surrounding the city of Almaty), begin to experience shortages due to population inflows from the urban center. A key detail is the vulnerability of suburban zones surrounding major cities. When projected numbers of future first-grade students are overlaid on current capacity (i.e., the number of existing Grade 1 classrooms) using Power BI tools, it becomes evident that the “hotspots” are concentrated in the suburbs of Almaty, Astana, Shymkent, and Aktobe.
These areas typically consist of newly developed residential neighborhoods inhabited by many young families but lacking sufficient school infrastructure. As a result, children are forced to study in overcrowded classrooms or travel long distances in search of available places—clear evidence of a mismatch in infrastructure planning. At the same time, city centers and long-established districts often maintain stable enrollment without significant overcrowding.
Projections also indicate that western oil-producing regions (Atyrau and Mangystau) may face shortages not only in classroom space but also in housing, as continued internal migration brings an unanticipated increase in the number of school-age children.
4.4. Factors Influencing the Infrastructure Burden on the Education System
Through regression analysis, we quantitatively assessed the contribution of various factors to the projected shortage. The identified key drivers were consistent with our expectations.
4.4.1. Recent Birth Rates
The number of children born in a region over the past few years is strongly correlated with both current and future demand for preschool and first-grade placements. In regions that have experienced a localized “baby boom” (such as the Turkestan region), the resulting strain on infrastructure increases proportionally.
4.4.2. Internal Migration
A positive migration balance significantly exacerbates school overcrowding. For example, when thousands of new residents—primarily young families—relocate to a city, the resulting surge in the child population can exceed projections based solely on birth rates. Our model indicates that in several rapidly growing centers (e.g., Almaty, Astana), the impact of migration is comparable to that of natural population growth.
This finding aligns with empirical observations: in the capital, birth rates are relatively moderate, but migration-driven population growth leads to rapid school overcrowding. As noted by Z. Zhantayev et al. [
47], mapping migration flows in Kazakhstan is essential for responsive infrastructure planning.
4.4.3. Infrastructure Density
Regions with historically higher numbers of schools or preschools per capita are better equipped to handle demographic pressure. In our model, the coefficient for “number of institutions per 1000 children” was negative (as expected), indicating that prior investment in infrastructure helps mitigate shortages.
Based on standardized regression coefficients, the most influential variable is “number of recent births”, followed by “migration”. Notably, in the two largest cities (Almaty and Astana), the contribution of migration is nearly equal to that of birth rates. This insight is critical for policymakers: relying solely on birth statistics is insufficient—migration trends must also be closely monitored to produce accurate forecasts of school system load.
Moreover, interaction effects between variables matter. For instance, if a region exhibits both high fertility and strong net migration (as in parts of the Almaty region), the pressure on infrastructure increases “through both channels”. Conversely, another region may have high fertility but sufficient school capacity (a mitigating effect) or low birth rates alongside school closures due to underfunding—resulting in localized stress despite modest demographic indicators.
5. Discussion
The findings of this study support the original hypothesis and offer critical insights for sustainable planning in the education sector. First, the analysis clearly demonstrates that persistently high birth rates—particularly concentrated in specific regions—will inevitably intensify pressure on preschool and primary school infrastructure. This confirms previous findings by Lee and Mason [
2] about the role of age structure in long-term educational demand and extends their analysis by localizing demographic pressure within specific subnational regions.
In the southern and western regions of Kazakhstan, where fertility remains elevated, the strain on the preschool and school system is not temporary but rather structural and likely to increase over time. This implies that without strategic intervention, these regions risk facing chronic classroom overcrowding and teacher overburden, which could negatively affect both the quality and accessibility of education. This represents a textbook case of a broader sustainable development challenge: how to ensure that social services expand in proportion to population growth.
Our results underscore the urgency of proactive measures: without substantial investments (such as the construction of new schools and the training of teaching staff), certain areas will experience critical shortfalls—undermining the goal of “equal access to quality education”. This finding is aligned with the conclusions of Talen [
41], who emphasized that overburdened teacher–student ratios directly reduce educational quality, especially in urban centers with high demographic pressure. Similarly, Chulanova et al. [
42] highlight that in Kazakhstan’s southern regions, preschool and school infrastructure is critically lagging behind demand, exacerbated by shortages of qualified teaching staff. For example, Z. Engin et al. [
18] argued that modern urban management must anticipate demographic shifts, a point echoed by Sachs et al. [
14] in their call for transformative approaches to infrastructure under the Sustainable Development Goals framework.
The alignment of our findings with other data-driven studies supports the view that rapid population growth can lead to educational infrastructure overload, underscoring the need for timely and evidence-based planning. Logan and Molotch [
1] emphasize that schooling deficits reinforce urban inequality, while the World Bank [
5] underlines the need for data-driven planning in public education. What our study contributes is a detailed localized analysis within Kazakhstan, enabling stakeholders to understand precisely where and when overloads will occur—thus providing a practical “roadmap” for action.
An important theme that emerged from the study is the role of migration, which proved to be a double-edged sword in terms of educational sustainability. On one hand, migration may ease pressure in certain rural areas (by relocating people to places with underutilized resources); on the other hand, it significantly worsens overcrowding in growth hubs, increasing unplanned demand for preschool and school services. Our spatial analysis revealed that in cities like Almaty and Astana, migration is the primary driver of infrastructure overload.
These cities act as magnets for families seeking better opportunities, which is consistent with global urbanization trends; however, when the pace of infrastructure development lags behind, it creates a new layer of inequality. In this context, the “gain” in human capital for a city can simultaneously become a pressure point for public services. This reinforces the importance of integrated urban planning—where housing, employment, and education must be considered together.
Our method, which incorporates migration data, improved the accuracy of demand forecasts. Similar integration of internal migration trends has been shown to be effective by Zhantayev et al. [
47] in Kazakhstan and by Brown and Schafft [
14] in rural settings internationally.
Ideally, educational authorities should revise enrollment projections annually, taking into account the latest population movement data. A one-size-fits-all national policy will not be effective; instead, targeted and region-specific strategies are needed. If a city is under pressure due to migration, a viable solution may involve promoting the development of satellite towns with independent infrastructure or encouraging businesses to open branches in less developed areas. Conversely, if a region’s growth is primarily driven by natural fertility, the key response lies in capital investments in schools and teacher training, as demographic change is occurring locally.
It is also important to link these findings with the broader concept of sustainability and the reduction in regional inequality. If current trends remain unaddressed, Kazakhstan may see a widening gap in education quality between different regions. Children in the overcrowded schools of the south may receive lower-quality educational services than their peers in the north, where schools are underutilized. This constitutes a form of spatial inequality with long-term implications for social equity and economic opportunity. This reinforces arguments by Brown and Schafft [
14], who point to the compounding disadvantages faced by populations in demographically polarized regions.
Our research provides a basis for interventions that can mitigate this inequality: by identifying where infrastructure lags behind population growth, the government can direct targeted investments to ensure balanced regional development. This approach aligns well with the idea of balanced socio-demographic development, whereby public services—including education—are tailored to meet local needs and provide equal opportunities for all citizens.
In doing so, Kazakhstan can avoid deepening educational disparities and foster more inclusive growth. Addressing these imbalances directly supports the achievement of SDG 10 (Reduced Inequalities) and SDG 11 (Sustainable Cities and Communities), since equal access to education is both a driver and an outcome of resilient urban systems.
The case for using BI and GIS tools is further strengthened by their proven effectiveness in analyzing and visualizing complex datasets. From a policy perspective, these tools enable systematic, data-driven decision-making. This approach is consistent with the World Bank’s [
5] recommendations on the use of integrated dashboards for education planning in low- and middle-income countries. The interactive dashboard we developed can serve as a practical, operational instrument for ministries and local authorities. For example, policymakers can instantly check the latest enrollment figures and school capacities, view next year’s forecast, and make rapid decisions—whether to allocate funding for new teachers or identify locations for new school construction. The inclusion of mapping layers (Bing Maps in the dashboard) ensures that the results are also understandable to non-specialists.
Thus, such a visual decision-support system can significantly enhance the transparency and scientific rigor of public administration. This illustrates that sustainability depends not only on the analysis itself but also on how the results are utilized and communicated to stakeholders.
It is also important to acknowledge the limitations of our study, as they help define a direction for future improvements. First, we rely on available official data, which in some cases are aggregated at the regional (oblast) level—potentially masking intra-city or intra-district nuances. Moreover, internal migration statistics may be incomplete; not all relocations are promptly registered. Weak regression results in high-migration areas suggest that unrecorded or informal population movements distort projections of educational demand.
We recommend including more detailed migration variables—such as age, gender, and motivations—in future models.
Additional factors such as economic crises or new policies (e.g., the introduction of mandatory preschool education) can also substantially impact the situation. Our current model assumes an inertial continuation of existing trends, which is the most probable scenario, but for more robust planning, it is beneficial to construct alternative forecasting scenarios. Flexible modeling tools would improve preparedness for a range of possible futures.
Despite these uncertainties, the central conclusion remains clear: the use of an integrated approach can significantly enhance the management of educational infrastructure. Regular model validation and updates enable policymakers to maintain accuracy and adapt strategies in a timely manner.
In essence, we propose a system of continuous comparison between forecasts and real-world developments—a process akin to meteorological forecasting, where regular updates improve reliability. We believe that a similarly dynamic model can be successfully applied to demographic-infrastructure planning.
While this study focuses on Kazakhstan, the methodology and findings are relevant to other countries with heterogeneous demographic landscapes. The methodology we employed—a combination of cohort analysis, BI, and GIS—is adaptable across contexts. We have shown that even relatively simple demographic indicators can produce actionable insights. In data-rich environments, the model could be enriched with additional layers (e.g., economic data, real-time mobility patterns). In data-scarce settings, it could be simplified using surveys or mobile operator data as proxies for official statistics.
In this way, the study contributes to the growing body of research on applying big data analytics to sustainable development planning. It demonstrates a promising pathway for managing regional growth and preemptively addressing demographic challenges with precision and agility.
6. Conclusions
In this study, we assessed the impact of demographic growth on Kazakhstan’s educational infrastructure and proposed a comprehensive approach for forecasting future demand for preschool and primary school placements. Our work makes several key contributions.
First, we developed an original forecasting model that combines classical cohort analysis with modern business intelligence (BI) tools and geographic information systems (GIS), taking into account regional heterogeneity. The model proved effective in identifying where and when shortages in educational capacity are most likely to occur, thus filling a significant gap in both the theory and practice of educational planning in Kazakhstan.
Second, we demonstrated the value of integrating BI dashboards and cartographic visualization into decision-support tools. This approach enabled the creation of a user-friendly system that allows decision-makers to visualize demographic trends and infrastructure needs in real time, thereby significantly enhancing the ability for proactive planning and resource allocation.
Third, our findings emphasize the need for a geographically differentiated approach to educational development. We showed that different regions require tailored strategies: rapidly growing urbanized areas in the south and west need accelerated investment in preschools, schools, and teacher training, while some northern regions may focus on resource consolidation or repurposing underutilized facilities. Such a targeted approach is crucial for minimizing socio-economic inequality and ensuring equitable access to quality education, regardless of geographic location.
From a sustainability perspective, the study illustrates how infrastructure forecasting contributes to balanced regional growth. Anticipating future challenges enables Kazakhstan to avoid reactive crisis responses and move toward a more sustainable path in education sector development. The practical implementation of our recommendations can lead to reduced classroom overcrowding, maintained or improved educational quality, and, in the long term, better learning outcomes—thereby strengthening the country’s human capital and social stability.
It is also important to acknowledge several limitations of this study. Our analysis is largely based on available data and the assumption that current demographic trends will continue. Another limitation lies in the assumption of full (100%) utilization of existing educational facilities. Due to the absence of disaggregated or real-time occupancy data, the model applies this as a neutral baseline for comparing projected demand across regions. However, this may not reflect actual variations in facility usage. The limited availability of information, particularly regarding migration and local fluctuations, implies that our forecasts should be interpreted with a degree of caution.
The methodology requires regular data updates and refinements to maintain relevance in the face of changing demographic patterns. In the future, the model could be enhanced by incorporating more granular data (e.g., at the district level) and additional indicators such as levels of economic development or the pace of residential construction. Furthermore, the application of machine learning techniques holds promise for improving predictive accuracy and detecting non-linear relationships.
We also see potential for extending our approach to other sectors and regions. A similar methodology could be applied to forecast healthcare needs in areas with an aging population. The flexibility of the proposed model makes it suitable for a broader context of spatially integrated social planning, beyond the education sector alone.
In summary, the results of this study provide national and local governments with a system of early warning—through BI dashboards, GIS maps, and cohort-based forecasting—that facilitates more timely and informed decision-making and supports the development of coherent regional policies. Ultimately, this strengthens the foundation for sustainable development, as infrastructure adapts to real demographic dynamics, reducing social and economic risks.
Through detailed analysis and demand forecasting for preschool and primary education in Kazakhstan, we offer evidence-based recommendations that help ensure no region is overlooked. This approach enhances the resilience of the education system, enabling stakeholders to prepare for future challenges today—reflecting the very essence of sustainable development planning.
We are confident that the adoption of such data-driven, geographically sensitive planning tools will enable Kazakhstan—and other nations—to effectively manage the complex demographic shifts in the 21st century, transforming potential crises into manageable scenarios and ensuring a better future for the next generation.


