Article

Evaluation of Different Biowaste Collection Scenarios and Comparison of Periodic and Dynamic Collection

by
Antoine Lesieur
1,2,*,
Mahdi Zargayouna
1 and
Vincent Loubière
2,3
1
COSYS-GRETTIA, University Gustave Eiffel, F-77447 Marne-la-Vallée, France
2
Odyssee Act One, F-75010 Paris, France
3
Lab’URBA, University Gustave Eiffel, F-77447 Marne-la-Vallée, France
*
Author to whom correspondence should be addressed.
Sustainability 2025, 17(9), 4206; https://doi.org/10.3390/su17094206
Submission received: 14 February 2025 / Revised: 18 April 2025 / Accepted: 29 April 2025 / Published: 7 May 2025

Abstract

Efficient biowaste management is critical for sustainable urban development, and directly influences environmental outcomes and operational efficiency. As dense urban areas face increasing volumes of waste and stricter regulations, as in France’s “loi APEC”, optimizing collection strategies is becoming a pressing challenge. The aim of this paper is to compute routing scenarios in order to determine which one is the more sustainable. The study examines biowaste management in urban environments for one year, evaluating and comparing the economic and environmental impacts of two distinct waste collection strategies: traditional periodic collection and an advanced signal-based collection system. To achieve this, we used a synthetic population model and clustering algorithms to map the distribution of biowaste bins throughout the study area. Subsequently, a Capacity Vehicle Routing Problem (CVRP) algorithm was applied to optimize the collection routes for both scenarios, and we specifically adapted it to represent the specificities of bio-waste management. The traditional method involves weekly collection regardless of bin fill levels, whereas the signal-based approach dynamically triggers collection based on predefined fill thresholds. The signal-based collection system initiates waste collection when a bin exceeds an upper threshold ( t 1 ) and includes all bins filled above a lower threshold ( t 0 , where t 1 t 0 ). The results demonstrate a 35% reduction in waste collection time in the signal-based system on a running year, highlighting its potential for significant improvements in operational efficiency and environmental sustainability. This paper provides a rigorous analysis of the methodologies used and discusses the implications of transitioning to adaptive biowaste collection systems in urban settings.

1. Introduction

The urban context and its social, technical, and environmental system can be assimilated as a metabolism. Such an analogy aims to facilitate the evaluation of its ecological footprint, and support attempts to reconcile its flows and processes with environmental processes. Material flow analysis has been a baseline methodology for assessing the urban metabolism and revealing the various dimensions of its footprint: food, water, energy, and soil [1,2,3]. Plaine Commune, a local authority composed of nine cities located north-west of the Paris Metropolitan Area, has been at the forefront of metabolic analysis [4] to address its significant flows of construction material as part of major urban transformation projects carried out in the context of the 2024 Olympic Games. In a previous article [5], we introduced an evolution to a flow-based apprehension of the metabolism, moving towards a network-based representation of the metabolism. This evolution aims to representing the actors and components of the metabolism (people, companies, organization, infrastructures, resources), their respective links, and various interactions (social, commercial, functional). The value of this representation is to enable the use of social network analysis and techniques, such as network effects supported by AI, to animate transition pathway dynamics within the network, restructuring its components and mesh, thus impacting the flows and the overall footprint. The present article and the method presented below fit in the evolving perspective of urban metabolism and aim to provide an analysis tool able to reshuffle the metabolic mesh while incorporating social and economic responses in the footprint evaluation.
Though construction material flow has represented the principal and most impactful flow of the Plaine Commune metabolism, recent French legislation is increasing the emphasis on food flows, with concerns over food supply resilience on one side and biowaste management on the other. This second part of the food supply chain has become especially critical following the enforcement in 2024 of the European Law and the French “loi AGEC” (see https://www.ecologie.gouv.fr/loi-anti-gaspillage-economie-circulaire, accessed on 13 February 2025) regarding the source sorting of biowastes. The latter now obliges local authorities to deploy the necessary services and equipment to facilitate the source sorting of biowaste by citizens. This issue has already been subject to various studies (Phosphore (see https://www.cocreate.brussels/projet/phosphore/, accessed on 13 February 2025), etc.) questioning the choice between centralized, decentralized, and distributed types of biowaste management, with varied degrees of implication for citizens. The work presented is the first step in providing a tool to evaluate such complex reconfigurations of the metabolic networks and to assess their repercussions and impact.
The field of waste management has evolved into a dynamic research domain, taking advantage of advances in modeling and optimization to enhance the system’s efficiency. Studies such as [6,7] have highlighted the role of algorithmic approaches in addressing logistical challenges, while [8] provided a detailed comparative analysis of biowaste transport scenarios. The authors in [9] further demonstrated the utility of graph traversal algorithms for optimizing waste container collections. These contributions collectively establish a robust foundation for investigating innovative waste management strategies. Previous studies have demonstrated that using IoT technology for waste collection significantly improves performance [10] in an experiment led in Qatar. In addition, ref. [11] proposes a review of the use of IoT devices for waste management and waste collection. The review states that the use of this technology allows real-time data to analyze waste flow, to predict generation trends, and to improve operational efficiency. However, high initial costs may jeopardize the viability of the transition to tech-assisted waste management, and only a smooth transition to this technology seems reasonable. There are currently gaps in the research, such as a method to determine the location of the waste collection points and a thorough evaluation of the socio-economic benefits of such a biowaste collection process.
This study extends previous work by comparing two distinct biowaste collection strategies—traditional periodic collection versus a signal-based adaptive approach—to identify which scenario is more sustainable in terms of greenhouse gas emissions. The periodic method relies on fixed weekly collection schedules, regardless of bin fill levels. Conversely, the signal-based strategy leverages real-time data, triggering collections only when bin fill levels exceed predefined thresholds. To accurately represent the spatial distribution of biowaste bins within the study area, synthetic population modeling combined with clustering techniques is employed. A Capacitated Vehicle Routing Problem (CVRP) algorithm is then applied to optimize the collection vehicle routes under both scenarios. Specifically, the methodology involves comparing each strategy’s performance for identical bin-filling patterns. We anticipate that the signal-based approach will notably reduce CO2 emissions by decreasing the total distance traveled for waste collection compared to the traditional periodic method.
In this paper, we propose a method to completely determine the waste collection strategy by using public data and to evaluate its environmental and economic performance.
To further enhance the approach, we propose a light use of IoT probes to improve the distance traveled by dumpsters during biowaste collection. This will be implemented by determining optimal waste container locations based on synthetic population outputs, modeling container filling dynamics through a stochastic process, and finally evaluating the resulting scenario’s performance in terms of cost savings and mileage reduction. The cost reduction of this IoT-based setup, corresponding to the reduction in the distance traveled by the dumpsters, must be compared to the increase in cost of the installation and maintenance of the devices. If the tradeoff is positive, there is an incentive for the collectivities to implement this setup in order to reduce operation costs and improve the CO2 emissions of their waste collection process.
The significance of this research lies in its potential to inform sustainable urban practices. This study provides actionable insights into each collection strategy’s ecological and economic trade-offs by quantifying key performance indicators, such as total distance traveled and CO2 emissions. In subsequent sections, we detail the case study area of the Plaine Commune, the methodological framework, and the comparative evaluation of the two strategies. Ultimately, this paper aims to contribute to the broader discourse on adaptive waste management and its role in fostering resilient urban systems.
The deployed methodology follows these steps:
  • Build a synthetic population using the framework Eqasim [12];
  • Set up the biowaste containers in the study area using a clustering algorithm;
  • Model the filling dynamic of the biowaste container with a stochastic process, similar to [13];
  • Set the dumpster trajectories for the regular collection of biowaste with the framework VROOM [14];
  • Set the dumpster trajectories for the signal based collection of biowaste with the framework VROOM [14];
  • Calibrate the thresholds so that the collection is optimized with a grid search optimization;
  • Evaluate the benefits in terms of cost and emission reduction;
  • Compare this reduction with the extra cost necessary for the installation of the new setup;
  • Estimate the overall benefit of the new scenario.
This paper proceeds as follows: First, Section 2 presents a given area which will be our case study: Plaine Commune (northern Greater Paris area, France). Section 3 explains how to produce a synthetic population and models the signal-based and regular collection methods and sets the performance indicators of the different scenarios. Section 4 compares the results of the current waste management strategy with a new signal-based strategy across the area. We evaluate the ecological and economic performance with key indicators such as the distance (in km) traveled and the mass (in kg) of CO2 emitted. Section 5 validates which of the scenarios is most efficient in terms of distance traveled and emission reduction. Finally, Section 6 defines the economical counterparts linked to a change from the nominal collection strategy to a signal-based strategy. A conclusion in Section 7 shows how to validate the study and its uncertainties and limitations.

2. Case Study: Plaine Commune

Plaine Commune is a conglomerate of nine municipalities in the northern region of Greater Paris, France. It represents a diverse urban landscape with a population of approximately 450,000 residents. The area produces an estimated 164,663 t of waste annually, of which 1144 t is biowaste [15,16]. This urban zone is an ideal testbed for investigating advanced biowaste collection strategies due to its heterogeneous population density, varied socio-economic profiles, and existing logistical challenges in waste management.

2.1. Current Waste Management System

Biowaste collection in Plaine Commune is managed at present by a fleet of 46 natural-gas-fueled vehicles. These vehicles vary in capacity, ranging from 5 t to larger models. The fleet operates on fixed weekly schedules, regardless of the fill levels of individual containers. This approach often leads to inefficiencies, such as unnecessary trips to partially filled containers, which contribute to elevated CO2 emissions—estimated at 0.21 kg/km based on the COPERT emissions model (See https://copert.emisia.com, accessed on 13 February 2025). COPERT is a mathematical model used to compute the emissions of various components during urban road simulations, in order to provide environmental data to evaluate road simulation impact. The use of a software tool to calculate road transport emissions enables data to be collected in a standardized and supposedly more transparent way, making it more consistent and comparable and enabling emissions comparisons as well as reporting procedures, in line with the provisions of international conventions and protocols and European environmental law. The methodology is detailed at the following link: https://copert.emisia.com/wp-content/uploads/2024/07/1.A.3.b.i-iv-Road-transport-2024.pdf, accessed on 13 February 2025. The emission factor is an approximation function derived from empirical data. The emission factor (EF) used is computed as
E F = α v 2 + β v + γ + δ v ϵ v 2 + ζ v + η ( 1 R F ) ,
where v represents the vehicle speed (set at 30 km/h for this study), and α , β , γ , δ , ϵ , ζ , η , and R F are vehicle-specific parameters; the parameters have been computed for heavy-duty trucks fueled with LNG.
The collection process is managed by Moulinot, a biowaste recycling company headquartered in Stains, located northeast of Plaine Commune. The current collection methodology involves the following steps:
  • Each vehicle is assigned a predefined set of containers based on its capacity.
  • Containers are emptied on a fixed schedule, regardless of their fill levels.
  • All vehicles depart from and return to the central depot at the Moulinot site.
While effective for ensuring regular collection, this static model lacks the adaptability required to optimize for environmental and economic efficiency.

2.2. Signal-Based Waste Collection

In contrast to the periodic system, the proposed signal-based collection method leverages real-time data on container fill levels to dynamically optimize collection routes. The system operates as follows:
  • Container fill levels are continuously monitored using IoT sensors or QR code-based manual updates by residents.
  • A collection is triggered when a container exceeds an upper threshold ( t 1 ). All containers with fill levels above a lower threshold ( t 0 ) are included in the route.
The thresholds t 0 and t 1 are critical parameters. If t 1 is set too low, collection frequency increases, negating the efficiency gains of the signal-based system. Conversely, excessively high thresholds may lead to hygiene and overflow issues. A detailed sensitivity analysis, presented in Section 4.1, explores the optimal balance between these thresholds.
This signal-based approach aligns with the ongoing deployment of the Carte Eco initiative in Plaine Commune (see https://plainecommune.fr/projets/comite-eco/, accessed on 13 February 2025), which promotes smart city technologies for sustainable urban management. By integrating connected infrastructure, the system exemplifies the potential of digital innovation in achieving circular economy goals.

2.3. Application to Other Cities

The choice of the area in which to conduct the study was motivated by the fact that the researchers are located here. However the interest of this study is that it can be replicated wherever in France or in other areas where public data allow for the building of a consistent synthetic population. With the synthetic population and the road network, the same study can be led in virtually every urban area in the world.

3. Methodology

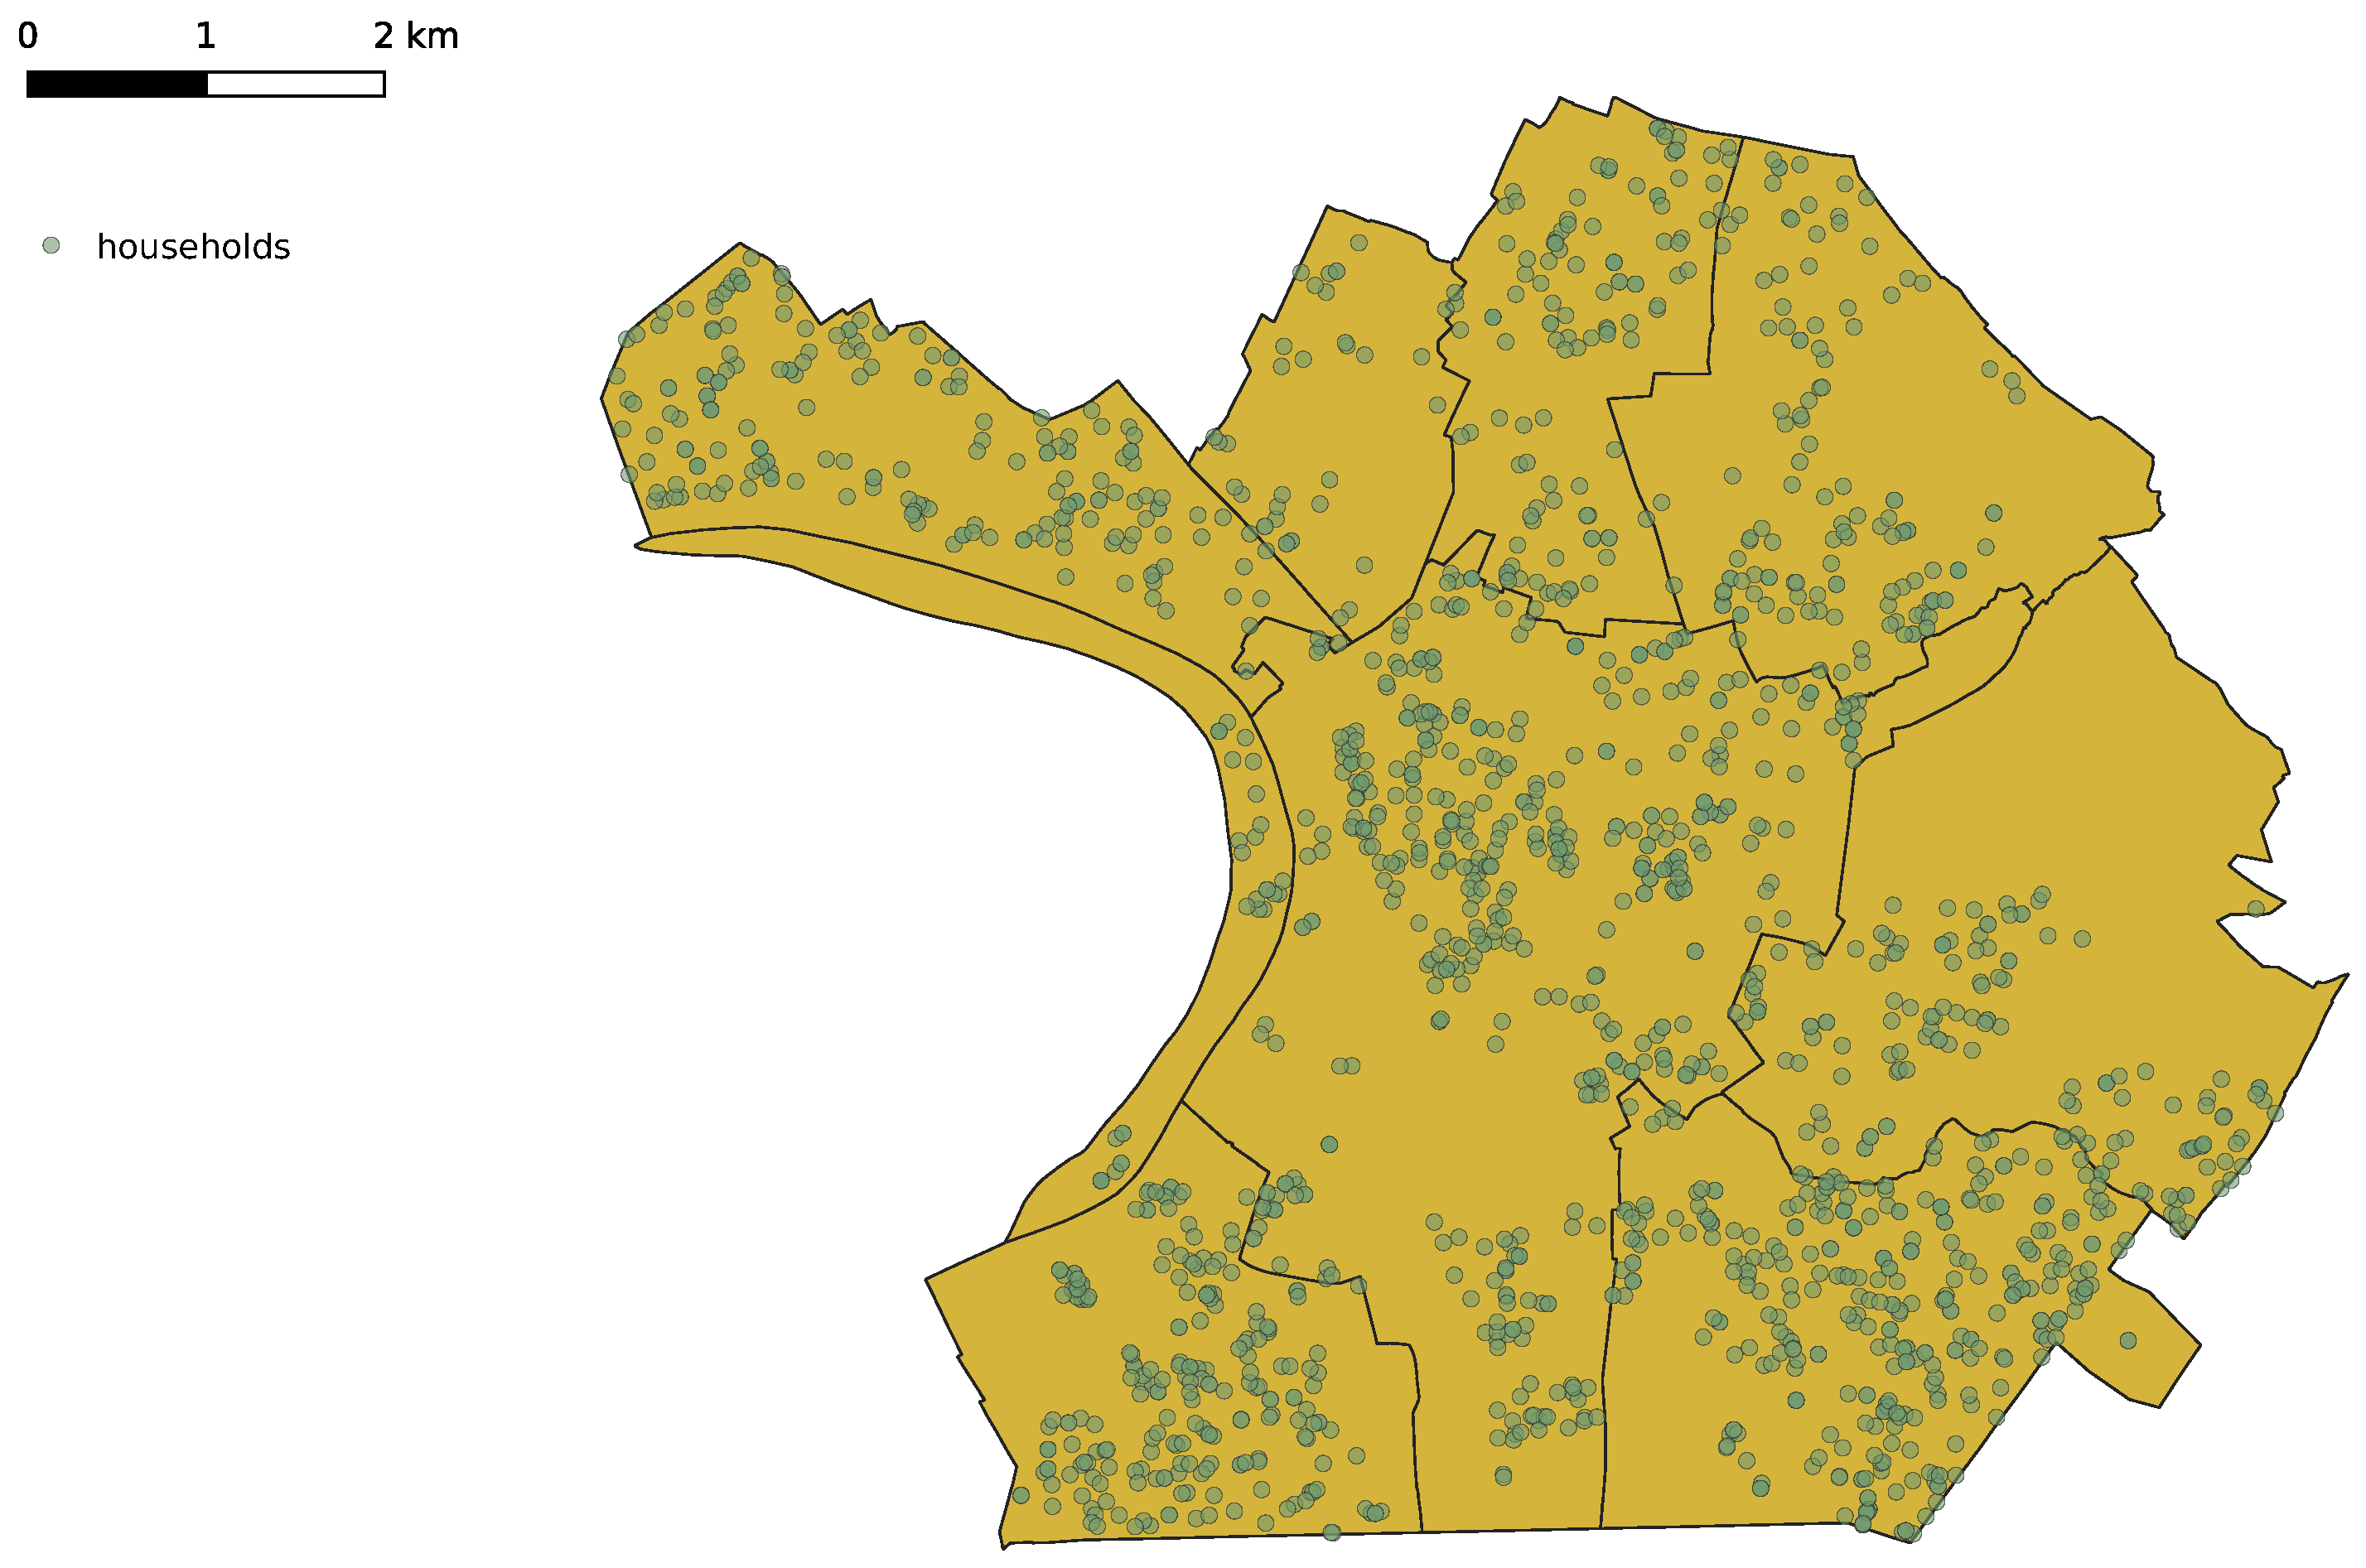
3.1. Synthetic Population

A synthetic population represents a probabilistic reconstruction of the actual population characteristics derived from available demographic and activity data [17]. In this study, we utilized a synthetic population and travel demand data for Paris and Île-de-France, developed based on open and publicly accessible datasets [12]. These data include detailed spatial and temporal household activity distributions, enabling a robust estimation of biowaste generation patterns. Figure 1 illustrates the spatial distribution of synthetic households in Plaine Commune, forming the basis for biowaste container allocation across the territory.

3.2. Container Distribution

The allocation of biowaste containers was achieved using a clustering approach. Specifically, a k-means algorithm, implemented with Python’s scikit-learn library [18], was applied to segment the territory into clusters. The number of clusters corresponds to the total number of planned containers (463), as defined in Plaine Commune’s long-term waste management program (PLPDMA) [15]. Each cluster centroid represents the location of a biowaste container. Figure 2 shows an illustrative subset of 50 containers for visualization purposes.

3.3. Container Filling Models

3.3.1. Probabilistic Model

The container fill rate is modeled as a stochastic process. For each container i, the level of waste at time t is denoted by a i , t . The waste generation at each timestep is modeled as a random variable X i , t U ( [ 0 , m i ] ) , where m i is the average daily waste per capita adjusted for cluster population size. The recursive relationship governing the waste level is given by
a i , t = a i , t 1 + X i , t .

3.3.2. Graph Neural Network (GNN) Model

An alternative, advanced model involves a Graph Neural Network (GNN) that incorporates the population’s socio-ecological characteristics and activity patterns. This approach allows for a more nuanced prediction of container-filling dynamics by accounting for interactions between neighboring areas. The development of this model is ongoing, with preliminary findings suggesting its potential to improve predictive accuracy over the uniform distribution assumption.

3.4. Capacity Vehicle Routing Problem (CVRP)

The CVRP is formulated to optimize the collection routes by minimizing travel distances while respecting vehicle capacity constraints. The problem is modeled as follows.
  • Objective: Minimize total route distance.
    min k = 0 K i = 0 N j = 0 N C i j k X i j k
  • Constraints: Ensure that vehicle load does not exceed capacity and that all assigned containers are visited.
    • k = 0 K i = 0 N X i j k = 1 , j [ 1 , N ] ;
    • k = 0 K j = 0 N X i j k = 1 , i [ 1 , N ] ;
    • i = 0 N X i t k j = 0 N X t j k = 0 , { k , t } [ 1 , K ] × [ 1 , N ] ;
    • j = 0 N q j ( i = 0 N X i j k ) Q k , k [ 1 , K ] ;
    • j = 1 N X 0 j k 1 , k [ 1 , K ] ;
    • i = 1 N X i 0 k 1 , k [ 1 , K ] ;
    • X i j k { 0 , 1 } , { i , j , k } [ 0 , N ] × [ 0 , N ] × [ 1 , K ] ;
The objective function is to minimize the total cost by all vehicles that is the sum of the travel distance of vehicles, with C i j as the cost to travel from node i to j. Constraint Equations (1) and (2) ensure that each container is collected exactly once. Constraint Equation (3) ensures the connectivity of the route. Constraint Equation (4) shows that the total demand of any route must not exceed the capacity Q k of the vehicle k. Constraint Equations (5) and (6) ensure that each vehicle is used no more than once. Constraint Equation (7) ensures that the variable X i j only takes the integers 0 or 1 (the path is taken or not).
We utilized the VROOM optimization library [14] to solve the CVRP, setting the vehicle capacity at 5 t based on fleet specifications in the PLPDMA report. The model iteratively adjusts routes to accommodate the dynamic addition of containers in the signal-based collection scenario.

3.4.1. Threshold Calibration

In order to determine which set of thresholds to use ( t 1 , which triggers the collection, and t 0 , which selects the collected containers), we performed a grid search to look for the pair of thresholds which gave the best results, i.e., which minimised the distance traveled and the CO2 emissions. The ( t 0 , t 1 ) pair was selected for the rest of the study.

3.4.2. Emission Computation

Figure 3 illustrates an example of a signal-based collection route. The dots represent container locations connected via optimized routes. CO2 emissions are computed based on travel distance, using the emission factor specified in Section 2.

3.5. Implementation Costs

Several aspects of the socio-economical impacts of the transition from one scenario to another are evaluated and detailed in Section 6:
  • Fleet size and cost implications;
  • Installation costs for monitoring infrastructure;
  • Operational adjustments and social impacts;
  • Operation and maintenance costs.
This will give tools to evaluate the cost–benefit analysis as well as the return on investment period.

4. Results

4.1. Threshold Calibration

We conducted a sensitivity analysis to determine the optimal threshold values ( t 0 and t 1 ). The analysis varied t 0 and t 1 within the range [0.5, 1] to identify the configuration minimizing the total collection distance. The results, summarized in Table 1, indicate that t 0 = 1 and t 1 = 0.6 achieve optimal performance. Since we have the constraint t 0 t 1 , the table is triangular.

4.2. Benefits of the Scenarios

The process outlined in Section 3—modeling container filling dynamics using a stochastic approach and collecting waste via either the traditional strategy or the signal-based strategy—was simulated over a full year (365 days). For each collection route, the distance traveled and the associated CO2 emissions were monitored, recorded, and compared.
The performance of the periodic and signal-based collection strategies was evaluated based on two key metrics: total collection distance and associated CO2 emissions. These metrics provide insights into the environmental and operational implications of each strategy.
Table 2 summarizes the results for average weekly collection distances and CO2 emissions. The comparison reveals that the signal-based collection scenario significantly outperforms the periodic approach regarding efficiency and sustainability. The observed reduction of distance traveled and emission reduction is 35%.

5. Analysis

Several analyses can be made from the results.
  • Reduction in Collection Distance
    The signal-based approach reduces the weekly collection distance by 35%, minimizing vehicle travel and operational costs. This improvement is attributed to the signal-based system’s adaptive nature, which prioritizes bins with higher fill levels and optimizes routing dynamically.
  • Environmental Benefits
    By reducing total collection distance, the signal-based strategy lowers weekly CO2 emissions from 5.4 t to 3.5 t, translating to a 35% reduction. These results underscore the environmental benefits of leveraging real-time data in waste collection systems.
  • Implications of Threshold Calibration
    The thresholds t 0 and t 1 significantly influence the system’s performance. As detailed in Section 4.1, the chosen values ( t 0 = 1 , t 1 = 0.6 ) balance collection frequency and efficiency, avoiding excessive trips while maintaining hygienic standards.
  • Future Adaptations
    The ongoing deployment of the Carte Eco app in Plaine Commune provides an opportunity to enhance the signal-based system. By integrating user-reported data and IoT-enabled fill sensors, future iterations of the system can incorporate machine learning models, such as GNNs, to further refine predictions of container filling dynamics. This advancement is expected to improve accuracy and reduce over- or under-collection risks.

5.1. Visualization of Collection Routes

Figure 3 illustrates a representative signal-based collection route, highlighting the optimized travel paths and efficient allocation of vehicle capacity. The dynamic adaptation of routes is a cornerstone of the observed efficiency gains.

5.2. Summary of Findings

The results validate the hypothesis that signal-based collection is superior to environmental sustainability and operational efficiency. By integrating advanced routing algorithms with real-time data, municipalities can significantly enhance the performance of their waste management systems while contributing to broader sustainability goals.

6. Socio-Economic Counterparts

The signal-based collection strategy offers notable operational benefits, reducing the collection time by 35% compared to the regular scenario. However, these improvements require upfront investments and ongoing operational adjustments, which this section examines.

6.1. Fleet Size and Cost Implications

The fleet size required to handle peak collection demands is a critical factor in the socio-economic analysis. While the signal-based strategy improves route efficiency, its dynamic nature necessitates higher fleet availability to respond effectively to real-time triggers.
The demand for vehicles under each scenario is computed as follows:
  • Regular Scenario: The fleet size is determined by the number of trips required to collect all bins weekly, given a vehicle capacity of 5 t. This results in a fleet size of 11 vehicles.
  • Signal-Based Scenario: The fleet size corresponds to the maximum number of vehicles required during peak collection periods. This is estimated at 43 vehicles for 5 t capacity.
The additional 32 vehicles required for the signal-based strategy represent a substantial capital expense. At an estimated cost of EUR 30,000 per vehicle (based on market data from https://www.hellopro.fr/camion-poubelle-1001630-fr-1-feuille.html, accessed on 13 February 2025), the total investment amounts to EUR 960,000. This expense underscores the importance of balancing operational benefits with capital expenditures when transitioning to adaptive collection systems.

6.2. Installation Costs for Monitoring Infrastructure

Implementing the signal-based system requires technological upgrades to monitor bin fill levels. Two primary options exist:
  • IoT Sensors: Installing sensors in all 463 bins provides real-time data on fill levels. The cost scales with the number of bins, with individual sensor units priced between EUR 100 and EUR 500, leading to a potential range of EUR 46,300 to EUR 231,500.
  • QR Code System: This lower-cost alternative relies on manual updates from users scanning QR codes on bins. While the upfront cost is minimal, its effectiveness depends on user participation and compliance.
The choice between these options depends on the municipality’s budget and technological readiness, with IoT sensors offering greater automation and accuracy.

6.3. Operational Adjustments and Social Impacts

The dynamic nature of the signal-based strategy necessitates changes in workforce deployment and community engagement:
  • Workforce Adaptation: Collection schedules become more variable, requiring flexible staffing models. Training programs may be needed to ensure drivers adapt to real-time route adjustments.
  • Community Involvement: The system’s success partially relies on public cooperation, particularly if QR code systems are used. Awareness campaigns highlighting the environmental benefits of participation can improve engagement.

6.4. Operation and Maintenance Costs

If the IoT sensor solution is chosen, operational costs will need to be assessed, including electricity consumption by the sensors and the telecommunication fees required for transmitting data to the operator via a 4G network. Additionally, regular maintenance must be scheduled to ensure proper functioning of the IoT sensors. The sensors should be capable of sending alerts in case of malfunctions, and maintenance technicians should regularly inspect the containers to address any reported issues promptly.

6.5. Cost–Benefit Analysis

The operational savings from reduced collection distances and CO2 emissions must be weighed against the additional costs of fleet expansion and monitoring infrastructure. Preliminary estimates suggest that the long-term environmental and efficiency gains justify the initial investments, particularly as IoT and routing technologies continue to advance, driving down costs.

6.6. Return on Investment

In addition to the environmental benefits associated with transitioning from the standard scenario to the signal-based approach, an economic analysis of the return on investment should be conducted. This analysis must consider vehicle depreciation and the operational costs per kilometer of the collection process. Given that operating expenses are reduced under the signal-based scenario, it becomes possible to estimate the payback period for this transition.

7. Conclusions

This study has demonstrated the potential of advanced methodologies to improve urban biowaste collection. By leveraging synthetic population modeling and clustering algorithms, we effectively represented the spatial distribution of biowaste containers, enabling a robust comparison between periodic and signal-based collection strategies. The integration of real-time data into waste management systems offers substantial benefits, including reduced collection distances and CO2 emissions, as evidenced by the 35% decrease in emissions under the signal-based scenario.
The findings underscore the viability of adopting dynamic collection systems in urban settings. While the signal-based approach entails upfront costs, such as fleet expansion and monitoring infrastructure, the long-term environmental and operational savings justify these investments. The cost–benefit analysis highlights that technological advancements, particularly in IoT and routing optimization, continue to reduce implementation barriers, enhancing the practicality of such systems for municipalities worldwide.
Looking forward, this research opens pathways for further advancements:
  • Enhanced Predictive Modeling: The integration of Graph Neural Networks (GNNs) to model container filling dynamics based on socio-economic and environmental factors.
  • More complex optimisation problems: The integration of time constraints [19], dynamic traffic [20], and multiple origins and destinations [21] for more operational analysis.
  • Dynamic Threshold Optimization: Developing algorithms to dynamically adjust collection thresholds ( t 0 and t 1 ) in response to real-time data and fleet constraints.
  • Socio-Economic Insights: Incorporating detailed demographic data to tailor collection strategies to specific community needs, maximizing participation and equity.
  • Ecological insights: This study has focused exclusively on the so-called brown matter, which consists of nitrogen-rich food waste. However, an efficient compost process also needs so-called green matter, consisting of wood waste rich in carbon. An efficient composting process needs both nitrogen and carbon supply. The source of green matter is very different from the source of brown matter and requires a whole other approach.
  • Scenario Analysis: The resilience of collection strategies should be assessed under disruptions, such as strikes or extreme weather events. Different kinds of biowaste management should be considered, such as neighborhood composters, which require residents to be dedicated to their management, as well as supply regarding the brown and green matter, and specific outlets.
Finally, deploying initiatives such as Carte Eco demonstrates the growing public and governmental interest in smart waste management solutions. By fostering citizen engagement and integrating advanced analytics, municipalities can enhance waste collection efficiency and contribute to broader sustainability goals, advancing the circular economy and reducing urban ecological footprints.

7.1. Validation of the Study

It would be interesting to compare the simulated output value (total distance traveled and CO2 emissions) of the nominal scenario with the ground-truth data provided by Plaine Commune waste management services. These data are not available yet. However, future studies shall rely on this information to validate whether the nominal scenario is realistic or not, and whether it constitutes a robust baseline for the evaluation of the signal-based scenario.

7.2. Uncertainties and Limitations

Despite providing a method to compute the distance and emissions of the biowaste collection strategy of a collectivity, the pipeline contains several uncertainties and limitations that need to be addressed in future works. First, the synthetic population uses data that are not actualized on a yearly basis; hence, the results might differ from reality and not be up to date. In addition, the waste filling stochastic process is a model which might show some inaccuracies. Other sources of data such as GNNs might offer real-time data of the population behavior and waste-filling distribution, as explained in Section 3.3.2. Second, the CVRP algorithm does not take into account the traffic state of the area, and the speed of the vehicles may not be centered around 30 km/h. A new study should refine the estimation by taking into account the variation in speed. Finally, with the CVRP being NP-complete, the algorithm does not provide an exact solution of the problem but an approximate solution, with the exact solution being computationally intractable; one must take into account this limitation.

Author Contributions

Conceptualization, A.L., M.Z. and V.L.; methodology, A.L. and M.Z.; software, A.L.; validation, A.L.; formal analysis, A.L.; investigation, A.L., M.Z. and V.L.; resources, M.Z. and V.L.; data curation, A.L.; writing—original draft preparation, A.L.; writing—review and editing, A.L. and M.Z.; visualization, A.L.; supervision, M.Z.; project administration, V.L.; funding acquisition, V.L. All authors have read and agreed to the published version of the manuscript.

Funding

This research received no external funding.

Institutional Review Board Statement

Not applicable.

Informed Consent Statement

Not applicable.

Data Availability Statement

The data presented in this study are available on request from the corresponding author.

Conflicts of Interest

Authors Antoine Lesieur and Vincent Loubière were employed by the company Odyssee Act One. The remaining authors declare that the research was conducted in the absence of any commercial or financial relationships that could be construed as a potential conflict of interest.

References

  1. Barles, S. Comprendre et maîtriser le métabolisme urbain et l’empreinte environnementale des villes. Ann. Mines-Responsab. Environ. 2008, 52, 21–26. [Google Scholar] [CrossRef]
  2. Barles, S.; Buclet, N.; Billen, G. L’écologie territoriale: Du métabolisme des sociétés à la gouvernance des flux d’énergie et de matières. In Proceedings of the du 1er Colloque International du CIST, Collège International des Sciences du Territoire (CIST), Paris, France, 23 November 2011; pp. 16–22. [Google Scholar]
  3. Barles, S. Écologie territoriale et métabolisme urbain: Quelques enjeux de la transition socioécologique. Rev. D’économie Régionale Urbaine 2017, 18, 819–836. [Google Scholar] [CrossRef]
  4. Bastin, A. Vers une gestion circulaire des matières inertes issues de la démolition et des travaux publics en région parisienne: Une lecture croisant transition sociotechnique et approches territoriales. Flux 2019, 116–117, 42–57. [Google Scholar] [CrossRef]
  5. Loubière, V.; Huraux, T.; Mastio, M. Parcours de vie Résilients: Une méthode systémique d’Écologie Territoriale pour une Planification Écologique Ascendante. In Proceedings of the Congrés Interdisciplinaire sur l’Économie Circulaire, AIFREC, Montpellier, France, 26–27 June 2024; p. 8. [Google Scholar]
  6. Debray, B. Modélisation et simulation de la gestion et du traitement des déchets ménagers. Environ. Ingénierie Dévelop. 2002, 27, 3–8. [Google Scholar] [CrossRef]
  7. Rodrigues, J.; Gondran, N.; Beziat, A.; Laforest, V. Application of the absolute environmental sustainability assessment framework to multifunctional systems—The case of municipal solid waste management. J. Clean. Prod. 2021, 322, 129034. [Google Scholar] [CrossRef]
  8. Vilain, P.; Blanquart, C.; Zeroual, T. The environmental impact of transport in biowaste collection. Transp. Res. Procedia 2023, 82, 1039–1053. [Google Scholar] [CrossRef]
  9. Tonneau, Q.A. Optimisation de la Chaine Logistique des Déchets non Dangereux. Ph.D. Thesis, Ecole Nationale Supérieure Mines-Télécom Atlantique, Nantes, France, 2017. [Google Scholar]
  10. Hussain, D.I.; Elomri, D.A.; Kerbache, D.L.; Omri, D.A.E. Smart city solutions: Comparative analysis of waste management models in IoT-enabled environments using multiagent simulation. Sustain. Cities Soc. 2024, 103, 105247. [Google Scholar] [CrossRef]
  11. Lakhouit, S.; Allouhi, A. IoT-enabled smart waste management: A comprehensive review. Waste Resour. Manag. 2025. [Google Scholar] [CrossRef]
  12. Hörl, S.; Balac, M. Synthetic population and travel demand for Paris and Île-de-France based on open and publicly available data. Transp. Res. Part Emerg. Technol. 2021, 130, 103291. [Google Scholar] [CrossRef]
  13. Laurence, L. Introduction à un Domaine de Recherche: Étude sur L’optimisation des Modes de Collecte des Déchets Ménagers. Master’s Thesis, École Normale Supérieure de Paris, Paris, France, 2021. [Google Scholar]
  14. Coupey, J.; Nicod, J.M.; Varnier, C. VROOM v1.14, Vehicle Routing Open-Source Optimization Machine; Verso: Besançon, France, 2024; Available online: http://vroom-project.org/ (accessed on 13 February 2025).
  15. Plaine-Commune. Programme Local de Prévention des Déchets Ménagers et Assimilés; Plaine-Commune: Saint-Denis, France, 2022. [Google Scholar]
  16. Plaine-Commune. Rapport Annuel sur le prix et la Qualité du Service Public de Prévention et de Gestion des Déchets Ménagers et Assimilés; Plaine-Commune: Saint-Denis, France, 2022. [Google Scholar]
  17. Moeckel, R.; Spiekermann, K.; Wegener, M. Creating a synthetic population. In Proceedings of the 8th International Conference on Computers in Urban Planning and Urban Management (CUPUM), Sendai, Japan, 27–30 May 2003; pp. 1–18. [Google Scholar]
  18. Pedregosa, F.; Varoquaux, G.; Gramfort, A.; Michel, V.; Thirion, B.; Grisel, O.; Blondel, M.; Prettenhofer, P.; Weiss, R.; Dubourg, V.; et al. Scikit-learn: Machine Learning in Python. J. Mach. Learn. Res. 2011, 12, 2825–2830. [Google Scholar]
  19. Zargayouna, M.; Balbo, F.; Scémama, G. A multi-agent approach for the dynamic VRPTW. In Engineering Societies in the Agents World IX, Proceedings of the 9th International Workshop, ESAW 2008, Saint-Etienne, France, 24–26 September 2008; Springer: Berlin/Heidelberg, Germany, 2008. [Google Scholar]
  20. Alisoltani, N.; Leclercq, L.; Zargayouna, M.; Krug, J. Optimal fleet management for real-time ride-sharing service considering network congestion. In Proceedings of the Transportation Research Board 98th Annual Meeting (TRB 2019), Washington, DC, USA, 13-17 January 2019; p. 22. [Google Scholar]
  21. Zargayouna, M. Coordination model and language for open multiagent systems. Application to the Dial A Ride Problem. Ph.D. Thesis, University of Paris-Dauphine, Paris, France, 2007. [Google Scholar]
Figure 1. Synthetic households of Plaine Commune.
Sustainability 17 04206 g001
Figure 2. Distribution of the centroids: example with a sample of 50 containers.
Sustainability 17 04206 g002
Figure 3. Example of a signal-based collection route.
Sustainability 17 04206 g003
Table 1. Average weekly collection distance in km vs. thresholds t 0 and t 1 .
t 0 t 1 0.50.60.70.80.91
0.5
0.6 3.0 × 10 4
0.7 3.0 × 10 4 2.8 × 10 4
0.8 2.1 × 10 4 2.5 × 10 4 2.6 × 10 4
0.9 2.1 × 10 4 2.2 × 10 4 2.1 × 10 4 2.0 × 10 4
1 1.7 × 10 4 1.7 × 10 4 2.0 × 10 4 1.9 × 10 4 1.9 × 10 4
Table 2. Comparison of collection distance and CO2 emissions for periodic and signal-based collection strategies.
Collection TypePeriodicSignal-Based
Collection Distance (km) 2.59 × 10 4 1.70 × 10 4
Distance per Dumpster (km)380250
CO2 Emissions (t)5.43.5
CO2 Reduction−35%
Disclaimer/Publisher’s Note: The statements, opinions and data contained in all publications are solely those of the individual author(s) and contributor(s) and not of MDPI and/or the editor(s). MDPI and/or the editor(s) disclaim responsibility for any injury to people or property resulting from any ideas, methods, instructions or products referred to in the content.

