Abstract
The Paris Agreement’s pressing global mandate to limit global warming to 1.5 degrees Celsius above pre-industrial levels by 2030 has placed immense pressure on energy-consuming industries and businesses to deploy robust, advanced, and accurate monitoring and tracking of carbon footprints. This critical issue is examined through a systematic review of English-language studies (2015–2024) retrieved from three leading databases: Scopus (n = 1528), Web of Science (n = 1152), and GreenFILE (n = 271). The selected literature collectively highlights key carbon footprint tracking methods. The resulting dataset is subjected to bibliometric and scientometric analysis after refinement through deduplication and screening, based on the PRISMA framework. Methodologically, the analysis integrated the following: (1) evaluating long-term trends via the Mann–Kendall and Hurst exponent tests; (2) exploring keywords and country-based contributions using VOSviewer (v1.6.20); (3) applying Bradford’s law of scattering and Leimkuhler’s model; and (4) investigating authorship patterns and networks through Biblioshiny (v4.3.0). Further, based on eligibility criteria, 35 papers were comprehensively reviewed to investigate the emerging carbon footprint tracking technologies such as life cycle assessment (LCA), machine learning (ML), artificial intelligence (AI), blockchain, and data analytics. This study identified three main challenges: (a) lack of industry-wide standards and approaches; (b) real-time tracking of dynamic emissions using LCA; and (c) need for robust frameworks for interoperability of these technologies. Overall, our systematic review identifies the current state and trends of technologies and tools used in carbon emissions tracking in cross-sectors such as industries, buildings, construction, and transportation and provides valuable insights for industry practitioners, researchers, and policymakers to develop uniform, integrated, scalable, and compliant carbon tracking systems and support the global shift to a low-carbon and sustainable economy.
1. Introduction
In recent years, the concerns over climate change and ecological responsibility have gained tremendous global attention [1,2]. Global climate agreements such as the Sustainable Development Goals (SDGs) and Paris Agreements have put tremendous pressure on governments, industries, and organizations to track, monitor, and report carbon emissions [3,4]. Carbon footprint tracking (CFT) is the process of tracking and quantifying the amount of greenhouse gases (GHGs) from different sources such as industries, services, products, and processes [5]. CFT is important for businesses and industries to ensure their compliance with standards and frameworks such as ISO 14064 and the GHG Protocol [6,7]. In addition, quantifying and monitoring footprints is also necessary for preparing reports, policy development, identifying inefficiencies, and reducing operational costs in energy systems, supply chains, and manufacturing processes [8].
One crucial foundation of carbon footprint tracking is the sorting of emissions into Scope 1, Scope 2, and Scope 3 emissions [9]. As defined by the GHG Protocol, Scope 1 emissions are source-controlled or owned direct emissions such as from boilers, vehicles, and production processes; Scope 2 emissions are indirect emissions from purchased sources such as electricity, heating, cooling, or steam uses; and Scope 3 emissions are other indirect emissions that are gathered from upstream and downstream activities of the organization such as transportation, logistics, and disposal of products at the ends of their lives [10,11,12,13,14,15]. Even though there were worldwide obligations to limit warming temperatures to 1.5 °C, a study by Matthews et al. has shown that the limit is unachievable at the current rate of decarbonization [16,17]. This suggests the urgent need for comprehensive carbon footprint tracking to determine hotspots and to apply emissions reduction efforts. As per the Intergovernmental Panel on Climate (IPCC), electricity and heat production (34%); industry (24%); agriculture, forestry, and other land use (22%); transportation (15%); and buildings (5%) are the major contributors to carbon footprint distribution by sectors [18].
The current strategies for reducing GHG emissions include reductions in carbon footprint using various approaches, tools, technologies, and other diverse sustainable solutions. The most widely adopted approach in industries is the transition to renewable energy sources such as solar [19], wind [20], geothermal [21,22], and hydropower [23,24,25], as well as the deployment of electric heat pumps and boilers instead of natural gas. In agriculture, researchers are investing in organic fertilizers [26], renewable-powered machinery [27], sustainable farming practices [28], and electrified farming equipment [29] to diminish the emissions in agricultural operations [30,31]. In the transportation sector, there is a significant shift towards electric vehicles (EVs) [32], biofuels [33,34], and hydrogen fuel cell vehicles [35] to offset transportation emissions. Likewise, the building sector is adopting the use of LED lights [36], high-performance heating ventilation, and air-conditioning (HVAC) systems [37], enhancing building envelopes [38], green roofs [39], etc., to reduce carbon emissions.
In such industries, traditional carbon accounting methods have a much longer history. Traditional carbon footprint tracking approaches, including manual data collection, simple emission factors, and subjective assessments, made the process tedious and prone to errors [40]. These methods mostly included industry-average carbon emissions data, spreadsheets, and self-provided information. Life cycle assessment (LCA) is one of the most used traditional methods, but it has infrequent updates and static datasets [41]. M.N.N Rodrigo [42] developed databases and embodied carbon-estimating tools, which include databases such as ICE [43,44], Ecoinvent [45], AusLCI [46], The Greenbook 2020 [47], and tools such as Sima Pro [48] and GaBI Education Software [49]. Table 1 shows some of the latest databases and tools used in the estimation of carbon emissions.

Table 1.
Overview of some of the latest carbon-tracking tools and databases with updated information.
As most industries are under sheer pressure for carbon disclosure and are intensifying their efforts towards decarbonization, reliable carbon footprint tracking methods have never been this important. While there are many options to track and monitor carbon emissions, the tools and technologies are often scattered. Moreover, many previous studies have focused more on a single sector, and there is currently no single source that assesses and contrasts carbon footprint tracking technologies across industries. This systematic review paper addresses the critical gap by combining and evaluating cross-sector monitoring tools and technologies. By offering detailed cross-sector tracking solutions, this review not only advocates for robust carbon management but also supports policymakers and pushes practitioners toward more effective and transparent climate action.
In this study, we aim to investigate the technological advancements in carbon footprint tracking technologies in different industries and businesses, leveraging various approaches such as LCA, machine learning (ML), artificial intelligence (AI), Internet of Things (IoT), and blockchain. This review paper employs the bibliometric and scientometric analysis approach to identify the trending topics, keyword analysis, country analysis, and author analysis. Section 2 in the paper defines the methods and materials used. Section 3 shows the results of our bibliometric and scientometric analysis of the selected papers. Section 4 presents a summary of papers that are thoroughly reviewed and a comprehensive discussion of the papers based on the technology adopted. Finally, Section 5 provides the conclusion of this study.
2. Materials and Methods
The systematic review process follows a structured approach, which is divided into three main stages as shown in Figure 1. This review study employs bibliometric analysis using statistical methods such as the Mann–Kendall test method [56] and the Hurst exponent method [57]. The methodology coheres with the Preferred Reporting Items for Systematic Reviews and Meta-Analysis (PRISMA) framework [58] and utilizes the SPICE (Setting, Perspective, Intervention, Comparison, Evaluation) method to develop research questions. It also makes use of bibliometric software such as VOSviewer [59] and Biblioshiny [60]. In the first stage, a protocol is developed, and then research questions are formulated to finalize the search strategy and PRISMA framework. Secondly, the data are fed to statistical models and bibliometric analysis software such as VOSviewer and Biblioshiny to yield social network analysis and thematic maps analysis. Finally, the findings are summarized, and potential future research directions are developed.
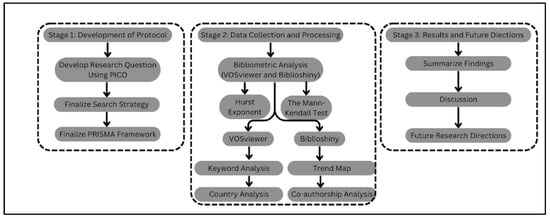
Figure 1.
Three stages of the systematic review process.
In this paper, the terms ‘carbon footprint tracking’, ‘carbon emissions monitoring’, and ‘carbon monitoring’ are often used interchangeably, though they carry nuanced differences. Carbon footprint tracking refers to the quantification of greenhouse gas emissions across the life cycle of a product. Carbon emissions monitoring refers to real-time measurement of emission outputs, and carbon monitoring is a broader term that encompasses both. For consistency and clarity, this paper uses ‘carbon footprint tracking’ as the main term unless specific distinction is necessary.
2.1. Protocol Development
The protocol for this systematic review was developed to ensure that the review process is transparent and compliant with the defined guidelines. The protocol was developed by adhering to the PRISMA framework checklist.
2.1.1. Research Question Formulation
The research questions for this review were formulated using the SPICE (Setting, Perspective, Intervention, Comparison, Evaluation) framework in such a way that the questions focus on emerging innovative approaches to carbon footprint tracking within several industries. The SPICE framework was developed as shown below.
Setting (S): Several industries;
Perspective (P): Users and stakeholders of carbon footprint tracking;
Intervention (I): Technological innovations and their efficiency, barriers, and opportunities;
Comparison (C): Different carbon footprint tracking technologies;
Evaluation (E): Identification, classification, and significance of carbon footprint tracking in industries.
Using this framework, the following research questions were formulated:
- What are the emerging technologies to monitor and track the carbon footprints in industries? RQ1
- How can these technologies improve the efficiency, accuracy, and scalability of carbon footprint tracking in comparison with traditional methods? RQ2
- What could be the barriers and opportunities in the utilization of these technologies? RQ3
2.1.2. Search Strategy
This systematic review ensures the use of different databases for comprehensive, high-quality, and unbiased coverage of the content. The literature related to carbon emissions tracking and monitoring is taken from three databases, which include Scopus, Web of Science, and GreenFILE. The literature search strategy concentrates on three main domains: technology, application, and environmental context. The keywords that reflect the core concepts of the research questions were selected and altered based on the responses from the subject matter experts. The keywords within each domain and between each domain are systematically combined using the OR and AND operators, respectively. Figure 2 below shows the core concept, and its associated keywords used to minimize irrelevant results. The detailed search string for this systematic literature search is provided in the Supplementary Material (Supplementary File S1).
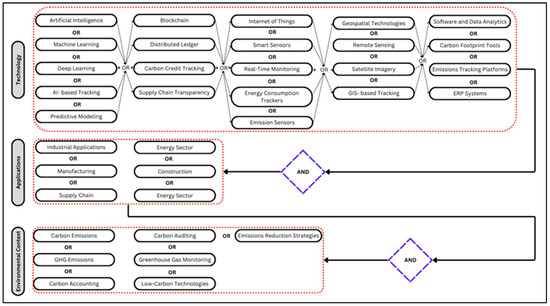
Figure 2.
Core concepts and keyword nesting for systematic review on carbon footprint tracking.
2.1.3. Eligibility Criteria for Systematic Review
The eligibility criteria for this review were defined to secure the inclusion of relevant studies and exclude irrelevant ones in a structured manner. Studies relevant to the technologies related to carbon footprint tracking were included. To maintain methodological rigidity, only studies between 2015 and 2024 were considered. Papers were limited to peer-reviewed journal articles and conference proceedings, available in full-text format, and published in English. Moreover, to maintain the standard of impact and quality, papers that have fewer than 5 citations were omitted.
2.2. Bibliometric Analysis
Bibliometric analysis is a quantitative tool to assess academic literature based on publication trends, key authors, key journals, and research themes [61,62]. This tool makes use of metadata from different databases such as Scopus, Web of Science, and GreenFILE to analyze co-authorship networks, citation patterns, and keyword occurrences. This allowed the use of bibliometric tools such as VOSviewer and Biblioshiny for the visualization of bibliometric results. VOSviewer is particularly used here to create network visualizations, and Biblioshony, an interactive tool for the Bibliometrix v 4.2.1, allows researchers to use thematic mapping, word clouds, Sankey diagrams, and extensive quantitative analysis [63].
2.3. Scientometric Analysis
Scientometric analysis allows the use of study data to analyze the structure and progress of the scientific research in that domain [64]. It often utilizes tools such as Visualization of Similarities (VOSviewer) and Biblioshiny to make appealing visualizations that enable researchers to spot thematic clusters. This allows researchers to comprehend how these themes may change over time. It also complements systematic reviews in the identification of research gaps, opportunities, and strengths in the scientific landscape by providing an extensive review of the literature.
3. Results
3.1. Selection of Studies
Figure 3 shows the PRISMA framework, which illustrates a structured and systematic literature selection and screening process. The framework starts with the retrieval of studies from three databases, i.e., Scopus (n = 1528), Web of Science (n = 1152), and GreenFILE (n = 271). The first screening phase involves the application of inclusion and exclusion criteria for each database, and 549 papers were removed based on the open-access criteria, including 136 non-English papers, 231 non-article and non-conference papers, and 112 studies published before 2015. The remaining 1923 papers were fed into bibliometric software to yield bibliometric results for further screening.
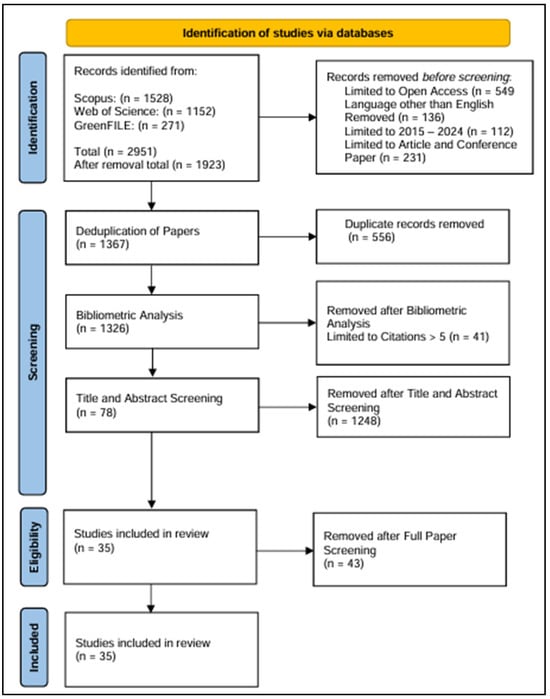
Figure 3.
PRISMA framework showing the screening and eligibility criteria.
In the second step, Zotero v. 7.0.11 was used to remove 556 articles after the deduplication process. To prioritize influential studies, studies with fewer than five citations are removed. The authors removed more papers based on the keyword analysis and based on the full-text review. Finally, 35 papers were selected for the full review process following a total agreement between both authors.
3.2. Mann–Kendall Test
The Mann–Kendall test is a statistical tool leveraged to examine trends in time-series data [65]. This test helps us realize whether the publication trend in the carbon footprint theme is increasing, decreasing, or stable over time, even with irregular datasets. This statistical analysis calculates statistical parameters such as z-value and p-value and evaluates those values to come to a statistical conclusion [66]. Table 2 shows the trend, z-value, p-value, and significance obtained after the Mann–Kendall test.
Table 2.
Trend, z-value, p-value, and significance of each database.
The Mann–Kendall test was applied to all three databases and showed a significantly increasing trend in publication.
Scopus: The z-value obtained from the analysis is greater than 5, which indicates a positive trend and statistically concludes that the number of publications is significantly increasing. This demonstrates that the domain of carbon tracking technologies and methods is growing in interest within the Scopus database.
Web of Science: The Web of Science also shows similar growth, indicating an ongoing rise in articles on this topic. The low p-value for this database also indicates the growing scholarly interest.
GreenFILE: Even though the publication base of GreenFILE is smaller compared to Scopus and Web of Science, the z-value and p-value are both significant, which indicates the relevance.
Figure 4 illustrates the trend of publication across Scopus, Web of Science, and GreenFILE from 2015 to 2024. For the period 2025–2029, the publication trends are forecasted using the linear regression model. The linear regression model is chosen for its simple yet effective approach in predicting future publication outputs. The forecast suggests the continued growth of all three databases as seen from the colored section of the figure. In the Scopus database, the number of publications is predicted to reach 400 by 2029. Similarly, in Web of Science and GreenFile, the number of publications is expected to reach 340 and 100, respectively.
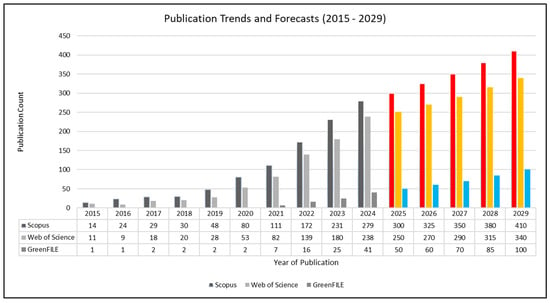
Figure 4.
Publication trends in publications of articles related to carbon footprint tracking across Scopus, Web of Science, and GreenFILE. Colored bars show the forecast for the period 2025 to 2029.
3.3. Hurst Exponent Test
The Hurst exponent method is another statistical tool that serves to evaluate the long-term memory of time-series data. It examines whether a dataset inhibits mean-reverting, persistent trends, or random walk based on the calculation of a statistical parameter called the Hurst exponent. An H-value of 0.5 or above suggests that there is a Brownian motion (purely random process) with no persistence. A value of H greater than 0.5 indicates persistence, i.e., the current trend is likely to continue. Likewise, if the H value is lower than 0.5, it demonstrates an anti-persistence trend; i.e., the trend is likely to increase for a certain period and then decrease in the next period. Table 3 shows the Hurst exponent values and their significance for each of the three databases.
Table 3.
Hurst exponent values and their corresponding behavior.
3.4. Journal Source Analysis
The objective of the journal source analysis is to comprehend the distribution of articles over different journals and conferences and to rank the journals based on their contribution to the research domain. Figure 5 illustrates the concentration of articles across different journals and conferences in the review dataset, combining all three databases. For illustration purposes, only journals with more than five published articles are included in Figure 5.
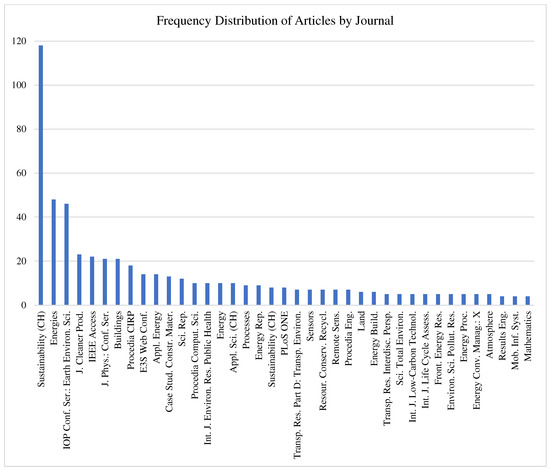
Figure 5.
Frequency distribution of articles across journals.
3.5. Bradford Zone Analysis
Bradford’s zone analysis is a fundamental concept in bibliometrics that aids in identifying the core journals in a field of research.
3.5.1. Bradford’s Law of Scattering
Bradford’s law of scattering is a bibliometric theory that describes how the articles are dispersed across journals in a certain field of study. It gives a quantifiable relationship between the articles and the journals [67]. Samuel Bradford first explained this principle by ranking the journals in terms of decreasing productivity and dividing the articles into three different but approximately equal zones, namely Zone 1, Zone 2, and Zone 3. Zone 1 (core zone) contains the most productive journals, thus contributing to the large number of articles. Zones 2 and 3 are the subsequent zones that contain a greater number of journals but fewer articles per journal. Table 4 shows the journals and documents distribution across the Bradford zone.
Table 4.
Distribution of journals and documents over the Bradford zone.
In total, 13 journals formed the core zone, followed by 99 journals in the secondary zone and 416 journals in the peripheral zone. For a Bradford zone, the number of sources in each zone should roughly form a geometric series in the form 1: n: n2. In this case, this relationship can be presented as:
(13, 99, 416) = (1, n, n2)
N = [(99/13) + (416/99)/(2)]
N = 5.909, where ‘n’ is called Bradford’s multiplier.
Hence,
1 × 13: 13 × 5.909: 13 × (5.909) 2: 13: 76.82: 453.91
Error Percentage: (543.73 − 588)/588 × 100 = 7.53%
The percentage error of 7.53% is relatively low and indicates that the observed values fit the curve of Bradford’s law of scattering. Hence, it validates the identification of Zone 1 as the core journals, Zone 2 as secondary journals, and Zone 3 as peripheral journals.
3.5.2. Verification of Bradford’s Law: Leimkuhler’s Model
Leimkuhler’s model is a mathematical framework that explains the unequal distribution of papers and provides the generalization and refinement of Bradford’s law. It uses empirical relations to calculate Bradford’s multiplier and determine the number of journals in each zone.
The empirical relation to calculate Bradford’s multiplier (k) is,
where p = 3 is the number of zones.
K = (ey × ym)1/p,
ym = 455 is the number of articles in Zone 1.
ey = 1.781 is Euler’s constant.
The nucleus zone was formulated using the verbal formulation defined by Bradford as
where ‘T’ is the total number of journals.
This value was used to find the number of journals in each zone.
Zone 1: ro = 6.05
Zone 2: r1 = 6.05 × k = 6.05 × 9.32 = 56.386
Zone 3: r2 = 6.05 × 9.32 × 9.32 =525.518
Now, Bradford’s law can be fitted as:
(1, n, n2) = (6.05, 56.386, 525.518)
Error Percentage: (588–587.9)/(588) = 1.7%
The negligible error percentage of 1.7% suggested that Leimkulher’s model adequately explains the distribution of articles with low deviation from the observed data.
3.6. Keyword Analysis
Keyword analysis serves to identify emerging concepts, focal areas, and trends. This analysis helps to extract keywords from the corpus of papers and provides insights into current emerging trends, frequently occurring terms, and related concentrations.
3.6.1. Co-Occurrence Analysis
Figure 6 below demonstrates the co-occurrence network of keywords produced by bibliometric analysis. Each node represents one keyword that occurred in the articles, and the size of the node indicates the frequency of occurrence of the keyword. The links joining the two keywords signify the connection between keywords, and the thickness of the line reflects how strong the links are. The analysis was carried out in VOSviewer software. The minimum number of occurrences of keywords is set to 10. Out of 8047 keywords, 218 meet the threshold.
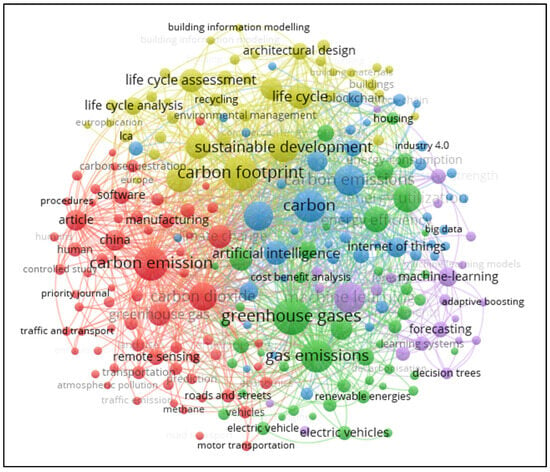
Figure 6.
Co-occurrence network of keywords.
Carbon emissions, greenhouse gases, carbon footprint, and sustainable development nodes are the bigger nodes and hence are the major areas of research in this domain. This visualization shows four different colored clusters. The green cluster represents topics like energy utilization, electric vehicles, and renewable energies. The red cluster has keywords such as carbon sequestration, transportation, and remote sensing that indicate mitigation strategies and environmental impact. Blue clusters have keywords like big data, decision support systems, and blockchain, which suggests an increasing research trend in carbon footprint tracking and optimization. Likewise, yellow clusters include subjects like the construction industry and life cycle assessment, which reflect assessment methods for carbon emissions. Furthermore, keywords such as electric vehicles, machine learning, and blockchain suggest the growth of scholarly interest in these topics connected to energy efficiency.
3.6.2. Trend Map
Figure 7 illustrates the evolution of trend terms from 2016 to 2024 based on their frequency of occurrence. Each horizontal line represents a trend, and the radius of the bubble denotes its occurrence.
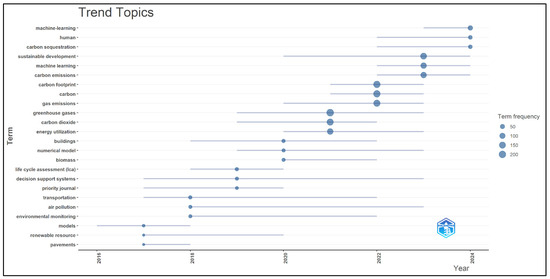
Figure 7.
Trend map showcasing the key research topic related to carbon footprint tracking.
- (I)
- Emerging Trend
In recent years, it has been seen that topics like carbon sequestration, artificial intelligence, machine learning, and numerical methods have gathered momentum, especially between 2020 and 2024. This suggests the increasing trend in the use of artificial intelligence and machine learning techniques in carbon tracking systems and emissions reduction.
- (II)
- Established Topics
Across the period of 2016 to 2024, main subject areas such as greenhouse gases, carbon footprint, and sustainable development dominate the trend chart. These are the fundamental concepts that industries stress to align themselves with international environmental standards.
- (III)
- Newer Topics
Topics emerging after 2021 include decision support systems, LCA, carbon dioxide management, and machine learning. These reflect that industries are shifting towards lifecycle-based carbon evaluations and structured decision-making tools.
3.7. Country Analysis
This bibliometric analysis shows the leading countries in research in this domain. Figure 8 shows the distribution of citations across the top 10 most-cited countries.
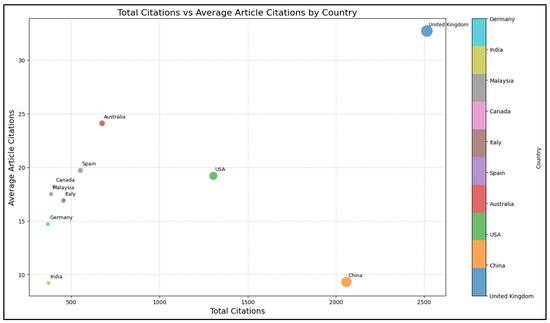
Figure 8.
Bubble chart of country-wise total and average citations.
This analysis provides us with insights into the global research efforts in the field of carbon footprint tracking. The X-axis and Y-axis show total and average citations, respectively. The United Kingdom stands as a top contributor, exhibiting its impact in the global research environment with the most citations, as shown in the far-right corner of the figure. Countries that lie higher up in the bubble chart (the United Kingdom and Australia) have high-quality papers based on their citations received. Other countries such as China, the USA, and Spain also reflect their high concentration in cutting-edge research in the advancement of this field. Though China has a higher total citation count, the lower average citations in papers could be due to collaboration networks and social familiarity, where Western researchers tend to cite papers from their regions. Likewise, Australia has a lower total citation but with relatively higher average citations. Regarding the papers in terms of average article citations, Colombia ranks first with 39 citations per article, followed by Slovenia, Qatar, Rwanda, and so on.
3.8. Author Analysis
To assess and identify the most impactful authors in this field, we conducted an author analysis using the VOSviewer software. Table 5 shows the top 10 most influential authors on carbon footprint research.
Table 5.
Key metrics of the most impactful authors in carbon footprint research.
The table presents the ranking of authors based on key indicators such as h_index, g_index, m_index, total citations (TC), number of publications (NP), and publication year (PY). Li X emerges as the most impactful author with the highest h_index of 7 and 143 citations in nine papers since 2017. Liu Y also has a strong presence with the highest g_index of 12 and 12 publications gathering 306 citations since 2016. Similarly, in terms of consistent contributions, Li J stands tall with 17 publications since 2016, maintaining the g-index of 13. Overall, this analysis shows the mix of established, new, and seasonal authors.
4. Comprehensive Analysis
After further screening of articles preceded by bibliometric and scientometric analysis, 35 papers were selected for the final comprehensive review process. Table 6 summarizes the selected papers in terms of the method used, key objective, main findings, and the technology used in the carbon footprint analysis and tracking.
Table 6.
Summary of included articles.
Carbon footprint analysis and monitoring have undergone significant developments from simple assessment of emissions to complex and sophisticated cutting-edge methods. Initially, the methods included more manual calculations using the simplified and fundamental frameworks, which offered limited information on the sources of emissions and methods to reduce them. Over time, there have been advancements in technological approaches and techniques such as LCA, AI, digital technologies, ML, and IoT, which have allowed us to track and monitor emissions precisely and accurately. The way industries are assessing and tracking their carbon footprints has transformed completely with the integration of blockchain technology and the Internet of Things. These advanced technologies not only improve tracking but also encourage industries to follow data-driven approaches. This section groups the included articles in terms of the methods used in the tracking and analysis of carbon emissions and highlights the key applications and advancements. Figure 9 shows the different footprint-tracking technologies and their key elements.
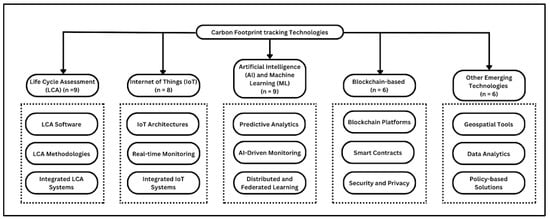
Figure 9.
Key elements under each technological classification based on carbon tracking.
Similarly, Figure 10 shows the year-wise distribution of selected papers based on the technologies leveraged in tracking and monitoring carbon emissions.
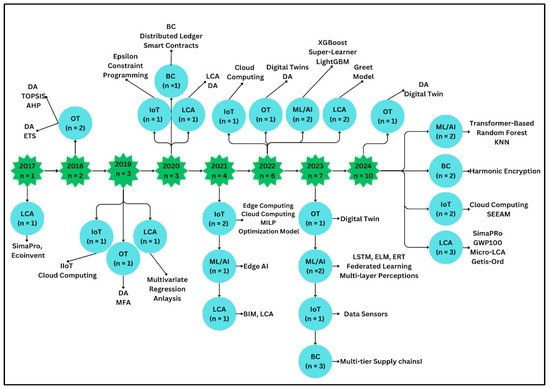
Figure 10.
Timeline of articles distribution with used methodologies. OT: Other Technologies; LCA: Life Cycle Assessment; IoT: Internet of Things; ML: Machine Learning; AI: Artificial Intelligence; BC: Blockchain; DA: Data Analytics; TOPSIS: Technique for Order Preference by Similarity to Ideal Solution; AHP: Analytical Hierarchy Process; ETS: Error, Trend, and Seasonality; ERT: Extremely Randomized Trees; IIoT: Industrial Internet of Things; MFA: Multi-Factor Authentication; BIM: Building Information Modeling; LightGBM: Light Gradient-Boosting Machine; MILP: Multi-Integer Linear Programming; BIM: Building Information Modeling; LSTM: Long Short-Term Memory; ELM: Enterprise Learning Management System; KNN: K-Nearest Neighbors; GWP: Global Warming Potential; SEEAM: System Engineering Experiment and Modeling.
4.1. Life Cycle Assessment (LCA)
Life cycle assessment is a structured and systematic approach to assessing the environmental impact of a product, starting from the raw materials to the end product. This method is highly regarded in industries as it can record the emissions at every stage of a product's life cycle. Many of the articles mentioned above leveraged this approach for emissions tracking.
- Eco-Concrete Based on Hemp: In 2024, Isopescu et al. applied the LCA approach by leveraging the SimaPro 9.5 and standards ISO 14040 and ISO 14044 to estimate the carbon footprint and reduction possibility and showed the negative footprint value of −20.3168 kgCO2 [101]. They emphasized this is due to recycling and CO2 sequestration.
- High-Concentration Photo-Voltaics (HCPV): In 2017, Hu et al. used LCA to assess the carbon emissions of HCPV systems [98]. They divided the HCPV systems into stages, categories, items, and inventory data. They used the SimaPRo 8.02 software, integrating INER, Ecoinvent, and CFCP data sources, and found out that material input and manufacturing stages account for 93% of the total carbon emissions with an Energy Payback Time (EPBT) of 2.61 years.
- Residential Buildings: Kurian et al. 2021 performed the life cycle analysis of a residential building using the Building Information Modeling (BIM) LCA approach [97]. They divided the system boundaries into construction, transportation, operational, and destruction stages. They used the software One Click LCA for software computation and used the databases GaBI and Ecoinvent for manual calculation of the carbon footprints. They highlighted that cement is the highest contributor to emissions during the operational stage (83.42%), followed by construction stage emissions (66.6%).
- Shoe Manufacturing: Serweta et al. in 2019 used the LCA approach to calculate the CF in footwear manufacturing [99]. They divided the manufacturing process into eight different stages and used the following empirical relation for each stage:
Carbon Footprint = Σₖ=1ˡ (Σi=1m pi + Σj=1n wj)
where k = corresponding stage number,
pi = Greenhouse gas emissions for the ith process
wj = volume of greenhouse gases for the jth item of the shoe for the duration of ti
The greenhouse gas emissions at each stage were calculated using the SimaPro software. They also used a multivariate regression analysis to correlate the emissions at various stages to the total carbon footprint. The study found manufacturing (74.5%) as the highest and assembly lines (<5%) as the lowest contributors to the CF, respectively.
- Electric and Hybrid Buses: In 2022, Garcia, et al. conducted an LCA study on electric and hybrid buses to evaluate the carbon footprint (CF) at various stages. The emission values were evaluated by calculating the weight of each part and multiplying it by the corresponding emission value in the GREET database [96]. The study found 40% less CO2 emissions in hybrid buses and 60% less CO2 emissions in electric buses as compared to diesel.
Similarly, Gupta et al. in 2024 also used the LCA method to calculate the CF in the production phase, transportation phase, use phase, and end-of-life phase of computing systems and leveraged the standard approach of using the life cycle inventory (LCI) and emission factors [95].
4.2. Blockchain-Based Carbon Tracking
Blockchain technology has become a vital tool in enhancing the accuracy, security, and visibility of carbon footprint data.
- Transparent Carbon Tracking: In 2023, Lee et al. implemented a blockchain-based system for carbon tracking in multi-tier supply chain systems [91]. This proved to improve the traceability data immutability and the transfer of data across the supply chains.
- Carbon Capture and Storage (CCS): In 2023, Aristia et al. proposed a blockchain-based architecture involving various stakeholders such as industrial plants, technical experts, government, the public, and other interested parties to incorporate accountability and transparency in industries [92].
- Security Accounting of Emissions: He et al. in 2024 proposed a blockchain-based carbon emission security accounting scheme (BCESAS), which is a cross-chain carbon emission accounting model, and tested the model using three blockchains theoretically, as well as experimentally to prove the privacy, correctness, and integrity of BCESAS [93].
Similarly, Nechetnyy et al. also performed a blockchain-based analysis in CF tracking and found a reduction in carbon emissions by 15% (rail), 12% (sea), 13% (road), and 10% (air) [94].
4.3. ML and AI
Machine learning and artificial intelligence can be leveraged for precise data collection, analysis, predictive forecasting, emissions modeling, and visualization of carbon emissions.
- Chemical Industry: In 2024, Zhang et al. proposed a transformer-based framework named FineChem 2 to subdue the limitations of pre-LCA tools in the evaluation of carbon footprints in chemicals [88]. They took 100+ sets of organic chemicals for the experimentation, overcoming other tools by 55% in terms of predictive accuracy.
- Construction Industry: Tavares et al. in 2022, used k-nearest neighbors and random forest ML models to optimize the composition in ultra-high-performance concrete (UHPC) and found them to be more eco-efficient with reduced carbon footprints [86]. They also leveraged the ML model to estimate the global warming potential (GWP) of different concrete mixtures.
- Transportation Industry: In 2022, Wei et al. used super-learner models based on XGBoost, LightGBM, RF, CarBoost, and MOVES—a method for real-time monitoring of CO2 and NOx in diesel trucks [91]. They achieved high accuracy of prediction (R2 = 0.94 and R2 = 0.84) on validation tests.
Similarly, in 2023, Savazzi and his team evaluated the carbon footprint of federated, centralized, and decentralized learning [84]. The study analyzed the real datasets using a test bed with IoT devices. They executed real-time monitoring and assessed the carbon emissions for two industry-relevant 5G verticals. Likewise, Aryai et al. in 2023 developed a model to evaluate the short-term emissions with methods such as ERT, PSO, ELM, and data analytics [85].
4.4. Internet of Things: Real-Time Monitoring
The Internet of Things is another approach that can be leveraged to perform carbon footprint tracking and real monitoring of emissions using the interconnection between devices, sensors, and data analytics.
- Urban Planning: Zhang and his team in 2021 designed a smart carbon tracking system using IoT sensors and cloud architecture in designing smart, small cities [74]. They used the smart carbon monitoring platform (SCMP) to integrate long-term data, such as GDP-based energy consumption, and short-term data, such as population density, energy usage, and traffic congestion, to find the predicted emissions at street and block levels using correlation coefficients.
- Concrete Manufacturing: In 2022, Kim and the team used Arduino-based sensors and IoT-enabled carbon monitoring in real time using a testbed setup in the Remicon manufacturing process at each stage [75].
4.5. Other Technologies
This study also reviewed several articles that showed the integration of different approaches to create a comprehensive carbon footprint tracking framework.
- Implications of Land Use in Carbon Emissions: Luo et al. [103] discussed how changes in land utilization affect the quantification of carbon emissions. They performed a bibliometric analysis; collected carbon emissions data from major Chinese cities, land cover change (LULC) data, and land use; and standardized the time series from 2001 to 2002. They also leveraged statistical analysis methods such as calculating the coefficient of variation (CV) and correlation analysis between carbon emissions and intensity indicators such as population, gross domestic product (GDP), and built area. Their empirical research found that land use planning, carbon reduction tools, and urban form control can effectively decrease the carbon emission intensity. Likewise, Ahmad et al. [104] quantified carbon emissions from deforestation and forest degradation in the temperate region of the Hindukush Himalaya and provided a detailed understanding of carbon dynamics in that region. They identified changes in land use over the study period using satellite imagery, applied allometric equations to estimate carbon stocks before and after the changes in land use, and estimated 206 kMg C (kilomicrograms of Carbon) from deforestation, 1757 kMg C from degradation, and 221 kMg C from wood harvesting. Cai et al. [105] developed a 30 m high-resolution carbon emission dataset for the Greater Bay Area (GBA). They leveraged the Normalized Difference Vegetation Index (NDVI) to quantify emissions from vegetated areas and to downscale carbon emissions data. They also performed K-means clustering and spatial autocorrelation analyses to identify high-density carbon emission zones. Cai et al. [106] used the Low-Emissions Analysis Platform (LEAP) model and scenario simulation, such as baseline and CCUS (Carbon Capture, Utilization, and Storage), to explore different ways to achieve carbon neutrality and emissions peaks.
- Battery Production: In 2024, Rietdorf et al. integrated digital twins (DTs), life cycle assessment (LCA), and a user interface for real-time CF monitoring [89].
- Data Centers: In 2022, Cao et al. performed a detailed survey and demonstrated a roadmap to evaluate the carbon footprint of data centers at different granular levels of time. They employed carbon usage effectiveness (CUE) and power usage effectiveness (PUE) metrics to estimate the CO2 emissions [80].
- Residential Carbon Footprint: In 2023, Arsiwala and her team leveraged IoT for real-time monitoring of carbon emissions, integrating the Azure Digital Twin (ADT) and Stochastic Gradient Descent (SGD) machine learning algorithms. The study revealed that the use of digital twins in CF tracking and monitoring enhances the accuracy of prediction in building management systems [69].
Table 7 presents the mapping of key tools and technologies to some common industrial sectors in CFT.
Table 7.
Mapping of technologies and their industrial use cases.
Evidently from the table, life cycle assessment remains the most widely applied method, mostly in industries such as concrete, brick manufacturing, footwear manufacturing, battery industries, and data centers. Having an established framework and long history makes it a reliable tool, particularly in applying the cradle-to-grave assessment. Similarly, ML and AI are increasingly accepted and adopted in the construction, transportation, and chemical industries. Much exploration of the IoT is performed by concrete industries and urban planning, in which real-time data collection provides significant chances for emissions reductions. Blockchain applications have just started and are emerging for their promising application in improving traceability and transparency in carbon accounting. Overall, this mapping table evidences the growing research interest in ML, AI, IoT, and blockchain as tools for carbon management in the future.
4.6. Future Research Directions
Several areas of future research have been identified from the bibliometric and scientometric analysis of tools and technologies for carbon footprint tracking. From the analysis of emerging keywords and research trends, a positive trend and growing research interest are observed in fields such as the Internet of Things, machine learning, and data analytics. Scholars should therefore research the integration of such technologies more closely in estimating carbon footprints. Keyword analysis opened new research areas to investigate how topics such as ‘predictive analytics’, ‘carbon auditing’, and ‘life cycle assessment’ can be integrated to develop tracking frameworks. The bibliometric analysis also illustrated the opportunities for exploration in carbon footprint management in developing countries, as seen from the research distribution based on geography. This study also highlighted the potential for cooperation between policymakers, industry people, and academic institutions in the adoption of these different technologies.
Allen et al. [98] showed a footprint evaluation based on Taiwan only and suggested that the carbon frameworks should test the framework’s performance in varying climatic and geographical conditions. They also outlined limited research on the economic and social impacts of carbon reduction, such as integrating the social cost of carbon in the business plan. There are also concerns about data breaches and illegal access in blockchain-based carbon tracking solutions, and it is necessary to develop novel means of privacy preservation such as dual chain, trusted execution environments (TEEs), and zero-knowledge proofs (ZKPs) [91,92]. Also, blockchain encounters scalability issues to deal with large amounts of data, and its integration into carbon auditing systems such as ERP and LCA software is complex [94,95]. Hence, there could be more exploration of interoperability cross-chains and investigation of low-energy consensus tools such as federated blockchains.
Luo et al. (2024) [103] pointed out the sheer need for research required to generate more complex models and strategies, such as advancement in remote sensing and GIS technologies and exploration of AI and ML, to reduce carbon emissions through land use planning and management. Ahmad et al. (2018) [104] indicated the significance of developing advanced monitoring systems to track the changes in land and forest cover. They also suggested the utilization of advanced technologies such as GIS and remote sensing for more accurate data collection.
There could be a linking up of life cycle assessment (LCA) methods with real-time production processes that can accommodate real-time changes in operations and supply chains. There could also be more development specific to industries such as agriculture, electronics, and pharmaceuticals and AI-driven LCA methods with more user-friendly interfaces. In terms of the Internet of Things (IoT), IoT sensors could be deployed in high numbers to track live emissions across manufacturing facilities, logistics, and supply chains. IoT-based carbon footprint reduction solutions can be enabled to optimize energy usage and lower carbon emissions through predictive maintenance. Moreover, AI and different machine learning models can be leveraged to automate complex footprint calculations, identify strange patterns in emissions data, accommodate company sustainability strategies, detect carbon hotspots, and study AI-aided carbon trading using smart contracts.
Further studies should be carried out to help small and mid-sized companies acquire cost-effective carbon tracking tools. There have been some studies on the integration of emerging techniques and tools such as machine learning, artificial intelligence, and blockchain in the development of tracking frameworks; however, more study on the development of scalable frameworks and standardized protocols is necessary for uniform carbon accounting and supporting more stakeholders and huge datasets. There could also be more research investigating the synergy between carbon tracking systems and models of the circular economy
5. Limitations
First, relevant research published in non-English or regional journals may have been underrepresented, as the literature was highly based on the English language and indexed publications. Second, the citation patterns are often influenced by collaboration networks and visibility; hence, citation counts as a measure of impact may not fully reflect the actual quality of the research. Third, recently published papers may have lower citation counts leading to temporal bias in the analysis.
6. Conclusions
This study offers a comprehensive examination of the latest state of carbon footprint tracking, highlighting key authors, technological and methodological advancements, and challenges in a range of industries. The bibliometric exploration in this study highlights key pioneers, key countries, institutional contributors, publication trends, collaborative research networks, emerging research domains, methodological gaps, journal contributions, and trends in technological integration. The z-value and p-values from the Mann–Kendall test showed the increasing trend of publication and scholarly interest in this domain. The Hurst exponent test confirmed Brownian motion and suggested that the current publication trend is likely to continue.
The study highlights the progress made in the exploration of IoT, LCA, AI, ML, blockchain, data analytics, and other technologies to enhance precision, accuracy, and efficient monitoring of carbon emissions. Each domain has its specialized tools and applications:
- (a)
- Life Cycle Assessment: With the integration of LCA software and refined methodologies, this finds its extensive use in construction, electronics, and manufacturing industries.
- (b)
- ML/AI: Rapidly gaining more attention for its dynamic, predictive, and real-time monitoring and effective tracking solutions, especially in the chemical and transportation industries.
- (c)
- Internet of Things: Even with integration barriers related to standardization and data management, IoT’s role is rising mainly in concrete industries.
- (d)
- Blockchain: Rising as a promising technology in secure carbon accounting, with most applications in supply chain systems and industrial plants.
- (e)
- Other Technologies: Several other tools, such as advanced data analytics and geospatial tools, are emerging, highlighting the evolution toward efficient carbon management.
Most of the studies reviewed in this study showed key areas that are not addressed specifically, such as:
- (a)
- The lack of industry-wide standard methodologies for carbon footprint monitoring.
- (b)
- Challenges in the integration of AI and blockchain, such as a higher risk of data breaches and illegal access.
- (c)
- Challenges in incorporating life cycle assessment (LCA) with real-time tracking of dynamic emissions.
This highlights the need for collaboration between stakeholders such as policymakers, industry practitioners, and academia to develop strong frameworks that guarantee security, accuracy, and uniformity in reporting carbon emissions. In addition, it also emphasizes that the inclusion of circular economic concepts and socio-economic factors will be essential in creating sustainable tools for footprint management. Hence, our review study provides a thorough understanding of the current state of carbon footprint tracking and encourages researchers and industry practitioners to integrate secure, standardized, and real-time digital solutions and regulatory compliance methods to enhance carbon footprint management.
Supplementary Materials
The following supporting information can be downloaded at: https://www.mdpi.com/article/10.3390/su17094205/s1, File S1: Search string.
Author Contributions
The original manuscript was drafted by N.A., while H.L. and B.G. worked on editing and reviewing it. All authors have read and agreed to the published version of the manuscript.
Funding
This study did not receive funding from external sources.
Data Availability Statement
All data is contained within this paper.
Conflicts of Interest
The authors have no conflicts of interest to declare.
References
- Dwivedi, Y.K.; Hughes, L.; Kar, A.K.; Baabdullah, A.M.; Grover, P.; Abbas, R.; Andreini, D.; Abumoghli, I.; Barlette, Y.; Bunker, D.; et al. Climate change and COP26: Are digital technologies and information management part of the problem or the solution? An editorial reflection and call to action. Int. J. Inf. Manag. 2022, 63, 102456. [Google Scholar] [CrossRef]
- Omer, A.M. Energy, environment and sustainable development. Renew. Sustain. Energy Rev. 2008, 12, 2265–2300. [Google Scholar] [CrossRef]
- Gomez-Echeverri, L. Climate and development: Enhancing impact through stronger linkages in the implementation of the Paris Agreement and the Sustainable Development Goals (SDGs). Philos. Trans. R. Soc. A Math. Phys. Eng. Sci. 2018, 376, 20160444. [Google Scholar] [CrossRef] [PubMed]
- Dzebo, A.; Janetschek, H.; Brandi, C.; Iacobuta, G. Connections between the Paris Agreement and the 2030 Agenda: The Case for Policy Coherence. 2019. Available online: https://www.sei.org/wp-content/uploads/2019/08/connections-between-the-paris-agreement-and-the-2030-agenda.pdf (accessed on 12 December 2024).
- Johnsson, F.; Karlsson, I.; Rootzén, J.; Ahlbäck, A.; Gustavsson, M. The framing of a sustainable development goals assessment in decarbonizing the construction industry—Avoiding ‘Greenwashing’. Renew. Sustain. Energy Rev. 2020, 131, 110029. [Google Scholar] [CrossRef]
- ISO 14064; International Standard for GHG Emissions Inventories and Verification. Jay Wintergreen and Tod Delaney First Environment, Inc.: Boonton, NJ, USA, 2007. Available online: https://gaftp.epa.gov/AIR/nei/ei_conference/EI16/session13/wintergreen.pdf (accessed on 12 December 2024).
- Weisser, D. A guide to life-cycle greenhouse gas (GHG) emissions from electric supply technologies. Energy 2007, 32, 1543–1559. [Google Scholar] [CrossRef]
- Agbelusi, J.; Arowosegbe, O.; Alomaja, O.; Odunfa, O.; Ballali, C. Strategies for minimizing carbon footprint in the agricultural supply chain: Leveraging sustainable practices and emerging technologies. World J. Adv. Res. Rev. 2024, 2024, 2625–2646. [Google Scholar] [CrossRef]
- Hertwich, E.G.; Wood, R. The growing importance of scope 3 greenhouse gas emissions from industry. Environ. Res. Lett. 2018, 13, 104013. [Google Scholar] [CrossRef]
- Kim, D.; Kim, K.-T.; Park, Y.-K. A Comparative Study on the Reduction Effect in Greenhouse Gas Emissions between the Combined Heat and Power Plant and Boiler. Sustainability 2020, 12, 5144. [Google Scholar] [CrossRef]
- Nordenstam, L.; Ilic, D.D.; Ödlund, L. Corporate greenhouse gas inventories, guarantees of origin and combined heat and power production—Analysis of impacts on total carbon dioxide emissions. J. Clean. Prod. 2018, 186, 203–214. [Google Scholar] [CrossRef]
- Dragomir, V.D. The Disclosure of Industrial Greenhouse Gas emissions: A Critical Assessment of Corporate Sustainability Reports. J. Clean. Prod. 2012, 29–30, 222–237. [Google Scholar] [CrossRef]
- Brander, M.; Gillenwater, M.; Ascui, F. Creative accounting: A critical perspective on the market-based method for reporting purchased electricity (scope 2) emissions. Energy Policy 2018, 112, 29–33. [Google Scholar] [CrossRef]
- Wiedmann, T.; Chen, G.; Owen, A.; Lenzen, M.; Doust, M.; Barrett, J.; Steele, K. Three-scope carbon emission inventories of global cities. J. Ind. Ecol. 2020, 25, 735–750. [Google Scholar] [CrossRef]
- Onat, N.C.; Kucukvar, M.; Tatari, O. Scope-based carbon footprint analysis of U.S. residential and commercial buildings: An input-output hybrid life cycle assessment approach. Build. Environ. 2014, 72, 53–62. [Google Scholar] [CrossRef]
- Matthews, H.D.; Wynes, S. Current global efforts are insufficient to limit warming to 1.5 °C. Science 2022, 376, 1404–1409. [Google Scholar] [CrossRef]
- Kriegler, E.; Luderer, G.; Bauer, N.; Baumstark, L.; Fujimori, S.; Popp, A.; Rogelj, J.; Strefler, J.; van Vuuren, D.P. Pathways limiting warming to 1.5 °C: A tale of turning around in no time? Philos. Trans. R. Soc. A Math. Phys. Eng. Sci. 2018, 376, 20160457. [Google Scholar] [CrossRef]
- IPCC. Climate Change 2022: Mitigation of Climate Change; IPCC: Geneva, Switzerland, 2022; Available online: https://www.ipcc.ch/report/ar6/wg3/ (accessed on 18 December 2024).
- Akhtar, I.; Kirmani, S.; Jameel, M.; Alam, F. Feasibility Analysis of Solar Technology Implementation in Restructured Power Sector With Reduced Carbon Footprints. IEEE Access 2021, 9, 30306–30320. [Google Scholar] [CrossRef]
- Xie, J.; Fu, J.; Liu, S.; Hwang, W. Assessments of carbon footprint and energy analysis of three wind farms. J. Clean. Prod. 2020, 254, 120159. [Google Scholar] [CrossRef]
- Ball, P.J. A Review of Geothermal Technologies and Their Role in Reducing Greenhouse Gas Emissions in the USA. J. Energy Resour. Technol. 2020, 143, 1–47. [Google Scholar] [CrossRef]
- Idroes, G.M.; Syahnur, S.; Majid, A.; Idroes, R.; Kusumo, F.; Hardi, I. Unveiling the Carbon Footprint: Biomass vs. Geotherm. Energy Indonesia. Ekon. J. Econ. 2023, 1, 10–18. [Google Scholar] [CrossRef]
- Wang, J.; Chen, X.; Liu, Z.; Frans, V.F.; Xu, Z.; Qiu, X.; Xu, F.; Li, Y. Assessing the water and carbon footprint of hydropower stations at a national scale. Sci. Total Environ. 2019, 676, 595–612. [Google Scholar] [CrossRef]
- Bello, M.O.; Solarin, S.A.; Yen, Y.Y. The impact of electricity consumption on CO2 emission, carbon footprint, water footprint and ecological footprint: The role of hydropower in an emerging economy. J. Environ. Manag. 2018, 219, 218–230. [Google Scholar] [CrossRef] [PubMed]
- Adhikari, N.; Adhikari, N.; Poudel, S.K.; Gurung, S.; Subedi, S.; Bastakoti, D. Study on Effect of Flow Rate and Number of Blades on Sizing of Archimedes Screw Turbine. In Proceedings of the 11th IOE Graduate Conference, Pokhara, Nepal, 9–10 March 2022; Available online: http://conference.ioe.edu.np/ioegc11/papers/ioegc-11-024-11052.pdf (accessed on 17 February 2025).
- Xu, X.; Bi, R.; Song, M.; Dong, Y.; Jiao, Y.; Wang, B.; Xiong, Z. Organic substitutions enhanced soil carbon stabilization and reduced carbon footprint in a vegetable farm. Soil Tillage Res. 2023, 236, 105955. [Google Scholar] [CrossRef]
- Suresh, P.; Paul, A.; Kumar, B.A.; Ramalakshmi, D.; Dillibabu, S.P.; Boopathi, S. Strategies for Carbon Footprint Reduction in Advancing Sustainability in Manufacturing. In Environmental Applications of Carbon-Based Materials; Advances in Chemical and Materials Engineering Book Series; IGI Global: Hershey, PA, USA, 2024; pp. 317–350. [Google Scholar] [CrossRef]
- Liu, C.; Cutforth, H.; Chai, Q.; Gan, Y. Farming tactics to reduce the carbon footprint of crop cultivation in semiarid areas. A review. Agron. Sustain. Dev. 2016, 36, 1–16. [Google Scholar] [CrossRef]
- Scolaro, E.; Beligoj, M.; Estevez, M.P.; Alberti, L.; Renzi, M.; Mattetti, M. Electrification of Agricultural Machinery: A Review. IEEE Access 2021, 9, 164520–164541. [Google Scholar] [CrossRef]
- Knobloch, F.; Hanssen, S.V.; Lam, A.; Pollitt, H.; Salas, P.; Chewpreecha, U.; Huijbregts, M.A.J.; Mercure, J.-F. Net emission reductions from electric cars and heat pumps in 59 world regions over time. Nat. Sustain. 2020, 3, 437–447. [Google Scholar] [CrossRef]
- Chowdhury, N.I.; Gopalakrishnan, B.; Adhikari, N.; Li, H.; Liu, Z. Evaluating Electrification of Fossil-Fuel-Fired Boilers for Decarbonization Using Discrete-Event Simulation. Energies 2024, 17, 2882. [Google Scholar] [CrossRef]
- Xia, X.; Li, P.; Xia, Z.; Wu, R.; Cheng, Y. Life cycle carbon footprint of electric vehicles in different countries: A review. Sep. Purif. Technol. 2022, 301, 122063. [Google Scholar] [CrossRef]
- Kumar, S.; Tirlangi, S.; Kumar, A.; Imran, M.; Hp, J.S.P.; Koshariya, A.K.; Sathish, T.; Ubaidullah, M.; Ayub, R.; Reddy, V.R.M.; et al. A review on the contribution of nanotechnology for biofuel production from algal biomass: A bridge to the reduction of carbon footprint. Sustain. Energy Technol. Assess. 2023, 60, 103498. [Google Scholar] [CrossRef]
- Zamboni, A.; Murphy, R.J.; Woods, J.; Bezzo, F.; Shah, N. Biofuels carbon footprints: Whole-systems optimisation for GHG emissions reduction. Bioresour. Technol. 2011, 102, 7457–7465. [Google Scholar] [CrossRef]
- Colella, W.G.; Jacobson, M.Z.; Golden, D.M. Switching to a U.S. hydrogen fuel cell vehicle fleet: The resultant change in emissions, energy use, and greenhouse gases. J. Power Sources 2005, 150, 150–181. [Google Scholar] [CrossRef]
- Mills, E.; Jacobson, A. From carbon to light: A new framework for estimating greenhouse gas emissions reductions from replacing fuel-based lighting with LED systems. Energy Effic. 2011, 4, 523–546. [Google Scholar] [CrossRef]
- Yildiz, O.F.; Yilmaz, M.; Celik, A. Reduction of energy consumption and CO2 emissions of HVAC system in airport terminal buildings. Build. Environ. 2022, 208, 108632. [Google Scholar] [CrossRef]
- Sozer, H. Improving energy efficiency through the design of the building envelope. Build. Environ. 2010, 45, 2581–2593. [Google Scholar] [CrossRef]
- Seyedabadi, M.R.; Eicker, U.; Karimi, S. Plant selection for green roofs and their impact on carbon sequestration and the building carbon footprint. Environ. Chall. 2021, 4, 100119. [Google Scholar] [CrossRef]
- Franchetti, M.J.; Apul, D. Carbon Footprint Analysis. Google Books. 2025. Available online: https://books.google.com/books?hl=en&lr=&id=UIUmD75qyzUC&oi=fnd&pg=PP1&dq=traditional+carbon+footprint+tracking+using+spreadsheets&ots=vznHjENNiO&sig=QAn3UzX7muH8oUxpL2b9EMU3C_Q#v=onepage&q&f=false (accessed on 27 January 2025).
- Kendall, A. Time-adjusted Global Warming Potentials for LCA and Carbon Footprints. Int. J. Life Cycle Assess. 2012, 17, 1042–1049. [Google Scholar] [CrossRef]
- Rodrigo, M.N.N.; Perera, S.; Senaratne, S.; Jin, X. Potential Application of Blockchain Technology for Embodied Carbon Estimating in Construction Supply Chains. Buildings 2020, 10, 140. [Google Scholar] [CrossRef]
- Hammond, G.P.; Jones, C.I. Embodied energy and carbon in construction materials. Proc. Inst. Civ. Eng. Energy 2008, 161, 87–98. [Google Scholar] [CrossRef]
- Symons, K. Book Review: Embodied Carbon: The Inventory of Carbon and Energy (ICE). A BSRIA Guide; ICE Virtual Library: Online, 2011; Volume 164, p. 206. [Google Scholar] [CrossRef]
- Ecoinvent Database. ecoinvent. Available online: https://ecoinvent.org/database/ (accessed on 15 February 2025).
- AusLCI. 2023. Available online: https://www.auslci.com.au/ (accessed on 21 January 2025).
- Aoife. The GreenBook Updated with Great New Features | the Footprint Company. The Footprint Company, 4 July 2021. Available online: https://www.tsariley.com/service/the-greenbook/ (accessed on 27 January 2025).
- SimaPro | The World’s Leading LCA Software. SimaPro. Available online: https://simapro.com/ (accessed on 21 January 2025).
- GaBi (GaBi Education License)—LIFE-C. LIFE-C, 7 July 2023. Available online: https://life-c.eu/programs/gabi-gabi-education-license/ (accessed on 27 January 2025).
- Built Environment Carbon Database. Available online: https://www.becd.co.uk/ (accessed on 9 January 2025).
- Ramboll Launches Open Access Carbon Database for Buildings—Ramboll Group. 2024. Available online: https://www.ramboll.com/co2mpare (accessed on 27 January 2025).
- World’s fastest Building Life Cycle Assessment Software—One Click LCA. One Click LCA® Software. Available online: https://oneclicklca.com/ (accessed on 14 February 2025).
- EC3 Tool. Carbon Leadership Forum, 6 October 2021. Available online: https://carbonleadershipforum.org/ec3-tool/ (accessed on 19 February 2025).
- Free Embodied Carbon Calculator | One Click LCA. 2025. Available online: https://oneclicklca.com/resources/planetary (accessed on 27 January 2025).
- Download Our FREE Embodied Carbon Calculator | Mesh Energy. Available online: https://www.mesh-energy.com/resources/embodied-carbon-calculator-v2 (accessed on 28 December 2024).
- Mann, H.B. Nonparametric Tests Against Trend. Econometrica 1945, 13, 245. [Google Scholar] [CrossRef]
- Hurst, H.E. Long-term storage capacity of reservoirs. Trans. Am. Soc. Civ. Eng. 1951, 116, 770–799. [Google Scholar] [CrossRef]
- Page, M.J.; McKenzie, J.E.; Bossuyt, P.M.; Boutron, I.; Hoffmann, T.C.; Mulrow, C.D.; Shamseer, L.; Tetzlaff, J.M.; Akl, E.A.; Brennan, S.E.; et al. The PRISMA 2020 statement: An Updated Guideline for Reporting Systematic Reviews. Br. Med. J. 2021, 372, 71. [Google Scholar] [CrossRef]
- van Eck, N.J.; Waltman, L. Software survey: VOSviewer, a computer program for bibliometric mapping. Scientometrics 2010, 84, 523–538. [Google Scholar] [CrossRef]
- Aria, M.; Cuccurullo, C. bibliometrix: An R-tool for comprehensive science mapping analysis. J. Informetr. 2017, 11, 959–975. [Google Scholar] [CrossRef]
- McBurney, M.K.; Novak, P.L. What is bibliometrics and why should you care? In Proceedings of the IEEE International Professional Communication Conference, Shanghai, China, 20–24 May 2019. [Google Scholar] [CrossRef]
- Hasan, M.R.; Wuest, T. A Review of Sustainable Composites Supply Chains. IFIP Adv. Inf. Commun. Technol. 2022, 663, 448–455. [Google Scholar] [CrossRef]
- Delavari, V.; Shaban, E.; Janssen, M.; Hassanzadeh, A. Thematic mapping of cloud computing based on a systematic review: A tertiary study. J. Enterp. Inf. Manag. 2019, 33, 161–190. [Google Scholar] [CrossRef]
- Zhong, B.; Wu, H.; Li, H.; Sepasgozar, S.; Luo, H.; He, L. A scientometric analysis and critical review of construction related ontology research. Autom. Constr. 2019, 101, 17–31. [Google Scholar] [CrossRef]
- Design Trend Mann-Kendall. Available online: https://vsp.pnnl.gov/help/vsample/design_trend_mann_kendall.htm (accessed on 29 December 2024).
- Lundberg, J. Lifting the crown—Citation z-score. J. Informetr. 2007, 1, 145–154. [Google Scholar] [CrossRef]
- Bhargav, P.N.V.; Kishore, A.; Doraswamy, M. Application of Bradford’s Law of Scattering in the Field of Production Engineering Literature: A Bibliometric Analysis of Ph.D. Theses. Int. J. Res. Libr. Sci. 2020, 6, 24. [Google Scholar] [CrossRef]
- Lamas, P.F.; Lopes, S.I.; Caramés, T.M.F. Green IoT and Edge AI as Key Technological Enablers for a Sustainable Digital Transition towards a Smart Circular Economy: An Industry 5.0 Use Case. Sensors 2021, 21, 5745. [Google Scholar] [CrossRef]
- Alharbi, H.A.; Aldossary, M. Energy-Efficient Edge-Fog-Cloud Architecture for IoT-Based Smart Agriculture Environment. IEEE Access 2021, 9, 110480–110492. [Google Scholar] [CrossRef]
- Arsiwala, A.; Elghaish, F.; Zoher, M. Digital twin with Machine learning for predictive monitoring of CO2 equivalent from existing buildings. Energy Build. 2023, 284, 112851. [Google Scholar] [CrossRef]
- Patsavellas, J.; Salonitis, K. The Carbon Footprint of Manufacturing Digitalization: Critical literature review and future research agenda. Procedia CIRP 2019, 81, 1354–1359. [Google Scholar] [CrossRef]
- Ihoume, I.; Tadili, R.; Arbaoui, N.; Krabch, H. Design of a low-cost active and sustainable autonomous system for heating agricultural greenhouses: A case study on strawberry (Fragaria vulgaris) growth. Heliyon 2023, 9, e14582. [Google Scholar] [CrossRef]
- IRIE, H.; YAMADA, T. Decision support model for economical material carbon recovery and reduction by connecting supplier and disassembly part selections. J. Adv. Mech. Des. Syst. Manuf. 2020, 14, JAMDSM0024. [Google Scholar] [CrossRef]
- Zhang, H.; Zhang, J.; Wang, R.; Huang, Y.; Zhang, M.; Shang, X.; Gao, C. Smart carbon monitoring platform under IoT-Cloud architecture for small cities in B5G. Wirel. Netw. 2021, 30, 3837–3853. [Google Scholar] [CrossRef]
- Kim, B.; Jeong, J. Real-Time Low-Carbon Prediction in Ready-Mixed Concrete Production Process for Smart Manufacturing. Procedia Comput. Sci. 2022, 203, 205–212. [Google Scholar] [CrossRef]
- Xue, Z.; Zhu, W.; Li, L.; Jiang, C.; Yan, C.; Wang, Y.; Gao, J.; Luo, J. Carbon emissions assessment of cement mixing piles for soft loess improvement and carbon emission reduction using white mud-cement composite material. Case Stud. Constr. Mater. 2024, 21, e03397. [Google Scholar] [CrossRef]
- Li, Z.; Fei, J.; Du, Y.; Ong, K.-L.; Arisian, S. A near real-time carbon accounting framework for the decarbonization of maritime transport. Transp. Res. Part E Logist. Transp. Rev. 2024, 191, 103724. [Google Scholar] [CrossRef]
- Wan, Z.; el Makhloufi, A.; Chen, Y.; Tang, J. Decarbonizing the international shipping industry: Solutions and policy recommendations. Mar. Pollut. Bull. 2018, 126, 428–435. [Google Scholar] [CrossRef]
- Rashid, K.; Hameed, R.; Ahmad, H.A.; Razzaq, A.; Ahmad, M.; Mahmood, A. Analytical framework for value added utilization of glass waste in concrete: Mechanical and environmental performance. Waste Manag. 2018, 79, 312–323. [Google Scholar] [CrossRef]
- Cao, Z.; Zhou, X.; Hu, H.; Wang, Z.; Wen, Y. Towards a Systematic Survey for Carbon Neutral Data Centers. arXiv 2021. [Google Scholar] [CrossRef]
- Xue, L.; Prass, N.; Gollnow, S.; Davis, J.; Scherhaufer, S.; Östergren, K.; Cheng, S.; Liu, G. Efficiency and Carbon Footprint of the German Meat Supply Chain. Environ. Sci. Technol. 2019, 53, 5133–5142. [Google Scholar] [CrossRef] [PubMed]
- Jin, H.; Frost, K.; Sousa, I.; Ghaderi, H.; Bevan, A.; Zakotnik, M.; Handwerker, C. Life cycle assessment of emerging technologies on value recovery from hard disk drives. Resour. Conserv. Recycl. 2020, 157, 104781. [Google Scholar] [CrossRef]
- Wei, N.; Zhang, Q.; Zhang, Y.; Jin, J.; Chang, J.; Yang, Z.; Ma, C.; Jia, Z.; Ren, C.; Wu, L.; et al. Super-learner model realizes the transient prediction of CO2 and NOx of diesel trucks: Model development, evaluation and interpretation. Environ. Int. 2022, 158, 106977. [Google Scholar] [CrossRef]
- Savazzi, S.; Rampa, V.; Kianoush, S.; Bennis, M. An Energy and Carbon Footprint Analysis of Distributed and Federated Learning. IEEE Trans. Green Commun. Netw. 2022, 7, 248–264. [Google Scholar] [CrossRef]
- Aryai, V.; Goldsworthy, M. Day ahead carbon emission forecasting of the regional National Electricity Market using machine learning methods. Eng. Appl. Artif. Intell. 2023, 123, 106314. [Google Scholar] [CrossRef]
- Tavares, C.; Grasley, Z. Machine learning-based mix design tools to minimize carbon footprint and cost of UHPC. Part 2: Cost and eco-efficiency density diagrams. Clean. Mater. 2022, 4, 100094. [Google Scholar] [CrossRef]
- Taslakyan, L.; Baker, M.C.; Shrestha, D.S.; Strawn, D.G.; Möller, G. CO2e footprint and eco-impact of ultralow phosphorus removal by hydrous ferric oxide reactive filtration: A municipal wastewater LCA case study. Water Environ. Res. 2022, 94, e10777. [Google Scholar] [CrossRef]
- Zhang, D.; Wang, Z.; Oberschelp, C.; Bradford, E.; Hellweg, S. Enhanced Deep-Learning Model for Carbon Footprints of Chemicals. ACS Sustain. Chem. Eng. 2024, 12, 2700–2708. [Google Scholar] [CrossRef]
- Rietdorf, C.; Torolsan, K.; Favier, M.; Krishna, S.; Henke, A.; Wahl, K.; Oberle, M.; Defranceski, M.; Koch, D.; Schwarz, J.; et al. Leveraging Digital Twins for Real-Time Environmental Monitoring in Battery Manufacturing. Procedia CIRP 2024, 130, 749–754. [Google Scholar] [CrossRef]
- Alzoubi, Y.I.; Mishra, A. Green blockchain—A move towards sustainability. J. Clean. Prod. 2023, 430, 139541. [Google Scholar] [CrossRef]
- Wei, A.; Toyoda, K.; Yeow, I.; Yeo, Z.; Sze, J.; Lu, W.F. Blockchain-enabled carbon emission management system in a multi-tier supply chain. Procedia CIRP 2023, 116, 233–238. [Google Scholar] [CrossRef]
- Aristia, G.; Salehin, K. Transparent carbon capture and storage using blockchain technology. E3S Web Conf. 2024, 475, 01003. [Google Scholar] [CrossRef]
- He, Y.; Wang, S.; Zhou, Z.; Xiao, K.; Xie, A.; Wu, B. A Blockchain-based carbon emission security accounting scheme. Comput. Netw. 2024, 243, 110304. [Google Scholar] [CrossRef]
- Nechetnyy, N.; Balassem, Z.A.; Subbarayudu, Y.; Goyal, W.; Singh, M.; Mittal, V.; Sobti, S.; Sharma, G.; Nagaraju, K.C. Analysis of Carbon Footprint Reduction in Supply chains using Blockchains. E3S Web Conf. 2024, 581, 01017. [Google Scholar] [CrossRef]
- Gupta, U.; Kim, Y.G.; Lee, S.; Tse, J.; Lee, H.-H.S.; Wei, G.-Y.; Brooks, D.; Wu, C.-J. Chasing Carbon: The Elusive Environmental Footprint of Computing. IEEE Xplore, 1 February 2021. Available online: https://ieeexplore.ieee.org/abstract/document/9407142 (accessed on 29 January 2022).
- García, A.; Monsalve-Serrano, J.; Sari, R.L.; Tripathi, S. Life cycle CO2 footprint reduction comparison of hybrid and electric buses for bus transit networks. Appl. Energy 2022, 308, 118354. [Google Scholar] [CrossRef]
- Kurian, R.; Kulkarni, K.S.; Ramani, P.V.; Meena, C.S.; Kumar, A.; Cozzolino, R. Estimation of Carbon Footprint of Residential Building in Warm Humid Climate of India through BIM. Energies 2021, 14, 4237. [Google Scholar] [CrossRef]
- Hu, A.H.; Huang, L.H.; Lou, S.; Kuo, C.-H.; Huang, C.-Y.; Chian, K.-J.; Chien, H.-T.; Hong, H.-F. Assessment of the Carbon Footprint, Social Benefit of Carbon Reduction, and Energy Payback Time of a High-Concentration Photovoltaic System. Sustainability 2016, 9, 27. [Google Scholar] [CrossRef]
- Serweta, W.; Gajewski, R.; Olszewski, P.; Zapatero, A.; Ławińska, K. Carbon Footprint of Different Kinds of Footwear—A Comparative Study. Fibres Text. East. Eur. 2019, 27, 140–149. [Google Scholar] [CrossRef]
- Lang, S.; Engelmann, B.; Schiffler, A.; Schmitt, J. A Simplified Machine Learning Product Carbon Footprint Evaluation Tool. Clean. Environ. Syst. 2024, 13, 100187. [Google Scholar] [CrossRef]
- Isopescu, D.N.; Adam, L.; Nistorac, A.; Bodoga, A. Carbon Footprint Assessment: Case Studies for Hemp-Based Eco-Concrete Masonry Blocks. Buildings 2024, 14, 3150. [Google Scholar] [CrossRef]
- Abulibdeh, A. Spatial and temporal assessment of the carbon footprint of water and electricity consumption in residential buildings in Qatar. J. Clean. Prod. 2024, 445, 141262. [Google Scholar] [CrossRef]
- Luo, H.; Liu, Z.; Li, Y.; Meng, X.; Yang, X. Characterizing and predicting carbon emissions from an emerging land use perspective: A comprehensive review. Urban Clim. 2024, 58, 102141. [Google Scholar] [CrossRef]
- Ahmad, A.; Liu, Q.-J.; Nizami, S.M.; Mannan, A.; Saeed, S. Carbon emission from deforestation, forest degradation and wood harvest in the temperate region of Hindukush Himalaya, Pakistan between 1994 and 2016. Land Use Policy 2018, 78, 781–790. [Google Scholar] [CrossRef]
- Cai, Y.; Su, S.; Zhang, P.; Chen, M.; Wang, Y.; Xie, Y.; Tan, Q. Quantifying high-resolution carbon emissions driven by land use change in the Guangdong-Hong Kong-Macao Greater Bay Area. Urban Clim. 2024, 55, 101943. [Google Scholar] [CrossRef]
- Cai, L.; Luo, J.; Wang, M.; Guo, J.; Duan, J.; Li, J.; Li, S.; Liu, L.; Ren, D. Pathways for municipalities to achieve carbon emission peak and carbon neutrality: A study based on the LEAP model. Energy 2023, 262, 125435. [Google Scholar] [CrossRef]
Disclaimer/Publisher’s Note: The statements, opinions and data contained in all publications are solely those of the individual author(s) and contributor(s) and not of MDPI and/or the editor(s). MDPI and/or the editor(s) disclaim responsibility for any injury to people or property resulting from any ideas, methods, instructions or products referred to in the content. |
© 2025 by the authors. Licensee MDPI, Basel, Switzerland. This article is an open access article distributed under the terms and conditions of the Creative Commons Attribution (CC BY) license (https://creativecommons.org/licenses/by/4.0/).