Article

Soil Respiration in Maize, Wheat, and Barley Across a Growing Season: Findings from Croatia’s Continental Region

by
Dija Bhandari
1,*,
Nikola Bilandžija
2,
Tajana Krička
2,
Zvonimir Zdunić
3,
Soni Ghimire
4,
Theresa Reinhardt Piskáčková
5 and
Darija Bilandžija
6,*
1
Sustainability in Agriculture, Food Production and Food Technology in the Danube Region (DAFM), Faculty of Agriculture, University of Zagreb, Svetošimunska Cesta 25, 10 000 Zagreb, Croatia
2
Division of Agricultural Engineering and Technology, Faculty of Agriculture, University of Zagreb, Svetošimunska Cesta 25, 10 000 Zagreb, Croatia
3
Agricultural Institute Osijek, Južno Predgrađe 17, 31 000 Osijek, Croatia
4
Department of Soil and Environmental Sciences, University of Wisconsin-Madison, 1525 Observatory Drive, Madison, WI 53706, USA
5
Department of Agroecology and Crop Production, Faculty of Agrobiology, Food and Natural Resources, Czech University of Life Sciences, Kamycka 129, 165000 Prague, Czech Republic
6
Division of Agroecology, Faculty of Agriculture, University of Zagreb, Svetošimunska Cesta 25, 10 000 Zagreb, Croatia
*
Authors to whom correspondence should be addressed.
Sustainability 2025, 17(9), 4207; https://doi.org/10.3390/su17094207
Submission received: 15 January 2025 / Revised: 15 April 2025 / Accepted: 16 April 2025 / Published: 7 May 2025

Abstract

:
Soil respiration (Rs) in croplands is of primary importance in understanding the carbon (C) cycle mechanism and C balance of agroecosystems. This study examines the seasonal Rs dynamics in three predominant cereal crops, maize, wheat, and barley, in continental Croatia during the growing season 2021/2022. This study was conducted at the Agricultural Institute Osijek, featuring a continental climate and silty clay soil. Rs was measured monthly throughout the growing season by following an in situ closed static chamber method and using Infrared Gas Analyzers (IRGAs) with three replicates for each crop and a fallow control. This study found that crop type plays a prominent role in Rs dynamics, while temperature and moisture can have modifying effects. Significant (p < 0.05) temporal variation in Rs between months was found in wheat, barley, and maize. Mean seasonal Rs values for wheat, barley, and maize were, respectively, 14.73, 19.64, and 12.72 kg CO2-C ha−1 day−1. Cropped fields demonstrated two to three times higher Rs than no vegetation/fallow and indicated the significance of autotrophic respiration in cropped fields. There exists a seasonal dynamics of Rs governed by the complex interaction of biotic and abiotic factors that influences Rs. This necessitates a multifaceted examination for effective understanding of seasonal Rs dynamics and its integration to modeling studies.

1. Introduction

Soil is an important reservoir of carbon (C), and it contains twice the amount of C present in the atmosphere and thrice as much C as exists in vegetation [1,2]. Soil and atmosphere continuously exchange C and are vital components of the terrestrial C cycle. Soils release C in the form of carbon dioxide (CO2) into the atmosphere during the process, called as soil respiration (Rs). Under natural conditions, the C efflux is balanced by similar opposite fluxes. However, over the past decades, Rs has been increasing [3,4,5] due to changes in climate [6], land cover/disturbance, and biogeochemical cycle change [5,7]. This increase disrupts the natural C cycle, causing atmospheric CO2 to rise, which has increased 1.2 times from 1990 to 2022, and these trends are consistent with global temperature rise [8]. The increase in CO2 along with greenhouse gases in the atmosphere have been identified as the principal reasons for climate change and global warming. To mitigate these effects, initiatives such as the worldwide ‘4p1000’ initiative and the FAO’s Global Assessment of Soil Organic Carbon Sequestration Potential (GSOCeq) program have the goal of enhancing soil C sequestration. Although adding to soil C storage is essential, to obtain net C accumulation in soils, it is equally important to monitor the release of C back into the atmosphere and utilize opportunities to prevent C losses from the soil. It is therefore important to understand Rs as a measure to mitigate climate change issues and challenges in agriculture.
Rs originates from the respiration of plant roots, the respiration activity of soil macro-organisms, and microbial mineralization and decomposition processes. Rs serves as an indicator of biological activities in the soil profile [9,10]. Rs is one of the most widely used biological indicators [11]; it estimates biological activity, nutrient mineralization [10], and biomass activity, and it provides early detection of the management effect on organic matter in the soil. As one of the key ecosystem processes, Rs is closely linked with ecosystem productivity, soil fertility, and decomposition processes, and it plays a key role in global and regional C cycling [12]. Measurements of Rs provide information on ecosystem metabolism [13]. Rs provides a crucial parameter in the determination of greenhouse gas emissions to the atmosphere and in modeling the C cycles.
Rs is highly variable at different spatial and temporal scales as it is affected by several factors. During the peak growing season, root activity and microbial processes are higher, which subsequently enhance Rs rates. However, Rs fluctuations in the temporal scale are primarily influenced by climatic factors, soil properties, crop growth stages, and land management practices. The estimation of Rs on global and regional scales is difficult, with many uncertainties. Therefore, understanding Rs requires an in-depth understanding of this dynamic across various ecosystems and climates. Rs values in agroecosystems vary substantially across the globe, as they are influenced by numerous types of cropland management. Agricultural ecosystems are mostly affected by human activities, and as such, sustainable management practices can be used to sequester carbon. Among the terrestrial ecosystems, the farmland ecosystem is the most active and can be adjusted by humans in the shortest period [14]. Understanding Rs in agricultural ecosystems thus becomes crucial for understanding the C cycle, the status of soil health, and the impact of various agricultural practices on emissions of CO2. A comprehensive evaluation of the seasonal patterns and seasonal cumulative amount of soil respiration in various croplands has remained lacking [15] till recent times. Studies that compare Rs values and their seasonal dynamics in crops are not adequate in terms of executing quantification and modeling studies, therefore limiting the application of these studies to C sequestration and climate change mitigation. Identifying key factors that control Rs is desirable for informed soil management decisions and for promoting and scaling up soil health [15]. Understanding C emission in Rs studies supports the modeling of Rs and provides a scientific basis for implementing taxes on C [14]. In our study, we investigate the seasonal dynamics of Rs in three different arable crops in continental Croatia.
Agricultural production in Croatia is dominated by cereal crops, and maize, wheat, and barley rank as the three leading crops in terms of area coverage [16]. Despite their significance, little is known from research regarding Rs dynamics on Croatian arable land. Therefore, this study will help improve the understanding of the theory and practice of C dynamics in agroecosystems in continental Croatia. With the EU’s target of lowering greenhouse gas (GHG) emissions, this research on Rs in Croatia is valuable to GHG estimation and in developing suitable policy.

2. Materials and Methods

2.1. Description of Site

The experiment was carried out during the year 2021/2022 at the Agriculture Institute Osijek (latitude: 45°31′56.47″ N, longitude: 18°44′16.07″ E, 90 m a.s.l), near Osijek City. The Osijek area is characterized by a continental climate. According to a study, the average annual air temperature and precipitation for the region were 11.7 °C and 707 mm, respectively, while the evapotranspiration amounted to 590 mm per year for the period 1991–2018 [17]. A soil water deficit was observed during July–September, with 72 mm, and a water surplus occurred during December–March [17]. For our analysis, during the experimental period (2021/2022), the agroclimatic factor and indicator calculations were based on climate elements data from the Osijek–Čepin main meteorological station (latitude = 45°30′9″ N, longitude = 18°33′41″ E; 89 m a.s.l) of the Croatian Meteorological and Hydrological Service Network.

2.2. Experimental Design

The experiment included 3 different cereal crops (wheat, barley, and maize) and a control plot with three repetitions. The experiment was a part of an experimental field at the Agriculture Institute Osijek which consisted of 3 different cereal crops with 4 different cereal varieties of each crop and a control plot (black fallow) in three repetitions (Figure 1). The size of each plot was 120 m2 (8 m × 15 m) for wheat and barley and 150 m2 for corn (10 m × 15 m). In this research, one variety of each cereal crop and a control plot were studied:
  • T0—control-bare soil.
  • T1—winter wheat (Triticum aestivum L.) Srpanjka cultivar—an old cultivar, a very early growing cultivar, with very low habitus (64 cm), and a plant density of 9,110,000 plants ha−1.
  • T2—corn (Zea mays) OS SK515 cultivar—for production of grain, cob, and/or silage, pronounced grain vigor, FAO group 520, stems with higher growth, large and numerous leaves, deep and branched roots, and a plant density of 65,000 grain ha−1.
  • T3—barley (Hordeum vulgare L.) Rex cultivar—a medium—late-growing two-rowed cultivar with an average yield of 10 t/ha, low habitus (87–92 cm), and a plant density of 6,440,000 plants ha−1.

2.3. Soil Properties

Soil sampling (0–30 cm) was carried out before the beginning of the experiment in 2021, and the soil’s physical and chemical properties were determined. The soil had a silty clay texture with 2.3% sand, 56% silt, and 41.7% clay. The soil bulk density and water holding capacity were found to be 1.39 g cm−3 and 37.7%, respectively. Soil pHKCL was found to be 7.24. Soil had 0.11% total nitrogen, 1.25% total carbon, 0.06% total sulfur, 17.87 mg of P2O5, 15.50 mg of K2O per 100 g of soil, 2.3% humus content, and 0.9% CaCO3.

2.4. Maintenance of Experiment

The experimental period (2021/2022) covered one growing season for all the crops: October–July for barley and winter wheat and April–October for maize. Tilling of the field was carried out according to the principles of reduced tillage. Mineral fertilizer (N:P:K—7:20:30) at the rate of 400 kg/ha and urea 100 kg/ha was applied and spread with a mineral fertilizer spreader. Additional tillage was carried with a 4 m rotary harrow, which prepared the soil for sowing. The 1st sowing of the fields with wheat (Srpanjka cultivar) and barley (Rex cultivar) was carried out using a multirow mechanical seeder for small grains. The fertilization in the wheat and barley fields was supplemented through two top dressings with mineral fertilizer at rates of 100 kg/ha KAN and 150 kg/ha KAN in the second and third months, respectively. Herbicide was applied in the third month to suppress weed growth followed by fungicide application in the fourth month. At the same time, the 2nd sowing with maize (OS SK 515 cultivar) was performed following herbicide application. Harvesting was performed with a mechanical harvester.

2.5. Measurement of Soil CO2 Efflux and Agroclimatic Elements

The field measurements of soil CO2 efflux and agroclimatic elements (soil temperature and soil moisture) were conducted once every month during the growing season for all crops. These measurements were conducted thrice to obtain 3 repetitions. The measurement was not possible during the winter period (months—December and January) due to unfavorable weather conditions (snow cover). The number of measurements taken for winter wheat was 21 (7 months × 3 repetitions), for barley 18 (6 months × 3 repetitions), for corn 21 (7 months × 3 repetitions), and for control (12 × 3 = 36), resulting in a total of 96 observations. Soil CO2 efflux was measured by the in situ closed static chamber method with a portable infrared carbon dioxide detector (GasAlerMicro5 IR, Staffordshire, UK 2011). Soil temperature and moisture conditions were measured continuously along with the Rs at a depth of 10 cm with a TDS sensor device, IMKO HD2 (Ettlingen, Germany 2011), placed close to the static chamber.
The calculation of CO2 efflux was calculated as
FCO2 = [M × P × V × (c2 − c1)]/[R × T × A × (t2 − t1)]
where
  • FCO2: soil CO2 efflux (kg ha−1 day−1);
  • M: molar mass of the CO2 (kg mol−1);
  • P: air pressure (Pa);
  • V: chamber volume (m3);
  • c2 − c1: CO2 concentration increase rate in the chamber for the incubation period (µmol mol−1);
  • R: gas constant (J mol−1 K−1);
  • T: air temperature (K);
  • A: chamber surface (m2);
  • t2 − t1: incubation period (day).

2.6. Statistical Analysis

The effects of different covers, different months, and their interaction with Rs were evaluated using analysis of variance (ANOVA) at ρ ≤ 0.05 with SAS 9.1 statistical software (SAS Inst. Inc., 2002–2004, Cary, NC, USA). Mean Rs values of individual cover types were compared in different months to examine the seasonal respiration, while the same across treatments (cover types) was also compared using ANOVA. A Least Significant Difference (LSD) test was used to determine the differences between means. Pearson correlation analysis was performed to evaluate the relationship between environmental variables (soil moisture and temperature) and Rs. Rs data were log-transformed to meet the normal distribution assumptions before carrying out the analysis.

3. Results

3.1. Seasonal Variation of Temperature, Moisture, and Carbon Fluxes

The average air temperature for the growing season 2021/2022 was 12.4 °C. The mean air temperature during the growing season and the observed soil temperature during the months (n = 1) when Rs was measured (n = 3) is shown in Figure 2a. A general seasonal fluctuation in mean air temperature was observed. Measurements of CO2 flux over the experimental period had a range of soil temperature (8.9–45.9 °C) at a depth of 10 cm. The lowest mean air temperature was measured in January and the highest in July. The highest mean soil temperature (41.5 °C) was recorded in May and the lowest mean soil temperature (10.4 °C) was observed in November, when measurements were not made in December and January due to freezing soil conditions. At each observation date when soil temperature was measured, the mean observed soil temperature was higher than the monthly air temperature. This seems unusual at first since soil is known as a better insulator of temperature, but the soil temperature was only measured during one day in each month and within daylight hours. It is important to note that the soil temperature follows the same trend of seasonal variation but that the soil temperature at the time of data collection with other variables was higher than the average air temperature for the month to contextualize the data that will be discussed. In February, March, April, and May, differences in observed soil temperature were much higher (>15 °C) than the mean air temperature during those months. Due to the single observation per month, the observed soil temperature does not represent the actual temperature changes in the vegetative season.
The average amount of precipitation for the period of 2021/2022 was 638.7 mm, which was 9.6% less compared to the 1991–2018 period. Water deficit occurred during June, July, and August, whereas there was a water surplus in October, November, December, January, and February. Soil moisture was in the range of 5.0–34.9% measured at a depth of 10 cm. During December and January, measurements were not made. Soil moisture was more constant even though precipitation amounts greatly varied between the months, Figure 2b. The soil moisture did not exceed field capacity in any measurements; the soil moisture (%) never had flooding conditions.
Analysis of variance (ANOVA) was carried out to examine the monthly variation in Rs for each cover type (Table 1) This result indicated that the observations within each crop had at least one month which was significantly different than the values of other months, thereby supporting that respiration does have variation within the season.
Seasonal variation is attributed to a number of biotic and abiotic factors, which include soil temperature, moisture conditions, and crop phenology. Under each crop and no vegetation, the p-values indicate a significant difference between the values observed throughout the season (Table 1). Since these values were found to be significant, LSD was used to separate the means (Table 2).
Significant temporal variation in Rs between months was found across the treatments in wheat, maize, barley, and no vegetation (Figure 3). Rs varied within a range of 8.27–41.02 kg CO2-C ha1 day1 in barley, 8.06–23.50 kg CO2-C ha1 day1 in wheat, and 7.08–33.66 kg CO2-C ha1 day1 in maize. In barley, the Rs rates increased continually from November, reached a peak in May, and declined in June with the ending season. The pattern of monthly Rs in wheat showed an increasing trend from November and reached a peak from April to June before reducing drastically in July during senescence. Similarly, in maize, the Rs increased from the sowing season in April, reached the highest in June, and continuously declined until October. From the figure, despite marginal temperature variation between cover types, there is a significant variation in Rs, which indicates that besides temperature, several other factors govern Rs dynamics.

3.2. Variation in Soil Respiration Among Cover Types

The temporal variations in Rs fluxes and two main environmental factors (soil temperature and soil moisture) affecting Rs flux with different cover types were compared (Table 3).
Average Rs fluxes of the vegetation season varied significantly among different crops (Figure 4). The mean flux of Rs for the growing season was found to be 19.64 kg CO2-C ha1 day1 for barley, 12.72 kg CO2-C ha−1 day1 for maize, 14.73 kg CO2-C ha1 day1 for wheat, and 6.75 kg CO2-C ha1 day1 in the bare soil. A significant difference in Rs was present between barley and maize and between soil with crops and with no vegetation.

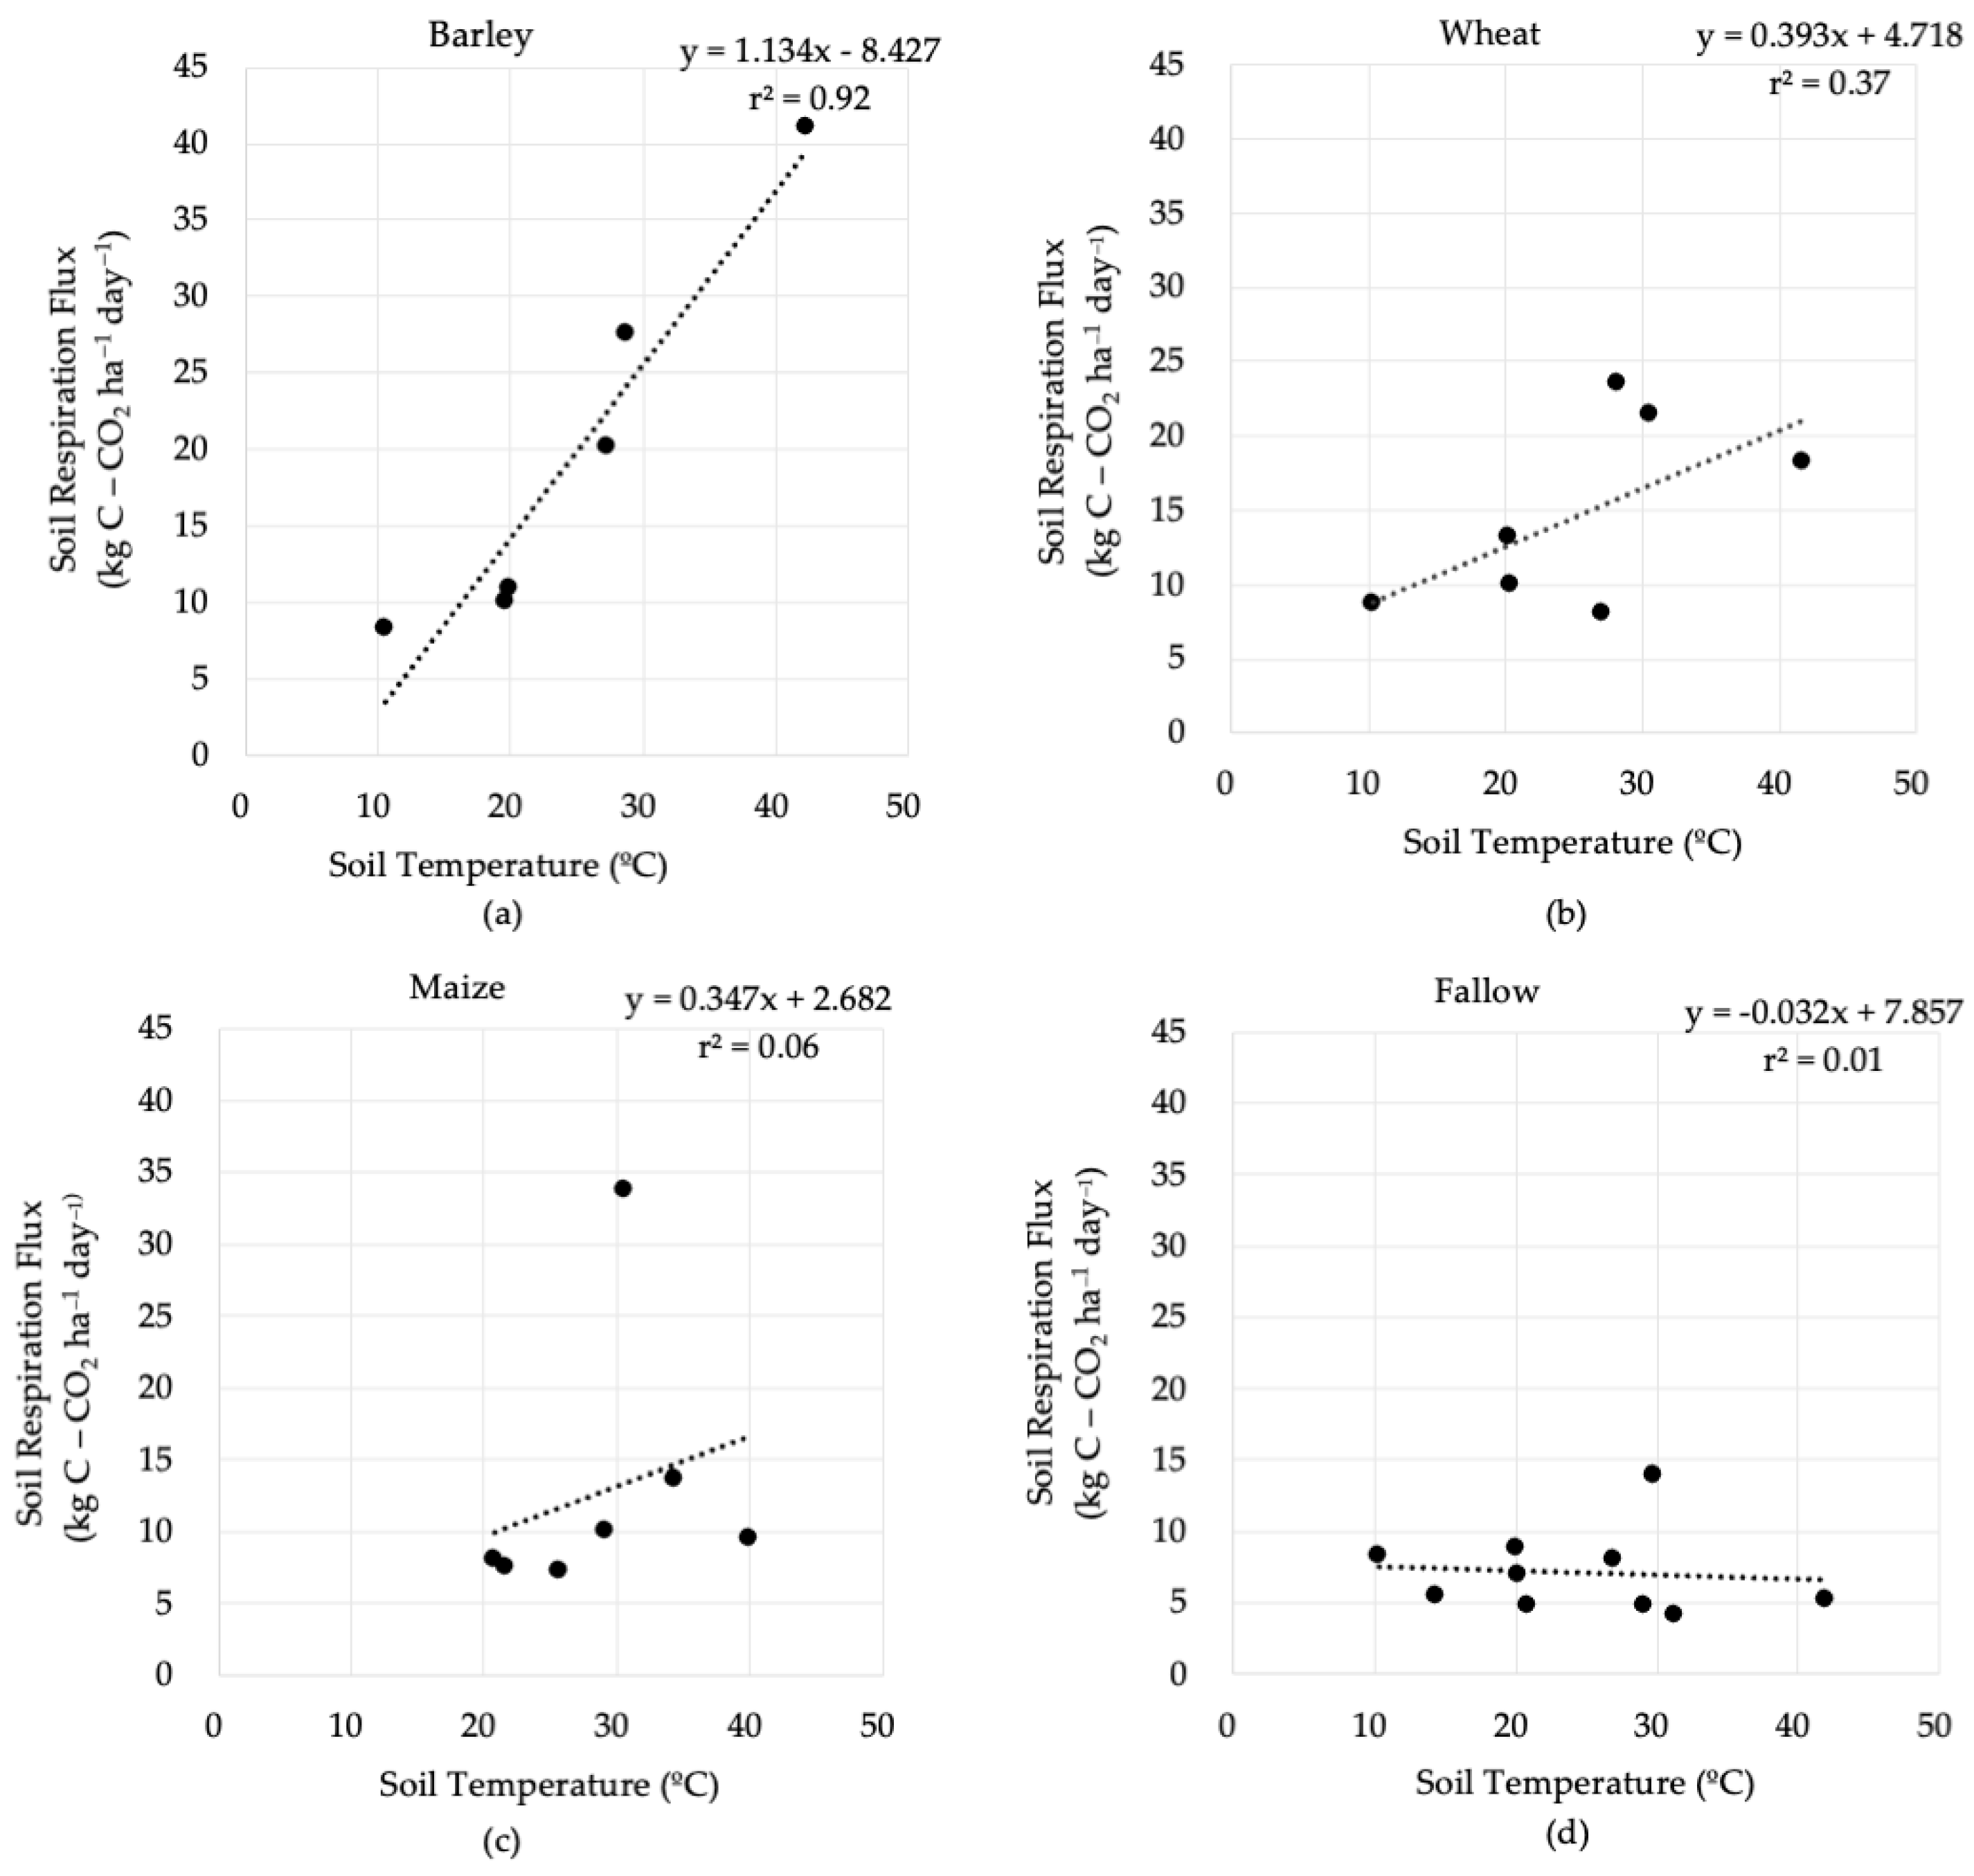
3.3. Correlation Between Temperature, Moisture, and Soil Respiration

A positive correlation (R = 0.26) was observed between Rs and soil temperature, while a negative correlation (R = −0.18) was observed between Rs and soil moisture. Linear regression analysis was performed, and the coefficient of determination was (R2 = 0.07) with soil temperature and (R2 = 0.13) with soil moisture, which indicated a poor relationship with Rs of the individual hydrothermal parameters in our study. It was observed that Rs in different covers responded differently with temperature (Figure A1). Likewise, the responses of soil respiration in different covers had differential responses with soil moisture (Figure A2). The interaction effects of soil temperature and soil moisture were determined using a linear model, and the coefficient of determination increased to (R2 = 0.16), which indicated that the interaction of soil temperature and soil moisture had a greater role in influencing Rs than their individual effects.

4. Discussion

4.1. Temporal Interpretation of Temperature, Moisture, and Carbon Fluxes Control

There was significant monthly variation in Rs in all the cover types examined (Table 1), consistent with previous findings for winter wheat [9,18,19,20], summer maize [21,22,23], barley [20,24], cotton [21], and soybean [25]. In our study, temporal variation in Rs followed a pattern characteristic to many terrestrial ecosystems: low during initial growing phases, increased with crop growth, peaking at the time of maximum development, and declining after maturity. In a study by [26] in continental Croatia, the CO2 efflux was higher during the second half of spring and the first half of summer, while lower CO2 efflux was observed during autumn–winter, similar to our study.
Soil temperature and soil moisture are significant abiotic drivers of Rs that regulate the temporal variation in CO2 efflux from soils. However, the impacts of these factors are not always direct due to interactions with biotic components such as plant growth and microbial activity. Non-cropped fields or fallow zones experience temporal Rs variation primarily due to heterotrophic respiration. However, in a cropped field, crop growth becomes a significant contributor to seasonal changes in Rs. In a study conducted in subtropical east China, a model based on soil temperature, moisture, and Leaf Area Index (LAI) accounted for 57.9–69.1% of the seasonal Rs variation in a winter wheat–soybean rotation cropland [27], indicating the leading role of crop growth factors. In a recent study conducted on summer maize in Songnen Plain in China, models based on soil hydrothermal factors and Net Primary Productivity (NPP) were able to explain 52.6 to 57.7% of the Rs variation [23]. Among them, changes in soil surface temperature and NPP (R2 = 0.16) played dominant roles in influencing Rs [23].
Winter wheat Rs was in the range of 8.06–23.50 kg CO2-C ha−1 day−1 with a maximum Rs in April and June. The values are comparable to those in continental Croatia, where the Rs in the same wheat variety was in the range of 8.35–20.23 kg CO2-C ha−1 day−1, with a maximum in June [20]. In another study conducted in the Tibetan Plateau, winter wheat had a minimum Rs value of 0.4 g m−2 d−1 and a maximum of 15.0 g m−2 d−1 on the 1st of July [18]. In the same study, the maximum Rs value was observed in the flowering and grain-filling stages of wheat in June/July. Though temperature was an important controlling factor of Rs, the maximum Rs did not necessarily coincide with the month of highest temperature but overlapped instead with times of maximum growth in wheat [18]. Measurements conducted by [9] included crop biomass and by [18] included live root biomass (LRB) and LAI to determine the relationship between crop phenological stages and Rs and concluded that crop activity was a major factor in controlling Rs. A similar pattern of seasonal variability was observed by [28]. Rs in maize was in the range of 7.08–33.66 kg CO2-C ha−1 day−1 with a maximum Rs value reported in June. The minimum Rs was during the first month after seeding in April and in October before harvest.
A similar result was observed under summer maize cultivation in the subtropics, where the maximum Rs value of maize was observed at day 69 (around May/June), which corresponded with the silking stage of maize. The Rs value in maize ranged between 2.4 and 15.2 µmol m−2 s−1 during the growing season. The greatest Rs occurred in July and August, when maize was in the early reproductive stages [22]. Similarly, ref. [29] found a significant linear relationship between Rs rate and root biomass (R2 = 0.73) in maize, indicating the dominant role of root biomass in influencing Rs. A similar conclusion as in winter wheat regarding the major influence of crop phenology on Rs can be made for maize.
Rs in barley was in the range of 8.27–41.06 kg CO2-C ha−1 day−1 and was at the maximum in May around the ripening stage. The Rs value increased from sowing and was the highest during the ripening stage, and it declined toward harvest. The minimum Rs values occurred during the earlier growing period. The Rs corresponded with the month of highest temperature and the period of high growth. However, unlike wheat and maize, it did not necessarily correspond to the period of maximum growth but was increasingly in sync with temperature trends. In a previous study in continental Croatia, the Rs was in the range of 6.07–18.02 kg CO2-C ha−1 day−1, with a maximum Rs in June and suggesting lower Rs values [20], which indicates the effect of potential site-specific characteristics such as soil and microclimatic conditions. The Rs increases soon after sowing and reaches a maximum at about the time of the reproductive growth stage in barley [1]. In a study by [24] in Mediterranean Spain, during a 2-year period, the maximum Rs in barley showed a difference between years and did not necessarily correspond to the period of maximum LAI. During the year 2012, the maximum Rs was during tillering, whereas in 2013, the maximum value was during stem elongation, and both were one month earlier than the maximum LAI. It was concluded that the roles of temperature and moisture had limiting effects on the influence of crop growth compared to Rs [24].
The current work emphasizes the multivariate interactions of climate and vegetation development in regulating the temporal variation in Rs. Even if the Rs was generally in concurrence with crop phenology, temperature and moisture conditions played significant roles, sometimes overriding the immediate impact of vegetation growth. The Rs changes with different seasons, depending on climatological conditions, crop type, soil type, and many other factors without a defined pattern [30]. Substrate availability is the primary limiting factor for Rs, as it is the food for microbes [31]. Variations in organic carbon play a critical role in driving Rs changes. Plant growth strongly influences rhizosphere respiration, indicating that differences in growth variables influence Rs [1,9]. Substrate availability plays a critical role in affecting Rs, explained by amounts of SOC and its soluble components [31]. In this research, however, we did not have direct measures to link Rs with crop phenology, e.g., biomass root or SOC observations, and conclude that such measurements would provide more integrated information on Rs dynamics.

4.2. Effect of Cover Types on Soil Respiration

Results obtained in this study show a significant difference in Rs among different cover types. Barley had significantly higher mean Rs (19.64 kg CO2-C ha−1 day−1) compared to maize (12.72 kg CO2-C ha−1 day−1), while no significant difference was present between Rs in wheat (14.73 kg CO2-C ha−1 day−1) and barley and between maize and wheat. Non-cropped plots had significantly lower Rs flux than all cover types at −6.75 kg CO2-C ha−1 day−1. The higher Rs recorded in barley in our study is also in agreement with [32], which noted that CO2 emissions from soils with different crops were similar, with maximum values of about 10 g m−2 day−1; however, for barley, CO2 evolution between 10 and 20 g m−2 day−1 was recorded. Although some research [30] found wheat to have higher Rs than maize, the present study did not find a significant difference between these two crops, indicating the complexity of factors that regulate Rs. Ref. [1] found differences in Rs in different crop types, i.e., grass, barley, and potato. However, Ref. [33] conducted a study on different crop groups and types, including cereals (oats, barley), rape seed (spring wheat and spring triticale), and row crops (potato, carrot, and parsnip) and found low variation between the compared crops which were inconsistent with seasons and time. Differences in Rs between crops may be due to crop-specific factors, such as photosynthetic potential, root architecture, root biomass, and root exudate plant species, which could differentially influence soil CO2 efflux [15,21]. While vegetation type clearly contributes to Rs variability, it alone has little influence on Rs [34]. Several studies emphasize the dominant role of environmental factors like temperature, moisture availability, microbial activity, and substrate conditions [15,34]. Factors associated with varietal properties of crops and management practices, such as planting density, can also affect Rs. Barley and wheat have a longer growing season than maize. However, studies that compare barley with other crops are fewer, and the factors that could have caused this relationship remain underexplored. In an earlier study [21], Rs was 23.0% to 36.5% lower in fallow plots than in cropped ones. Similarly, Ref. [35] found that CO2 fluxes were roughly twice as high under barley as in fallow plots. The rhizosphere respiration contribution to the total Rs is extremely variable among crops. It was 62% to 98% in soybean-planted soil and varied with the crop growth stages [25], and it was comparatively lower for wheat and maize, which were 36% and 29%, respectively [36]. Furthermore, Ref. [21] reported that root respiration comprised 13–29% in different crops. However, it was observed in some cases that non-cropped soils also had greater respiration rates than cropped plots [34]. Nevertheless, Rs is generally higher in cropped sites than in fallow due to the presence of the autotrophic respiration of roots and enhanced microbial activity of the rhizosphere. As supported in the literature, the contribution of roots to the total Rs rates greatly varies with crop types and environmental conditions.

4.3. Implications of Temperature and Moisture Variability on Soil Respiration

In this study, Rs was positively correlated (R2 = 0.071) to soil temperature and negatively (R2 = 0.13) to soil moisture. In various studies in the literature, it was found that temperature had a significant role in defining Rs in the seasonal variation of croplands [9,18,23]. Among the several parameters for temperature, it was found that mean weekly air temperature was the best predictor of Rs [9]. A high correlation (R2 = 0.53–0.86) was found in a 2-year study of winter wheat cultivation [19], and a moderate correlation (R2 = 0.49) was found in summer-grown maize [23]. Soil temperature stimulates plant growth and microbial activity in the soil and thus increases respiration rates. However, there are not always significant temperature dependencies described in the literature. For instance, a previous study conducted on the same study site had a lower correlation (R2 = 0.0195) of temperature with Rs [20]. Similarly, Ref. (Akinremi et al.) [35] also reported a low coefficient of determination (R2 = 0.06 and 0.02) in fallow plots and (R2 = 0.09–0.24) in barley. The effect of soil moisture on Rs was complex and highly variable in various studies. In the present research, the limited range of soil moisture and lower sampling frequency most likely contributed to its poor negative correlation with Rs. It is supported by other research that shows that in a limited range of soil moisture, its effect on soil CO2 efflux was negligible [18,31]. Moreover, Rs had different behaviors according to soil types [10]. The Rs rate for peat and clay soils decreased with the increase in soil moisture content (R2 = 0.39, p < 0.001 for peat soil; R2 = 0.578, p < 0.001 for clay soil), whereas only in sandy soil did Rs increase with the increase in moisture (R2 = 0.29, p < 0.001) [10]. In broader ecosystem studies, soil moisture alone did not explain Rs variability [37]. From the same study [37], in cropland ecosystems, Rs displayed poor to no correlation with soil moisture. In line with this, Ref. (Moyano et al.) [38] found no significant effect of moisture on respiration activity, and this suggests that low amounts of aboveground litter can limit microbial substrate supply and thus the moisture response. Ref. [39] found soil depth, nutrient levels and slope positions among the different soil factors greatly influence Rs. These observations showed that the relationship between the temperature and moisture on Rs varies with soil types, biomes, and crop types and can have a differential influence on Rs based on their complex interactions. The complexity of the relation between the two variables can lead to non-linear effects. In this study, when a linear model incorporating the interaction of soil temperature and soil moisture was used, the coefficient of determination was improved (R2 = 0.16) in line with earlier findings [37,40], where model performance was increased by considering both factors combined. A better frequency of data records might further improve the predictability of temperature and moisture variables with Rs. Rising temperatures and altered precipitation patterns from climate change can influence soil temperature regimes and moisture conditions, thereby altering their role in ecosystem processes. Studies on warming effects on Rs have been found to elevate Rs [12,27], and this was also found when they were coupled with increasing precipitation [41]. However, moisture effects on soil respiration are also a subject of debate in various ecosystems and require attention in light of the possible effects of climate change in the future.

4.4. Limitations of the Study

This study had a limited sampling frequency which did not account for diurnal and spatial variations. Such an approach may have sacrificed important diurnal and short-term variations, particularly under conditions of sharp temperature and humidity changes. Having a single measurement per month could limit our understanding of unknown changes during certain periods of temperature or moisture fluctuations during the season. It has been realized that the soil temperature during the measurements was generally higher and did not correspond well with the mean air temperature, adding potential biases to seasonal Rs measurement. To overcome these limitations, increasing the sampling frequency, particularly at the peak growth seasons and periods of maximum hydrothermal fluctuations, is essential. To enhance the precision of Rs estimations, it is recommended to incorporate diurnal and spatial variations in future studies. Site-specific parameters arising from soil heterogeneity, root distribution, and microclimate conditions also influence Rs. Individual soil samples, representative of different treatment plots, were not considered in this investigation; however, this would provide additional and precise information and is encouraged to keep in consideration during future investigations. Apart from that, there is scarce information on how different crops influence Rs. Based on our results, barley had significantly higher Rs than maize, which suggests crop selection make a difference in Rs behavior and may have climate-smart implications. More comparison studies are required to arrive at a conclusion that barley has a higher Rs than maize. An inter-comparison of Rs in different crops would contribute to better C balance modeling and cropping system approaches towards CO2 mitigation. Finally, to gain deeper insights into Rs, future studies should integrate additional parameters such as biomass activity and LAI to gain a more comprehensive view of the mechanisms driving Rs variability.

5. Conclusions

We examined the seasonal variation in Rs in three different major crops, maize, wheat, and barley, in continental Croatia and came to the following conclusions:
I.
Seasonal variation in crops is governed by phenology and crop growth cycles. Maximum Rs generally corresponded with the peak growth stage of the crop. Rs remained lower at the beginning and end of the crop-growing season. Rs also followed the temperature trend with some exceptions, which are attributed to the interaction effects of moisture and other possible factors.
II.
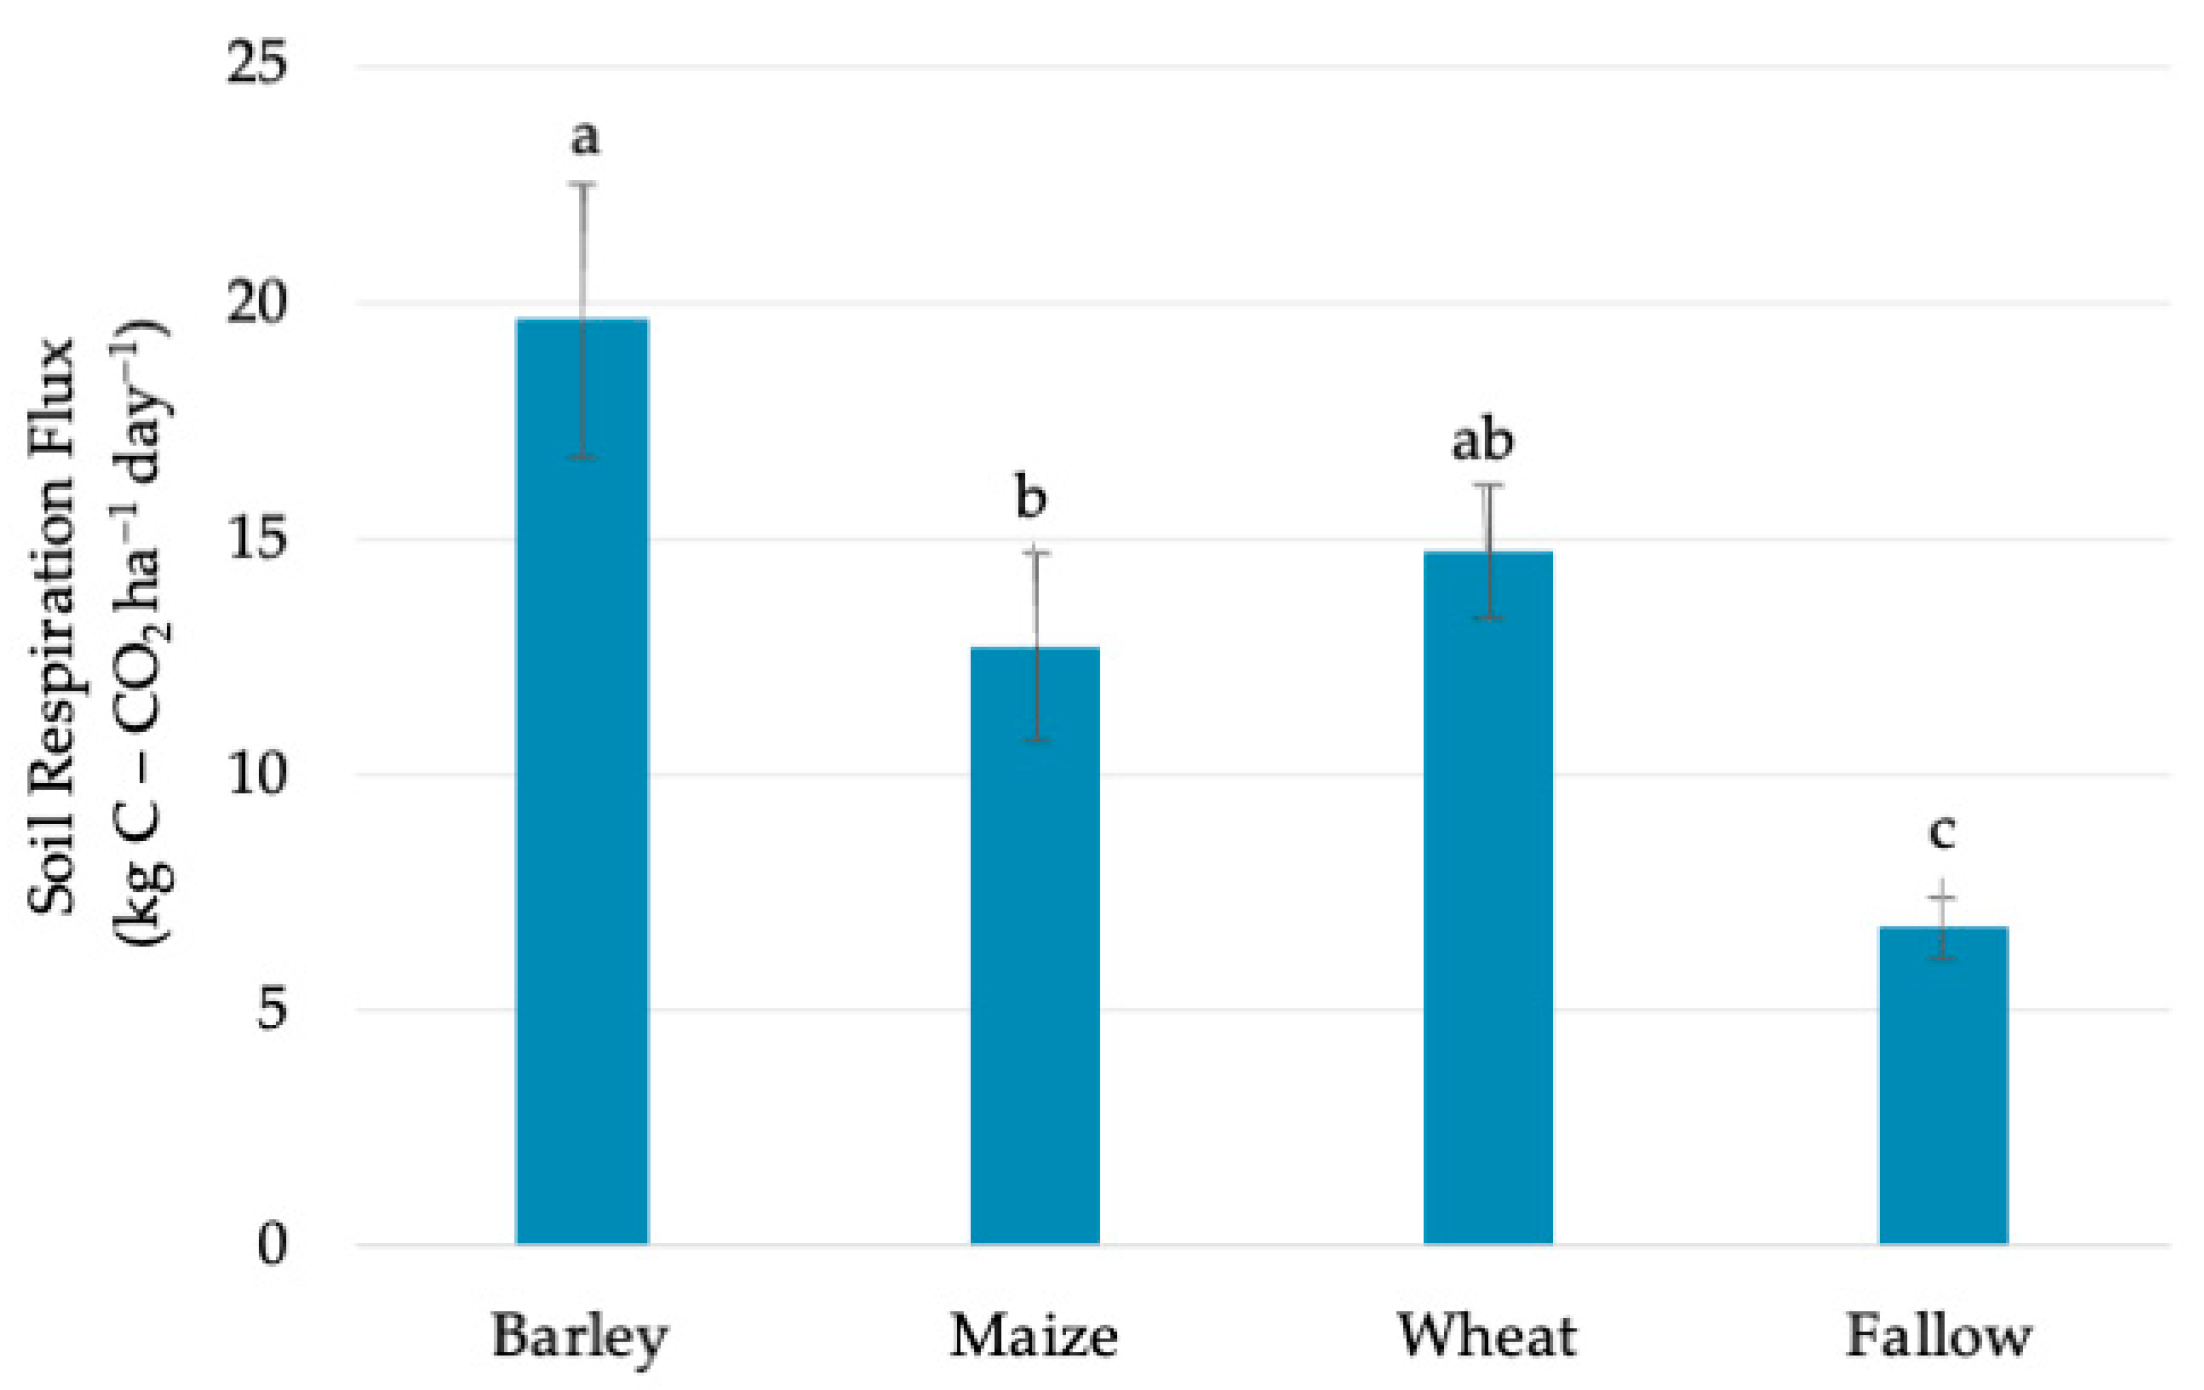
Barley had significantly higher respiration rates compared to maize. This could be relevant in crop selection for climate-smart agriculture. However, additional research under diverse cropping systems and agroclimatic conditions is required to understand these dynamics in more detail. Cropped fields have significantly higher Rs than fallow, indicating the prominent role of autotrophic respiration in cropped fields.
III.
No significant correlation was found between Rs and soil temperature and between Rs and soil moisture. Interaction effects play an influential role in masking the individual effect of these factors on Rs. More frequent sampling is helpful to clearly understand the effects of these agroclimatic variables on Rs.
IV.
To obtain a better understanding of factors contributing to seasonal Rs dynamics, increasing the sampling frequency of Rs and agroclimatic variables is recommended. Sampling frequency could be increased after heavy rainfalls and during peak growth periods in crops.
V.
Seasonal variation in Rs is influenced by both biotic factors, such as crop types and phenology, and abiotic factors, such as temperature and moisture, which can interact in different ways. To understand Rs demands an analysis of its seasonal variation, making it essential to account for these variations when quantifying and modeling Rs.

Author Contributions

Conceptualization: D.B. (Darija Bilandžija); methodology: D.B. (Darija Bilandžija), Z.Z., T.K. and N.B.; software: D.B. (Dija Bhandari) and S.G.; formal analysis: D.B. (Dija Bhandari) and S.G., investigation: D.B. (Darija Bilandžija) and N.B.; resources: T.K. and Z.Z.; writing—original draft preparation: D.B. (Dija Bhandari); writing—review and editing: D.B. (Dija Bhandari) and T.R.P.; visualization: N.B.; supervision: D.B. (Darija Bilandžija), T.K. and T.R.P.; funding acquisition: T.K. All authors have read and agreed to the published version of the manuscript.

Funding

This research was funded by the European Union from the Operational Program Competitiveness and cohesion of European Regional Development Fund via project “Production of food, biocomposites and biofuels from cereals in the circular bioeconomy” (grant number KK.05.1.1.02.0016).

Institutional Review Board Statement

Not applicable.

Informed Consent Statement

Not applicable.

Data Availability Statement

The original contributions presented in this study are included in the article. Further inquiries can be directed to the corresponding author.

Conflicts of Interest

The authors declare no conflicts of interest.

Appendix A

Table A1. Agrotechnical measures in the production of maize, wheat, and barley during the experimental season 2021/2022.
MonthField OperationTools and EquipmentHow Was It Conducted?
Wheat and Barley
OctoberPrimary tillage
Secondary tillage
Combined tool
Rotary harrow
Up to 15–20 cm depth
Up to 5–10 cm depth
OctoberFertilizationMineral fertilizer spreader (Amazone 1500)Urea 46% (100 kg/ha)
NPK 7:20:30 (400 kg/ha)
OctoberSowingMultirow mechanical seederSeeding density: Rex (200 kg/ha), Srpanjka (290 kg/ha)
NovemberApplication of rodenticide33.6613.61
FebruaryFertilizationMineral fertilizer spreader (Amazone 1500) Top dressing by KAN (100 kg/ha)
MarchFertilizationMineral fertilizer spreader (Amazone 1500) Top dressing by KAN (400 kg/ha)
MarchHerbicide application Trimur WG (15 g/ha) + Fluxir (0.5 L/ha)
AprilFungicide applicationMechanical harvesterImpact 25 SC (0.5 L/ha) + Tebusha 25% EW (1 L/ha)
JulyHarvestMechanical harvester
Maize
OctoberPrimary tillageFendt, 194 kW
AprilSecondary tillageFendt, 164 kW
AprilSowingMultirow mechanical corn planterOS 515
Seeding rate: 65,000 plants/ha
AprilHerbicide application in corn fieldMechanical sprayerDual Gold 960 (1 L/ha) + Koban T (3 L/ha)
MayFertilizationFendt, 164 kWKAN (250 kg/ha)
OctoberHarvest of maizeMechanical harvester
Figure A1. Scatter plot of soil temperature and corresponding measured Rs flux under barley (a), wheat (b), maize (c), and no vegetation (d).
Sustainability 17 04207 g0a1
Figure A2. Correlation of soil moisture and corresponding measured Rs flux under barley (a), wheat (b), maize (c), and no vegetation (d).
Sustainability 17 04207 g0a2

References

  1. Lohila, A.; Aurela, M.; Regina, K.; Laurila, T. Soil and total ecosystem respiration in agricultural fields: Effect of soil and crop type. Plant Soil 2003, 251, 303–317. [Google Scholar] [CrossRef]
  2. European Commission; Environment Directorate-General. Soil: The Hidden Part of the Climate Cycle; Publications Office of the European Union: Luxembourg, 2011. [Google Scholar]
  3. Bond-Lamberty, B.; Bailey, V.L.; Chen, M.; Gough, C.M.; Vargas, R. Globally rising soil heterotrophic respiration over recent decades. Nature 2018, 560, 80–83. [Google Scholar] [CrossRef]
  4. Huang, N.; Wang, L.; Song, X.-P.; Black, T.A.; Jassal, R.S.; Myneni, R.B.; Wu, C.; Wang, L.; Song, W.; Ji, D.; et al. Spatial and Temporal Variations in Global Soil Respiration and Their Relationships with Climate and Land Cover. Available online: https://www.science.org (accessed on 22 March 2024).
  5. Zhao, Z.; Peng, C.; Yang, Q.; Meng, F.; Song, X.; Chen, S.; Epule, T.E.; Li, P.; Zhu, Q. Model prediction of biome-specific global soil respiration from 1960 to 2012. Earth’s Future 2017, 5, 715–729. [Google Scholar] [CrossRef]
  6. Wu, Z.; Dijkstra, P.; Koch, G.W.; Peñuelas, J.; Hungate, B.A. Responses of terrestrial ecosystems to temperature and precipitation change: A meta-analysis of experimental manipulation. Glob. Change Biol. 2011, 17, 927–942. [Google Scholar] [CrossRef]
  7. Hursh, A.; Ballantyne, A.; Cooper, L.; Maneta, M.; Kimball, J.; Watts, J. The sensitivity of soil respiration to soil temperature, moisture, and carbon supply at the global scale. Glob. Change Biol. 2017, 23, 2090–2103. [Google Scholar] [CrossRef] [PubMed]
  8. Yurak, V.V.; Fedorov, S.A. Review of natural and anthropogenic emissions of carbon dioxide into the earth’s atmosphere. Int. J. Environ. Sci. Technol. 2024, 22, 2719–2736. [Google Scholar] [CrossRef]
  9. Buyanovsky, G.A.; Wagner, G.H.; Gantzer, C.J. Soil Respiration in a Winter Wheat Ecosystem. Soil Sci. Soc. Am. J. 1986, 50, 338–344. [Google Scholar] [CrossRef]
  10. Koizumi, H.; Kontturi, M.; Mariko, S.; Nakadai, T.; Bekku, Y.; Mela, T. Soil Respiration in Three Soil Types in Agricultural Ecosystems in Finland. Acta Agric. Scand. Sect. B—Soil Plant Sci. 1999, 49, 65–74. [Google Scholar] [CrossRef]
  11. Bünemann, E.K.; Bongiorno, G.; Bai, Z.; Creamer, R.E.; De Deyn, G.; de Goede, R.; Fleskens, L.; Geissen, V.; Kuyper, T.W.; Mäder, P.; et al. Soil quality—A critical review. Soil Biol. Biochem. 2018, 120, 105–125. [Google Scholar] [CrossRef]
  12. Zhou, L.; Zhou, X.; Shao, J.; Nie, Y.; He, Y.; Jiang, L.; Wu, Z.; Bai, S.H. Interactive effects of global change factors on soil respiration and its components: A meta-analysis. Glob. Change Biol. 2016, 22, 3157–3169. [Google Scholar] [CrossRef]
  13. Ryan, M.G.; Law, B.E. Interpreting, measuring, and modeling soil respiration. Biogeochemistry 2005, 73, 3–27. [Google Scholar] [CrossRef]
  14. Zhang, S.; Hussain, H.A.; Wang, L.; Hussain, S.; Li, B.; Zhou, H.; Luo, H.; Zhang, X.; Ma, Z.; Long, L.; et al. Responses of soil respiration and organic carbon to straw mulching and ridge tillage in maize field of a triple cropping system in the hilly region of southwest China. Sustainability 2019, 11, 3068. [Google Scholar] [CrossRef]
  15. Yao, X.; Chen, S.; Ding, S.; Zhang, M.; Cui, Z.; Linghu, S.; Xu, J. Temperature, Moisture, Hyperspectral Vegetation Indexes, and Leaf Traits Regulated Soil Respiration in Different Crop Planting Fields. J. Soil Sci. Plant Nutr. 2021, 21, 3203–3220. [Google Scholar] [CrossRef]
  16. Cvjeticanin, P.; Kanizaj, Z.; Valentic, M.; Grlica, A.; Pejkovic, M.; Dujman, I. Agricultural Production, 2023; Statistical Reports; Croatian Bureau of Statistics: Zagreb, Croatia, 2024; ISSN 1333-3518. [Google Scholar]
  17. Bilandžija, D.; Martinčić, S. Agroclimatic Conditions of the Osijek Area During Referent (1961–1990) and Recent (1991–2018) Climate Periods. 2020. Volume 54, pp. 1–154. Available online: http://hrcak.srce.hr/hmc (accessed on 2 May 2024).
  18. Shi, P.-L.; Zhang, X.-Z.; Zhong, Z.-M.; Ouyang, H. Diurnal and seasonal variability of soil CO2 efflux in a cropland ecosystem on the Tibetan Plateau. Agric. For. Meteorol. 2006, 137, 220–233. [Google Scholar] [CrossRef]
  19. Liang, G.; Houssou, A.A.; Wu, H.; Cai, D.; Wu, X.; Gao, L.; Li, J.; Wang, B.; Li, S. Seasonal patterns of soil respiration and related soil biochemical properties under nitrogen addition in winter wheat field. PLoS ONE 2015, 10, e0144115. [Google Scholar] [CrossRef]
  20. Bilandžija, D.; Zgorelec, Ž.; Bilandžija, N.; Zdunić, Z.; Krička, T. Contribution of winter wheat and barley cultivars to climate change via soil respiration in continental Croatia. Agronomy 2021, 11, 2127. [Google Scholar] [CrossRef]
  21. Benbi, D.K.; Toor, A.; Brar, K.; Dhall, C. Soil respiration in relation to cropping sequence, nutrient management and environmental variables. Arch. Agron. Soil Sci. 2020, 66, 1873–1887. [Google Scholar] [CrossRef]
  22. Lamptey, S.; Xie, J.; Li, L.; Coulter, J.A.; Jagadabhi, P.S. Influence of organic amendment on soil respiration and maize productivity in a semi-arid environment. Agronomy 2019, 9, 611. [Google Scholar] [CrossRef]
  23. Gao, Y.; Chu, Z.; Jiang, L.; Zhou, Y.; Zhao, F.; Gao, F.; Liu, D.; Zhao, H. Soil respiration dynamics and effects of hydrothermal factors and NPP during growing period of maize cropland ecosystem in Songnen Plain, China. Trop. Ecol. 2024, 66, 55–66. [Google Scholar] [CrossRef]
  24. Cicuéndez, V.; Rodríguez-Rastrero, M.; Recuero, L.; Huesca, M.; Schmid, T.; Inclán, R.; Litago, J.; Sánchez-Girón, V.; Palacios-Orueta, A. First insights on soil respiration prediction across the growth stages of rainfed barley based on simulated MODIS and sentinel-2 spectral indices. Remote Sens. 2020, 12, 2724. [Google Scholar] [CrossRef]
  25. Yang, L.-F.; Cai, Z.-C. Soil Respiration During a Soybean-Growing Season. Pedosphere 2006, 16, 192–200. [Google Scholar] [CrossRef]
  26. Bilandžija, D.; Zgorelec, Ž.; Kisić, I. The Influence of Agroclimatic Factors on Soil CO2 Emissions. Coll. Antropol. 2014, 38, 77–83. [Google Scholar]
  27. Chen, S.; Wang, J.; Zhang, T.; Hu, Z.; Zhou, G. Warming and straw application increased soil respiration during the different growing seasons by changing crop biomass and leaf area index in a winter wheat-soybean rotation cropland. Geoderma 2021, 391, 114985. [Google Scholar] [CrossRef]
  28. Rochette, P.; Desjardins, R.L.; Pattey, E. Spatial and temporal variability of soil respiration in agricultural fields for personal use only. Can. J. Soil Sci. 1991, 71, 189–196. [Google Scholar] [CrossRef]
  29. Han, G.; Zhou, G.; Xu, Z.; Yang, Y.; Liu, J.; Shi, K. Biotic and abiotic factors controlling the spatial and temporal variation of soil respiration in an agricultural ecosystem. Soil Biol. Biochem. 2007, 39, 418–425. [Google Scholar] [CrossRef]
  30. Bilandžija, D.; Zgorelec, Ž.; Kisić, I. Influence of tillage practices and crop type on soil CO2 emissions. Sustainability 2016, 8, 90. [Google Scholar] [CrossRef]
  31. Wang, Y.; Bölter, M.; Chang, Q.; Duttmann, R.; Scheltz, A.; Petersen, J.F.; Wang, Z. Driving factors of temporal variation in agricultural soil respiration. Acta Agric. Scand. Sect. B—Soil Plant Sci. 2015, 65, 589–604. [Google Scholar] [CrossRef]
  32. Monteith, J.L.; Szeicz, G.; Yabuki, K. Crop Photosynthesis and the Flux of Carbon Dioxide Below the Canopy. J. Appl. Ecol. 1964, 1, 321. [Google Scholar] [CrossRef]
  33. Norberg, L.; Berglund, Ö.; Berglund, K. Seasonal CO2 emission under different cropping systems on Histosols in southern Sweden. Geoderma Reg. 2016, 7, 338–345. [Google Scholar] [CrossRef]
  34. Raich, J.W.; Tufekcioglu, A. Vegetation and soil respiration: Correlations and controls. Biogeochemistry 2000, 48, 71–90. [Google Scholar] [CrossRef]
  35. Akinremi, O.O.; McGinn, S.M.; McLean, H.D.J. Effects of soil temperature and moisture on soil respiration in barley and fallow plots. Can. J. Soil Sci. 1999, 79, 5–13. [Google Scholar] [CrossRef]
  36. Zhang, Q.; Lei, H.-M.; Yang, D.-W. Seasonal variations in soil respiration, heterotrophic respiration and autotrophic respiration of a wheat and maize rotation cropland in the North China Plain. Agric. For. Meteorol. 2013, 180, 34–43. [Google Scholar] [CrossRef]
  37. Lai, L.; Zhao, X.; Jiang, L.; Wang, Y.; Luo, L.; Zheng, Y.; Chen, X.; Rimmington, G.M. Soil Respiration in Different Agricultural and Natural Ecosystems in an Arid Region. PLoS ONE 2012, 7, e48011. [Google Scholar] [CrossRef] [PubMed]
  38. Moyano, F.; Kutsch, W.; Schulze, E. Response of mycorrhizal, rhizosphere and soil basal respiration to temperature and photosynthesis in a barley field. Soil Biol. Biochem. 2007, 39, 843–853. [Google Scholar] [CrossRef]
  39. Adhikari, K.; Anderson, K.R.; Smith, D.R.; Owens, P.R.; Moore, P.A.; Libohova, Z. Identifying key factors controlling potential soil respiration in agricultural fields. Agric. Environ. Lett. 2023, 8, e20117. [Google Scholar] [CrossRef]
  40. Wu, R.E.; Gauland, T.T.R.; Bus, R.L. The interdependent effects of soil temperature and water content on soil respiration rate and plant root decomposition in arid grassland soils. Soil Biol. Biochem. 1975, 7, 373–378. [Google Scholar]
  41. Chang, X.; Zhu, X.; Wang, S.; Luo, C.; Zhang, Z.; Duan, J.; Bai, L.; Wang, W. Temperature and moisture effects on soil respiration in alpine grasslands. Soil Sci. 2012, 177, 554–560. [Google Scholar] [CrossRef]
Figure 1. Scheme of the experimental field. (Plots marked with arrows represent the studied experimental plot of each crop, and the plot marked with an oval represents the control plot studied).
Sustainability 17 04207 g001
Figure 2. Average mean air temperature and corresponding soil temperature observed during the months (a) and average monthly precipitation (mm) and measured soil moisture (%) during the corresponding months (b). Error bars denote standard deviation.
Sustainability 17 04207 g002
Figure 3. Monthly variation in soil temperature (a) and measured Rs (b). Values on the y-axis represent mean observed values taken in 3 replications of each crop once a day in each month.
Sustainability 17 04207 g003
Figure 4. Average Rs under barley, maize, wheat, and no vegetation (fallow) observed during the vegetation season: Rs measured as kg CO2-C ha−1day−1; different letters in bars indicate significant differences between cover types, error bars denote standard errors.
Sustainability 17 04207 g004
Table 1. Analysis of variance for monthly Rs in wheat, barley, maize, and no vegetation among the observations throughout the season.
SourceDFSum of
Squares
Mean SquareF valuePr > FR2Cv
CO2-C Wheat
Model6722.03120.3418.42<0.00010.8817.35
Error1491.476.53
Corrected total20813.50
CO2-C Barley
Model52458.87491.7770.62<0.00010.9713.43
Error1283.566.96
Corrected total172542.44
CO2-C Maize
Model61623.52270.5848.25<0.00010.1018.61
Error1478.515.60
Corrected total201702.03
CO2-C No vegetation
Model11437.4639.778.63<0.00010.7931.77
Error24110.594.61
Corrected total35548.06
Table 2. Least Significant Difference for monthly Rs in wheat, barley, maize, and no vegetation among the observations throughout the season.
Cover TypeNovemberFebruaryMarchAprilMayJuneJulyAugustSeptemberOctober
Barley8.2710.0210.8320.1441.0227.57
dddcab
Wheat8.6610.0213.1523.5018.2321.498.06
dcdcababd
Maize 7.089.4633.6613.619.947.907.38
cbcabbccc
No vegetation8.278.916.978.025.2513.964.144.684.895.54
bcabbcbcbcacbcbcbc
Different letters denote a statistically significant difference between treatments; differences between months under the same crop type are according to the Fisher’s LSD test at p < 0.05.
Table 3. Analysis of variance for Rs flux between different cover types.
SourceDFSum of
Squares
Mean SquareF ValuePr > FR2Cv
CO2-C
Model32204.32734.7712.06<0.00010.2863.87
Error925606.1160.94
Corrected total957810.43
Soil Temperature
Model3207.2269.070.910.43890.0333.16
Error926975.1975.82
Corrected total957182.42
Soil Moisture
Model3408.06136.023.320.02320.1029.55
Error923766.0940.94
Corrected total954174.15
Disclaimer/Publisher’s Note: The statements, opinions and data contained in all publications are solely those of the individual author(s) and contributor(s) and not of MDPI and/or the editor(s). MDPI and/or the editor(s) disclaim responsibility for any injury to people or property resulting from any ideas, methods, instructions or products referred to in the content.

