Article

Renewable Energy Communities: Frameworks and Implementation of Regulatory, Technical, and Social Aspects Across EU Member States

1
Department of Energy, Politecnico di Milano, Via Lambruschini 4, I-20133 Milan, Italy
2
Department of Industrial Economics and Technology Management, Norwegian University of Science and Technology (NTNU), NO-7491 Trondheim, Norway
3
Department of Civil, Environmental and Mechanical Engineering, University of Trento, Via Mesiano 77, I-38123 Trento, Italy
*
Author to whom correspondence should be addressed.
Sustainability 2025, 17(9), 4195; https://doi.org/10.3390/su17094195
Submission received: 25 March 2025 / Revised: 23 April 2025 / Accepted: 1 May 2025 / Published: 6 May 2025
(This article belongs to the Section Energy Sustainability)

Abstract

:
This study presents a comprehensive review of renewable energy communities, focusing on key challenges concerning their implementation. In particular, it addresses the technical, regulatory, and social dimensions of community energy models, with special attention to planning and operation strategies, grid-related impacts, and energy poverty mitigation. Additionally, the study explores the varied regulatory approaches to energy community implementation across EU Member States and proposes a comparative analysis of selected countries from both theoretical and quantitative perspectives. The findings reveal highly heterogeneous regulatory approaches, resulting in significantly different economic outcomes for participants, and show a general gap in the considerations of social aspects, which could support policymakers in designing more effective incentive schemes.

Graphical Abstract

1. Introduction

Renewable energy sources (RES) are growing at an exponential rate, with 2023 marking a significant increase in the pace of new installations [1]. Almost 510 GW of new RES installations and a year-on-year (YoY) increase of almost 50% set a new record. The main drivers of this result are distributed and utility-scale photovoltaic (PV) systems, whose installed capacity increased from 230 GW in 2022 to 370 GW in 2023 (Figure 1). More unstable progress is seen for hydro and wind, mainly motivated by the different trends in cost reduction, which are impressive for PV (−90% from 2010 to 2023), interesting for wind (−60–70%), stagnating for hydro (+20%) [2]. This pace is leading to reach 2.5 times today’s installed capacity by the end of the decade, thus falling short of the goal of tripling installed RES by 2030 defined at COP28 at the end of 2023 [1,3].
To reach the 2030 targets, it is fundamental not to lose momentum and to exploit existing tools and technologies, as well as new schemes for deploying new RES. In this sense, small-scale, distributed resources and customers could play a key role. This is why an extensive electricity market reform is ongoing in the EU [4]. Among the initiatives to increase the role of the electricity consumer in the energy transition, there are flexible tariffs to encourage demand side management (DSM), power purchase agreement (PPA) to link demand and offer of RES, and community energy and collective self-consumption initiatives to share the benefits of renewables in a local framework. Community energy can provide an incentive to deploy small-scale RES plants in cities and rural areas, directly owned or participated by people who share costs and benefits. This way, on the one hand, people’s acceptability of RES increases, and on the other hand, the economic profitability of RES projects increases due to the benefits related to self-consumption. Renewable energy communities (RECs) can be effective in lowering bills where it is more necessary: sharing the investment costs, RES installation, and benefit on the bill can involve those vulnerable users that could not face, alone, a capital-intensive investment such as photovoltaic (PV) systems [5]. Therefore, community energy can also be a tool for energy poverty mitigation and, in turn, for Just Transition [6]. Collective self-consumption is mainly regulated at the EU level by directives, whose transposition into national regulatory frameworks can lead to different schemes and different effectiveness. Therefore, an investigation of each Member State’s implementation of RECs can provide insights into the support these schemes can provide.
Research works reviewing the regulatory and environmental framework of collective self-consumption initiatives have been developed from the beginning. First, since 2019, research has presented the pilot projects and regulatory sandboxes aimed at providing first-of-a-kind projects and at commenting on the tools for spreading these new entities [7]. Other works focused on technological, economic, and social aspects while considering rural RECs worldwide [8]. The design criteria for a new REC, considering different performance indicators and objective functions, have been investigated to highlight how different initiatives can diffuse considering what is the goal of the stakeholders [9]. Being a multifaceted entity, involving a set of possible benefits and interactions with the power system assets and customers, the most recent reviews on the topic highlight the need to fill the research gap by covering a wide set of RECs challenges to provide an overall picture to the stakeholders [10], possibly focusing on a specific macro-region to consider a common framework and develop trade-offs analyses [9]. In particular, research just partially summarized the REC impacts on the grid and has not yet provided a detailed financial comparison between different REC schemes in the EU, to better understand the efficiency and effectiveness of each regulatory scheme.
This review work aims to investigate the scientific and institutional literature with three main targets.
  • First, it provides a general description of what planning and operating a collective self-consumption initiative means, building on existing research to list a set of good practices.
  • Then, it tries to address questions that are often disregarded in the literature on the topic, yet they are crucial: how to assess the impacts of RECs on the power grid and how to develop tools for improving the social impact of energy communities.
  • Finally, it gives a detailed international comparison, first theoretical and then quantitative, of the regulatory frameworks and incentive schemes of some key EU States. This produces financial outcomes that provide insights on efficiency (in the use of public money) and economic interest (for REC members) for projects in key EU countries.
The systematic review has followed some standard routines [11]. Selected sources are mainly scientific sources. Where there is a potential gap in academic literature, institutional references or pilot projects are considered. The selected topics will cover the nature of RECs and their compatibility with the three pillars of sustainability [12]: they aim to promote economic, environmental, and social sustainability via novel regulatory frameworks. Therefore, we considered management and economic viability (Section 3), compatibility with the power system and its transition (Section 4), and social benefits (Section 5), and we detailed how and if these sustainability goals are fostered by national regulatory frameworks (Section 6). Finally, a comparative case study provides indicative figures (Section 7).
The remainder of the paper is thus structured as follows. Section 2 outlines a brief history of European regulation of RESs, including the EU definition of energy communities. Section 3 presents a set of strategies commonly found in the literature for planning and operating collective self-consumption initiatives. Section 4 focuses on available academic studies concerning the potential impact of these initiatives on the grid. Section 5 investigates the social aspect of energy communities, with a focus on their role in mitigating energy poverty. Section 6 offers an in-depth qualitative analysis of regulatory frameworks for energy communities in some Member States, while Section 7 complements this analysis by outlining an international comparative case study. Finally, Section 8 draws the conclusions.

2. Context, Scenarios, and Targets

After successfully achieving the goals of the 20-20-20 strategy [13], the EU has new challenging targets in terms of decarbonization and renewable energy sources (RESs) penetration for 2030. Since 2014, the EU has committed to target an overall reduction of greenhouse gas (GHG) emissions of 40% by 2030 compared to 1990 [14]. Also considering the good EU performance highlighted in the latest available data (2021), where GHG emissions were 30.4% lower than in 1990 [15], updates for more ambitious targets have been proposed. The update started with the European Green Deal, issued in December 2019 [16]. The Green Deal targets an overall 55% reduction of GHG emissions in the EU by 2030, and carbon neutrality as a long-term goal by 2050. The Green Deal is backed by a package of legislation, the “Fit for 55”, addressing roadmaps and subgoals for all the sectors [17]. For instance, by 2030, Fit for 55 indicates at least 40% of RES in gross final consumption, at least 49% of RES in buildings, and a yearly increase of 1.1% of RES in heating and cooling. For what concerns energy efficiency, the goals are a minimum reduction of 39% in primary energy consumption and 36% in final energy consumption by 2030 compared to 2007 projected scenarios. Some targets are specific by sector, for instance, a 1.7% yearly savings in the public sector, and a 55% reduction in average CO2 emissions from new cars.
2021 and 2022 saw the advent of an intense natural gas crisis entailing durable high energy prices, first led by an increase in global gas demand [18] and then by the Russian invasion of Ukraine [19]. This brought a new awareness of the need for energy security, a drastic and fast reduction in fossil fuel use, and the energy poverty issue. The REPowerEU plan [20], especially the EU Solar Energy Strategy, further enhanced some of the previous targets. The RES penetration on gross final energy consumption is targeted to 42.5% and possibly to 45% by 2030. Solar energy and rooftop solar plants will play a major role, with a gradual obligation to install solar plants on new buildings, starting from public and commercial buildings. In addition, by 2025, the Solar Energy Strategy calls for the establishment of at least one REC per municipality with more than 10,000 residents.
Extremely high energy prices raised concerns about the fact that the energy transition should occur with no one left behind [6]. The concept of Just Transition was already introduced, as well as energy poverty initiatives such as the EU statistics on income and living conditions (EU-SILC) [21], but in 2021, an enhanced interest in the Energy Poverty Advisory Hub (EPAH) and local initiatives to tackle energy poverty was recorded [22]. New ways to contrast energy poverty are crucial: this issue now involves more than 34 million people in the EU [23]. For instance, community energy and collective self-consumption should be part of the solution [5].
At the European level, in the context of the Clean Energy Package [24], two main pieces of legislation paved the way for community energy initiatives and collective self-consumption: Directive 2018/2001 of 11 December 2018 on the promotion of the use of energy from renewable sources (Directive REDII) and Directive 2019/944 of 5 June 2019 on common rules for the internal market for electricity and amending Directive 2012/27/UE (Directive IEM). These describe two main structures for energy communities that should be transposed into the national regulatory framework of each Member State, even if the actual implementation can vary widely among Member States, concerning technical aspects, economic incentives, and time schedules.
As described before, it is apparent that small-scale, distributed, community-based RES will be part of the transition, and a massive deployment of local projects is expected in the future. Likewise, these projects cannot disregard energy poverty mitigation. As anticipated, the approach could be different from country to country. If, in some countries, the concept of energy cooperatives is already diffused, and community energy projects could evolve from these traditional entities, for some other countries, energy communities are a brand-new scheme [25,26]. If, at the EU level, there will be a gradual obligation to solar rooftop installations, some countries, such as The Netherlands, have already domestic laws for reaching a high penetration of distributed PV installations on new and existing buildings, including obligations and simplifications for permitting [27,28]. Better planning, operation, and management of energy communities can foster their diffusion as a tool to reach the target for distributed RES.

3. REC Planning, Operation, and Management

Energy communities are expected to play a pivotal role in decentralizing energy systems and leveraging locally available RES [29]. Numerous studies in the literature have explored optimal sizing strategies for energy communities, spanning from city districts to individual building levels. The presented studies were selected on Google Scholar after searching with the following keywords: “renewable energy communities”, “planning”, “operation”, “management”, “economics”, and “optimization”. Ref. [30] aimed to quantify the benefits of optimizing technology portfolios within energy communities, particularly focusing on cost reduction and lowering carbon emissions. Modeling the energy community as a multi-energy system, they imposed restrictions to meet electricity and heat requirements. Ref. [31] explored urban building clustering as a smart community solution at a smaller scale. Participants collaborated through an Internet of Things-based platform to enhance energy self-sufficiency and reduce city-wide CO2 emissions.
Generally speaking, REC design could be targeted toward three main goals: economic, environmental, and social. The most popular objective function is cost minimization [32,33,34,35]: installation costs (i.e., the cost of deploying the generation portfolio like PV, wind, etc., and any energy storage equipment), expenditure for purchasing energy on the grid (possibly taking into account revenues from the energy injected into the grid, too), and the operational costs are optimally managed by an Energy Management System to minimize the costs. Typically, this leads to a minimization of the energy exchanged with the main grid [36,37]. Environmental goals are typically added as emission targets, usually limited to carbon dioxide emissions [38]. The social aspect is more complex: it will be analyzed in a dedicated section (Section 5).

3.1. Cooperative vs. Competitive Management Approaches

The academic literature, industry reports, and policy documentation have highlighted a variety of economic and environmental benefits stemming from the development and operation of RECs. Nonetheless, the determination of the operational strategy to be implemented by a REC and its members is not a trivial task and it may depend on several factors. Although recent actual implementations of RECs indicate a relatively small number of involved members [39], a wider participation of members and assets is expected. This would require more complex control techniques.
In the recent past, several works have investigated the cooperative coordination of the power profiles of the REC’s members. Note that the underlying control strategies may display common characteristics. For instance, they may not guarantee the optimal operational strategy for each member of the REC. In other words, each member may increase its own revenue or decrease its own costs by deviating from the cooperative solution. In addition, these methodologies may necessarily require the presence of an intermediate aggregator to enable actual economic rewards. Finally, cooperative coordination may introduce privacy concerns for the REC’s members since they might be encouraged to share private data, preferences, and behavioral patterns.
In contrast, competitive approaches may be quite suitable to address the abovementioned shortcomings. Nonetheless, a competitive approach may eventually reduce the overall economic performance of a REC. In fact, the reduction of the REC-level revenue arises when individual members compete rather than cooperate toward the same overall system objective. Note that competitive interactions are often determined by resorting to game theory. The implementation of such schemes in the case of REC operation is not straightforward. The impact of the actual design of the incentive mechanism for the shared energy requires further analysis since it may increase the mathematical complexity of the problem. Although competitive operational schemes have been proposed in several systems (e.g., [40,41]) their application to the specific case of RECs remains limited.

3.2. Operational Schemes for RECs

The literature review carried out in this section highlights several works concerning the operation of RECs. To facilitate the comprehension of these works, their main features have been listed in Table 1.
It is worth noting that the majority of the works (65%) recalled in Table 1 are devoted to operational aspects only, whereas the remaining ones also analyze investment models coupled with hour-by-hour operational aspects of the REC’s assets. Moreover, 60% of these works deal with RECs that explicitly exploit the intrinsic flexibility of certain assets, especially battery storage units, to maximize the REC revenues or minimize its electricity costs. All the recalled works—except for [42]—adopt a cooperative operational approach to optimize or analyze the operation of the RECs. This helps to assess an upper bound of the potential economic and technical benefits for RECs. Furthermore, most of the proposed methodologies (65%) overlook the impact of the operational decisions adopted by the REC on the main distribution network. The existence of clear EU-level and national-level regulations concerning RECs allows most of these works (75%) to propose methodologies and assess case studies that accurately apply specific actual features of the corresponding regulations. Among these, the Italian case is largely considered. Finally, the last column of Table 1 informs us of the overall features of the methodology which underlies each of the considered works. A more detailed assessment is provided below.
The only work proposing a game-theoretic approach to investigate the benefits stemming from the shared energy of a REC is [43]. The model seeks the optimal portfolio of members/assets based on the collected energy requests and the availability of distributed renewable generation. The output of this model is used then to evaluate the operation of the RECs which includes flexible storage assets. A fair mechanism to distribute the collected revenues based on the Shapley Value is implemented as a particular solution of the proposed coalition game. The authors in [44] have developed a tool to predict the energy behavior of RECs of different sizes and with heterogeneous compositions. The application of random sampling methods and the use of real data from energy meters allow them to highlight effective correlation phenomena in the operational patterns of individual members. A Mixed-Integer Linear Programming (MILP) optimization problem is proposed in [45] to assess the implementation and monitoring of a REC. The results of the proposed optimization model exploit the flexibility of battery storage assets. A different approach is studied in [42], which deals with a local market mechanism based on blockchain to exchange physical storage rights within the framework of a REC. This setup allows members of the REC to compete in maximizing their utility.
The dual nature of RECs in Poland, which may foster both cooperative and competitive mechanisms, is discussed in [46,47]. However, the features of the common underlying MILP optimization problem are suited for a cooperative operational approach. The authors in [48] investigated the economic viability of RECs under the scope of application of the Austrian legislation on RECs, which in turn implements the corresponding EU legislation. It is worth noting that the assessment of the RECs’ operation does not rely on a mathematical optimization model; rather, it is based on the match between possible load and generation profiles. The flexibility of controllable assets is exploited in [49]. The relevant optimization model is made of two algorithms that seek the solution of an ad hoc optimal open-loop control problem in a receding horizon fashion. The application of the algorithms to the case of RECs leads to a drastic reduction of the electricity costs for the REC’s members. Interestingly, the electricity produced by the REC’s members is allocated using an effective definition of repartition keys, i.e., the fraction of the surplus of energy production of the REC to be allocated to each member. The authors in [49] proposed a comprehensive linear optimization model that accounts for different scopes of a REC such as its composition, the role of the flexibility of demand side response schemes, and ultimately the implementation of a fair distribution mechanism concerning the REC’s revenues. A different approach is adopted in [50], where the output of an optimal investment and operational model of RECs is used to translate the carbon emissions avoided by the REC into economic solar compensation rights. Different optimization strategies based on a MILP optimization model for investment and operation of RECs considering 11 RECs in Austria are compared in [51]. In particular, the study highlights the large economic value introduced by flexible assets. The impact of RECs’ real-time operation on the low-voltage distribution grid to which they are connected is addressed in [52]. In particular, a comprehensive algorithm, not based on an optimization model, is derived to consider the technical limitations of the distribution network such as voltage profiles and power ratings of cables and transformers. The role of flexible assets in RECs is addressed in [53]. The authors developed a stochastic model predictive control that optimizes the operation of the assets of the REC to maximize the expected revenues. Particular attention is given to the feasible operation of reversible solid oxide cells, i.e., bifunctional units that function as power generators as well as energy storage devices. A set of MILP optimization problems is proposed in [54] to evaluate the benefits and limitations of different connection schemes and regulatory policies for battery storage units under Italian legislation for RECs.
The study presented in [55] deals with an optimization problem to determine the investment decisions of a REC in terms of renewable generation to be installed, combined with the optimal management of the operational energy shared by the REC. Insights and best practices stemming from the first year of operation of an actual REC in northern Italy are summarized in [56]. The work collects actual data and provides realistic economic indicators. The algorithm proposed in [57] promotes a network-friendly operation of a REC, which aims to reduce the power peaks in rural, suburban, and urban grid topologies while, at the same time, pursuing revenue maximization objectives. Interestingly, the operation of a variety of flexible assets is computed, e.g., heat pumps, electric vehicles, and battery units. The combined optimization model in [58] aims to extract the maximum economic potential of RECs. In fact, the multi-objective problem looks at both the planning and the operational phases. A combinatorial optimization method is used, whereas genetic algorithms help, for instance, to reduce the search space. The authors in [59] have modeled a MILP optimization problem to evaluate the sizing of battery units installed in a potential Italian REC. The resulting operation of the asset aims to maximize the energy shared by photovoltaic generators and inflexible loads. By doing so, the economic operational performance of the REC is highly improved. While keeping the focus on the Italian regulatory framework for RECs, the work in [60] evaluates the impact of policy options on the operation of battery storage units operating in RECs. In particular, besides economic indicators, the analysis considers technical aspects such as the evaluation of reverse power flows from the REC toward the grid and the increased cyclic operation of a battery unit, which may accelerate its energy capacity fade.
Table 1. Summary of considered REC planning and operation studies.
ReferenceObjective—ScopePresence of
Flexible Assets
Operational SchemeRegulatory
Context
Network
Consideration
Main Feature of the Method
[60]operation + investmentbattery storagecooperativeItalianyesgame theory—cooperative game
[59]operationnocooperativeItaliannoanalysis of data based on a predictive tool
[58]operation + investmentbattery storagecooperativeItalianyesMILP optimization
[57]operationbattery storagecompetitivegenericnoblockchain—local market
[56]operationnocooperativePolishyesMILP optimization
[55]operationnocooperativePolishyesMILP optimization
[54]operationnocooperativeAustriannoanalysis of data
[53]operationgeneric controllable assetscooperativegenericnooptimal control problem
[52]operation + investmentbattery storage; demand responsecooperativeItaliannoLP optimization
[51]operation + investmentbattery storagecooperativeItaliannoMILP optimization
[50]operation + investmentbattery storagecooperativeAustriannoMILP optimization
[49]operationbattery storagecooperativegenericyesad hoc algorithm—simulation
[61]operationbattery storagecooperativeItaliannostochastic model predictive control
[48]operationbattery storagecooperativeItaliannoMILP optimization
[47]operation + investmentnocooperativegenericnonon-dominated sorting genetic algorithm
[46]operationnocooperativeItaliannoanalysis of data
[42]operationbattery storage; heat pump; electric vehiclescooperativegenericyesLP optimization
[45]operation + investmentnocooperativeSpanishnocombinatorial optimization
[44]operationnocooperativeItaliannoMILP optimization
[43]operationbattery storagecooperativeItalianyesMILP optimization

4. REC Impact on the Grid

Energy Communities aim to promote local self-consumption within the distribution network (DN). However, they may not necessarily yield positive efficiency outcomes. Drawbacks could arise in the operation of the grid due to potential impacts on voltage profiles, line loading, and short-circuit currents. Moreover, the integration of additional generation into distribution networks may influence both electricity supply volumes and market prices, impacting the operations of transmission and distribution networks. This section presents findings from Google Scholar after searching with the following keywords: “renewable energy communities”, “impact”, “grid”, “power system”, “voltage”, and “power flow”.
Despite the abundant literature on energy communities, only a few works have assessed EC’s impact on the electric grid. For instance, study [55] assesses using a deterministic power flow the impact on the DN of different REC designs featuring BESS of increasing size. Results show that BESS can decrease the overall grid withdrawal and the average voltage variation on all buses. Furthermore, study [62] examined the potential impact of REC on distribution grids, using Linear Programming optimization to size photovoltaics and Energy Storage Systems. However, this evaluation relied on a deterministic approach and was conducted on a simple CIGRE distribution grid model. In particular, generators and energy storage devices are strategically placed based on simplified assumptions, often involving their connection at predetermined nodes positioned either at the initiation or culmination points of the feeder system. Similarly, the case study in [63] analyzed a full-electric community in Denver by employing a physics-based urban energy modeling platform to assess the impact of various technologies on energy usage, carbon emissions, and peak demand. Nevertheless, grid impact assessment was mainly limited to energy balance objectives, such as reducing power peaks injected and absorbed by the grid. Other research efforts also demonstrated limitations in evaluating grid impact. For instance, the study in [63] focuses on detailed appliance modeling for specific houses, while grid impact was only estimated through transformer loading. Study [64] conducted a comprehensive techno-economic analysis using real-world household data, yet its grid impact assessment was confined to estimating maximum power flows through transformers for different energy community configurations. Larger-scale studies, like [65], that evaluate the impact of medium-scale EC development across Europe, mainly focus on capacity expansion in cross-border transmission and national generation and storage. However, they often lack detailed grid modeling, since they often rely on assessments of net transfer capacity between virtual nodes representing specific areas, typically countries. In [66], a grid-focused approach was proposed, in which the objective is to evaluate how different energy communities could impact electric grid operation. Real-life distribution grids, relevant to the Italian scenario, are adopted. The outcomes demonstrate that energy communities in rural areas could have a major impact on the distribution grids’ losses and the branches’ loading factors. A summary of findings is reported in Table 2.
The literature review delineates the inadequate investigation into the impact on the electric grid and the energetic infrastructure, representing a significant gap in energy community planning. Often, evaluations are primarily confined to the requirements imposed by the regulatory framework—namely, the criteria adopted by energy authorities to steer the Energy Community toward what is termed a “grid-positive” evolution. It is evident that the notion of grid-positive communities requires further investigations, as the current understanding remains somewhat vague and generic. To contribute further elucidation on this topic, Section 6.2 provides a comparative description of the regulatory framework currently in place in several European countries. In general, future research should consider grid modeling for system assessment of RECs and possibly treat separately rural and urban RECs when considering grid impact/benefits.
Table 2. Summary of considered studies for REC impacts on the grid.
ReferenceInvestigated AreaInvestigated Network ItemsKPIsMethodsInvolved Technologies
[55]An energy communityA portion of LV DNWithdrawn power; voltage in all LV busesDeterministic power flowPV, BESS
[62]Two suburban areasA portion of MV DN with 2 sub-portions of LV DNVoltage range in the network, line, and transformer maximum loadingsLP optimization and deterministic power flowPV, BESS
[63]Two suburban areasTwo portions of MV DN downstream two transformers, featuring a set of LV transformersEnergy and power flows through LV transformersEnergy modelingDetail of appliances of residential buildings
[64]An energy communityLV DN downstream a transformerMaximum power flows through LV transformersEnergy modelingEnergy community vs. no energy community, PV
[65]EuropeHV network areas and cross-border transitsNeed for storage and new generating capacity to respect transport limitsEnergy modelingEnergy community vs. no energy community, PV, residential demand including heating
[66]A rural vs. an urban areaTwo portions of MV DN with 3 MV transformers featuring a set of LV transformersLine and transformer loading, voltage violationsMonte Carlo-based power flowEnergy community vs. no energy community, PV

5. Social Impact

The EU’s definition of Energy Communities highlights their role in delivering social benefits to their members, emphasizing their primary objective of fostering social and environmental innovation [67]. While the European directive broadly outlines these principles, it lacks a detailed examination of the social impact and measurement methodologies. A systematic review of studies has been performed on Google Scholar by searching the following keywords: “renewable energy communities”, “social”, “energy poverty”, “energy justice”, and “sharing mechanisms”.
This section aims to fill this gap by examining the social aspect of renewable energy communities and conducting a thorough analysis based on existing literature. The focus will be on exploring potential social impacts attributed to RECs and outlining methods for measuring these impacts. Additionally, special attention will be given to the role of RECs as an effective tool for mitigating energy poverty.

5.1. Overview of REC Social Impact

Frequently, the presence of social benefits is assumed as an inherent aspect when framing a project as a community. However, this intuitive belief that energy communities inherently generate positive social impacts is increasingly coming under scrutiny. The effectiveness of RECs in delivering the anticipated positive social impacts remains unclear. This ambiguity is primarily attributed to the lack of quantitative rigor applied to evaluating social impacts compared to the more thorough assessments of economic, environmental, and technical impacts found in the literature. While numerous articles focus on optimization systems for RECs [68,69], including multi-objective approaches that encompass economic, technical, and environmental considerations, the social dimension is often overlooked. Ref. [70] attempted to address this gap by introducing a social objective function, albeit in a specific context. Specifically, this function is applied in a study evaluating demand side management (DSM) in RECs, where the social aspect is conceptualized as the discomfort or inconvenience associated with a particular DSM strategy. It is therefore not possible to generalize this concept to all REC projects. Social targets are more complex to define; this is because different contents should be evaluated. In order to cope with the problem, a study [71] provided a quite detailed literature review on social innovation (SI), whose definition is proposed as “innovation that contributes to the low-carbon energy transition, civic empowerment, and social goals through initiatives such as new forms of governance, social configurations, supportive policies and regulations, and new business models”. The topic is broad and faces the challenge of hosting both technical and social content. Source [72] proposed another comprehensive literature review focusing on the social dimension of energy communities over the last decades.
The social impact of a project includes both tangible and intangible effects on individuals and communities and it can be divided into the “process” dimension, which concerns the depth of involvement of local people, and the “outcomes”, related to benefit-sharing [73]. Measuring these impacts is complex, involving both quantitative and qualitative assessments. Studies often list important social criteria but lack a systematic method for quantification, relying on surveys or binary evaluations of specific actions in REC projects [74].
Below are the main social benefits identified in the literature.
  • Public acceptance of RES [75]: REC projects offer new ways for individuals to perceive and interact with energy generation and supply systems. The NIMBY (Not in My Backyard) phenomenon of energy infrastructure can be greatly reduced because generation actively involves citizens. In many cases, citizens themselves become producers, so that in addition to a positive perception of renewables, they are involved in the front line of energy generation, triggering virtuous mechanisms whereby they consume during peak production hours. This aspect is very important, especially if the community makes use of non-conventional or less common renewable sources such as wood fuel [75].
  • Education [76]: RECs can help implement local sustainability projects to inform people about energy education. This type of activity can be carried out through courses, seminars, and events to inform and raise awareness of energy issues such as meter reading, consumption reduction, and sustainability. The REC can also organize activities with primary schools and visits to the facilities.
  • Local value: Achieving greater energy independence, reducing carbon emissions, alleviating energy poverty, and creating jobs are key factors in increasing local value and contributing to community economic growth. Using community resources such as wind turbines and solar panels not only generates financial returns for the community but also gives members local control over resources and profit-sharing. The surpluses from these efforts can be strategically reinvested into community charitable funds and various initiatives (including improving infrastructure for elderly care and assisted housing and promoting social housing) [73]. During the installation and commissioning period of the plant, jobs can be generated by hiring labor from the locality [76].
  • Health and lifestyle: The installation of renewable energy plants can decrease health problems associated with the emission of pollutants or due to overall negative impacts on the ecosystem by the power plant.
  • Energy democracy: It refers to participation, quality of access to it, change in power structures, and ways of civic ownership. With RECs, the citizens have democratic control over energy investments by becoming co-owners of renewable installations. Participation in renewables ownership and decision-making can be direct, in which case members approve decisions in assembly meetings and decide how the surplus is distributed [77].
  • Energy justice: It refers to access to modern energy systems, representative and collaborative decision-making processes, as well as the explicit consideration of marginalized groups [77].
  • Mitigation of energy poverty: Closely related to these latter aspects is the mitigation of energy poverty among the members [73,77].

5.2. Focus on Energy Poverty Mitigation

On 20 October 2023, the European Commission published a recommendation concerning the phenomenon of energy poverty [5], which has increasingly aggravated in recent years due to the already described energy price rise. The EU recommendation refers to self-consumption schemes as a tool to help overcome the limited ability of people in energy poverty to access renewables and become both consumers and producers of electricity. Being a prosumer and participating in collective self-consumption schemes brings a wide range of non-financial benefits: empowerment, new skills, social inclusion for individuals, and trust and interconnectedness for the community [78]. The EU recommendation also reminds us of how important the role of municipalities is in making collective self-consumption schemes open and accessible to energy-poor households, especially in cases where entry would otherwise entail financial obligations and complex administrative procedures and costs.
As in the case of social impact, there is a dearth of information on how energy poverty can be measured and, especially, how in practice energy communities can help mitigate it.
The three main factors contributing to the risk of energy poverty are poor building efficiency, low income, and high energy prices. It follows from this that certain households may be at greater risk than others, for example when considering geographic area, number of household members, age, occupational status, and type of dwelling [79]. It is, therefore, necessary to work on several fronts and implement multidisciplinary policies that help improve the efficiency of buildings on the one hand and reduce the burden of energy bills in household expenses on the other. RECs can directly help with this second point by reducing consumption and supply tariffs.
The following are real examples of energy communities that have contributed to the mitigation of energy poverty:
  • Enercoop actively endorses Énergie Solidaire, a solidarity fund that promotes microdonations from consumers and renewable energy producers to support those in need. Enercoop customers can contribute 1 cent per kWh from their energy bills, with Energie Solidaire channeling the funds toward associations combating fuel poverty [80].
  • Som Energia collaborates with municipalities to identify energy-poor households, offering support by covering energy bills for struggling members. Additionally, the cooperative allows members to share their memberships with up to five individuals without incurring extra costs, providing benefits to those with lower incomes [81].
  • The solidarity energy community project in eastern Naples is one of the first social projects involving RECs in Italy. The proposed project entails the establishment of an energy community, comprising the Famiglia di Maria Foundation and 40 families facing hardship. A photovoltaic system is installed, partially funded through tax deductions. Socio-assistance services, an educational program on renewable energy procurement, and monitoring of electrical consumption and building quality are provided to families [82].
  • InclusivECs Awards is an initiative spearheaded by La Corriente, a Citizen Energy Community based in Madrid, Spain. It is a non-profit energy cooperative that boasts more than 1000 members and actively engages in initiatives advocating for a just energy transition and inclusive practices for social justice [83].
A theoretical approach, on the other hand, has been adopted in [84], which developed an algorithm for the distribution of RECs’ earnings (sales and possible incentives) that also considers the social status of community members. In addition to the logic already established in the literature such as the use of game theory and the Shapley value [69], algorithms have been developed in parallel that consider not only structural aspects of the REC, such as the percentage of investment and the alignment of consumption with production, in the distribution of economic benefits, but have also included an index that assesses the energy poverty risk of households. This is the Low-Income High-Cost (LIHC) index [79], which considers at risk of energy poverty a household that has an energy expenditure above the median and at the same time an income net of energy expenditure below a threshold value. Thanks to this type of allocation method, it is possible to achieve substantial bill savings for those considered to be at risk of energy poverty while also guaranteeing an economic return for the other members of the REC, thus finding a trade-off between social goals and the acceptability of community members.

5.3. Summary of Tools for Social Impact of RECs

In summary (as done in Table 3), tools for enhancing the social impact of RECs could include simple and transparent methods for the energy poverty analysis of REC members and consequently improved benefit-sharing mechanisms. Also, considering both the benefits and barriers for RECs and energy efficiency provides more effective indications.
Table 3. Summary of considered studies on REC social impact.
ReferenceInvestigated AreaContribution to the Social Impact
[70]Demand side management and multi-objective optimizationMethodology for balancing economic, environmental, and social objectives.
[71]Social innovation and energy transitionReview of links between social innovation and energy community
[72]Social innovationAnalysis of evidence on social innovation in energy communities.
[73]Social aspects of energy transitionOverview of energy communities and social innovation
[74]Integrated microgridsAnalysis of a remote microgrid with social benefits
[75]Social impact of renewable projectsCase study on community projects, definition of public acceptance
[76]Urban sustainable developmentRole of energy community in the development of sustainable cities, definition of local value and education
[77]Social impactReview on social impacts of energy communities, connection with energy poverty
[80,81,82,83]Social energy communitiesExamples of real ECs with a social purpose
[84]Sharing algorithmsMethodology for sharing algorithms with social purposes

6. Regulatory Framework

As described at the beginning, although the legislative framework for collective self-consumption is given by EU Directives, the implementation could vary widely in each Member State. Thus, we propose a description of the realization of collective self-consumption schemes and energy communities in some key EU Member States. A general introduction describes European law, then details are given on the transposition in five States: Germany, Italy, The Netherlands, Portugal, and Spain. In this case, the main sources were laws and regulations from the considered EU Member State. For these countries, a quantitative case study is proposed in Section 6.2 to compare the incentive schemes and business cases.

6.1. European Directive

As already mentioned, the main legislation regarding energy community initiatives and collective self-consumption is represented by the REDII and the IEM directives. REDII defines renewable self-consumers and renewable energy communities as users who produce renewable (electric or thermal) energy inside their premises or in a confined boundary, for their consumption, storing, and/or selling. IEM defines active costumers and citizen energy communities (CECs) as users who produce electricity within confined boundaries, for self-consuming, storing, selling, and/or participating in flexibility or energy efficiency schemes. Another difference is that CECs are responsible for imbalances while RECs are not. Therefore, CECs are their own balance responsible party (BRP), subject to imbalance discipline in case they are not able to produce/consume their exact schedule on the electricity markets. In both cases, these activities should not constitute the primary commercial or professional activities of community members. Also, there are some kinds of limitations to the participation and control of RECs and CECs by large companies. Differences and similarities are better described in Table 4.
Beyond these general characteristics, the actual implementation may significantly differ among Member States. More details on the transposition process of the REDII directive in some key States are given in Section 6.2.

6.2. Transposition for Different Member States

The transposition of the REDII directive has occurred differently among distinct Member States. This section illustrates and compares the resulting operating models stemming from the transposition processes of five European countries: Italy, Portugal, Spain, Germany, and The Netherlands.
Italy has embraced a model called virtual. The energy shared in the community is computed as the minimum between the total energy injected and the total energy withdrawn by the whole community on an hourly basis [85]. Notably, this shared energy does not lead to direct discounts on individual members’ bills, as they continue to be billed for their total energy withdrawal. Instead, the community manager receives a monetary reward, proportional to the energy shared, which is then distributed among the members, according to a chosen rule. The incentive for the energy shared includes a feed-in premium (FIP), whose level depends on the zonal price, the installed capacity of the community plants, and the geographical location of the community [86], and partial reimbursement of the network charges [87], in a cost-reflective usage of the network. Any energy surplus that is not self-consumed by the members is overseen by the community manager, who sells it to the market. They may receive the zonal price or a feed-in tariff, according to the remuneration scheme chosen by the community. However, certain conditions must be met for community members to participate in this model. They must be connected under the same primary substation within the same market zone, and they need to utilize the public distribution grid for sharing energy [88].
The Netherlands is another Member State that has implemented a virtual model characterized by a subsidy scheme (SCE) to support energy cooperatives engaged in RES electricity generation [89]. In this framework, the subsidy is paid to the energy cooperative proportionally to the total energy produced by community-owned plants, up to a predefined maximum eligible production, and it is then distributed among the members. There is no explicit incentive for shared energy in the community. The involvement of additional members allows the installed capacity of the community plant to increase by 5 kW for each new participant, up to a maximum of 100 kW. The subsidy, guaranteed for 15 years, is determined as the difference between a fixed term, called the base amount, designed to cover the investment and the operating costs, ensuring a reasonable return, and a variable term, called the correction amount, that follows the fluctuations in the electricity market price. However, a price floor limits the subsidy in case the energy price gets below a lower threshold. Nevertheless, if the market remuneration exceeds the base amount, the cooperative is allowed to keep the additional revenues. Furthermore, the cooperative can also manage the community production through PPAs with a chosen energy supplier, who acts as the purchasing party. Additional income opportunities arise if community members choose the same energy supplier with whom the PPA was established. Participation in the cooperative requires users and production units to be connected within the same postcode-rose area. This area encompasses the postal code where the plant is situated, along with immediately adjacent postal code areas.
To better clarify the aforementioned incentivization schemes, a graphical representation of the energy and money flows taking place in the Italian and Dutch models is illustrated in Figure 2. Energy flows depicted in italics represent virtual exchanges. Moreover, each pair of energy and monetary flows is color-coded, with darker shades representing energy flows and lighter shades representing the corresponding monetary flows. The saving due to physical self-consumption (if applicable) is not represented as it is seen as an avoided cost.
Countries in the Iberian Peninsula, specifically Portugal and Spain, have instead opted for a model called physical since the energy virtually self-consumed in the community is directly discounted from the members’ bills as it would happen in the case of physical self-consumption. As a result, members are billed by their retailer only for a discounted portion of energy—the energy supply and surplus—rather than for the whole energy physically withdrawn or injected. This concept is clearly illustrated in Figure 3. Figure 3a shows all physical and virtual energy flows within the model, while Figure 3b illustrates how monetary and energy flows are coupled. In particular, both energy withdrawal and energy supply refer to energy taken from the grid. However, the former represents the actual physical energy withdrawn, while the latter represents the virtual energy, discounted of the energy virtually self-consumed within the community, used for billing purposes. A similar logic applies to energy injection and energy surplus, where the former indicates the physical energy injected into the grid and the latter corresponds to the virtual energy considered for market remuneration. The distribution of the energy self-consumed among the community members takes place through allocation coefficients [90,91] that determine the amount of energy billed at the community’s internal price to each community member. Since the community internal transactions generally occur at an intermediate price between the buyers’ retailer buying price and the sellers’ retailer selling price, the community members can either partially purchase their consumption at a reduced rate or sell their injection at a higher price. Additionally, a discount on the grid access tariff is provided for the energy self-consumed. This discount tariff, equivalent to the difference between the full access tariff and the access tariffs of the higher voltage levels to which the community plants are connected, is covered by the community buyers [91,92]. Although Spain and Portugal share similarities, significant differences exist. For instance, the Portuguese regulation permits three types of allocation coefficients: fixed but changing every 15 min [93]; proportional to the members’ energy withdrawal, which is metered every 15 min as well [93]; dynamic [94], based to other rules chosen by the community members. In contrast, Spanish regulation allows just fixed or proportional allocation coefficients [91]. However, fixed coefficients remain unchanged through the year, while proportional coefficients are tied to members’ contractual power. Another noteworthy difference is related to the proximity criteria governing community involvement. In Portugal, members must be connected under the same voltage level with specific criteria on the maximum distance between members and community plants: 2 km for LV units and 4 km for MV units [94]. In Spain instead, the proximity requirement hinges on the population of the municipality where the community plants are situated [95]. The accepted borders align with the municipality itself for towns with a population between 5 and 50 thousand people. For municipalities with less than 5 thousand inhabitants, neighboring towns also have the right to community participation, up to a maximum contingent of 50 thousand inhabitants. In cities with populations exceeding 50 thousand people, community members must be situated within 5 km from the first installation site. Furthermore, the two countries also diverge in surplus management. In Portugal, the individual surpluses are aggregated and managed by the community manager who sells them to the market. In Spain, the surplus is managed individually for every member by their retailer or by a delegate for plants with capacity exceeding 100 kW. Small power plants may be entitled to a simplified remuneration scheme [91], based on a predefined feed-in tariff, while other plants are subjected to the market price.
Finally, the transposition of the REDII directive in Germany has led to the establishment of two distinct models: the full feed-in model and the Tenant electricity model [96]. In the Tenant electricity model, the eligible members are those living in the same building, with community plants being the property of the landlord. The exchange of energy relies on a private network owned by the tenants. In this scenario, the community plants are used to meet the energy demand of the condominium residents. The remaining energy consumption is billed to the users by the landlord who subsequently settles the payments with the energy supplier. Members derive benefits from this arrangement as their electricity costs for the supplied energy are discounted, reaching a minimum of 90% below the local basic tariff. Additionally, members are exempt from paying network or system charges on the energy self-consumed within the building. On the other hand, the landlord receives a direct subsidy, known as the tenant surcharge, for the energy self-consumed. Any surplus is fed to the grid and remunerated according to the method chosen by the plant operator. This may involve, among other possibilities, a feed-in tariff or direct participation in the market with a premium tariff. Again, a graphical representation of the energy and money flows taking place in the two German models is illustrated in Figure 4. As in the previous images, each pair of energy and monetary flows is color-coded, with darker shades representing energy flows and lighter shades representing the corresponding monetary flows. The saving due to physical self-consumption (if applicable) is not represented as it is seen as an avoided cost.
To conclude and better confront the selected incentivization schemes, a summary of the main regulation differences in the aforementioned countries is also represented in Table 5.

7. Case Study on Collective Self-Consumption: International Comparison

To return to the reader a quantitative feeling of the techno-economic performance of different collective self-consumption schemes, the following section describes an international case study, where the regulatory frameworks illustrated in Section 6.2 are compared.

7.1. Input Data and Methodology

The considered national self-consumption frameworks are listed in Table 5. For the sake of replicability, the analysis focuses on a group of electric consumers (and prosumers) living in the same, large building (from now on, also, the community).
Two market and energy scenarios are considered.
  • A Generic Scenario is first proposed, where all the energy, bill, and market data are kept the same and the different collective self-consumption schemes are compared. In particular, for bill and market input data, the EU average is adopted. Instead, the PV production is estimated using a common simulation software [97] and considering a plant located in Frankfurt, Germany.
  • A country-specific Business Case is then added. Each national framework presents different data (e.g., PV production, electric bill, market prices, capital costs) so that the techno-economic results represent a possible business case for each country.
Moreover, a “No incentive” case has been added for the comparison as if located in Frankfurt, Germany for the Generic Scenario and in Milan, Italy for the Business Case. It represents the case of a behind-the-meter PV merchant initiative with no incentives for buying and selling to the market.
The building units are described considering the electric users’ features in Table 6. Some domestic users are present, as well as offices and shops. A building POD is there for the building’s services (e.g., lift, lights), and the only PV plant is behind that meter. It is worth noting that, as per what is described in Section 6.2, The Netherlands and Germany (full feed-in case) cannot host the PV plant behind a consumer’s meter, since it must be pure feed-in: a pure feed-in POD is present in these cases.
Each user is characterized by energy data. Yearly profiles were built for each user based on their own data from Politecnico di Milano. Table 7 shows the consumption, production, self-consumption, and exchange with the grid in the community for the Italian, Portuguese, and Spanish cases. Minimum differences are there for other cases: the German TEM considers as self-consumed all the energy produced by the PV plant and consumed by every community member since the grid is operated by the community itself; the pure feed-in models do not include self-consumption at all. As can be seen, offices and shops have largely more consumption than residential users. The production and self-consumption of the only prosumer, the building POD, are also reported.
Economic data are necessary to characterize the exchanges with the grid: purchased energy cost (bill cost) for different customers, as well as injected energy evaluation at the electricity market price. Capital (capex) and operational expenditures (opex) for PV plants are considered, too. These are reported in Table 8 for the Generic Scenario, where average EU values are adopted for each Member State, and for each country-specific Business Case, where national typical values are considered. The period is the first half of 2021, considered a period characterized by high costs (something we could consider the new normal) but not influenced by the war in Ukraine yet. EU institutional data sources (e.g., Eurostat) are investigated, where possible, complementing with national data if necessary. The non-household bills’ data consider small users, thus higher bill costs.
Table 8. Economic data for the case study.
CaseLocationEquivalent HoursElectricity Market Price (€/MWh)Household Bill Cost (€/MWh)Non-Households Bill Cost (€/MWh)Capex (€/kW)Opex (€/kW/year)
Avg EUFrankfurt115460.50220.30252.001.057.80 (+3085 €/yearin the German TEM for the O&M of the private grid)
GermanyFrankfurt115454.90319.30296.601.358.70 (+3085 €/yearin the TEM for the O&M of the private grid)
ItalyMilan144967.10225.90336.001.207.13
The NetherlandsAmsterdam109456.35128.10232.701.058.54
PortugalLisbon168758.30208.90236.801.056.10
SpainMadrid178358.25232.30281.001.126.79
Main
references
[97][98][99][100][101,102][2,103]
Notes Mean value Q1–Q2 2021All taxes included Private grid operating costs are derived from grid costs in tariff, raised to consider scale economy
In any case (both Generic and Business Case), the adopted incentive is typical for each Member State to have a comparison of the different schemes. The implementation of the collective self-consumption schemes differs from country to country, as described in Section 6.2 and Table 9. Italy has a peculiar scheme, based on a virtual approach where no private grid or submetering is added. The DSOs’ meters are used, and their data are elaborated by the DSOs that return the shared energy. On the shared energy (injected by one member and withdrawn, in the same time window, by another), a twofold incentive is added: part of it covers the avoided grid cost of local consumption, while the other part is an incentive from the Ministry. Germany and The Netherlands are generally based on pure feed-in connection points for RES generation. In Germany, there are two models: a full feed-in and the TEM. The full feed-in scheme includes a pure feed-in PV that receives a premium for each produced and injected MWh. Instead, the TEM considers a community manager (e.g., the landlord) purchasing energy and operating a private electric grid for the community, where the pure feed-in PV injects, and the community members can self-consume. Savings for the community are related to collective purchasing at a convenient bill cost (the REC manager works as an internal electricity retailer and has a profit) and to self-consumption within the private grid (discount on grid costs that results in bill reduction for self-consumption). In addition, the community gets a surcharge on the self-consumed energy and a market premium on the excess energy sold. The Netherlands is based on a feed-in tariff with a floor system that incentivizes produced energy, up to a maximum incentivized volume that is variable with the REC members’ number, as shown in Equation (1). The received price is set to the basic amount (BA), so if the market price gets below the basic amount, the difference between the two is compensated, so that the community continues to receive the basic amount. However, if the market price gets below the lower basic amount (LBA), the incentives no more increase. Oppositely, if the market price is above the basic amount, the community gets the market price, keeping the additional revenues. There is no trading within the community or shared energy.
S U B = m a r k e t   p r i c e m a r k e t   p r i c e > B A S U B = B A L B A < m a r k e t   p r i c e < B A S U B = [ B A L B A m a r k e t   p r i c e ] m a r k e t   p r i c e < L B A
Spain and Portugal implement a similar scheme and are the only ones considering peer-to-peer energy trading among members. Revenues for the community come from the fact that shared energy is bought at an internal price, directly paid to the producer. Therefore, no energy cost is paid in the bill for shared energy. In addition, in Spain, there is a discount on the grid cost for shared energy, too.
Table 9. Incentive framework.
National SchemeComponentValueSource
ItalyMinistry incentive (TIP) on shared energy (ESH) 120.0 €/MWh (+10 €/MWh for plants in the North, due to less radiation)[102]
NRA incentive (TRASE) on shared energy (ESH) 10.1 €/MWh[104]
[103]
Germany
Full Feed-In (FFI)
Full market premium (MP) on the energy produced (EP)38.8 €/MWh[105]
Germany
Tenant Electricity Model (TEM)
PV surcharge (PVSUR) on energy self-consumed (ESELF)26.5 €/MWh
Partial market premium (MP) on the energy injected (EINJ)0.0 €/MWh
Bill reduction (BR) for self-consumed energy (ESELF)66%[106]
The NetherlandsBasic Amount (BA)106.0 €/MWh[107,108,109]
Lower Basic Amount (LBA)44.0 €/MWh
Maximum incentivized energy volume (EMAX)90 MWh/year
PortugalInternal price (PI) on shared energy (ESH)140.4 €/MWh[110]
Reduced network access tariffs ( λ grid) for shared energy (ESH)63.7 €/MWh[111]
SpainInternal price (PI) on shared energy (ESH)145.0 €/MWh[110]
Reduced network access tariffs ( λ grid) for shared energy (ESH)0.0 €/MWh[112]
The results are given in terms of technical and economic results, considering the community as a whole. The redistribution of revenues toward each community member is out of scope. Four main types of revenues are considered and applied to the corresponding energy flows as indicated previously in Section 6.2. Table 10 summarises the computation required to define the main energy fluxes in each case, while Table 11 illustrates in detail the calculations carried out for the techno-economic analysis, for each type of defined revenue, according to the country’s regulation.
  • Avoided bill costs due to physical self-consumption (R1);
  • net incentive on energy shared or energy collectively self-consumed (R2);
  • incentive on injected energy (R3);
  • market revenues on injected energy (R4).
The second and third terms represent revenues from the incentive framework for communities, while the first and the fourth would generally be present even without the collective self-consumption schemes. The payback time (PBT) is computed with a 6% discount rate, while the internal rate of return (IRR) is computed for 10 years.

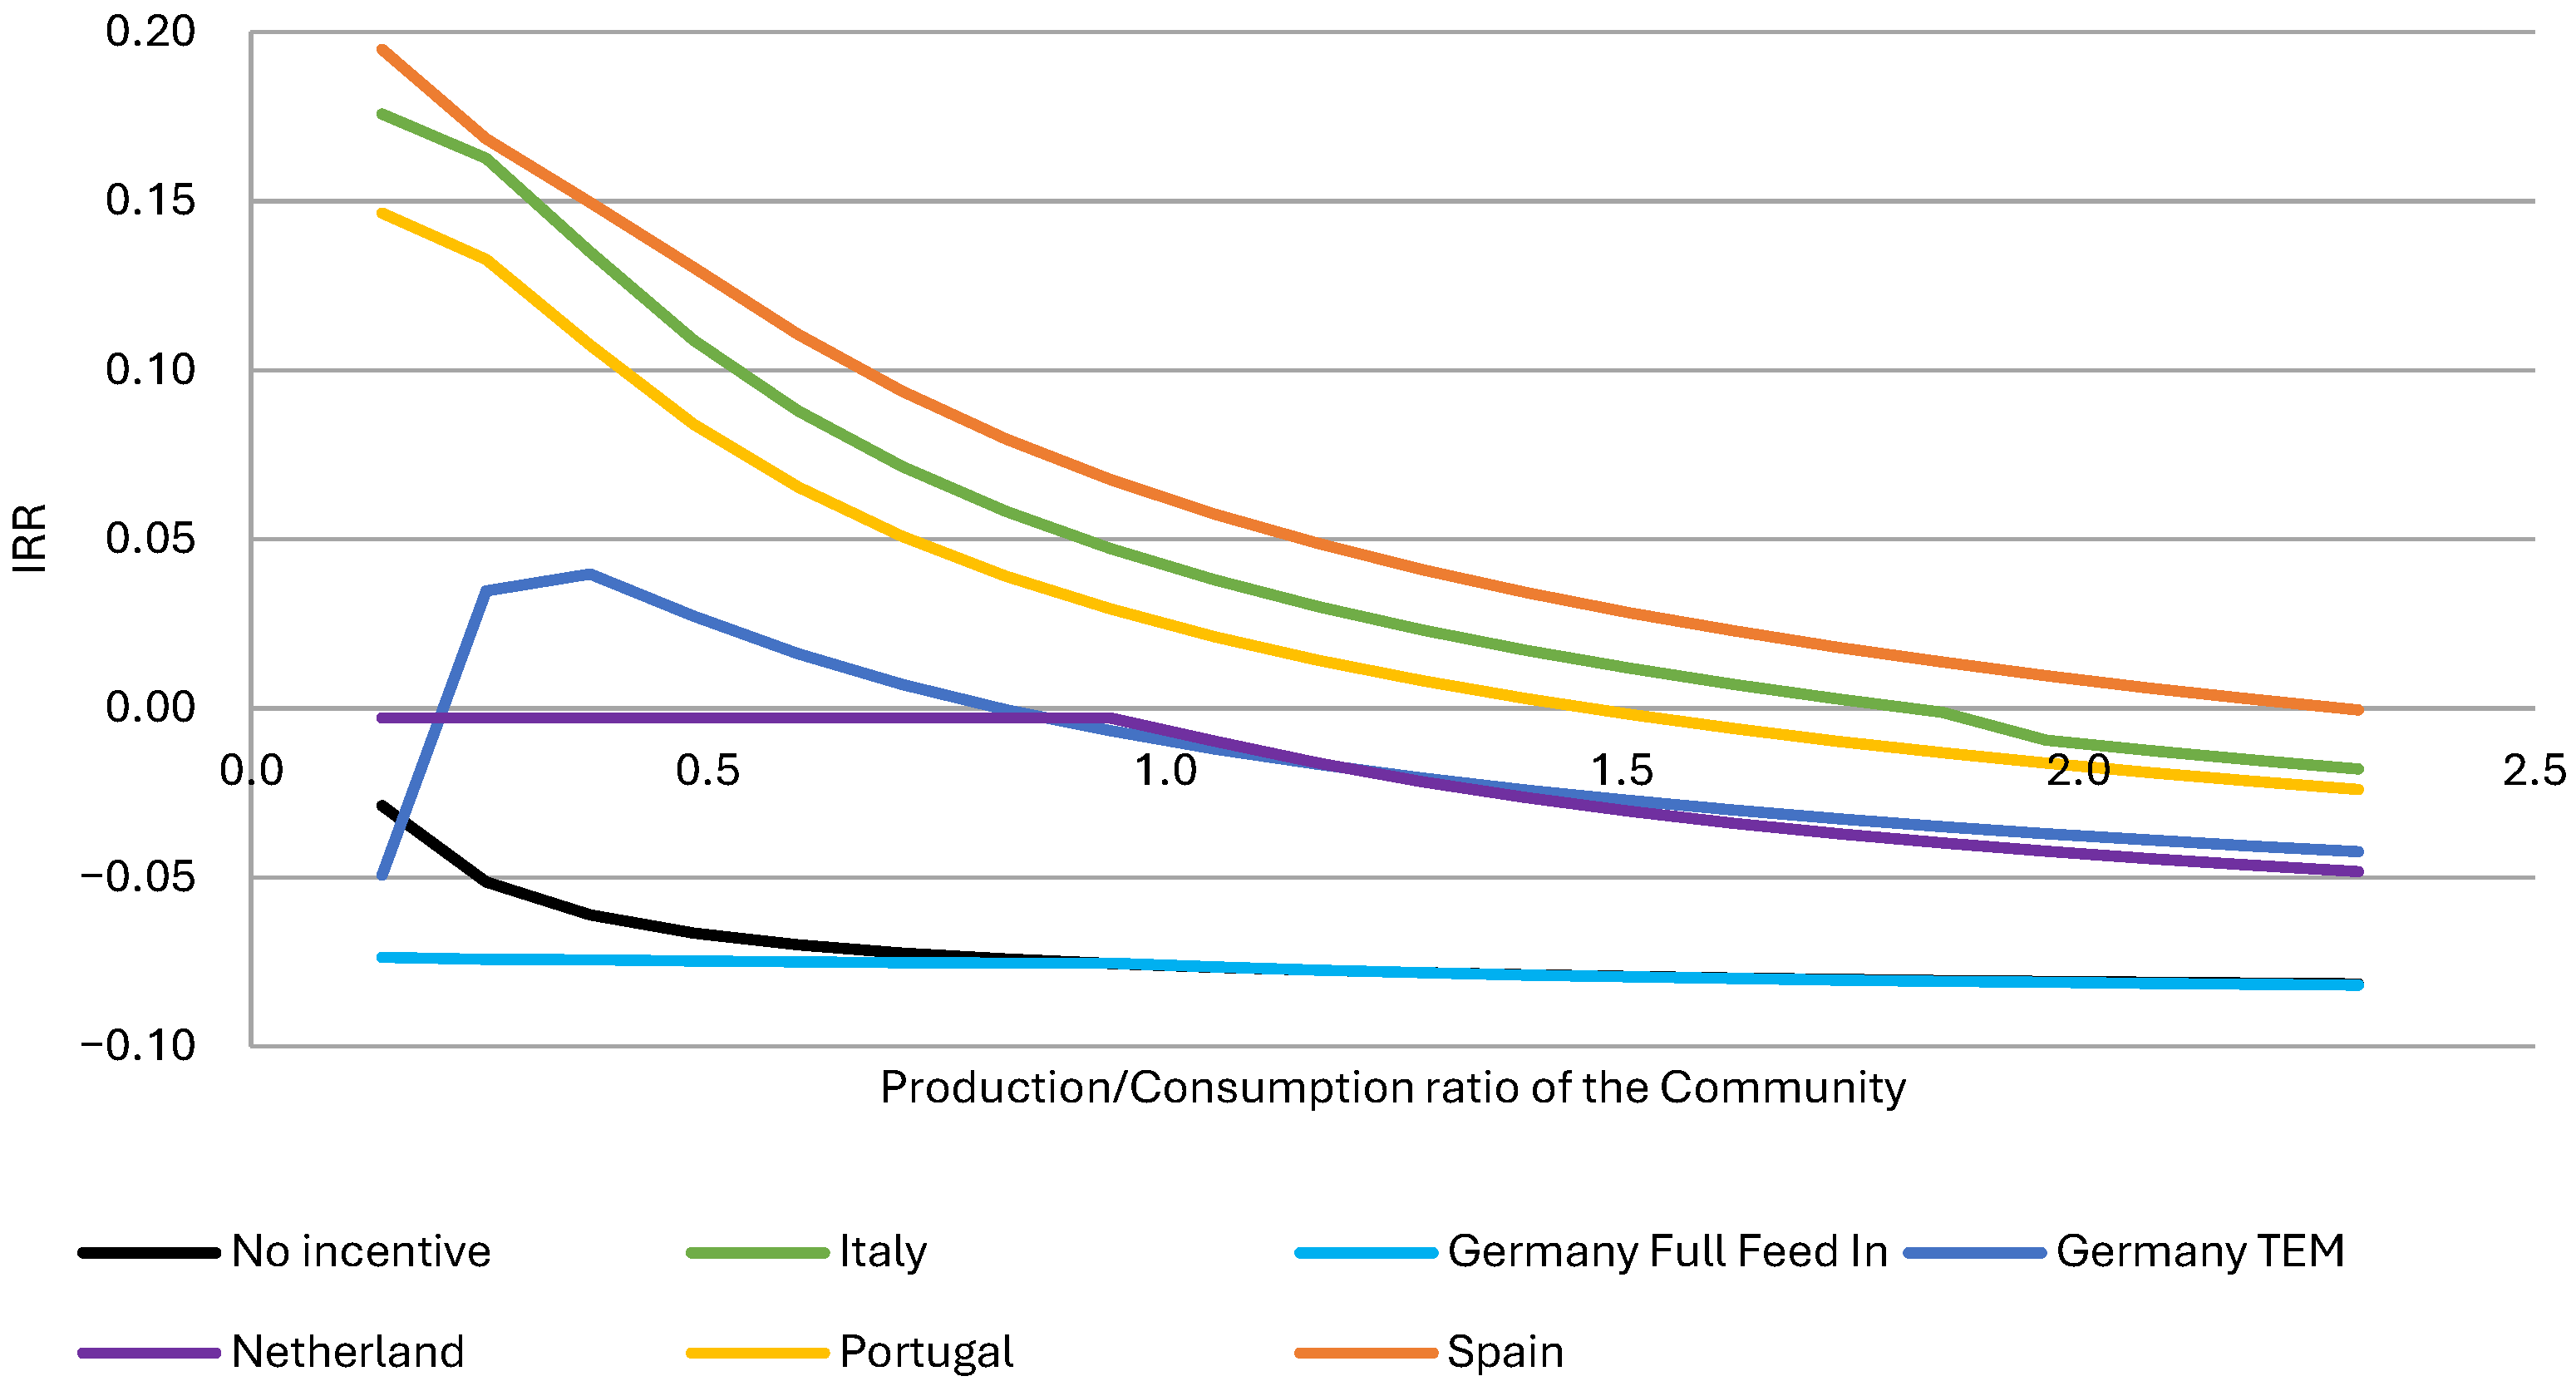
7.2. Results and Discussion

The results for the General Scenario are presented here below, considering both technical and economic findings. For what concerns the energy flows, Table 12 reports all the quantities for the community. With respect to the reported quantities, the cases with pure feed-in (Germany and The Netherlands) have null values of self-consumed energy. Shared energy is instead a concept only applied in Italy, Spain, and Portugal. As can be seen, the considered case study has balanced production and consumption. Most of the production is not consumed behind the meter, and there is large room for sharing within the community.
The essential economic findings are returned in Table 13. Revenues are widely different. In case of no incentive, only market and bill-based revenues are present (R1, R4). All the schemes but pure feed-in schemes in Germany and The Netherlands, include the concept of shared energy (or collectively self-consumed for German TEM) and associate an incentive to that energy flow (R2). An incentive for the injected energy is foreseen in Germany FFI, The Netherlands, and the Iberian Peninsula (R3). The case with No incentive is included, to compare with a merchant PV system behind the meter, injecting energy directly into the market and receiving the market price. As can be seen, every incentive scheme improves the situation with no incentives. Germany’s full feed-in (FFI) has a slight improvement concerning the merchant case, given by the net effect of no self-consumption and the premium on the injected energy. Only the schemes of Southern European Member States return a positive IRR. The obtained results, in terms of PBT and IRR, clearly highlight that different incentivization schemes provide a wide range of outcomes under the same case study conditions. In particular, it is notable that the incentivization models implemented in Southern Europe countries tend to offer greater benefits, resulting in faster break-evens, compared to those in Central Europe countries. However, this observation does not necessarily indicate as wrong the incentivization schemes of Central European countries since, in all cases, the PBT remains under 20 years, meaning that the investment remains profitable over time. It is important to consider, though, the purposes of the incentivization schemes. In fact, even if in Southern Europe the results appear more favorable, whereas those in Central Europe are less advantageous, Central Europe countries already have a well-established network of collective self-consumption schemes. Therefore, the two regions, being at different stages of development, might require more or less advantageous incentivization schemes, according to their specific context.
To develop the Business Cases, the same simulations were run, substituting the previously adopted EU average data for the country-specific ones from Table 8. The project economic indicators are shown in Table 14. They are qualitatively similar to the General Scenario’s ones. The gap between the positive economic results in Southern Europe and the lower IRRs in Central Europe expands. This is because PV productivity is larger in Southern Europe, while capex and opex are slightly lower. In the Iberian Peninsula, PBT is equal to or lower than 10 years and IRR is in the order of 10%.
It is worth noting that these results consider a disadvantaged technical framework: a large PV system built behind a meter consuming a small amount of energy. This brings to very limited self-consumption (less than 2% of production), partially compromising the economic result. Therefore, a strong incentive scheme brings wide improvement in the economics of the project. As of today (beginning in 2024), PV projects are in grid parity in many cases and countries, even at a small scale [111]. A sensitivity analysis is presented in Figure 5 to provide a result for different installed PV power. The sensitivity analysis is based on a varying Production/Consumption ratio in the community, ranging from 0 to 2.5: if the ratio is 1, it means that the yearly PV production equals the overall yearly community consumption; a value of 0.5 indicates that production is 50% of the consumption; a value of 2 highlights a production that doubles the consumption. A set of simulations has been carried out with the previously illustrated techno-economic model to increase the installed PV from 0 to a power coherent with producing 2.5 times the energy consumed in the community. As can be seen, for a small production/consumption ratio, higher IRRs are shown. Increasing the PV size, IRRs generally decrease, except for Germany’s TEM, which shows a maximum of around 0.4, and The Netherlands, which is flat up to 1.0.
The comparison returned some insights into the regulatory frameworks for collective self-consumption schemes around the EU. In particular, larger improvements with respect to No incentive cases are achieved where energy communities have a younger life and less diffusion, as it is in Southern Europe. In Germany and The Netherlands, where more community projects are already present, fewer economic nudges are given by the incentive scheme.
Additionally, some schemes foster the installation of larger PV systems (e.g., The Netherlands and German TEM) with IRR that keep stable (or even increase) in case of more PV, while some others return project economic indexes inversely proportional to PV size.

8. Conclusions

The proposed review was conducted to investigate the EU framework of community energy initiatives from economic, technical, social, and regulatory perspectives.
From a technical standpoint, it has been shown that these schemes could foster the diffusion of small-scale PV systems and partially cope with the possible negative impacts of non-programmable generation on distribution networks. Additionally, the local nature of these projects, along with the possibility of investment costs and economic benefits to be shared among members, could enhance the participation of vulnerable consumers in RES projects.
From a regulatory perspective, various schemes for RECs are developed across Member States. For instance, differences can be observed in the type of process that is incentivized (self-consumption, grid injection, or renewable capacity installation), but also on the incentive structure (either fixed or variable with electricity market prices). Other differences may be observed in energy community responsibilities. For instance, the grid operation can be in charge of the community manager (private grid) or remain among the duties of the distributor, and transactions could be carried out (also) through peer-to-peer mechanisms or (only) through centralized markets.
Economic-wise, the quantitative case study implemented in this paper has highlighted that each scheme provides community benefit when compared to no incentives scenarios; however, larger economic benefits were observed in Member States where energy communities have been historically less diffused.
From a social perspective, it can be noted that a clear definition of vulnerable users and energy poverty is lacking. If RECs are expected to mitigate this issue, clearer indexes should be introduced, and benefit-sharing algorithms considering REC members vulnerabilities should be proposed as a standard. This would also influence how RECs are planned and operated. As can be drawn from the carried-out review, most implementations and academic studies have been focused on optimizing the economic and environmental side of the project. However, a shift toward social studies is expected in the future to make community energy initiatives an effective tool for the Just Transition.
Some advice for policymaking can also be drawn from the study. First, rapid implementation and promotion of community energy schemes are needed to support bottom-up RES projects and increase the social acceptability of RES. Then, the development of regulatory schemes aware of the physics of the power network can foster benefits for the infrastructures, resulting in a lower need for grid reinforcement in the long term. As previously shown, some mechanisms present a correlation between economic incentives and the rational use of the grids (e.g., in Italy a small portion of the energy value is related to abated grid costs, in Iberia the physical model incentivizes local exchange, in Germany the community should operate its distribution grid). In any case, the economic benefit of the initiative is poorly connected with the positive impact on the grid: this correlation could be improved as the mechanisms mature. Additionally, some national schemes present variable tariff schemes, inversely proportional to electricity market prices: these results as a best practice to ensure stability in mitigating the rise of public burden. Indeed, this is the principle of both contracts for differences promoted by the Electricity Market Reform [113] and the Italian incentive on shared energy.
Possible future works could include an analysis of the economic efficiency of incentive schemes, considering the multiplier effect that incentives can have on citizens’ savings. Indeed, by stimulating RES investments through public support, incentives can convey additional earnings/savings from private bodies to citizens (e.g., avoided bill costs or new revenues for energy sales). The evaluation of this multiplier effect could enhance policy design for “green” investments. Lastly, since the literature is still lacking quantitative studies on REC social impacts, future research could also move in this direction, such that tailor-made algorithms for economic benefit sharing among REC members are also developed.

Author Contributions

Conceptualization, F.B., V.T., M.M. and G.R.; Methodology, G.T., L.C., C.B. and G.R.; Investigation, G.T., L.C. and C.B.; Data curation, C.B.; Writing—original draft, G.T., L.C., V.T., M.M. and G.R.; Writing—review & editing, G.T. and G.R.; Supervision, F.B., M.M. and G.R. All authors have read and agreed to the published version of the manuscript.

Funding

This research has received funding from “Ecosystem for Sustainable Transition in Emilia-Romagna”, a project funded by the European Union under the National Recovery and Resilience Plan (NRRP), Mission 04 Component 2 Investment 1.5—NextGenerationEU, Call for tender n. 3277 dated 30 December 2021, Award Number: 0001052, dated 23 June 2022. This research was partially carried out within the NEST—Network 4 Energy Sustainable Transition (D.D. n. 1561, 1.10.2022, PE0000021) and received funding under the NRRP, Mission 4 Component 2 Investment 1.3, funded by the European Union—NextGenerationEU. This manuscript reflects only the authors’ views and opinions; neither the European Union nor the European Commission can be considered responsible for them.

Institutional Review Board Statement

Not applicable.

Informed Consent Statement

Not applicable.

Data Availability Statement

The raw data supporting the conclusions of this article will be made available by the authors on request.

Conflicts of Interest

The authors declare no conflict of interest.

References

  1. IEA. Renewables 2023; IEA: Paris, France, 2024; Available online: www.iea.org (accessed on 29 January 2024).
  2. IRENA. Renewable Energy Generation Costs in 2022; IRENA: Abu Dhabi, United Arab Emirates, 2023. [Google Scholar]
  3. COP28. Outcome of the First Global Stocktake. In Proceedings of the Conference of the Parties Serving as the Meeting of the Parties to the Paris Agreement Fifth Session, Dubai, United Arab Emirates, 30 November–12 December 2023. [Google Scholar]
  4. European Commission. COM/2023/148 Final; European Commission: Brussels, Belgium, 2023; Available online: https://eur-lex.europa.eu/legal-content/EN/TXT/?uri=CELEX%3A52023PC0148&amp%3Bqid=1679410882233 (accessed on 29 January 2024).
  5. European Commission. Commission Recommendation (EU) 2023/2407 of 20 October 2023 on Energy Poverty; European Commission: Brussels, Brussels, 2023; Available online: https://eur-lex.europa.eu/legal-content/EN/TXT/?uri=OJ%3AL_202302407 (accessed on 29 January 2024).
  6. Bouzarovski, S.; Thomson, H.; Cornelis, M. Towards an Inclusive Energy Transition in the European Union: Confronting Energy Poverty Amidst a Global Crisis; European Commission: Brussels, Belgium, 2020; Available online: https://op.europa.eu/it/publication-detail/-/publication/4a440cf0-b5f5-11ea-bb7a-01aa75ed71a1/language-en (accessed on 6 April 2023).
  7. Lowitzsch, J.; Hoicka, C.E.; van Tulder, F.J. Renewable energy communities under the 2019 European Clean Energy Package–Governance model for the energy clusters of the future? Renew. Sustain. Energy Rev. 2020, 122, 109489. [Google Scholar] [CrossRef]
  8. Shi, Z.; Liang, F.; Pezzuolo, A. Renewable energy communities in rural areas: A comprehensive overview of current development, challenges, and emerging trends. J. Clean. Prod. 2024, 484, 144336. [Google Scholar] [CrossRef]
  9. Gjorgievski, V.Z.; Cundeva, S.; Georghiou, G.E. Social arrangements, technical designs and impacts of energy communities: A review. Renew. Energy 2021, 169, 1138–1156. [Google Scholar] [CrossRef]
  10. Ahmed, S.; Ali, A.; D’angola, A. A Review of Renewable Energy Communities: Concepts, Scope, Progress, Challenges, and Recommendations. Sustainability 2024, 16, 1749. [Google Scholar] [CrossRef]
  11. Xiao, Y.; Watson, M. Guidance on Conducting a Systematic Literature Review. J. Plan Educ. Res. 2019, 39, 93–112. [Google Scholar] [CrossRef]
  12. Purvis, B.; Mao, Y.; Robinson, D. Three pillars of sustainability: In search of conceptual origins. Sustain. Sci. 2019, 14, 681–695. [Google Scholar] [CrossRef]
  13. EEA. Trends and Projections in Europe; EEA: Copenhagen, Denmark, 2021; Available online: https://www.eea.europa.eu/publications/trends-and-projections-in-europe-2021 (accessed on 9 January 2024).
  14. European Council. EUCO 169/14; European Council: Brussels, Belgium, 2014. [Google Scholar]
  15. EEA. Trends and Projections in Europe; EEA: Copenhagen, Denmark, 2023; Available online: https://www.eea.europa.eu//publications/trends-and-projections-in-europe-2023 (accessed on 9 January 2024).
  16. European Commission. The European Green Deal (COM/2019/640); European Commission: Brussels, Belgium, 2019. [Google Scholar]
  17. European Commission. Legal Documents on Delivering the European Green Deal-European Commission; European Commission: Brussels, Belgium, 2019; Available online: https://commission.europa.eu/publications/legal-documents-delivering-european-green-deal_en (accessed on 9 January 2024).
  18. ACER. ACER’s Preliminary Assessment of Europe’s High Energy Prices and the Current Wholesale Electricity Market Design; ACER: Brussels, Belgium, 2021. [Google Scholar]
  19. ACER. Wholesale Electricity Market Monitoring; ACER: Brussels, Belgium, 2022. [Google Scholar]
  20. European Commission. REPowerEU (COM/2022/230 Final); European Commission: Brussels, Belgium, 2022; Available online: https://eur-lex.europa.eu/legal-content/EN/TXT/?uri=COM%3A2022%3A230%3AFIN&qid=1653033742483 (accessed on 9 January 2024).
  21. Wirth, H.; Pforr, K. The European Union Statistics on Income and Living Conditions after 15 Years. Eur. Sociol. Rev. 2022, 38, 832–848. [Google Scholar] [CrossRef]
  22. EPAH. Tackling Energy Poverty Through Local Actions—Inspiring Cases from Across Europe; EPAH: Brussels, Belgium, 2020. [Google Scholar]
  23. EPAH. EU Energy Poverty Advisory Hub-Leaflet; EPAH: Brussels, Belgium, 2022. [Google Scholar]
  24. European Commission. Clean Energy for All Europeans; European Commission: Brussels, Belgium, 2019; Available online: https://data.europa.eu/doi/10.2833/9937.
  25. Soeiro, S.; Dias, M.F. Renewable energy cooperatives: A systematic review. In Proceedings of the 2019 16th International Conference on the European Energy Market (EEM), Ljubljana, Slovenia, 18–20 September 2019. [Google Scholar] [CrossRef]
  26. Grignani, A.; Gozzellino, M.; Sciullo, A.; Padovan, D. Community Cooperative: A New Legal Form for Enhancing Social Capital for the Development of Renewable Energy Communities in Italy. Energies 2021, V14, 7029. [Google Scholar] [CrossRef]
  27. Federal Ministry for Economic Affairs and Climate Actions. BMWK-Minister Habeck: ‘More Speed and Less Bureaucracy for the Expansion of Solar Energy’–Solar Package Paves the Way for the rAte of Expansion to Triple. Available online: https://www.bmwk.de/Redaktion/EN/Pressemitteilungen/2023/08/20230816-more-speed-and-less-bureaucracy-for-the-expansion-of-solar-energy.html (accessed on 9 January 2024).
  28. Yang, X.; Hu, M.; Tukker, A.; Zhang, C.; Huo, T.; Steubing, B. A bottom-up dynamic building stock model for residential energy transition: A case study for the Netherlands. Appl. Energy 2022, 306, 118060. [Google Scholar] [CrossRef]
  29. Caramizaru, A.; Uihlein, A.; European Commission; Joint Research Centre. Energy Communities: An Overview of Energy and Social Innovation; Publications Office of the European Union: Luxembourg, 2020. [Google Scholar]
  30. Johannes, D.-I.; Franz, F.; Dorfner, C. Open Source Modelling and Optimisation of Energy Infrastructure at Urban Scale; Technical University of Munich: München, Germany, 2016. [Google Scholar]
  31. Vardakas, J.S.; Zenginis, I.; Zorba, N.; Echave, C.; Morato, M.; Verikoukis, C. Electrical Energy Savings through Efficient Cooperation of Urban Buildings: The Smart Community Case of Superblocks’ in Barcelona. IEEE Commun. Mag. 2018, 56, 102–109. [Google Scholar] [CrossRef]
  32. Putratama, M.A.; Rigo-Mariani, R.; Mustika, A.D.; Debusschere, V.; Pachurka, A.; Besanger, Y. A Three-Stage Strategy with Settlement for an Energy Community Management Under Grid Constraints. IEEE Trans. Smart Grid. 2023, 14, 1505–1514. [Google Scholar] [CrossRef]
  33. Berg, K.; Rana, R.; Farahmand, H. Quantifying the benefits of shared battery in a DSO-energy community cooperation. Appl. Energy 2023, 343, 121105. [Google Scholar] [CrossRef]
  34. Srithapon, C.; Månsson, D. Predictive control and coordination for energy community flexibility with electric vehicles, heat pumps and thermal energy storage. Appl. Energy 2023, 347, 121500. [Google Scholar] [CrossRef]
  35. Lilla, S.; Orozco, C.; Borghetti, A.; Napolitano, F.; Tossani, F. Day-Ahead Scheduling of a Local Energy Community: An Alternating Direction Method of Multipliers Approach. IEEE Trans. Power Syst. 2020, 35, 1132–1142. [Google Scholar] [CrossRef]
  36. Jo, H.C.; Kim, J.Y.; Byeon, G.; Kim, S.K. Optimal Scheduling Method of Community Microgrid with Customer-owned Distributed Energy Storage System. In Proceedings of the SEST 2019—2nd International Conference on Smart Energy Systems and Technologies, Porto, Portugal, 9–11 September 2019. [Google Scholar] [CrossRef]
  37. Barone, G.; Buonomano, A.; Forzano, C.; Palombo, A.; Russo, G. The role of energy communities in electricity grid balancing: A flexible tool for smart grid power distribution optimization. Renew. Sustain. Energy Rev. 2023, 187, 113742. [Google Scholar] [CrossRef]
  38. Houben, N.; Cosic, A.; Stadler, M.; Mansoor, M.; Zellinger, M.; Auer, H.; Ajanovic, A.; Haas, R. Optimal dispatch of a multi-energy system microgrid under uncertainty: A renewable energy community in Austria. Appl. Energy 2023, 337, 120913. [Google Scholar] [CrossRef]
  39. Koltunov, M.; Pezzutto, S.; Bisello, A.; Lettner, G.; Hiesl, A.; van Sark, W.; Louwen, A.; Wilczynski, E. Mapping of Energy Communities in Europe: Status Quo and Review of Existing Classifications. Sustainability 2023, 15, 8201. [Google Scholar] [CrossRef]
  40. Gan, L.; Topcu, U.; Low, S.H. Optimal decentralized protocol for electric vehicle charging. IEEE Trans. Power Syst. 2013, 28, 940–951. [Google Scholar] [CrossRef]
  41. De Paola, A.; Angeli, D.; Strbac, G. Price-Based Schemes for Distributed Coordination of Flexible Demand in the Electricity Market. IEEE Trans. Smart Grid. 2017, 8, 3104–3116. [Google Scholar] [CrossRef]
  42. Thomas, D.; Kotsakis, E.; Kounelis, I.; De Paola, A.; Fulli, G. Blockchain-enabled Local Market for Sharing Storage in Energy Communities. In Proceedings of the 2023 IEEE PES Conference on Innovative Smart Grid Technologies-Middle East, ISGT Middle East 2023-Proceedings, Abu Dhabi, United Arab Emirates, 12–15 March 2023. [Google Scholar] [CrossRef]
  43. Moncecchi, M.; Meneghello, S.; Merlo, M. A Game Theoretic Approach for Energy Sharing in the Italian Renewable Energy Communities. Appl. Sci. 2020, 10, 8166. [Google Scholar] [CrossRef]
  44. De Paola, A.; Thomas, D.; Kotsakis, E.; Fulli, G.; Lugano, M.; Ferrero, D.; Olivero, S. A Predictive Tool for Techno-Economical Analyses of Renewable Energy Communities. In Proceedings of the 2023 International Conference on Smart Energy Systems and Technologies, SEST 2023, Mugla, Turkiye, 4–6 September 2023. [Google Scholar] [CrossRef]
  45. Calise, F.; Vicidomini, M.; Cappiello, F.L.; Cutore, E.; Fichera, A.; Volpe, R. A Roadmap for the Design, Operation and Monitoring of Renewable Energy Communities in Italy. Sustainability 2023, 15, 8118. [Google Scholar] [CrossRef]
  46. Mucha-Kuś, K.; Sołtysik, M.; Zamasz, K.; Szczepańska-Woszczyna, K. Coopetitive Nature of Energy Communities—The Energy Transition Context. Energies 2021, 14, 931. [Google Scholar] [CrossRef]
  47. Jasiński, J.; Kozakiewicz, M.; Sołtysik, M. Determinants of Energy Cooperatives’ Development in Rural Areas—Evidence from Poland. Energies 2021, 14, 319. [Google Scholar] [CrossRef]
  48. Fina, B.; Auer, H. Economic Viability of Renewable Energy Communities under the Framework of the Renewable Energy Directive Transposed to Austrian Law. Energies 2020, 13, 5743. [Google Scholar] [CrossRef]
  49. Casalicchio, V.; Manzolini, G.; Prina, M.G.; Moser, D. From investment optimization to fair benefit distribution in renewable energy community modelling. Appl. Energy 2022, 310, 118447. [Google Scholar] [CrossRef]
  50. Rossi, F.; Heleno, M.; Basosi, R.; Sinicropi, A. LCA driven solar compensation mechanism for Renewable Energy Communities: The Italian case. Energy 2021, 235, 121374. [Google Scholar] [CrossRef]
  51. Cosic, A.; Stadler, M.; Mansoor, M.; Zellinger, M. Mixed-integer linear programming based optimization strategies for renewable energy communities. Energy 2021, 237, 121559. [Google Scholar] [CrossRef]
  52. Norbu, S.; Couraud, B.; Robu, V.; Andoni, M.; Flynn, D. Modeling economic sharing of joint assets in community energy projects under LV network constraints. IEEE Access 2021, 9, 112019–112042. [Google Scholar] [CrossRef]
  53. Bianchi, F.; Bosio, B.; Conte, F.; Massucco, S.; Mosaico, G.; Natrella, G.; Saviozzi, M. Modelling and optimal management of renewable energy communities using reversible solid oxide cells. Appl. Energy 2023, 334, 120657. [Google Scholar] [CrossRef]
  54. De Juan-Vela, P.; Alic, A.; Trovato, V. Monitoring the Italian transposition of the EU regulation concerning renewable energy communities and the relevant policies for battery storage. J. Clean. Prod. 2023, 425, 138937. [Google Scholar] [CrossRef]
  55. Secchi, M.; Barchi, G.; Macii, D.; Moser, D.; Petri, D. Multi-objective battery sizing optimisation for renewable energy communities with distribution-level constraints: A prosumer-driven perspective. Appl. Energy 2021, 297, 117171. [Google Scholar] [CrossRef]
  56. Ghiani, E.; Trevisan, R.; Rosetti, G.L.; Olivero, S.; Barbero, L. Energetic and Economic Performances of the Energy Community of Magliano Alpi after One Year of Piloting. Energies 2022, 15, 7439. [Google Scholar] [CrossRef]
  57. Sudhoff, R.; Schreck, S.; Thiem, S.; Niessen, S. Operating Renewable Energy Communities to Reduce Power Peaks in the Distribution Grid: An Analysis on Grid-Friendliness, Different Shares of Participants, and Economic Benefits. Energies 2022, 15, 5468. [Google Scholar] [CrossRef]
  58. Lazzari, F.; Mor, G.; Cipriano, J.; Solsona, F.; Chemisana, D.; Guericke, D. Optimizing planning and operation of renewable energy communities with genetic algorithms. Appl. Energy 2023, 338, 120906. [Google Scholar] [CrossRef]
  59. Cielo, A.; Margiaria, P.; Lazzeroni, P.; Mariuzzo, I.; Repetto, M. Renewable Energy Communities business models under the 2020 Italian regulation. J. Clean. Prod. 2021, 316, 128217. [Google Scholar] [CrossRef]
  60. De Juan-Vela, P.; Alic, A.; Trovato, V. Impact of policy options on battery storage in renewable energy communities. In Proceedings of the 2023 19th International Conference on the European Energy Market (EEM), Lappeenranta, Finland, 6–8 June 2023. [Google Scholar] [CrossRef]
  61. Aittahar, S.; de Villena, M.M.; Derval, G.; Castronovo, M.; Boukas, I.; Gemine, Q.; Ernst, D. Optimal control of renewable energy communities with controllable assets. Front. Energy Res. 2023, 11, 879041. [Google Scholar] [CrossRef]
  62. Weckesser, T.; Dominković, D.F.; Blomgren, E.M.V.; Schledorn, A.; Madsen, H. Renewable Energy Communities: Optimal sizing and distribution grid impact of photo-voltaics and battery storage. Appl. Energy 2021, 301, 117408. [Google Scholar] [CrossRef]
  63. Narayanamurthy, R. Grid Integration of Zero Net Energy Communities; Palo Alto: Santa Clara, CA, USA, 2017. [Google Scholar]
  64. Mehta, P.; Tiefenbeck, V. Solar PV sharing in urban energy communities: Impact of community configurations on profitability, autonomy and the electric grid. Sustain. Cities Soc. 2022, 87, 104178. [Google Scholar] [CrossRef]
  65. Backe, S.; Zwickl-Bernhard, S.; Schwabeneder, D.; Auer, H.; Korpås, M.; Tomasgard, A. Impact of energy communities on the European electricity and heating system decarbonization pathway: Comparing local and global flexibility responses. Appl. Energy 2022, 323, 119470. [Google Scholar] [CrossRef]
  66. Dimovski, A.; Moncecchi, M.; Merlo, M. Impact of energy communities on the distribution network: An Italian case study. Sustain. Energy Grids Netw. 2023, 35, 101148. [Google Scholar] [CrossRef]
  67. Energy Communities. Available online: https://energy.ec.europa.eu/topics/markets-and-consumers/energy-communities_en (accessed on 25 January 2024).
  68. Faria, J.; Marques, C.; Pombo, J.; Mariano, S.; Calado, M.d.R. Optimal Sizing of Renewable Energy Communities: A Multiple Swarms Multi-Objective Particle Swarm Optimization Approach. Energies 2023, 16, 7227. [Google Scholar] [CrossRef]
  69. Zatti, M.; Moncecchi, M.; Gabba, M.; Chiesa, A.; Bovera, F.; Merlo, M. Energy communities design optimization in the italian framework. Appl. Sci. 2021, 11, 5218. [Google Scholar] [CrossRef]
  70. Mariuzzo, I.; Fioriti, D.; Guerrazzi, E.; Thomopulos, D.; Raugi, M. Multi-objective planning method for renewable energy communities with economic, environmental and social goals. Int. J. Electr. Power Energy Syst. 2023, 153, 109331. [Google Scholar] [CrossRef]
  71. Dall-Orsoletta, A.; Cunha, J.; Araújo, M.; Ferreira, P. A systematic review of social innovation and community energy transitions. Energy Res. Soc. Sci. 2022, 88, 102625. [Google Scholar] [CrossRef]
  72. Hewitt, R.J.; Bradley, N.; Compagnucci, A.B.; Barlagne, C.; Ceglarz, A.; Cremades, R.; McKeen, M.; Otto, I.M.; Slee, B. Social innovation in community energy in Europe: A review of the evidence. Front. Energy Res. 2019, 7, 31. [Google Scholar] [CrossRef]
  73. Caramizaru, A.; Uihlein, A. Energy Communities: An Overview of Energy and Social Innovation; Social Aspects of the Energy Transition; Publications Office of the European Union: Luxembourg, 2020. [Google Scholar] [CrossRef]
  74. Kumar, A.; Singh, A.R.; Deng, Y.; He, X.; Kumar, P.; Bansal, R.C. Integrated assessment of a sustainable microgrid for a remote village in hilly region. Energy Convers. Manag. 2019, 180, 442–472. [Google Scholar] [CrossRef]
  75. Rogers, J.C.; Simmons, E.A.; Convery, I.; Weatherall, A. Social impacts of community renewable energy projects: Findings from a woodfuel case study. Energy Policy 2012, 42, 239–247. [Google Scholar] [CrossRef]
  76. Otamendi-Irizar, I.; Grijalba, O.; Arias, A.; Pennese, C.; Hernández, R. How can local energy communities promote sustainable development in European cities? Energy Res. Soc. Sci. 2022, 84, 102363. [Google Scholar] [CrossRef]
  77. Bielig, M.; Kacperski, C.; Kutzner, F.; Klingert, S. Evidence behind the narrative: Critically reviewing the social impact of energy communities in Europe. Energy Res. Soc. Sci. 2022, 94, 102859. [Google Scholar] [CrossRef]
  78. Boostani, P.; Pellegrini-Masini, G.; Klein, J. The Role of Community Energy Schemes in Reducing Energy Poverty and Promoting Social Inclusion: A Systematic Literature Review. Energies 2024, 17, 3232. [Google Scholar] [CrossRef]
  79. Faiella, I.; Lavecchia, L. La Povertà Energetica in Italia. Questioni di Economia e finanza: Banca d’Italia. 2014. Available online: https://www.bancaditalia.it/pubblicazioni/qef/2014-0240/QEF_240.pdf (accessed on 3 December 2024).
  80. Association Énergies Solidaires. Available online: http://energies-solidaires.org/ (accessed on 3 December 2024).
  81. Som Energia, Catalonia (Spain)|ENERGY DEMOCRACY. Available online: https://energy-democracy.net/som-energia-the-first-energy-cooperative-which-provides-an-alternative-to-the-traditional-energy-suppliers/ (accessed on 25 January 2024).
  82. Nasce la Rete Delle Comunità Energetiche Rinnovabili e Solidali. Legambiente. Available online: https://www.legambiente.it/comunicati-stampa/nasce-la-rete-delle-comunita-energetiche-rinnovabili-e-solidali/ (accessed on 25 January 2024).
  83. InclusivECs Awards: Encouraging the Inclusion of Vulnerable Groups in Energy Communities-Accting. Available online: https://accting.eu/selected-pilot-projects/inclusivecs-awards-encouraging-the-inclusion-of-vulnerable-groups-in-energy-communities/ (accessed on 25 January 2024).
  84. Campagna, L. Methods to Mitigate Energy Poverty in a Renewable Energy Community. 2023. Available online: https://www.politesi.polimi.it/handle/10589/204743 (accessed on 25 January 2024).
  85. Repubblica Italiana. Legge 28 Febbraio 2020, n.8. 2020. Gazzetta Ufficiale della Repubblica Italiana, 28 February 2020. [Google Scholar]
  86. Repubblica Italiana. Bozza Di Decreto Ministeriale; Ministero dell’Ambiente e della Sicurezza Energetica: Roma, Italy, 2023. [Google Scholar]
  87. ARERA Autorità di Regolazione per Energia Reti e Ambiente. Regolazione Delle Partite Economiche Relative all ’Energia Elettrica Condivisa da un Gruppo di Autoconsumatori di Energia Rinnovabile che Agiscono Collettivamente in Edifici e Condomini Oppure Condivisa in una Comunità di Energia Rinnovabile. Delibera 4 Agosto 2020-318/2020/R/eel; ARERA: Milan, Italy, 2020. [Google Scholar]
  88. Repubblica Italiana. Decreto Legislativo 8 Novembre 2021, n. 199. 2021. Gazzetta Ufficiale della Repubblica Italiana, 8 November 2021. [Google Scholar]
  89. HIER. Subsidieregeling Coöperatieve Energieopwekking. Available online: https://www.hier.nu/samen-energie-opwekken/sce (accessed on 6 December 2023).
  90. Presidência do Conselho de Ministros. Decreto-Lei n. 162/2019. Diário da República, 25 October 2019.
  91. Ministerio para la Transición Ecológica. Real Decreto 244/2019, de 5 de abril. 2019. Boletín Oficial del Estado, 5 April 2019.
  92. ERSE Entidade Reguladora dos Serviços Energéticos. Regulamento 266/2020 do Autoconsumo de Energia Elétrica; ERSE: Lisbon, Portugal, 2020. [Google Scholar]
  93. ERSE Entidade Reguladora dos Serviços Energéticos. Regulamento 373/2021 do Autoconsumo de Energia Elétrica; ERSE: Lisbon, Portugal, 2021. [Google Scholar]
  94. Presidência do Conselho de Ministros. Decreto-Lei n. 15/2022, de 14 de Janeiro. Diário da República, 14 January 2022.
  95. Jefatura del Estado. Real Decreto-ley 5/2023. Boletín Oficial del Estado, 28 June 2023.
  96. Bundesnetzagentur. Solaranlagen auf Mehrparteiengebäuden: Mieterstromzuschlag und Einspeisevergütung. Available online: https://www.bundesnetzagentur.de/DE/Fachthemen/ElektrizitaetundGas/ErneuerbareEnergien/Solaranlagen/Solar_Mehrparteien/start.html (accessed on 6 December 2023).
  97. European Commission. Photovoltaic Geographical Information System (PVGIS). 2024. Available online: https://joint-research-centre.ec.europa.eu/photovoltaic-geographical-information-system-pvgis_en (accessed on 29 January 2024).
  98. DG Energy. Quarterly Report on European Electricity Markets; DG Energy: Brussels, Belgium, 2021. [Google Scholar]
  99. Eurostat. Electricity Prices for Household Consumers-bi-Annual Data (from 2007 Onwards). European Commission. Available online: https://ec.europa.eu/eurostat/databrowser/view/nrg_pc_204/default/table?lang=en (accessed on 25 January 2024).
  100. Eurostat. Electricity Prices for Non-Household Consumers-bi-Annual Data (from 2007 Onwards). European Commission. Available online: https://ec.europa.eu/eurostat/databrowser/view/nrg_pc_205__custom_9446931/default/table?lang=en (accessed on 25 January 2024).
  101. Philipps, S.; Warmuth, W. Photovoltaics Report. Freiburg. 2022. Available online: www.ise.fraunhofer.de (accessed on 25 January 2024).
  102. MASE. Decreto Ministeriale n.414; MASE: Rome, Italy, 2023. [Google Scholar]
  103. ARERA. Tariffe di Distribuzione e Misura. Autorità di Regolazione per Energia Reti Ambiente. Available online: https://www.arera.it/area-operatori/prezzi-e-tariffe/tariffe-di-distribuzione-e-misura (accessed on 25 January 2024).
  104. ARERA. Delibera 727/2022/R/eel; ARERA: Milan, Italy, 2022; Available online: https://www.arera.it/it/docs/22/727-22.htm (accessed on 7 April 2023).
  105. Bundesministerium der Justiz. Gesetz für den Ausbau Erneuerbarer Energien. Available online: https://www.gesetze-im-internet.de/eeg_2014/index.html#BJNR106610014BJNE002207311 (accessed on 26 January 2024).
  106. Bundesnetzagentur. Monitoring-Bericht 2023; Bundesnetzagentur: Bonn, Germany, 2023. [Google Scholar]
  107. RVO. Zon-PV SCE. Available online: https://www.rvo.nl/subsidies-financiering/sce/zon-pv (accessed on 26 January 2024).
  108. HIER. De SCE-Regeling in Het Kort; HIER: Utrecht, The Netherlands, 2023; Available online: https://www.hier.nu/subsidieregeling-cooperatieve-energieopwekking/veelgestelde-vragen-sce-regeling-in-het-kort (accessed on 26 January 2024).
  109. PBL. Postcoderoossubsidieregeling Eindadvies-2021; PBL: Den Haag, The Netherlands, 2020. [Google Scholar]
  110. Mello, J.; de Lorenzo, C.; Campos, F.A.; Villar, J. Pricing and Simulating Energy Transactions in Energy Communities. Energies 2023, 16, 1949. [Google Scholar] [CrossRef]
  111. ERSE. Tarifas E Preços Para A Energia Elétrica E Outros Serviços Em 2021; ERSE: Lisboa, Portugal, 2021; Available online: www.erse.pt (accessed on 26 January 2024).
  112. CONSEJO. Sala de Supervisión Regulatoria. Propuesta De Resolución por La Que Se Establecen Los Valores De Los Peajes De Acceso a Las Redes De Transporte y Distribución De Electricidad De Aplicación a Partier Del 1 De Enero De 2024; CONSEJO: Barcelona, Spain, 2023; Available online: www.cnmc.es (accessed on 26 January 2024).
  113. European Council. Electricity Market Reform; European Council: Brussels, Belgium, 2024; Available online: https://www.consilium.europa.eu/en/policies/electricity-market-reform/ (accessed on 22 April 2025).
Figure 1. New RES capacity installed in the period 2018–2023 [1].
Sustainability 17 04195 g001
Figure 2. Graphical color-coded representation of energy (darker shade) and money (lighter shade) flows of virtual models in (a) Italy and (b) The Netherlands. Virtual energy exchanges are highlighted in italics.
Sustainability 17 04195 g002
Figure 3. Graphical representation of (a) physical and virtual energy flows and (b) energy and monetary flows, taking place in both Portuguese and Spanish physical models. Virtual energy exchanges are also highlighted in italics.
Sustainability 17 04195 g003
Figure 4. Graphical color-coded representation of energy (darker shade) and money (lighter shade) flows in German (a) virtual full feed-in model and (b) physical TEM model.
Sustainability 17 04195 g004
Figure 5. Sensitivity analysis on IRR for different production/consumption ratio.
Sustainability 17 04195 g005
Table 4. REC and CEC main features.
FeatureRECCEC
EnergyRenewable-only, electric and/or thermal energyElectric energy
Members and shareholdersCitizens, SMEs, and local authorities, including municipalitiesOpen to all categories of entities
LocationShareholders or members
that are in proximity of the renewable energy projects that are owned and developed by that legal entity
Shareholders or members share electricity from generating installations within the community without being in direct physical proximity to the generating installation and without being behind a single metering point
Control/decision-making powersEffectively controlled by shareholders or members that are located in the proximity of the renewable energy projectsDecision-making powers within a CEC should be limited to those members or shareholders that are not engaged in large-scale commercial activity and for which the energy sector does not constitute a primary area of economic activity
Distribution networksCan manage distribution networksCan own, purchase, or lease distribution networks and autonomously manage them
Imbalances-Responsible for imbalances
Table 5. Collective self-consumption schemes.
ItalyPortugalSpainGermany The Netherlands
Full Feed-inTEM
EC modelVirtualPhysicalPhysicalVirtualPhysicalVirtual
EC accepted
borders
HV/MV substationLV—2 km or LV/MV substation
MV—4 km and HV/MV substation
Proximity depends on municipality inhabitantsMembers’ postcodes within a radius of 50 km around the power plantSame buildingPostcode-rose area
Distribution gridPublicPublic/privatePublic/privatePublicPrivatePublic
Incentivization schemeTIP on shared energy for 20 yearsConvenient price for internal transactions and ACs to allocate the energy self-consumed among membersConvenient price for internal transactions and ACs to allocate the energy self-consumed among membersMarket premium on the energy sold for 20 yearsTenant surcharge on energy self-consumed for the landlord and discount price on energy supplied for tenants for 20 yearsSubsidy on the generated energy, up to a maximum eligible production, for 15 years. The remaining part of the non-incentivized energy is sold at the market price.
Self-consumption time window1 h15 min1 hNot foreseen1 hNot foreseen
Network chargesReimburse of TRASE on shared energyDiscounted access tariff on energy self-consumedDiscounted access tariff on energy self-consumedNo discountExemption on energy self-consumedNo discount
Surplus
management
Aggregated and managed by a community managerAggregated and managed by a community managerManaged individually by every member’s retailer/representative according to the applicable self-consumption configurationThe concept of surplus does not exist because the market premium is applied to the total energy productionManaged by the SO and paid with a market premiumThe concept of surplus does not exist. The total production is sold.
Maximum
capacity
1 MWNot foreseenNot foreseen1 MW 5 kW per member up to 100 kW
Table 6. Nameplate data for the case study.
Type of UsersNumber of UsersContractual Power [kW]PV Installed Capacity
[kW]
3-person household530
5-person household54.50
Office2100
Shop2100
Building POD110100 (for The Netherlands and Germany full-feed in = 0)
Pure feed-in0 (for The Netherlands and Germany full-feed in = 1) 0 (for The Netherlands and Germany full-feed in = 100)
Table 7. Energy data for the case study.
Type of UsersConsumed Energy [kWh/year]Produced Energy [kWh/year]Self-Consumed Energy [kWh/year]Injected Energy [kWh/year]Withdrawn Energy [kWh/year]
3-person household2000---2000
3-person household3000---3000
5-person household4000---4000
Office16,000---16,000
Shop19,200---19,200
Building POD5300115,4402280113,1703030
Table 10. Summary of energy flux computation per country.
No IncentiveItalyGermany, FFIGermany, TEMThe NetherlandsPortugalSpain
ESELFmin(EP, EC)min(EP, EC)Not applicablemin(EP, ECTOT)Not applicablemin(EP, EC)min(EP, EC)
EINJEP–ESELFEP–ESELFEPEP–ESELFEPEP–ESELFEP–ESELF
EWITHEC–ESELFEC–ESELFECEC–ESELFECEC–ESELFEC–ESELF
ESHNot applicablemin(EINJTOT, EWITHTOT)Not applicableNot applicableNot applicablemin(EINJTOT, EWITHTOT)min(EINJTOT, EWITHTOT)
Table 11. Summary of revenues computation per country.
No IncentiveItalyGermany, FFIGermany, TEMThe NetherlandsPortugalSpain
R1ESELF bill costESELF bill costNot applicableESELF (1—BR) bill costNot applicableESELF bill costESELF bill cost
R2Not applicableESH (TIP + TRASE)Not applicableESELF PVSURNot applicableESH (bill cost— PI λ grid)ESH (bill cost—PI λ grid)
R3Not applicableNot applicableEINJ MPEINJ MPmin(EMAX, EP) SUBESH PIESH PI
R4EINJ market priceEINJ market priceEP market priceEINJ market pricemax(0, EP—EMAX) market price(EINJ–ESH) market price(EINJ–ESH) market price
Table 12. Community’s energy flows in the general case.
QuantityUnitValue
Consumed energykWh120,707
Produced energykWh115,443
Equivalent hoursh1154
Self-consumed energy (if applicable)kWh2276
Shared energy (if applicable)kWh47,734
Injected energykWh113,166
Withdrawn energykWh118,430
Table 13. Community’s economic result in the General Scenario.
No IncentiveItalyGermany FFIGermany TEMThe NetherlandsPortugalSpain
R1 (€/year)574574086590574574
R2 (€/year)0668901324017424455
R3 (€/year)004480957867026306
R4 (€/year)6847684769843959153939594129
PBT (year)22122218181411
IRR @ 10 y (%)−7.6%4.6%−7.5%−0.7%−0.3%2.8%6.6%
Table 14. Community’s economic result in country-specific Business Cases.
No IncentiveItalyGermany FFIGermany TEMThe NetherlandsPortugalSpain
PBT (year)2211222022108
IRR (%)−4%7%−5%−2%−1%9%15%
Disclaimer/Publisher’s Note: The statements, opinions and data contained in all publications are solely those of the individual author(s) and contributor(s) and not of MDPI and/or the editor(s). MDPI and/or the editor(s) disclaim responsibility for any injury to people or property resulting from any ideas, methods, instructions or products referred to in the content.

