Abstract
With the acceleration of urban industrialization and urbanization processes, land use patterns have undergone significant changes. In Northern Anhui, a typical region where agriculture and industry intersect, land use modifications exert a particularly significant influence on carbon sequestration capacities. However, research into how land use transformations affect carbon storage within this region is still lacking. Exploring the relationship between land use changes and carbon storage in depth can not only provide reliable data for scientific management and policy formulation but also offer important references for achieving “dual carbon” goals. This study combines the PLUS model and the InVEST model to comprehensively evaluate and forecast land utilization and carbon sequestration shifts across six cities in Northern Anhui from 2000 to 2030. By constructing four scenarios—natural development, farmland protection, economic development, and sustainable development—the potential impacts of different land use patterns on carbon sequestration capacity were simulated. The findings suggest that between 2000 and 2020, the farmland area in Northern Anhui continuously decreased, while the construction land area significantly increased; carbon storage decreased by 8.53 million tons between 2000 and 2020, which was primarily caused by the transformation of agricultural land into areas for construction. Except for the farmland protection scenario, carbon storage decreased to varying degrees in all other scenarios, with the sustainable development scenario showing the most notable mitigation in carbon storage reduction. As Northern Anhui undergoes rapid development, the significant loss of farmland caused by industrialization and urbanization is the main reason for the decline in carbon sequestration capacity.
1. Introduction
Carbon storage is an important component of ecosystem services and has been established as a key indicator for assessing terrestrial ecosystem services’ responses to global climate change [1]. In recent years, there has been increasing scholarly interest in how to enhance carbon storage and sequestration capacity [2,3,4]. Studies assessing carbon storage across different ecosystems have demonstrated that increasing ecosystem carbon storage effectively reduces atmospheric CO2 concentrations, playing a crucial role in mitigating climate change and serving as a key pathway to achieving carbon neutrality [5]. Significant progress has been made globally in carbon storage research. According to the IPCC (2021), the global forest ecosystem’s carbon storage is approximately 650 Pg, while soil carbon storage is around 1500 Pg [6]. Research shows that carbon storage is influenced by various factors: Land Use Changes—Activities such as deforestation, urbanization, and agricultural expansion significantly affect carbon storage [7]. Climate Change: Variations in temperature and precipitation directly impact plant growth and soil organic carbon accumulation [8]. Soil Types: Different soil types vary in carbon storage capacity, with clay soils typically having higher carbon storage levels [9].
Land use change is one of the major drivers of climate change, especially in the context of rapid industrialization and urbanization. Foley highlighted that the transformation of land use, particularly the conversion of forests and grasslands to cropland or construction land, significantly reduces carbon storage [10]. Globally, land use change is considered a major source of greenhouse gas emissions, second only to CO2 emissions from fossil fuel combustion [11,12]. This issue is particularly acute in developing countries, where land development and deforestation intensify the problem [13]. Thus, evaluating regional carbon storage across various spatial and temporal scales has become a critical issue for achieving the “dual carbon” goals as soon as possible.
Current methods for measuring carbon storage include direct measurement and model estimation [14]. Direct Measurement [15]: This involves field surveys and the sampling analysis of plant biomass and soil organic carbon. While accurate, this method is time-consuming and complex. Model Estimation [16]: This relies on ecological models and remote sensing technology, offering promising applications. Among these models, the InVEST model stands out for its high simulation accuracy, visualization capabilities, and fast operation speed, making it widely used for terrestrial ecosystem carbon storage assessments [17,18]. There are numerous land use prediction models, including the Markov model [19], FLUS model [20], CFLUS model [21], PLUS model [22,23,24], and CA-Markov model [25]. However, among these models, the FLUS model cannot simulate urban emergence in areas lacking historical urban data, the CFLUS model fails to capture the mutual attraction and dynamic evolution of land use types under varying policy constraints, and the CA-Markov model suffers from complex operational procedures. This study adopts the PLUS model, which not only addresses these limitations but also demonstrates advantages in computational efficiency and simulation accuracy. These improvements significantly enhance the precision of land use prediction simulations for 2030.
Evaluating the spatiotemporal evolution of carbon storage based on land use changes has gradually become a classic method for carbon storage assessment [26]. For example, Yingxue Li and colleagues used the FLUS and InVEST models to simulate land cover and assess carbon storage in Changchun City, concluding that the main reason for carbon storage decline in Northeast China’s Changchun City was the conversion of farmland to construction land [27]. Similarly, Xudong Li and others applied the coupled PLUS-InVEST model to study the impact of land use changes on carbon storage in Weihai, one of China’s most livable cities [16]. Extensive research has confirmed the effectiveness of the PLUS and InVEST models in simulating and evaluating land use changes and their impact on carbon storage [28,29,30]. By integrating these two models, researchers can gain a more comprehensive understanding of the mechanisms by which land use changes influence carbon storage [31]. However, there remain conflicting findings regarding the impact of land use changes on ecosystem carbon exchange processes, particularly at different spatial scales [32]. Thus, conducting comprehensive research on how land use alterations impact the carbon cycle across different areas is essential, especially in underdeveloped areas.
Northern Anhui, as a typical region where agriculture and industry are intertwined, shows significant impacts of land use changes on carbon sequestration capacity. Currently, studies on the changes in carbon storage caused by land use changes in Northern Anhui are limited, focusing primarily on the economic and ecological impacts of land use changes [33,34]. This study selects the Northern Anhui region as the research area, enriching research on carbon storage in plain areas dominated by cropland. By coupling the PLUS-InVEST model, we analyze historical and current land use changes and carbon storage in Northern Anhui to achieve the following objectives: (1) simulate future land use patterns in 2030 under different scenarios based on land use changes from 2000 to 2020; (2) assess carbon storage changes in 2030 across scenarios and quantify the relationship between land use transitions and carbon storage dynamics; (3) provide reliable references and precise data support for land management and policy-making, contributing to the early achievement of China’s “dual carbon” goals.
2. Materials and Methods
2.1. Overview of the Study Area
Northern Anhui is situated in the northern part of Anhui Province, north of the Huai River, and includes six prefecture-level cities: Suzhou, Huaibei, Bengbu, Fuyang, Huainan, and Bozhou (Figure 1). The total area of this region is 53,000 square km, spanning from 114°55′ to 118°10′ east longitude and 32°25′ to 34°35′ north latitude. Northern Anhui lies within the Yangtze River Delta region, with Shanghai at its core. The region’s terrain is primarily flat, dominated by the vast Huaibei Plain, with some low mountainous and hilly areas in the northeastern part. The area is strategically important as a transit hub for movement north–south and east–west, with the main passage being the Eurasian Continental Bridge. It is the only region in Anhui Province covered by the “Belt and Road” initiative.
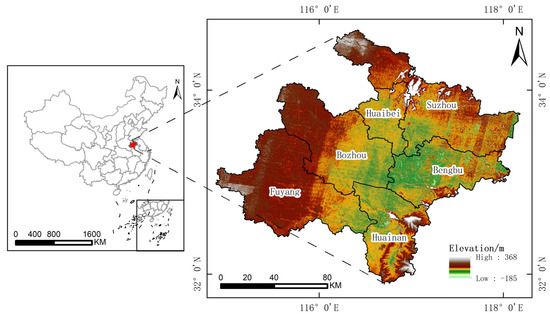
Figure 1.
Location overview of Northern Anhui.
Plains, particularly those dominated by cultivated land, hold significant research value due to their unique geographical characteristics. However, studies on carbon storage in typical cultivated plains remain relatively scarce. Therefore, this study selects the Northern Anhui region, a representative cultivated plain area, as the research focus to enrich the understanding of carbon storage dynamics in such regions.
2.2. Research Data
This study primarily utilizes data on land use, socio-economic factors, natural environmental conditions, and carbon density. Specific data sources are listed in Table 1. The land use data comes from the China 30 m annual land cover dataset, which utilizes 335,709 Landsat images from Google Earth Engine. A post-processing method combining spatiotemporal filtering and logical reasoning was proposed. The overall accuracy of the CLCD dataset, based on 5463 visual interpretation samples, reached 79.31% [35]. The Euclidean distance method was used to calculate the distances to government offices, water bodies, and roads. The carbon density data comes from NESDC and has been modified and compiled based on literature sources [36,37,38] related to the geographic location of the study area (Table 2).

Table 1.
Types and sources of research data.
Table 2.
Carbon density of different land use types in Northern Anhui/t·hm−2.
2.3. InVEST Model
Developed by the Natural Capital Project at Stanford University, the InVEST model serves as a tool for assessing ecosystem services comprehensively. It is widely used in urban planning, ecological redline designation, climate change adaptation and mitigation strategies, and more. By quantifying ecosystem services, it provides scientific support for achieving sustainable development. The model divides the carbon storage of each land type into four basic carbon pools: aboveground carbon storage (Cabove), belowground carbon storage (Cbelow), soil carbon storage (Csoil), and dead organic carbon storage (Cdead) [39]. The total carbon storage of the region, C, is calculated based on the carbon density of different land types and land use data, with the following formula:
C = Cabove + Cbelow + Csoil + Cdead
2.4. PLUS Model
The PLUS model is a cellular automaton (CA) model based on raster data, developed jointly by the School of Geography and Information Engineering at China University of Geosciences (Wuhan) and the High-Performance Computing and Intelligent Lab (HPSCIL) at the National GIS Engineering Technology Research Center. It is used for land use change simulation at the patch scale. The PLUS model is an extension of the FLUS model, incorporating a land expansion analysis strategy module and the CARS module, while also embedding the Markov chain [40]. Through these mechanisms, the PLUS model provides an in-depth understanding and prediction of land use changes, offering scientific support for land planning and management.
This study uses the PLUS model to forecast future land use patterns using historical data. First, the projected land utilization scenario for 2020 is forecasted through comprehensive analysis of historical land use records spanning 2000–2010 within the investigated region. Then, the empirical 2020 geospatial datasets serve to validate precision in simulation outcomes, guaranteeing alignment between modeled results and scientific criteria. Finally, leveraging authenticated geospatial information from 2020, the PLUS model’s spatial allocation mechanisms and developmental probability layers enable systematic projection of 2030 land utilization patterns.
The parameter settings for the Random Forest Classification (RFC) were configured as follows: the sampling rate was set to 0.01, the number of regression trees was set to 20, and the number of features used to train the RFC model (mTry) was 16. The CARS module parameters were configured as follows: the patch generation threshold was set to 0.2, the expansion coefficient was set to 0.1, the percentage of seeds was set to 0.1, and the neigborhood weights were set as follows: farmland 0.186, forest 0.045, grassland 0.082, water bodies 0.031, built-up land 0.487, and unused land 0.004.
2.5. Multi-Scenario Settings
- (1)
- Natural Development Scenario (M1): This scenario relies on the patterns of land use changes observed between 2000 and 2020, without considering factors such as policy guidance or planning restrictions. The PLUS model, embedded with the Markov chain, predicts the land demand for 2030, which serves as the basis for other scenario simulations [41].
- (2)
- Farmland Protection Scenario (M2): Food security is a crucial national strategy, and farmland protection is a key measure for ensuring food security. Northern Anhui, as a major grain-producing area, plays an essential role in safeguarding the nation’s food security. This study sets a farmland protection scenario, based on the natural development scenario and relevant literature research. The Markov transition probability matrix was revised to rigorously implement cultivated land protection policies by reducing the transition probabilities of cultivated land to built-up areas by 70%, to grassland and water bodies by 40% each, while simultaneously increasing all transition probabilities of unused land by 50%, thereby aligning the model with national agricultural conservation mandates and ensuring strict adherence to land use regulatory frameworks [42].
- (3)
- Economic Development Scenario (M3): Since the 13th Five-Year Plan, Northern Anhui has accelerated industrialization and urbanization, supported by a series of development-promoting policies. This has intensified land use conflicts. When prioritizing economic development, a large amount of construction land is needed to support it. In this study, an economic development scenario is set, based on the natural development scenario, the transition probabilities from built-up areas to cultivated land, water bodies, forest land, grassland, and unused land were systematically reduced by 40%, while the transition probabilities from cultivated land, forest land, grassland, water bodies, and unused land to built-up areas were proportionally increased by 40%, 10%, 20%, 10%, and 50%, respectively, reflecting intensified urbanization pressures and differentiated land conversion priorities under policy-constrained simulations [22].
- (4)
- Sustainable Development Scenario (M4): The government has proposed accelerating the holistic green shift in economic and social development, optimizing the spatial development and protection pattern of the land, and strictly adhering to the three “red lines”. In the sustainable development scenario, while promoting economic development, ecosystem protection is also considered. This scenario adds nature reserves, which serve as restricted conversion areas, based on the natural development scenario. The transition probabilities were systematically adjusted to simulate land use patterns balancing ecological conservation and economic development: reductions of 20% in conversions from forest land and grassland to built-up areas, a 40% decrease in water bodies transitioning to built-up areas coupled with a 30% increase in their conversion to cultivated land, a 30% reduction in cultivated land transitioning to built-up areas, a 40% increase in unused land converting to built-up areas, and a 10% elevation in the probability of built-up areas reverting to grassland, collectively reflecting strategic trade-offs between urbanization demands and ecosystem resilience enhancement [24].
3. Results
3.1. Model Validation
To verify the model’s accuracy and evaluate its predictive capability for land use in 2030, we contrasted the simulated 2020 land use map against the observed 2020 land use data. The validation process used the Kappa consistency index, which is widely applied in land use prediction verification. When the Kappa coefficient exceeds 0.75, the prediction is considered statistically accurate [43].
This research utilized land use data from 2000 and 2010 to forecast the 2020 land use distribution through the PLUS model. When compared to the observed 2020 land use data, the Kappa coefficient was 0.82, and the overall accuracy achieved 0.94. These results demonstrate that the PLUS model effectively simulates and accurately projects future land use patterns in Northern Anhui.
3.2. Land Use Change Analysis
3.2.1. Land Use Change from 2000 to 2020
As shown in Figure 2, the land use in Northern Anhui is dominated by cultivated land, with construction land concentrated in specific areas, water bodies and forested land clearly distributed, while unused land and grasslands are relatively sparse. From a spatial perspective, cultivated land is widely spread across the entire Northern Anhui region, indicating that agricultural activities are dominant in this area. Construction land is concentrated in cities and towns with convenient transportation, and it spreads to surrounding areas, showing a scattered pattern across the Northern Anhui plain. In the study area, water bodies are predominantly situated in the southeastern section, following the distribution of rivers and lakes, indicating a relatively rich availability of water resources. Forested areas are primarily concentrated in the small hilly regions of the northeast. Grasslands are sparsely scattered, with their main presence in the northeastern part of the study area. Unused land is sporadically distributed and constitutes the smallest proportion, typically found in areas that are not suitable for development.
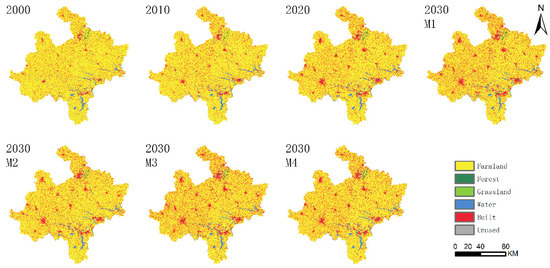
Figure 2.
Spatial distribution of land use types in Northern Anhui from 2000 to 2030. Note: M1 represents the natural development scenario; M2 represents the farmland protection scenario; M3 represents the economic development scenario; M4 represents the sustainable development scenario.
From 2000 to 2020, the area distribution and change trends of various land use types in Northern Anhui are shown in Table 3. Among these, the predominant land use category is cultivated land, which accounts for over 80% of the total area, followed by construction land and water bodies, which account for 12–16% and 2–3% of the study area, respectively. Unused land is the smallest land use type. By comparing land use data from different years, it can be observed that the land use types in Northern Anhui have undergone various degrees of change. The specific trends and characteristics of this evolution are as follows:
Table 3.
Land use in Northern Anhui/km2.
First, between 2000 and 2020, there was a substantial reduction in the area of cultivated land, shrinking from 36,699.66 km2 (86.03%) to 34,438.27 km2 (77.78%), a reduction of 2261.39 km2. At the same time, the area of construction land significantly increased, from 4821.12 km2 (11.3%) to 6966.05 km2 (19.26%), an increase of 2144.92 km2. This indicates that as urbanization accelerated, part of the cultivated land was converted into construction land. Second, the extent of water bodies experienced a slight expansion, rising from 927.06 km2 (2.17%) to 1102.97 km2 (2.61%), which may be related to regional water resource management and conservation policies. The size of unused land shrank from 0.4428 km2 to 0.3483 km2, a reduction of 0.0945 km2, indicating an improvement in land resource utilization. Finally, the area of forested land fluctuated slightly (increased by 0.03%) from 2000 to 2020, but the overall proportion remained stable (0.3%). This suggests that during the urbanization process, the government has paid attention to ecological protection and forest resource preservation. Meanwhile, the area of grassland showed a downward trend, decreasing from 99.79 km2 in 2000 to 22.90 km2 in 2020, a decrease of 70.89 km2. The urbanization process is likely connected to the decrease in green land and the increasing pressure on land resources.
To delve deeper into the alterations of land use types in Northern Anhui from 2000 to 2020, we developed land use transition matrices for the intervals of 2000–2010 and 2010–2020. (Table 4). The findings indicate that cultivated land has seen a net decrease over both decades, especially during the period from 2010 to 2020, with a significant rise in the conversion of cultivated land to construction land, which points to the growing impact of urbanization on cultivated land. Additionally, the shift of cultivated land to forested areas and grasslands also rose, likely attributed to the enforcement of ecological protection measures and changes in the agricultural sector. Construction land increased significantly in both decades, especially from 2010 to 2020, with the speed of expansion accelerating, closely linked to economic development and urbanization in Northern Anhui. Water bodies remained relatively stable but showed an increased transition to construction land between 2010 and 2020. This may be related to regional economic development and water resource utilization policies. Grassland experienced significant transitions to construction land from 2000 to 2010, but this trend slowed from 2010 to 2020, suggesting that grassland protection measures may have been strengthened. Forested land remained relatively stable from 2000 to 2010, but there was a decrease in the transition from forested land to cultivated land from 2010 to 2020, reflecting strengthened government efforts in forest resource protection and ecological balance. Unused land showed little change over both decades, maintaining high stability, which may be due to land use policies and natural conditions.
Table 4.
Land area transfer matrix of Northern Anhui from 2000 to 2030 /km2.
Overall, between 2000 and 2020, the extent of cultivated land that was transformed into other land use categories (2570.07 km2) was considerably greater than the area of other land use types that were converted into cultivated land (308.67 km2), making cultivated land the main driver of land use changes. The expansion of construction land is largely due to the conversion of cultivated land and unused land, with a total converted area of 2221.71 km2. The conversion of grassland out of the study area (78.08 km2) was far greater than the transformation of grassland into other land uses (7.18 km2), with most grassland loss going to cultivated land. There was a reciprocal transformation between water bodies and cultivated land. However, the extent of cultivated land that shifted to water bodies was marginally lower than that of water bodies converted to cultivated land. Meanwhile, due to minimal fluctuations in other land use types, the overall area of water bodies has shown a steady rise.
To offer a more transparent and visually comprehensible depiction of land use changes and variety, this study used a Sankey diagram to quantitatively display the land use transitions between 2000 and 2020, as well as the total distribution of each land type (Figure 3). The findings demonstrate a marked decline in the extent of cultivated land, predominantly converted to construction land, which underscores the rapid pace of urbanization and industrialization. Meanwhile, the transformation of grassland into cultivated and forested areas is evident, while the shift of grassland to construction land could potentially affect the ecological environment, requiring attention to ecological balance and sustainable development. The main contributors to the expansion of construction land are cultivated land, forested land, and grassland, suggesting that these land types are being sacrificed for the rapid growth of construction land. Water bodies, as key ecological resources, remained relatively stable during the study period, but with the progression of urbanization, some water bodies were converted into construction land, presenting new challenges for ecological protection. There is a clear mutual transformation relationship between cultivated land, water bodies, and grassland, with unused land showing relatively little change, though some portions were converted into construction land and other land types, which may relate to regional development policies and the efficiency of land resource use.
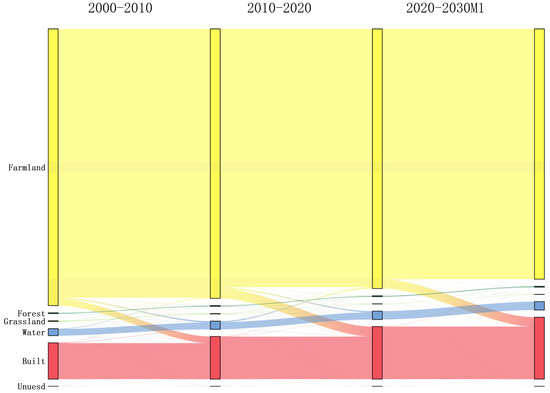
Figure 3.
Land use transition in Northern Anhui from 2000 to 2030 (M1 scenario).
3.2.2. Land Use Change Analysis from 2020 to 2030
Drawing from the 2020 land use data of the study area and employing the validated PLUS model, four distinct land use prediction scenarios are presented in Figure 4.
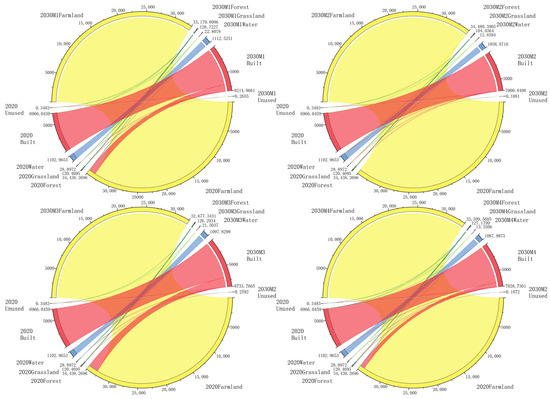
Figure 4.
Sankey diagram of land use transition under multiple scenarios. Note: M1 represents the natural development scenario; M2 represents the farmland protection scenario; M3 represents the economic development scenario; M4 represents the sustainable development scenario.
In the natural scenario, the land use change trend remains consistent with the 2000 to 2020 trend. Between 2020 and 2030, the extent of cultivated land continues to decline, reducing from 34,438.27 km2 to 33,179.81 km2, a reduction of 1258.46 km2. The primary direction of this change is still the transformation of cultivated land into construction land (1247.92 km2), followed by transitions to forested land and grassland. Given the continuous decline in cultivated land, stricter land protection policies should be formulated in the future to ensure food security. The extent of construction land sees a substantial rise, growing from 6966.05 km2 to 8214.87 km2, an increase of 1248.82 km2, primarily sourced from cultivated land. As construction land rapidly expands, refining the spatial arrangement of urban and industrial land, improving land use efficiency, and reducing encroachment on cultivated land and other land types should be prioritized. Other land types remain almost unchanged.
In the cultivated land protection scenario, between 2020 and 2030, the extent of cultivated land sees a modest increase from 34,438.27 km2 to 34,480.39 km2, reflecting the effectiveness of land protection measures during this period. By 2030, construction land increases only slightly from 6966.05 km2 to 7000.85 km2, primarily coming from the conversion of water bodies, forested land, and grasslands. Forests, grasslands, water bodies, and unused land all decrease to varying extents, highlighting the need for stronger ecological protection measures, particularly for water bodies and forests.
In the economic development scenario, construction land increases substantially from 6966.05 km2 in 2020 to 8733.77 km2 in 2030, an increase of 1767.72 km2, which is the largest growth among the four scenarios. At the same time, the area of cultivated land decreases significantly from 34,438.27 km2 to 32,677.34 km2, a reduction of 1760.93 km2. The main driver of construction land expansion is the transformation of cultivated land, while other land types exhibit little change. Given the large decrease in cultivated land in this scenario, stronger measures for cultivated land protection should be implemented to ensure food security and agricultural sustainability. Additionally, refining the spatial arrangement of urban and industrial land to minimize encroachment on cultivated and other land types should be prioritized.
Under the sustainable development scenario, relative to 2020, by 2030, cultivated land, grassland, water bodies, and unused land all show a downward trend, with respective declines of 838.71 km2, 15.55 km2, 14.9 km2, and 0.16 km2. Construction land and forested land increase by 862.68 km2 and 6.71 km2, respectively. In terms of transitions, cultivated land primarily converts to construction land, while forested land and water bodies remain relatively stable. Grassland and forested land undergo reciprocal transformation, while unused land predominantly transitions into construction land. In this scenario, while cultivated land decreases, the reduction is significantly mitigated, and construction land continues to grow at a relatively fast pace. Moreover, unused land is the smallest across all four scenarios. This scenario achieves a balance between protecting cultivated land and promoting economic development. In the future, cultivated land protection measures should be further strengthened to ensure food security and agricultural sustainability. Additionally, ecological protection measures, especially for water bodies and forests, should be continuously improved, along with efforts to increase land use efficiency, such as developing ecological agriculture or land reclamation.
3.3. Carbon Storage Change Analysis
3.3.1. Carbon Storage Change from 2000 to 2020
Carbon sequestration levels within Anhui’s northern territories during the 2000–2020 timeframe were quantified through the application of the InVEST integrated valuation model (Figure 5). Analytical findings demonstrate that the geospatial configuration of carbon pools remained relatively stable throughout this twenty-year cycle. Macroscopically, the spatial arrangement of terrestrial carbon reserves exhibited strong congruence with regional land cover spatial configurations. The areas with the highest carbon density were the forested regions in the north, followed by the extensive cultivated land, and regions with the lowest carbon storage were predominantly located in the southeastern water bodies.
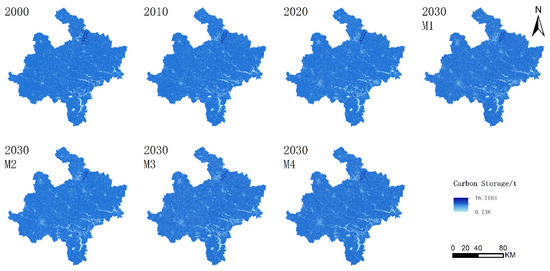
Figure 5.
Spatial distribution of total carbon storage in Northern Anhui from 2000 to 2030. Note: M1 represents the natural development scenario; M2 represents the farmland protection scenario; M3 represents the economic development scenario; M4 represents the sustainable development scenario.
Between 2000 and 2020, the total carbon storage in Northern Anhui dropped from 56,023.30 thousand tons in 2000 to 55,576.84 thousand tons in 2020, and further to 55,169.89 thousand tons (Table 5). This represented a continuous decrease, with a total loss of 853.41 thousand tons, averaging an annual decrease of 42.67 thousand tons. Regarding the carbon sequestration capacity contribution by land type, cultivated land held more than 80% of the total carbon sequestration capacity in Northern Anhui, thus serving as the dominant carbon reservoir. Since 2000, carbon storage in cultivated land has declined in line with the decrease in cultivated land area, from 50,315.24 thousand tons to 47,214.87 thousand tons, a reduction of 3100.37 thousand tons. Carbon storage in construction land increased from 5272.38 thousand tons to 7618.07 thousand tons, an increase of 2345.69 thousand tons. Other land types accounted for a small portion, with little overall change.
Table 5.
Carbon storage of each land type from 2000 to 2030 × 104/t.
Over this period, the spatial pattern of carbon stock in Northern Anhui exhibited minimal change, with most areas showing no significant changes. Regions experiencing a decline in carbon stock were more extensive than those showing increases. The regions experiencing carbon storage loss were mainly in the northern and central parts, especially in areas with significant urban expansion, reflecting the negative impact of human activities on carbon storage. Conversely, regions with enhanced carbon stock were predominantly situated in the southern areas and certain northern locales, likely due to afforestation, ecological rehabilitation programs, and the recovery of natural vegetation. The increase in areas with reduced carbon storage from 2010 to 2020 compared to 2000 to 2010 (Figure 6) can be ascribed to the decrease in cultivated land. Overall, the changes in carbon storage were strongly associated with alterations in land use, with urbanization and agricultural expansion causing a decline in carbon storage, while ecological protection and restoration measures contributed to its increase. This shift underscores the intricate interplay between urban–rural growth and environmental conservation.
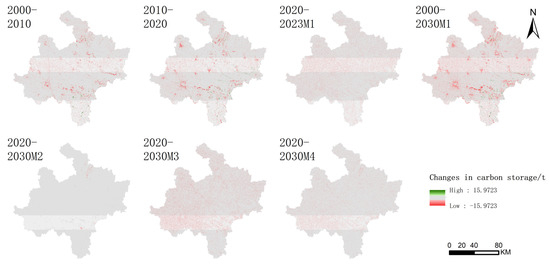
Figure 6.
Spatial distribution of carbon storage changes in Northern Anhui. Note: M1 represents the natural development scenario; M2 represents the farmland protection scenario; M3 represents the economic development scenario; M4 represents the sustainable development scenario.
3.3.2. Carbon Storage Change from 2020 to 2030
Utilizing the InVEST model, the carbon storage corresponding to the four distinct land use scenarios in the study area was estimated based on the 2030 land use predictions (Figure 6). In 2030, the spatial pattern of carbon storage across the four scenarios remained largely consistent with that of 2020. In comparison to the other scenarios, the cultivated land protection scenario exhibited the highest level of carbon storage, reaching 55,205.62 thousand tons, followed by the sustainable development scenario at 54,944.08 thousand tons, the natural development scenario at 54,809.73 thousand tons, and the economic development scenario with the lowest carbon stock at 54,684.00 thousand tons.
In the natural development scenario, between 2020 and 2030, the carbon stock will follow the same trend as from 2000 to 2020, with a cumulative loss of 360.16 thousand tons. Carbon stock in cultivated land decreases by 1725.35 thousand tons, while carbon stock in developed land increases by 1365.71 thousand tons. Carbon storage in forests increases by 10.01 thousand tons, while that in grasslands falls by 11.31 thousand tons, with little change in other land types. Under the cultivated land protection scenario, the total carbon stock in Northern Anhui in 2030 remains relatively stable compared to that in 2020. Specifically, carbon stock in cultivated land rises by 57.75 thousand tons and in construction land by 38.06 thousand tons, respectively, while carbon stock in forested land drops by 26.30 thousand tons and in grassland by 30.15 thousand tons, with little change in other land types.
Under the economic development scenario, the carbon stock in cultivated land decreases to the lowest value of all four scenarios (44,800.64 thousand tons), while carbon stock in construction land increases to the highest value (89,551.25 thousand tons), resulting in a total carbon storage reduction to the lowest value in 2030, with a decrease of 485.87 thousand tons compared to 2020. Under the sustainable development scenario, the total carbon stock in Northern Anhui in 2030 decreases by 225.81 thousand tons relative to 2020. Specifically, carbon stock in cultivated land and grassland decreases by 1149.87 thousand tons and 28.87 thousand tons, respectively, while carbon storage in construction land and forested land increases by 943.43 thousand tons and 10.74 thousand tons, respectively. In this scenario, carbon stock exceeds that of the natural development scenario by 134.35 thousand tons. These findings indicate that ecological conservation initiatives can enhance the carbon sequestration capacity of terrestrial ecosystems in Northern Anhui.
4. Discussion
4.1. Response of Carbon Storage to Land Use Change
Land use status is a key factor in assessing carbon storage because it directly affects the structure and distribution of terrestrial ecosystems, thus altering carbon storage and its spatial patterns. Studying the response of carbon storage to land use changes is of great practical significance for guiding the optimization and management of regional land use [44]. Therefore, a detailed grasp of how land use interacts with carbon stock is essential for crafting scientific land use frameworks and accomplishing the “dual carbon” goals.
Land cover classifications within the targeted geographical context demonstrate marked variations in their differential influences on terrestrial carbon sequestration capacities. According to Figure 7, since 2000, the Northern Anhui region has experienced rapid cultivated land shrinkage and accelerated built-up land expansion. These land use changes align closely with the region’s intensified industrialization, urbanization, and continuous growth of urban population size, consistent with Wu’s [37] findings on land use dynamics in Anhui Province. As a cultivated land-dominated plain area constrained by flat topography, over 80% of its land cover comprises cultivated areas, resulting in cultivated land being the primary carbon pool in Northern Anhui. This contrasts with Yue’s [17] conclusion that forests and cultivated lands jointly dominate carbon storage in Anhui Province, a discrepancy attributable to Southern Anhui’s extensive forest coverage versus Northern Anhui’s extreme scarcity of forests and overwhelming cultivated land dominance. The region’s total carbon storage has shown a progressive decline since 2000, corroborating previous studies [17]. This deterioration primarily stems from rapid urbanization-driven factors: high population density, uncontrolled urban sprawl, and substantial built-up land encroachment on cultivated and forested areas. Notably, carbon loss accelerated during the last decade, paralleling the intensification of ecological degradation, a trend consistent with existing research [37].
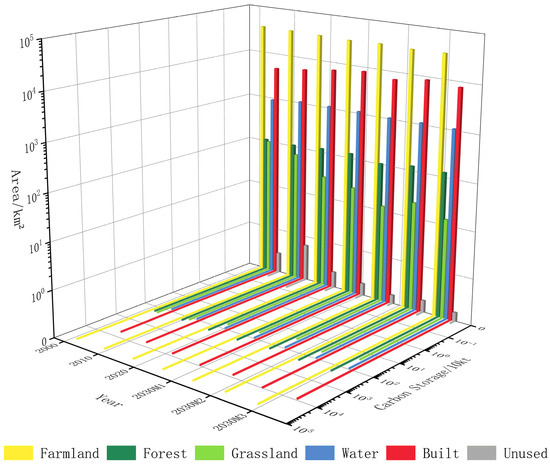
Figure 7.
Carbon storage and area changes of different land use types in Northern Anhui. Note: M1 represents the natural development scenario; M2 represents the farmland protection scenario; M3 represents the economic development scenario; M4 represents the sustainable development scenario.
In the natural development scenario, from 2020 to 2030, the carbon storage will continue the same trend as from 2000 to 2020, with a cumulative loss of 360.16 thousand tons. The area of cultivated land will further decrease, and the area of construction land will continue to increase, leading to a further decline in overall carbon storage. In the cultivated land protection scenario, the area of each land type will remain almost unchanged compared to 2020, and the carbon storage in 2030 will also not differ much from 2020. In the economic development scenario, the area of cultivated land will decrease to its lowest value across all years (32,677.34 km2), while construction land will increase to its highest value (8733.77 km2), causing the carbon storage in Northern Anhui to reach the lowest value in every scenario. In the sustainable development scenario, the cultivated land area will decrease by 838.71 km2 relative to 2020, while the construction land area will increase by 862.68 km2. In this scenario, Northern Anhui’s carbon storage will increase by 134.35 thousand tons compared to the natural development scenario, suggesting that the implementation of ecological conservation will help enhance the carbon sink capacity of Northern Anhui’s terrestrial ecosystem.
4.2. Policy Recommendations
The results imply that a long-term carbon storage monitoring and assessment framework should be developed in the future to offer scientific guidance for land use planning and ecological conservation efforts. A series of measures should be taken to effectively manage and regulate regional carbon storage, promoting the sustainable development of the ecological environment and contributing to the achievement of the “dual carbon” goals. Specific measures include the following: first, effective strategies should be implemented to protect cultivated land and preserve its carbon storage function. Sustainable grassland management measures should be enforced to prevent grassland degradation and restore its ecological role. Second, urban development areas need to be strategically planned to mitigate the adverse impacts of urbanization on carbon storage. Moreover, ongoing forest conservation and reforestation efforts are essential to boost the carbon sequestration potential of forest ecosystems. Finally, exploring ways to improve land use efficiency, such as converting cropland to forest, should be actively pursued.
4.3. Limitations and Future Prospects
Extensive research has confirmed the effectiveness of the PLUS and InVEST models in simulating and evaluating land use changes and their impact on carbon storage [25,26,27]. In this study, the accuracy verification of the PLUS model demonstrated a Kappa coefficient of 0.82, indicating its strong simulation performance in predicting future land use patterns in the Northern Anhui Province. However, the model’s inherent reliance on historical data limits its ability to reflect sustainable land use transitions under China’s new urbanization strategy. Future improvements could integrate parameters such as abrupt policy shifts into the model to better capture land use changes under specific policy interventions. Additionally, given that land use dynamics are influenced by multifaceted factors including economic development levels, policy regulations, and environmental constraints, existing models face challenges in achieving perfect simulation. To enhance realism, future iterations could incorporate critical parameters such as climate variations, infrastructure development, and policy adjustments to achieve more accurate predictive simulations. The 30 m annual resolution land cover dataset adopted in this study, while beneficial for long-term (2000–2020) cross-regional comparisons, may inadequately capture localized land use changes under rapid urbanization. Future work could explore multi-source data fusion approaches that integrate the 30 m long-term dataset with recent high-resolution imagery, leveraging machine learning algorithms (e.g., spatiotemporal reconstruction models) to infer historical high-resolution land cover information
5. Conclusions
- (1)
- The main land use type in Northern Anhui is cultivated land, which accounts for more than 80% of the total area. Between 2000 and 2020, the cultivated land area in Northern Anhui continued to decrease, while the area of construction land increased significantly. The main land use transition was the conversion of cultivated land into construction land. In different scenarios, the cultivated land protection scenario had the largest cultivated land area and the strongest constraints on the expansion of construction land.
- (2)
- From 2000 to 2020, carbon storage in Northern Anhui declined by 8.53 million tons, showing a continuous decline, primarily due to the conversion of farmland into construction land. Farmland is the region’s most important carbon storage.
- (3)
- By 2030, the spatial distribution of carbon storage in Northern Anhui will be similar to that of 2020, but carbon storage changes will vary significantly under different scenarios. The carbon stock in the cultivated land protection scenario will be the highest, reaching 55.206 million tons, followed by the sustainable development scenario (54.944 million tons), the natural development scenario (54.810 million tons), and the economic development scenario, which has the lowest carbon storage at 54.684 million tons. Except for the cultivated land protection scenario, all other scenarios show varying degrees of carbon storage reduction compared to 2020. To achieve the “dual carbon” goals and leverage the role of carbon storage in Northern Anhui, future planning should focus on cultivating land protection and sustainable development.
Author Contributions
Conceptualization, Y.Y. and J.L.; methodology, Y.Y. and M.L.; software, Z.L. and J.Y.; formal analysis, Y.Y.; resources, Y.Y. and M.D.; data curation, J.L.; writing—original draft preparation, Y.Y.; writing—review and editing, J.L.; supervision, J.L.; project administration, J.L.; funding acquisition, J.L. and Z.L. All authors have read and agreed to the published version of the manuscript.
Funding
This research was funded by the University Natural Science Research Project of Anhui Province, grant number 2022AH051317, the Doctoral Foundation of Fuyang Normal University grant number 2021KYQD0014 and the University Natural Science Research Project of Anhui Province, China, grant number 2023AH050397 and 2023AH050387.
Institutional Review Board Statement
Not applicable.
Informed Consent Statement
Not applicable.
Data Availability Statement
The original contributions presented in this study are included in the article. Further inquiries can be directed to the corresponding author.
Acknowledgments
The authors want to acknowledge the support given by Jie Zhang and Chuansheng Wu for his suggestions in the paper revision.
Conflicts of Interest
The authors declare no conflicts of interest.
References
- Ito, A.; Nishina, K.; Noda, H.M. Impacts of Future Climate Change on the Carbon Budget of Northern High-Latitude Terrestrial Ecosystems: An Analysis Using ISI-MIP Data. Polar Sci. 2016, 10, 346–355. [Google Scholar] [CrossRef]
- Yue, X.; Zhou, H.; Cao, Y.; Liao, H.; Lu, X.; Yu, Z.; Yuan, W.; Liu, Z.; Lei, Y.; Sitch, S.; et al. Large Potential of Strengthening the Land Carbon Sink in China through Anthropogenic Interventions. Sci. Bull. 2024, 69, 2622–2631. [Google Scholar] [CrossRef] [PubMed]
- Chen, L.; Zhou, G.; Feng, B.; Wang, C.; Luo, Y.; Li, F.; Shen, C.; Ma, D.; Zhang, C.; Zhang, J. Saline-Alkali Land Reclamation Boosts Topsoil Carbon Storage by Preferentially Accumulating Plant-Derived Carbon. Sci. Bull. 2024, 69, 2948–2958. [Google Scholar] [CrossRef]
- Zhu, H.; Tao, J.; Wang, M.; Zhou, J.; Fan, L. Bibliometric Analysis of the Status and Trends in Soil Inorganic Carbon Research. Chin. J. Soil Sci. 2024, 55, 1174–1184. [Google Scholar]
- Fu, Y.; Tian, D.; Hou, Z.; Wang, M.; Zhang, N. Review on the evaluation of global forest carbon sink function. J. Beijing For. Univ. 2022, 44, 1–10. [Google Scholar] [CrossRef]
- Intergovernmental Panel On Climate Change (IPCC). Climate Change 2021—The Physical Science Basis: Working Group I Contribution to the Sixth Assessment Report of the Intergovernmental Panel on Climate Change, 1st ed.; Cambridge University Press: Cambridge, UK, 2023; ISBN 978-1-009-15789-6. [Google Scholar]
- Yang, S.; Li, L.; Zhu, R.; Luo, C.; Lu, X.; Sun, M.; Xu, B. Assessing Land-Use Changes and Carbon Storage: A Case Study of the Jialing River Basin, China. Sci. Rep. 2024, 14, 15984. [Google Scholar] [CrossRef]
- Jia, H.X.; Wang, X.; Xiao, J.J.; Jang, S.L.; Li, J.; Zhao, Y.F.; Ye, W.L. Simulated Soil Organic Carbon Stocks in Northern China’s Cropland under Different Climate Change Scenarios. Soil. Tillage Res. 2021, 213, 105088. [Google Scholar] [CrossRef]
- Lal, R. Soil Carbon Sequestration Impacts on Global Climate Change and Food Security. Science 2004, 304, 1623–1627. [Google Scholar] [CrossRef] [PubMed]
- Foley, J.A.; DeFries, R.; Asner, G.P.; Barford, C.; Bonan, G.; Carpenter, S.R.; Chapin, F.S.; Coe, M.T.; Daily, G.C.; Gibbs, H.K.; et al. Global Consequences of Land Use. Science 2005, 309, 570–574. [Google Scholar] [CrossRef]
- Lambin, E.F.; Turner, B.L.; Geist, H.J.; Agbola, S.B.; Angelsen, A.; Bruce, J.W.; Coomes, O.T.; Dirzo, R.; Fischer, G.; Folke, C.; et al. The Causes of Land-Use and Land-Cover Change: Moving beyond the Myths. Glob. Environ. Chang. 2001, 11, 261–269. [Google Scholar] [CrossRef]
- Zhu, E.; Deng, J.; Zhou, M.; Gan, M.; Jiang, R.; Wang, K.; Shahtahmassebi, A. Carbon Emissions Induced by Land-Use and Land-Cover Change from 1970 to 2010 in Zhejiang, China. Sci. Total Environ. 2019, 646, 930–939. [Google Scholar] [CrossRef] [PubMed]
- Lambin, E.F.; Gibbs, H.K.; Heilmayr, R.; Carlson, K.M.; Fleck, L.C.; Garrett, R.D.; le Polain de Waroux, Y.; McDermott, C.L.; McLaughlin, D.; Newton, P.; et al. The Role of Supply-Chain Initiatives in Reducing Deforestation. Nat. Clim. Chang. 2018, 8, 109–116. [Google Scholar] [CrossRef]
- Xie, L.; Bai, Z.; Yang, B.; Chen, M.; Fu, S.; Mao, Y. Carbon sequestration assessment methods at home and abroad forterrestrial ecosystems: Research progress in achieving carbon neutrality. Earth Sci. Front. 2023, 30, 447. [Google Scholar]
- Li, M.Y.; Shangguan, Z.P.; Deng, L. Spatial distribution of carbon storages in the terrestrial ecosystems and its influencing factors on the Loess Plateau. Acta Ecol. Sin. 2021, 41, 6786–6799. [Google Scholar]
- Li, X.; Li, C.; Yu, S.; Cheng, L.; Li, D.; Wang, J.; Zhao, H. Dynamic Simulation of Land Use Change and Assessment of Carbon Storage Based on the PLUS Model: A Case Study of the Most Livable City, Weihai, China. Sustainability 2024, 16, 10826. [Google Scholar] [CrossRef]
- Yue, S.; Ji, G.; Chen, W.; Huang, J.; Yulong, G.; Cheng, M. Spatial and Temporal Variability Characteristics of Future Carbon Stocks in Anhui Province under Different SSP Scenarios Based on PLUS and InVEST Models. Land 2023, 12, 1668. [Google Scholar] [CrossRef]
- Li, P.; Chen, J.; Li, Y.; Wu, W. Using the InVEST-PLUS Model to Predict and Analyze the Pattern of Ecosystem Carbon Storage in Liaoning Province, China. Remote Sens. 2023, 15, 4050. [Google Scholar] [CrossRef]
- Tariq, A.; Mumtaz, F. A Series of Spatio-Temporal Analyses and Predicting Modeling of Land Use and Land Cover Changes Using an Integrated Markov Chain and Cellular Automata Models. Environ. Sci. Pollut. Res. 2023, 30, 47470–47484. [Google Scholar] [CrossRef]
- Çağlıyan, A.; Dağlı, D. Monitoring Land Use Land Cover Changes and Modelling of Urban Growth Using a Future Land Use Simulation Model (FLUS) in Diyarbakır, Turkey. Sustainability 2022, 14, 9180. [Google Scholar] [CrossRef]
- Liang, X.; Liu, X.; Chen, G.; Leng, J.; Wen, Y.; Chen, G. Coupling Fuzzy Clustering and Cellular Automata Based on Local Maxima of Development Potential to Model Urban Emergence and Expansion in Economic Development Zones. Int. J. Geogr. Inf. Sci. 2020, 34, 1930–1952. [Google Scholar] [CrossRef]
- Jiang, H.; Cui, Z.; Fan, T.; Yin, H. Impacts of Land Use Change on Carbon Storage in the Guangxi Beibu Gulf Economic Zone Based on the PLUS-InVEST Model. Sci. Rep. 2025, 15, 6468. [Google Scholar] [CrossRef]
- Wu, Q.; Wang, L.; Wang, T.; Ruan, Z.; Du, P. Spatial–Temporal Evolution Analysis of Multi-Scenario Land Use and Carbon Storage Based on PLUS-InVEST Model: A Case Study in Dalian, China. Ecol. Indic. 2024, 166, 112448. [Google Scholar] [CrossRef]
- Wang, Q.; Guan, Q.; Sun, Y.; Du, Q.; Xiao, X.; Luo, H.; Zhang, J.; Mi, J. Simulation of Future Land Use/Cover Change (LUCC) in Typical Watersheds of Arid Regions under Multiple Scenarios. J. Environ. Manag. 2023, 335, 117543. [Google Scholar] [CrossRef] [PubMed]
- Zhu, L.; Song, R.; Sun, S.; Li, Y.; Hu, K. Land Use/Land Cover Change and Its Impact on Ecosystem Carbon Storage in Coastal Areas of China from 1980 to 2050. Ecol. Indic. 2022, 142, 109178. [Google Scholar] [CrossRef]
- Yu, Y.; Guo, B.; Wang, C.; Zang, W.; Huang, X.; Wu, Z.; Xu, M.; Zhou, K.; Li, J.; Yang, Y. Carbon Storage Simulation and Analysis in Beijing-Tianjin-Hebei Region Based on CA-plus Model under Dual-Carbon Background. Geomat. Nat. Hazards Risk 2023, 14, 2173661. [Google Scholar] [CrossRef]
- Li, Y.; Liu, Z.; Li, S.; Li, X. Multi-Scenario Simulation Analysis of Land Use and Carbon Storage Changes in Changchun City Based on FLUS and InVEST Model. Land 2022, 11, 647. [Google Scholar] [CrossRef]
- Luo, S.Q.; Hu, X.M.; Sun, Y.; Yan, C.; Zhang, X. Multi-scenario land use change and its impact on carbon storage based on coupled Plus-Invest model. Chin. J. Eco-Agric. 2023, 31, 300–314. [Google Scholar] [CrossRef]
- Wang, Z.; Li, X.; Mao, Y.; Li, L.; Wang, X.; Lin, Q. Dynamic Simulation of Land Use Change and Assessment of Carbon Storage Based on Climate Change Scenarios at the City Level: A Case Study of Bortala, China. Ecol. Indic. 2022, 134, 108499. [Google Scholar] [CrossRef]
- Zhang, Y.; Naerkezi, N.; Zhang, Y.; Wang, B. Multi-Scenario Land Use/Cover Change and Its Impact on Carbon Storage Based on the Coupled GMOP-PLUS-InVEST Model in the Hexi Corridor, China. Sustainability 2024, 16, 1402. [Google Scholar] [CrossRef]
- Fan, L.; Cai, T.; Wen, Q.; Han, J.; Wang, S.; Wang, J.; Yin, C. Scenario Simulation of Land Use Change and Carbon Storage Response in Henan Province, China: 1990–2050. Ecol. Indic. 2023, 154, 110660. [Google Scholar] [CrossRef]
- Zhou, J.; Zhao, Y.; Huang, P.; Zhao, X.; Feng, W.; Li, Q.; Xue, D.; Dou, J.; Shi, W.; Wei, W.; et al. Impacts of Ecological Restoration Projects on the Ecosystem Carbon Storage of Inland River Basin in Arid Area, China. Ecol. Indic. 2020, 118, 106803. [Google Scholar] [CrossRef]
- Li, Q.; Chu, Z.; Wu, Y. Spatial Evolution Patterns and Reconstruction Strategies of “Production-Living-Ecology” Space in Rural Areas of Northern Anhui from the Perspective of Smart Shrinkage: A Case Study of Lixin County. Huazhong Archit. 2024, 42, 114–119. [Google Scholar] [CrossRef]
- Chen, X.; Wu, S.; Wu, J. Characteristics and Formation Mechanism of Land Use Conflicts in Northern Anhui: A Case Study of Funan County. Heliyon 2024, 10, e22923. [Google Scholar] [CrossRef]
- Yang, J.; Huang, X. The 30 m Annual Land Cover Dataset and Its Dynamics in China from 1990 to 2019. Earth Syst. Sci. Data 2021, 13, 3907–3925. [Google Scholar] [CrossRef]
- Xu, L.; He, N.; Yu, G. A Dataset of Carbon Density in Chinese Terrestrial Ecosystems (2010s). China Sci. Data 2018, 4, 90–91. [Google Scholar] [CrossRef]
- Wu, N.; Chen, N.; Chen, P.; Song, T. Evaluation of Carbon Storage on Terrestrial Ecosystem Responses to Land Cover Change under Five Future Scenarios in Anhui Province. Resour. Environ. Yangtze Basin 2023, 32, 415–426. [Google Scholar]
- Noon, M.; Goldstein, A.; Ledezma, J.; Roehrdanz, P.; Cook-Patton, S.; Spawn-Lee, S.; Wright, T.; González-Roglich, M.; Hole, D.; Rockström, J.; et al. Mapping the Irrecoverable Carbon in Earth’s Ecosystems. Nat. Sustain. 2022, 5, 37–46. [Google Scholar] [CrossRef]
- Natural Capital Project. InVEST 0.0. Stanford University, University of Minnesota, Chinese Academy of Sciences, The Nature Conservancy, World Wildlife Fund, Stockholm Resilience Centre and the Royal Swedish Academy of Sciences. 2024. Available online: https://naturalcapitalproject.stanford.edu/software/invest (accessed on 30 January 2025).
- Liang, X.; Guan, Q.; Clarke, K.C.; Liu, S.; Wang, B.; Yao, Y. Understanding the Drivers of Sustainable Land Expansion Using a Patch-Generating Land Use Simulation (PLUS) Model: A Case Study in Wuhan, China. Comput. Environ. Urban. Syst. 2021, 85, 101569. [Google Scholar] [CrossRef]
- Wu, X.; Qin, M.; Jing, H.; Zhao, Y.; Luo, D.; Wang, Z. Simulation of land use zoning optimization under multi-objective scenarios based on maximizing carbon storage: Taking Qingshui River of Xijiang River in Guangxi as an example. J. Environ. Eng. Technol. 2023, 13, 1752–1762. [Google Scholar] [CrossRef]
- Zhang, M.; Chen, E.; Zhang, C.; Liu, C.; Li, J. Multi-Scenario Simulation of Land Use Change and Ecosystem Service Value Based on the Markov–FLUS Model in Ezhou City, China. Sustainability 2024, 16, 6237. [Google Scholar] [CrossRef]
- Viera, A.J.; Garrett, J.M. Understanding Interobserver Agreement: The Kappa Statistic. Fam. Med. 2005, 37, 360–363. [Google Scholar]
- Duan, L.; Lu, M.; Cai, Y.; Ling, Y.; Fan, T.; Li, Z. Analysis and Prediction of EcosystemCarbon Storage Evolution in Chinese Provinces and Cities Along the MaritimeSilk Road Economic Belt. J. Soil. Water Conserv. 2024, 38, 242–254. [Google Scholar]
Disclaimer/Publisher’s Note: The statements, opinions and data contained in all publications are solely those of the individual author(s) and contributor(s) and not of MDPI and/or the editor(s). MDPI and/or the editor(s) disclaim responsibility for any injury to people or property resulting from any ideas, methods, instructions or products referred to in the content. |
© 2025 by the authors. Licensee MDPI, Basel, Switzerland. This article is an open access article distributed under the terms and conditions of the Creative Commons Attribution (CC BY) license (https://creativecommons.org/licenses/by/4.0/).