Article

Study on the Trade-Off and Synergy Between Agricultural Water–Soil Matching and Ecosystem Service Value in the Tailan River Irrigation District of Xinjiang

1
College of Hydraulic and Civil Engineering, Xinjiang Agricultural University, Urumqi 830052, China
2
Xinjiang Key Laboratory of Hydraulic Engineering Security and Water Disasters Prevention, Urumqi 830052, China
*
Author to whom correspondence should be addressed.
Sustainability 2025, 17(9), 4173; https://doi.org/10.3390/su17094173
Submission received: 30 March 2025 / Revised: 1 May 2025 / Accepted: 3 May 2025 / Published: 5 May 2025

Abstract

:
Xinjiang is located in an inland arid area, and it faces significant challenges in water resource supply and demand, with a fragile ecological environment. Exploring the internal relationship between the time–space distribution of agricultural water–soil matching and the evolution of the ecosystem service value (ESV) in the Tailan River Irrigation District of Xinjiang from 2000 to 2020, this study provides theoretical guidance for the balance of agricultural water–soil resources and the healthy and sustainable development of the ecological environment in the irrigation district. By integrating the water–soil matching coefficient and the equivalent factor method, the spatiotemporal distribution of agricultural water–soil matching and the spatiotemporal evolution of the ESV under the change of land use (LU) in the irrigation district are analyzed. Based on the Pearson correlation, the trade-off synergy between the two is explored. The results show that the following occurred in the past 20 years: (1) Grassland and dryland are the two categories of land with the biggest transfer-out and transfer-in areas in the Tailan River Irrigation District, and the conversion areas are mostly in Jiamu Town and Guleawati Township. (2) The area and reclamation rate of the irrigation district increased gradually, among which the highest reclamation rate was 85.93% in Kezile Town and the lowest was 76.37% in Guleawati Township. The average Gini coefficient of agricultural water–soil in the irrigation district is 0.118, which is absolutely fair. (3) Kezile Town has the highest agricultural water consumption, but the matching of agricultural water–soil always fluctuates between the best and the worst. The agricultural water consumption in Communist Youth League Town is the lowest, but the matching of agricultural water–soil has remained the best for many years. (4) The ESV of the irrigation district showed an overall increasing trend, from CNY 243 million in 2000 to CNY 678 million in 2020; in addition, soil conservation, hydrological regulation, grassland, and dryland contributed the most to ESV in each period. (5) There was a significant trade-off relationship between agricultural water–soil matching and ecosystem services in the Tailan River Irrigation District, while there was a significant synergistic relationship between ecosystem services.

1. Introduction

Water resources and cultivated land resources are important foundations for ensuring national food security and maintaining regional development [1,2]. However, China’s agricultural water–soil resource distribution exhibits pronounced spatial heterogeneity, characterized by abundance in southern/eastern regions versus scarcity in northern/western zones, exacerbating systemic water deficits and impeding sustainable agricultural evolution [3,4]. This spatial mismatch is particularly acute in Xinjiang, a key agricultural base in Northwest China. Despite accounting for 16.7% of the nation’s total land area, Xinjiang contains only 4.9% of China’s freshwater resources and 5.5% of its arable land [5]. The region’s agricultural development is constrained by extreme aridity (annual precipitation <150 mm vs. evaporation >2000 mm), fragmented oasis ecosystems, and widespread soil salinization (affecting 33% of cultivated land) [6,7]. Quantifying water–soil resource coordination through matching indices has emerged as a pivotal approach to assessing agricultural sustainability [8]. As an important carrier of terrestrial ecosystems, the ecosystem service value (ESV) of water–soil resources is different due to the differences in the use of human resources [9,10]. For the inland arid area of Xinjiang, where precipitation is scarce, evaporation is strong, and agriculture depends on irrigation, the water–soil matching and ESV research has been a concern of many scholars. Xie’s matching coefficient analysis revealed stark disparities between northern and southern Xinjiang’s water–soil matching [11], while Wang’s multi-indicator assessment (matching coefficient, Gini coefficient, and equivalent coefficient) identified chronic water scarcity across the Tarim Basin [12]. Methodologically, the DEA method [13], Gini coefficient method [14], matching coefficient method [15], equivalent coefficient [16], and Theil index [17] are commonly used in the study of water–soil matching. Among them, the matching coefficient method and the Gini coefficient method are the most mature, and the study area covers the watershed [18] and the irrigation district [19]. However, the exploration of the spatiotemporal evolution trend of agricultural water–soil matching in the inland arid irrigation district of Northwest China needs to be further deepened.
Building upon Costanza’s foundational framework [20], Xie’s ESV equivalent factor table for Chinese terrestrial ecosystems has gained prominence due to its methodological robustness [21,22]. This paradigm recognizes that land use (LU) restructuring drives ecosystem service alterations through spatial reconfiguration and functional shifts [23], further catalyzing the evolution of ESV research. Regional analyses in Xinjiang and the Aksu River Basin employing this method revealed divergent trends: Zhao documented a 20-year ESV decline linked to water and forest land degradation [24], whereas Xie reported grassland- and cropland-driven ESV growth over three decades [25]. Comparative temporal analyses in Ningxia’s Hongsibu irrigation district further demonstrated ESV fluctuations: Hu observed 1996–2010 ESV increases tied to cropland and hydrological expansions [26], while An identified ESV phased profit–loss patterns during 1990–2018 despite an overall CNY 1.116 billion escalation [27]. Additionally, the equivalent factor method demonstrates robust applicability in quantifying regional ESV within multi-scenario LU simulation frameworks [28,29]. Empirical studies employing integrated modeling approaches have yielded significant insights: research integrating the Markov–FLUS framework by Zhang has elucidated the differential ESV fluctuation patterns across development scenarios in Ezhou City, projecting distinct value increment/decrement magnitudes under 2030 LU developments [30]. Furthermore, Wu’s investigation through a Markov–PLUS coupled model systematically unraveled the spatiotemporal differentiation patterns of ESV gains/losses in the Chishui River Basin, quantitatively establishing the correlation mechanisms between LU intensity and ESV responses under different simulation scenarios in the next 30 years [31]. These findings underscore the equivalent factor method’s versatility across diverse spatial scales, enabling robust ESV quantification in heterogeneous landscapes [32,33,34,35].
In summary, existing research predominantly examines agricultural water–soil matching and ESV variations as isolated phenomena in irrigated districts, with limited integration of their spatiotemporal interdependencies under LU dynamics. To address this gap, this study focuses on Xinjiang’s Tailan River Irrigation District, employing a multidimensional analytical framework. Key metrics—including LU transition patterns, cultivated land reclamation intensity, the water–soil matching coefficient, and Gini coefficients—are systematically evaluated to delineate township-level agricultural water–soil coordination trends between 2000 and 2020. Concurrently, the improved equivalent factor method is applied to map ESV evolution across spatiotemporal dimensions. Finally, by quantifying the trade-off synergy relationships between agricultural water–soil matching and ecosystem services, this work establishes actionable insights for enacting agricultural water–soil sustainable development strategies in arid inland irrigation districts.

2. Materials and Methods

2.1. Study Area

The Tailan River Irrigation District is located in the eastern part of Wensu County, Aksu Prefecture, Xinjiang (Figure 1). It is located on the northern edge of the Tarim Basin, the southern foot of the Tianshan Mountains (80°20′–80°45′ E, 40°55′–41°25′ N). It is one of the key areas for the construction of grain, cotton, and oil bases, livestock product bases, and fruit bases [36]. According to the meteorological statistics for many years, the average annual precipitation in the region is 82.6 mm, the average annual sunshine duration is 2618.7 h, and the average annual temperature is 11.67 °C. The irrigation district mainly relies on the surface and groundwater resources of the Tailan River and its tributaries to serve the surrounding vast agricultural areas, it plays a pivotal role in safeguarding regional food supplies, stimulating sustainable socioeconomic growth, and preserving ecosystem integrity.
Given the characteristics of water use, distribution areas, and comprehensive management in the irrigation district, the irrigation district is divided into five calculation units, according to the administrative division of townships and towns: Jiamu Town, Communist Youth League Town, Kezile Town, Yixilaimuqi Township, and Guleawati Township.

2.2. Data Source

The dataset includes 30 m resolution LU remote sensing data from 2000, 2005, 2010, 2015, and 2020, obtained from the Resource and Environment Science Data Center of the Chinese Academy of Sciences (https://www.resdc.cn/ accessed on 2 March 2024). The data, based on Landsat-TM and Landsat-8 images, were collected during periods of low cloud cover (<10%) from mid-June to late September. LU data were reclassified into seven categories using ArcGIS10.8: paddy field, dryland, forest, grassland, water, construction land, and unused land. DEM data were sourced from the Globeland 30 global land cover database (http://www.globallandcover.com/ accessed on 9 May 2024), with a spatial resolution of 30 m.
Data on the yield and planting area of major crops (rice, wheat, and corn) from 2000 to 2020 were obtained from the Wensu County Statistical Yearbook and the Aksu Statistical Yearbook. Crop prices were sourced from the National Agricultural Product Cost–Benefit Compilation for the same period. Surface and groundwater usage data were obtained from annual irrigation district water use reports.

2.3. Research Methods

2.3.1. Changes in Land Utilization in the Irrigation District

(1) The LU transfer matrix visually reflects the conversion between different LU categories over a specific period [37,38]. The LU transfer matrix is calculated as follows:
B i j = B 11 B 1 n B n 1 B n n
where B is the irrigation land area, hm2; i and j represent the initial and final LU categories of the irrigation district, respectively; and n is all land categories.
(2) The dynamic change of LU can reflect the change process of the land resource category, quantity, and quality with time [39]. With the help of a single LU dynamic degree Ka and comprehensive LU dynamic degree Kc, we can reflect the dynamic change trend of LU in irrigation districts for many years [40]. The calculation formulas are, respectively, as follows:
K a = 1 T ( U b U a ) / U a × 100 %
K c = 1 T ( i = 1 n L U i j / 2 i = 1 n L U i ) × 100 %
where Ua is the area of a land category at the beginning of the study, hm2; Ub is the area at the end of the study, hm2; T is the study duration (a); Lui − j is the area of i-category land into j-category land, hm2; and Lui is the area of i land category at the beginning the study, hm2.

2.3.2. Cultivated Land Reclamation Rate in the Irrigation District

The cultivated land reclamation rate of the irrigation district refers to the proportion of cultivated land (the sum of dryland and paddy field area) in the total LU area of the irrigation district [41]. It can characterize the scale and change degree of land reclamation in irrigation districts in different periods. The calculation formula is as follows:
F m = i = 1 n L m / Y m × 100 %
where Fm is the cultivated land reclamation rate in the m-th unit of the irrigation district, %; Lm is the cultivated land area in the m-th unit, hm2; and Ym is the total land area in the m-th unit, hm2.

2.3.3. Agricultural Water–Soil Matching Coefficient in the Irrigation District

The agricultural water–soil matching coefficient quantifies agricultural water allocation efficiency per cultivated land unit, serving as an operational metric to assess the harmonization efficiency between available water resources and arable land capacity in irrigated zones [42]. The calculation formula is as follows:
V m = i = 1 n C m × S m / L m
where Vm is the water–soil matching coefficient for agriculture in the m-th unit of the irrigation district; Cm is the proportion of agricultural water in the m-th unit of the irrigation district, %; and Sm is the amount of surface and groundwater in the m-th unit, 104 m3.

2.3.4. Lorenz Curve and Gini Coefficient in the Irrigation District

The Lorenz curve visually represents the matching between agricultural water–soil resources. A curve closer to the 45-degree line indicates better matching [43]. The Gini coefficient quantifies the matching degree, with lower values indicating better matching [44]. According to previous studies [16], the evaluation results represented by the Gini coefficient G are as follows: 0.5 ≤ G < 1 indicates significant disparity; 0.4 ≤ G < 0.5 indicates large disparity; 0.3 ≤ G < 0.4 indicates relatively reasonable; 0.2 ≤ G < 0.3 indicates comparative fairness; and 0 < G < 0.2 indicates absolute fairness.

2.3.5. ESV of the Irrigation District

According to many scholars’ research, different ecosystem services interact with each other, and the ESV represents the direct and indirect benefits humans derive from ecosystems [45,46]. Based on Xie’s improved equivalent factor method, the ESV is calculated using land area data from five periods in the Tailan River Irrigation District [47]. The calculation formula [48] is as follows:
E S V m = i = 1 n H m   i × V C i   j
where ESVm denotes the ESV value in the m-th unit, CNY; Hmi is the area of i land category in the m-th unit, hm2; and VCij is the j-th ESV coefficient of i land category, (CNY · hm−2 · a−1).
When measuring the economic value of farmland, a standard equivalent factor usually refers to the economic value of the average annual output of grain per hectare of farmland [21]. Although Xie proposed to use the average net profit per unit area of rice, wheat, and corn to calculate this indicator [47], Shi pointed out that the annual net interest rate may be negative in some years, which is obviously contrary to the value of ecosystem services [49]. Therefore, the study uses the economic value of a single ESV equivalent factor equal to 1/7 of the market value of the national average grain yield per unit area in that year [50]. According to the average annual yield, unit price, and planting area of rice, wheat, and corn in the irrigation district from 2000 to 2020, the average value of one standard equivalent factor in the five periods of the irrigation district was calculated to be 1608.2 CNY/hm2, and the ESV coefficient suitable for the irrigation district was obtained (Table 1).

2.3.6. ESV Sensitivity Test and Trade-Off Synergy Analysis in the Irrigation District

(1) Due to the uncertainty of the value coefficient of various LU categories estimated by Costanza [51,52], to test the dependence of the ESV on the value coefficient over time, the ESV coefficient of each LU category was increased by 50%, and the sensitivity index (CS) of each LU category in the study area was calculated [53]. If CS > 1, ESV is elastic to VC; if CS < 1, it indicates that ESV is inelastic to VC. The larger the CS is, the more critical the accuracy of the ESV coefficient is. The smaller the CS, the more accurate the VC value, and the more in line with the actual situation of the study area [54]. The calculation formula of CS is as follows:
C S = ( E S V j E S V i ) / E S V i / ( V C j k V C i k ) / V C i k
where CS is the sensitivity coefficient; ESV is the total value of ecological services; VC is the equivalent coefficient of ESV; i and j represent the initial value and the adjusted value of the equivalent coefficient, respectively; and K is the category of LU.
(2) The Pearson coefficient (R) can be used to reflect the linear correlation between two random variables [55]. Through this coefficient, the correlation between agricultural water–soil matching and the four ecosystem services of provision, regulation, support, and culture in the irrigation district is identified. The value of R is [−1,1]; when 0 < R < 1, the two variables are synergistic; when −1 < R < 0, the two variables are trade-offs; and when R = 0, the two variables are not related; that is, the greater the absolute value, the greater the degree of correlation [56]. Its calculation formula is as follows:
R = i = 1 q (   X i X ¯ ) (   Y i Y ¯ ) / i = 1 q (   X i X ¯ ) 2 i = 1 q (   Y i Y ¯ ) 2  
where R is the Pearson coefficient; Xi and Yi represent the i-th observed value of the two variables, respectively; X ¯ and Y ¯ represent the average of the two variables, respectively; and q is the number of observations.

3. Results

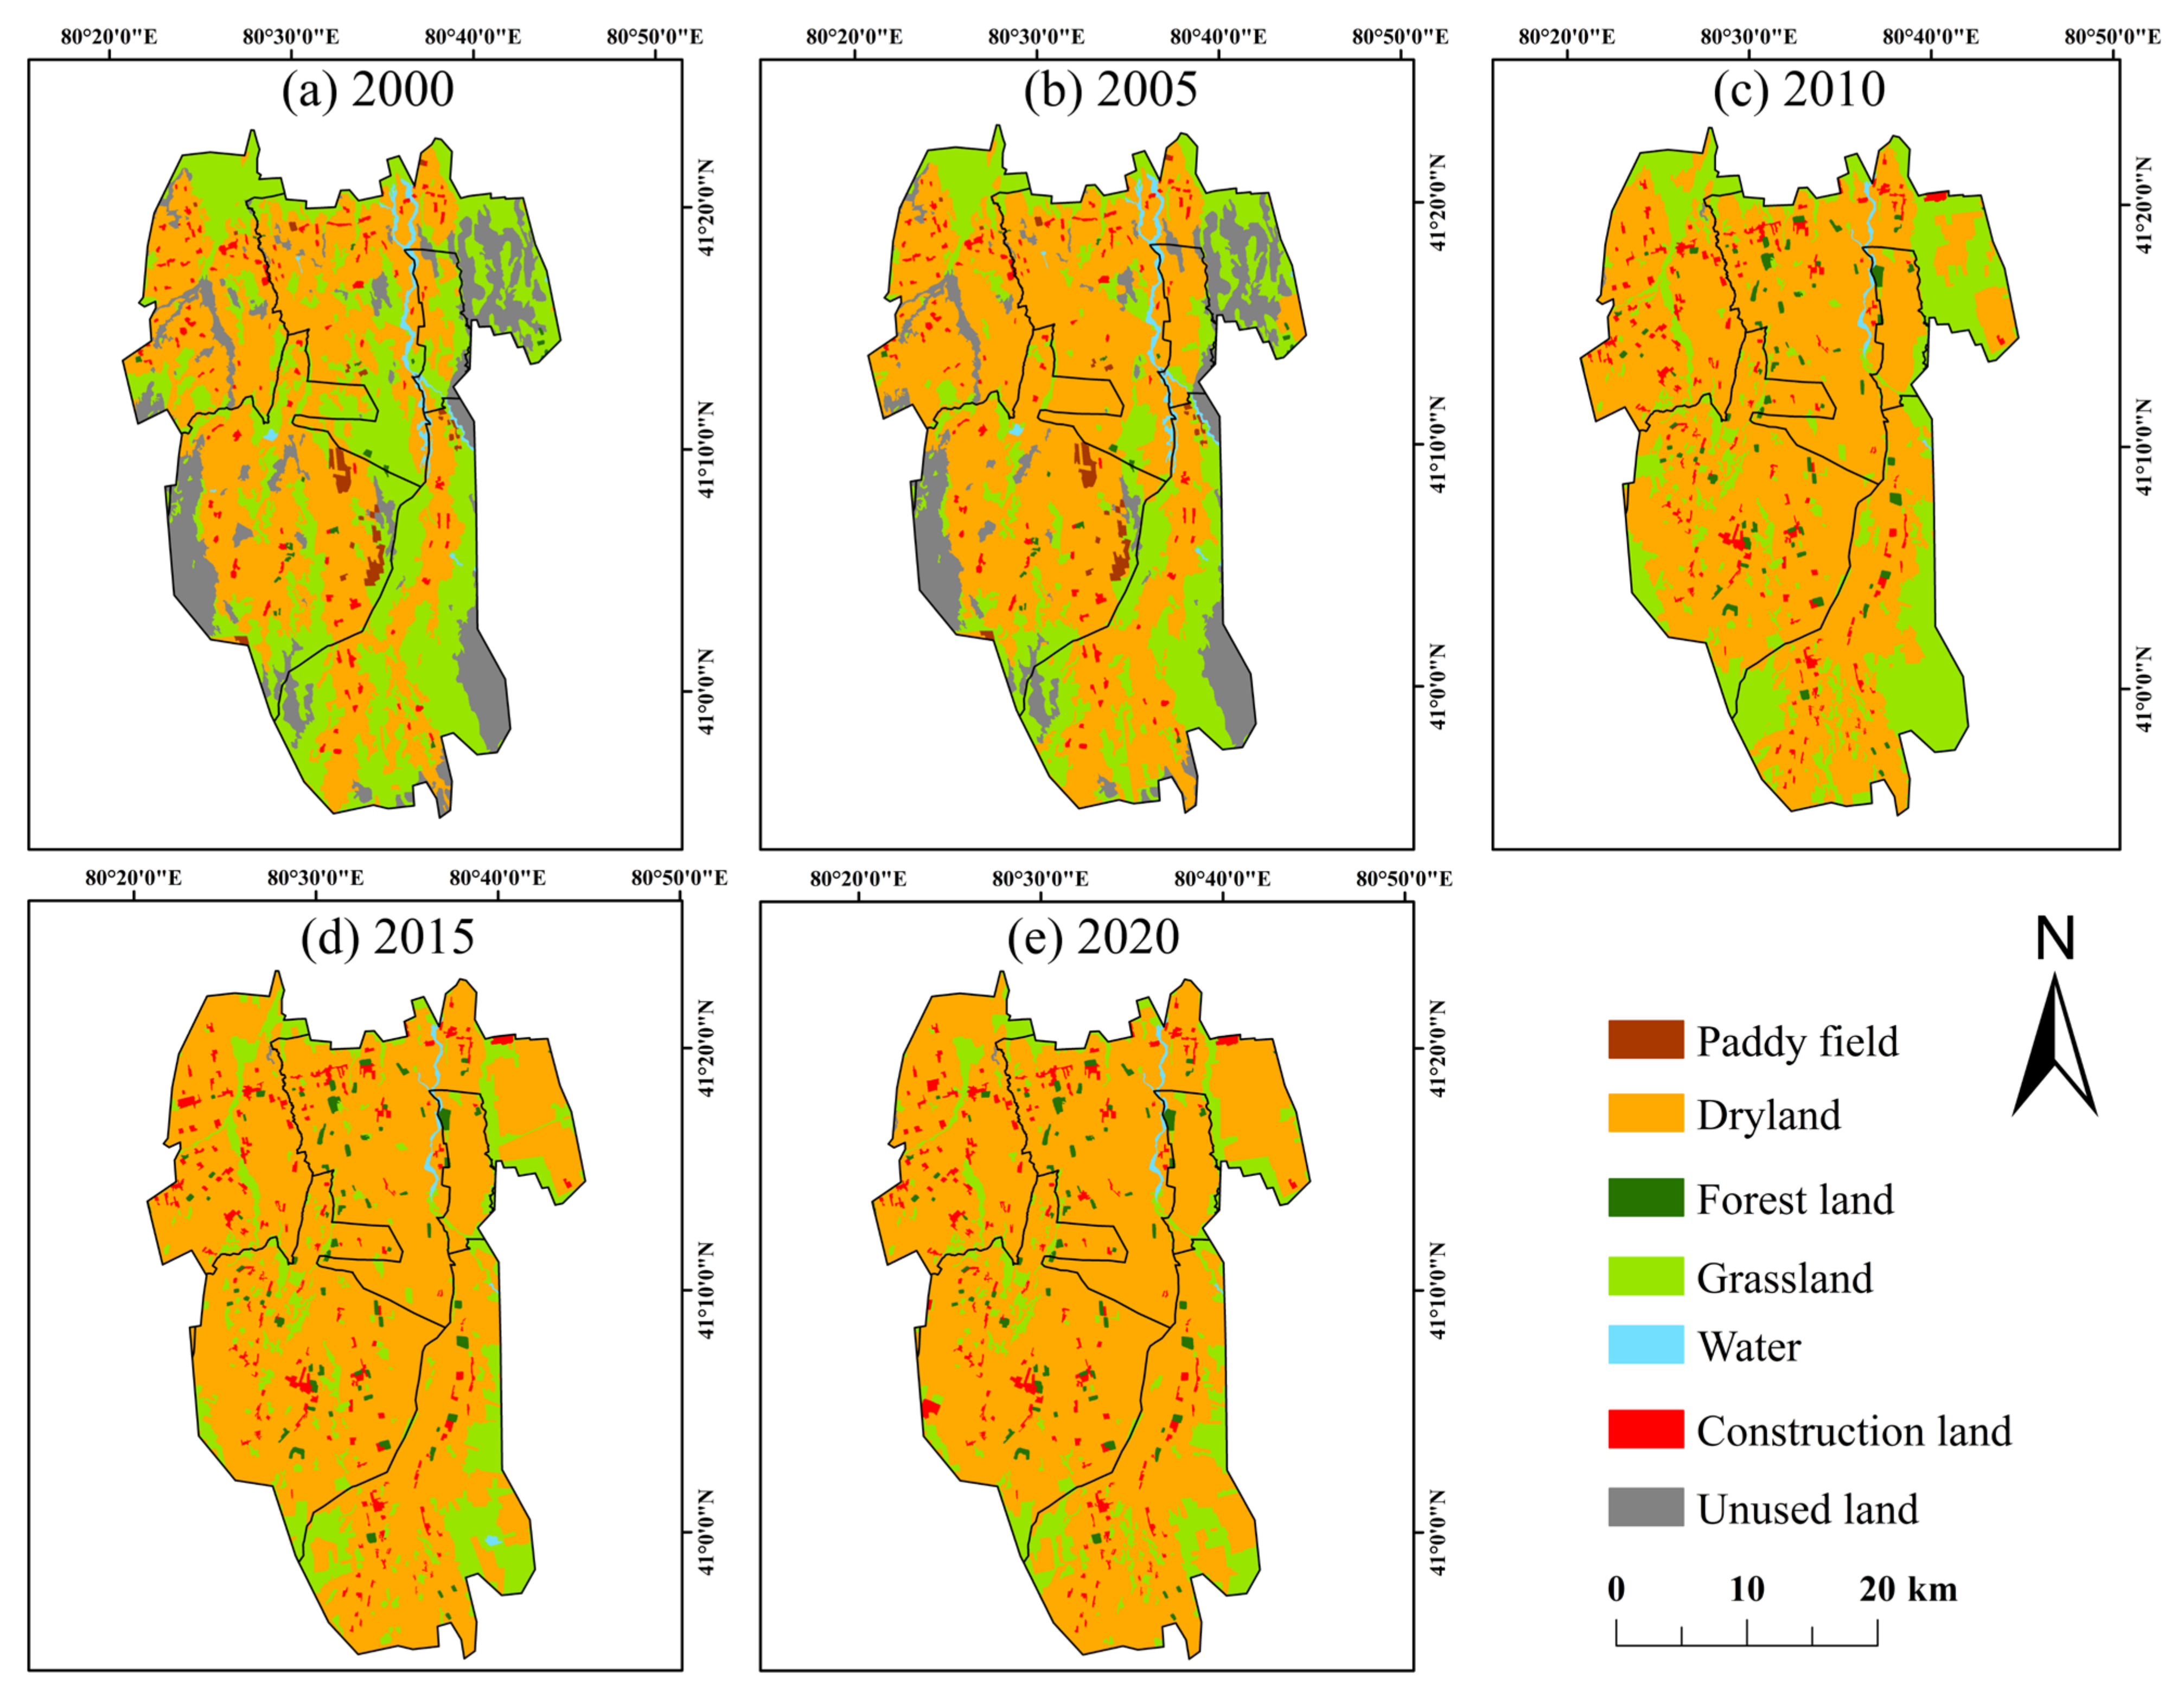
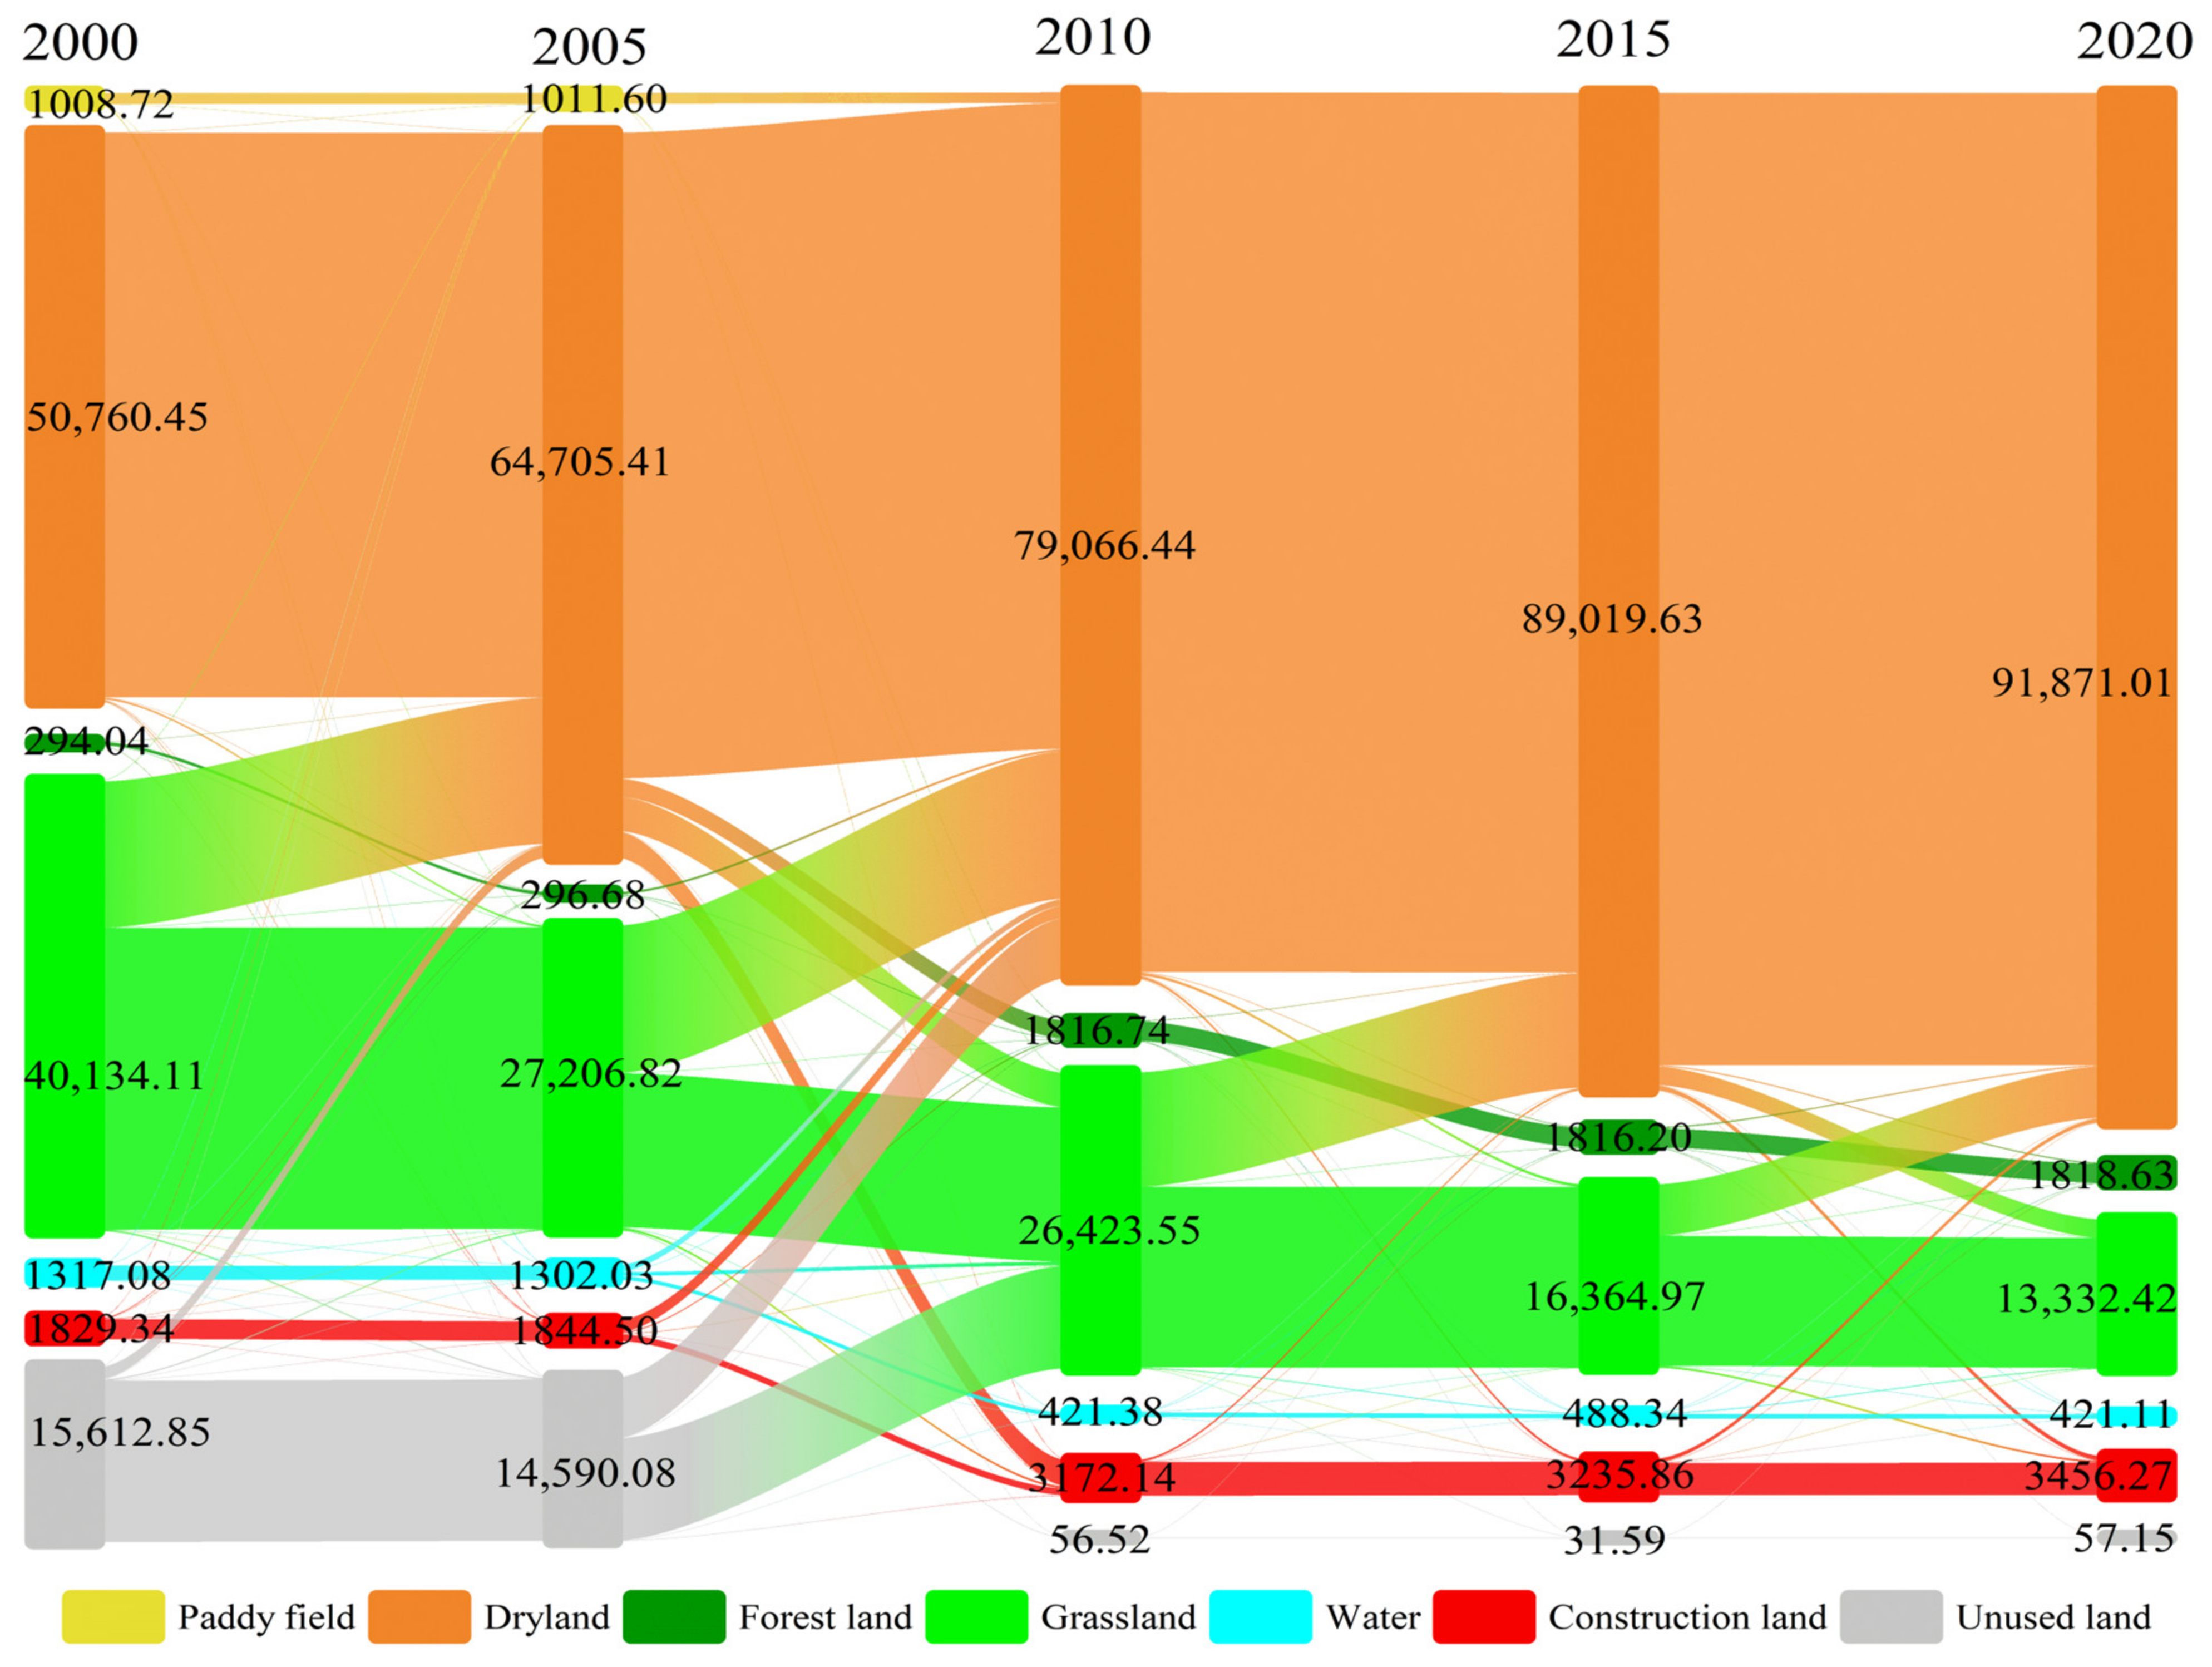
3.1. Spatiotemporal Dynamic Changes of LU in the Tailan River Irrigation District

As illustrated in Figure 2, dryland and grassland collectively constituted over 80% of the Tailan River Irrigation District’s land area throughout the 2000–2020 period, maintaining their dominance as primary LU categories. Additionally, the increase and decrease of LU in its interior is also obvious. The most notable change occurred in dryland coverage, which surged from 45.75% of the total area in 2000 to 82.8% by 2020, representing a 37.05 percentage point increase. Construction land increased from 1.65% to 3.12%. The national and local “oasisization” and “food security” policies have significantly expanded dryland agriculture in irrigated districts [57]. Meanwhile, rising global temperatures have prompted a shift in agricultural practices across arid regions like Xinjiang, with a growing emphasis on drought-resistant crops. This transformation has further entrenched the dominance of dryland agriculture in regional LU patterns. Additionally, the increasing population density in oasis areas has created a strong demand for residential land, which has driven the expansion of urban and construction LU [57].
Secondly, the area of unused land, grassland, and paddy fields decreased. During 2000–2020, the paddy fields’ area decreased from 0.91% to 0%. The unused land area decreased from 14.07% to 0.05%. The LU data collection period (June–September) coincides with the typical rice maturation cycle in the irrigation district, which generally concludes around September. This temporal overlap, combined with resolution limitations, may compromise the effective identification of small-scale paddy field distributions through remote sensing imagery. As previously indicated, grassland reduction primarily stems from policy-driven land management strategies and agricultural expansion under evolving climatic conditions. The grassland area decreased from 36.17% to 12.02%. The forest land area increased from 0.27% in 2000 to 1.64% in 2010 and has remained since then. The simultaneous decrease in unused land and expansion of forested areas demonstrates significant progress in desertification control and sandy land rehabilitation within the irrigation district. Before 2010, the water area was above 1.17%; since then, the water area decreased to 0.4%. Hydrological modifications in the upper Tailan River basin, including the construction of low-lying reservoirs and cascaded canal-head power stations, have altered natural water flow patterns through river diversion and flow interception, consequently reducing downstream water surface areas.
Combined with Figure 2 and Figure 3, it can be seen that from 2000 to 2020, dryland and construction land are the two categories of land with the biggest turn-in area in the irrigation district, and their turn-in areas are 41,110.56 hm2 and 1626.93 hm2, respectively. Grassland and unused land are the two categories of land with the biggest transfer-out areas in the irrigation district, and the transfer areas are 26,801.69 hm2 and 15,555.7 hm2, respectively. In addition, unused land is the biggest proportion of land transferred to grassland, while grassland is the biggest proportion of land transferred to dryland. The land conversion area is mostly concentrated in the eastern part of Jiamu Town, the central part of Yixilaimuqi Township, the southeastern part of Guleawati Township, and the southwestern part of Kezile Town. At the same time, the area of forest land and water area in the irrigation district showed a trend of increasing fluctuation and decreasing fluctuation from 2000 to 2020. The reason is that they are deeply related to the urbanization development behind the irrigation district, the increasing expansion of construction land year by year, and the active exploration of the development and utilization of a large amount of unused land.
From 2000 to 2020, the single LU dynamic degrees of the irrigation district from small to large are as follows: grassland, water, dryland, construction land, unused land, paddy field, and forest land (Table 2). The area of forest land increased rapidly from 2005 to 2010, and its single LU dynamic degree reached 102.6%, which was the highest dynamic degree of the irrigation district. From 2005 to 2010, the paddy field, unused land, and water area decreased sharply, and the single LU dynamic degrees were 20%, 19.92%, and 13.53%, respectively. From the interval change of the comprehensive LU dynamic degree from small to large, the comprehensive LU dynamic degree of the irrigation district was the biggest between 2005 and 2010, and the changes in various categories were the most significant; and the comprehensive LU dynamic degree was the smallest between 2015 and 2020, and the changes of land categories were the least significant, indicating that the utilization of land categories gradually stabilized during this period.

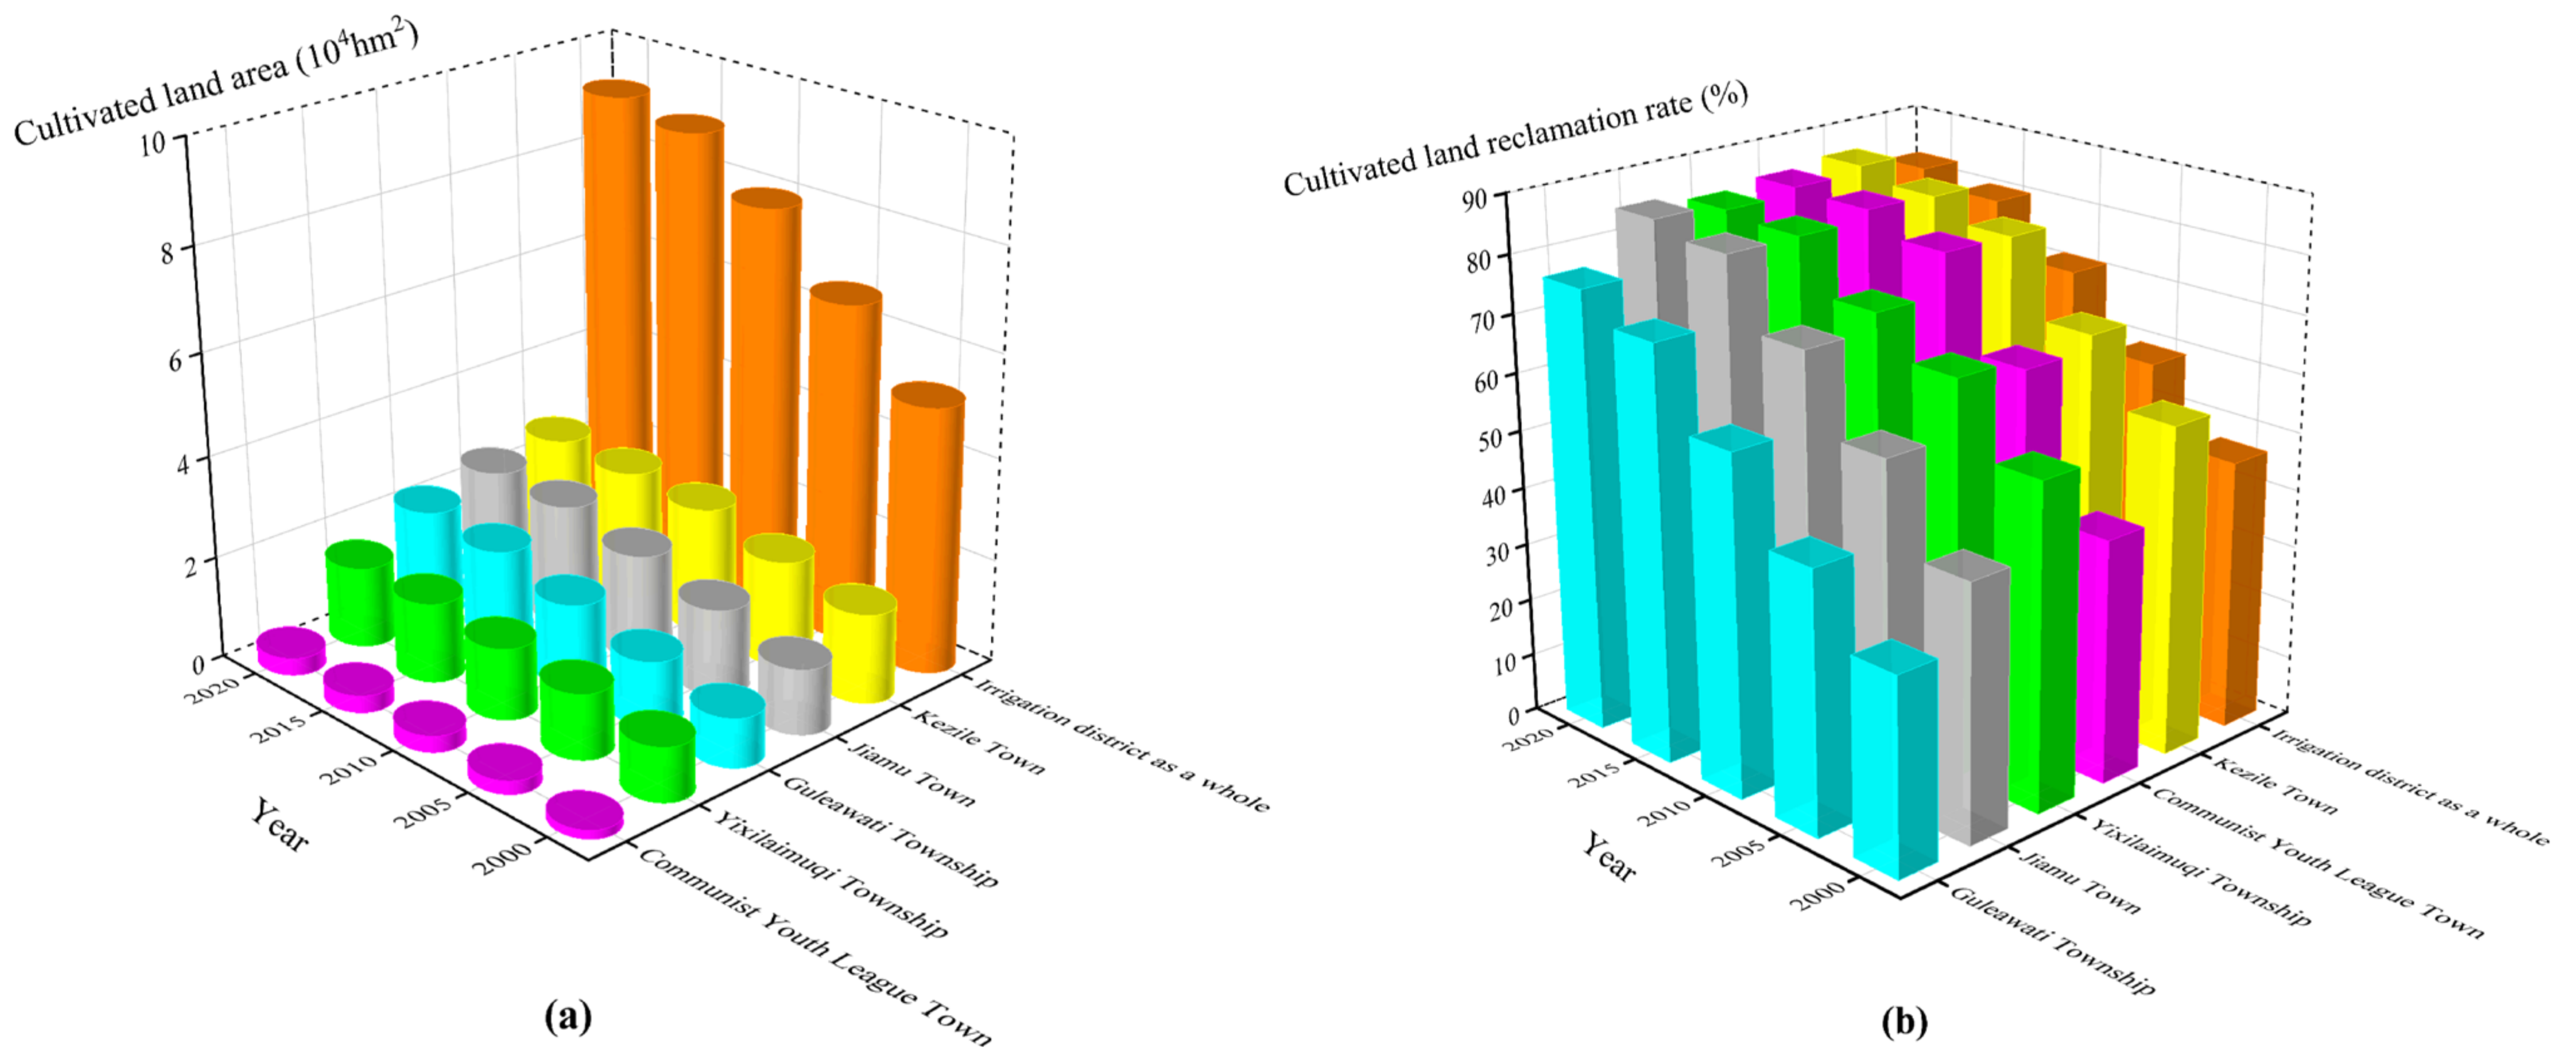
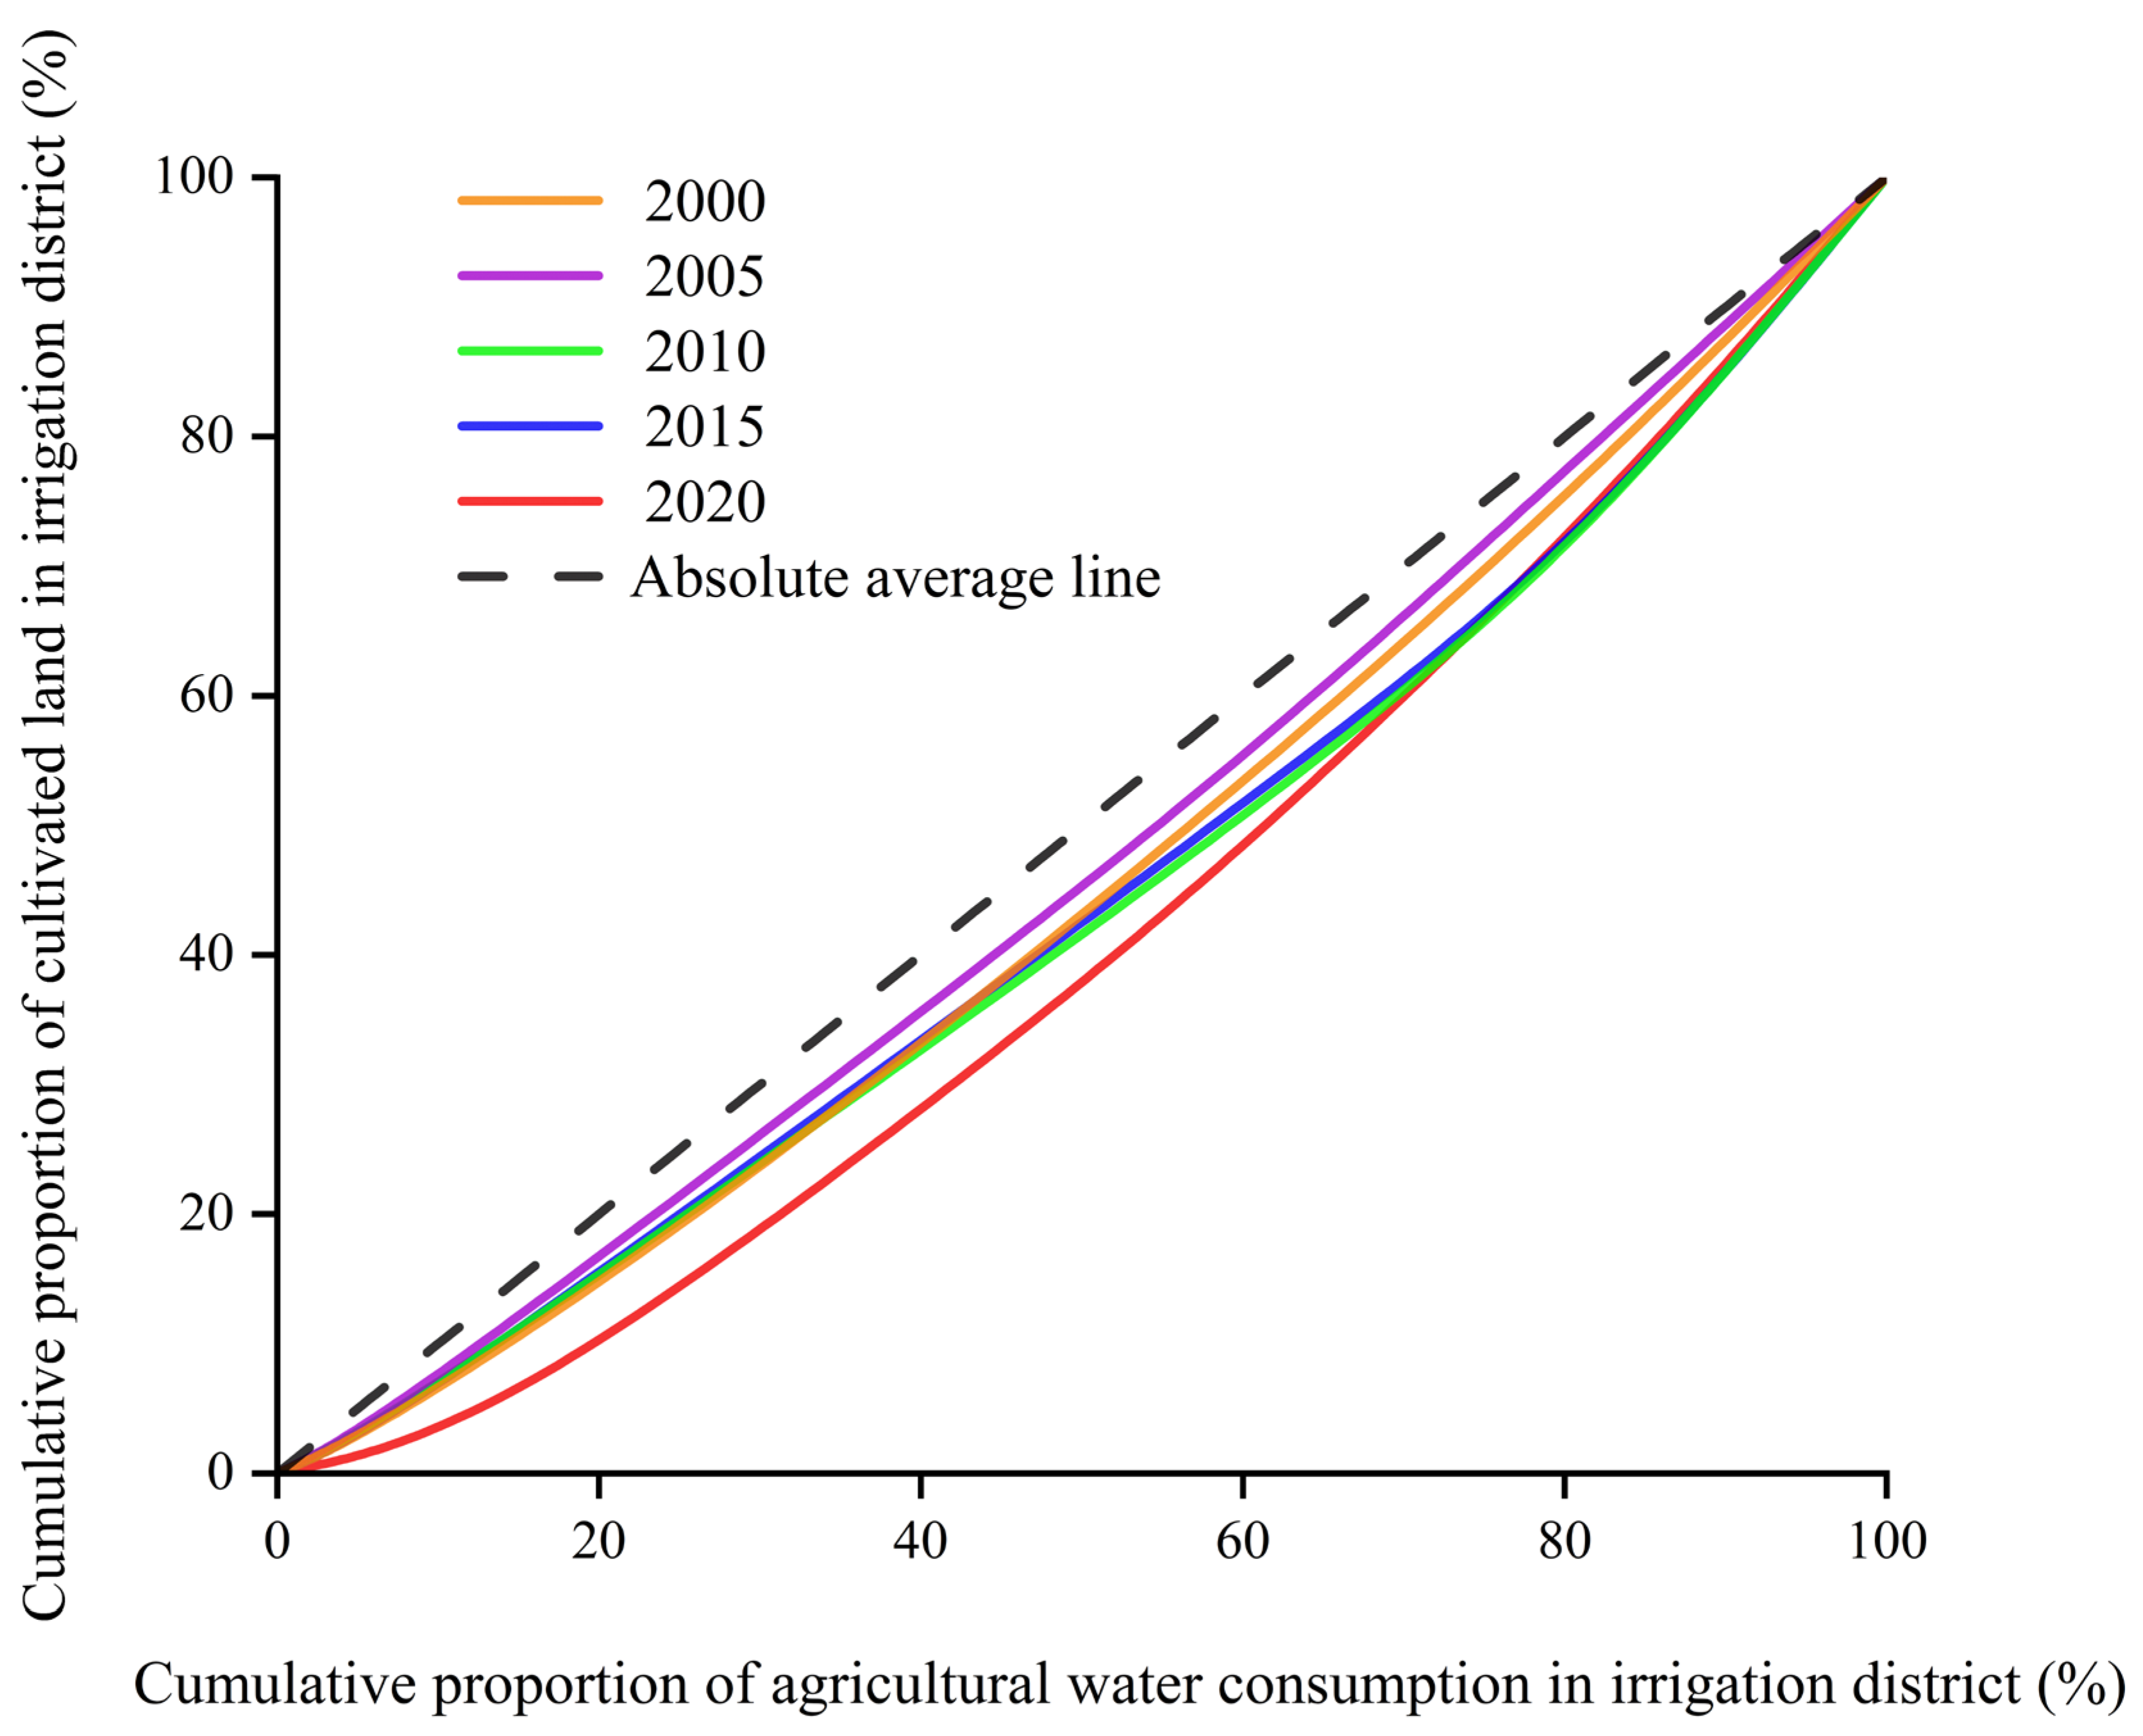
3.2. Reclamation Rate and Matching Gini Coefficient in the Tailan River Irrigation District

The cultivated land area and reclamation rate of each township unit in the Tailan River Irrigation District showed a gradually increasing trend between 2000 and 2020. The total cultivated land area increased by 40,101.84 hm2, and the reclamation rate increased from 46.66% in 2000 to 82.8% in 2020 (Figure 4). In the five units of the irrigation district, the area of cultivated land in Guleawati Township increased the most from 2000 to 2020, which was 12,182.67 hm2, but the reclamation rate of cultivated land was only 76.37%, which was lower than that of other units in the same period. On the contrary, the cultivated land area of the Communist Youth League Town increased the least, only 1695.33 hm2, but its reclamation rate increased by 43.11% from 2000 to 2020, and the reclamation rate reached 84.82% by 2020, and the utilization of cultivated land remained at a high level. In addition, the cultivated land reclamation rate of Kezile Town, Yixilaimuqi Township, Communist Youth League Town (only 41.71% in 2000), and Jiamu Town (only 43.72% in 2000) remained above 50% for many years, reflecting that the cultivated land resources of each unit have been fully reclaimed and utilized.
The Gini coefficient is used to quantitatively characterize the overall agricultural water–soil matching in the irrigation district. Table 3 is the Gini coefficient and evaluation results of agricultural water–soil matching in the Tailan River Irrigation District between 2000 and 2020. The coefficient showed a trend of decrease–increase–decrease–increase during the period.
Combined with the comparison of Lorentz curves for five periods (Figure 5), it was found that the minimum Gini coefficient in 2005 was 0.066, and the Lorentz curve was the closest to the absolute average line, indicating that the agricultural water–soil matching degree in this period was the best. This is mainly because 2005 was a wet year. The glacier ablation increased the runoff of the basin, and the water resources were abundant in the short term. The agricultural water in the townships and towns within the irrigation district was sufficient, and the pressure on local water–soil resources was alleviated. On the contrary, the maximum Gini coefficient in 2020 was 0.181. Although the coefficient evaluation is in absolute fairness, the Lorentz curve is the farthest from the absolute average line, indicating that the agricultural water–soil matching was the worst in this period. This is mainly due to the increase in population, construction land, and cultivated land in the irrigation district in 2020, which led to the surge of water use in production, life, and ecology. Under the condition of limited water resources such as glacier retreat and groundwater overexploitation, the uneven distribution of water soil in the irrigation district was deepened.
The Gini coefficients of the remaining years were between 0 and 0.2, which is similar to the average Gini coefficient of agricultural water–soil in the irrigation district between 2000 and 2020, which is in an absolutely fair interval. Thanks to the long-term implementation of a relatively fair water rights distribution mechanism in the irrigation district, the monopoly of agricultural resources has been effectively avoided. Therefore, based on the agricultural water consumption of the irrigation district, from the point of view of the Gini coefficient of water–soil matching in different periods, the Tailan River Irrigation District is not short of water and has a relatively uniform background condition of water–soil resources. In the future, the district management plan can be formulated according to the differences of townships within the irrigation district.

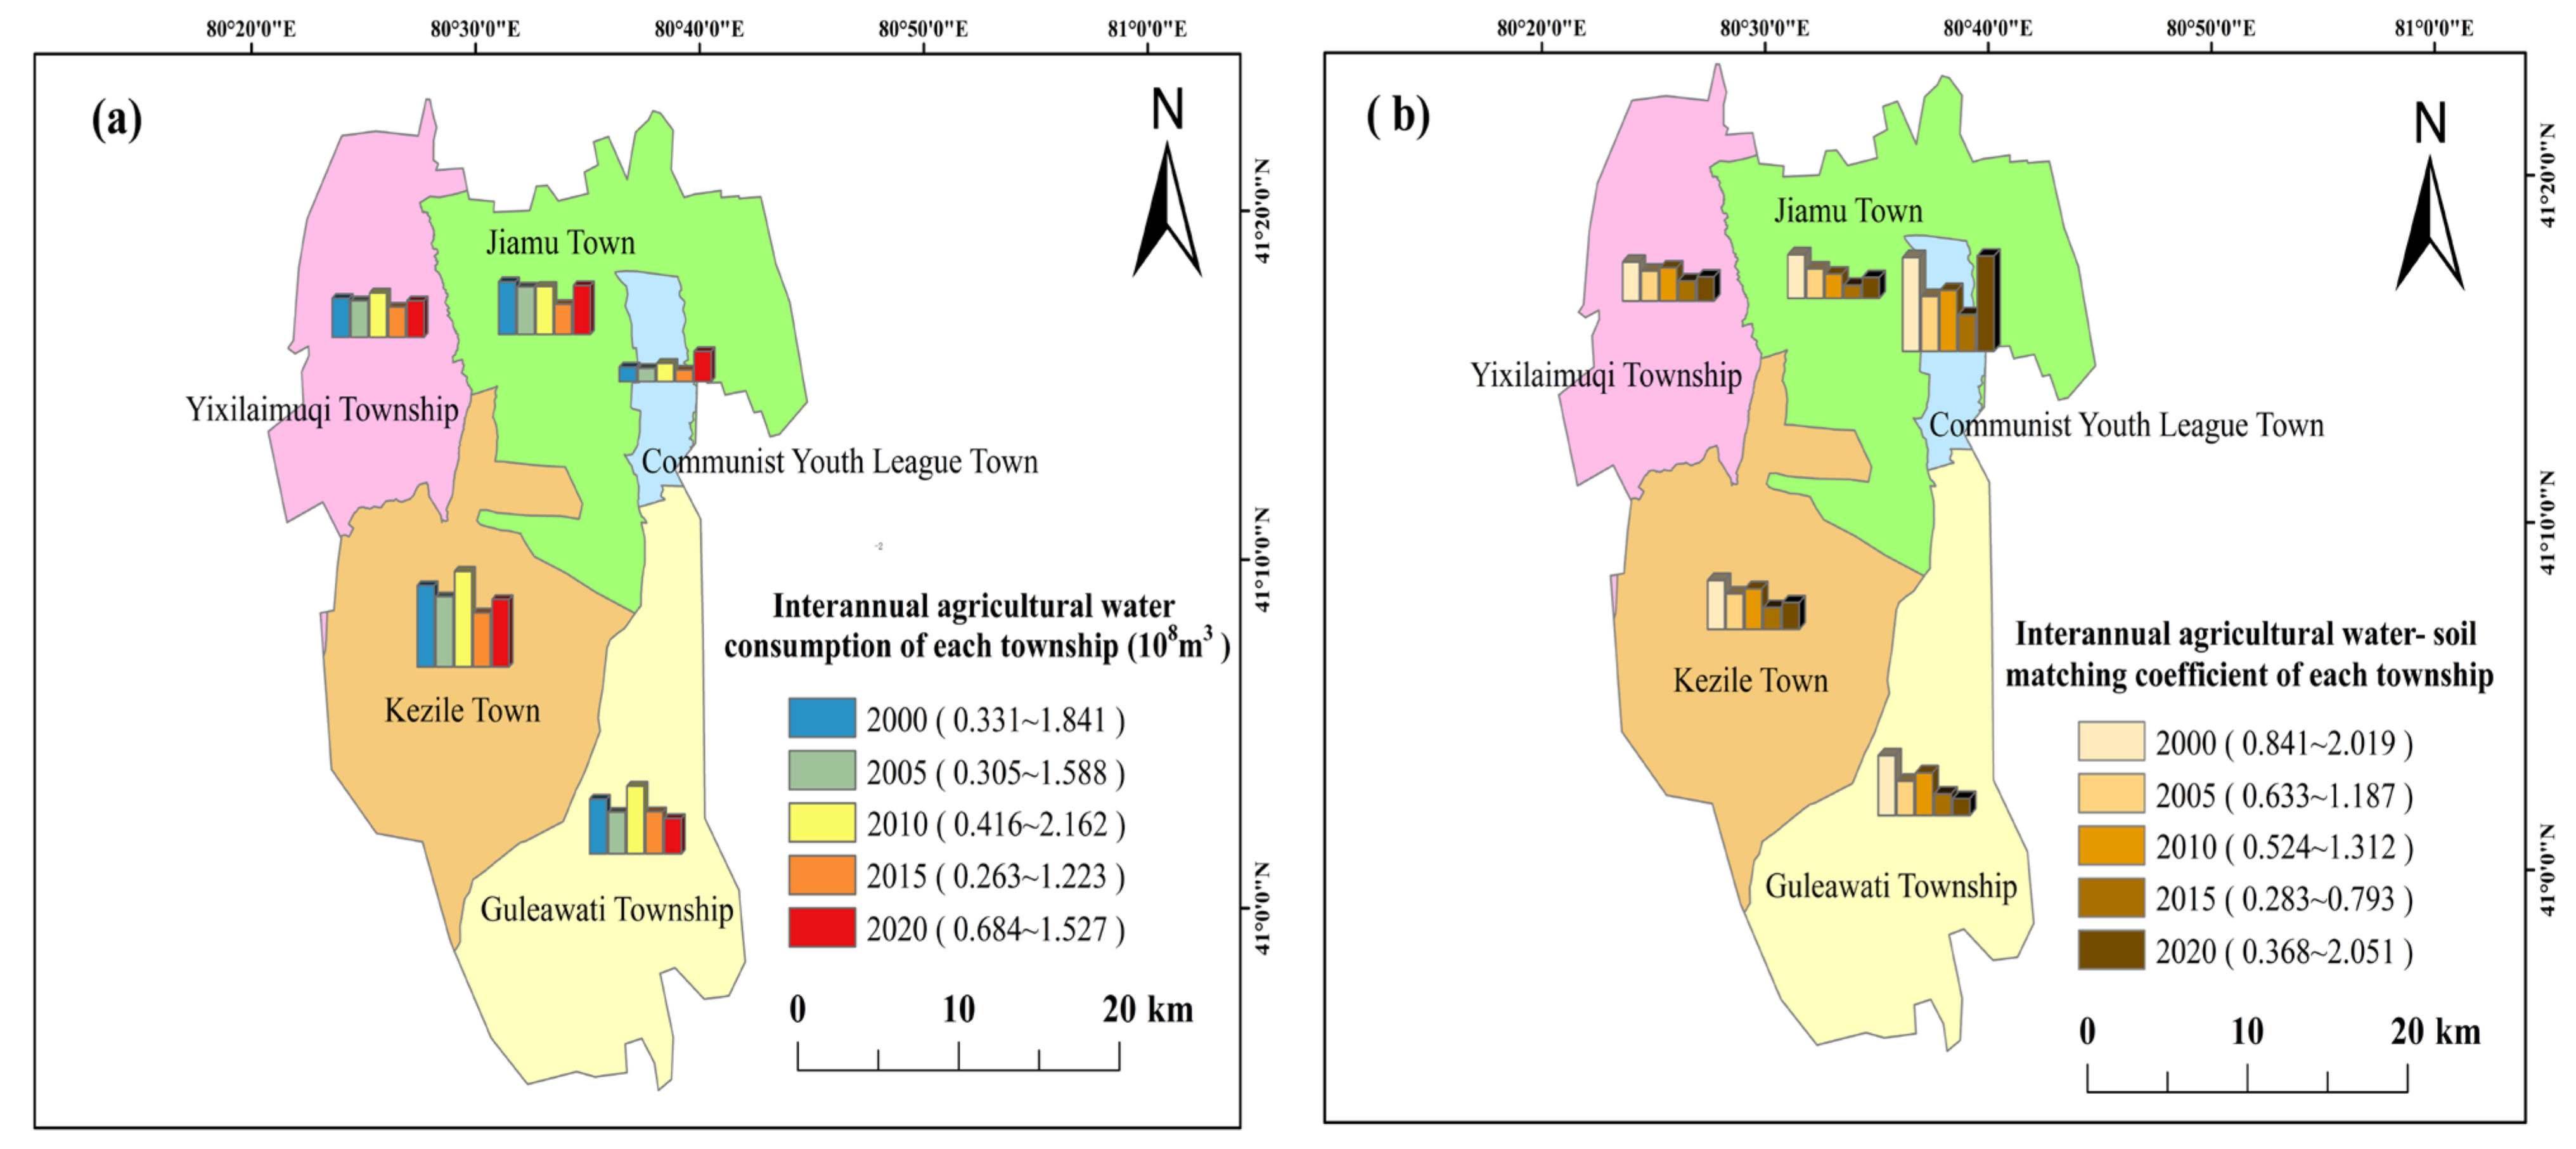
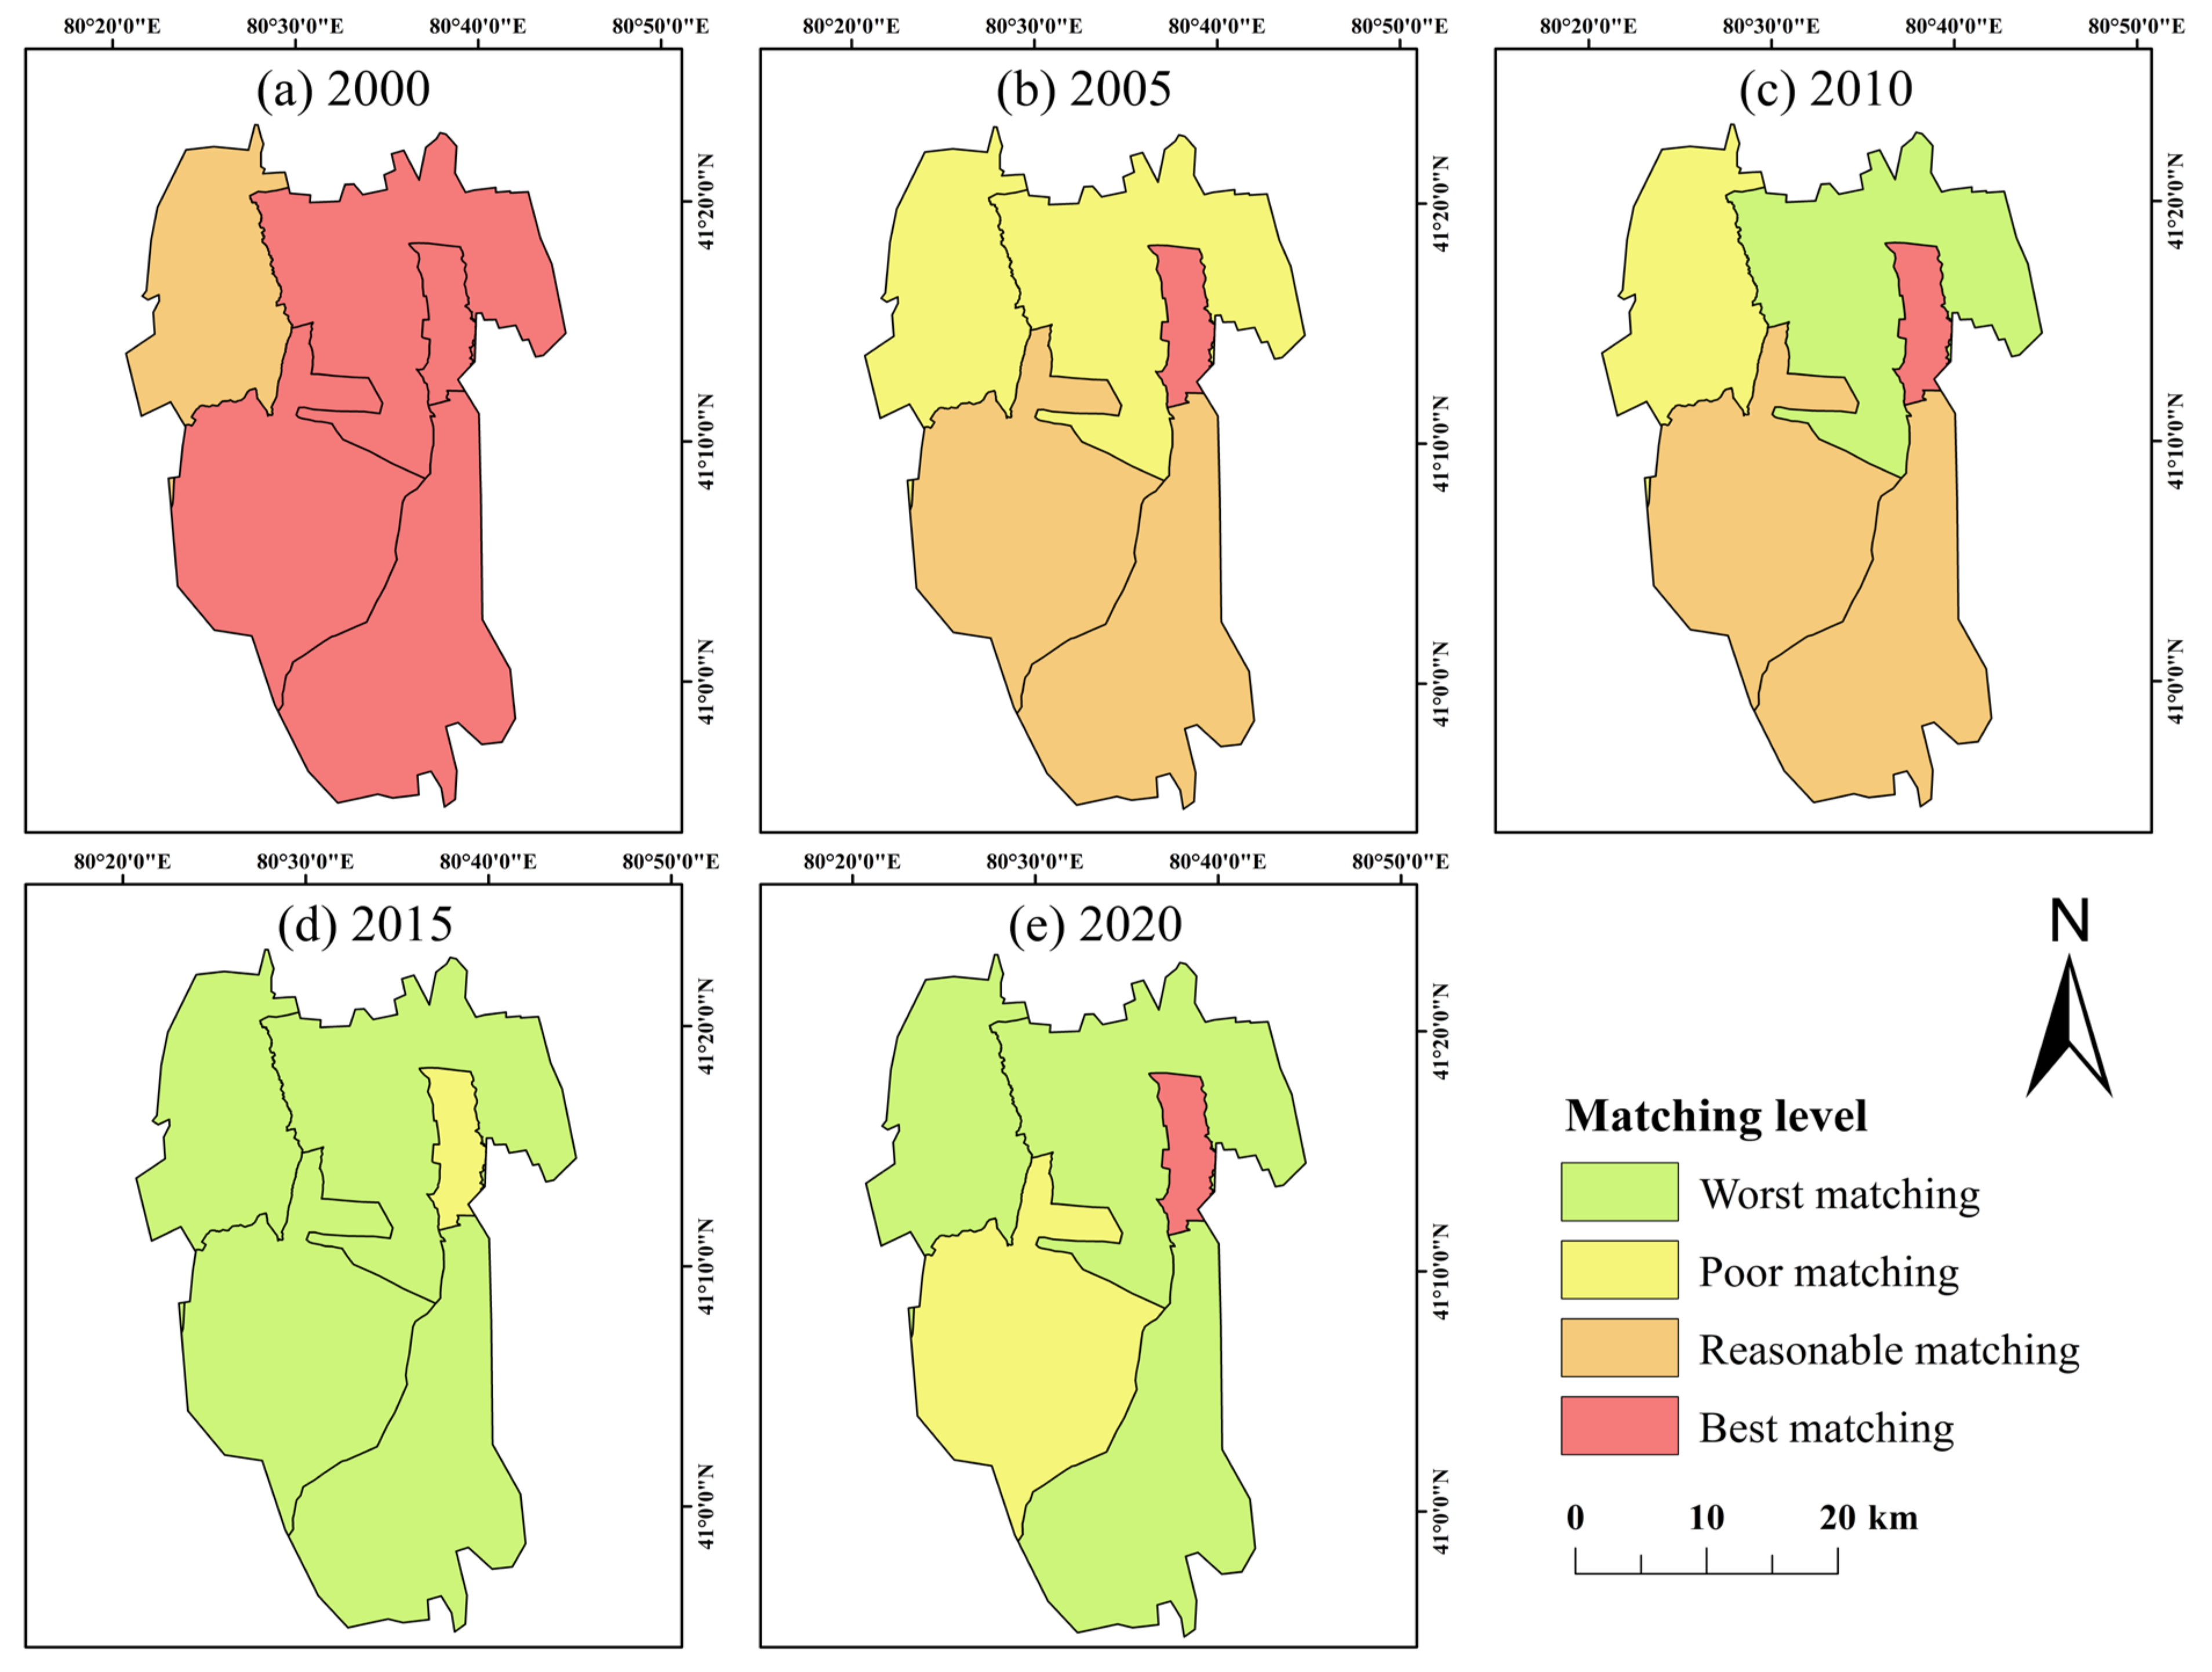
3.3. Spatiotemporal Distribution of Agricultural Water–Soil Matching in the Tailan River Irrigation District

The agricultural water consumption in the irrigation district for each period is not balanced (Figure 6). In 2010 and 2015, the agricultural water consumptions were the highest and lowest, which were 618.3 million m3 and 379.6 million m3, respectively. The remaining agricultural water consumptions in 2000, 2005, and 2020 were 547.5 million m3, 473.6 million m3, and 494.5 million m3, respectively. There are also significant differences in the agricultural water consumption of each unit in the irrigation district during each period. The agricultural water consumption of Kezile Town was far more than that of the other units in the same period, but the agricultural water–soil matching coefficient fluctuated and decreased since 2000. The agricultural water–soil matching coefficient of the whole irrigation district also changed with the change in agricultural water consumption and cultivated land reclamation rate. The agricultural water–soil matching coefficients of the irrigation district between 2000 and 2020 were as follows, from large to small: 2000 (1.058), 2010 (0.782), 2005 (0.721), 2020 (0.538), and 2015 (0.426). The agricultural water–soil matching coefficient of the irrigation district reached the maximum in 2000, because the cultivated land reclamation rate was the lowest and the agricultural water use conditions were better at that time. The coefficient in 2015 was the smallest. Because the agricultural water use was significantly reduced compared with the past, the cultivated land reclamation rate did not decrease, and it still maintained a high growth, which made the water–soil matching situation in the irrigation district deteriorate.
The spatiotemporal distribution of agricultural water–soil matching in the irrigation district was further highlighted. Referring to the previous research methods [17], the natural breakpoint method in ArcGIS10.8 was used to classify the agricultural water–soil matching coefficients of each unit in each period, which are as follows: worst matching (0.283~0.524), poor matching (0.524~0.720), reasonable matching (0.720~0.921), and best matching (0.921~2.051) (Figure 7). The agricultural water–soil matching status of each unit in the irrigation district in 2000 was reasonable or above, reaching the best state in the study period; the worst was in 2015, and the agricultural water–soil matching of each unit was poor and below.
Except for in 2015, the best unit of agricultural water–soil matching in the irrigation district was only the Communist Youth League Town, and its agricultural water–soil matching coefficient was 0.793~2.051 (Figure 6), which always occupied the first place in each unit. In addition, the units with reasonable water–soil matching are as follows: Yixilaimuqi Township in 2000, and Kezile Town and Guleawati Township in 2005 and 2010. The towns with poor matching degrees are as follows: Jiamu Town in 2005, Yixilaimuqi Township in 2005 and 2010, Communist Youth League Town in 2015, and Kezile Town in 2020. The worst matching areas are as follows: Jiamu Town in 2010, units other than the Communist Youth League Town in 2015, and Yixilaimuqi Township, Jiamu Town, and Guleawati Township in 2020.
Because the Tailan River Irrigation District is located in the arid inland river area, it has a continental north-temperate arid climate, the precipitation in the irrigation district is scarce, and the evaporation is large [57]. The interannual agricultural water use of each unit is mostly dependent on the surface runoff of the Tailan River. When the interannual variation of the surface runoff of the Tailan River is large, the agricultural water use in the irrigation district will also change. Compared with the initial stage of research, the contradiction between agricultural water–soil matching in the irrigation district has deepened in recent years. Therefore, in the future, it is necessary to rationally allocate the agricultural water use in the irrigation district according to the scale of cultivated land reclamation in each unit, and further strengthen the monitoring and statistics of the surface runoff of the Tailan River, to better provide the basis for agricultural water use in the irrigation district.

3.4. Spatiotemporal Variation and Sensitivity Test of the ESV in the Tailan River Irrigation District

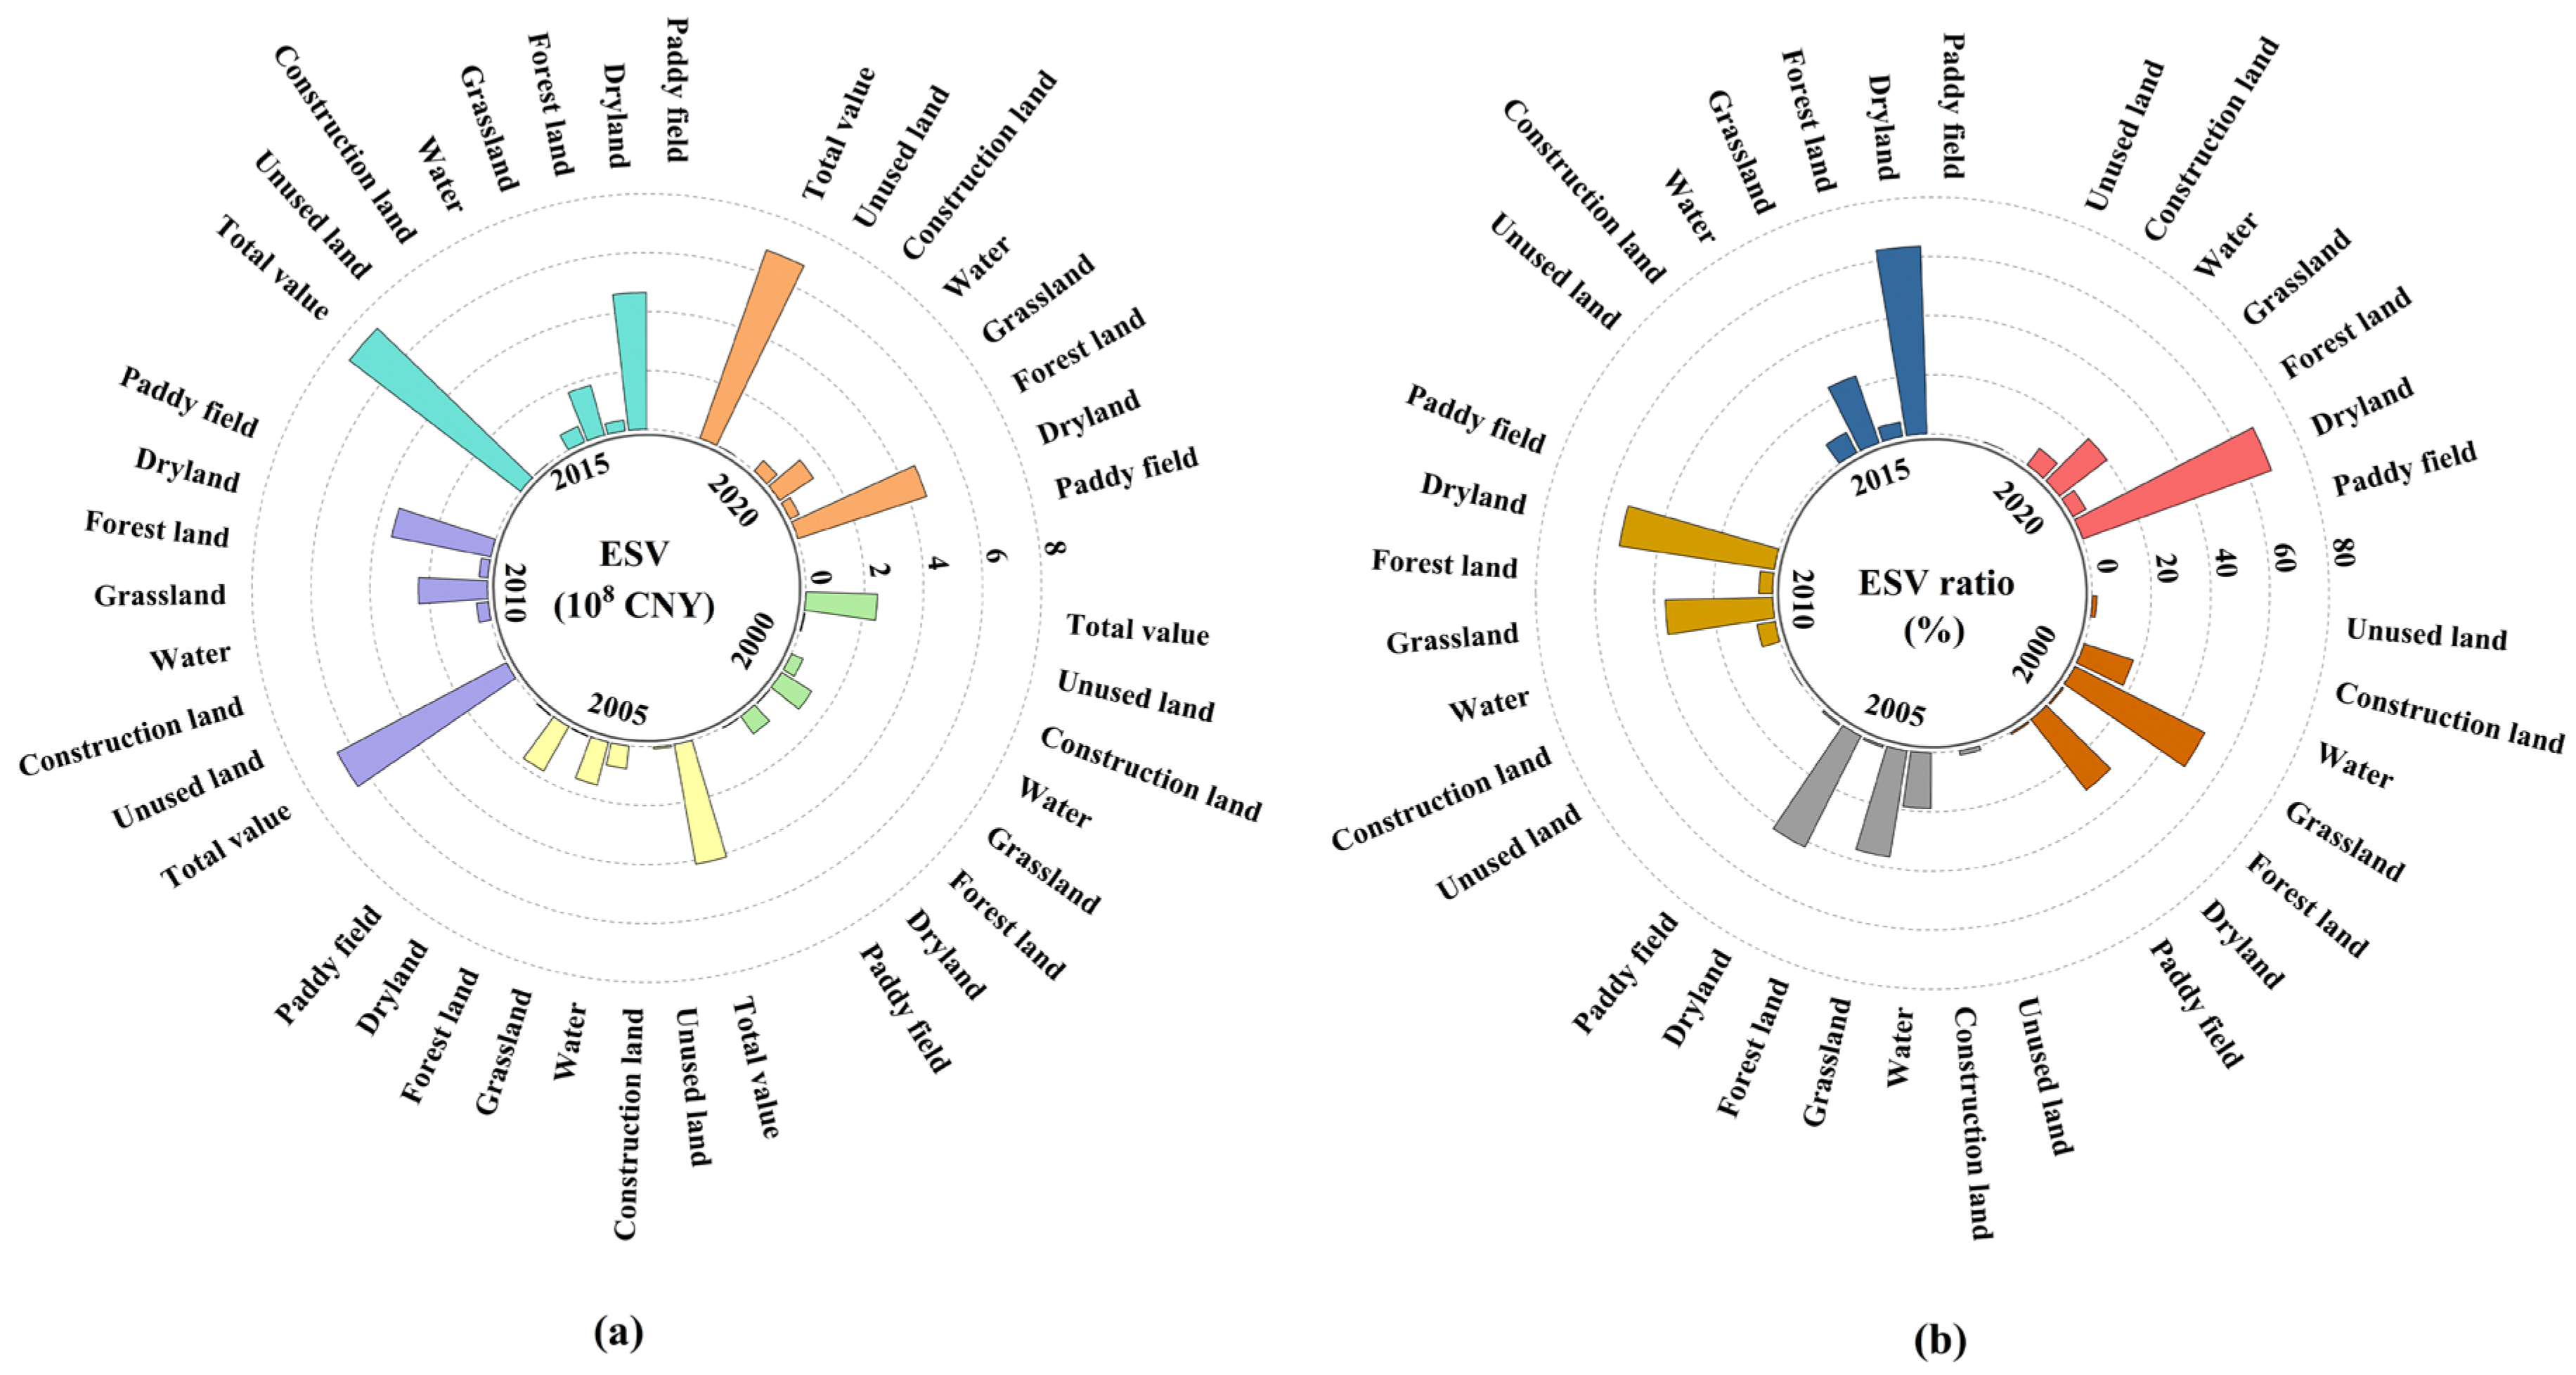
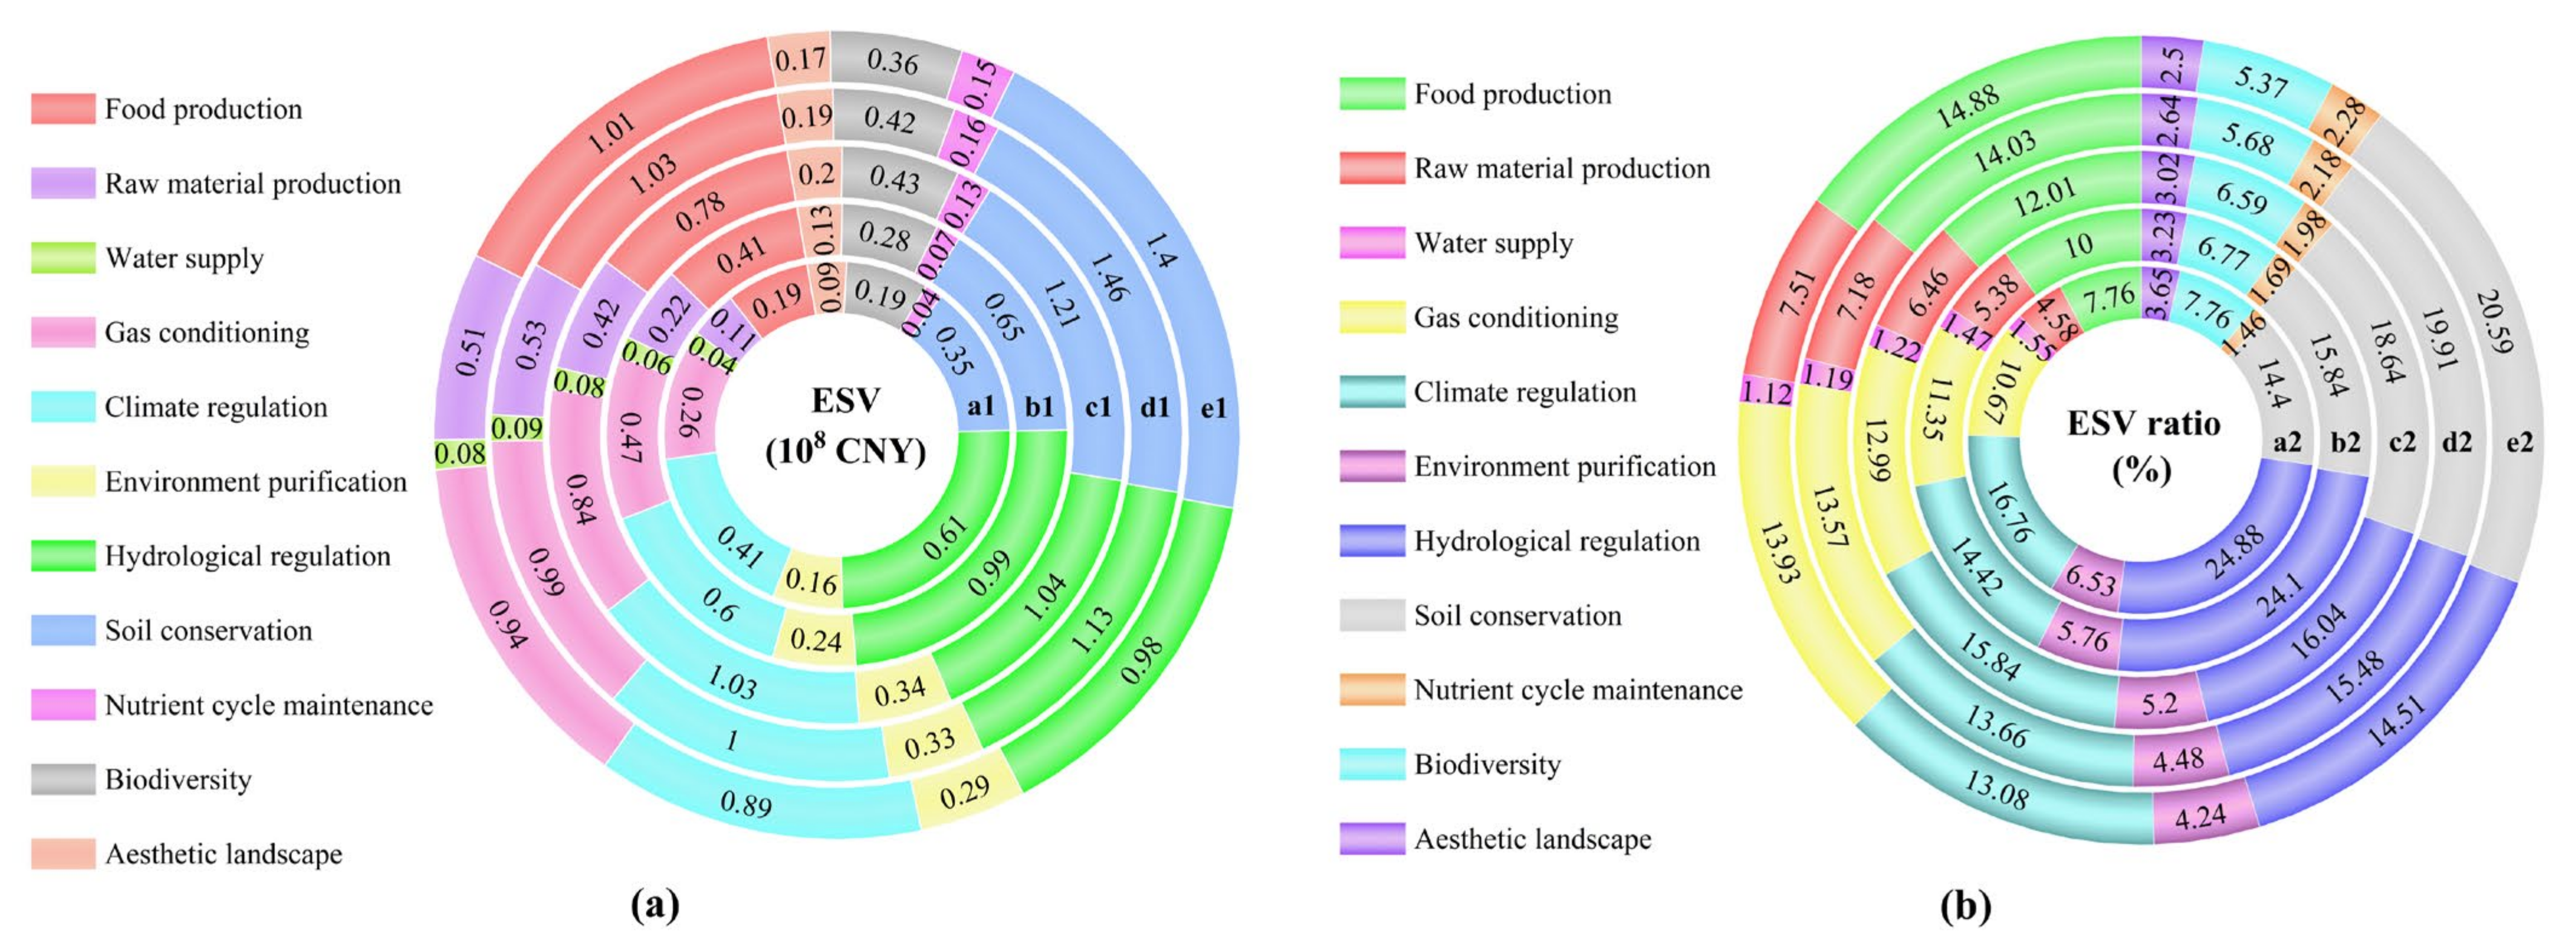
3.4.1. Spatiotemporal Changes of the ESV of Each LU and Secondary Service Category in the Irrigation District from 2000 to 2020

The total values of the ESV in the Tailan River Irrigation District in 2000, 2005, 2010, 2015, and 2020 were CNY 243 million, 413 million, 650 million, 732 million, and 678 million, respectively (Figure 8). The change of the ESV in the irrigation district is the result of the combined action of LU change, climate change, and human activities. Between 2000 and 2020, the ESV increased by CNY 435 million, of which CNY 386 million came from dryland. Therefore, except for 2000 (the contribution of grassland ESV accounted for 49.36% in 2000), dryland always ranked first in the contribution of each land category to the ESV in the irrigation district. The contribution rates of the remaining four periods to the ESV were 42.05% (2005), 52.87% (2010), 63.43% (2015), and 67.81% (2020), respectively, accounting for more than half of the contribution rate of each land category to the ESV. The increase of dryland area, the promotion of water-saving irrigation technology, and the adjustment of crop structure have directly improved the ESV of dryland soil conservation and food production.
Secondly, grassland and water areas contributed greatly to the ESV in the irrigation district. Although the proportion of grassland ESV decreased by 29.15% from 2000 to 2020, the ESV increased by CNY 17 million. The ESV of water increased by CNY 4 million, and the proportion decreased by 10.58%. The proportion of the ESV in forest land and paddy fields showed an increasing and decreasing trend between 2000 and 2020, respectively, and the ESV increased by CNY 33 million and decreased by CNY 10 million, respectively. Meanwhile, the ESV of unused land also decreased by approximately CNY 4 million; the ESV of construction land remained 0 across each period.
Because the irrigation district is located in an arid inland area, the unused land occupies nearly 40% of the overall area of the region, and the regional development is extremely dependent on water resources. From 2000 to 2020, the ESV of the secondary service category in the Tailan River Irrigation District showed a fluctuating trend of increasing first and then decreasing (Figure 9). The hydrological regulation and water supply are consistent with the overall ESV change in the irrigation district. The hydrological regulation ESV increased from CNY 61 million in 2000 to CNY 113 million in 2015, and then decreased to CNY 98 million in 2020, and the fluctuation changed significantly. The reason may be related to the reduction of the water supply caused by climate fluctuations such as the reduction of water area and the increase of evaporation in the irrigation district, which has an impact on hydrological regulation and agricultural productivity.
Similar to food production and gas conditioning, the ESV provided by soil conservation was undoubtedly the biggest among the secondary service categories, increasing by CNY 111 million between 2000 and 2015, and decreasing by CNY 6 million between 2015 and 2020. The ESV provided by climate regulation was only lower than that of soil conservation and hydrological regulation, and the proportion of ESV decreased from 16.76% in 2000 to 13.08% in 2020. Although the ESV of other environmental purification, biodiversity, and aesthetic landscapes increased gradually, the proportion decreased year by year. At the same time, the proportion of the ESV of nutrient cycle maintenance and raw material production increased from 1.46% and 4.58% to 2.28% and 7.51%, respectively.
In general, the change of the ESV in the Tailan River Irrigation District is driven by LU change, and the expansion of dry land dominates the growth of the ESV. Climate change affects the stability of the ESV through water resource fluctuations, especially in the later decline stage; human activities such as agricultural policies and technology applications directly shape the LU pattern and may mitigate or aggravate the impact of climate change on the ESV in irrigation districts through resource management.

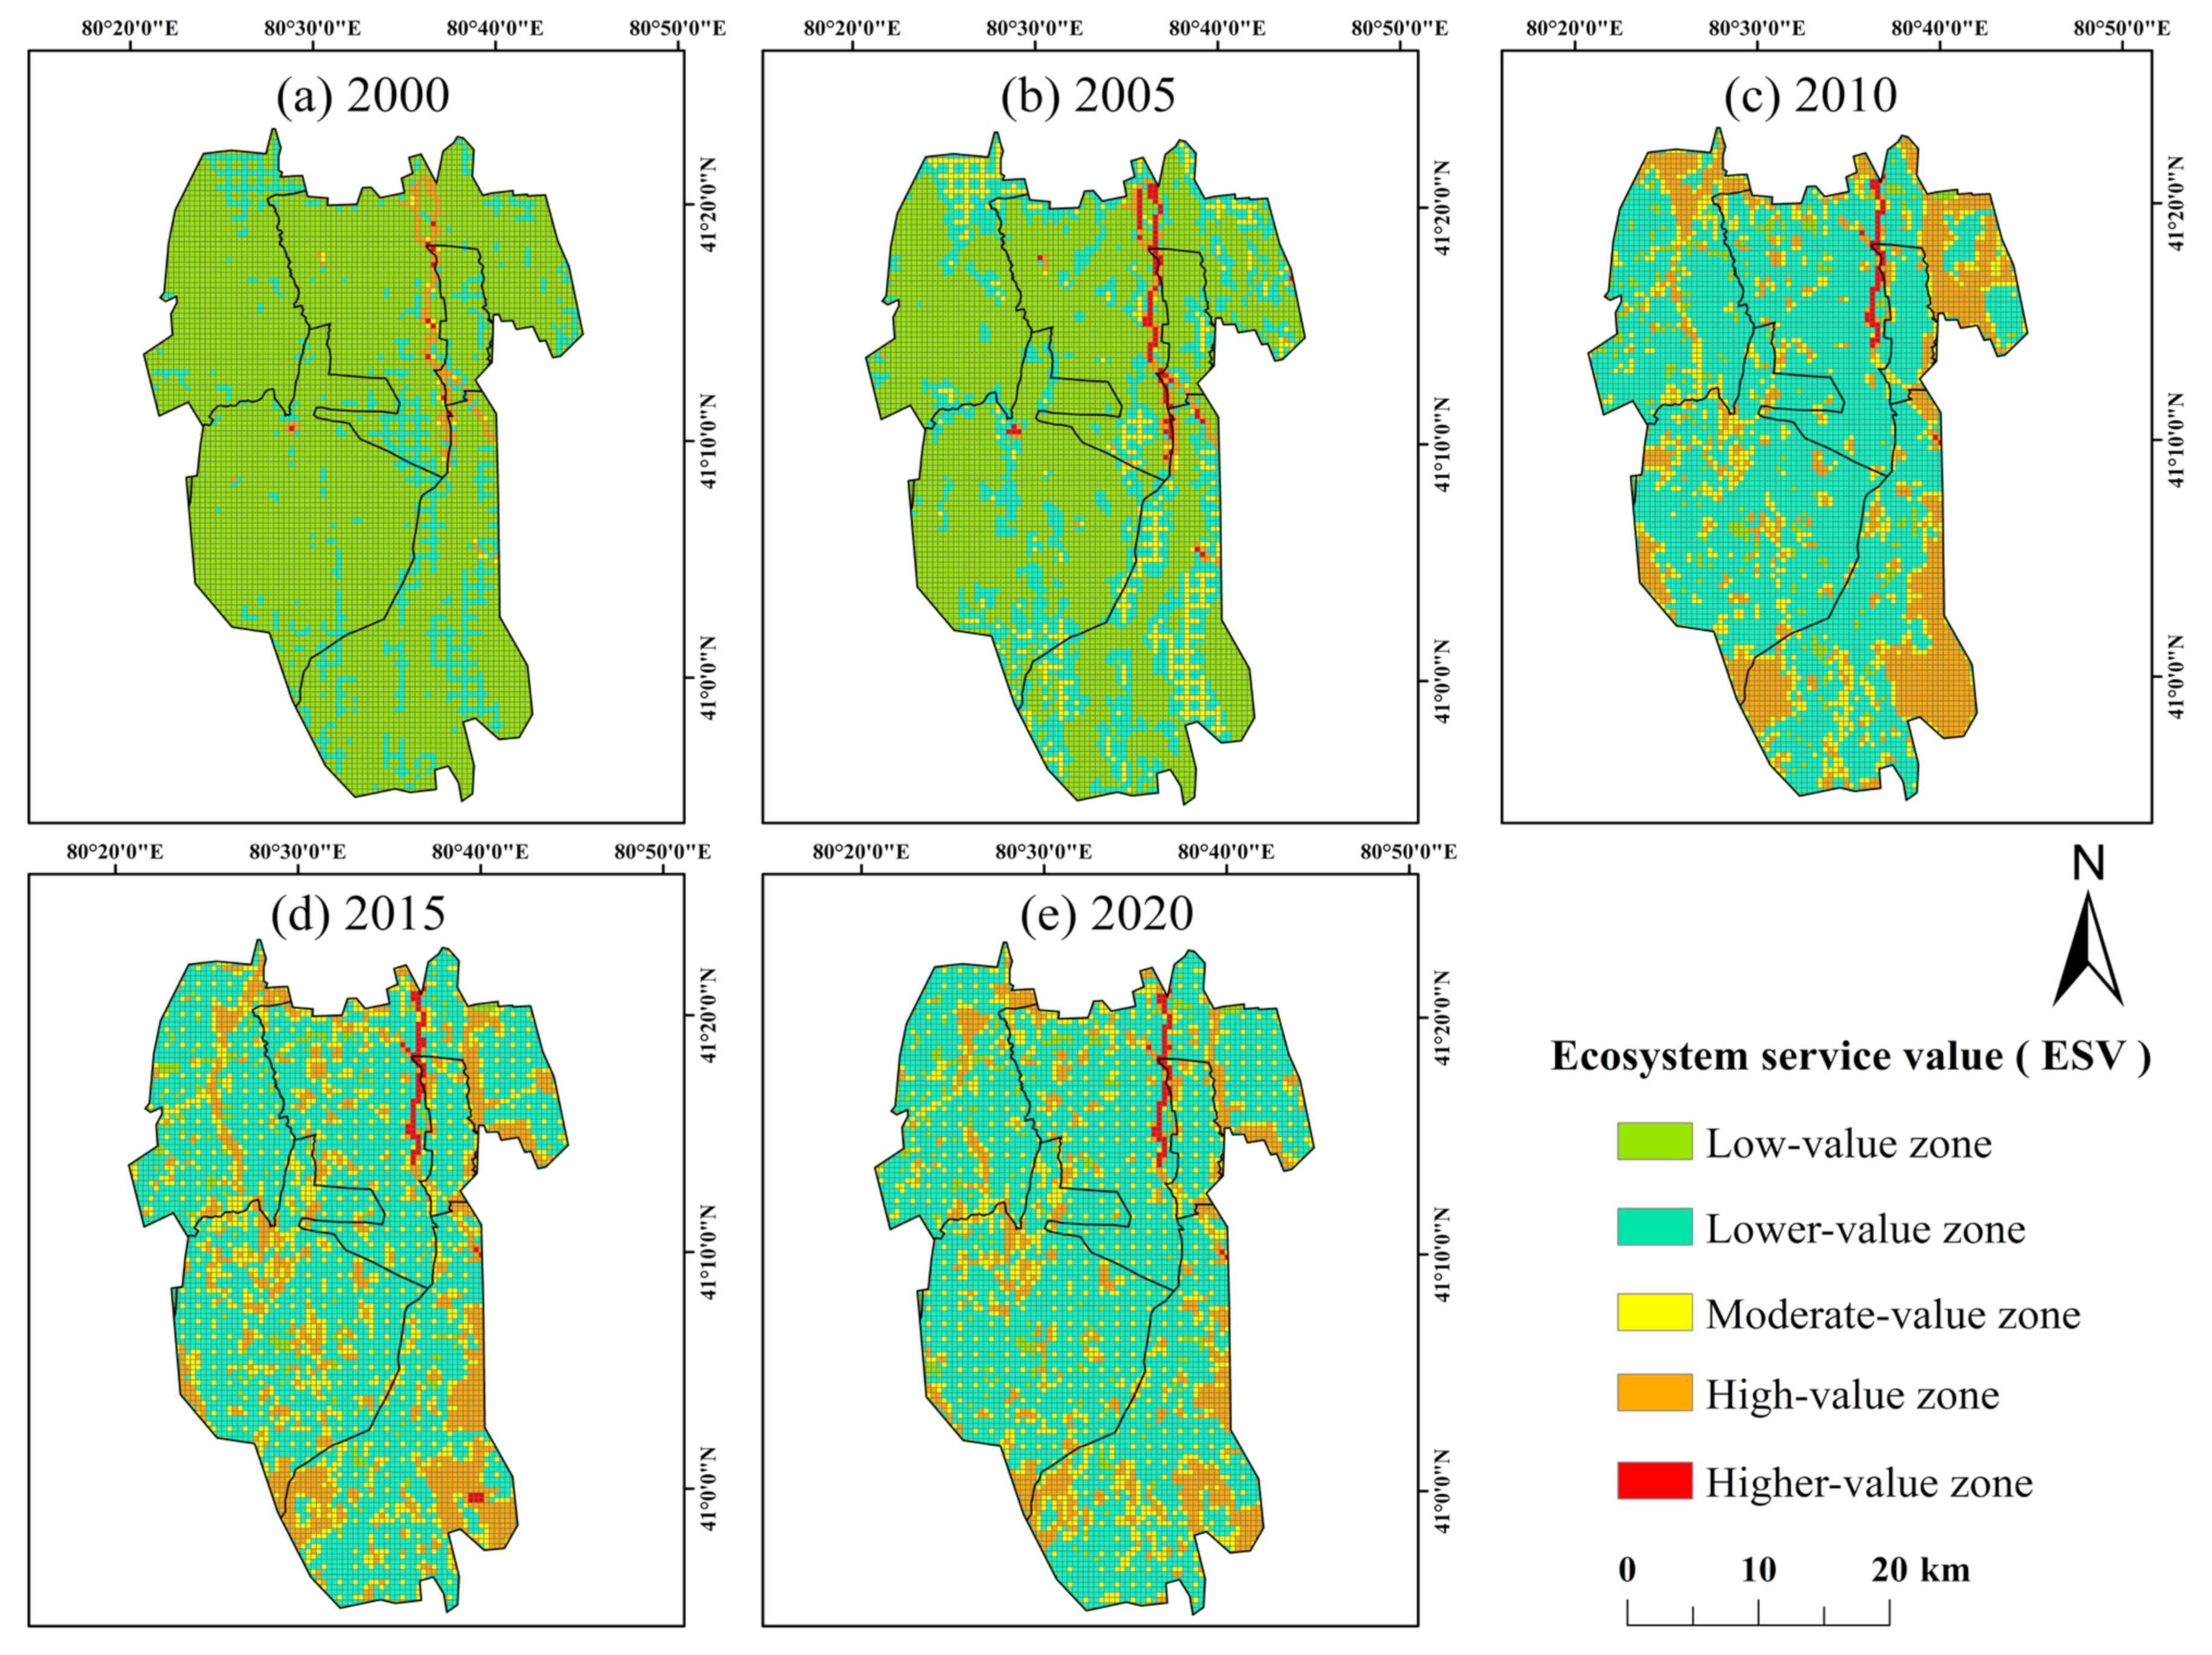
3.4.2. Spatiotemporal Changes of the ESV in Each Unit of the Irrigation District from 2000 to 2020

Among the five units in the Tailan River Irrigation District, the ESV of Jiamu Town was the highest in each period (Table 4), and the average annual ESV was CNY 165 million. The area of the Communist Youth League Town is the smallest, and the average annual ESV is the lowest, at only CNY 24 million. In the 20 years of each unit, the largest increase in ESV was in Kezile Town, which was 75.63%; the largest decrease was in Guleawati Township, with 11.07%. The ESV of each unit in the irrigation district increased first and then decreased, showing an upward trend between 2000 and 2015, with an increase of more than 9.97%. From 2015 to 2020, it showed a downward trend, and the overall ESV reduction reached 7.32%.
Referring to the previous research methods and grade division [34,48], and combining this with the scope of the Tailan River Irrigation District, the irrigation district was divided into 7199 grid points by ArcGIS10.8 using a 400 m × 400 m fishing net. The natural breakpoint method was used to divide the ESV area of the Tailan River Irrigation District from 2000 to 2020 into five levels: a low-value zone (CNY 0~0.478 × 10⁴), lower-value zone (CNY 0.478~0.876 × 10⁴), moderate-value zone (CNY 0.876~1.269 × 10⁴), high-value zone (CNY 1.269~4.40 × 10⁴) and higher-value zone (CNY 4.40~17.368 × 10⁴) (Figure 10).
Combined with Figure 11, it is found that the ESV in the Tailan River Irrigation District showed an increasing trend between 2000 and 2020. The area of ESV low-value zones in the irrigation district remained at 2.89% and above in each period. Before 2010, it was widely distributed in each unit of the irrigation district, and then sharply decreased to sporadic point distribution. The area of the ESV lower-value zones increased significantly and accounted for a large proportion, it was widely distributed in each unit of the irrigation district in 2010 and after, and the zones increased by 58,189.14 hm2 from 2000 to 2020. Different from the former two, the areas of ESV moderate-value zones and high-value zones in the study period generally showed the fluctuation characteristics of increasing first and then decreasing. The area of ESV moderate-value zones had a maximum increase of 20.74%, which was scattered in each township unit. The area of ESV high-value zones increased by 16.59%, and it was mainly distributed in local points, strips, and sheets from 2010 onwards in the southeastern part of Guleawati Township, the central part of Yixilaimuqi Township, and the central and eastern parts of Jiamu Town. The area of ESV higher-value zones remained between 0.15% and 1.21% for many years, and the proportion was small.
In space, the ESV low-value zones were mainly distributed in the unused land and construction land in the irrigation district units. The ESV lower-value zones and moderate-value zones were mainly distributed in dryland and paddy fields in the irrigation district. Additionally, the ESV moderate-value zones were also distributed on the edge of grassland and forest land. The ESV high-value zones were mainly distributed in grassland and forest land. The ESV higher-value zones were mostly distributed in strips around the waters of each unit in the irrigation district. It was found that the LU categories in the irrigation district have an obvious and profound influence on the ESV value.

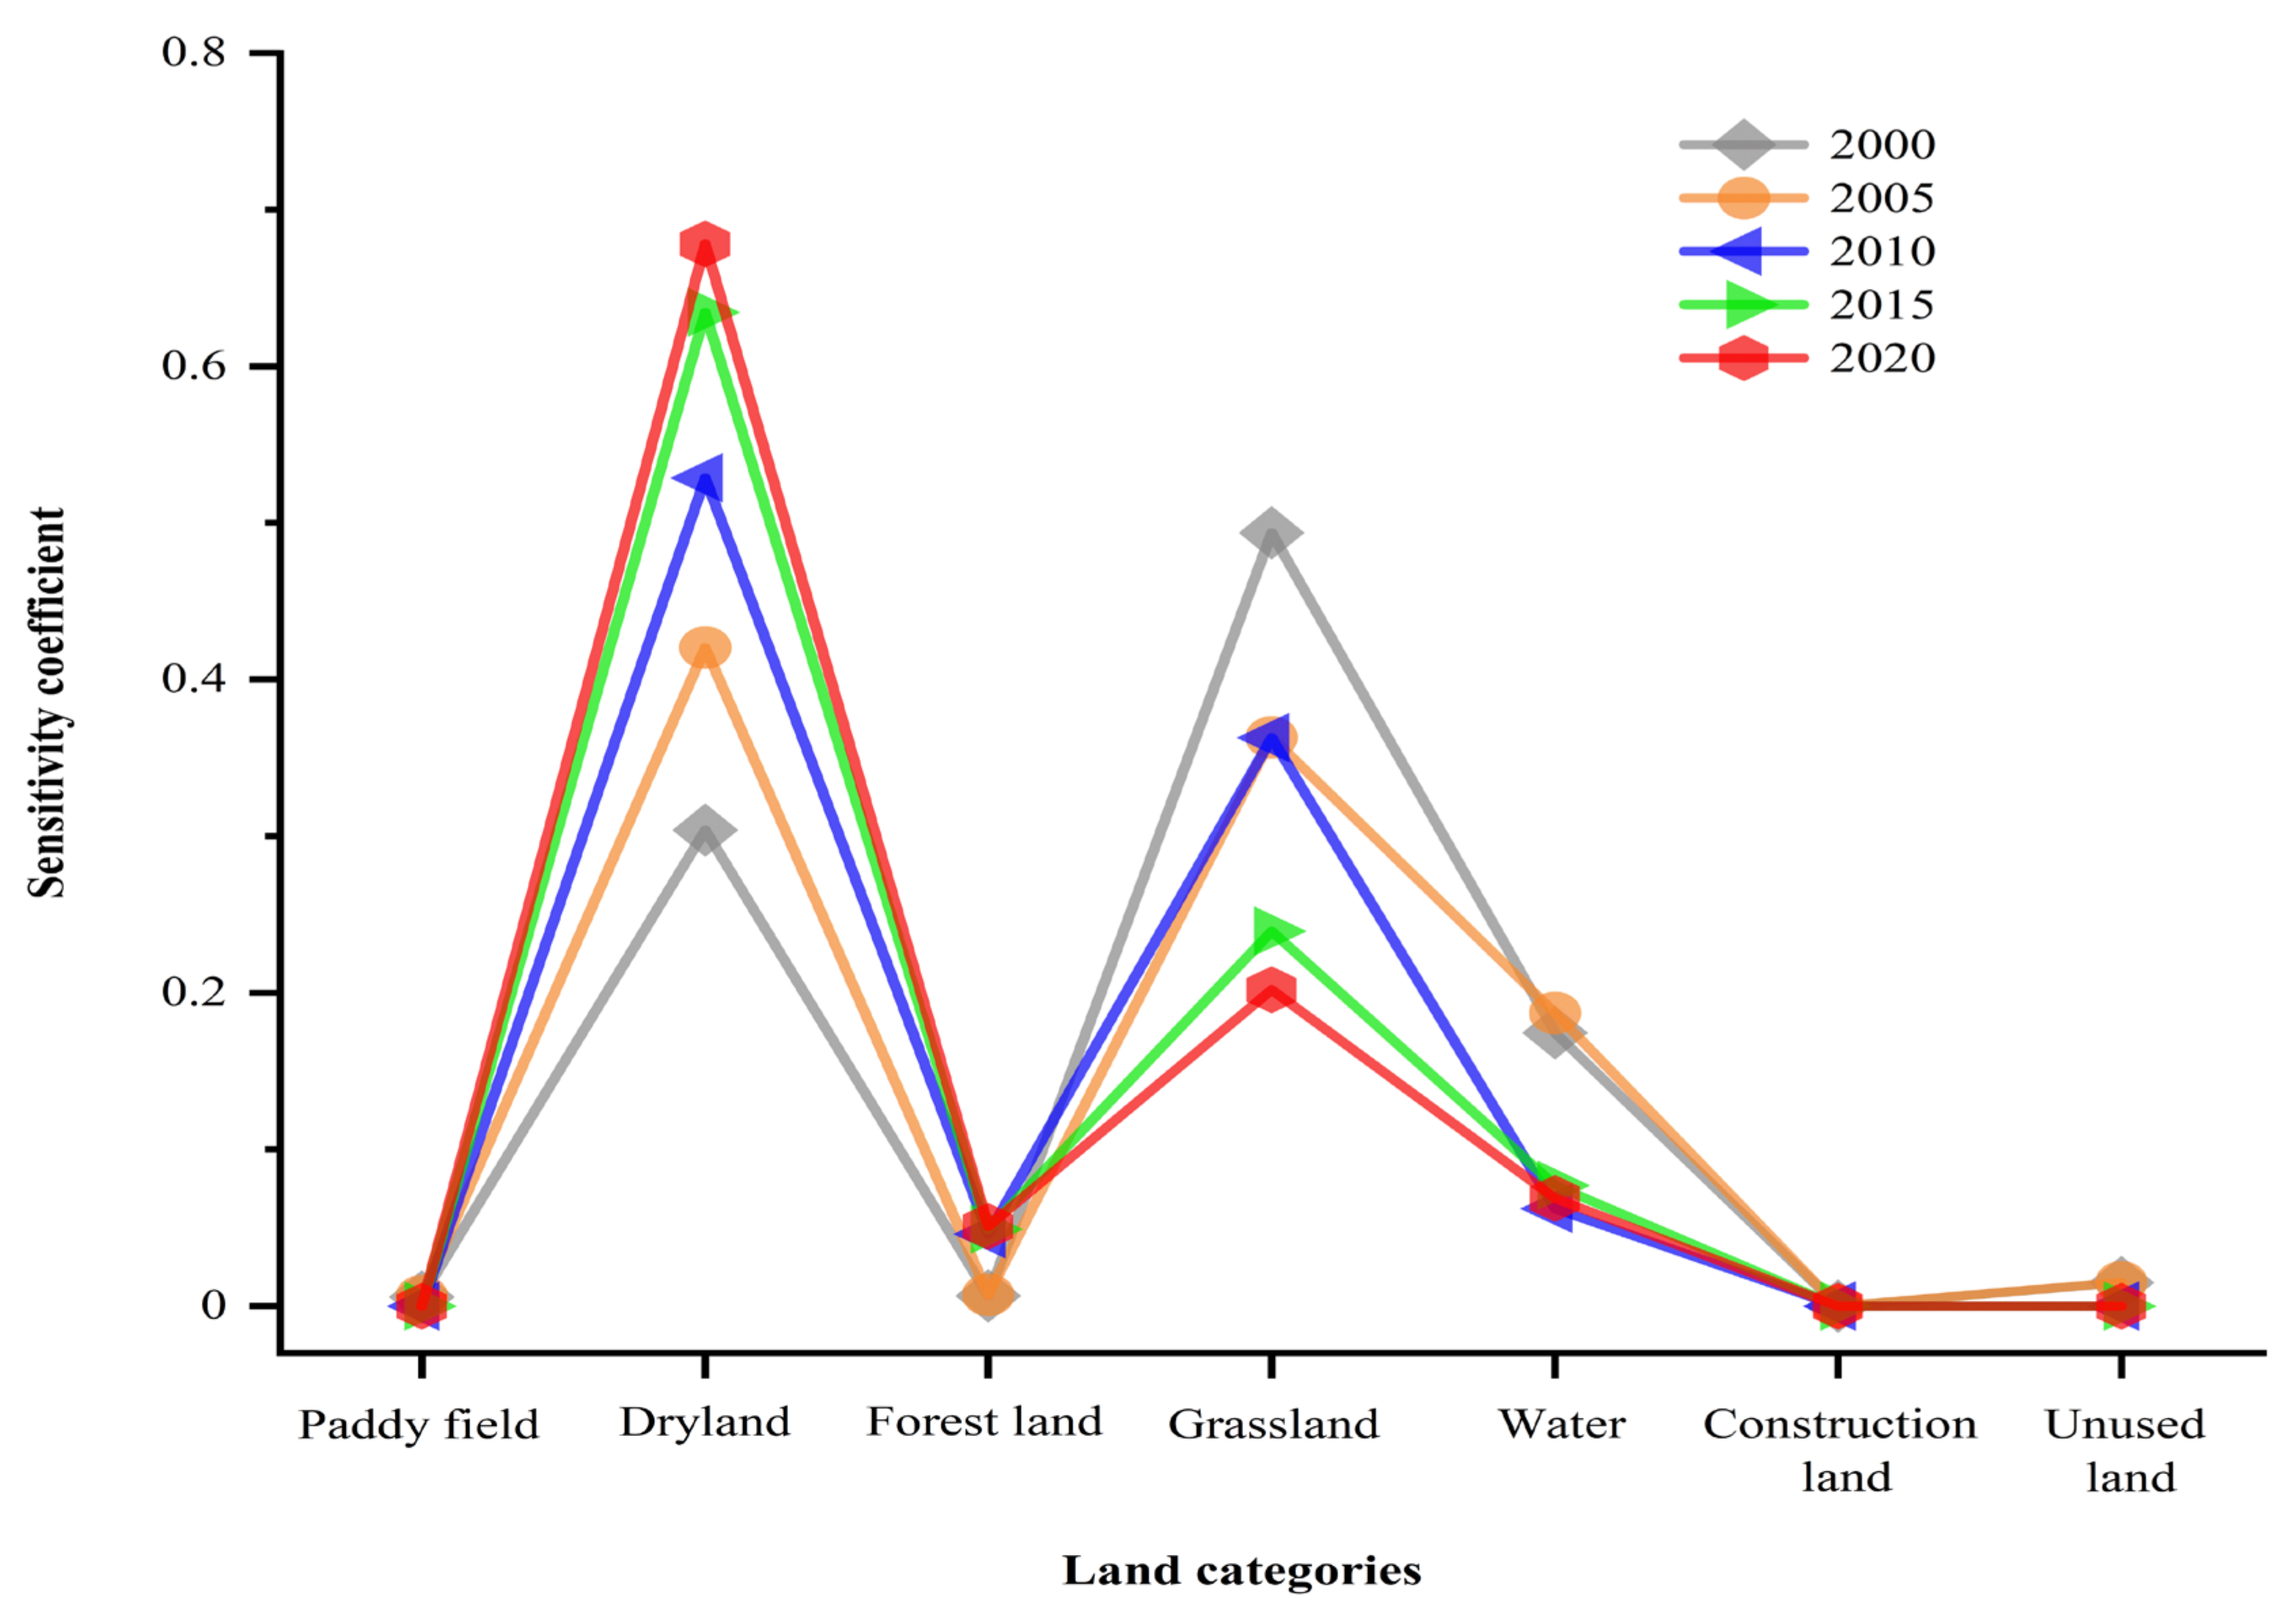
3.4.3. ESV Sensitivity Test in the Irrigation District

Between 2000 and 2020, the ESV sensitivity coefficient of each LU category in the Tailan River Irrigation District was less than 1, ranging from 0 to 0.68 (Figure 12). Among them, the ESV sensitivity coefficient of construction land was 0, which was the smallest among all land categories; the ESV sensitivity coefficient of dryland and forest land increased year by year, and the highest coefficient of dryland was 0.68, indicating that when the ESV of dryland increased by 1%, the total value of ecosystem services would increase by 0.68%. The ESV sensitivity coefficients of paddy fields, unused land, and grassland decreased gradually, with average values of 0.002, 0.006, and 0.33, respectively. The test results show that the equivalent coefficient VC of ESV in the irrigation district was accurate and in line with the actual situation of the irrigation district.

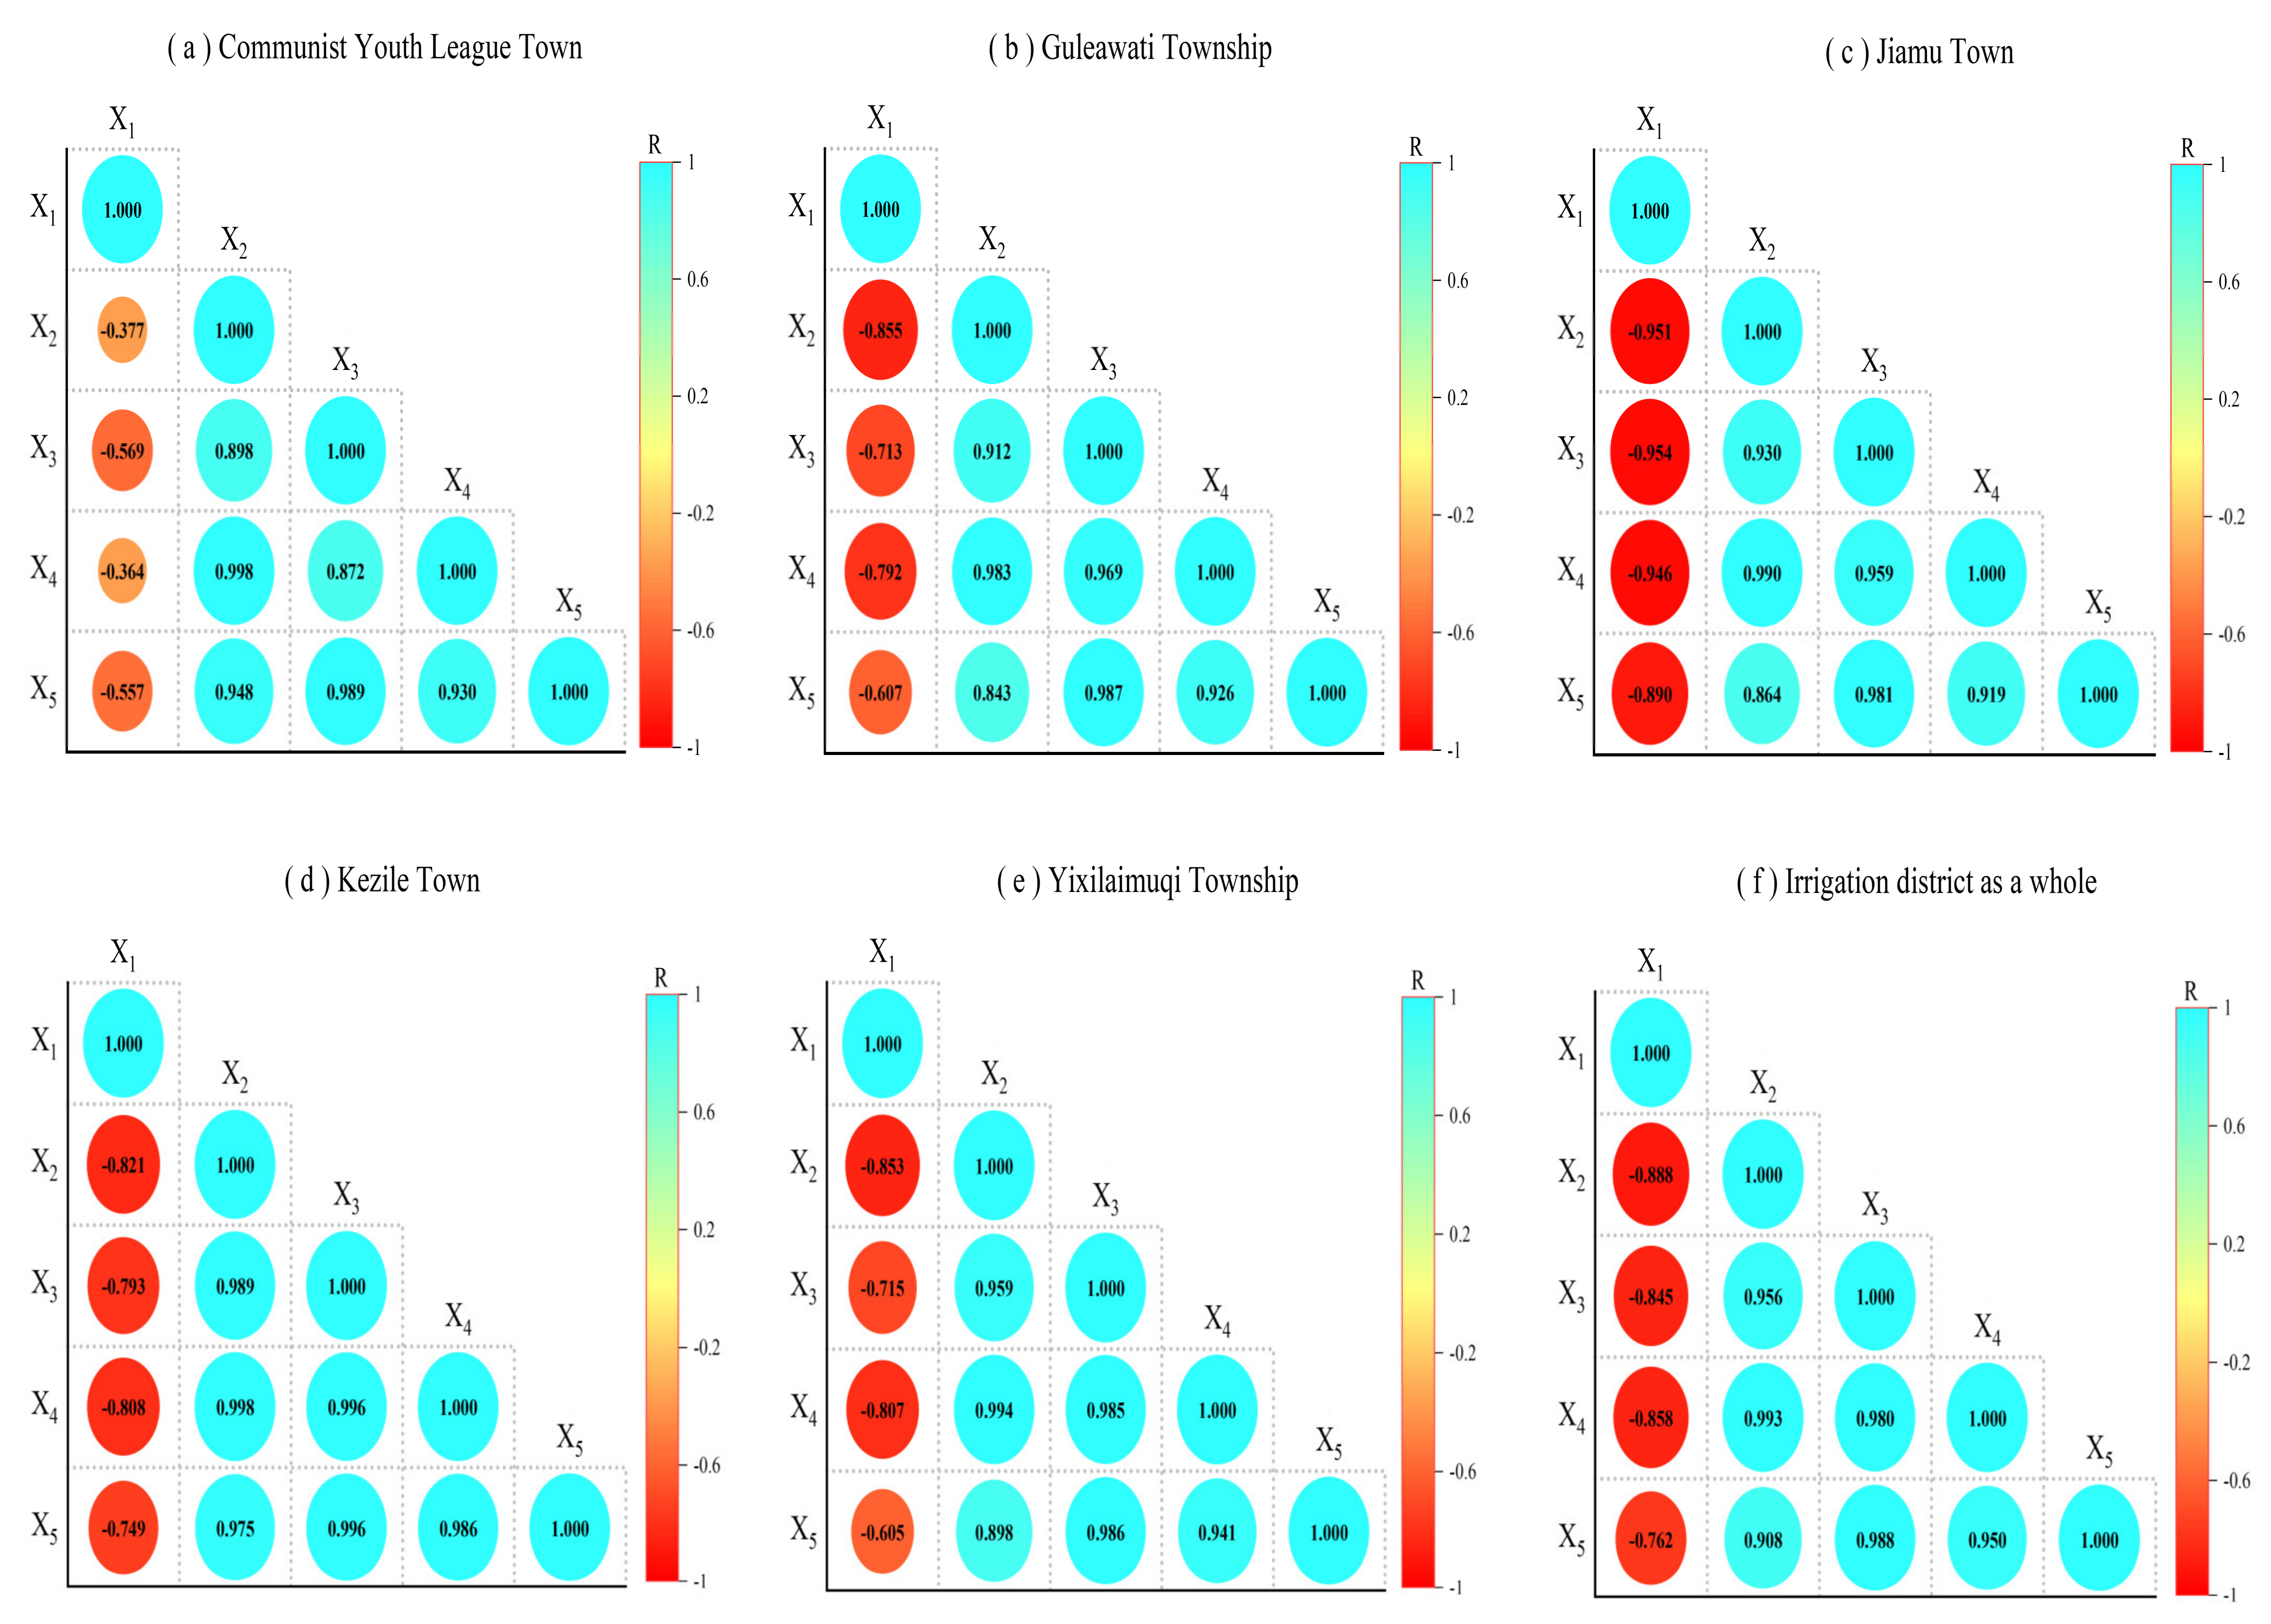
3.5. Trade-Off Synergy Between Agricultural Water–Soil Matching and Ecosystem Services in the Tailan River Irrigation District

The trade-off synergies between the matching state of agricultural water–soil in irrigation districts and various ecosystem services can be discussed through Pearson correlation analysis (Figure 13). This study found that there were significant trade-offs between the agricultural water–soil matching of the whole irrigation district and each unit and the ecosystem services such as provision, regulation, support, and culture, but there was a significant synergistic relationship between the ecosystem services. By comparing the correlation coefficients of each unit, it was found that the trade-offs between agricultural water–soil matching and ecosystem services in Jiamu Town were the most significant, among which the trade-off between water–soil matching and the regulation service was the highest (0.954), and the trade-off between water–soil matching and the cultural service was the lowest (0.89). However, the trade-offs between the agricultural water–soil matching and various ecosystem services in the Communist Youth League Town were the least significant. Specifically, the highest trade-off between water–soil matching and the regulation service was only 0.569, and the lowest trade-off with the support service was only 0.364. For the whole irrigation district, the trade-offs between agricultural water–soil matching and ecosystem services were above 0.762, while the synergy between each ecosystem service was above 0.908.

4. Discussion

4.1. Irrigation District Ecosystem Under LU Change

With the improvement of crop planting technology and the development of urbanization in each unit, between 2000 and 2020, the reclamation rate of cultivated land and the scale of construction land in each unit of the Tailan River Irrigation District significantly improved. However, the agricultural landscape tended to be simplified and the heterogeneity of the ecosystem was reduced. Meanwhile, it further compressed the space of natural and semi-natural ecosystems such as woodlands and wetlands, and increased the loss of biodiversity [58]. Under the pursuit of the development of the social and economic interests of the people in the irrigation district, much unused land and grassland has been cleared for cultivation. The reduction of green space has reduced the ability of climate regulation and soil conservation, resulting in the reduction of native vegetation coverage in the irrigation district, resulting in the loss of animal and plant habitats that depend on these habitats, which is consistent with Sun’s research [59]. From the perspective of the Gini coefficient in each period, the matching of agricultural water–soil in the Tailan River Irrigation District from 2000 to 2020 is absolutely fair, while the matching of water–soil in each unit is different. Although the agricultural water consumption of each unit in each period in the irrigation district was different due to the influence of climatic conditions or other canal systems, reservoirs, and other engineering facilities, its proportion was more than 90% of the total water consumption. This high proportion of agricultural water leads to the crowding out of ecological water, which may make the ecosystem more vulnerable to collapse in dry years [60]. It can be seen that the irrigation district needs to seek a balance between food security and ecological security through refined water–soil resource management, eco-friendly agricultural technology, and natural habitat protection in the future, to avoid sacrificing long-term ecological sustainability for short-term economic benefits [61].

4.2. Ecosystem Service Function of the Irrigation District Under ESV Change

The Tailan River Irrigation District demonstrated sustained growth in ESV between 2000 and 2020, with soil conservation emerging as the dominant service component. This prominence reflects the region’s inherent water–soil resource constraints and successful erosion control measures, which collectively enhance land productivity while stabilizing arid zone ecological barriers [62]. Particularly under escalating climate change pressures, improved soil retention capacity now mitigates extreme weather impacts, including dust storm attenuation and drought resilience in agricultural ecosystems [63]. Spatial analysis reveals concentrated ESV higher-value zones surrounding aquatic ecosystems, underscoring wetlands and riparian corridors as critical infrastructure for biodiversity preservation, hydrological regulation, and climate regulation, similar to previous studies of arid inland regions [24,25,26]. These water-dependent habitats not only ensure regional water security but also sustain vital ecological processes, including migratory avifauna pathways and piscine reproductive cycles—findings corroborated by previous studies [35,38,40]. The observed inter-township ESV disparities present governance challenges, as localities bearing greater ecological protection burdens face constrained economic development opportunities. This spatial imbalance necessitates innovative compensation mechanisms to equitably distribute conservation costs and benefits [64]. The ESV trajectory demonstrates a potential paradigm shift from human–nature conflict to coordinated coexistence in arid regions. However, sustaining this transition requires the following: (1) advanced resource management leveraging ESV quantification frameworks, (2) institutional reforms promoting ecological–economic integration, and (3) market-based mechanisms to translate the ecological capital of “lucid waters and lush mountains” into sustainable “golden mountains and silver mountains” economic value [65,66].

4.3. Regulation Strategy of the Irrigation District from the Perspective of Trade-Off Coordination

There is a significant trade-off relationship between agricultural water–soil matching and ecosystem services in the Tailan River Irrigation District. This means that blindly pursuing high agricultural water–soil matching may lead to problems such as regional water resource depletion, soil salinization, and biodiversity decline [61,67]. In particular, Jiamu Town needs to be alert to this ecological overdraft risk. In the short term, high water–soil matching is used to increase agricultural output, which may bring rapid economic growth. However, in the long run, it will lead to ecological degradation, abandoning land and threatening economic sustainability [68]. On the contrary, the trade-off of the Communist Youth League Town is weaker. The sensitivity of ecosystem services to the matching of agricultural water–soil is low, the quality of life of residents is less directly affected by agricultural expansion, and the environmental stability is high. It can be used as an eco-friendly agricultural demonstration area to strengthen the synergistic effect of townships [69]. It is necessary to implement differentiated governance strategies, set a strict agricultural water red line for Jiamu Town, implement precision irrigation and ecological compensation mechanisms, and encourage farmers to turn to high-value-added crops to reduce resource consumption [70]. It is also necessary to moderately expand the scale of agriculture in the Communist Youth League Town and explore the value-added path of ‘agriculture + ecological services’. In the future, flexible policies should be formulated in combination with the natural background and socio-economic conditions of each township [70]. The high synergistic effect between the ecological services of the whole irrigation district and each unit indicates that the improvement of one service may lead to the improvement of other services, which is analogous to previous studies [35,56].

4.4. Research Limitations and Suggestions

The calculation of the ESV in this study relies on the equivalent factor table proposed by Xie. The parameters are based on the national scale adjustment, which may not fully reflect the unique ecological characteristics of arid inland irrigation districts. In the follow-up study, the parameters can be calibrated by biomass monitoring and soil carbon storage measurement, thereby enhancing the localization accuracy of ESV accounting [71]. The 30 m resolution LU data used may not be able to capture small-scale LU changes such as farmland fragmentation and micro-wetland degradation, resulting in insufficient accuracy of ESV spatial heterogeneity analysis [72]. Subsequent research can improve the ability of ESV spatial heterogeneity representation by exploring multi-source data fusion. This study revealed the surface trade-off relationship between agricultural water–soil matching and the ESV through statistical correlation but failed to deeply analyze the natural and human-driven mechanisms behind it. In the follow-up study, relevant models such as geographic detectors can also be used to explore the interaction between climate change and human activities on water–soil resource allocation and ESV dynamic evolution [60,73]. Moreover, to reflect the different development statuses in the future, the long-term water–soil resource allocation and ESV evolution trajectory can also be reconstructed based on historical data. Combined with climate prediction models such as CMIP6 and LU simulation models such as PLUS or FLUS [30,31], the matching status of water–soil resources under different development scenarios in the future and their response to the ESV can be revealed.

5. Conclusions

This study focused on the spatiotemporal characteristics of agricultural water–soil matching and the spatiotemporal evolution pattern of the ESV from the perspective of LU change in the Tailan River Irrigation District, by integrating the LU dynamic change, water–soil matching coefficient, Gini coefficient, and equivalent factor method. The main conclusions are as follows:
(1)
An excess of 80% of all land in the Tailan River Irrigation District from 2000 to 2020 was mainly composed of dryland and grassland. Dryland and construction land were the two categories with the biggest turn-in areas in the irrigation district, while grassland and unused land were the two categories with the biggest turn-out areas in the irrigation district, and the conversion areas were mostly concentrated in the east of Jiamu Town, the middle of Yixilaimuqi Township, the southeast of Guleawati Township, and the southwest of Kezile Town. Among the changes of single LU dynamic degrees, the top three were forest land, paddy fields, and unused land, indicating that the changes of the three are the most significant at that period.
(2)
Between 2000 and 2020, the cultivated land acreage within the irrigation zone demonstrated a progressive annual expansion, culminating in a cumulative augmentation of approximately 36.14% in the overall reclamation rate. However, the annual reclamation rate of cultivated land in each unit was different. The highest reclamation rate was 85.93% in Kezile Town, and the lowest was 76.37% in Guleawati Township. Additionally, the average Gini coefficient of agricultural water–soil in the irrigation district between 2000 and 2020 was 0.118, which is the same as the multi-year Gini coefficient and is in the absolutely fair interval.
(3)
The years 2010 and 2015 were those with the most and least agricultural water consumption in the irrigation district. Although the agricultural water consumption of Kezile Town ranked first in each unit, the agricultural water–soil matching situation was not the best and was always fluctuating. On the contrary, although the Communist Youth League Town had the least amount of agricultural water consumption over the years, the matching status of agricultural water–soil remained the best for many years. In addition, the overall agricultural water–soil matching coefficient of the irrigation district gradually decreased from 1.058 in 2000 to 0.426 in 2015, and increased to 0.538 until 2020, reflecting the profound influence of agricultural water consumption and cultivated land reclamation rate on water–soil matching in the irrigation district.
(4)
Between 2000 and 2020, the ESV of the irrigation district exhibited a consistent upward trajectory, escalating from CNY 243 million in 2000 to CNY 678 million in 2020. Although it was lower than the total value of CNY 732 million in 2015, the growth state of the ESV over the past two decades was still obvious. The proportion of contribution from dryland to the ESV in each period was more than 30%, and more than 50% after 2010. Among the secondary services, soil conservation and hydrological regulation services contributed the most to the ESV in each period. The spatial distribution of the ESV shows a staggered phenomenon. The ESV low-value zones were mostly distributed near the unused land in the irrigation district, and the ESV higher-value zones were mostly distributed in strips around the water of each unit in the irrigation district.
(5)
The agricultural water–soil matching in the Tailan River Irrigation District is closely related to the provision, regulation, support, and culture services, and shows a significant trade-off relationship. There are also significant synergies among ecosystem services.

Author Contributions

Conceptualization, Y.R. and Y.H.; methodology, Y.R. and Y.H.; validation, Y.Q. and L.M.; writing—original draft preparation, Y.R.; writing—review and editing, Y.H., Y.Q. and L.M.; formal analysis, Y.R.; visualization, Y.R.; supervision, Y.H. All authors have read and agreed to the published version of the manuscript.

Funding

This research was funded by major science and technology projects of the Xinjiang Uygur Autonomous Region, “Optimized Allocation of Water-Soil Resources and Hydrologically Adaptive Development Paradigm for Inland River Basins” (project number: 2023A02002-1), and in 2019, the People’s Government of Xinjiang Uygur Autonomous Region sent a group of supporting projects to study abroad, “Research on Water-saving and Efficiency-increasing Technology of Micro-irrigation in Arid Areas”.

Institutional Review Board Statement

Not applicable.

Informed Consent Statement

Not applicable.

Data Availability Statement

The original contributions presented in this study are included in the article. Further inquiries can be directed to the corresponding author.

Acknowledgments

The authors express sincere appreciation to the anonymous reviewers for their insightful suggestions during the peer-review phase, and acknowledge the editorial team’s professional coordination in advancing the manuscript evaluation workflow.

Conflicts of Interest

The authors declare no conflicts of interest.

Abbreviations

The following abbreviations are used in this manuscript:
ESVEcosystem service value
CNYChinese Yuan
LULand use

References

  1. Liu, D.; Liu, C.; Fu, Q.; Li, M.; Faiz, M.A.; Khan, M.I.; Li, T.; Cui, S. Construction and application of a refined index for measuring the regional matching characteristics between water and land resources. Ecol. Indic. 2018, 91, 203–211. [Google Scholar] [CrossRef]
  2. Miao, L.; Zhang, J.; Kattel, G.R.; Liu, R. Increased exposure of China’s cropland to droughts under 1.5 °C and 2 °C global warming. Atmosphere 2022, 13, 1035. [Google Scholar] [CrossRef]
  3. Han, X.; Zhao, Y.; Gao, X.; Jiang, S.; Lin, L.; An, T. Virtual water output intensifies the water scarcity in Northwest China: Current situation, problem analysis and countermeasures. Sci. Total Environ. 2021, 765, 144276. [Google Scholar] [CrossRef] [PubMed]
  4. Du, J.; Yang, Z.; Wang, H.; Yang, G.; Li, S. Spatial-temporal matching characteristics between agricultural water and land resources in Ningxia, Northwest China. Water 2019, 11, 1460. [Google Scholar] [CrossRef]
  5. Han, Z.; Wu, S.; Liu, J. Land use change and its impact on the quality of the ecological environment in Xinjiang. Sustainability 2024, 16, 10114. [Google Scholar] [CrossRef]
  6. Yang, J.; Li, Y.; Zhou, L.; Zhang, Z.; Zhou, H.; Wu, J. Effects of temperature and precipitation on drought trends in Xinjiang, China. J. Arid Land 2024, 16, 1098–1117. [Google Scholar] [CrossRef]
  7. Yu, X.; Lei, J.; Gao, X. An over review of desertification in Xinjiang, Northwest China. J. Arid Land 2022, 14, 1181–1195. [Google Scholar] [CrossRef]
  8. Zhang, Y.; Yan, Z.; Song, J.; Wei, A.; Sun, H.; Cheng, D. Analysis for spatial-temporal matching pattern between water and land resources in Central Asia. Hydrol. Res. 2020, 51, 994–1008. [Google Scholar] [CrossRef]
  9. Wu, Y.; Qin, F.; Dong, X.; Li, L. Investigating the Spatio-Temporal Evolution of Land Cover and Ecosystem Service Value in the Kuye River Basin. Water 2024, 16, 2456. [Google Scholar] [CrossRef]
  10. Xiao, J.; Zhang, Y.; Xu, H. Response of ecosystem service values to land use change, 2002–2021. Ecol. Indic. 2024, 160, 111947. [Google Scholar] [CrossRef]
  11. Xie, G.Y.; Zhang, F.Y. Research on Time and Space Matching of Agricultural Water and Soil Resources in Xinjiang. China Rural. Water Hydropower 2020, 6, 58–62. [Google Scholar]
  12. Wang, Y.; Jiang, Z.H.; Chu, J.Q.; Zhang, H.K.; Liu, X.M.; Lin, Y.N. Study on the spatiotemporal matching relationship of agricultural water and land resources in the Tarim River basin. J. Agric. Resour. Environ. 2024, 41, 360–370. [Google Scholar]
  13. Xu, N.; Zhang, J.; Zhang, R.; Tian, F. Study on matching characteristics of agricultural water and soil resources based on dea—Take Gansu Province 5 watershed as an example. Chin. J. Agric. Resour. Reg. Plan. 2020, 41, 277–285. [Google Scholar]
  14. Yang, Y.; Wang, H.; Wang, C.; Zhang, Y. Coupling variable fuzzy sets and Gini coefficient to evaluate the spatial equilibrium of water resources. Water Resour. 2022, 49, 292–300. [Google Scholar] [CrossRef]
  15. Gao, Y.; Li, P.; Hou, H.; Liang, Z.; Zhang, Y.; Qi, X. Evaluation of agricultural water and soil resource matching characteristics considering increased precipitation-derived “green water”: A case study in the Yellow River Basin, China. Mitig. Adapt. Strateg. Glob. Change 2023, 28, 6. [Google Scholar] [CrossRef]
  16. Li, X.Y.; Hao, J.M.; Chen, A.Q. Time-space matching pattern and evaluation of agricultural water and soil resources in Shandong Province. J. China Agric. Univ. 2020, 25, 1–11. [Google Scholar]
  17. He, C.G.; Yao, H.Z.; Yu, G.H.; Guan, W.; Xu, B.B.; She, D.L. Balance Between Water Resources and Soil Resources in Coastal Regions of Jiangsu Province and Its Economic Analysis. J. Irrig. Drain. 2023, 2, 110–116. [Google Scholar]
  18. Wang, L.; Jie, F.; He, B. Study on planting development layout in arid region based on matching characteristics of agricultural water and soil resources. Environ. Dev. Sustain. 2025, 1–30. [Google Scholar] [CrossRef]
  19. Qu, S.H.; Yao, H.Z.; Wang, Y.D.; Chen, Y.; Peng, Y.M.; Fang, K.; She, D.L. Matching Status and Bearing Capacity Characteristics of Agricultural Water and Land Resources in Typical Irrigation Districts of Jiangsu Province. Res. Soil Water Conserv. 2023, 6, 452–457+467. [Google Scholar]
  20. Costanza, R.; D’Arge, R.; De Groot, R.; Farber, S.; Grasso, M.; Hannon, B.; Van Den Belt, M. The value of the world’s ecosystem services and natural capital. Nature 1997, 387, 253–260. [Google Scholar] [CrossRef]
  21. Xie, G.D.; Lu, C.X.; Leng, Y.F.; Zheng, D.; Li, S.C. Ecological assets valuation of the Tibetan Plateau. J. Nat. Resour. 2003, 18, 189–196. [Google Scholar]
  22. Xie, G.D.; Zhang, Y.L.; Lu, C.X.; Zheng, D.; Cheng, S.K. Study on the valuation of rangeland ecosystem services of China. J. Nat. Resour. 2001, 16, 47–53. [Google Scholar]
  23. Xie, G.; Xiao, Y.; Lu, C. Study on ecosystem services: Progress, limitation and basic paradigm. Chin. J. Plant Ecol. 2006, 30, 191. [Google Scholar]
  24. Zhao, Y.; Zhang, Y.F.; Bu, X.; Li, Y.F.; He, Z.F. Land use change and its impact on ecosystem service value in Xinjiang from 2000 to 2020. J. Tianjin Norm. Univ. (Nat. Sci. Ed.) 2023, 6, 53–60+80. [Google Scholar]
  25. Xie, L.; Wang, H.; Liu, S. The ecosystem service values simulation and driving force analysis based on land use/land cover: A case study in inland rivers in arid areas of the Aksu River Basin, China. Ecol. Indic. 2022, 138, 108828. [Google Scholar] [CrossRef]
  26. Hu, X.Y.; Song, Y.Q.; Lu, L. Impacts of Land Use Changes on Ecosystem Service Value in Hongsipu Irrigated Area. Acta Sci. Nat. Univ. Pekin. 2017, 53, 939–947. [Google Scholar]
  27. An, S.W.; Ma, C.H.; Hua, Y.Q.; Li, C.H. Analysis of Ecosystem Service Value Profit and Loss Under the Oasis Development Model of the Ecological Fragile Area in the Upper Yellow River—A Case Study of Hongsibu District in Ningxia. Res. Soil Water Conserv. 2022, 6, 375–382. [Google Scholar]
  28. Schirpke, U.; Tscholl, S.; Tasser, E. Spatio-temporal changes in ecosystem service values: Effects of land-use changes from past to future (1860–2100). J. Environ. Manag. 2020, 272, 111068. [Google Scholar] [CrossRef]
  29. Ran, P.; Frazier, A.E.; Xia, C.; Tiando, D.S.; Feng, Y. How does urban landscape pattern affect ecosystem health? Insights from a spatiotemporal analysis of 212 major cities in China. Sustain. Cities Soc. 2023, 99, 104963. [Google Scholar] [CrossRef]
  30. Zhang, M.; Chen, E.; Zhang, C.; Liu, C.; Li, J. Multi-scenario simulation of land use change and ecosystem service value based on the Markov–FLUS model in Ezhou City, China. Sustainability 2024, 16, 6237. [Google Scholar] [CrossRef]
  31. Wu, C.; Wang, Z. Multi-scenario simulation and evaluation of the impacts of land use change on ecosystem service values in the Chishui River Basin of Guizhou Province, China. Ecol. Indic. 2024, 163, 112078. [Google Scholar] [CrossRef]
  32. Jiang, Y.; Du, G.; Teng, H.; Wang, J.; Li, H. Multi-scenario land use change simulation and spatial response of ecosystem service value in black soil region of northeast China. Land 2023, 12, 962. [Google Scholar] [CrossRef]
  33. Wei, J.; Tian, M.; Wang, X. Spatiotemporal variation in land use and ecosystem services during the urbanization of Xining City. Land 2023, 12, 1118. [Google Scholar] [CrossRef]
  34. Shao, S.; Li, W.; Yan, Z.; Zhou, W. Spatial and Temporal Evolution of the Value of Ecosystem Services in Jiuquan, China, from 2005 to 2020. Sustainability 2025, 17, 507. [Google Scholar] [CrossRef]
  35. Yang, L.; Zhang, S.; Luo, M.; Zhao, X.; Lin, X.; Zhang, Q.; Fang, K.; Lv, S. Impacts of land use and crop structure change on the value of ecosystem services in Hetao Irrigation District of China. J. Clean. Prod. 2024, 480, 144113. [Google Scholar] [CrossRef]
  36. Chen, J.R.; Tang, D.S. An Evaluation of the Water Demand of Tailan Irrigation Project Based on the ANP-FCE. China Rural. Water Hydropower 2014, 3, 159–161+165. [Google Scholar]
  37. Camacho-Valdez, V.; Ruiz-Luna, A.; Ghermandi, A.; Berlanga-Robles, C.A.; Nunes, P.A. Effects of land use changes on the ecosystem service values of coastal wetlands. Environ. Manag. 2014, 54, 852–864. [Google Scholar] [CrossRef]
  38. Liu, Y.; Ma, C.; Ma, L.; Li, N. Ecological effects of land use and land cover change in the typical ecological functional zones of Egypt. Ecol. Indic. 2024, 168, 112747. [Google Scholar] [CrossRef]
  39. Wu, Y.; Liu, X.; Zhao, Q.; Liu, H.; Qu, F.; Zhang, M. Impact of Land Use/Land Cover Change on Ecosystem Service Trade-Offs/Synergies—A Case Study of Gangu County, China. Sustainability 2024, 16, 5929. [Google Scholar] [CrossRef]
  40. Wang, Y.; Shataer, R.; Zhang, Z.; Zhen, H.; Xia, T. Evaluation and analysis of influencing factors of ecosystem service value change in Xinjiang under different land use types. Water 2022, 14, 1424. [Google Scholar] [CrossRef]
  41. Du, G.; Li, Y.; Yu, F.; Zhang, S.; Yang, F. Change characteristics analysis of farmland in Northern Sanjiang Plain in 20002009 based on remote sensing. Trans. Chin. Soc. Agric. Eng. 2012, 28, 225–229. [Google Scholar]
  42. Li, H.; Zhou, W.; Zhuang, Y.; Ma, C.; Liu, B. Agricultural water and soil resources matching patterns and carrying capacity in Yan’an City. Trans. Chin. Soc. Agric. Eng. 2016, 32, 156–162. [Google Scholar]
  43. Bai, J.; Li, Y.; Zhou, W. Matching and carrying capacity of agricultural water and soil resources in Yulin City. J. Drain. Irrig. Mach. Eng. 2017, 35, 609–615. [Google Scholar]
  44. Jiang, N.; Fu, Q. Spatial matching analysis of Heilongjiang Province’s water resource based on Gini coefficient. J. Northeast Agric. Univ 2010, 41, 56–60. [Google Scholar]
  45. Li, N.; Wang, J.; Wang, H.; Fu, B.; Chen, J.; He, W. Impacts of land use change on ecosystem service value in Lijiang River Basin, China. Environ. Sci. Pollut. Res. 2021, 28, 1–16. [Google Scholar] [CrossRef]
  46. Hu, S.; Chen, L.; Li, L.; Zhang, T.; Yuan, L.; Cheng, L.; Wang, J.; Wen, M. Simulation of land use change and ecosystem service value dynamics under ecological constraints in Anhui Province, China. Int. J. Environ. Res. Public Health 2020, 17, 4228. [Google Scholar] [CrossRef]
  47. Xie, G.D.; Zhang, C.X.; Zhang, L.M.; Chen, W.H.; Li, S.M. Improvement of the Evaluation Method for Ecosystem Service Value Based on Per Unit Area. J. Nat. Resour. 2015, 30, 1243–1254. [Google Scholar]
  48. Yang, Y.; Qin, T.; Yan, D.; Liu, S.; Feng, J.; Wang, Q.; Liu, H.; Gao, H. Analysis of the evolution of ecosystem service value and its driving factors in the Yellow River Source Area, China. Ecol. Indic. 2024, 158, 111344. [Google Scholar] [CrossRef]
  49. Shi, X.W.; Chen, X.H.; Cai, M.Y.; Zhang, X.S.; Shen, Z.; Tai, W.F.; Shen, W.; Li, J.; Xiao, T. Evaluation of Changes in Ecosystem Services in Ecological Conservation Red Line and the Entire Area of Ningxia. J. Geo-Inf. Sci. 2023, 25, 999–1011. [Google Scholar]
  50. Yueriguli, K.; Yang, S.; Zibibula, S. Impact of land use change on ecosystem service value in Ebinur Lake Basin, Xinjiang. Trans. Chin. Soc. Agric. Eng 2019, 35, 268–277. [Google Scholar]
  51. Costanza, R.; De Groot, R.; Sutton, P.; Van der Ploeg, S.; Anderson, S.J.; Kubiszewski, I.; Farber, S.; Turner, R.K. Changes in the global value of ecosystem services. Glob. Environ. Change 2014, 26, 152–158. [Google Scholar] [CrossRef]
  52. Qi, L.P.; Yan, D.D.; Li, J.T.; Yao, X.Y.; Xue, Y.Y.; Luan, Z.Q. Dynamics of ecosystem services value in response to land use/land cover changes in Jiangsu Province. J. Beijing Norm. Univ. (Nat. Sci.) 2021, 57, 255–264. [Google Scholar]
  53. Yushanjiang, A.; Zhang, F.; Kung, H.T.; Li, Z. Spatial-temporal variation of ecosystem service values in Ebinur Lake Wetland National Natural Reserve from 1972 to 2016, Xinjiang, arid region of China. Environ. Earth Sci. 2018, 77, 586. [Google Scholar] [CrossRef]
  54. Peng, W.F.; Zhou, J.M.; Fan, S.Y.; Yang, C.J. Effects of the land use change on ecosystem service value in Chengdu, western China from 1978 to 2010. J. Indian Soc. Remote Sens. 2016, 44, 197–206. [Google Scholar] [CrossRef]
  55. Cao, A.; Zhang, J. Multi-scenario prediction of ecosystem services value and mechanism of its trade-offs under the township scale-evidence from Liaoning province. Environ. Monit. Assess. 2025, 197, 204. [Google Scholar] [CrossRef]
  56. Niu, T.; Yu, J.; Yue, D.; Yang, L.; Mao, X.; Hu, Y.; Long, Q. The temporal and spatial evolution of ecosystem service synergy/trade-offs based on ecological units. Forests 2021, 12, 992. [Google Scholar] [CrossRef]
  57. Peng, D.M.; Zhao, C.Y.; Sun, D.Y.; Yan, Y.Y.; Li, J.Y.; Wei, H.; Li, Z.L. Study on Land Use Change and Ecological Effect in Tailan River Watershed in Recent 15 years. Soils 2010, 1, 136–141. [Google Scholar]
  58. Habibullah, M.S.; Din, B.H.; Tan, S.H.; Zahid, H. Impact of climate change on biodiversity loss: Global evidence. Environ. Sci. Pollut. Res. 2022, 29, 1073–1086. [Google Scholar] [CrossRef]
  59. Sun, D.Y.; Zhao, C.Y.; Peng, D.M.; Li, J.Y.; Yan, Y.Y.; Wei, H. Dynamics of Water Resources and Land Use in Oasis Irrigation Area in Tailan River Watershed. Bull. Soil Water Conserv. 2010, 3, 158–162. [Google Scholar]
  60. Xu, Q.; Zhang, Z.; Liu, X.; Wang, Z.; Ren, C.; Xia, T.; Sun, G.; Han, L. Analysis of Ecosystem Service Value Trends and Drivers in the Yellow River Delta, China. Agriculture 2025, 15, 346. [Google Scholar] [CrossRef]
  61. Li, W.J.; Xu, W.Q.; Bao, A.M.; Lü, Y. Analysis of cultivated land change and water-land matching characteristics in Amu Darya River Basin. Water Resour. Prot. 2021, 37, 80–86. [Google Scholar]
  62. Wang, X.; Wang, X.; Zhang, X.; Zhou, J.; Jia, Z.; Ma, J.; Yao, W.; Tu, Y.; Sun, Z.; Wei, Y. Ecological barriers: An approach to ecological conservation and restoration in China. Ambio 2024, 53, 1077–1091. [Google Scholar] [CrossRef] [PubMed]
  63. Tang, C.S.; Liu, B.; Vahedifard, F.; Jiang, N.J.; Zhu, C.; Shen, Z.T.; Pan, X.H.; Cheng, Q.; Shi, B.; Shi, B. Enhancing soil resilience to climatic wetting-drying cycles through a bio-mediated approach. J. Geophys. Res. Earth Surf. 2024, 129, e2023JF007573. [Google Scholar] [CrossRef]
  64. Chen, S.; Pei, B. Spatial-temporal variations of cultivated land compensation and its compensation mechanism in mainland China. Environ. Impact Assess. Rev. 2025, 110, 107712. [Google Scholar] [CrossRef]
  65. Ling, J.; Peng, J.; Peng, T. Can institutional opening-up promote green development in cities? Evidence from China’s Pilot Free Trade Zones. J. Clean. Prod. 2024, 473, 143573. [Google Scholar] [CrossRef]
  66. Qin, C.; Su, J.; Wang, Q.; Wan, J.; Wang, J. Practice mechanism analysis of the theory of lucid waters and lush mountains are invaluable assets’. Res. Environ. Sci. 2018, 31, 985–990. [Google Scholar]
  67. Chu, H.; Wu, C.; Wang, G.; Lang, Y.; Aynalem, M. Coupling Coordination Evaluation of Water and Soil Resource Matching and Grain Production, and Analysis of Obstacle Factors in a Typical Black Soil Region of Northeast China. Sustainability 2024, 16, 5030. [Google Scholar] [CrossRef]
  68. Acheampong, A.O.; Opoku, E.E.O. Environmental degradation and economic growth: Investigating linkages and potential pathways. Energy Econ. 2023, 123, 106734. [Google Scholar] [CrossRef]
  69. Zeng, L.; Wen, M.; Li, C.; Nie, Y.; Wang, S. Impact of digital greening synergistic transformation on urban economic resilience in China: Evidence from quasi-natural experiments. Humanit. Soc. Sci. Commun. 2025, 12, e85. [Google Scholar] [CrossRef]
  70. Ding, R.; Dai, J.; Zhang, Y.; Tan, T.; Chou, L.C. Dynamics in green governance in China: Exploring the relationship between carbon emissions, water consumption and economic planning. Desalination Water Treat. 2025, 322, 101120. [Google Scholar] [CrossRef]
  71. Das, S.; Ghimire, D. Soil organic carbon: Measurement and monitoring using remote sensing data. In Remote Sensing of Soils; Elsevier: Amsterdam, The Netherlands, 2024; pp. 395–409. [Google Scholar]
  72. Hao, W.; Hu, X.; Wang, J.; Zhang, Z.; Shi, Z.; Zhou, H. The impact of farmland fragmentation in China on agricultural productivity. J. Clean. Prod. 2023, 425, 138962. [Google Scholar] [CrossRef]
  73. He, Z.; Shang, X.; Zhang, T.; Yun, J. Coupled regulatory mechanisms and synergy/trade-off strategies of human activity and climate change on ecosystem service value in the loess hilly fragile region of northern Shaanxi, China. Ecol. Indic. 2022, 143, 109325. [Google Scholar] [CrossRef]
Figure 1. Overview of the geographical division of the Tailan River Irrigation District.
Sustainability 17 04173 g001
Figure 2. Spatiotemporal changes of LU in the Tailan River Irrigation District from 2000 to 2020.
Sustainability 17 04173 g002
Figure 3. Changes of LU transfer in the Tailan River Irrigation District from 2000 to 2020. Note: The numerical unit in the figure is hm2.
Sustainability 17 04173 g003
Figure 4. Cultivated land area (a) and reclamation rate (b) in the Tailan River Irrigation District from 2000 to 2020.
Sustainability 17 04173 g004
Figure 5. Lorenz curve of the Tailan River Irrigation District from 2000 to 2020.
Sustainability 17 04173 g005
Figure 6. Agricultural water consumption (a) and agricultural water–soil matching coefficient (b) in the Tailan River Irrigation District from 2000 to 2020.
Sustainability 17 04173 g006
Figure 7. Spatiotemporal distribution of agricultural water–soil matching in the Tailan River Irrigation District from 2000 to 2020.
Sustainability 17 04173 g007
Figure 8. ESV changes of different LU categories in the Tailan River Irrigation District from 2000 to 2020. (a) ESV; (b) ESV ratio.
Sustainability 17 04173 g008
Figure 9. Variation of the ESV of secondary services in the Tailan River Irrigation District from 2000 to 2020. Note: in Figure 9(a), a1, b1, c1, d1, and e1 represent the total value of the ESV in 2000, 2005, 2010, 2015, and 2020, respectively: CNY 243 million, 413 million, 650 million, 732 million, and 678 million; and in Figure 9(b), a2, b2, c2, d2, and e2 represent the proportion of the ESV in 2000, 2005, 2010, 2015, and 2020, respectively.
Sustainability 17 04173 g009
Figure 10. Spatiotemporal changes of ESV area division in the Tailan River Irrigation District from 2000 to 2020.
Sustainability 17 04173 g010
Figure 11. The area and proportion distribution of ESV high- and low-value zones in the Tailan River Irrigation District from 2000 to 2020.
Sustainability 17 04173 g011
Figure 12. ESV sensitivity coefficient in the Tailan River Irrigation District.
Sustainability 17 04173 g012
Figure 13. Trade-off synergistic relationship between agricultural water–soil matching and ecosystem services in the Tailan River Irrigation District from 2000 to 2020. Note: X1 is the agricultural water–soil matching, X2 is the provision service, X3 is the regulation service, X4 is the support service, and X5 is the cultural service.
Sustainability 17 04173 g013
Table 1. ESV per unit area of the Tailan River Irrigation District from 2000 to 2020. Note: All services of construction land are 0, not indicated.
Ecosystem ServicesESV Coefficient (CNY·hm−2·a−1)
Secondary ClassificationPaddy FieldDrylandForest LandGrasslandWaterUnused Land
Provision servicesFood production1268.55792.84177.22149.24610.964.66
Raw material production83.95373.10401.09219.20340.4613.99
Water supply−2453.1518.66205.21107.275074.209.33
Regulation servicesGas conditioning1035.36624.951315.19769.521245.2360.63
Climate regulation531.67335.793945.562033.412746.9746.64
Environment purification158.5793.281193.93671.594244.05191.22
Hydrological regulation2537.10251.843124.741487.7558,982.92111.93
Support servicesSoil conservation9.33960.741604.34937.421511.0769.96
Nutrient cycle maintenance177.22111.93121.2674.62116.594.66
Biodiversity195.88121.261464.43853.474859.6765.29
Cultural serviceAesthetic landscape83.9555.97643.60377.773087.4327.98
Total3628.433740.3614,196.577681.2682,819.53606.29
Table 2. Dynamic degree of LU change in the Tailan River Irrigation District from 2000 to 2020. Note: The area is the change area, hm2; the dynamic degree includes the single LU dynamic degree and comprehensive LU dynamic degree, %; and the comprehensive LU is the sum of the absolute values of the area changes of the seven land categories, hm2.
Land Categories2000~20052005~20102010~20152015~20202000~2020
AreaDynamic DegreeAreaDynamic DegreeAreaDynamic DegreeAreaDynamic DegreeAreaDynamic Degree
Paddy field2.880.06−1011.6−20.000.000.000.000.00−1008.72−5.00
Dryland13,944.965.4914,361.034.449953.192.522851.380.6441,110.564.05
Forest land2.640.181520.06102.60−0.54−0.012.430.031524.5925.94
Grassland−12,927.29−6.44−783.27−0.58%−10,058.58−7.61−3032.55−3.71−26,801.69−3.34
Water−15.05−0.23−880.65−13.5366.963.19−67.23−2.75−895.97−3.40
Construction land15.160.171327.6414.4063.720.40220.411.361626.934.45
Unused land−1022.77−1.31−14,533.56−19.92−24.93−8.8225.5616.18−15,555.7−4.98
Comprehensive LU27,930.751.3534,417.813.4720,167.921.006199.560.6888,524.161.28
Table 3. Gini coefficient and evaluation results of agricultural water–soil matching in the Tailan River Irrigation District from 2000 to 2020.
YearsGini Coefficient (G)Evaluation Results
20000.101absolute fairness
20050.066absolute fairness
20100.125absolute fairness
20150.118absolute fairness
20200.181absolute fairness
2000~20200.118absolute fairness
Table 4. Variation of ESV in township units of the Tailan River Irrigation District.
Irrigation District Administrative UnitsESV Interannual Total Value (10 8 CNY)Interannual Change Rate of ESV (%)
20002005201020152020The Mean Value of 5 Periods2000~20052005~20102010~20152015~2020
Guleawati Township0.641.091.761.981.761.4571.1561.8212.32−11.07
Jiamu Town0.801.361.932.142.011.6569.8542.5510.44−5.85
Communist Youth League Town0.130.210.260.300.290.2464.3819.5817.50−4.50
Kezile Town0.530.901.581.831.711.3168.7075.6316.29−6.83
Yixilaimuqi Township0.330.570.971.061.010.7970.5970.159.97−4.94
Total region2.434.136.507.326.785.4369.7557.4412.58−7.32
Disclaimer/Publisher’s Note: The statements, opinions and data contained in all publications are solely those of the individual author(s) and contributor(s) and not of MDPI and/or the editor(s). MDPI and/or the editor(s) disclaim responsibility for any injury to people or property resulting from any ideas, methods, instructions or products referred to in the content.

