
Agri-Food Supply Chain Sustainability Indicators from a Multi-Capital Perspective: A Systematic Review


Abstract
1. Introduction
- -
- Most studies address the AFSC, with limited attention to how sustainability responsibilities and indicators are distributed among individual actors—an issue highlighted by [2,6]. Such allocation highlights each actor’s responsibility for sustainability, reinforcing the need to consider all AFSC actors in the framework development.
- -
- There is a lack of accurate indicator formulas across most of the developed frameworks.
- -
- There is a lack of studies adopting the MCSA despite its recognized advantages.
- -
- To our knowledge, no review has been published recently on this topic as of 2024. Moreover, the most recent review of sustainability indicators considered studies published only up to 2022.
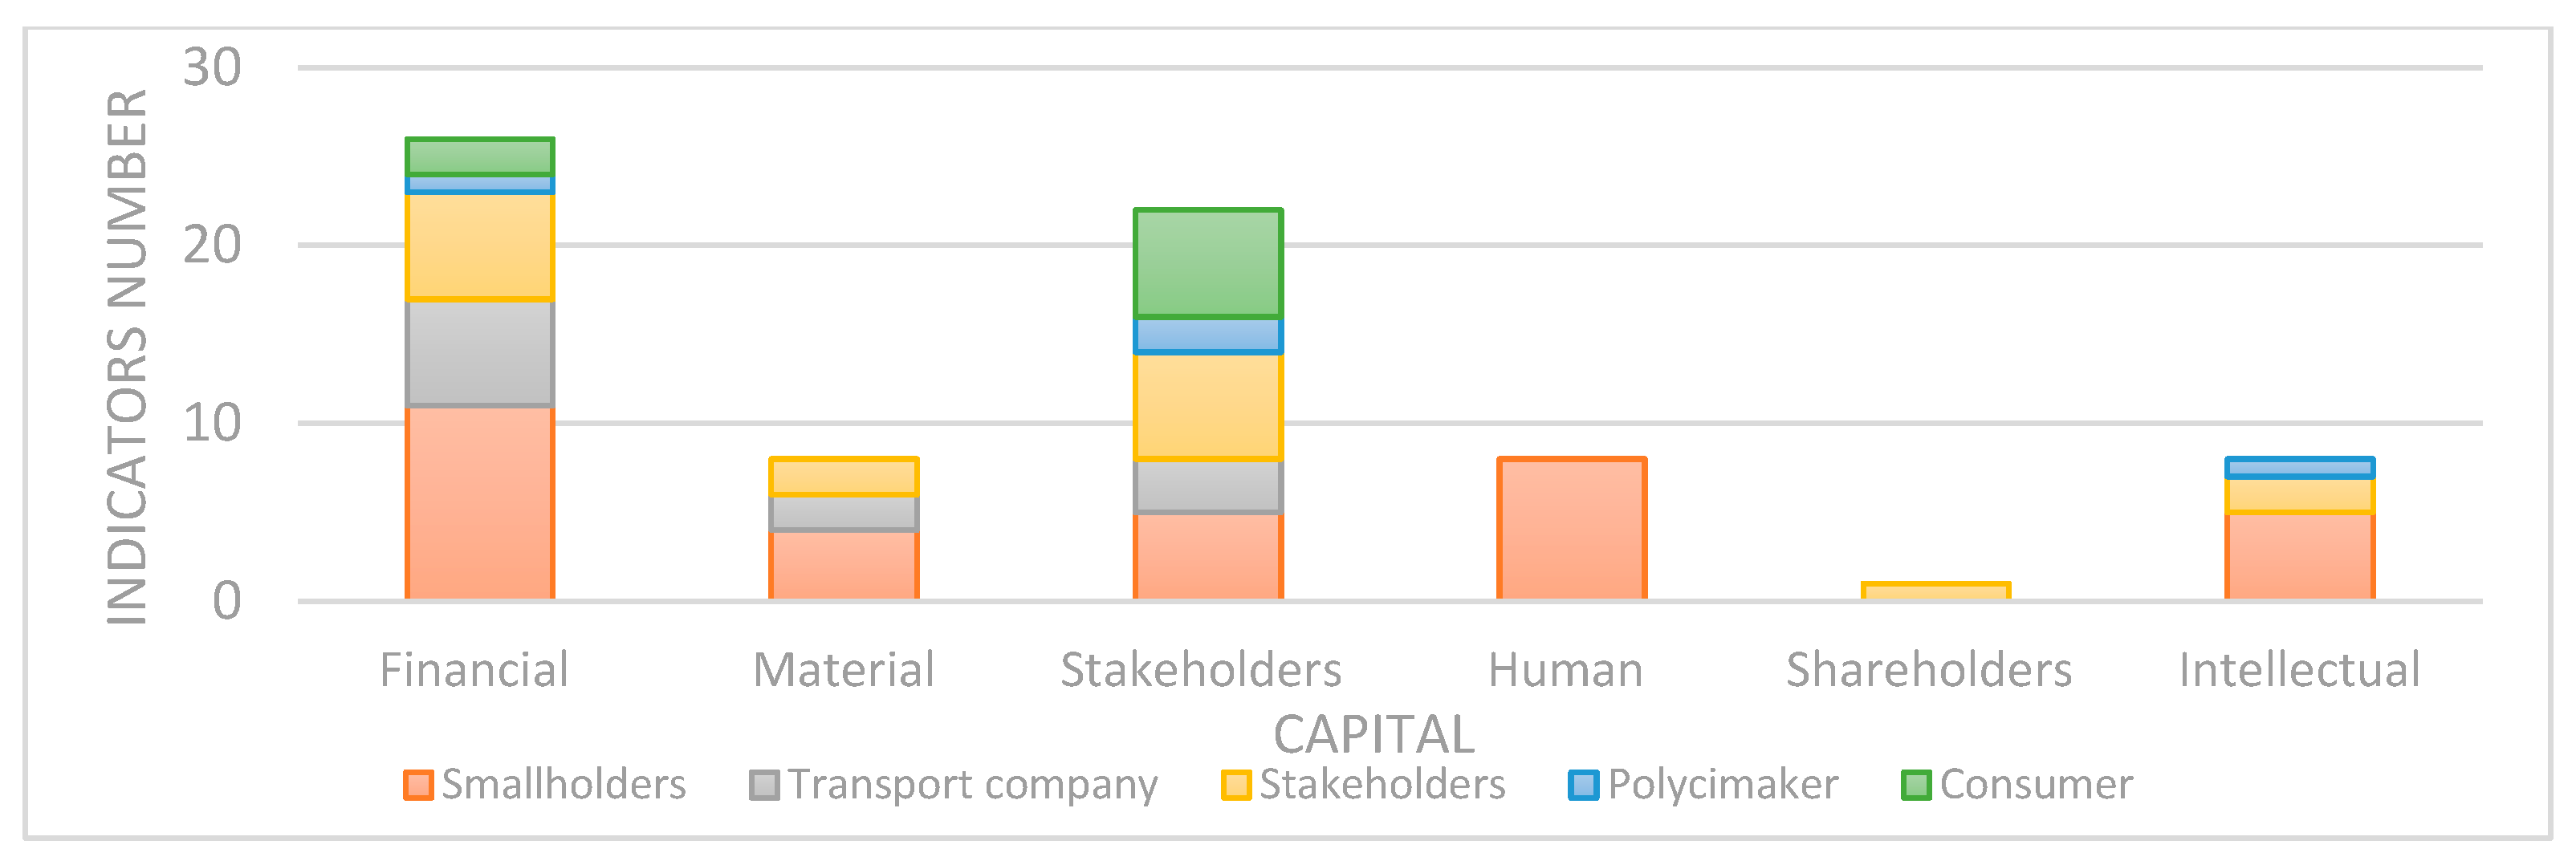
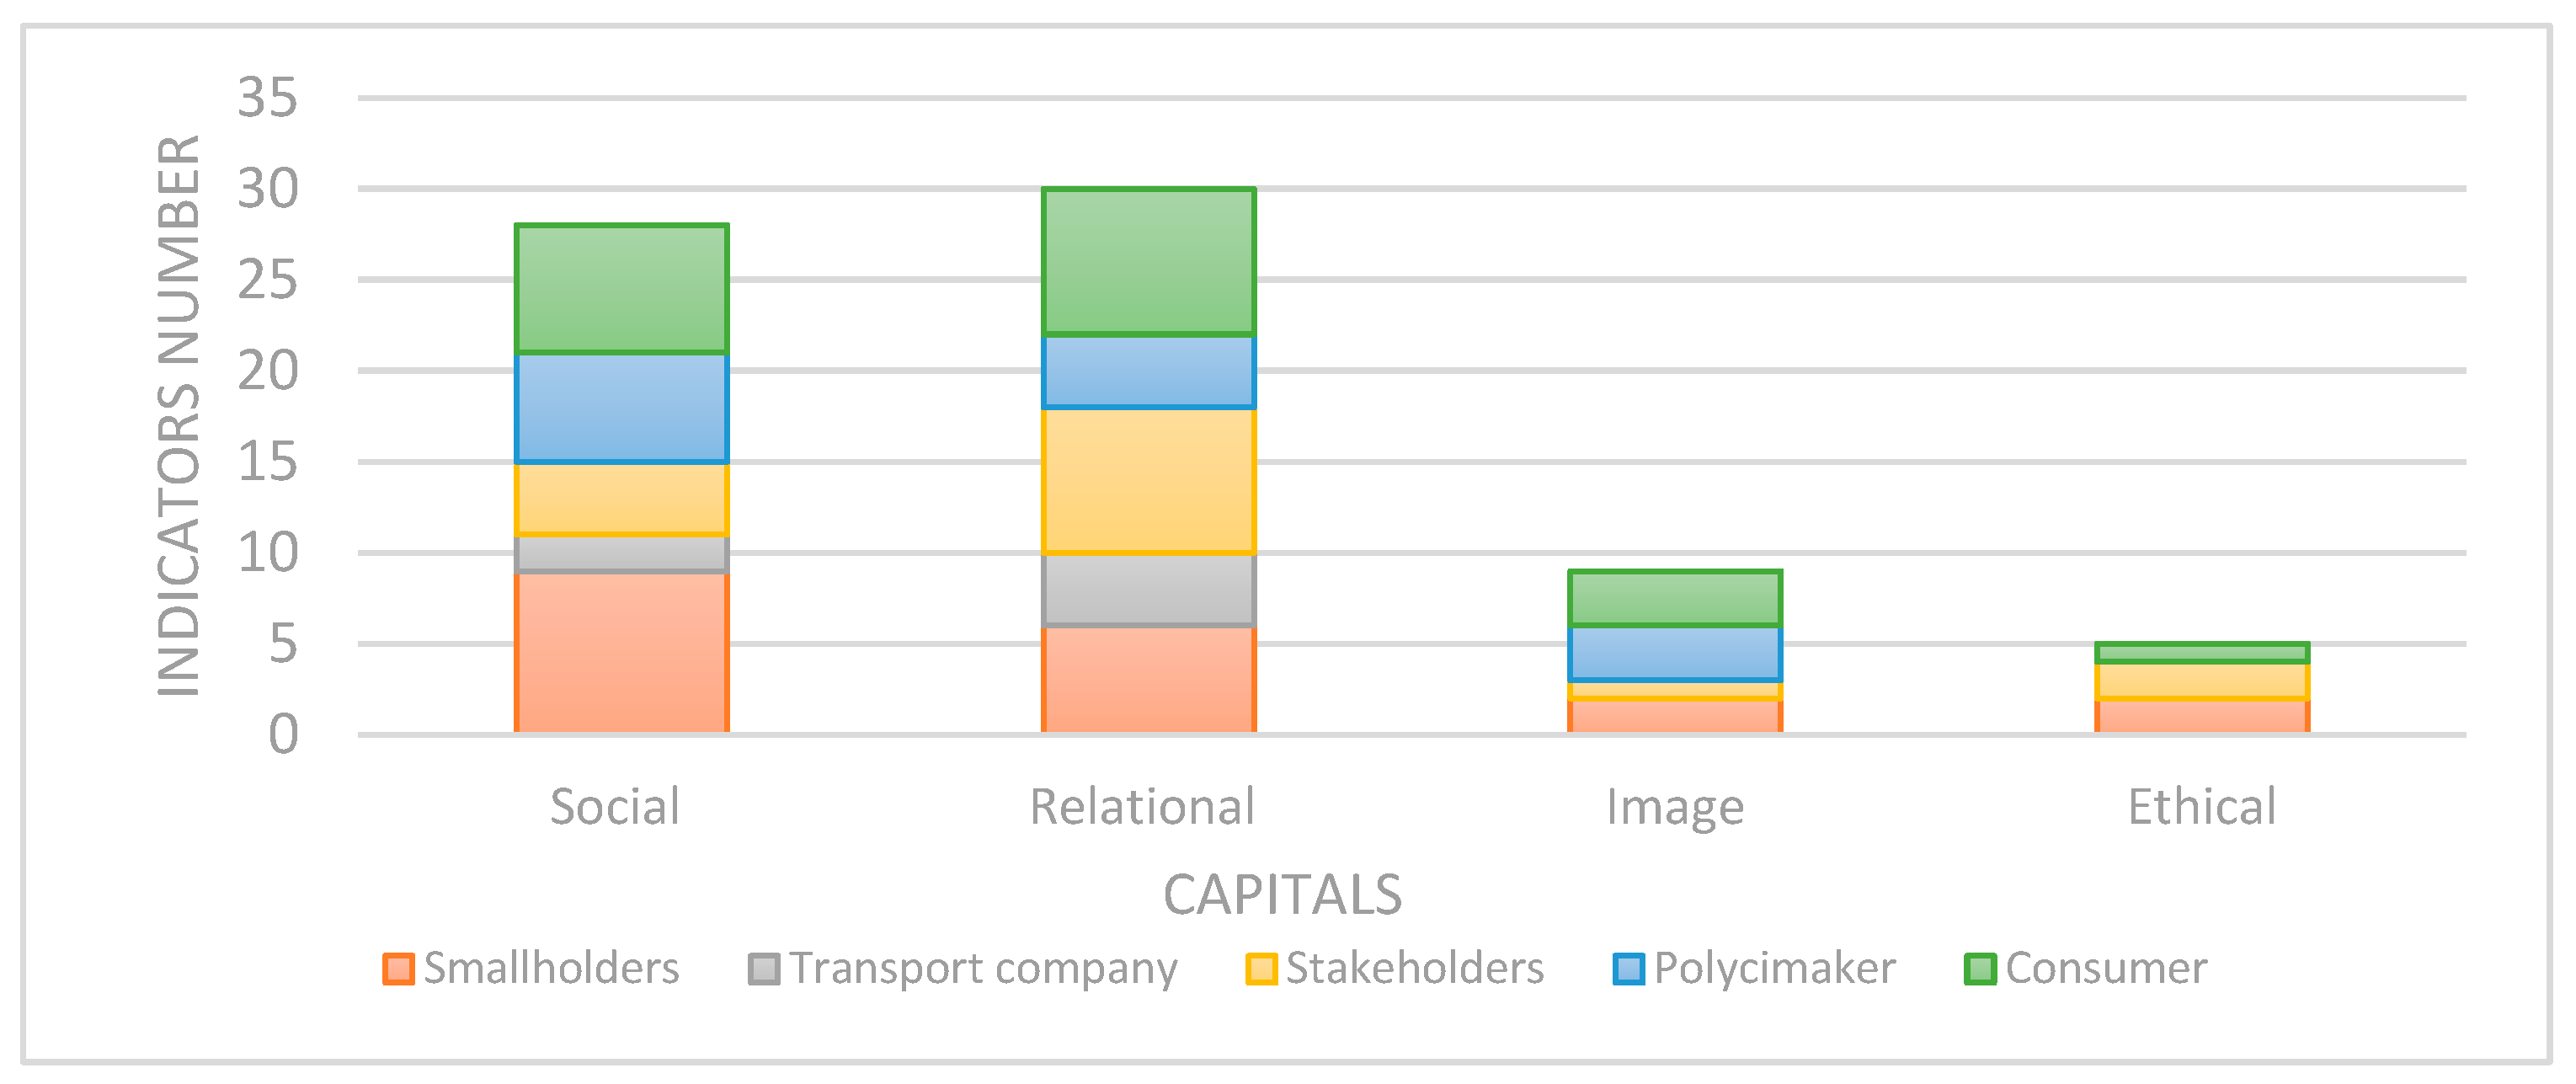
- It is an attempt to develop an MCSF for the AFSC by adapting the MCSA to the agri-food context. To do so, the proposed framework breaks down the 3 sustainability dimensions into 12 distinct types of capital as listed and defined in Table 3 and aligned with [15]. Each type of capital addresses specific aspects of sustainability, contributing to a holistic evaluation of economic, social, and natural interactions. Adopting these types of capital varies depending on the activities of each AFSC actor. In this paper, we consider five AFSC actors [24,25]: (i) smallholders (SH) as they form the backbone of agriculture, focusing on growing and harvesting agricultural products; (ii) transport companies (TC) that carry these products to processing facilities; (iii) stakeholders (ST), including manufacturers, food processors, distributors, restaurants, hotels, and retail stores; (iv) consumers (CS); and (v) policymakers (PM) such as government agencies and regulatory bodies that create and implement regulations to govern various aspects of the supply chain. To the best of our knowledge, this is the first study that defines a comprehensive MCSA for AFSCs with a structured understanding of the three dimensions of sustainability from a resource perspective for each actor.
- There is a meticulous gathering of indicators crucial for sustainability assessment assigned to the different types of capital based on the systematic literature review. Furthermore, a rigorous linking of each indicator to its specific capital and AFSC actor steers away from the mere collection of data and comprehensively addresses the spatial and temporal scales within the assessment context.
- Crafting specific formulas for each indicator and providing transparent methodologies for their calculation is proposed.
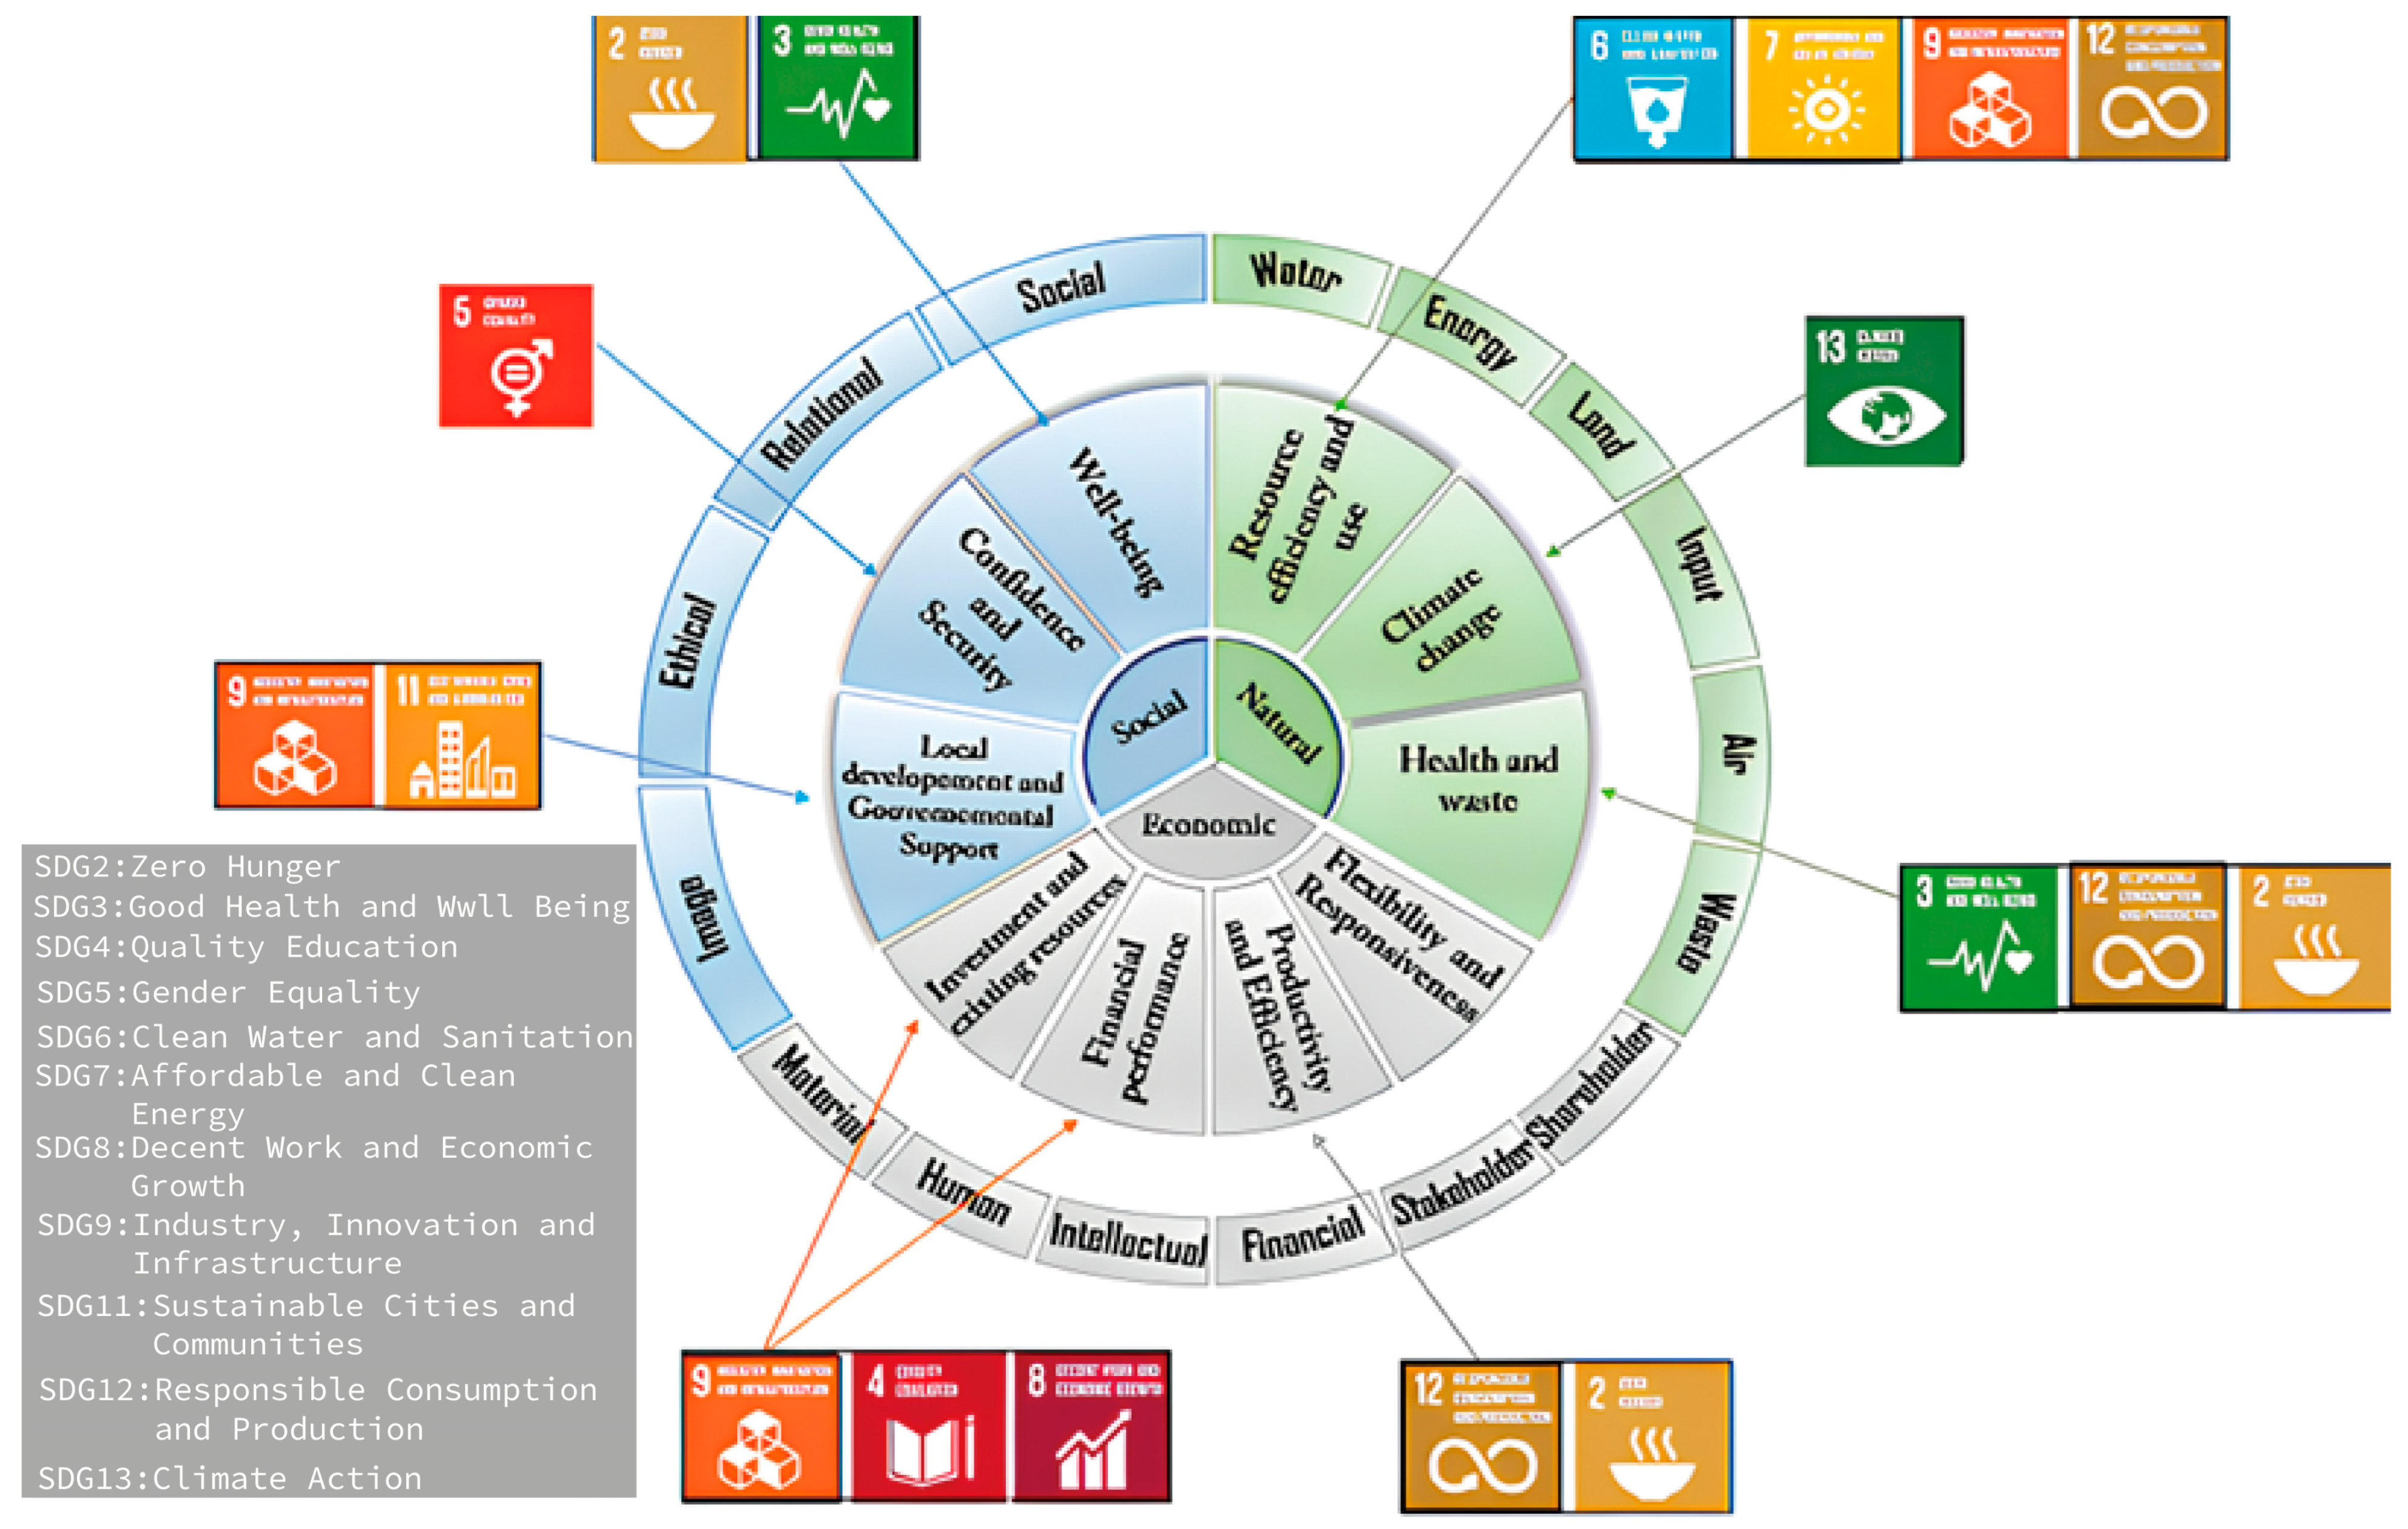
- Based on the literature review, a theoretical AFSC sustainability framework linking the set of sustainability capital, themes, and SDGs is proposed.
2. Materials and Methods
2.1. Search Strategy
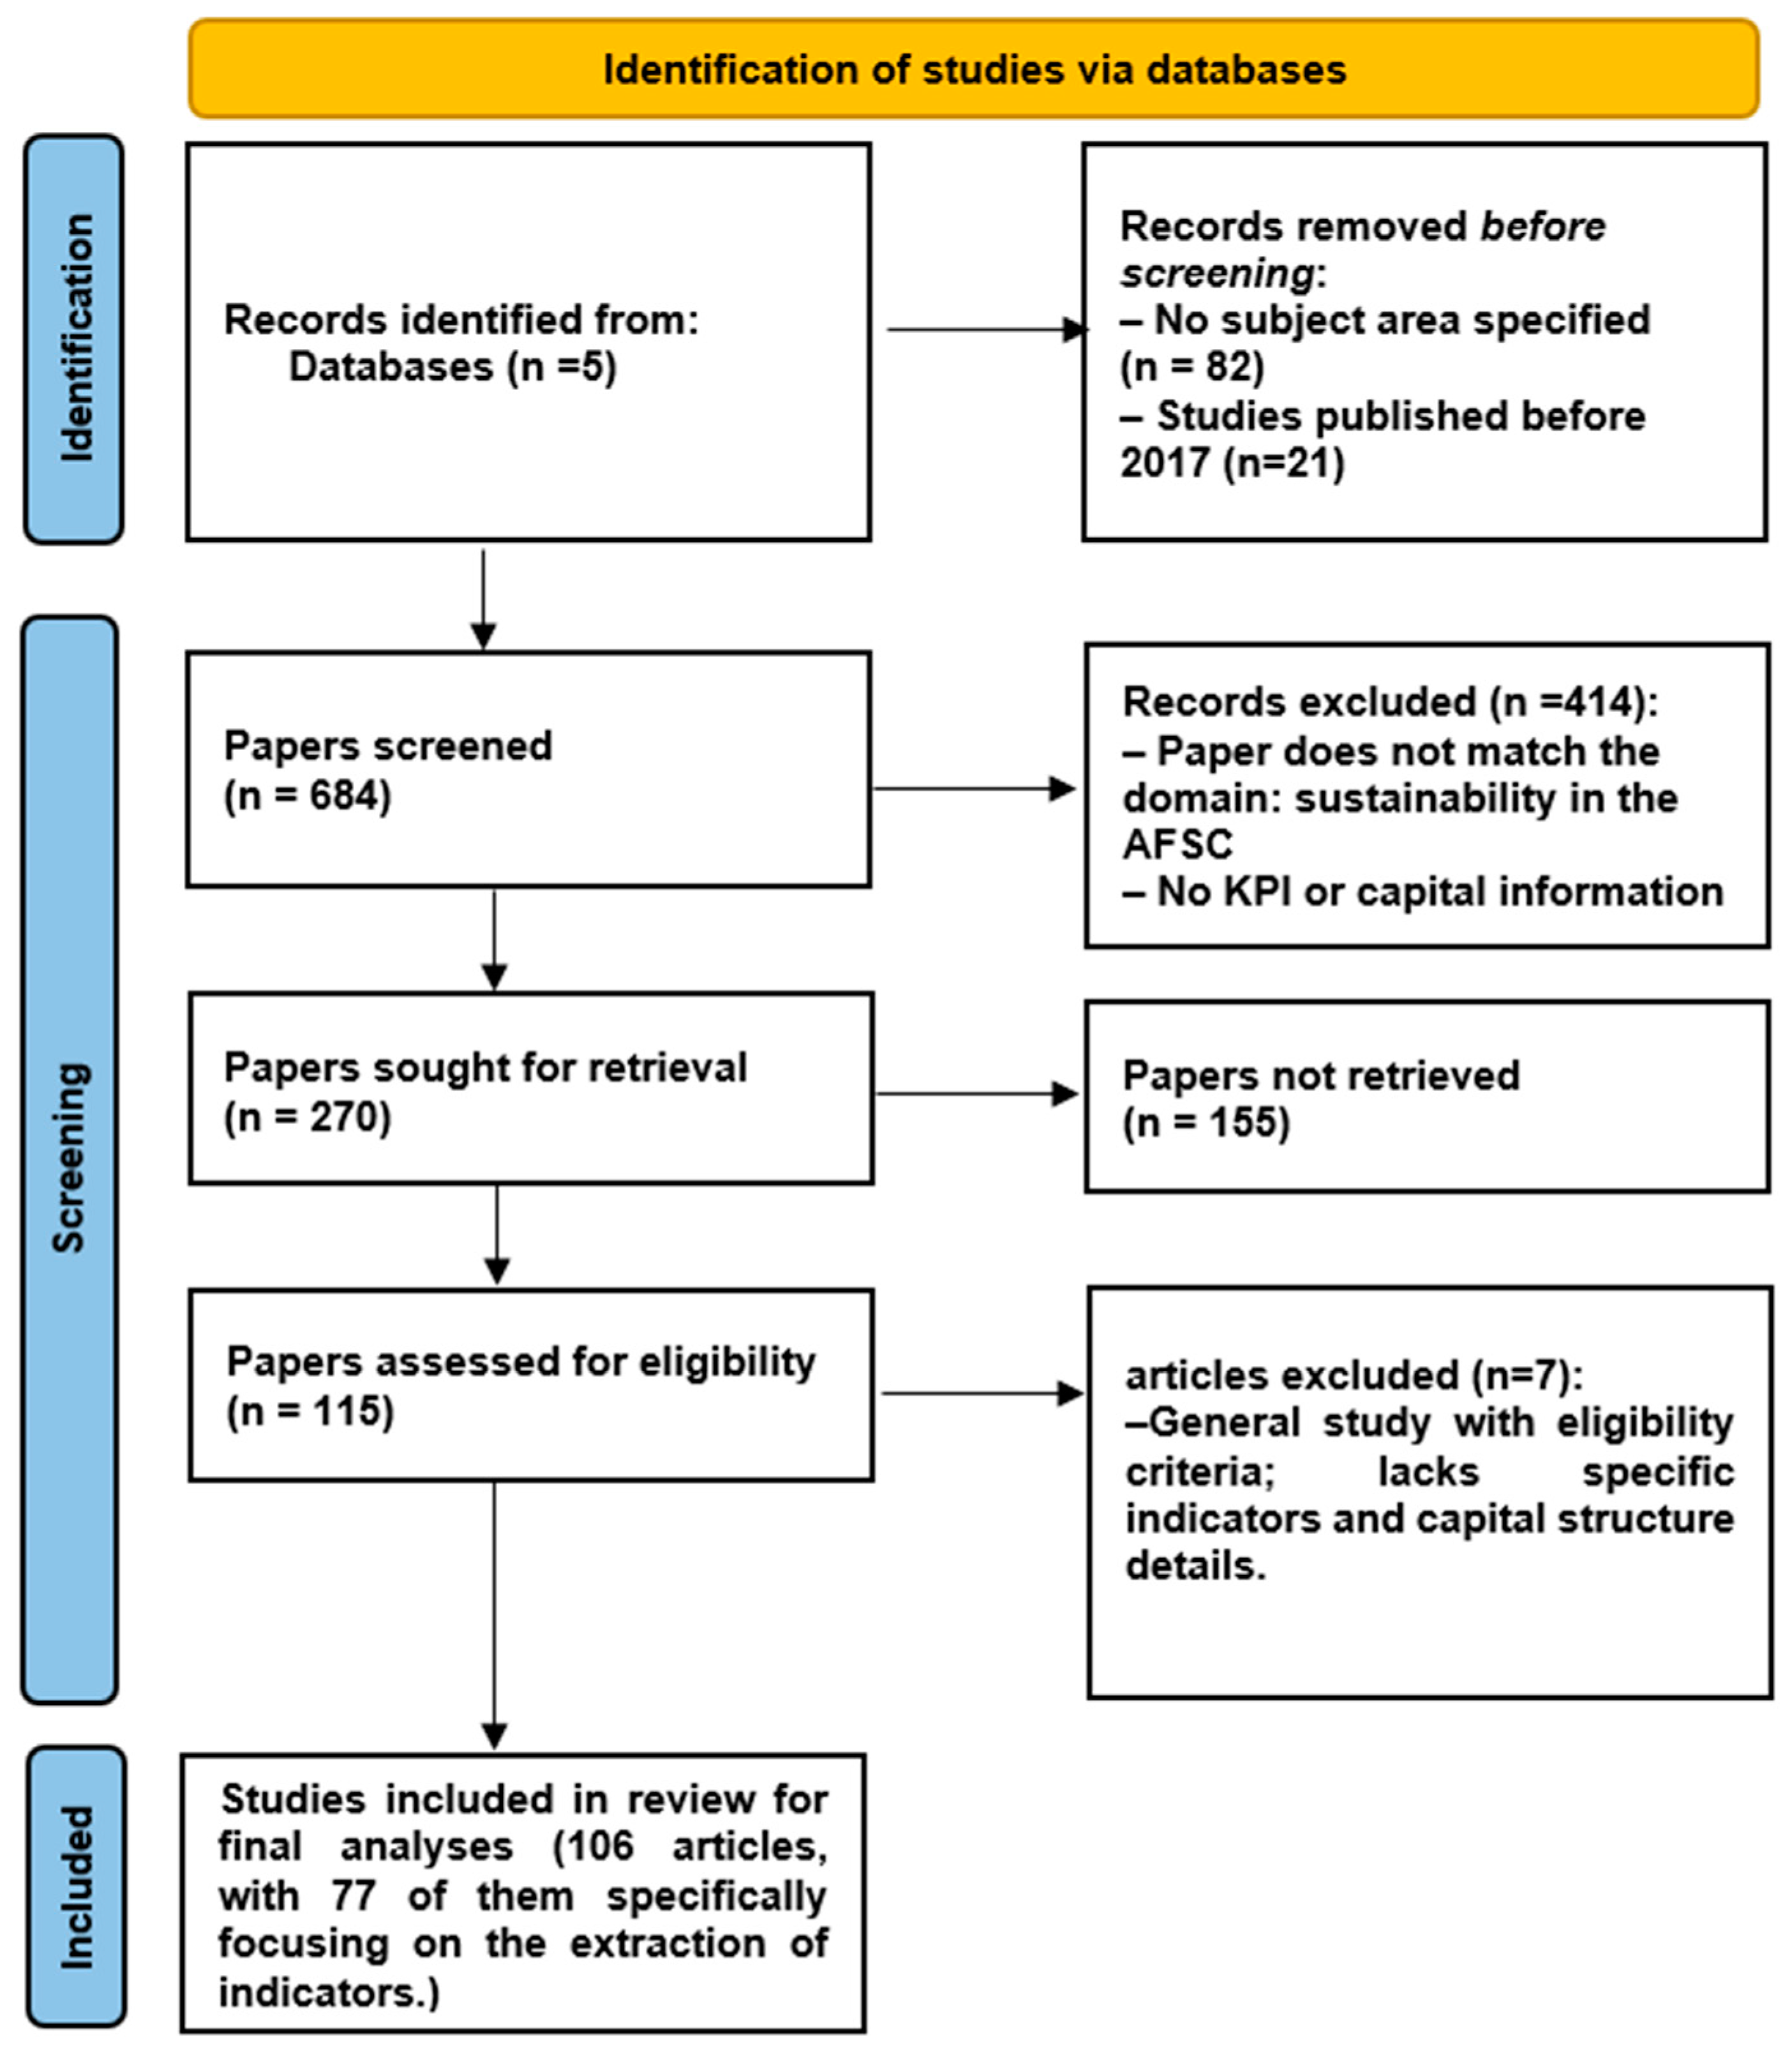
2.2. Study Selection
2.3. Data Extraction
- (i)
- Basic data about the paper, such as author, paper title, date, country/affiliation, type of paper, paper keywords, and topic.
- (ii)
- Content-related data, such as sustainability capitals/dimensions, actors in the AFSCs, indicators used to measure sustainability, case studies, and the sustainability approach taken in the study. This will provide a comprehensive overview of the different sustainability-related issues and approaches investigated in the AFSCs.
2.4. Analysis Pathway
2.5. Data Analysis: An Overview of Considered Types of Sustainability Capital and AFSC Actors
3. Identification of Sustainability Capital and Indicators for AFSCs
3.1. Environmental Dimension Capital and Indicators
3.1.1. Classification and Results
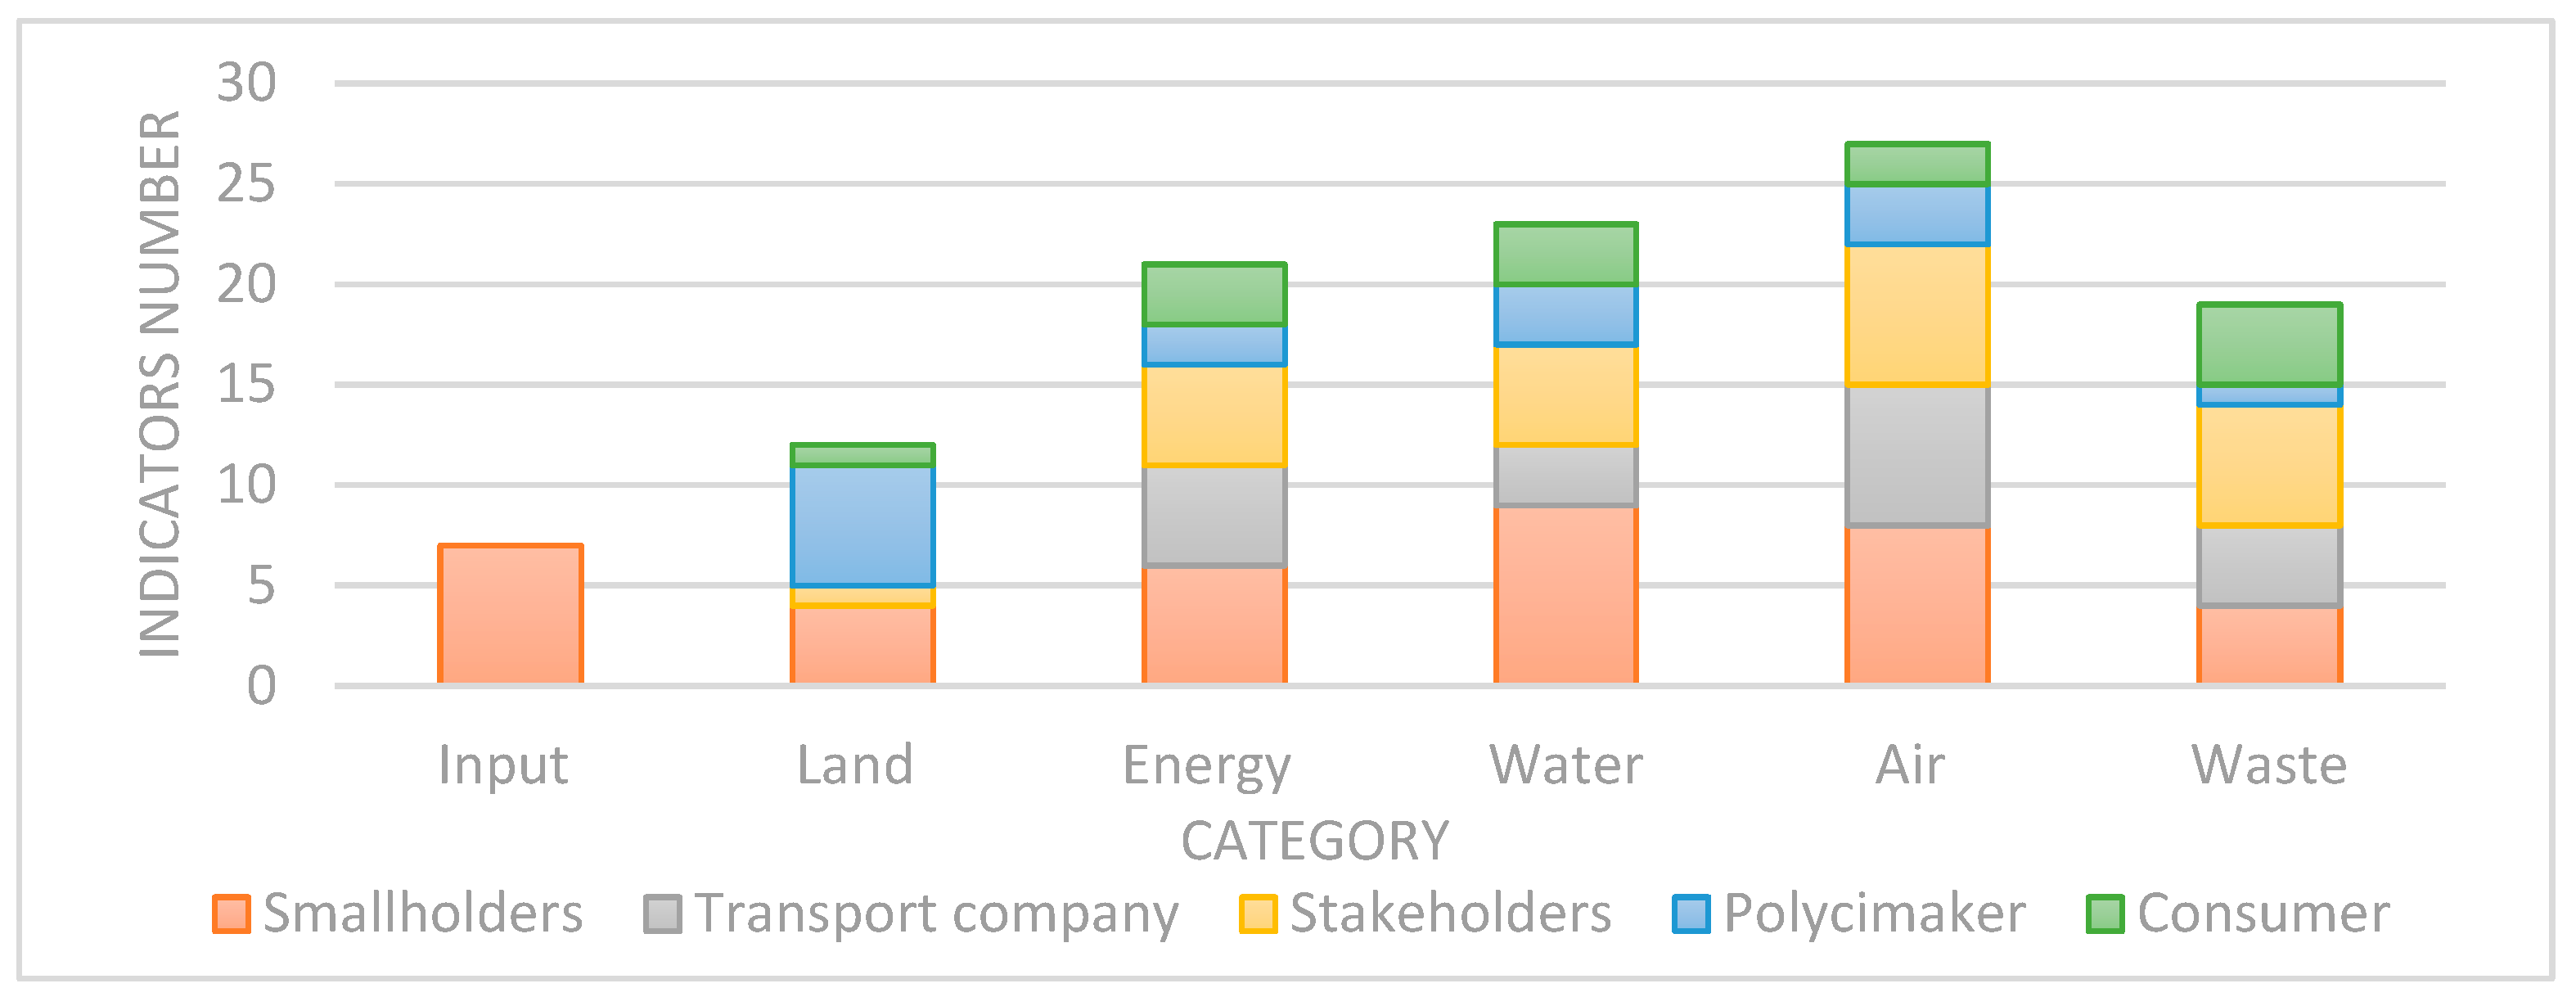
- Of all the characters, water has the most indicators, highlighting its critical role in agricultural operations, including crop irrigation and the production and consumption of food. Since agriculture uses 70% of the world’s water withdrawals and more than 80% in agrarian economies, water, acknowledged as essential to life and socioeconomic development [54], is under increasing strain [55]. Sustainable water management is supported by indicators that offer insights into productivity, consumption, and policy optimization, such as irrigation water productivity (IWP), water use efficiency (WUE), and agricultural water use [55]. Social capital also affects water management since decisions about optimal practices and water quality are shaped by the trust and collaboration of farmers, regulators, and extension workers [56].
- The second category, air indicators, assesses atmospheric properties and their significant environmental effects. Climate change, fuelled by globalization and industrialization, is one of the most important challenges. Storms, floods, and droughts are among the major environmental disasters exacerbated by this phenomenon, affecting transportation, distribution, and agricultural output. Key metrics like GHG emissions and global warming potential (GWP) are essential. These indicators are crucial and need to be considered separately for an appropriate estimate, even though they are connected. GHG emissions quantify the amount of greenhouse gases released into the atmosphere, whereas GWP measures the warming potential of greenhouse gases compared to carbon dioxide over a given period [46]. Both metrics guide climate policy and mitigation efforts. Linking to GWP and GHG emissions, ozone depletion is another critical indicator. It is assessed through changes in stratospheric ozone concentration, with ozone depletion potential (ODP) measuring a substance’s impact relative to CFC-11.
- Issues for the AFSC’s energy category include resource depletion and reliance on fossil fuels. To lessen dependence on fossil fuels, the number of electrical points along the chain is a crucial indicator that shows improvement but is still low, particularly in developing nations where infrastructure development is the responsibility of policymakers [57]. This provides a vital focus for sustainability initiatives and research since it illustrates the intricate interactions among consumer preferences, packaging innovation, and energy dynamics.
- In the land category, the “native grassland” indicator is often overlooked despite its role in climate change mitigation and ecosystem services like carbon sequestration and water regulation [58]. To determine significant conservation areas, biodiversity, and ecosystem health, the area of natural grasslands must be measured. Innovations in sustainable packaging have resulted from these decisions, which show how consumer tastes, environmental concerns, and industry activities are changing over time [59].
- The input category only applies to smallholders because it concentrates on materials used for livestock and soil.
3.1.2. Themes Identified
3.2. Economic Dimension Forms of Capital and Indicators
3.2.1. Classification and Results
3.2.2. Themes Identified
3.3. Social Dimension Capital and Indicators
3.3.1. Classification and Results
3.3.2. Themes Identified
4. Discussion
4.1. Major Findings
4.2. Connecting Multi-Capital Sustainability Framework with the SDG Targets
5. Conclusions and Future Research Areas
Supplementary Materials
Funding
Conflicts of Interest
Abbreviations
| AFSC | Agri-food supply chains |
| MCSA | Multi-capital sustainability approach |
| SR | Literature review |
| FAO | Food and Agriculture Organization |
| SDGs | Sustainable Development Goals |
| KPI | key performance indicators |
| ISO | International Organization for Standardization |
Appendix A

| Ca | Indicator | Unity | SH | TC | ST | PM | CS | Ref | Formula |
|---|---|---|---|---|---|---|---|---|---|
| Input | Percentage of external inputs used for production (IE) | % | * | [74] | ; [75] Input cost (IC) = X × Px X: Number of inputs, Px: Price of input (Currency/unit) The total cost of production inputs (ITC)= EIC+IIC; EIC: External Input cost IIC: Internal input cost | ||||
| Nitrogen and phosphorus balances (NP) | kg ha−1 | * | [76] | ; [76] | |||||
| Number of treatment days using antibiotics per 100 days (TD100) | * | [65] | ; [77] Qt antibiotic: antibiotics quantity DDDAc: Defined daily dose animal defined for ‘any country’ kg animals at risk: Total mass of animals at risk of treatment (animal’s average number present multiplied by the estimated mass at the time of treatment) Daysr: Total number of days that an animal was at risk of treatment. LAc: Long-acting factor adjusts for extended duration of action and could be defined for all products for the same country | ||||||
| Nitrogen use efficiency (NUE) | grain kg N kg−1 | * | [49] | ; [78] N: fertilizer amount added through sources (organic or inorganic) | |||||
| Phosphorus use efficiency (PUE) | grain kg P kg−1 | * | [49] | ; [78] P: Fertilizer amount added through sources (organic or inorganic) | |||||
| Potassium use efficiency (KUE) | grain kg k kg−1 | * | [49] | ; [79] K: fertilizer amount added through sources (organic or inorganic) | |||||
| Eutrophication potential | kg PO43- eq ha−1 year−1 | * | [48] | PEN = Load (mass) of nitrogen/mass or units produced; [80] PEP = Load (mass) of phosphorous/mass or units produced | |||||
| Land | Agricultural land occupation | ha | * | * | [47] | Data | |||
| Area under native grasslands (AUNG) | % | * | [76] | ; [76] | |||||
| Land cover | % | * | * | * | [81] | Data: % of:—Artificial surfaces -agricultural areas—forest and semi-natural area -wetlands -water bodies; [81] | |||
| Urban land occupation | % | * | * | [47,82] | Data: the urban land occupation indicator is more dedicated to bringing information on transport planning issues and on tensions between agricultural and urban land occupation; [83] | ||||
| Annual soil loss | Mg ha−1 yr−1 | * | * | [84] | A = R.K.LS.C. SP; [84] R calculated using the equation: R = 10.8 + 0.415 MRRm MRRm: Monthly average precipitation from the 3 closest climatological stations of the study area weighted by the inverse of the distance between the plot and the stations. K: Soil erodibility, LS: Slope length and steepness factor, C: Cropping factor, SP: Support practice factor | ||||
| Terrestrial acidification | kg SO2eq /ha/year | * | * | [82] | The specific equation for calculating terrestrial acidification involves the Acidification Potential (AP). (recipe 2016) ; APx,i: Acidification potential for a specific precursor (e.g., NOx, NH3, SO2) in a specific grid FFx,i: Fate factor for acidification due to emissions of the precursor (x) in grid i FFso2, world average: the world average is the emission-weighted world average fate factor for SO2 | ||||
| Energy | Abiotic depletion (AD) | kg Sb eq | * | [48] | ; [85] ; Mj: Quantity of resource i extracted (kg). ADPj: Abiotic depletion potential of resource i (kg Sb equivalents/kg of resource i) Rj: Ultimate reserve of resource j (kg) DRj: Extraction rate of resource j (kg yr−1) (regeneration is assumed to be zero) Rref: Ultimate reserve of the reference resource, antimony (Sb) (kg) DRref: Extraction rate of the reference resource (kg yr−1) | ||||
| Energy use (EU) | MJ/kg | * | * | * | * | * | [76] | ; Qi: Quantity or amount of a specific energy source i used. Efi: Energy conversion factor for that particular energy source i. | |
| Use of renewable energy (RE) | % | * | * | * | [74] | ; ER: renewable energy used in kWh TE: Total of energy used in kWh | |||
| Fossil fuel depletion (FFD) | kg oil-eq/unit output | * | * | * | * | [82] | ; [86] FFETt: Fossil fuel extraction by type t (in kg/unit output or MJ/unit output of the process under study) OILQt: Oil equivalent characterization factor by type t (in kg oileq/kg or kg oileq /MJ). Types ‘t’: Crude oil, hard coal, natural gas, brown coal, and peat | ||
| * | * | [47] | |||||||
| Use of electrical vehicles | number | * | * | * | * | * | [87] | Data | |
| CO2 emission by electrical used (C1) | tco2 per ton product | * | * | * | [50] | C1; [50] | |||
| Water | Water use for agriculture production | m3 | * | * | [49,88] | Data | |||
| Water use efficiency (WUE) | Value added/m3 | * | * | * | * | * | [55] | ; [89] WUE: the overall water use efficiency at the national level. WUEi: the water use efficiency for the i-th sector. Weighti: the % of water withdrawn by the i-th sector relative to the total water withdrawals. ; [89] NVAi: Net value added; VWi: Volume of water used (m3) | |
| * | [49,90] | ||||||||
| Water depletion (WD) | m3 | * | * | * | [82] | WD = (CURSW + CUARG) − AAWA; [91] CURSW: Consumptive use of renewable surface water (m3) CUARG: Consumptive use of annually renewable groundwater (m3) AAWA: Average annual water availability (m3) | |||
| * | * | * | [47] | ||||||
| Water footprint (WF) | m3/ton | * | [92] | ; [92] | |||||
| Water scarcity footprint (WSF) | m3 world-eq,/kg | * | [93] | ; [93] WCgs: Total growing season water consumption (m3/kg) Annual aware CF: annual available water remaining characterization factors of specific crops (m3 world-eq,/m3 consumed) | |||||
| Irrigation water use productivity (IWP) | kg m−3 | * | [49] | ; [94] | |||||
| Water loss (Wloss) | m3/year | * | * | * | * | [16] | Wloss [p, c] = WF [p, c] × Floss[p]; [16] Wloss [p, c]: Loss of water based on each water footprint (WF) component c used to produce the quantity of food item p in the year t. WF [p, c]: Water footprint of the food item pp associated with component c. Floss: Amount of food loss recorded across the supply chain in year t for the selected food item p. | ||
| Freshwater eutrophication | kg P eq | * | * | * | [47] | Based on [95], there are several methods for calculating freshwater eutrophication, such as the Trophic Level Index (TLI) method, the Trophic State Index (TSI) method, and the Fuzzy Comprehensive Evaluation (FCE) method. These methods use specific formulas to calculate the eutrophication indices based on measured parameters such as nutrient concentrations and water clarity. | |||
| Water quality | ------ | * | * | * | [56] | Data: Total of suspended solid (mg/L), Biochemical oxygen demand (mg/L), Chemical oxygen demand (mg/L), sulfide (mg/L) | |||
| * | * | * | [50] | ||||||
| Air | Acidification potential (AP) | kg SO2eq | * | [48] | ; [96] ESO2i: Coefficient of sulphur dioxide equivalent for i-th material [kgSO2eq kg−1]; Wi2 weight of i-th material (kg) | ||||
| GHG emissions (GHG) | kg CO2 | * | * | * | [97] | ; | |||
| Global warming potential (GWP) | Kg CO2eq | * | * | [48] | ; [96] ECO2i: Coefficient of carbon dioxide equivalent for i-th material [kgCO2eq kg−1]; Wi2, weight of i-th material (kg) | ||||
| * | * | * | [46] | ||||||
| Odor and dust disruption to the community | - | * | * | * | [50] | Data | |||
| Noise level | dB | * | * | * | [50] | Data from sensors: Workplace noise (DB), open space noise (DB) | |||
| Ambient air quality | * | * | * | [50] | Data: Dust (µg/Nm3), sulfure dioxide(µg/Nm3), carbon monoxid (µg/Nm3), nitrogen dioxide (µg/Nm3) | ||||
| Time temperature indicator (TTI) | °C | * | * | * | * | * | [98] | Data via sensors | |
| Ozone depletion (ODP) | Kg CFC-11 eq/kg emission | * | [48] | ; [99] CFC: Chlorofluorocarbon | |||||
| * | * | * | * | * | [82] | ||||
| Waste | Natural preservation in fresh fruit | - | * | * | * | [60] | data | ||
| Green packaging (GP) | % | * | * | [59] | For …: ; : Use of returnable, reusable, and recycled packages …… with 3R concept (remanufacturing, recycling, and reuse) [100] | ||||
| * | * | [100] | ; [100] | ||||||
| Food waste (FW) | % | * | * | * | * | [101] | ; Total FW: Total amount of food waste Total IP: Total amount of input food commodities | ||
| * | * | * | * | * | [102] | ||||
| Solid waste (SW) | solid/product | * | * | * | [50] | ; Blotong: Product or solid waste resulting from the refining process |
| Ca | Indicator | Unit | SH | TC | ST | PL | CS | Ref | Formula |
|---|---|---|---|---|---|---|---|---|---|
| Financial | Benefit-cost ratio (BC) | Currency unit | * | [49] | ; [80] Yi: Net annual benefit of year i = Bi − Oi + Epi − Eni Bi: Total benefit (or revenue) of year i; Oi: Operating cost of year i; Epi: Total positive externalities; Eni: Total negative externalities; Ki: Capital outlay for assets of year i (initial investments + re-investments); r: Discount rate; n: Number of years in operation. n ≥ 20. | ||||
| Net farm income (NFI) | currency unit | * | [103] | NFI = CR + Yk − OE − Dep + VIC; [104] NFI: Total net farm income Yk: Income in kind CR: Total farm cash receipts including direct program payments OE: Total operating expenses after rebates (including costs of labour) Dep: Depreciation VIC: Value of inventory change | |||||
| Net income (Ni) | currency unit | * | * | * | [49] | Ni = sales revenue − total costs | |||
| Total production costs (TPC) | currency unit/ha | * | [49] | TPC = Fixed cost + Variable cost | |||||
| Payback period (PP) | currency unit/year | * | * | * | [105] | ; [106] Cin: Cost of investment ACF: Average Annual Cash Flow | |||
| Access to credit score (ACC’s) | * | * | * | [97] | ACC’s = [0.5 × Normalized IMF] + [0.5 × (Normalized Findex)]; [107] IMF: Financial institution access Findex: Share of adults with an account | ||||
| Cash requirement (CR) | currency unit/month | * | * | * | [108] | TE: Total expenses over the accounting period. NM: Number of months in the accounting period. | |||
| Net cash flow (CF) | Currency unit/month | * | [109] | CR = Total Cash Inflows − Total Cash Outflows | |||||
| Land productivity (LandP) | * | [110,111] | ; P: Total production income (per acre) GP: Government payments (per acre) SI: Secondary income (per acre, e.g., hunting leases) AY: Adjusted yield per acre SLF: Share lease factor (typically 1/3 or 0.33) | ||||||
| Farmers reference price (FRP) | Currency unit | * | [50] | Data | |||||
| Access to markets (AM) | * | [112,113] | Data | ||||||
| * | * | [114] | |||||||
| Road density (RD) | RD/country | * | [115] | ; Total LR: Total length of road network (km2) LR: Land area (km2) | |||||
| Transport cost | Currency unit × ton agro-material−1 | * | [116] | Data: These would include mode of transportation, distance traveled, type of goods, and other logistical considerations | |||||
| Grocery store density (GSD) | GS/100,000 people | * | * | [113] | ; GS: Total number of grocery stores in the area, and Population: Total population of the area. | ||||
| Gross domestic product (GDP) | Currency unit/country | * | * | [117] | Cs: Consumption; In: Investment; Gs: Government spending; Ne: Net Exports | ||||
| Material | Cost of fertilizer, equipment, and machines | Currency unit | * | [118] | Data | ||||
| Storage facilities (SF) | Number of facilities | * | [97] | Data: Farmer surveys project records [119] | |||||
| Cold infrastructure storage (CIS) | * | [120] | Data: Farmer surveys project records [119] | ||||||
| Material for packaging | * | * | [120] | Data | |||||
| Pre-cooling facilities | * | [121] | Data: Farmer surveys project records [119] | ||||||
| Variable and fixed costs | * | * | [122] | Variable costs: labor costs (paid and unpaid) + material costs Fixed Costs: land charge + costs of certification + costs of own capital | |||||
| Stakeholders | Lead time (Ltime) | * | * | * | [123] | Ltime = the promised delivery date of the product − the actual delivery date of the product | |||
| Delivery flexibility | * | * | [123] | Data: The possibility to change planned delivery dates | |||||
| change in the nutritional value | * | [124] | Data | ||||||
| Number of food exports | * | * | * | [19] | Data | ||||
| Number of food imports | * | * | * | [19] | Data | ||||
| Entrepreneurial orientation | * | * | * | [125] | Data | ||||
| Number of agricultural raw materials exports | * | * | * | [19] | Data | ||||
| Number of agricultural raw materials imports | * | * | * | [19] | Data | ||||
| Degree of quality performance of collaboration | * | [126] | Data | ||||||
| Human | Labor intensity (Lint.) | h/wage | * | [70] | Data: Laborers’ time per hectare, wage value and hours of work per wage; [70] | ||||
| Labor productivity (LaborP) | currency unit/person/day | * | [70] | ; Pr: Product value ($) | |||||
| Child labor costs | currency unit | * | [49,122] | Data | |||||
| Costs of hired labor in accordance with international labor standards | currency unit | * | [122] | Total workings day X (minimum wage in accordance with international standards—paid wages) | |||||
| Food self-sufficiency | * | [70] | Data: Caloric production necessary for the household supplied from the pastures | ||||||
| Labor reduction (LR) | % | * | [70] | ; | |||||
| Total off-farm labor performed | hr year–1 | * | [127] | Data [128]. | |||||
| Hired labor | hr year–1 | * | [127] | Data | |||||
| Intellectual | % Use of agriculture education (AEDU) | %/country | * | [113] | NF: Number of farmers who received technical education. TF: Total number of farmers. | ||||
| Use of production technology | * | * | [108] | Data | |||||
| % Project supported by the governmental (PSG) | %PSG/Time period | * | * | [118] | ; | ||||
| % Project supported by the Private investment (PSPI) | %PSPI/Time period | * | * | [68] | ; | ||||
| Education level | * | [129] | Data | ||||||
| Shareholders | Concept of management—Cash conversion cycle (CCC) | number of days/companies | * | [130] | The indicator of how long cash is tied up between procurement and sales developed CCC = DIO + DSO − DPO DIO: Days of inventory outstanding DSO: Days sales (receivables) outstanding DPO: Days payables outstanding |
| Ca | Indicator | Unit | SH | TC | ST | PL | CS | Ref | Formula |
|---|---|---|---|---|---|---|---|---|---|
| Social (external + internal) | Healthiness index (HI) | % | * | [131] | ; [131] MPF: Total score of subgroups of minimally processed foods sold UPF: Total score of subgroups of ultra-processed foods not sold | ||||
| Organic food consumption (OFC) | %/week | * | [132] | ; | |||||
| Dietary diversity | %/country | * | * | [113] | PFD: Those who, according to the Food Diversity Score, consume more than six food types each day | ||||
| Number of new employees per year | * | [133] | Data | ||||||
| Number of contracts with buyers | * | [134] | Data | ||||||
| Participation in cooperative organization | * | [110] | Data | ||||||
| Match supply to demand (MS-d); | %/company or country | * | * | [135] | ; | ||||
| Food security | % | * | [136] | Data: % of the population that is food secure [113] | |||||
| Household hunger Scale | * | [137] | Data: | ||||||
| Access to health insurance programs (AHP) | Employee/country | * | [138] | ; Numhi: Number of employees and owners with health insurance Numeo: Number of employees and owners | |||||
| Number of social network | * | * | * | * | * | [139,140,141] | Data | ||
| Number | * | [118] | |||||||
| Degree purchase behavior | Purchase number/period | * | [142,143] | Data | |||||
| Number of participations in actions | Number of actions/years | * | * | * | Data | ||||
| Local availability of products (Lap) | %/period | * | * | * | * | * | ; N.T.F.: Number of local agrifood purchased products per product category per month T.N.F.: Total number of agrifood purchased products per product category per month | ||
| % of permanent employees for the agriculture activity per year (peas) | % of peans/year | * | * | ; | |||||
| Relational | Coordination degree | * | [120] | Data | |||||
| Number of collaborations | * | * | * | * | [144,145] | Data | |||
| Customer needs | * | * | * | [60,64,146] | Data | ||||
| * | * | [126] | |||||||
| Gender equity | * | [147] | Data | ||||||
| Trust degree | * | * | [148] | Data | |||||
| * | * | * | [149] | ||||||
| * | * | [150] | |||||||
| Number of followers on the social media (NFSM) | Followers | * | * | * | [151] | Data | |||
| Number of deliveries (ND) | ND/consumer | * | * | * | [152] | Data | |||
| Additional work hours (AWH) | AWH/month | * | * | * | [47] | Data | |||
| % Rural population | %R/country | * | * | * | [19] | ; Rural Population: The number of people living in rural areas. Total Population: The total population of the country or region. | |||
| Image | Net promoter score (NPS) | * | * | * | [148] | ; % Promoters: The percentage of respondents who score 9 or 10 on a scale of 0 to 10 when asked, “How likely are you to recommend our product/service? “ % Detractors: The percentage of respondents who score 0 to 6 on the same scale. | |||
| Local consumption of production (LC) | * | [153] | ; | ||||||
| Local brand value | * | * | * | * | [63] | Data: Recognition and awareness of the brand, perceived quality, examine promotional materials’ content for recurring themes and visuals. | |||
| Enforcement of the law | * | [62] | Data: Legal actions taken, regulatory compliance costs, stakeholder perceptions… | ||||||
| Ethical | Animal-based indicators | * | [154] | Data: Directly measure aspects of animal well-being, such as physiological parameters, behavior, and health. | |||||
| Certifications and labels | Number | * | * | * | [155] | Data: Labels such as organic, non-GMO (Genetically Modified Organism), free-range, and sustainable agriculture certifications provide consumers with assurance that products meet specific ethical standards and production practices. | |||
| % Corporation Social Responsibility (CSR) Initiative | % CSR/ Country | * | [156] | ; CSR: Companies taking responsibility for their social and environmental impacts by implementing ethical sourcing policies |
References
- McGreevy, S.R.; Rupprecht, C.D.; Niles, D.; Wiek, A.; Carolan, M.; Kallis, G.; Tachikawa, M. Sustainable agrifood systems for a post-growth world. Nat. Sustain. 2022, 5, 1011–1017. [Google Scholar] [CrossRef]
- De Carvalho, M.I.; Relvas, S.; Barbosa-Povoa, A.P. A roadmap for sustainability performance assessment in the context of Agri-Food Supply Chain. Sustain. Prod. Consum. 2022, 34, 565–585. [Google Scholar] [CrossRef]
- Araújo, R.G.; Chavez-Santoscoy, R.A.; Parra-Saldívar, R.; Melchor-Martínez, E.M.; Iqbal, H.M. Agro-food systems and environment: Sustaining the unsustainable. Curr. Opin. Environ. Sci. Health 2023, 31, 100413. [Google Scholar] [CrossRef]
- User Manual Beta Version 2.1.50. In Sustainability Assessment of Food and Agriculture Systems; FAO: Rome, Italy, 2014.
- Sannou, R.O.; Kirschke, S.; Günther, E. Integrating the social perspective into the sustainability assessment of agri-food systems: A review of indicators. Sustain. Prod. Consum. 2023, 39, 175–190. [Google Scholar] [CrossRef]
- Moreno-Miranda, C.; Dries, L. Integrating coordination mechanisms in the sustainability assessment of agri-food chains: From a structured literature review to a comprehensive framework. Ecol. Econ. 2022, 192, 107265. [Google Scholar] [CrossRef]
- Baue, B. From Monocapitalism to Multicapitalism: 21st Century System Value Creation. 2020. Available online: https://www.r3-0.org/wp-content/uploads/2020/12/r3-0-White-Paper-1-2020-From-Monocapitalism-to-Multicapitalism.pdf (accessed on 20 June 2024).
- Adams, C.; Coulson, A.; Emmelkamp, T.; Greveling, R.; Kluth, G.; Nugent, M.; Capitals Background Paper for Integrated Reporting. The International Integrated Reporting Council. 2013. Available online: https://integratedreporting.ifrs.org/wp-content/uploads/2013/03/IR-Background-Paper-Capitals.pdf (accessed on 10 July 2024).
- McElroy, M.W.; Thomas, M.P. The multicapital scorecard. Sustain. Account. Manag. Policy J. 2015, 6, 425–438. [Google Scholar] [CrossRef]
- Amamou, A.; Sidhom, L.; Zouari, A.; Mami, A. Sustainability-based Multi-capital Approach for the Agri-Food Supply Chain: Research Trends Based on Bibliometric Review. In Proceedings of the International Conference on Innovations in Intelligent Systems and Applications (INISTA), Hammamet, Tunisia, 20–23 September 2023. [Google Scholar]
- Steblyanskayaa, A.N.; Aib, M.; Efimovac, O.V.; Kleinerd, G.B.; Rybachuke, M.A. Multi-capital approach for sustainable growth: Experience from the oil and gaz companies. Фuнaнcы Teopuя Пpaкmuкa 2022, 26, 29–43. [Google Scholar]
- Doni, F.; Larsen, M.; Bianchi Martini, S.; Corvino, A. Exploring integrated reporting in the banking industry: The multiple capitals approach. J. Intellect. Cap. 2019, 20, 165–188. [Google Scholar] [CrossRef]
- Fordham, A.E.; Robinson, G.M.; Cleary, J.; Blackwell, B.D.; Van Leeuwen, J. Use of a multiple capital framework to identify improvements in the CSR strategies of Australian resource companies. J. Clean. Prod. 2018, 200, 704–730. [Google Scholar] [CrossRef]
- Bellahirich, S.; Amamou, A.; Sidhom, L.; Mami, A. Sustainability Indicators for Evaluating the Activities of a Home Delivery Company: A Tunisian Case Study. In Proceedings of the 15th IEEE International conference of Logistics and Supply Chain Management (LOGISTIQUA), Sousse, Tunisia, 2–4 May 2024. [Google Scholar]
- Longo, F.; Nicoletti, L.; Padovano, A.; Fusto, C.; Gazzaneo, L.; di Matteo, R. Multi-capitals sustainability for firms’ competitiveness. In Proceedings of the 20th International Conference on Harbour, Maritime Multimodal Logistics Modelling and Simulation, HMS 2018, Budapest, Hungary, 17–19 September 2018; pp. 83–90. [Google Scholar]
- Agnusdei, G.P.; Coluccia, B.; Pacifico, A.M.; Miglietta, P.P. Towards circular economy in the agrifood sector: Water footprint assessment of food loss in the Italian fruit and vegetable supply chains. Ecol. Indic. 2022, 137, 108781. [Google Scholar] [CrossRef]
- Kumar, M.; Sharma, M.; Raut, R.D.; Mangla, S.K.; Choubey, V.K. Performance assessment of circular driven sustainable agri-food supply chain towards achieving sustainable consumption and production. J. Clean. Prod. 2022, 372, 133698. [Google Scholar] [CrossRef]
- Havardi-Burger, N.; Mempel, H.; Bitsch, V. Framework for sustainability assessment of the value chain of flowering potted plants for the German market. J. Clean. Prod. 2021, 329, 129684. [Google Scholar] [CrossRef]
- Ruiz-Almeida, A.; Rivera-Ferre, M.G. Internationally-based indicators to measure Agri-food systems sustainability using food sovereignty as a conceptual framework. Food Secur. 2019, 11, 1321–1337. [Google Scholar] [CrossRef]
- Yadav, V.S.; Singh, A.R.; Gunasekaran, A.; Raut, R.D.; Narkhede, B.E. A systematic literature review of the agro-food supply chain: Challenges, network design, and performance measurement perspectives. Sustain. Prod. Consum. 2022, 29, 685–704. [Google Scholar] [CrossRef]
- Silvestri, C.; Silvestri, L.; Piccarozzi, M.; Ruggieri, A. Toward a framework for selecting indicators of measuring sustainability and circular economy in the agri-food sector: A systematic literature review. Int. J. Life Cycle Assess. 2024, 29, 1446–1484. [Google Scholar] [CrossRef]
- Bathaei, A.; Štreimikienė, D. A Systematic Review of Agricultural Sustainability Indicators. Agriculture 2023, 13, 241. [Google Scholar] [CrossRef]
- Gega, M.; Höhler, J.; Bijman, J.; Oude Lansink, A.G. The relationship of firm ownership structure and sustainability performance in agri-food chains: A systematic literature review. Clean. Logist. Supply Chain 2024, 13, 100193. [Google Scholar] [CrossRef]
- Borsotto, P.; Cagliero, R.; Giarè, F.; Giordani, G.; Iacono, R.; Manetti, I.; Sardone, R. Measuring short food supply chain sustainability: A selection of attributes and indicators through a qualitative approach. Agriculture 2023, 13, 646. [Google Scholar] [CrossRef]
- Chabouh, S.; Sidhom, L.; Amamou, A.; Mami, A.K. Agri-food supply chain sustainability from the consumer perspective: A survey-based study in the Tunisian context. In Proceedings of the 20th International Multidisciplinary Modeling Simulation Multiconference, Athens, Greece, 18–20 September 2023. [Google Scholar]
- Pomi, S.S.; Sarkar, S.M.; Dhar, B.K. Human or physical capital, which influences sustainable economic growth most? A study on Bangladesh. Can. J. Bus. Inf. Stud. 2021, 3, 101–108. [Google Scholar]
- Porritt, J. Capitalism as if the World Matters, 1st ed.; Routledge: London, UK, 2007. [Google Scholar]
- Armour, J. Share capital and creditor protection: Efficient rules for a modern company law. Mod. Law Rev. 2000, 63, 355–378. [Google Scholar] [CrossRef]
- Hatherly, D.; Mitchell, R.K.; Mitchell, J.R.; Lee, J.H. Reimagining profits and stakeholder capital to address tensions among stakeholders. Bus. Soc. 2020, 59, 322–350. [Google Scholar] [CrossRef]
- Crook, T.R.; Todd, S.Y.; Combs, J.G.; Woehr, D.J.; Ketchen, D.J., Jr. Does human capital matter? A meta-analysis of the relationship between human capital and firm performance. J. Appl. Psychol. 2011, 96, 443. [Google Scholar] [CrossRef]
- Udin, N.M.; Bahamman, S.M. The impact of intellectual capital on the financial performance of listed Nigerian food products companies. J. Account. Tax. 2017, 9, 147–160. [Google Scholar]
- Stewart, T.A. Intellectual Capital: The New Wealth of Organization; Doubleday/Currency: Broadway, NY, USA, 2010. [Google Scholar]
- Cuevas-Rodríguez, G.; Cabello-Medina, C.; Carmona-Lavado, A. Internal and external social capital for, radical product innovation: Do they always work well together? Br. J. Manag. 2014, 25, 266–284. [Google Scholar] [CrossRef]
- Nahapiet, J.; Ghoshal, S. Social capital, intellectual capital, and the organizational advantage. Acad. Manag. Rev. 1998, 23, 242–266. [Google Scholar] [CrossRef]
- Barroso-Castro, C.; Villegas-Periñan, M.D.M.; Casillas-Bueno, J.C. How boards’ internal and external social capital interact to affect firm performance. Strateg. Organ. 2016, 14, 6–31. [Google Scholar] [CrossRef]
- Dyer, J.H.; Singh, H. The Relational View: Cooperative Strategy and Sources of Interorganizational Competitive Advantage. Acad. Manag. Rev. 1998, 23, 660–679. [Google Scholar] [CrossRef]
- Barth, M.E.; Clement, M.B.; Foster, G.; Kasznik, R. Brand values and capital market valuation. Rev. Account. Stud. 1998, 3, 41–68. [Google Scholar] [CrossRef]
- Foster, D.; Seanor, P. Ethical Capital: The Neglected Aspect in the Conceptualisation of Social Enterprise. In Proceedings of the Social Entrepreneurship Research Conference, South Bank University, London, UK, 26–27 June 2008. [Google Scholar]
- Prabakaran, M. Ethical Capital: A Paradigm Shift in Economic Thought; IMS Unison University: Dehradun, India, 2024; Preprint. [Google Scholar] [CrossRef]
- Zawacki-Richter, O.; Kerres, M.; Bedenlier, S.; Bond, M.; Buntins, K. Systematic Reviews in Educational Research: Methodology, Perspectives and Application; Springer: Berlin/Heidelberg, Germany, 2020; p. 161. [Google Scholar]
- Khan, M.; Papadas, D.; Arnold, L.; Behrendt, K. Sustainability challenges in the multi-tier crop agri-food sector: A systematic review. Agric. Food Econ. 2024, 12, 25. [Google Scholar] [CrossRef]
- Page, M.J.; McKenzie, J.E.; Bossuyt, P.M.; Boutron, I.; Hoffmann, T.C.; Mulrow, C.D.; Moher, D. The PRISMA 2020 statement: An updated guideline for reporting systematic reviews. Br. Med. J. 2021, 372, n71. [Google Scholar] [CrossRef]
- Károly, K. Rise and fall of the concept sustainability. J. Environ. Sustain. 2011, 1, 1. [Google Scholar] [CrossRef]
- Dammak, K.; Zouari, A.; Sidhom, L. Overcoming Barriers of Sustainable Agrifood Supply Chain Through Conservation Agriculture and Multi-Capital Sustainability. In Proceedings of the 15th IEEE International Conference of Logistics and Supply Chain Management (LOGISTIQUA), Sousse, Tunisia, 2–4 May 2024. [Google Scholar]
- Lezoche, M.; Hernandez, J.E.; Díaz, M.D.M.E.A.; Panetto, H.; Kacprzyk, J. Agri-food 4.0: A survey of the supply chains and technologies for the future agriculture. Comput. Ind. 2019, 117, 103187. [Google Scholar] [CrossRef]
- Chandrasiri, C.; Dharmapriya, S.; Jayawardana, J.; Kulatunga, A.K.; Weerasinghe, A.N.; Aluwihare, C.P.; Hettiarachchi, D. Mitigating Environmental Impact of Perishable Food Supply Chain by a Novel Configuration: Simulating Banana Supply Chain in Sri Lanka. Sustainability 2022, 14, 12060. [Google Scholar] [CrossRef]
- Petit, G.; Yannou-Le Bris, G.; Trystram, G. Codesign of sustainable performance objectives in a food value chain. In Proceedings of the ICED17, Vancouver, BC, Canada, 21–25 August 2017; pp. 289–297. [Google Scholar]
- Gamboa, C.; Bojacá, C.R.; Schrevens, E.; Maertens, M. Sustainability of smallholder quinoa production in the Peruvian Andes. J. Clean. Prod. 2020, 264, 121657. [Google Scholar] [CrossRef]
- Stuart, A.M.; Devkota, K.P.; Sato, T.; Pame, A.R.P.; Balingbing, C.; Phung, N.T.M.; Singleton, G.R. On-farm assessment of different rice crop management practices in the Mekong Delta, Vietnam, using sustainability performance indicators. Field Crops Res. 2018, 229, 103–114. [Google Scholar] [CrossRef]
- Yani, M.; Asrol, M.; Hambali, E.; Papilo, P.; Mursidah, S.; Marimin, M. An adaptive fuzzy multi-criteria model for sustainability assessment of sugarcane agroindustry supply chain. IEEE Access 2022, 10, 5497–5517. [Google Scholar] [CrossRef]
- Fuentes, M.; Negrete, M.; Herrera-León, S.; Kraslawski, A. Classification of indicators measuring environmental sustainability of mining and processing of copper. Miner. Eng. 2021, 170, 107033. [Google Scholar] [CrossRef]
- Hasanuzzaman, M.; Kumar, L. Energy Supply. In Energy for Sustainable Development; Academic Press: Cambrige, MA, USA, 2020; pp. 89–104. [Google Scholar]
- Wilson, C.; Tisdell, C. Why farmers continue to use pesticides despite environmental, health and sustainability costs. Ecol. Econ. 2001, 39, 449–462. [Google Scholar] [CrossRef]
- Barbosa, M.W.; Cansino, J.M. A Water Footprint Management Construct in Agri-Food Supply Chains: A Content Validity Analysis. Sustainability 2022, 14, 4928. [Google Scholar] [CrossRef]
- Uhlenbrook, S.; Yu, W.; Schmitter, P.; Smith, D.M. Optimising the water we eat—Rethinking policy to enhance productive and sustainable use of water in agri-food systems across scales. Lancet Planet. Health 2022, 6, e59–e65. [Google Scholar] [CrossRef]
- Yoder, L.; Chowdhury, R.R. Tracing social capital: How stakeholder group interactions shape agricultural water quality restoration in the Florida Everglades. Land Use Policy 2018, 77, 354–361. [Google Scholar] [CrossRef]
- Yang, H.; Fulton, L.; Kendall, A. A Review of charging infrastructure requirements for US electric light-duty vehicles. Renew. Sustain. Energy Rev. 2024, 200, 114608. [Google Scholar] [CrossRef]
- Bengtsson, J.; Bullock, J.M.; Egoh, B.; Everson, C.; Everson, T.; O’connor, T.; Lindborg, R. Grasslands—More important for ecosystem services than you might think. Ecosphere 2019, 10, e02582. [Google Scholar] [CrossRef]
- Talukder, B.; Agnusdei, G.P.; Hipel, K.W.; Dubé, L. Multi-indicator supply chain management framework for food convergent innovation in the dairy business. Sustain. Futures 2021, 3, 100045. [Google Scholar] [CrossRef]
- Mesías, F.J.; Martín, A.; Hernández, A. Consumers’ growing appetite for natural foods: Perceptions towards the use of natural preservatives in fresh fruit. Food Res. Int. 2021, 150, 110749. [Google Scholar] [CrossRef]
- Ngqangweni, S.; Mmbengwa, V.; Myeki, L.; Sotsha, K.; Khoza, T. Measuring and tracking smallholder market access in South Africa; National Agricultural Marketing Council Working Paper (NAMC/WP/2016/03). In Proceedings of the NAMC Seminar, Pretoria, South Africa, 4 April 2016. [Google Scholar]
- Govindan, K.; Shaw, M.; Majumdar, A. Social sustainability tensions in multi-tier supply chain: A systematic literature review towards conceptual framework development. J. Clean. Prod. 2021, 279, 123075. [Google Scholar] [CrossRef]
- Tang, J.W.; Chen, M.L.; Chiu, T.H. An exploratory study on local brand value development for outlying island agriculture: Local food system and actor–network theory perspectives. Sustainability 2018, 10, 4186. [Google Scholar] [CrossRef]
- Fesharaki, M.H.; Safarzadeh, H. Modeling the Sustainable Supply Chain Network Design for Food-Agricultural Industries considering Social and Environmental Impacts. Comput. Intell. Neurosci. 2022, 2022, 6726662. [Google Scholar] [CrossRef]
- Georgakakos, C.B.; Hicks, B.J.; Walter, M.T. Farmer perceptions of dairy farm antibiotic use and transport pathways as determinants of contaminant loads to the environment. J. Environ. Manag. 2021, 281, 111880. [Google Scholar] [CrossRef]
- Reina-Usuga, L.; Parra-López, C.; de Haro-Giménez, T.; Carmona-Torres, C. Sustainability assessment of territorial short food supply chains versus large-scale food distribution: The case of Colombia and Spain. Land Use Policy 2023, 126, 106529. [Google Scholar] [CrossRef]
- Mardenli, A.; Sackmann, D. Smallholders and the Impact of the Agri-food Supply Chain. In Proceedings of the 17th International Doctoral Students Workshop on Logistics, Supply Chain and Production Management, Magdeburg, Germany, 18 June 2024; pp. 95–103. [Google Scholar]
- Negra, C.; Remans, R.; Attwood, S.; Jones, S.; Werneck, F.; Smith, A. Sustainable agri-food investments require multi-sector co-development of decision tools. Ecol. Indic. 2020, 110, 105851. [Google Scholar] [CrossRef]
- Yu, W. Human Capital, Social Capital and Economic Growth. Athens J. Soc. Sci. 2015, 2, 161–172. [Google Scholar] [CrossRef]
- Motta-Delgado, P.A.; Ocaña Martínez, H.E.; Rojas-Vargas, E.P. Indicators associated to pastures sustainability: A review. Cienc. Tecnol. Agr. 2019, 20, 387–430. [Google Scholar]
- FAO. Progress on Change in Water-Use Efficiency: Global Status and Acceleration Needs for SDG Indicator 6.4.1; FAO: Rome, Italy, 2021. [Google Scholar]
- Masi, A.; Ciccullo, F.; Pero, M. Digitalizing Agri-Food Supply Chains to Achieve Sustainable Development Goals: A systematic Literature Review. In Proceedings of the International Conference on Engineering, Technology and Innovation (ICE/ITMC) IEEE, Cardiff, UK, 14–16 June 2021. [Google Scholar]
- Djekic, I.; Batlle-Bayer, L.; Bala, A.; Fullana-i-Palmer, P.; Jambrak, A.R. Role of the food supply chain stakeholders in achieving UN SDGs. Sustainability 2021, 13, 9095. [Google Scholar] [CrossRef]
- Rodrigues, G.S.; Martins, C.R.; de Barros, I. Sustainability assessment of ecological intensification practices in coconut production. Agric. Syst. 2018, 165, 71–84. [Google Scholar] [CrossRef]
- Mukhlis, M.; Noer, M.; Nofialdi, N.; Mahdi, M. Comparison of External and Internal Inputs Usage Based on Enterprises Scale on Rice-cattle Integration Systems Farming. Asian J. Sci. Res. 2020, 13, 9–17. [Google Scholar]
- Modernel, P.; Dogliotti, S.; Alvarez, S.; Corbeels, M.; Picasso, V.; Tittonell, P.; Rossing, W.A. Identification of beef production farms in the Pampas and Campos area that stand out in economic and environmental performance. Ecol. Indic. 2018, 89, 755–770. [Google Scholar] [CrossRef]
- AMCRA. Analysis of Antibiotic Use. Retrieved. September 2024. Available online: https://amcra.be/en/analysis-of-antibiotic-use/ (accessed on 13 April 2025).
- SRP. Sustainable Rice Platform: Performance Indicators for Sustainable Rice Cultivation, Version 1.0. Bangkok, Thailand. 2015, p. 26. Available online: https://www.sustainablerice.org (accessed on 18 July 2024).
- White, P.J.; Bell, M.J.; Djalovic, I.; Hinsinger, P.; Rengel, Z. Potassium use efficiency of plants. In Improving Potassium Recommendations for Agricultural Crops; Murrell, T.S., Mikkelsen, R.L., Sulewski, G., Norton, R., Thompson, M.L., Eds.; Springer: Cham, Switzerland, 2021; pp. 119–145. [Google Scholar]
- Valenti, W.C.; Kimpara, J.M.; Preto, B.D.L.; Moraes-Valenti, P. Indicators of sustainability to assess aquaculture systems. Ecol. Indic. 2018, 88, 402–413. [Google Scholar] [CrossRef]
- Cabral, P.; Campos, F.S.; David, J.; Caser, U. Disentangling ecosystem services perception by stakeholders: An integrative assessment based on land cover. Ecol. Indic. 2021, 126, 107660. [Google Scholar] [CrossRef]
- Thomas, C.; Maître, I.; Picouet, P.A.; Symoneaux, R. Organic consumers’ perceptions of environmental impacts of food overlap only partially with those considered by life cycle assessment. J. Clean. Prod. 2021, 298, 126676. [Google Scholar] [CrossRef]
- Cai, G.; Zhang, J.; Du, M.; Li, C.; Peng, S. Identification of urban land use efficiency by indicator-SDG 11.3.1. PLoS ONE 2020, 15, e0244318. [Google Scholar] [CrossRef]
- Andriyani, I.; Jourdain, D.; Lidon, B.; Soni, P.; Kartiwa, B. Upland farming system erosion yields and their constraints to change for sustainable agricultural conservation practices: A case study of Land Use and Land Cover (LULC) change in Indonesia. Land Degrad. Dev. 2017, 28, 421–430. [Google Scholar] [CrossRef]
- Van Oers, L.; Guinée, J. The abiotic depletion potential: Background, updates, and future. Resources 2016, 5, 16. [Google Scholar] [CrossRef]
- Galgani, P.; Woltjer, G.; de Adelhart Toorop, R.; Groot Ruiz, A. Fossil Fuel and Other Non-Renewable Material Depletion: True Pricing Method for Agri-Food Products; Wageningen University Research: Wageningen, The Netherlands, 2021; Available online: https://edepot.wur.nl/558072 (accessed on 2 February 2024).
- Galati, A.; Giacomarra, M.; Concialdi, P.; Crescimanno, M. Exploring the feasibility of introducing electric freight vehicles in the short food supply chain: A multi-stakeholder approach. Case Stud. Transp. Policy 2021, 9, 950–957. [Google Scholar] [CrossRef]
- Sutcliffe, C.; Knox, J.; Hess, T. I think this is where this lovely word “sustainability” comes in: Fruit and vegetable growers narratives concerning the regulation of environmental water use for food production. Sociol. Rural. 2023, 63, 493–513. [Google Scholar] [CrossRef]
- S.D.G. Sustainable Development Goals: SDG indicator metadata. Goal 6: Ensure Availability and Sustainable Management of Water and Sanitation for All 2024, Target 6.4, Indicator 6.4.1. Available online: https://unstats.un.org/sdgs/metadata/files/metadata-06-04-01.pdf (accessed on 2 August 2024).
- Razzaq, A.; Qing, P.; Abid, M.; Anwar, M.; Javed, I. Can the informal groundwater markets improve water use efficiency and equity? Evidence from a semi-arid region of Pakistan. Sci. Total Environ. 2019, 666, 849–857. [Google Scholar] [CrossRef] [PubMed]
- Brauman, K.A.; Richter, B.D.; Postel, S.; Malsy, M.; Flörke, M. Water depletion: An improved metric for incorporating seasonal and dry-year water scarcity into water risk assessments. Elementa 2016, 4, 83. [Google Scholar] [CrossRef]
- Nouri, H.; Stokvis, B.; Galindo, A.; Blatchford, M.; Hoekstra, A.Y. Water scarcity alleviation through water footprint reduction in agriculture: The effect of soil mulching and drip irrigation. Sci. Total Environ. 2019, 653, 241–252. [Google Scholar] [CrossRef]
- Kaewmai, R.; Grant, T.; Mungkalasiri, J.; Musikavong, C. Assessing the water scarcity footprint of food crops by growing season available water remaining (AWARE) characterization factors in Thailand. Sci. Total Environ. 2021, 763, 143000. [Google Scholar] [CrossRef]
- Li, X.; Zhang, X.; Niu, J.; Tong, L.; Kang, S.; Du, T.; Ding, R. Irrigation water productivity is more influenced by agronomic practice factors than by climatic factors in Hexi Corridor, Northwest China. Sci. Rep. 2016, 6, 37971. [Google Scholar] [CrossRef]
- Zhang, Y.; Li, M.; Dong, J.; Yang, H.; Van Zwieten, L.; Lu, H.; Wang, H. A critical review of methods for analyzing freshwater eutrophication. Water 2021, 13, 225. [Google Scholar] [CrossRef]
- Švajlenka, J.; Kozlovská, M.; Spišáková, M. The benefits of modern method of construction based on wood in the context of sustainability. Int. J. Environ. Sci. Technol. 2017, 14, 1591–1602. [Google Scholar] [CrossRef]
- Azadi, H.; Moghaddam, S.M.; Burkart, S.; Mahmoudi, H.; Van Passel, S.; Kurban, A.; Lopez-Carr, D. Rethinking resilient agriculture: From climate-smart agriculture to vulnerable-smart agriculture. J. Clean. Prod. 2021, 319, 128602. [Google Scholar] [CrossRef]
- Waldhans, C.; Albrecht, A.; Ibald, R.; Wollenweber, D.; Sy, S.J.; Kreyenschmidt, J. Temperature Control and Data Exchange in Food Supply Chains: Current Situation and the Applicability of a Digitalized System of Time–Temperature-Indicators to Optimize Temperature Monitoring in Different Cold Chains. J. Packag. Technol. Res. 2024, 8, 79–93. [Google Scholar] [CrossRef]
- Solomon, S.; Wuebbles, D.; Isaksen, I.; Kiehl, J.; Lal, M.; Simon, P.; Sze, N.-D.; Albritton, D.; Bruhl, C.; Connell, P.; et al. Ozone Depletion Potentials, Global Warming Potentials, and Future Chlorine/Bromine Loading 1995; Ennis, C.A., Ed.; Scientific Assessment of Ozone Depletion; World Meteorological Organization: Geneva, Switzerland, 1994. [Google Scholar]
- De Souza, E.D.; Kerber, J.C.; Bouzon, M.; Rodriguez, C.M.T. Performance evaluation of green logistics: Paving the way towards circular economy. Clean. Logist. Supply Chain 2022, 3, 100019. [Google Scholar] [CrossRef]
- Lehn, F.; Goossens, Y.; Schmidt, T. Economic and environmental assessment of food waste reduction measures–Trialing a time-temperature indicator on salmon in HelloFresh meal boxes. J. Clean. Prod. 2023, 392, 136183. [Google Scholar] [CrossRef]
- De Boni, A.; Ottomano Palmisano, G.; De Angelis, M.; Minervini, F. Challenges for a Sustainable Food Supply Chain: A Review on Food Losses and Waste. Sustainability 2022, 14, 16764. [Google Scholar] [CrossRef]
- Setsoafia, E.D.; Ma, W.; Renwick, A. Effects of sustainable agricultural practices on farm income and food security in northern Ghana. Agric. Food Econ. 2022, 10, 1–15. [Google Scholar] [CrossRef]
- S.D.G. Sustainable Development Goals: SDG indicator metadata. Goal 11: Make Cities and Human Settlements Inclusive 2021, Safe, Resilient and Sustainable, Target 11.6, Indicator 11.6.1. Available online: https://www.pcbs.gov.ps/SDGs/Goal11/English/Metadata/110601.pdf (accessed on 14 July 2024).
- Williams, P.A.; Karanja Ng’ang’a, S.; Crespo, O.; Abu, M. Cost and benefit analysis of adopting climate adaptation practices among smallholders: The case of five selected practices in Ghana. Clim. Serv. 2020, 20, 100198. [Google Scholar] [CrossRef]
- Rashid Javed Payback Method. 2023. Available online: https://www.accountingformanagement.org/payback-method/ (accessed on 6 July 2024).
- Millennium Challenge Corporation. Access to Credit. Millennium Challenge Corporation. July 2023. Available online: https://www.mcc.gov/who-we-select/indicators/ (accessed on 6 July 2024).
- Kotu, B.H.; Oyinbo, O.; Hoeschle-Zeledon, I.; Nurudeen, A.R.; Kizito, F.; Boyubie, B. Smallholder farmers’ preferences for sustainable intensification attributes in maize production: Evidence from Ghana. World Dev. 2022, 152, 105789. [Google Scholar] [CrossRef]
- Siluthanyi, M.; Pradhan, A.; Yahia, Z. Scenario Analysis for Supply Chain Management of Milled Grain Products in South Africa: A System Dynamics Approach. Oper. Supply Chain Manag. Int. J. 2024, 17, 142–163. [Google Scholar] [CrossRef]
- Sarkar, D.; Singh, S.; Parihar, M.; Rakshit, A. Seed bio-priming with microbial inoculants: A tailored approach towards improved crop performance, nutritional security, and agricultural sustainability for smallholder farmers. Curr. Res. Environ. Sustain. 2021, 3, 100093. [Google Scholar] [CrossRef]
- Junior, A.N.; de Oliveira, M.C.; Helleno, A.L. Sustainability evaluation model for manufacturing systems based on the correlation between triple bottom line dimensions and balanced scorecard perspectives. J. Clean. Prod. 2018, 190, 84–93. [Google Scholar] [CrossRef]
- Connolly, R.; Bogue, J.; Repar, L. Farmers’ markets as resilient alternative market structures in a sustainable global food system: A small firm growth perspective. Sustainability 2022, 14, 11626. [Google Scholar] [CrossRef]
- De Carvalho, A.M.; Verly, E., Jr.; Marchioni, D.M.; Jones, A.D. Measuring sustainable food systems in Brazil: A framework and multidimensional index to evaluate socioeconomic, nutritional, and environmental aspects. World Dev. 2021, 143, 105470. [Google Scholar] [CrossRef]
- Latouche, K.; Chevassus-Lozza, E. Retailer supply chain and market access: Evidence from French agri+-food firms certified with private standards. World Econ. 2015, 38, 1312–1334. [Google Scholar] [CrossRef]
- Melesse, M.B.; van den Berg, M.; Béné, C.; de Brauw, A.; Brouwer, I.D. Metrics to analyze and improve diets through food Systems in low- and Middle-Income Countries. Food Secur. 2020, 12, 1085–1105. [Google Scholar] [CrossRef]
- Jonkman, J.; Barbosa-Póvoa, A.P.; Bloemhof, J.M. Integrating harvesting decisions in the design of agro-food supply chains. Eur. J. Oper. Res. 2019, 276, 247–258. [Google Scholar] [CrossRef]
- Haldane, A.; Chowla, S. Fast economic indicators. Nat. Rev. Phys. 2021, 3, 68–69. [Google Scholar] [CrossRef]
- Nooghabi, S.N.; Azadi, H.; Fleskens, L.; Janečková, K.; Sklenička, P.; Witlox, F. Social, economic and environmental vulnerability: The case of wheat farmers in Northeast Iran. Sci. Total Environ. 2022, 816, 151519. [Google Scholar] [CrossRef]
- Diskin, P. Agricultural Productivity Indicators Measurement Guide; Food Security and Nutrition Monitoring (IMPACT) Project; FAO: Rome, Italy, 1997. [Google Scholar]
- Surucu-Balci, E.; Tuna, O. Investigating logistics-related food loss drivers: A study on fresh fruit and vegetable supply chain. J. Clean. Prod. 2021, 318, 128561. [Google Scholar] [CrossRef]
- Saurabh, S.; Dey, K. Blockchain technology adoption, architecture, and sustainable agri-food supply chains. J. Clean. Prod. 2021, 284, 124731. [Google Scholar] [CrossRef]
- Sjauw-Koen-Fa, A.R.; Omta, S.O.; Blok, V. Constructing a multinationals’ inclusive sourcing indicator for impacting farmer business models: Application in cocoa cases. Int. J. Food Syst. Dyn. 2018, 9, 207–225. [Google Scholar] [CrossRef]
- Stranieri, S.; Riccardi, F.; Meuwissen, M.P.; Soregaroli, C. Exploring the impact of blockchain on the performance of agri-food supply chains. Food Control 2021, 119, 107495. [Google Scholar] [CrossRef]
- Lovegrove, J.A.; O’Sullivan, D.M.; Tosi, P.; Millan, E.; Todman, L.C.; Bishop, J.; Tebbit, M. ‘Raising the Pulse’: The environmental, nutritional and health benefits of pulse-enhanced foods. Nutr. Bull. 2023, 48, 134–143. [Google Scholar] [CrossRef]
- Syamsari, S.; Ramaditya, M.; Andriani, I.; Puspitasari, A. Selecting Priority Policy Strategies for Sustainability of Micro, Small, and Medium Enterprises in Takalar Regency. Sustainability 2022, 14, 15791. [Google Scholar] [CrossRef]
- Wicaksono, T.; Illés, C.B. From resilience to satisfaction: Defining supply chain solutions for agri-food SMEs through quality approach. PLoS ONE 2022, 17, e0263393. [Google Scholar] [CrossRef]
- Ditzler, L.; Komarek, A.M.; Chiang, T.W.; Alvarez, S.; Chatterjee, S.A.; Timler, C.; Groot, J.C. A model to examine farm household trade-offs and synergies with an application to smallholders in Vietnam. Agric. Syst. 2019, 173, 49–63. [Google Scholar] [CrossRef]
- Sumner, D.A. The off-farm labor supply of farmers. Am. J. Agric. Econ. 1982, 64, 499–509. [Google Scholar] [CrossRef]
- Chrisendo, D.; Siregar, H.; Qaim, M. Oil palm cultivation improves living standards and human capital formation in smallholder farm households. World Dev. 2022, 159, 106034. [Google Scholar] [CrossRef]
- Toušek, Z.; Hinke, J.; Malinská, B.; Prokop, M. Shareholder Value Generation within the Agro-Food Financial Supply Chain. AGRIS Online Pap. Econ. Inform. 2022, 14, 125–135. [Google Scholar] [CrossRef]
- Tavares, L.F.; Perez, P.M.P.; Dos Passos, M.E.A.; de Castro Junior, P.C.P.; da Silva Franco, A.; de Oliveira Cardoso, L.; de Castro, I.R.R. Development and application of healthiness indicators for commercial establishments that sell foods for immediate consumption. Foods 2021, 10, 1434. [Google Scholar] [CrossRef]
- Hansmann, R.; Baur, I.; Binder, C.R. Increasing organic food consumption: An integrating model of drivers and barriers. J. Clean. Prod. 2020, 275, 123058. [Google Scholar] [CrossRef]
- Rathnayake, S.; Gray, D.; Reid, J.; Ramilan, T. The impacts of the COVID-19 shock on sustainability and farmer livelihoods in Sri Lanka. Curr. Res. Environ. Sustain. 2022, 4, 100131. [Google Scholar] [CrossRef]
- Watteyn, C.; Dejonghe, O.; Van Hoyweghen, K.; Bolanos, J.B.A.; Karremans, A.P.; Vranken, L.; Maertens, M. Exploring farmer preferences towards innovations in the vanilla supply chain. J. Clean. Prod. 2022, 330, 129831. [Google Scholar] [CrossRef]
- Marusak, A.; Sadeghiamirshahidi, N.; Krejci, C.C.; Mittal, A.; Beckwith, S.; Cantu, J.; Grimm, J. Resilient regional food supply chains and rethinking the way forward: Key takeaways from the COVID-19 pandemic. Agric. Syst. 2021, 190, 103101. [Google Scholar] [CrossRef]
- Manikas, I.; Sundarakani, B.; Anastasiadis, F.; Ali, B. A framework for food security via resilient agri-food supply chains: The case of UAE. Sustainability 2022, 14, 6375. [Google Scholar] [CrossRef]
- Kolog, J.D.; Asem, F.E.; Mensah-Bonsu, A. The state of food security and its determinants in Ghana: An ordered probit analysis of the household hunger scale and household food insecurity access scale. Sci. Afr. 2023, 19, e01579. [Google Scholar] [CrossRef]
- Todd, M.; Guetterman, T.; Sigge, G.; Joubert, E. Multi-stakeholder perspectives on food labeling and health claims: Qualitative insights from South Africa. Appetite 2021, 167, 105606. [Google Scholar] [CrossRef]
- Haji, M.; Kerbache, L.; Al-Ansari, T. Food Quality, Drug Safety, and Increasing Public Health Measures in Supply Chain Management. Processes 2022, 10, 1715. [Google Scholar] [CrossRef]
- Rahman, M.T.; Islam, M.S.; Shehata, A.A.; Basiouni, S.; Hafez, H.M.; Azhar, E.I.; Attia, Y.A. Influence of COVID-19 on the sustainability of livestock performance and welfare on a global scale. Trop. Anim. Health Prod. 2022, 54, 309. [Google Scholar] [CrossRef]
- Tansuchat, R.; Suriyankietkaew, S.; Petison, P.; Punjaisri, K.; Nimsai, S. Impacts of COVID-19 on Sustainable Agriculture Value Chain Development in Thailand and ASEAN. Sustainability 2022, 14, 12985. [Google Scholar] [CrossRef]
- Sadeli, A.H.; Perdana, T.; Deliana, Y.; Onggo, B.S. Consumers’ purchase behavior in short food supply chains using social commerce in Indonesia. J. Clean. Prod. 2023, 386, 135812. [Google Scholar] [CrossRef]
- Gutiérrez, J.A.; Macken-Walsh, Á. Ecosystems of Collaboration for Sustainability-Oriented Innovation: The Importance of Values in the Agri-Food Value-Chain. Sustainability 2022, 14, 11205. [Google Scholar] [CrossRef]
- Deng, L.; Zhang, H.; Wang, C.; Ma, W.; Zhu, A.; Zhang, F.; Jiao, X. Improving the sustainability of the wheat supply chain through multi-stakeholder engagement. J. Clean. Prod. 2021, 321, 128837. [Google Scholar] [CrossRef]
- Bhattacharya, A.; Fayezi, S. Ameliorating food loss and waste in the supply chain through multi-stakeholder collaboration. Ind. Mark. Manag. 2021, 93, 328–343. [Google Scholar] [CrossRef]
- Garner, B.; Ayala, C. Consumer supply-chain demands and challenges at farmers’ markets. Br. Food J. 2018, 120, 2734–2747. [Google Scholar] [CrossRef]
- Yang, S.; Zhao, W.; Liu, Y.; Cherubini, F.; Fu, B.; Pereira, P. Prioritizing sustainable development goals and linking them to ecosystem services: A global expert’s knowledge evaluation. Geogr. Sustain. 2020, 1, 321–330. [Google Scholar] [CrossRef]
- Meador, J.E.; O’Brien, D. Placing Rwanda’s agriculture boom: Trust, women empowerment and policy impact in maize agricultural cooperatives. Food Secur. 2019, 11, 869–880. [Google Scholar] [CrossRef]
- Assis, M.T.; Lucas, M.R.; Rainho, M.J.M. A meta-analysis on the trust in agrifood supply chains. Food Front. 2022, 3, 413–427. [Google Scholar] [CrossRef]
- Wu, W.; Zhang, A.; van Klinken, R.D.; Schrobback, P.; Muller, J.M. Consumer trust in food and the food system: A critical review. Foods 2021, 10, 2490. [Google Scholar] [CrossRef]
- Singh, D.; Verma, B.K. The utilisation of social media for accessing farming information by progressive farmers. Bhartiya Krishi Anusandhan Patrika 2023, 38, 290–295. [Google Scholar] [CrossRef]
- Feizizadeh, B.; Omrazadeh, D.; Ghasemi, M.; Bageri, S.; Lakes, T.; Kitzmann, R.; Blaschke, T. Urban restaurants and online food delivery during the COVID-19 pandemic: A spatial and socio-demographic analysis. Int. J. Digit. Earth 2023, 16, 1725–1751. [Google Scholar] [CrossRef]
- Merlino, V.M.; Sciullo, A.; Pettenati, G.; Sottile, F.; Peano, C.; Massaglia, S. “Local Production”: What Do Consumers Think? Sustainability 2022, 14, 3623. [Google Scholar] [CrossRef]
- Comin, M.; Barbieri, S.; Minero, M.; Dalla Costa, E. The feasibility of animal-based indicators of consciousness and unconsciousness for stunning in sheep: A systematic review. Animals 2023, 13, 1395. [Google Scholar] [CrossRef]
- Prell, M.; Zanini, M.T.; Caldieraro, F.; Migueles, C. Sustainability certifications and product preference. Mark. Intell. Plan. 2020, 38, 893–906. [Google Scholar] [CrossRef]
- Mishra, S.P.; Mohanty, M. Exploring Corporate Social Responsibility Initiatives and Their Impact On agricultural sustainability in India: A Comprehensive Study. J. Inform. Educ. Res. 2024, 4, 917–922. [Google Scholar]
| Question | Research Significance |
|---|---|
| RQ1: How widely has MCSA been applied to address sustainability challenges in AFSCs? | Determining the degree of MCSA implementation aids in evaluating its maturity within the agri-food industry and shows how various contexts have included multi-capital thinking. |
| RQ2: What capital and indicators should be considered to characterize the performance of AFSCs while addressing sustainability concerns? | Building a strong framework that can capture the multifaceted character of sustainability in AFSCs is made possible by identifying pertinent types of capital and the indicators that go along with them. |
| RQ3: How can these indicators be effectively evaluated or calculated? | Searching the evaluation techniques that guarantee the chosen indicators are quantifiable, actionable, and comparable across settings. |
| RQ4: How are the sustainability capital and themes connected to particular Sustainable Development Goals (SDGs)? | Mapping capital and themes to particular SDGs further strengthens the alignment between AFSC sustainability assessments and global development targets. |
| Reference | Time Horizon | Scope | N Article | Sustainability Dimension | Categorizations | Indicator | |
|---|---|---|---|---|---|---|---|
| Number | Methodology/Formula | ||||||
| [5] | Completed in August 2021 | Identifying and analyzing social sustainability indicators | 128 | Soc. | 8 themes | 36 | No |
| [6] | 1997–2018 | Sustainability assessment frameworks and indicators measurement | 109 | Env., Eco., Soc. | 40 | No | |
| [19] | 2009–2019 | Food sovereignty framework, database indicators, and its limitations | Env., Eco., Soc. | 6 categories | 97 | No | |
| [20] | 2005–2020 | Challenges, performance indicators, and modeling | 108 | Env., Eco., Soc. | -- | -- | Methodology |
| [21] | 2007–2020 | Indicators selections | 99 | Env., Eco., Soc. | -- | 49 | No |
| [22] | 2010–2022 | Indicators selections | 157 | Env., Eco., Soc. | 101 | No | |
| [2] | 2000–2021 | Categorizations and identifying key subcategories | 142 | Env., Eco., Soc. | 16 categories | 71 | No |
| [23] | 1990–2022 | Conceptualization and metrics selections | 81 | Env., Eco., Soc. | --- | 40 | No |
| Our work | 2017–2024 | A conceptual framework based on multi-capital, categorization by multi-capital, and indicator measurement per actor | 106 | Env., Eco., Soc. | 12 types of capital and 6 categories | 116 | Formula and methodology |
| Dimension | Capital | Description | Role |
|---|---|---|---|
| Environmental | Natural | Refers to the essential resources and ecosystems that provide goods and services necessary for human well-being [7]. | It is essential to maintaining life and human development, but it must be kept within reasonable bounds to prevent going beyond its ability to recover or absorb effects [7]. |
| Economic | Financial | Identifies investments and financial resources that promote value and growth [8]. | Accessible to a company for usage in manufacturing products or rendering services [7]. A business model that prioritizes financial gain may reduce overall value if it depletes more valuable resources, like human effort or natural assets, for short-term profits [7]. |
| Material | Pertains to physical resources such as new infrastructure, raw materials, and technologies [15]. It can also be referred to as physical capital [26] and manufactured capital, which encompasses mainly physical assets, plants, machinery, and equipment [27]. Those are a subset of material capital due to their tangible nature and central role in production processes [8]. | It is vital in reducing risks, improving efficiency, and meeting quality requirements. Such investments are increasingly essential for maintaining competitiveness. | |
| Shareholders | Represents shares owned by the corporation and the dedication to maximizing and protecting asset value for the organization’s and each investor’s long-term growth [15,28]. It is also called share capital [28]. | It is crucial in determining an enterprise’s worth and future direction [15]. | |
| Stakeholders | Highlights the collective interests and contributions of all stakeholders: internal (e.g., employees) and external (e.g., customers, suppliers), emphasizing the interconnected importance of all the actors [15,29]. | Addresses tensions in profit allocation between stockholders and other stakeholders [29]. Maintaining stakeholder capital benefits both the firm and the broader economy by aligning the interests of all parties involved. | |
| Human | It focuses on the individual level and refers to individuals’ ages, experiences, knowledge, and capabilities and their active contribution to work processes. | Drives innovation and productivity through skills and expertise at the individual level [30]. | |
| Intellectual | It focuses on the organizational level and is seen as the total knowledge of an organization’s members. It also examines how this knowledge is practically applied to create valuable assets for the company. It is also known as scholarly capital [31]. | Converts personal knowledge into organizational assets that may be utilized, distributed, and sold, giving an organization a competitive edge [32]. It provides a long-term competitive advantage. | |
| Social | Internal social | Refers to connections between individuals and groups within organizations [15,33]. | Increases internal cooperation and information exchange [34]. |
| External social | This refers to the relationships with other businesses and institutions beyond the organization that impact broader society. Relevant in activities like regional fairs or representing national agriculture [15,33]. | It allows the company to learn from its external partners, improve its processes, and strengthen its organizational capabilities [35]. | |
| Relational | Focuses on value generated from external relationships and their direct contribution to the organization’s value. | Builds loyalty and trust with clients and partners [36]. | |
| Image | It influences how the public views a company/service and is improved by effective communication, strategic brand selection, and promotion of the organization’s activities or services [37]. It is also called brand capital. | Significantly strengthens the company’s ability to generate revenue and drive sales. Higher revenue can result from a stronger brand attracting more clients [37]. | |
| Ethical | It entails a dedication to moral behavior, bolstering social legitimacy and confidence [38]. | Guarantees the adaptability and robustness of economic networks by incorporating moral values like justice, openness, and ecological care [39]. |
| Steps | Decision Point | Rationale | Activity |
|---|---|---|---|
| 1. Search Strategy | Identify where to look | Databases, keywords, type, language, and date of publication | Develop a protocol for conducting systematic searches across multiple sources. |
| 2. Study Selection | Decide what to include | Rigor, relevance, data quality, inclusion/exclusion criteria | Using reference management software, create a PRISMA flow diagram to document the selection process. |
| 3. Data Extraction | Extract what matters | Key research questions, study design, outcomes | Design data extraction forms and coding schemes. |
| 4. Analysis Pathway | Choose how to synthesize | Narrative synthesis, meta-analysis, qualitative/quantitative analysis | Ensure a clear and systematic method for analyzing and classifying sustainability indicators based on well-defined criteria. |
| 5. Results and Interpretations | Choose classification criteria | Findings | Classify indicators by capital, followed by thematic categorization through tables and analyses. |
| 6. Discussion | Determine trends to discuss and propose a framework | Alignment between sustainability capital, themes, and corresponding SDGs. | Discuss the connection between the selected themes and the relevant SDGs. |
| 7. Dissemination and Engagement | Share the literature review outcomes | Publications, presentations, knowledge translation strategies | Articles |
| Group | Keywords | |
|---|---|---|
| Topic | Agri, agro, food supply chain, sustainable, sustainability | |
| Actors | Smallholder, farmer, transport; policymaker, decision maker, stakeholder, consumer, retailer | |
| Capitals and dimensions |
| |
| Indicators | Indicator, metric | |
| Inclusion Criteria | Exclusion Criteria |
|---|---|
| Study design: Only peer-reviewed original research articles that report on empirical studies related to sustainability in the agri-food supply chain should be included. | Non-empirical studies: Studies that are not original research articles or do not report on empirical studies should be excluded. |
| Timeframe: Studies published within the last 7 years should be included for the indicator, while the calculation formulas can apply to any date range. | Language: Studies published in languages other than English should be excluded. |
| Participants: Studies should investigate sustainability issues related to agri-food supply chains, including farmers, processors, distributors, retailers, consumers, and other relevant stakeholders. | Duplicate studies: If multiple studies report on the same dataset, only one study should be included. |
| Outcomes: Studies should report on specific outcomes related to the sustainability of AFSCs, such as environmental impact, economic viability, social equity, and consumer health and safety. | Studies on non-agri-food supply chain sustainability: Studies that do not specifically investigate sustainability issues related to the agri-food supply chain should be excluded. |
| Interventions: Studies should investigate interventions or strategies that aim to improve the sustainability of AFSCs, such as reducing waste, improving resource efficiency, enhancing product quality and safety, and promoting ethical and social responsibility. | Poor quality studies: Studies with poor or incomplete data should be excluded. |
| Proposed Category | Definition | Equivalent or Similar Category in the Literature |
|---|---|---|
| Input | Refers to the substances used in the production process to raise livestock or grow crops. | Mineral Resources and Materials focuses on the inputs in various fields, encompassing the resources and materials extracted and utilized [51]. |
| Land | Concerns the use and management of land, including soil rehabilitation and preservation. | [52], “Land Use and Rehabilitation” (according to [51]) and can also be associated with “Ecosystem Preservation” (as per [2]). |
| Energy | Includes the consumption and efficiency of energy in production and operational processes. | “Energy Use” category is proposed by the authors of [2], and the energy dimension of the “Energy and Water” category according to [48]. |
| Water | The use of water includes water consumption in production processes. | [52] “Water Use” is classified by [4] and is also part of the broader “Energy and Water” category according to [48] |
| Air | Encompasses greenhouse gas emissions, air pollution, and their impact on climate. | Equivalent to the categories “Impact on the Environment and Climate Change”, “Emissions”, and “Atmospheric” according to [2], [51], and [52], respectively. |
| Waste | Measures liquid discharges and solid waste, providing insights into the environmental impact of these emissions and waste products. | Corresponds to “Waste Management” in [2] and “Emissions and Waste” in [51]. |
Disclaimer/Publisher’s Note: The statements, opinions and data contained in all publications are solely those of the individual author(s) and contributor(s) and not of MDPI and/or the editor(s). MDPI and/or the editor(s) disclaim responsibility for any injury to people or property resulting from any ideas, methods, instructions or products referred to in the content. |
© 2025 by the authors. Licensee MDPI, Basel, Switzerland. This article is an open access article distributed under the terms and conditions of the Creative Commons Attribution (CC BY) license (https://creativecommons.org/licenses/by/4.0/).
Share and Cite
Amamou, A.; Chabouh, S.; Sidhom, L.; Zouari, A.; Mami, A. Agri-Food Supply Chain Sustainability Indicators from a Multi-Capital Perspective: A Systematic Review. Sustainability 2025, 17, 4174. https://doi.org/10.3390/su17094174
Amamou A, Chabouh S, Sidhom L, Zouari A, Mami A. Agri-Food Supply Chain Sustainability Indicators from a Multi-Capital Perspective: A Systematic Review. Sustainability. 2025; 17(9):4174. https://doi.org/10.3390/su17094174
Chicago/Turabian StyleAmamou, Ayla, Safa Chabouh, Lilia Sidhom, Alaeddine Zouari, and Abdelkader Mami. 2025. "Agri-Food Supply Chain Sustainability Indicators from a Multi-Capital Perspective: A Systematic Review" Sustainability 17, no. 9: 4174. https://doi.org/10.3390/su17094174
APA StyleAmamou, A., Chabouh, S., Sidhom, L., Zouari, A., & Mami, A. (2025). Agri-Food Supply Chain Sustainability Indicators from a Multi-Capital Perspective: A Systematic Review. Sustainability, 17(9), 4174. https://doi.org/10.3390/su17094174