Article

Modeling the Salinity Distribution Suitable for the Survival of Asian Clam (Corbicula fluminea) and Examining Measures for Environmental Flow Supply in the Estuary of the Seomjin River, Korea

Department of Civil and Environmental Engineering, Hankyong National University, Anseong 17579, Gyeonggi Province, Republic of Korea
*
Author to whom correspondence should be addressed.
Sustainability 2025, 17(9), 4171; https://doi.org/10.3390/su17094171
Submission received: 31 March 2025 / Revised: 2 May 2025 / Accepted: 3 May 2025 / Published: 5 May 2025
(This article belongs to the Section Sustainable Oceans)

Abstract

:
The Seomjin River estuary is a key habitat for the Asian clam (Corbicula fluminea), contributing significantly to the local economy and aquatic biodiversity in South Korea. However, long-term reductions in upstream discharge, geomorphological alterations, land reclamation, and climate change have intensified saltwater intrusion, gradually displacing clam habitats upstream. This study employed the Environmental Fluid Dynamics Code (EFDC) model to simulate salinity distribution and evaluate optimal environmental flow strategies for clam conservation. Simulation results indicated that maintaining a minimum upstream flow of 23 m3/s was essential to prevent salinity levels from exceeding the critical threshold of 20 psu at Seomjin Bridge, a key habitat site. During neap tides, reduced tidal flushing led to prolonged saltwater retention, elevating salinity levels and increasing the risk of mass clam mortality. A historical event in May 2017, when salinity exceeded 20 psu for over four consecutive days, resulted in a major die-off. This study successfully reproduced that event and evaluated mitigation strategies. A combined approach involving increased dam releases and temporary reductions in intake withdrawal was assessed. Notably, a pulse release strategy supplying an additional 9.9–10.37 m3/s (total 30.4 m3/s) over three days during neap tide effectively limited critical salinity durations to fewer than four days. The preservation of Asian clams in the Seomjin River estuary is a sustainability measure not only from an ecological perspective but also from a cultural one.

1. Introduction

The downstream region of the Seomjin River is a national river with an open estuary, making it one of Korea’s five major rivers, along with the Han River. An open estuary forms a brackish zone where complex mixing of seawater and freshwater occurs due to tidal effects and fluctuations in upstream river discharge. The Seomjin River flows directly into Gwangyang Bay, creating a strong density current due to freshwater inflow and active turbulent mixing and circulation, which is more intense than in other estuaries due to tidal currents and tidal range variations [1]. The Seomjin River watershed and location of dams are depicted in Figure 1. However, the Seomjin River estuary has experienced continuous gravel extraction from the 1970s to 2004, resulting in a significant decrease in riverbed elevation [2]. Additionally, large-scale reclamation projects, such as the Yeosu Industrial Complex and the Gwangyang Steel Industrial Complex, have altered the estuarine topography, significantly affecting tidal range variations. According to the research [2] on the cause of salt damage in the lower reaches of the Seomjin River and possible measures to address it, as shown in Figure 2, the tidal range at Mangdeok tide observation station increased by approximately 20% after the Gwangyang Bay reclamation project, and the low tide level dropped by approximately 35 cm. Consequently, seawater intrusion into the Seomjin River has intensified compared with the past. Furthermore, the average annual discharge of the Seomjin River is approximately 3.2 billion m3/year, with a runoff ratio of about 47%, lower than other rivers average of 57%. This reduced flow is attributed to the inter-basin water supply from the Seomjin River to other basins [2]. Figure 1a provides an overview of the major dams and water transfer pathways within the Seomjin River basin. The upstream Seomjin River Dam supplies agricultural water to the Dongjin River basin, while the Juam Dam, Juam Regulating Dam, and Dongbok Dam in the Boseong River tributary provide municipal and industrial water to the Yeongsan River basin. Additionally, the Boseong River Dam discharges water into the South Sea through inter-basin water transfer for hydroelectric generation.
The Seomjin River estuary is known as Korea’s largest production site for Asian clams (Corbicula fluminea). Asian clams, shown in Figure 3 [3], belong to the family Corbiculidae within the order Venerida. Asian clams are an important seafood species and help maintain ecosystem balance through filter feeding [4]. Notably, the Seomjin River estuary accounts for approximately 30% of the country’s total Asian clam production. Moreover, the traditional hand-picking fishery method used for harvesting Asian clams in the Seomjin River was designated as Korea’s first fishery-related site in the Globally Important Agricultural Heritage System (GIAHS) by the Food and Agriculture Organization in July 2023 [5]. Therefore, preserving the Asian clam population in the Seomjin River estuary is vital for both ecological sustainability and cultural heritage conservation.
With ongoing climate change and decreasing precipitation exacerbating salinity intrusion, it is imperative to develop comprehensive strategies to regulate salinity levels and improve Asian clam habitat conditions. Originally, the Seomjin River estuary had an ideal environment for Asian clam habitation, characterized by first- and second-grade water quality, salinity levels of 2.5–10.5 psu, and shallow sandy substrates. However, continuous changes in estuarine topography and reductions in discharge have increasingly threatened Asian clam survival [6]. In particular, these changes have accelerated seawater intrusion, shifting suitable Asian clam habitats upstream [2], as illustrated in Figure 1b. The traditional harvesting areas have suffered severe declines in production due to salinity-induced damage, significantly impacting the income and livelihoods of local residents. Consequently, fishermen and related institutions are conducting investigations into the causes and environmental impacts of salinity intrusion [7,8], while local communities are demanding fundamental countermeasures. In addition, global trends indicate that altered natural flow regimes can detrimentally affect ecosystem structure and function [9], further underscoring the need for effective management strategies.
Given that salinity is the most critical factor influencing Asian clam survival in brackish water environments, this study focused on salinity variations rather than other water quality indicators. In this regard, there are studies on the impact of tidal fluctuations and freshwater variations on salinity changes in estuarine systems [10,11,12,13,14], investigations of various estuarine environments influenced by tidal processes [15,16,17,18,19], and research on the physiological and behavioral responses of Asian clams to salinity variations [20,21,22]. However, although the species under investigation is the same, differences in habitat regions limit the direct application of these criteria to Asian clams inhabiting the Seomjin River. Baek et al. [23] analyzed the distribution and growth characteristics of Asian clams in relation to salinity gradients in the lower reaches of the Seomjin River estuary. Their findings indicate that the highest Asian clam population density is observed in areas with salinity levels between 10 and 15 psu. Specifically, optimal feeding conditions are achieved at 15 psu, while feeding ceases at 20 psu, thereby suggesting a critical salinity threshold of 20 psu. Furthermore, according to a study by Lee et al. [24], when the salinity exceeds 20 psu for more than four consecutive days, the mortality rate of Asian clams reaches approximately 10% as shown in Figure 4. Based on previous research findings, it is reasonable to set the critical salinity threshold for Asian clam survival at 20 psu, ensuring that this level is not exceeded for more than four days to prevent mass mortality. During the dry season (spring), reductions in upstream discharge have already led to large-scale Asian clam die-offs in 2017 [2].
This study aimed to identify high-density Asian clam habitat zones within the Seomjin River estuary, particularly around the Seomjin Bridge (target point), and determine the minimum upstream discharge required to maintain salinity levels below the 20 psu threshold. Using hydrodynamic modeling, we estimated the necessary upstream discharge to prevent mass mortality during the 2017 dry-season hydrological conditions. Additionally, we evaluated how much environmental flow must be guaranteed from upstream dams to ensure that the critical salinity level did not persist for more than four consecutive days. Moreover, we examined various water supply strategies to achieve this goal effectively. As previously noted, Asian clams do not die immediately upon exposure to salinity levels exceeding 20 psu but instead succumb if exposure lasts for more than four days. Therefore, instead of continuously supplying large volumes of water to maintain salinity below the threshold, a more effective water management strategy may involve controlled water supply that ensures the critical salinity threshold is not exceeded beyond the four-day limit, thus optimizing water resource utilization. This study explores such an approach in detail.
Recent studies have increasingly employed advanced hydrodynamic models to analyze estuarine salinity distributions and their ecological impacts. For example, Hamrick [25] introduced the EFDC model, which has since become widely used for simulating estuarine hydrodynamics, including salinity transport. Furthermore, studies focusing on the role of salinity distribution and convergent flow in mixed estuaries through modeling [26,27], as well as research on salinity transport in coastal wetlands and aquifers [28,29,30], have demonstrated the influence of tidal fluctuations and freshwater inflow on the evolution of salinity gradients. Moreover, hydrodynamic modeling approaches for restoration and prediction applications [31,32,33,34] have improved ability to predict estuarine responses to environmental changes.
The primary objectives of this study were to (1) determine the minimum upstream discharge required to maintain salinity around the Seomjin Bridge (target location) below the critical 20 psu threshold and (2) evaluate various water supply strategies (e.g., increased dam releases versus reduced water withdrawals) to ensure that elevated salinity did not persist for more than four consecutive days. Although this study focused on the Seomjin River estuary, the findings have broader applicability to estuarine systems worldwide, particularly those facing similar challenges of reduced freshwater inflow and saltwater intrusion that threaten benthic ecosystems.

2. Methodology

2.1. Salinity Monitoring

Salinity was continuously monitored over a one-year period, from 15 February 2020 to January 2021, using a fixed salinometer [2]. The salinometer was installed at the pier of Seomjin Bridge to ensure stable and consistent data collection. To account for vertical salinity variations, measurements were conducted at three different water depths: upper, middle, and lower layers. These depth-specific measurements allowed for a comprehensive assessment of the estuarine salinity structure and its temporal variations. A conductivity-based salinometer was deployed to measure salinity in real time. The instrument operates by detecting electrical conductivity (EC) changes, which are directly related to the concentration of dissolved salts. Salinity was calculated using the practical salinity scale (PSS-78), which converts conductivity values into salinity units (psu). Data were recorded at 10 min intervals and stored internally within the device. The salinometer was calibrated periodically using standard salinity solutions to maintain measurement accuracy. To minimize sensor drift and biofouling effects, routine maintenance and cleaning were conducted at scheduled intervals. Additionally, a telemetry system was integrated into the monitoring setup, enabling remote data transmission for continuous observation. The measured salinity data were used to calibrate the hydrodynamic model, as described in the following section.

2.2. Construction of Numerical Model

To quantitatively analyze salinity variations, the EFDC model was employed in this study. The EFDC model was initially developed at the Virginia Marine Science Laboratory in the early 1990s and is currently being developed and maintained by the U.S. Environmental Protection Agency (EPA) and Tetra Tech, Inc. [25]. EFDC is a quasi-three-dimensional (quasi-3D) hydrodynamic and water quality model capable of simulating various water quality parameters, including salinity and dissolved oxygen (DO). The model incorporates layer-based vertical segmentation, enabling a three-dimensional representation of flow and constituent transport. In the horizontal direction, the EFDC model utilizes an orthogonal curvilinear grid system, which allows for accurate representation of complex estuarine and riverine geometries. In the vertical direction, the model adopts a sigma-stretched vertical grid system, which provides a flexible framework for resolving stratification and salinity gradients. A sigma-stretched grid is a terrain-following vertical coordinate system that divides the water column proportionally from surface to bottom. Because the vertical layers follow the free surface, it is particularly suitable for estuarine simulations involving time-varying tidal elevations, such as in this study.
The governing equations of the model include the continuity equation (Equation (1)), the momentum equations in the x- and y-directions (Equations (2) and (3), respectively), and the hydrostatic assumption for the z-direction momentum equation (Equation (4)). These equations form the foundation for simulating hydrodynamic behavior and salinity transport within the estuarine system:
η t + H u x + H v y + w z = 0
t m x m y H u + x m y H u u + y m x H v u + z m x m y w u f e m x m y H v   = m y H x p + p a t m + ϕ + m y z b x + z H x p z   + z m x m y A V H z u   + x m y m x H A H x u + y m x m y H A H y u m x m y c p D p u 2 + v 2 1 / 2 u
t m x m y H v + x m y H u v + y m x H v v + z m x m y w v f e m x m y H u   = m x H y p a t m + ϕ + m x z b y + z H y p z + z m x m y A V H z v   + x m y m x H A H x v + y m x m y H A H y v m x m y c p D p u 2 + v 2 1 / 2 v
z p = g H b = g H ρ ρ 0 ρ 0 1
where η is the free surface elevation; t is the time; H is the total water depth, defined as H = η + h (where h is the bottom depth); u is the horizontal velocity component in the x-direction; v is horizontal velocity component in the y-direction; w is the vertical velocity component in the z-direction; x, y, z are spatial coordinates; x, y define the horizontal plane, and z corresponds to the vertical direction; m x and m y are scale factors; f e is the effective Coriolis acceleration; p and p a t m are for pressure and atmospheric pressure, respectively; ϕ is the potential energy relative to a reference point, with the positive z-axis oriented upward; z b is a corrected bottom boundary value with respect to the gravitational surface at z = 0; A V is the vertical eddy viscosity coefficient; A H is the horizontal momentum and mass diffusion coefficient; c p is the drag coefficient; D p is a dimensionless projected area associated with vegetation; and ρ and ρ 0 are the actual density and reference density, respectively.
The governing equation for the water quality module in EFDC is the advection-diffusion equation for mass transport, which is expressed as Equation (5). This equation describes the transport and transformation of water quality constituents, including salinity, dissolved oxygen, and other dissolved substances, within the hydrodynamic framework of the EFDC model:
t m x m y H C + x m y H u C + y m x H v C + z m x m y w C   = x m y m x H A x x C + y m x m y H A y y C + z m x m y A z H C z   + m x m y H S c
where C is the concentration of each water quality parameter; A x , A y , and A z are the turbulent diffusion coefficients in the x, y, and z directions, respectively; and S c is the source–sink component (i.e., internal or external inputs and removals) per unit volume.
The EFDC model was applied to simulate the surface water grid system for the study area, which extends from Yesong Bridge (No. 62) to the confluence of the Seomjin River with the South Sea (No. 0). This reach was selected due to its significance as the primary habitat for Asian clam production. Given the importance of maintaining appropriate flow rates in this reach, it was necessary to analyze the salinity levels and their impacts on Asian clam survival. In the upstream section of the study area, the tributary, the Boseong River, merges with the Seomjin River from the right bank immediately downstream of Yesong Bridge. The Boseong River is regulated by the Juam Dam, a multipurpose dam that can supply environmental flow to the Seomjin River. Additionally, the Daap Water Intake facility is located approximately 25 km upstream from the river mouth (see Figure 1).
The model grid system was developed to cover a 62 km section of the Seomjin River’s mainstem and a 5 km section of the Boseong River’s lateral inflow. As shown in Figure 5, the Seomjin River grid consisted of 285 longitudinal and 5 lateral grid cells, while the Boseong River grid consisted of 27 longitudinal and 2 lateral grid cells, forming a total of 1479 grid cells. The average grid size was approximately 100 m in the lateral direction and 200 m in the longitudinal direction. The vertical layering comprised nine layers with uniform spacing. In total, 13,311 computational grids were constructed for the simulation. To develop the topographic data, MOLIT [35] was referenced, utilizing both planimetric and cross-sectional diagrams.
The model boundary conditions were categorized into upstream and downstream boundaries, lateral inflow boundaries, and internal boundaries. For the upstream boundary conditions, measured flow data from hydrological observation stations during the study period were applied. Specifically, discharge values from the Yesong Bridge water level and flow observation station were used for the Seomjin River, while discharge data from the Taean Bridge water level and flow observation station were used for the Boseong River. For internal boundary conditions, the water intake volume from the Daap Water Intake facility was considered, with the daily maximum intake value set at 4.63 m3/s as reported in the Investigation of Causes and Countermeasures for Saline Damage in the Lower Seomjin River [2]. The downstream boundary conditions included water level and salinity data. The water level and salinity data were derived from the tidal elevation records of the Gwangyang Tide Observation Station. Since the relationship between the EFDC input unit (ppt—parts per trillion) and the observed unit (psu—practical salinity unit) is defined as ppt = psu × 1.004715, no unit conversion was required for salinity input adjustments [36]. The performance of the configured model was evaluated through calibration and validation, based on observed data.

2.3. Model Calibration and Verification

To evaluate the accuracy of the hydrodynamic module of the EFDC model, calibration and validation were conducted by comparing the simulated water levels at the Eupnaeri observation station within the study domain (Figure 1) against the measured water level data from the same location. The calibration period was set from 1 February 2020 to 31 May 2020, corresponding to a timeframe with recorded saltwater intrusion damage. The model validation was performed using data from 1 May 2017 to 30 June 2017 to assess its performance under different hydrological conditions. The calibration and validation results are presented in Figure 6. In both procedures, the coefficient of determination (R2) exceeded 0.98, indicating that the model accurately captured water level fluctuations. This suggested that the EFDC model effectively reproduced the observed hydrodynamic behavior in the study area.
The salinity model was calibrated and validated using measured salinity concentration data from the Seomjin Bridge station (Figure 1), as reported in the Investigation of Causes and Countermeasures for Saltwater Intrusion in the Lower Seomjin River [2]. The calibration was performed using data collected from 15 February 2020 to 15 March 2020, while validation was conducted using data from 15 April 2020 to 11 May 2020. The key parameters requiring calibration and validation were the vertical eddy viscosity and vertical molecular diffusivity. The parameter values were derived by comparing field observations with model outputs from the study Assessment of Stratification Reproducibility in the Nakdong River Using the EFDC Model [37]. Based on this study, the vertical eddy viscosity was set to 1 × 10⁻6 m2/s, and the vertical molecular diffusivity was set to 1 × 10⁻7 m2/s.
Since Asian clam inhabit the riverbed layer, the salinity calibration and validation were conducted using salinity values from the first vertical layer (near the riverbed). The accuracy of the salinity model was evaluated using Percent Bias (PBIAS) [38] and Root Mean Square Error (RMSE). The equations for these statistical indicators are presented in Equations (6) and (7), while the evaluation criteria are summarized in Table 1. The results of the model calibration and validation at the Seomjin Bridge station are illustrated in Figure 7, and the statistical performance indicators are presented in Table 2. According to the classification criteria presented in Table 1, the PBIAS values for the bottom layer salinity simulation during the calibration and validation periods—45.94% and 34.78%, respectively—indicated “satisfactory” and “good” performance. This level of accuracy was considered acceptable for assessing estuarine-scale salinity dynamics, although care should be taken when interpreting results at finer spatial or temporal resolutions.
PBIAS ( % ) = i = 1 n O i P i × 100 i = 1 n O i
RMSE = i = 1 n ( P i O i ) 2 n

3. Results and Discussion

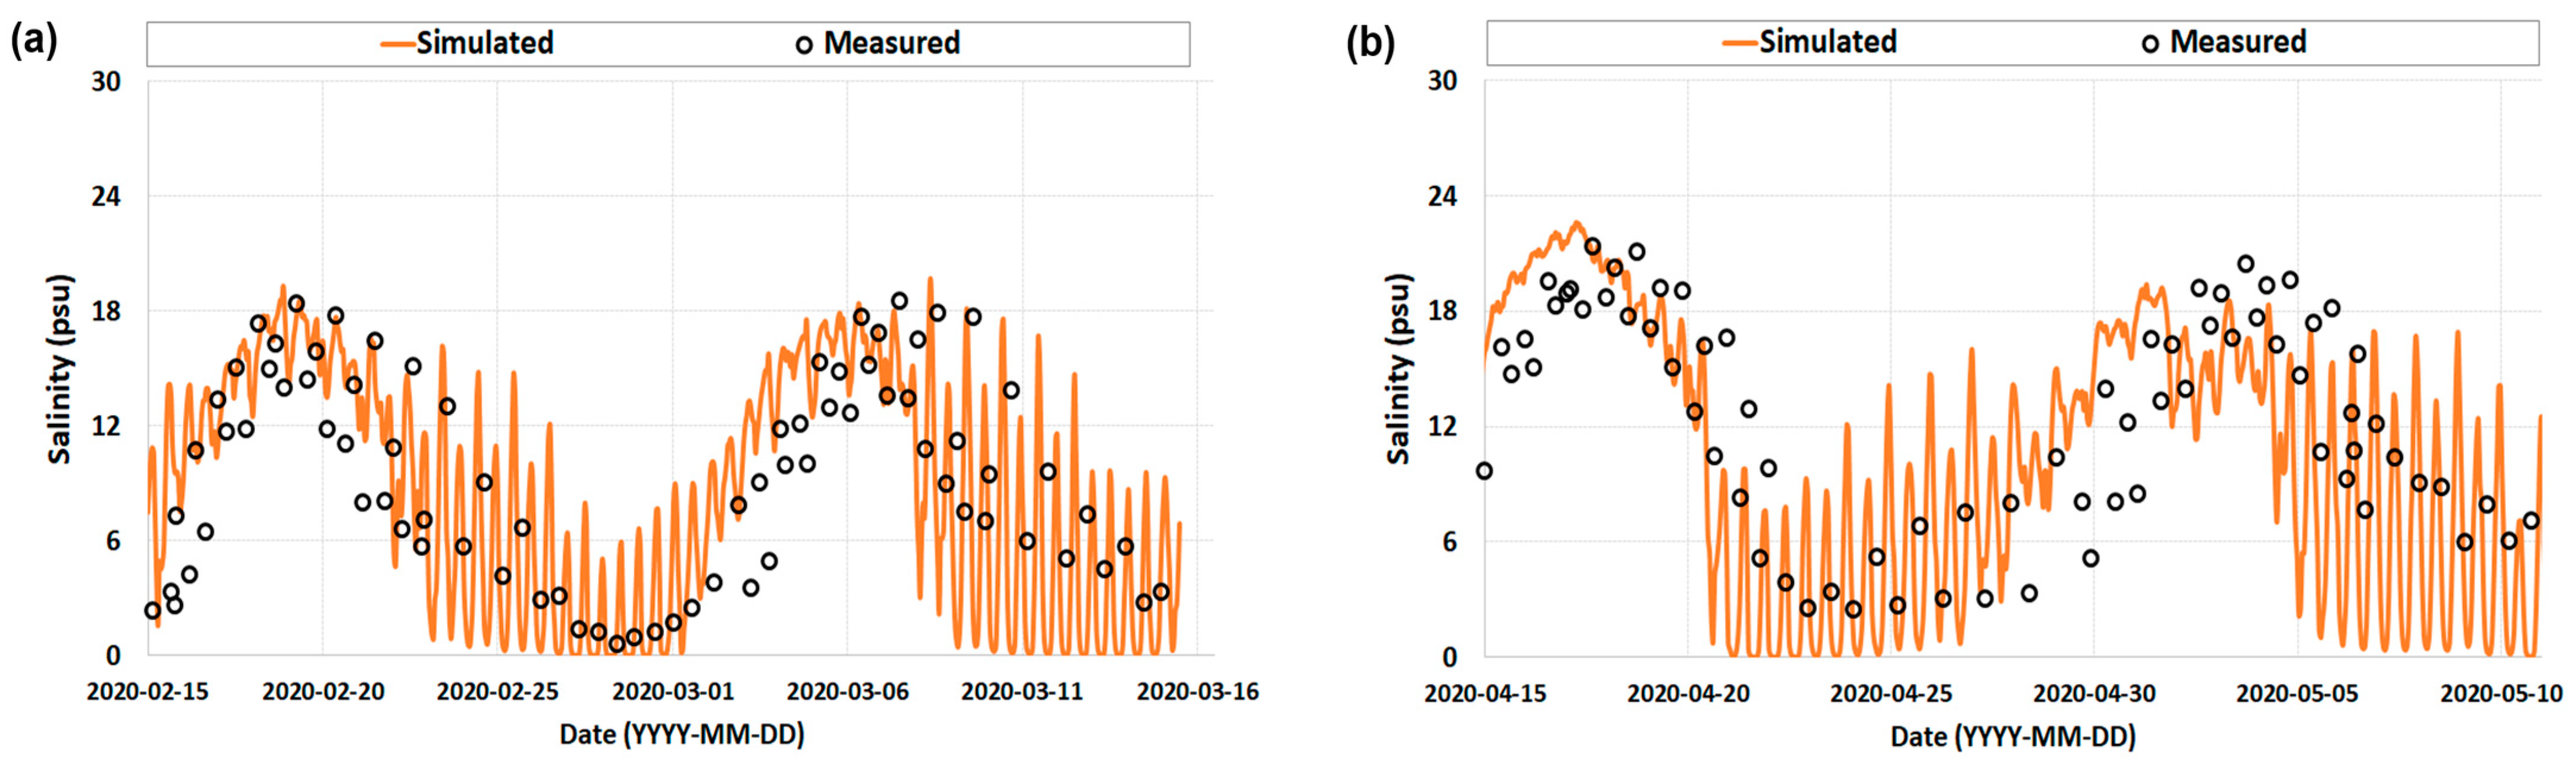
3.1. Results of Salinity Monitoring and Modeling

The salinity measurements collected in the bottom layer at the Seomjin Bridge from February 2020 to January 2021 are presented in Figure 8. Due to flooding, salinity data for August and September 2020 were missing, and sensor malfunctions resulted in data gaps in November 2020. In the bottom layer at Seomjin Bridge, salinity levels were typically below 20 psu; however, during certain neap tide conditions, salinity exceeded 20 psu and remained above this threshold for over four hours. The distinct salinity distribution pattern at the Seomjin River estuary was attributed to tidal variations. During spring tides, the large tidal range allowed seawater that intruded during spring tide high water (STHW) to be efficiently flushed out during spring tide low water (STLW). In contrast, during neap tides, the smaller tidal range resulted in seawater retention as the intruded seawater remained in the estuary during neap tide low water (NTLW). This phenomenon, referred to as the “salinity retention effect”, sustained salinity levels above 20 psu (the survival threshold for Asian clams) for extended periods.
Numerical simulations demonstrated salinity patterns that were consistent with field observations. Figure 9 presents the spatial and vertical distribution of salinity during high and low water levels under both spring and neap tide conditions in 2020. As expected, elevated salinity levels were simulated at the Seomjin Bridge during high-water periods, regardless of tidal type, due to seawater intrusion. However, differences became evident during low-water periods. In the STLW condition, the large tidal range allowed for sufficient seaward flushing of saline water, resulting in predominantly freshwater conditions at the Seomjin Bridge. In contrast, under NTLW conditions, the reduced tidal range restricted the seaward movement of saline water, leading to persistently elevated salinity levels at the same location. Figure 10 illustrates the simulated vertical salinity profiles at Seomjin Bridge for the four tidal scenarios (STHW, STLW, NTHW, and NTLW). Notably, at the bottom layer—corresponding to the typical habitat zone of the Asian clam—salinity levels during the NTLW period remained above 20 psu. This salinity retention effect constituted a critical condition directly influencing the mortality rate of Asian clams. Accordingly, the NTLW period, during which insufficient seaward flushing resulted in sustained high salinity, was identified as the critical target period for analysis in this study.

3.2. Minimum Flow Rate Required for Asian Clam Survival

To determine the critical upstream discharge required to prevent salinity levels from exceeding the survival threshold of Asian clams (20 psu) [24], numerical simulations were conducted using Seomjin Bridge, the area with the highest clam population density, as the target location. The analysis focused on the most severe salinity retention scenario, which occurred during the NTLW period in 2020. In this scenario, the downstream boundary condition was fixed at the lowest recorded tidal amplitude (NTLE; EL. −0.645 m), while the upstream discharge was systematically increased from 5 m3/s to 30 m3/s in 1 m3/s increments to evaluate its impact on salinity at Seomjin Bridge. The results, illustrated in Figure 11, demonstrated a linear relationship between upstream discharge and salinity concentration. When the upstream discharge was 23 m3/s, the predicted salinity at Seomjin Bridge was approximately 19.96 psu, with a 95% confidence interval of [19.33, 20.60] psu. This finding suggests that maintaining an upstream discharge of at least 23 m3/s was essential to ensure that salinity levels at the target site remained below the threshold required for Asian clam survival.
As shown in Figure 1, the study area was influenced by upstream dams and water intake facilities. Among the available water sources, Seomjingang Dam and Juam Dam were the two multi-purpose dams capable of supplying environmental flow to Seomjin Bridge. Although Seomjingang Dam was located on the main channel, its considerable distance (120 km) from the target site may limit the effective delivery of its discharge [1,2]. In contrast, Juam Dam, situated on the tributary Boseong River, is located approximately 70 km from Seomjin Bridge, making it a more effective source for maintaining the required environmental flow. Additionally, the Daap Intake Facility, located 13 km upstream of Seomjin Bridge, withdraws an average of 4.63 m3/s daily [2].
Two potential strategies were evaluated to maintain the required 23 m3/s flow at Seomjin Bridge: (1) supplying the entire deficit from Juam Dam or (2) a combined approach involving partial dam release and a reduction in water withdrawals at the Daap Intake facility. To assess whether these strategies would provide equivalent hydrological effects at the target location, additional simulations were performed. Specifically, a scenario was tested in which the upstream dam discharge was reduced to 22 m3/s (1 m3/s less than the required 23 m3/s) and the intake facility withdrawal was decreased by 1 m3/s to 3.63 m3/s, yielding a total upstream discharge of 23 m3/s. The results, shown in Figure 12, indicated that although minor differences in salinity distribution were observed, the overall impact on salinity levels at Seomjin Bridge was negligible. This suggested that increasing dam discharge or reducing water withdrawals could be equally effective in achieving the necessary flow conditions. Therefore, securing a total upstream discharge of 23 m3/s —whether through increased dam releases, reduced water withdrawals, or a combination of both—is a feasible strategy for mitigating excessive salinity during neap tide conditions, ensuring salinity levels remain below 20 psu at Seomjin Bridge.

3.3. Optimal Environmental Flow Supply Strategy

To prevent salinity levels exceeding 20 psu from persisting for more than four consecutive days at the target location (Seomjin Bridge), the minimum upstream flow required was determined. As shown in Figure 4, salinity levels exceeding 20 psu for more than four days resulted in a 10% mortality rate for Asian clams [24]. This implied that although exceeding the salinity threshold for up to four days may disrupt clam feeding activities, immediate mortality was unlikely. Therefore, rather than maintaining an upstream discharge high enough to continuously keep the salinity below 20 psu, an optimized approach from a water resource management perspective was to minimize flow use while ensuring that the duration of salinity exceedance remained below four days. As previously mentioned, the Seomjin River basin supplies water for industrial and agricultural use to other watersheds, making it challenging to allocate sufficient environmental flow for the clam survival [2]. Two potential strategies for environmental flow management include reducing water withdrawals at the Daap Intake Facility or increasing releases from Juam Dam. However, since a continuous increase in water supply may not be feasible, a more practical approach would be to provide temporary flow supplements during dry-season neap tides, when salinity levels tend to rise.
To analyze this approach, hydrological conditions from mid-May to late June 2017—when significant clam mortality was reported—were reconstructed, and the periods with salinity exceedance lasting more than 4 days were identified. The results indicated that during this timeframe, salinity exceedance occurred during three neap tide periods: Neap Tide_1, 19–21 May; Neap Tide_2, 4–6 June; and Neap Tide_3, 18 June–20 June. The duration of salinity exceedance beyond 20 psu for each neap tide period is summarized in Table 3. In Neap Tide_1, exceedance lasted 4 days and 20 h, in Neap Tide_2, 3 days and 12 h, and in Neap Tide_3, 4 days and 11 h. Therefore, mitigation efforts need to focus on reducing the exceedance duration by 20 h in Neap Tide_1 and 11 h in Neap Tide_3.
To achieve this, numerical simulations were conducted under the assumption that upstream discharge at Seomjin Bridge was maintained at 18, 18.5, and 19 m3/s during these neap tide periods. The results (Table 3) showed that with an upstream discharge of 18 m3/s, salinity exceedance still persisted for 1 h in Neap Tide_1 and 5 h in Neap Tide_3. However, with an upstream discharge of 18.5 m3/s, salinity exceedance did not exceed four days during any neap tide period. While increasing discharge to 19 m3/s ensured an even greater buffer, the most efficient environmental flow requirement was identified as 18.5 m3/s. The additional discharge required to maintain this flow level (18.5 m3/s), compared with actual 2017 upstream conditions and salinity, is presented in Table 4 and illustrated in Figure 13. Assuming a three-day environmental flow supply per neap tide, the required additional discharge was estimated at 9.9–10.37 m3/s (a total of 30.4 m3/s) for Neap Tide_1, 0–7.76 m3/s (a total of total 16.25 m3/s) for Neap Tide_2, and 4.25–5.7 m3/s (a total of 14.59 m3/s) for Neap Tide_3. A total of 15.87 million m3 of additional water was required to maintain the upstream discharge at 18.5 m3/s over three neap tide periods.
In conclusion, the required discharge of 18.5 m3/s could be achieved through one of the following approaches: pulse releases from Juam Dam, reducing withdrawals at the Daap Intake Facility, or a combination of dam releases and intake reduction. Here, the pulse refers to the controlled discharge of a large volume of freshwater over a short period of time, similar to flushing water through a system all at once. Maintaining an upstream discharge of at least 18.5 m3/s ensured that the duration of salinity exceedance at Seomjin Bridge did not exceed four days. While salinity levels exceeding 20 psu may temporarily halt Asian clam feeding activity, it did not result in immediate mortality. This strategy represented the most rational and feasible solution for preventing large-scale clam die-offs while optimizing the use of limited water resources.

4. Conclusions

This study utilized the EFDC model to analyze the impact of rising salinity levels in the Seomjin River estuary on Asian clam survival and proposed an optimal environmental flow strategy for mitigation. The results indicate that maintaining an upstream discharge of at least 23 m3/s prevented the salinity at Seomjin Bridge from exceeding 20 psu, the critical survival threshold. However, due to limited water availability in the Seomjin River basin, continuous discharge at this level was impractical. Instead, a strategic approach involving pulse releases during neap tide low-water periods and temporary intake adjustments was necessary.
A key component of this study was the reconstruction of the large-scale clam mortality event in May 2017 to develop a targeted flow management strategy. The findings revealed that if salinity levels exceeded 20 psu for more than four consecutive days, clam mortality rates increased significantly. Thus, limiting the duration of salinity exceedance to fewer than four days through controlled upstream releases was the most effective mitigation strategy. The proposed flow management strategy included (1) pulse releases during neap tide periods, supplying an additional 9.9–10.37 m3/s per day for three days (totaling 30.4 m3/s) to ensure that salinity exceedance remained below four days, and (2) temporary reductions in withdrawals at the Daap Intake Facility, which can complement dam releases and achieve similar salinity control with lower total discharge. Although intake reduction was presented as one potential measure, its implementation would require further institutional and policy-based analysis
This study provides a scientific basis for sustainable estuarine water management. It also proposes practical solutions to balance Asian clam conservation and efficient water resource utilization. Future research should explore the impacts of climate-induced variations in precipitation and changes in upstream dam operations, contributing to the development of long-term environmental flow management strategies.

Author Contributions

Conceptualization, K.O.B.; methodology, K.O.B. and D.Y.L.; software, D.Y.L.; visualization, D.Y.L.; model calibration and verification, D.Y.L.; formal analysis, D.Y.L.; writing—original draft preparation, K.O.B.; writing—review and editing, K.O.B.; supervision, K.O.B. All authors have read and agreed to the published version of the manuscript.

Funding

The Basic Science Research Program supported this research through the National Research Foundation (2016R1D1A1B02012110), funded by the Ministry of Education in Korea.

Institutional Review Board Statement

Not applicable.

Informed Consent Statement

Not applicable.

Data Availability Statement

The data presented in this study are available on request from the corresponding author.

Conflicts of Interest

The authors declare no conflicts of interest.

References

  1. Ministry of Land, Transport and Maritime Affairs (MLTMA). Study on the Establishment of an Estuary Management System (3): Seomjin River Estuary; Ministry of Land, Transport and Maritime Affairs (MLTMA): Sejong, Republic of Korea, 2010. [Google Scholar]
  2. Ministry of Environment (ME). Investigation of Causes and Countermeasures for Saline Damage in the Lower Seomjin River; Ministry of Environment (ME): Sejong, Republic of Korea, 2021. [Google Scholar]
  3. Bespalaya, Y.V.; Kropotin, A.V.; Kondakov, A.V.; Aksenova, O.V.; Gofarov, M.Y.; Kim, S.K.; Lee, J.H.; Travian, O.V.; Vikhrev, I.V.; Vinarski, M.V.; et al. A taxonomic reassessment of native and invasive species of Corbicula clams (Bivalvia: Cyrenidae) from the Russian Far East and Korea. Zool. J. Linn. Soc. 2023, 197, 104–126. [Google Scholar] [CrossRef]
  4. Newell, R.I. Ecosystem influences of natural and cultivated populations of suspension-feeding bivalve molluscs: A review. J. Shellfish Res. 2004, 23, 51–62. [Google Scholar]
  5. Food and Agriculture Organization (FAO). Globally Important Agricultural Heritage Systems (GIAHS). 2023. Available online: http://www.fao.org/newsroom/detail/globally-important-agricultural-heritage-systems-(giahs)--the-republic-of-korea-notches-up-its-sixth-site/en (accessed on 1 March 2025).
  6. Lee, M.; Park, B.S.; Baek, S.H. Tidal influences on biotic and abiotic factors in the Seomjin River Estuary and Gwangyang Bay, Korea. Estuaries Coasts 2018, 41, 1977–1993. [Google Scholar] [CrossRef]
  7. Ministry of Environment (ME). Analysis of Water Use Status Using Water Quantity and Quality Monitoring Data in the Seomjin River Area; Ministry of Environment (ME): Sejong, Republic of Korea, 2021. [Google Scholar]
  8. Kim, H.G.; Jeong, J.J.; Jeong, S.W.; Kim, H.S.; Lee, Y.S. A study on water quality to understand the cause of bloom of potamocorbula amurensis in Seomjin River estuary wetland. J. Korean Soc. Environ. Technol. 2018, 19, 322–327. [Google Scholar] [CrossRef]
  9. Poff, N.L.; Allan, J.D.; Bain, M.B.; Karr, J.R.; Prestegaard, K.L.; Richter, B.D.; Sparks, R.E.; Stromberg, J.C. The natural flow regime. BioScience 1997, 47, 769–784. [Google Scholar] [CrossRef]
  10. Bo, T.; Ralston, D.K.; Garcia, A.M.P.; Geyer, W.R. Tidal intrusion fronts, surface convergence, and mixing in an estuary with complex topography. J. Phys. Oceanogr. 2024, 54, 653–677. [Google Scholar] [CrossRef]
  11. Álvarez, A.H.; Otero, L.; Restrepo, J.C.; Álvarez, O. The effect of waves in hydrodynamics, stratification, and salt wedge intrusion in a microtidal estuary. Front. Mar. Sci. 2022, 9, 974163. [Google Scholar]
  12. Zhang, J.; Cheng, L.; Wang, Y.; Jiang, C. The impact of tidal straining and advection on the stratification in a partially mixed estuary. Water 2023, 15, 339. [Google Scholar] [CrossRef]
  13. Zhu, L.; He, Q.; Shen, J. Response of stratification processes to tidal current alteration due to channel narrowing and deepening. J. Geophys. Res. Ocean 2020, 125, e2019JC015223. [Google Scholar] [CrossRef]
  14. Hetzel, Y.; Pattiaratchi, C.; Lowe, R.; Hofmeister, R. Wind and tidal mixing controls on stratification and dense water outflows in a large hypersaline bay. J. Geophys. Res. Oceans 2015, 120, 6034–6056. [Google Scholar] [CrossRef]
  15. Liu, W.; Lu, F.; Han, W. Sustainable Marginal Water Resource Management: A Case Study of Brackish Water Irrigation on the Southern Coast of Laizhou Bay. Sustainability 2025, 17, 1956. [Google Scholar] [CrossRef]
  16. Hu, Z.; Guo, K.; Yang, Y.; Zhang, M. Field survey and analysis of water flux and salinity gradients considering the effects of sea ice coverage and rubber dam: A case study of the Liao River Estuary, China. Front. Mar. Sci. 2023, 10, 1154150. [Google Scholar] [CrossRef]
  17. Pool, M.; Post, V.E.; Simmons, C.T. Effects of tidal fluctuations on mixing and spreading in coastal aquifers: Homogeneous case. Water Resour. Res. 2014, 50, 6910–6926. [Google Scholar] [CrossRef]
  18. Huang, X.; Werner, A.D.; Solórzano, S.C.; Jazayeri, A. Salinity profiles in coastal aquifers: A characterization framework for field measurements. Water Resour. Res. 2024, 60, e2024WR037244. [Google Scholar] [CrossRef]
  19. Kniebusch, M.; Meier, H.M.; Radtke, H. Changing salinity gradients in the Baltic Sea as a consequence of altered freshwater budgets. Geophys. Res. Lett. 2019, 46, 9739–9747. [Google Scholar] [CrossRef]
  20. Xiao, B.C.; Li, E.C.; Du, Z.Y.; Jiang, R.L.; Chen, L.Q.; Yu, N. Effects of temperature and salinity on metabolic rate of the Asiatic clam Corbicula fluminea (Müller, 1774). SpringerPlus 2014, 3, 455. [Google Scholar] [CrossRef]
  21. Lee, J.Y.; Kim, W.K.; Lee, C.S. Growth and survival of the brackish water clam, Corbicula japonica larvae according to rearing conditions. Korean J. Malacol. 2011, 27, 337–343. [Google Scholar] [CrossRef]
  22. Nakamura, M.; Yasugi, S.; Takahashi, F.; Shinagawa, A.; Nakao, S. Salinity tolerance of the brackish water bivalve, Corbicula japonica Prime. Aquac. Sci. 1996, 44, 31–35. [Google Scholar]
  23. Baek, S.H.; Seo, J.Y.; Choi, J.W. Growth characteristics and distribution pattern of a brackish water clam, Corbicula japonica along an estuarine salinity gradient in Seomjin River. J. Korea Acad.-Ind. Coop. Soc. 2015, 16, 6852–6859. [Google Scholar]
  24. Lee, Y.; Choi, H.; Kim, W.; Cheong, C. Evaluation of acute toxicity of salinity, ammonia, and nitrite to Corbicula. J. Korean Soc. Environ. Technol. 2016, 17, 542–547. [Google Scholar]
  25. Hamrick, J.M. A Three-Dimensional Environmental Fluid Dynamics Code: Theoretical and Computational Aspects; Virginia Institute of Marine Science: Gloucester Point, VA, USA, 1992. [Google Scholar]
  26. Akter, A.; Tanim, A.H. Salinity distribution in river network of a partially mixed estuary. J. Waterw. Port Coast. Ocean Eng. 2021, 147, 04020055. [Google Scholar] [CrossRef]
  27. Guillermo, M.L.; Marta, A.; Carmen, Z.; Alejandro, L.R. Estuarine Salinity Distribution: The Role of Convergence. In Proceedings of the 40th IAHR World Congress, Vienna, Austria, 21–25 August 2023. [Google Scholar]
  28. Qiao, H.; Zhang, M.; Jiang, H.; Xu, T.; Zhang, H. Numerical study of hydrodynamic and salinity transport processes in the Pink Beach wetlands of the Liao River estuary, China. Ocean. Sci. 2018, 14, 437–451. [Google Scholar] [CrossRef]
  29. Roibás-Rozas, A.; Núñez, M.; Mosquera-Corral, A.; Hospido, A. Modeling the impact of salinity variations on aquatic environments: Including negative and positive effects in life cycle assessment. Environ. Sci. Technol. 2022, 56, 874–884. [Google Scholar] [CrossRef]
  30. Brookes, J.D.; Huang, P.; Zhai, S.Y.; Gibbs, M.S.; Ye, Q.; Aldridge, K.T.; Busch, B.; Hipsey, M.R. Environmental flows to estuaries and coastal lagoons shape the salinity gradient and generate suitable fish habitat: Predictions from the Coorong, Australia. Front. Environ. Sci. 2022, 10, 796623. [Google Scholar] [CrossRef]
  31. Passeri, D.L.; Ill, J.R.L.; Poisson, A.; Bilskie, M.V.; Bacopoulos, P. Modeling the effects of large-scale interior headland restoration on tidal hydrodynamics and salinity transport in an open coast, marine-dominant estuary. Front. Mar. Sci. 2023, 10, 1193462. [Google Scholar] [CrossRef]
  32. Ji, Z.G.; Moustafa, M.Z.; Hamrick, J. Hydrodynamic Modeling of a Large, Shallow Estuary. J. Mar. Sci. Eng. 2024, 12, 381. [Google Scholar] [CrossRef]
  33. Hsu, M.H.; Kuo, A.Y.; Kuo, J.T.; Liu, W.C. Modeling estuarine hydrodynamics and salinity for wetland restoration. J. Environ. Sci. Health Part A 1998, 33, 891–921. [Google Scholar] [CrossRef]
  34. Iglesias, I.; Pinho, J.L.; Avilez-Valente, P.; Melo, W.; Bio, A.; Gomes, A.; Vieira, J.; Bastos, L.; Veloso-Gomes, F. Improving estuarine hydrodynamic forecasts through numerical model ensembles. Front. Mar. Sci. 2022, 9, 812255. [Google Scholar] [CrossRef]
  35. Ministry of Land, Infrastructure and Transport (MOLIT). Seomjin River Basic Plan Report; Ministry of Land, Infrastructure and Transport (MOLIT): Sejong, Republic of Korea, 2021. [Google Scholar]
  36. Sharma, S.; Bhatt, R. Monitoring water and soil salinity across Mentor Marsh to investigate their temporal and spatial variability. Water 2023, 15, 4172. [Google Scholar] [CrossRef]
  37. Choi, H.G.; Han, K.Y.; Park, J.H. Reproducibility evaluation of stratification using EFDC model in Nakdong river. KSCE J. Civ. Environ. Eng. Res. 2017, 37, 561–573. [Google Scholar]
  38. Moriasi, D.N.; Arnold, J.G.; Van Liew, M.W.; Bingner, R.L.; Harmel, R.D.; Veith, T.L. Model evaluation guidelines for systematic quantification of accuracy in watershed simulations. Trans. ASABE 2007, 50, 885–900. [Google Scholar] [CrossRef]
Figure 1. Study area: (a) Seomjin River basin and major dam locations. (b) Hydrological, tidal, and salinity observation stations and principal habitats shift of Asian clam over time.
Sustainability 17 04171 g001
Figure 2. Tidal level variations at Mangdeok station before and after Gwangyang bay reclamation.
Sustainability 17 04171 g002
Figure 3. Photograph of the Asian clam (Corbicula fluminea) [3].
Sustainability 17 04171 g003
Figure 4. Cumulative mortality rate of Asian clams by salinity. Data adapted from Lee et al. [24].
Sustainability 17 04171 g004
Figure 5. EFDC model grid configuration for the study area.
Sustainability 17 04171 g005
Figure 6. Calibration and validation of the hydrodynamic model: (a) Calibration (1 February 2020 to 31 May 2020). (b) Validation (1 May 2017 to 30 June 2017).
Sustainability 17 04171 g006
Figure 7. Calibration and validation of the salinity model (salinity in psu): (a) Calibration (15 February 2020 to 15 March 2020). (b) Validation (15 April 2020 to 11 May 2020).
Sustainability 17 04171 g007
Figure 8. Time series of bottom-layer salinity at Seomjin Bridge and discharge at Songjeong.
Sustainability 17 04171 g008
Figure 9. Spatial and vertical salinity distributions during spring and neap tides conditions in 2020: (a) STHW, (b) STLW, (c) NTHW, and (d) NTLW.
Sustainability 17 04171 g009
Figure 10. Simulated salinity vertical profiles at Seomjin Bridge under four tidal conditions (STHW, STLW, NTHW, and NTLW).
Sustainability 17 04171 g010
Figure 11. Relationship between upstream discharge and salinity at Seomjin Bridge under NTLW conditions.
Sustainability 17 04171 g011
Figure 12. Comparison of original and scenario salinity time series at Seomjin Bridge under adjusted discharge conditions.
Sustainability 17 04171 g012
Figure 13. Simulated salinity results for original and 18.5 m3/s discharge conditions.
Sustainability 17 04171 g013
Table 1. The indices of differences between the measured and simulated data.
Very GoodGoodSatisfactoryUnsatisfactory
PBIAS (%)<2525–4040–70 ≥70
RMSEThe closer to 0, the higher the reliability.
Table 2. Statistical indicators for salinity simulation calibration and validation.
DatePBIASRMSE
Bottom layer15 February 2020–15 March 202045.94%5.62 psu
16 April 2020–11 May 202034.78%5.16 psu
Table 3. Summary of the duration of salinity exceeding 20 psu under various discharge conditions.
Neap Tide PeriodOriginal
Discharge
Discharge:
18 m3/s
Discharge:
18.5 m3/s
Discharge:
19 m3/s
Neap Tide_1116 h (4 d 20 h)97 h (4 d 1 h)96 h (4 d)81 h (3 d 9 h)
Neap Tide_284 h (3 d 12 h)50 h (2 d 2 h)51 h (2 d 3 h)58 h (2 d 10 h)
Neap Tide_3108 h (4 d 11 h)101 h (4 d 5 h)86 h (3 d 14 h)90 h (3 d 18 h)
Table 4. Summary of additional discharge required to maintain an upstream discharge of 18.5 m3/s for each neap tide period.
Neap Tide PeriodOriginal Discharge
(m3/s)
Additional Discharge
(m3/s)
Total of Additional Water
(Million m3)
Neap Tide_18.13–8.69.90–10.377.88
Neap Tide_210.74–19.810–7.764.21
Neap Tide_312.80–14.254.25–5.703.78
Disclaimer/Publisher’s Note: The statements, opinions and data contained in all publications are solely those of the individual author(s) and contributor(s) and not of MDPI and/or the editor(s). MDPI and/or the editor(s) disclaim responsibility for any injury to people or property resulting from any ideas, methods, instructions or products referred to in the content.

