Article

Occupancy-Based Predictive AI-Driven Ventilation Control for Energy Savings in Office Buildings

by
Violeta Motuzienė
1,*,
Jonas Bielskus
1,
Rasa Džiugaitė-Tumėnienė
1 and
Vidas Raudonis
2
1
Department of Building Energetics, Vilnius Gediminas Technical University, Saulėtekio Ave. 11, 10223 Vilnius, Lithuania
2
Automation Department, Kaunas University of Technology, K. Donelaičio St. 73, 44249 Kaunas, Lithuania
*
Author to whom correspondence should be addressed.
Sustainability 2025, 17(9), 4140; https://doi.org/10.3390/su17094140 (registering DOI)
Submission received: 5 April 2025 / Revised: 29 April 2025 / Accepted: 30 April 2025 / Published: 3 May 2025

Abstract

:
Despite stricter global energy codes, performance standards, and advanced renewable technologies, the building sector must accelerate its transition to zero carbon emissions. Many studies show that new buildings, especially non-residential ones, often fail to meet projected performance levels due to poor maintenance and management of HVAC systems. The application of predictive AI models offers a cost-effective solution to enhance the efficiency and sustainability of these systems, thereby contributing to more sustainable building operations. The study aims to enhance the control of a variable air volume (VAV) system using machine learning algorithms. A novel ventilation control model, AI-VAV, is developed using a hybrid extreme learning machine (ELM) algorithm combined with simulated annealing (SA) optimisation. The model is trained on long-term monitoring data from three office buildings, enhancing robustness and avoiding the data reliability issues seen in similar models. Sensitivity analysis reveals that accurate occupancy prediction is achieved with 8500 to 10,000 measurement steps, resulting in potential additional energy savings of up to 7.5% for the ventilation system compared to traditional VAV systems, while maintaining CO2 concentrations below 1000 ppm, and up to 12.5% if CO2 concentrations are slightly above 1000 ppm for 1.5% of the time.

1. Introduction

1.1. Research Background

The operations of buildings account for 30% of global final energy consumption and 26% of global energy-related emissions [1]. According to the International Energy Agency (IEA), in 2022, building sector energy use increased by around 1%. Despite the fact that minimum performance standards and building energy codes are increasing in scope and stringency across countries, and the use of efficient and renewable building technologies is accelerating, it is obvious that the sector needs more rapid changes to get on track with the net zero emissions by 2050 (NZE) scenario that also meets key energy-related Sustainable Development Goals (SDGs).
Currently, about 35% of the buildings in the EU are over 50 years old, and almost 75% of the building stock is energy inefficient [2]. It is, therefore, very important to focus on improving the energy efficiency and overall sustainability, including occupant comfort, of existing buildings.
Some recent studies [3] have shown that design energy performance can differ significantly from the actual energy consumption. This problem is known as the energy performance gap (EPG), and there are some tendencies found: (1) in heating-dominated climates, EPGs tend to be mostly positive [3,4,5,6]; (2) EPGs are significantly higher in non-residential buildings [7]; (3) positive EPGs are more common in new, highly energy-efficient buildings, while they tend to be negative in old, inefficient buildings (for heating-dominated climates) [3,8,9]. In new buildings, high, positive EPGs disappoint investors and hinder the achievement of climate change targets. The reasons for energy performance gaps can be very diverse, ranging from imperfect or unrealistic assumptions in the design methodologies used to assess energy performance, to design changes or poor workmanship during construction, inadequate management of the building’s energy-consuming systems, such as HVAC and other systems, or changes in the building’s use pattern, such as a significant reduction in occupancy [10,11].
Optimising HVAC energy is imperative in achieving energy efficiency goals and promoting sustainable practices in commercial building operations [12], and ventilation systems in heating-dominated countries are one of the most energy-consuming systems in new non-residential buildings. According to the traditional control strategies, ventilation systems are classified into constant air volume systems (CAV), variable air volume (VAV), demand controlled ventilation (DCV), and hybrid ventilation (HV) systems, where
  • CAVs maintain a constant volume of supply and exhaust air regardless of occupancy or indoor climate conditions. These systems are the least efficient, as they might continue ventilating even when spaces are unoccupied.
  • VAV systems focus on maintaining a desired airflow rate in different zones of a building. It adjusts airflow based on indoor climate parameters, such as temperature or pressure.
  • DCV systems focus on maintaining a desired level of indoor air quality (IAQ) by adjusting the ventilation rate based on a specific metric (usually CO2 concentration).
  • HV systems combine features of the other systems.
The energy demand of the ventilation systems mainly depends on the occupancy of the building. Therefore, occupancy is a very important variable when assessing the real demand for ventilation. VAV systems can be energy-efficient by reducing unnecessary airflow but may not always optimise for actual occupancy levels, while DCV systems offer greater potential for energy savings by precisely adjusting ventilation based on real-time occupancy or CO2 levels. In general, VAV systems are simpler, while DCV systems may require a more complex setup and control strategy.
The increased ventilation requirements due to COVID-19 have also raised energy consumption concerns in buildings. According to the review of Prince and Hati [13], the main opportunities for improving energy efficiency in ventilation systems are the combined benefits of correct component selection (20–30% energy savings), variable frequency drive (VFD) control strategies (5–50% energy savings), and AI-based demand prediction (1–8% energy savings). Consequently, interest in advanced control strategies has been growing in recent years. Among these, occupancy-based control has emerged as the most promising energy-saving strategy. The model developed and presented in this study combines AI-based demand predictions, utilising occupancy data to improve traditional VAV system control and achieve additional energy savings.

1.2. Literature Review

Advanced HVAC control strategies can be divided into [14,15]: (1) soft-computing (e.g., artificial neural networks (ANNs), fuzzy logic controllers (FLC), genetic algorithms (GAs), agent-based controls); (2) hard-computing (e.g., model predictive control (MPC), autotuning PID (proportional–integral–derivative) control); (3) hybrid (combination of soft and hard control strategies), and (4) adaptive–predictive control strategies (user predictive/responsive; weather predictive/responsive, etc.).
Saber et al. [16] discussed various AI techniques for intelligent control systems of ventilation, including FLC, ANN, GA, MPC, and reinforcement learning (RL). ANN is effective for learning patterns and making predictions but requires substantial data for training. GA optimises and fine-tunes FLC or other control systems. MPC makes control decisions based on future conditions, though it is still being developed for buildings. RL-based systems learn by trial and error, showing promise, but needing further research in building applications. FLC is versatile and effective for integrated control of natural ventilation, heating, and cooling due to its ability to handle non-linearity and manage uncertainty [13,16].
Esrafilian-Najafabadi and Haghighat [17] highlighted the rise in intelligent buildings using occupancy data for HVAC optimisation. Intelligent control systems aim to balance energy efficiency with thermal comfort and indoor air quality. Reactive control is efficient but can cause discomfort due to lag time, while predictive control improves comfort but may use more energy. Advanced algorithms, such as deep learning, can capture complex occupancy patterns, leading to more efficient control strategies. Reinforcement learning offers an alternative to MPC, potentially improving performance. Combining reactive and predictive approaches with advanced algorithms could enhance HVAC system modelling and control.
Anand et al. [18] emphasised the need for sophisticated occupancy-based control strategies prioritising occupant health and indoor environment quality (IEQ), especially post-COVID-19. Issues include discrepancies between planned and actual performance, the limitations of VAV dampers, and the need for novel control strategies. Meanwhile, Li and Cai [19] proposed a DCV system based on CO2 levels to reduce COVID-19 infection, saving 30–50% energy compared to constant high ventilation. Practical limitations include CO2 measurement problems and uneven distribution in large buildings.
Ren et al. [20] proposed a zonal DCV strategy adjusting ventilation based on real-time occupant detection using cameras, significantly reducing infection risk and improving energy efficiency. However, better occupancy prediction accuracy and cost analysis are needed. Zhang et al. [21] presented a user demand-oriented ventilation strategy prioritising comfort and well-being, though limited data and comprehensive user behaviour models are challenges. Jiang et al. [22] proposed an occupant number-based MPC system, showing significant energy savings but requiring further investigation into occupancy prediction uncertainty. Lee and Lee [23] highlighted the importance of faster hardware for effective AI applications in HVAC control.
In summary, occupancy-based or CO2-based ventilation control strategies with integrated AI techniques offer significant potential for energy savings and improved IEQ in buildings. However, recent studies [17,18,20,22,23] have shown the need to address limitations in occupancy prediction that affect control performance, investigate the impact of different control strategies on occupant health and COVID scenarios, and optimise hardware–software co-design for AI-based demand control ventilation systems.
This study presents a novel AI-driven optimisation model for improving building ventilation control. The model enhances the efficiency of the variable air volume (VAV) system by predicting CO2 levels based on occupancy. A significant advantage of this approach is its ability to overcome common data reliability issues found in similar models. The study employs an extreme learning machine (ELM) with simulated annealing (SA) and genetic algorithm (GA) optimizations to boost the model’s robustness and adaptability in HVAC system control.
The development of the control model was based on a large amount of monitoring data and was developed sequentially: (1) long-term monitoring of the microclimate parameters and occupancy of the three buildings was carried out by identifying correlations between the parameters, determining the actual prevailing occupancy of the administrative buildings and CO2 concentrations; (2) testing the reliability of the extreme learning machine (ELM) models prediction of occupancy under different conditions and identifying the sufficient monitoring period for the accuracy of the prediction; (3) assessing the reliability of the extreme learning machine with simulated annealing (ELM-SA) model-based variable air volume system improvement in control and the potential energy savings.

2. Materials and Methods

The methodology of the whole AI-based VAV control model development is presented graphically in Figure 1. It consists of three main phases, namely:
  • Data collection and analysis. As was already defined, occupancy is an important parameter to be used for the control of the ventilation system, so this is the core parameter that was decided to be monitored, together with the CO2 concentration in the room, as the main parameter reflecting the indoor air quality. A wider variety of indoor parameters (indoor air temperatures, relative humidity, air velocity) were also measured, seeking to increase the probability of finding hidden patterns and correlations, but the correlations with these parameters were found to be weak, and therefore are not further analysed in this study [7]. The data for the CO2 concentrations were gathered from 3 office buildings, with 5 min intervals, and for occupancy, when a signal of the PIR sensor was detected (direct detection of the occupancy). The CO2 and occupancy data were processed to unify the time step for CO2 and occupancy and further analysed. They are further utilised for training and validating the AI prediction models.
  • Analysis and validation of occupancy prediction models. At this stage, using the collected monitoring data, the ELM (extreme learning machine) model was applied for the prediction of occupancy. Different studies [24,25,26] have proven that prediction models incorporating the ELM show high accuracy and reliability. The ELM has been tested with two different algorithms: simulated annealing (SA) and genetic algorithm (GA). The optimisation application aims to obtain data with a high degree of deviation compared to adjacent data. The optimised data are fed to the ELM, and the algorithm is trained on the fed data. The objective of the ELM is to predict the near future based on the variables obtained and to adjust the ventilation system airflows accordingly. For ELM with two different optimisations (SA and GA), analysis was also performed to test the sensitivity to population size, number of hidden neurons, and maximum number of iterations. Additionally, model reliability was tested for different occupancy densities. As a result, the most acceptable and reliable optimisation is chosen for further development of the ventilation system optimisation model called AI-VAV.
  • Application of an AI-VAV model for the improvement of the control of a building’s ventilation system for the reduction in energy consumption. The AI model predicts occupancy and then recalculates it into CO2 concentration to enable system control. The energy-saving potential of the AI-VAV control model is compared to the traditional ventilation function of the VAV damper. The model was trained with different amounts of data to test the amount of data required to ensure sufficient prediction reliability. Once the data set was defined, five different AI-VAV control combinations were tested to determine the model’s performance and to ensure the indoor air quality in terms of CO2 concentration. Finally, the way that the system must operate to maintain acceptable indoor air quality and additional energy savings compared to traditional ventilation systems with VAV dampers is proposed.

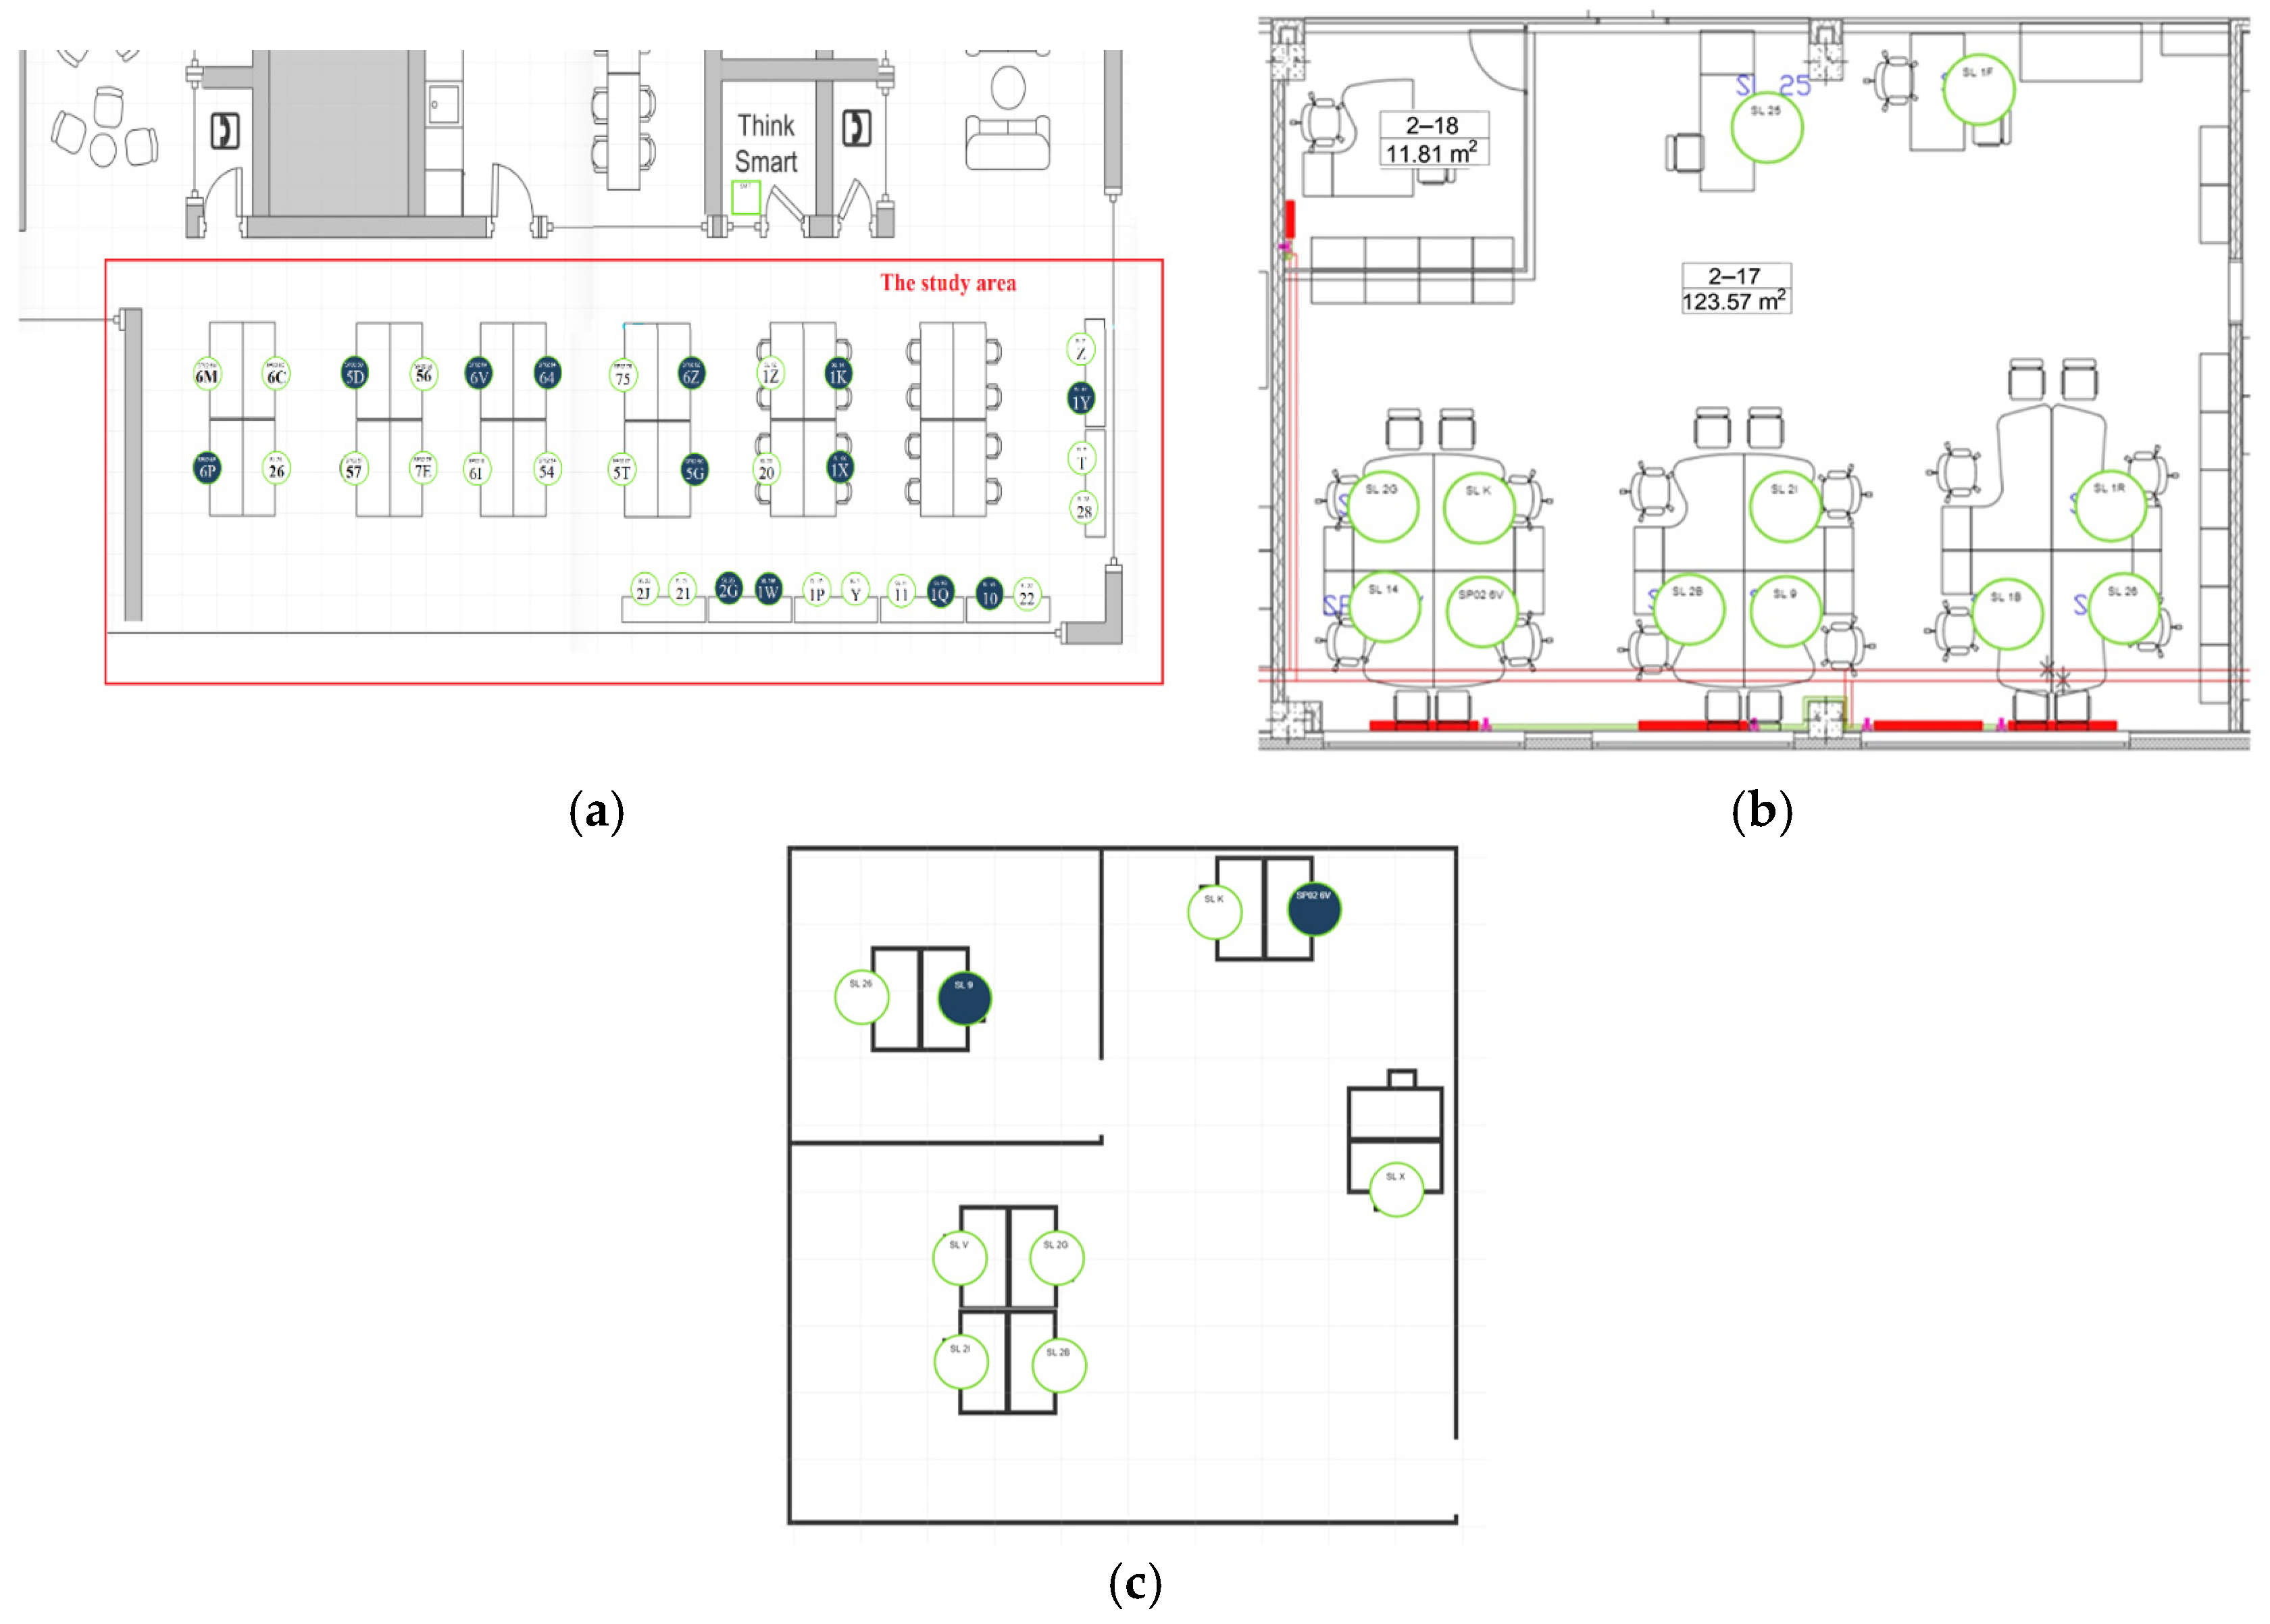
2.1. Monitoring Data

The data used for the development of the prediction model were collected from the monitoring of three office buildings. All the buildings were built between 2014 and 2017 in Vilnius, Lithuania, and are classified as B energy performance class, according to the national certification. However, they have very different predicted and actual energy consumption (see Table 1). Buildings A and C have a very large positive (consuming more than predicted) energy performance gap for heating energy, of 195% and 569%, respectively. The significant discrepancies between the designed and actual energy consumption of these buildings make them particularly interesting to monitor. This study hypothesises that the performance gaps may be largely attributable to the inefficient management of HVAC systems. Consequently, this study focuses on the ventilation system.
These buildings, despite having similar purposes and energy performance classes, exhibit some differences in the context of the urban environment, which plays a crucial role in influencing the energy consumption and occupancy of buildings. Building A, located in a mixed-use urban area, is expected to have higher energy consumption and occupancy rates due to its vibrant setting and availability of amenities. Building B, in a suburban residential area, is expected to have lower energy consumption and more stable occupancy rates. Meanwhile, Building C, on a university campus, is expected to have high energy consumption and occupancy rates due to the academic activities and constant flow of students and staff. In terms of energy consumption for heating, these expectations are roughly true (see Table 1). For the occupancies, these assumptions cannot be directly compared in the study, as measurements were performed at different periods.
One of the most important measurement parameters in this work is the presence of occupants, which influences changes in the energy consumption of indoor climate support systems. In the selected open-plan offices in each building (Table 2), PIR motion detectors (Figure 2) were installed under the desk at each workstation. CO2 sensors were also installed in all the monitored rooms. Additionally, other indoor climate parameters (relative humidity, air temperature, and air velocity) were monitored, but they were not used in the development of the prediction model as they did not show sufficient correlations with occupancy [7].
A comparison of the three buildings revealed that they all have mechanical supply and extract ventilation systems for heat recovery. The floor area per person in the study buildings is as follows: building C has the largest floor area per user at 11.6 m2, while building A has the smallest floor area at 5.25 m2 per person. This indicates that building C has more available space and does not utilise it to its full potential within the design parameters for the workplace.
PIR sensors are designed to monitor the occupancy of a workstation and are typically mounted under the desk. The sensor itself has been mounted in such a way that it does not interfere with the worker when seated, and at the same time, the worker cannot damage the sensor when seated (the power cords have been removed from the sensors several times) (Figure 2a). Carbon dioxide sensors were positioned at the height of the seated individual (Figure 2b), approx. 1.2 m, and were preferably situated in the centre of the room, taking care to avoid disrupting the occupants’ movement.
The amount of data collected during the measurement and further used for the training control model is provided in Table 3, where the initial amount is the one which is extracted directly from sensors. CO2 measurements at 5 min time step and occupancy was checked by the PIR sensor (Figure 3) every minute. So, the step was unified for both variables to 5 min.

2.2. Extreme Learning Machine Model with Integrated Optimisation Algorithms

Traditional solutions based on room-specific control alone are not enough to achieve optimal HVAC control of a single room. Machine learning models based on statistical data processing are used to address this problem [27]. The authors apply an extreme learning machine (ELM) in this study because it offers several advantages over traditional machine learning algorithms in predicting HVAC system parameters, primarily due to its unique architecture, fast learning speed, and excellent generalisation performance. These characteristics make ELM particularly suitable for real-time applications like heating, ventilation, and air conditioning (HVAC) systems that require real-time data processing and quick decision-making to adjust control strategies effectively [28,29]. However, ELMs require high-quality, extensive datasets to perform accurately. Therefore, in this study, the ELM model with simulated annealing (SA) and genetic algorithm (GA) optimisations was selected to improve its robustness and adaptability in HVAC system control.
The ELM algorithm is one of the machine learning models first introduced by Huang in 2004 [30]. The algorithm is simple, runs extremely fast, and has good generalisation performance. The standard single hidden layer feedforward neural network (SLFNN) scheme for the extreme machine learning model is shown in Figure 4.
The ELM model is usually applied for machine learning tasks that require fast training and reasonably good accuracy, and when there is no need for interpretability. The SLFNN processes information by passing it through layers of interconnected nodes, and it flows in one direction only, from the input layer xi to the output layer oj. The computation complexity is reduced by choosing one hidden layer and fixated random weights between the input and hidden layers. The training of ELM is reduced to the solving of a linear system, where only the weights between the hidden layer and output layer are unknown. The proposed simplification makes ELMs much faster to train compared to traditional multi-layer perceptron (MLP). However, it can be challenging to interpret the inner part of the SLFNN model, because of randomly selected weights. The simulated annealing and genetic algorithms are selected as hybrid optimisation techniques for solving the mentioned linear system with unknown values. The hybrid optimisation technique is based on mimicking natural processes. Simulated annealing mimics the cooling of metal, allowing for the exploration of different solutions while gradually converging towards an optimal one. Genetic algorithms mimic biological evolution, where a “fit” function is selected and combined to create a potentially better generation with better performance.
The pseudocode written by the extreme machine learning model is shown in Algorithm 1. The presented pseudocode outlines the main computation steps that are needed to train the ELM model. The training process involves four main steps, such as (1) random initialization (generation of weights with random values, weights between input and hidden layer is kept fixated), (2) output generation of hidden layer, (3) calculation of weights between hidden layer and output layer, and (4) the final model is acquired if certain threshold value is reached.
Algorithm 1. Pseudocode of ELM model training process [30].
1. START: learning data: {xi}TRn and {ti}TRm (xi = [xi1, xi2,…, xin]TRn
   and ti = [ti1, ti2,…, tin]TRm)
2. Hidden output neuron function g(x) and number of hidden neurons, L;
3. Assurance: Output weight vector, β
4. Random parameter for hidden neuron generation (wj, xj, bj), here j = 1, …, N;
5. Calculate hidden layer output matrix H;
6. Calculate output weights β: β = HT, here T = [t1, t2,…, tN]T;
7. END
The weights between hidden and output layers are calculated using the Genetic Random Selection algorithm. The genetic algorithm operates on a population of possible solutions and searches for a result that is equal or close to the answer to a given problem or so-called “fit” function. A new generation of solutions is produced from the previous generation of solutions through crossover (recombination) and mutation, repeating the process all over again. This process leads to the evolution of solutions that are better than the ones from which they were created. The pseudocode for the standard genetic algorithm, which was introduced by Zaritsky in 2004 [31], is shown in Algorithm 2. The standard genetic algorithm involves main seven processing steps: (1) initialization, where the algorithm starts with the initial population; (2) evaluation of each individual in the population using a predefined fit function; (3) selection of best-performing individuals in the current population; (4) crossover, during which genetic material is combined to create new population; (5) mutation is introduced as random changes; (6) new generation of individuals are generated; and (7) the iterative loop is continued for a predefined number of generation or until a certain threshold value is reached.
Algorithm 2. Pseudocode of the standard genetic algorithm [31].
1. Parameter (s): M—genome blocks are determined (pop size)
2. Output: a set of chromosomes is randomly selected from M
3. Initialisation
4. t  0
5. Initialise Y(t) to random individuals from M
6. EVALUATE-FITNESS-GA (Mt, Y(t))
7. When termination conditions not met
8.
     d o   S e l e c t   c h r o m o s o m e   f r o m   M t m a t c h   f i t n e s s S e l e c t   i n d i v i d u a l s   f r o m   Y t R e c o m b i n e   i n d i v i d u a l s Mutate   individuals EVALUATE FITNESS GA   M , c h r o m o s o m e s   a r e   i n s e r t e d   f r o m   o u t s i d e Y t + 1 Newly   created   individuals t t + 1
9. Return (superstring derived from best individual Y(t))
10. Procedure EVALUATE-FITNESS-GA (M, Y)
11.  M–set f population size
12.  Y–population of individuals
13. For each individual jY
14.           d o generate   derived   string resulting   values   O j   and   T j       fit y   fitness   function        
One extreme machine learning approach to optimisation is simulated annealing (SA), which is a low-complexity, powerful stochastic algorithm that is used to solve a variety of optimisation problems [32]. It is based on finding the global minimum of a given objective function to avoid the local minimum by performing a random neighbourhood search.
The pseudocode was introduced by Ruiz in 2010 [33] and is presented in Algorithm 3. The SA optimisation algorithm mainly consists of 5 computational steps: (1) initialization stage; (2) generation of initial configuration using random values; (3) energy (or fitness) evaluation step; (4) configuration is updated, and (5) termination of optimisation when stopping criteria is met.
Algorithm 3. Pseudocode of the simulated annealing algorithm [33].
1. Generate initial temperature, t0;
2. Generate initial configuration, x0;
3. While convergence criteria are not met do:
4.    Fix temperature, t;
5.    for j = 1,…, N,
6.      Choose randomly an element y   ϵ   N ( x ) .
7.     If f(y) < f(x), then xß y
8.     Else, either probability p ( x , y , t ) = e x p ( ( f y f ( x ) t ) , then xß y.
9.    End for
10. End while
11. Return the best solution found.

2.3. Modelling of Indoor Carbon Dioxide Concentrations

The main principle of a demand-controlled ventilation system is to ensure the right air quality in the room in an energy-efficient way, and one of the most common parameters used to monitor and control air quality is CO2 concentration. CO2 is mostly designed not to exceed the IDA 2 category limit–1000 ppm [34]. The CO2 concentration directly correlates with the occupancy; therefore, the ELM-SA model, which is developed to predict occupancy, is applied to improve the performance of the variable air volume damper (VAV damper). The created AI model predicts occupancy, then it is recalculated into CO2 concentration enabling supplied air volume control. The energy-saving potential of the AI-VAV control model is compared with the ventilation function of the standard VAV damper controlled based on CO2.
The developed model was trained with different amounts of data (from 100 to 10,000 steps), to test what amount of data (steps) ensures sufficient prediction reliability. Once the required amount of data had been defined, the different AI-VAV control combinations were tested to determine how the model would perform and ensure the indoor air quality in terms of CO2 concentration. Finally, it is proposed how the system must operate to maintain an acceptable indoor air quality (IDA 2 category–1000 ppm) and to save additional energy compared to traditional ventilation systems with VAV dampers.
This test was carried out in Matlab and Excel, so that each time the predicted number of occupants and the fresh air supplied changed, the carbon dioxide concentration was recalculated according to the actual number of occupants in the room. The air movement and CO2 pollution in the room are shown in Figure 5. Indoor carbon dioxide concentrations can be calculated using theoretical equations that require the exact number of occupants and the duration of time the occupants are indoors, as well as indoor air repeatability and initial carbon dioxide concentrations.
The concentration of carbon dioxide in a room after a certain time (when there are occupants) is expressed with the following Formula (1) [35]:
c = q n · V · 1 1 e n t + c 0 c i · 1 e n t + c i
The concentration of carbon dioxide in a room that is emitted from occupants can be used to determine the efficiency of the ventilation system or the theoretical CO2 concentration. The value of indoor carbon dioxide concentration is directly related to the number of occupants in the room, so the theoretical calculations require knowledge of the activity level of the occupants and the amount of CO2 exhaled per 1 person.
In further studies, resting and low-activity CO2 concentrations are used, as the occupancy in office buildings is low and carbon dioxide emissions per user are 0.013 m3/h.
The assumptions used to calculate the electricity and heat savings resulting from the improved control are shown in Table 4.

3. Results

3.1. Analysis of the Monitoring Data

The first phase of the study involved collecting and analysing data for the three buildings A, B, and C, as shown graphically below (Figure 6 and Figure 7). The measurements show that the density of people in the buildings, i.e., in the offices, is overall very low for the dominant part of the time—mostly being less than 0.033 persons/m2 (Figure 6). But some differences can also be noticed—Building A, which was monitored before the pandemic, has such a low density, for just 58% of the time. During other periods, it is higher, but still low compared to the minimum requirements for the office space in Lithuania (6 m2 per person working with a computer, meaning 0.166 persons/m2). Building B’s monitoring period mainly included different periods of the pandemic with changing restrictions, and therefore, its occupancy was extremely low—99% of the time, it was less than 0.033 persons/m2. Building B was already measured in the post-pandemic period, but people were still working a significant amount of their time remotely, and it also had very low occupancy—90% of the time, it was also lower than 0.033 persons/m2. It demonstrated that changing habits and office working culture also became an issue when considering efficient ventilation system control and waste of energy.
None of the monitored buildings had demand-controlled ventilation; all systems were of the CAV (constant air volume) type. Consequently, occupancy significantly impacts indoor air quality, assessed in terms of CO2 levels. Figure 7 demonstrates the distribution of CO2 concentrations during working hours (the sufficient air quality is the IDA 2 category when CO2 concentration does not exceed 1000 ppm, and high air quality is IDA 1 is when it does not exceed 800 ppm). Even when the air quality is maintained at the highest standards, the premises are still over-ventilated most of the working time. Over-ventilation problems, indicating the inefficient management of the ventilation systems and an untapped potential for energy savings, have also been found by other studies, e.g., [36]. The problem of over-ventilation in mechanically ventilated offices is also found by the other authors [37]. In an attempt to solve the problem of over-ventilation, the development of AI-driven optimisation for improved building ventilation control is demonstrated below, which aims to increase the energy efficiency of mechanically ventilated buildings.

3.2. Analysis and Validation of Occupancy Prediction Models’ Results

A Matlab computer programme containing an extreme machine learning (ELM) algorithm with an optimisation model allows the prediction of consumer occupancy based on the CO2 concentration data of buildings A, B, and C for different measurement periods. To ensure the reliability of the computational model, measurements were taken every 5 min.
One of the main requirements of the data transmitted to artificial neural networks is that the data must be correlated. This means that the reliability of the prediction will depend on the correlation of the data. The aggregated data for each of the buildings A, B, and C were used to calculate Pearson correlation coefficients. It was found [7] that room occupancy has the highest correlation with the carbon dioxide concentration, ranging from 0.506 to 0.834. As for the other indoor and outdoor parameters, although there are correlations with occupancies, they are relatively weak and of little importance in the application of the methodologies and the prediction of user habits. Therefore, the correlation between occupancy and carbon dioxide will be further explored in this paper.
Once it was determined that the carbon dioxide concentration was the most appropriate in terms of data for predicting the ventilation airflow, a sensitivity analysis was performed using extreme machine learning with two different optimisations—SA and GA for buildings A (highest occupancy) and B (lowest occupancy). It was found [6] that ELM-SA provides slightly higher accuracy after 8 weeks of learning data. It is also important to note that the accuracy of the results is highly dependent on the measurement period: the longer the period, the more reliable the prediction. Thus, this demonstrates that short-term measurements lead to low reliability due to insufficient data sets. At that point, from week 4 onwards, the reliability of the forecasting becomes sufficient, and reaches a higher R2 (0.76 and above) [6], which proves that only 4 weeks is enough to train the model. To determine the shortest prediction time and to maintain high confidence, a sensitivity analysis was carried out by varying the following parameters: the number of neurons, the population size, and the maximum iteration count.
A larger number of neurons increases the accuracy of the prediction, with a significant effect from 25 neurons onwards. There is no point in the number of neurons going even higher, as the change in prediction from 25 neurons onwards is not significant. The genetic algorithm’s number of 20 is based on the population size, as a larger population number has almost no effect on the accuracy and only increases the simulation time. In the ELM-SA model, the size of the population does not affect the accuracy of the results and the computation time, which can be as short as a few seconds. A comparison of the accuracy of the two models in terms of the maximum number of iterations and the impact on the computational time is revealed. It is observed that the higher number of iterations of ELM-GA leads to a computation time that can take more than 1 min. At the same time, the simulation time of ELM-SA varies between 1 and 5 s. It is clear from the results that 10 iterations can be considered a reasonable amount for both models.
Having established the sensitivity of the ELM-SA and ELM-GA models, a further study [38] was carried out to determine how effective the prediction is when the occupancy density is extremely low (e.g., in a pandemic). The data were collected during the pandemic period in Building B, and the simulations were carried out using the ELM-SA methodology, as this model has shown to have advantages over genetic algorithm optimisation (shorter computational time, which is particularly important). Prediction was applied during various periods of the pandemic (Table 5). The model’s reliability is assessed in terms of RMSE (root mean square error), which is a widely used metric for measuring the differences between values predicted by a model and values that are observed, and R2 (coefficient of determination/correlation factor), where 1 means a complete fit of the model [39].
The survey periods are longer than 4 weeks in each pandemic period, but the accuracy of the prediction is insufficient, and its reliability R2 is as low as 0.27 in the severe quarantine period, and increases in the light quarantine and post-quarantine periods to an R2 of 0.50 and 0.56, respectively.
In summary, previous studies performed by the authors [6,38] have shown that good model prediction performance depends on occupancy density and a sufficient monitoring period (amount of data).

3.3. Results of AI-VAV Model Training

The validation of the methodology requires appropriate testing steps. The authors carried out five tests with data from the different buildings A, B, and C. The validation programme is presented in Table 6, which attempts to train the AI-VAV by evaluating the presentation of the initial data, i.e., through zero data, self-learning, and real data from which the AI-VAV makes predictions. The AI-VAV training steps were chosen randomly, starting with 100 steps at the beginning and increasing to 10,000 at the end. In the fourth test, only working hours were included. The Vth test used the optimised machine learning model, running on a traditional VAV system. This means that if the prediction does not match the actual situation and the carbon dioxide concentration exceeds 950 ppm, the VAV system algorithm is triggered to adjust and reduce the CO2 concentration until it returns to the predicted concentration, and the machine learning model is triggered again.
As can be seen from the results in Table 6, the AI-VAV model for Buildings B and C has learned with extremely low predictive confidence during all tests, i.e., the occupancy density is insufficient to learn. Therefore, Buildings B and C are not further evaluated in the assessment of the energy savings potential. The results of AI-VAV model training for Building A during the third and fifth tests show sufficient reliability (namely, R2 is around 0.70). Therefore, only these two training tests for Building A are considered the most reliable options to assess the energy savings potential of the AI-VAV model.
To assess the AI-VAV correctly, it is compared with the traditional ventilation function of the VAV and its energy-saving potential. The AI-VAV training results of Building A are shown in Figure 8 and Figure 9.
As can be seen in Figure 7, the CO2 concentration in Building A did not exceed 1000 ppm during the period under study (0%). The fifth test combines the algorithms of the ELM-SA and VAV systems. It is observed that the quality of prediction in the fifth test has not changed compared to the third test, but the overall air quality has improved in terms of pollution with carbon dioxide concentration (see Figure 8).
As can be seen from Figure 8 and Table 7, the results of the third control option indicate that the AI-VAV model will not provide the required indoor air quality for 9 h (1.6% of the time), i.e., the CO2 concentration will be higher than 1000 ppm. Therefore, the fifth test is the best option to control indoor air contamination, where AI-VAV is used in conjunction with VAV.
The results of the energy consumption and savings calculations are presented in Table 8, which shows the total energy consumption per person and the energy comparison of the systems in terms of savings or losses due to the comparison of system performances.
From the data presented in Table 8, it can be seen that the difference in energy consumption for each of the systems studied with the options between AI-VAV and VAV is relatively small, ranging from 7.5 to 12.9%, with a difference of up to 80% between AI-VAV and CAV (including thermal and electrical energy). The greatest energy savings (12.9%) between AI-VAV and CAV are achieved with the third control option. However, this option also has the highest time duration of non-air quality above 900 ppm (Figure 9a). Consequently, the Vth control option represents the most promising ventilation control strategy in terms of simultaneously achieving energy savings and high indoor air quality. This is evidenced by the fact that it achieves energy savings of 7.5% and CO2 concentration lower than 1000 ppm over the entire study period.

4. Discussion

4.1. General Discussion

The paper presented a new AI-driven optimisation model for enhanced building ventilation control to improve the efficiency of the variable air volume system by predicting CO2 based on occupancy. The presented model is a continuation and final result of the larger research, which included long-term monitoring [7], analysis of results, and testing of different ELM optimisations [6,38]; therefore, it is based on Big Data and does not face limitations related to data reliability like many other similar models.
The analysed buildings are relatively new and were expected to be energy-efficient, but two of them—A and C—have very large positive energy performance gaps (rebound effect) for heating energy, 195% and 569%, respectively. Meanwhile, Building B has a gap that can be considered insignificant. Monitoring has shown that all offices have much lower occupancy levels than designed, even when measured under different conditions (pre-pandemic, pandemic, and post-pandemic). Indoor climate measurements also indicated HVAC systems control problems, with one of them leading to over-ventilation.
Over-ventilation indicates that the system does not take into account realistic occupancy and is not controlled based on real demand, thus wasting energy and also contributing to the energy performance gap. This problem is particularly evident when occupancy levels are low, as shown by the study.
While engineered solutions exist to control systems on demand, such as VAV dampers, these are based on the system’s response to an existing CO2 concentration. Meanwhile, the use of artificial intelligence can predict occupancy in advance and allow the system to react to potential demands, knowing that occupancy and CO2 correlate very well.
To solve the problem of over-ventilation, the development of AI-driven optimisation for improved building ventilation control was demonstrated by the study, aiming to increase the energy efficiency of mechanically ventilated buildings. The hybrid ELM (extreme learning machine) model was chosen and tested with different optimisations—simulated annealing (SA) and genetic algorithm (GA). Both optimizations showed similar and high accuracies of prediction for the whole measured period, R2—0.73–0.74 and RMSE—1.8–1.9 (at PopSize—100, MaxIter—100, and neurons number 20), when tested on Building A. It was also revealed that data from 4 weeks of monitoring (at the 5 min step) is a sufficient period for reliable prediction. The sensitivity analysis revealed that the optimal extreme learning machine model prediction reliability and the highest prediction speed are achieved when the number of neurons is at least 25, the population size is at least 20, and the number of iterations is at least 10. Of the above optimizations, the SA optimisation has the greater advantage of keeping the prediction quality at the same level as the GA but reducing the prediction time by a factor of 5–10.
Testing the models on pandemic occupancies also revealed a limitation, namely that the accuracy of the model is strongly dependent on the occupancy density and is not suitable for offices with very low occupancies, such as Building B and even Building C, where the predominant occupancy was less than 0.033 person/m2. Consequently, when training the model at different time steps, the highest reliabilities were obtained for Building A at 10,000 time steps, resulting in R2 = 0.7. Therefore, further estimations of potential energy savings were calculated just for this building.
An R2 of 0.7 is acceptable for non-critical HVAC control scenarios (e.g., offices). Typically, for real-world HVAC systems, especially where IAQ is a significant concern (e.g., healthcare, clean rooms, laboratories, and public facilities), an R2 value greater than 0.8 is considered acceptable to ensure that the model explains a substantial portion of the data variance [1]. In addition, the RMSE should ideally be less than 10% of the maximum observed values, reflecting a high degree of model precision [40]. In addition, control limits established in accordance with ASHRAE Standard 62.1 ensure compliance with accepted IAQ and ventilation standards. The current study shows that although the model R2 is approximately 0.7, the integrated traditional VAV backup system automatically activates at CO2 concentrations above 950 ppm, effectively providing a robust safety margin. This dual-control approach ensures reliable performance and maintains IAQ within acceptable limits, supporting confidence in the application. To further enhance confidence in deployment, the use of sensitivity analysis to identify and mitigate potential risks associated with sensor and actuator uncertainties can be applied [41]. Adherence to standards such as ASHRAE 62.1 [42], the use of computational fluid dynamics (CFD) simulations, the implementation of adaptive control logic, or feedback correction loops to dynamically correct for predictive inaccuracies could provide additional layers of reliability and optimisation to increase confidence in system performance.
A comparison was made of the additional benefits provided by the AI-VAV control model compared to the traditional VAV control damper, and an assessment was also made of how the control model ensured indoor air quality (IDA 2, not exceeding 1000 ppm). It was found that to ensure that the CO2 concentration never exceeded 1000 ppm, the control model had to be combined with a conventional VAV damper for some short periods. In this case, an additional 7.5% of energy is saved for heating and electricity compared to a pure VAV system. The other modelled option is when only the AI-VAV control is used. Then, the energy savings are higher, 12.5%, but the CO2 concentration is slightly above 1000 ppm, 1.5% of the time. Such a deviation in CO2 concentration seems very insignificant, knowing that 5% of occupants are always unhappy with indoor comfort (according to O. Fanger’s theory).
There are no studies that directly compare the improvement of VAV system control using AI models with occupancy-based CO2 predictions. However, to provide an indication of how much VAV system control could be improved, some examples can be mentioned. For instance, a neural network-based predictive control strategy for VAV systems designed by Wei et al. [43] achieved 6.12% energy savings. Meanwhile, ANN-based control algorithms for VAV terminal units proposed by Kim and Cho [44] have demonstrated substantial reductions in energy consumption, specifically achieving a 16.7% reduction in supply fan energy and a 19.5% reduction in reheat coil energy. Therefore, in general, the AI-VAV model with up to 12.5% energy savings is in line with other models. Furthermore, the authors of the study have provided energy savings per person, so that, knowing the design number of occupants, potential energy savings could be calculated for any office room.
Nevertheless, the AI-VAV model is superior to VAV system control and requires a minimum of 4 weeks of data to train the system to a sufficient level of flow prediction and ventilation control. The AI-VAV model can be effectively integrated into building management systems (BMS) by using real-time data from occupancy and environmental sensors via protocols such as BACnet or Modbus [45,46]. The model can be deployed on local BMS controllers or edge computing devices to ensure low delay predictions (within 1–2 min). Control algorithms will dynamically adjust ventilation based on live occupancy predictions [47], while fallback mechanisms will maintain IAQ standards when deviations occur. Real-world validation and optimisation strategies, such as efficient communication protocols and fast machine learning inference, will further ensure reliable deployment.

4.2. Limitations of the Study

The microclimate station with CO2 sensor was installed at a height of 1.2 m, corresponding to the level of a seated person. However, this installation was limited to a single point within the room, to maintain the sensor in a central position within the room, provided that this did not disrupt the activities of the employees. As the air supply and extraction in all rooms of the space is carried out in the upper zone, which is not an optimal air exchange scheme for workrooms, the efficiency of the air exchange and the CO2 concentration in the room may not be perfectly uniform, and the values analysed may vary slightly from one point of the space to another. To address this limitation in future work, it is suggested to implement a sensor array strategy, which involves deploying multiple CO2 sensors throughout the room to capture spatial variations more accurately. Sensors should be placed in strategic locations, such as near ventilation outlets, in areas with high occupancy, and in regions where CO2 sources are likely to be concentrated. By using a sensor array, a more comprehensive and representative data set could be obtained, enhancing the accuracy of the air quality assessments and improving the reliability of the findings regarding the energy savings predicted by the model.
The second limitation is that the training of the prediction models was based on historical long-term data, as there was no possibility of connecting to a specific BMS system and utilising also real-time data, by creating a hybrid approach. This is a planned aspect of the future testing of the model, and it is also anticipated that the efficacy of the prediction will be enhanced, as ELM models demonstrate optimal performance when using real-time data.
The study demonstrated that prediction models perform optimally with normal office occupancies and are less efficient with low occupancies. However, the impact of applying data augmentation methods on model performance was not considered. To address the issue of low performance in low-occupancy conditions, the application of data augmentation methods is a potential solution. To facilitate the model’s capacity to learn from a more extensive array of occupancy scenarios, thereby enhancing its ability to generalise and increase the accuracy of its predictions, the utilisation of synthetic data generation is a viable approach. This method involves the simulation of higher occupancy scenarios, resulting in the generation of additional data points that emulate elevated occupancy levels. In addition, transfer learning can be employed to enhance the model’s performance. This involves leveraging pre-trained models on similar datasets with higher occupancy levels, such as those from Building A. An alternative approach involves the implementation of noise addition, a method that incorporates random perturbations into the data points. This technique has been demonstrated to enhance the model’s resilience to variations and anomalies in occupancy data. This approach is designed to prevent the model from overfitting to specific patterns in the training data, thereby enhancing its performance on unseen data. As demonstrated in the extant literature, including but not limited to the following sources [48,49,50,51], the utilisation of these methods has been shown to enhance the accuracy and robustness of the occupancy prediction model, thereby ensuring more reliable predictions even in cases of consistently low occupancy levels. Consequently, this represents a promising avenue for future research aimed at enhancing the efficacy of the model.

5. Conclusions

The development of an AI-VAV model for the control of ventilation systems represents a significant contribution to the field of energy consumption optimisation in non-residential buildings. Furthermore, the proposed AI-VAV model has the potential to reduce energy consumption and the carbon footprint, thereby advancing long-term sustainability goals.
Conventional constant flow ventilation systems are controlled by static operating modes that are set in the building management systems. Variable air volume or demand-controlled ventilation systems are controlled by standard sensors that detect the current situation and vary the ventilation intensity accordingly, based on factors such as occupancy and CO2 concentration. This study presents the AI-VAV dynamic control model based on experimental studies, which allows for the simulation of open-plan office space, the prediction of user behaviour (occupancy), and the enabling of the system to react in advance to meet potential needs, such as those on indoor air quality, and to influence thermal comfort parameters (air temperature, relative humidity, air velocity) based on the aforementioned prediction. The proposed model represents a significant advancement in indoor air quality prediction and pre-operation of the ventilation system compared to existing models. It offers control with greater precision and efficiency than current systems. The principal findings of the study are as follows:
-
The accuracy of the predictions: the hybrid ELM with both optimisation methods, namely simulated annealing (SA) and genetic algorithm (GA), demonstrated a high level of prediction accuracy throughout the entire experimental period, with an R2 value of 0.73–0.74 and an RMSE value of 1.8–1.9. The accuracy of the AI-VAV model is contingent upon occupancy density and is therefore unsuitable for use in offices with very low occupancies. Monitoring data collected from different periods, including in atypical circumstances (COVID-19 pandemic), enabled us to demonstrate this sensitivity.
-
The reliability of the prediction: four weeks of observation data (in 5 min increments) is sufficient for the reliable prediction of the occupancy.
-
Energy savings: AI-VAV control provides an additional energy savings potential of up to 12.5% compared to traditional VAV systems.
This study extends the field of building automation and intelligent energy management research by simultaneously testing the performance of the advanced artificial intelligence algorithm and the operation control of the ventilation system. Further research would include developing the prototype of the AI-VAV system and testing it in real conditions.

Author Contributions

Conceptualization, V.M. and R.D.-T.; methodology, J.B. and V.M.; software, J.B.; validation, J.B. and V.M.; formal analysis, J.B., V.M. and R.D.-T.; investigation, J.B.; resources, V.M., R.D.-T. and V.R.; data curation, V.M.; writing—original draft preparation, V.M., R.D.-T. and V.R.; writing—review and editing, V.M., R.D.-T. and V.R.; visualisation, J.B. and V.M.; supervision, V.M.; project administration, V.M. and V.R.; funding acquisition, V.M. and V.R. All authors have read and agreed to the published version of the manuscript.

Funding

The research was co-funded by the European Union under Horizon Europe programme grant agreement no. 101059903; and by the European Union funds for the period 2021–2027 and the state budget of the Republic of Lithuania financial agreement no. 10-042-P-0001.

Institutional Review Board Statement

Not applicable.

Informed Consent Statement

Not applicable.

Data Availability Statement

The raw data supporting the conclusions of this article will be made available by the authors on request.

Conflicts of Interest

The authors declare no conflicts of interest.

Abbreviations

The following abbreviations are used in this manuscript:
AIArtificial intelligence
AI-VAV Variable air volume system controlled using artificial intelligence
ANNArtificial neural networks
CAVConstant air volume
COVID-19Coronavirus disease 2019
DCVDemand-controlled ventilation
ELMExtreme learning machine
ELM-SAExtreme learning machine with simulated annealing
EPGEnergy performance gap
FLCFuzzy logic controllers
GAGenetic algorithms
HVACHeating, ventilation, and air conditioning
IAQIndoor air quality
IDAIndoor air quality standard category
IEQIndoor environment quality
IEAInternational energy agency
MPCModel predictive control
NZENet zero emissions
OBMPCOccupant-number-based model predictive control
RLReinforcement learning
SASimulated annealing
VAVVariable air volume
VFDVariable frequency drive

References

  1. International Energy Agency. Available online: https://www.iea.org/reports/renovation-of-near-20-of-existing-building-stock-to-zero-carbon-ready-by-2030-is-ambitious-but-necessary (accessed on 3 May 2024).
  2. European Commission. Available online: https://ec.europa.eu/commission/presscorner/detail/en/ip_23_6423 (accessed on 3 May 2024).
  3. Jain, N.; Burman, E.; Stamp, S.; Mumovic, D.; Davies, M. Cross-Sectoral Assessment of the Performance Gap Using Calibrated Building Energy Performance Simulation. Energy Build. 2020, 224, 110271. [Google Scholar] [CrossRef]
  4. van Dronkelaar, C.; Dowson, M.; Spataru, C.; Mumovic, D. A Review of the Regulatory Energy Performance Gap and Its Underlying Causes in Non-Domestic Buildings. Front. Mech. Eng. 2016, 1, 17. [Google Scholar] [CrossRef]
  5. Hernandez-Cruz, P.; Giraldo-Soto, C.; Escudero-Revilla, C.; Hidalgo-Betanzos, J.M.; Flores-Abascal, I. Energy Efficiency and Energy Performance Gap in Centralized Social Housing Buildings of the Basque Country. Energy Build. 2023, 298, 113534. [Google Scholar] [CrossRef]
  6. Motuzienė, V.; Bielskus, J.; Lapinskienė, V.; Rynkun, G. Office Building’s Occupancy Prediction Using Extreme Learning Machine Model with Different Optimization Algorithms. Environ. Clim. Technol. 2021, 25, 525–536. [Google Scholar] [CrossRef]
  7. Motuzienė, V.; Lapinskienė, V.; Rynkun, G. Optimizing Ventilation Systems for Sustainable Office Buildings: Long-Term Monitoring and Environmental Impact Analysis. Sustainability 2024, 16, 984. [Google Scholar] [CrossRef]
  8. Cozza, S.; Chambers, J.; Deb, C.; Scartezzini, J.L.; Schlüter, A.; Patel, M.K. Do Energy Performance Certificates Allow Reliable Predictions of Actual Energy Consumption and Savings? Learning from the Swiss National Database. Energy Build. 2020, 224, 110235. [Google Scholar] [CrossRef]
  9. Newsham, G.R.; Mancini, S.; Birt, B.J. Do LEED-Certified Buildings Save Energy? Yes, But. Energy Build. 2009, 41, 897–905. [Google Scholar] [CrossRef]
  10. Cozza, S.; Chambers, J.; Brambilla, A.; Patel, M.K. In Search of Optimal Consumption: A Review of Causes and Solutions to the Energy Performance Gap in Residential Buildings. Energy Build. 2021, 249, 111253. [Google Scholar] [CrossRef]
  11. Zare, N.; Shafaat, A.; Asadi, S. Review of Energy Performance Gap and Solutions in Residential Buildings. In Proceedings of the IOP Conference Series: Earth and Environmental Science, Depok, Indonesia, 27–28 August 2022; Institute of Physics: London, UK, 2022; Volume 1085, p. 15DUMMY. [Google Scholar]
  12. Wang, H.; Chen, X.; Vital, N.; Duffy, E.; Razi, A. Energy Optimization for HVAC Systems in Multi-VAV Open Offices: A Deep Reinforcement Learning Approach. Appl. Energy 2024, 356, 122354. [Google Scholar] [CrossRef]
  13. Prince; Hati, A.S. A Comprehensive Review of Energy-Efficiency of Ventilation System Using Artificial Intelligence. Renew. Sustain. Energy Rev. 2021, 146, 111153. [Google Scholar] [CrossRef]
  14. Yayla, A.; Świerczewska, K.S.; Kaya, M.; Karaca, B.; Arayıcı, Y.; Ayözen, Y.E.; Tokdemir, O.B. Artificial Intelligence (AI)-Based Occupant-Centric Heating Ventilation and Air Conditioning (HVAC) Control System for Multi-Zone Commercial Buildings. Sustainability 2022, 14, 16107. [Google Scholar] [CrossRef]
  15. Gholamzadehmir, M.; Del Pero, C.; Buffa, S.; Fedrizzi, R.; Aste, N. Adaptive-Predictive Control Strategy for HVAC Systems in Smart Buildings—A Review. Sustain. Cities Soc. 2020, 63, 102480. [Google Scholar] [CrossRef]
  16. Saber, E.M.; Chaer, I.; Gillich, A.; Ekpeti, B.G. Review of Intelligent Control Systems for Natural Ventilation as Passive Cooling Strategy for UK Buildings and Similar Climatic Conditions. Energies 2021, 14, 4388. [Google Scholar] [CrossRef]
  17. Esrafilian-Najafabadi, M.; Haghighat, F. Occupancy-Based HVAC Control Systems in Buildings: A State-of-the-Art Review. Build. Environ. 2021, 197, 107810. [Google Scholar] [CrossRef]
  18. Anand, P.; Cheong, D.; Sekhar, C. A Review of Occupancy-Based Building Energy and IEQ Controls and Its Future Post-COVID. Sci. Total Environ. 2022, 804, 150249. [Google Scholar] [CrossRef] [PubMed]
  19. Li, B.; Cai, W. A Novel CO2-Based Demand-Controlled Ventilation Strategy to Limit the Spread of COVID-19 in the Indoor Environment. Build. Environ. 2022, 219, 109232. [Google Scholar] [CrossRef]
  20. Ren, C.; Yu, H.; Wang, J.; Zhu, H.C.; Feng, Z.; Cao, S.J. Zonal Demand-Controlled Ventilation Strategy to Minimize Infection Probability and Energy Consumption: A Coordinated Control Based on Occupant Detection. Environ. Pollut. 2024, 345, 123550. [Google Scholar] [CrossRef]
  21. Zhang, W.; Zhang, W.; Bai, Y.; Wen, S. Enhancing Indoor Environmental Quality: Personalized Recommendation Method for Demand-Oriented Indoor Ventilation Strategy. Sustain. Cities Soc. 2024, 101, 105061. [Google Scholar] [CrossRef]
  22. Jiang, Z.; Deng, Z.; Wang, X.; Dong, B. PANDEMIC: Occupancy Driven Predictive Ventilation Control to Minimize Energy Consumption and Infection Risk. Appl. Energy 2023, 334, 120676. [Google Scholar] [CrossRef]
  23. Lee, D.; Lee, S.T. Artificial Intelligence Enabled Energy-Efficient Heating, Ventilation and Air Conditioning System: Design, Analysis and Necessary Hardware Upgrades. Appl. Therm. Eng. 2023, 235, 121253. [Google Scholar] [CrossRef]
  24. Chen, Z.; Jiang, C.; Xie, L. A Novel Ensemble ELM for Human Activity Recognition Using Smartphone Sensors. IEEE Trans. Ind. Inform. 2019, 15, 2691–2699. [Google Scholar] [CrossRef]
  25. Jiang, C.; Chen, Z.; Su, R.; Masood, M.K.; Soh, Y.C. Bayesian Filtering for Building Occupancy Estimation from Carbon Dioxide Concentration. Energy Build. 2020, 206, 109566. [Google Scholar] [CrossRef]
  26. Sun, Y.; Haghighat, F.; Fung, B.C.M. A Review of The-State-of-the-Art in Data-Driven Approaches for Building Energy Prediction. Energy Build. 2020, 221, 110022. [Google Scholar] [CrossRef]
  27. Zhou, S.L.; Shah, A.A.; Leung, P.K.; Zhu, X.; Liao, Q. A Comprehensive Review of the Applications of Machine Learning for HVAC. DeCarbon 2023, 2, 100023. [Google Scholar] [CrossRef]
  28. Adegoke, M.; Hafiz, A.; Ajayi, S.; Olu-Ajayi, R. Application of Multilayer Extreme Learning Machine for Efficient Building Energy Prediction. Energies 2022, 15, 9512. [Google Scholar] [CrossRef]
  29. Li, P.; Anduv, B.; Zhu, X.; Jin, X.; Du, Z. Diagnosis for the Refrigerant Undercharge Fault of Chiller Using Deep Belief Network Enhanced Extreme Learning Machine. Sustain. Energy Technol. Assess. 2023, 55, 102977. [Google Scholar] [CrossRef]
  30. Huang, G.B.; Zhu, Q.Y.; Siew, C.K. Extreme Learning Machine: A New Learning Scheme of Feedforward Neural Networks. In Proceedings of the IEEE International Conference on Neural Networks—Conference Proceedings, Budapest, Hungary, 25–29 July 2004; Volume 2, pp. 985–990. [Google Scholar]
  31. Zaritsky, A.; Sipper, M. The Preservation of Favored Building Blocks in the Struggle for Fitness: The Puzzle Algorithm. IEEE Trans. Evol. Comput. 2004, 8, 443–455. [Google Scholar] [CrossRef]
  32. Zhan, S.H.; Lin, J.; Zhang, Z.J.; Zhong, Y.W. List-Based Simulated Annealing Algorithm for Traveling Salesman Problem. Comput. Intell. Neurosci. 2016, 2016, 1–12. [Google Scholar] [CrossRef] [PubMed]
  33. Ruiz-Torrubiano, R.; Suárez, A. Hybrid Approaches and Dimensionality Reduction for Portfolio Selection with Cardinality Constraints. IEEE Comput. Intell. Mag. 2010, 5, 92–107. [Google Scholar] [CrossRef]
  34. EN 16798-3:2017; Energy Performance of Buildings—Ventilation for Buildings—Part 3: For Non-Residential Buildings—Performance Requirements for Ventilation and Room-Conditioning Systems (Modules M5-1, M5-4). CEN-CENELEC Management Centre: Brussels, Belgium, 2017.
  35. Engineering ToolBox. Available online: https://www.engineeringtoolbox.com/pollution-concentration-rooms-d_692.html (accessed on 6 May 2024).
  36. Hosamo, H.; Mazzetto, S. Data-Driven Ventilation and Energy Optimization in Smart Office Buildings: Insights from a High-Resolution Occupancy and Indoor Climate Dataset. Sustainability 2025, 17, 58. [Google Scholar] [CrossRef]
  37. Dimitroulopoulou, C.; Bartzis, J. Ventilation Rates in European Office Buildings: A Review. Indoor Built Environ. 2014, 23, 5–25. [Google Scholar] [CrossRef]
  38. Motuzienė, V.; Bielskus, J.; Lapinskienė, V.; Rynkun, G.; Bernatavičienė, J. Office Buildings Occupancy Analysis and Prediction Associated with the Impact of the COVID-19 Pandemic. Sustain. Cities Soc. 2022, 77, 103557. [Google Scholar] [CrossRef] [PubMed]
  39. Li, T.; Liu, X.; Li, G.; Wang, X.; Ma, J.; Xu, C.; Mao, Q. A Systematic Review and Comprehensive Analysis of Building Occupancy Prediction. Renew. Sustain. Energy Rev. 2024, 193, 114284. [Google Scholar] [CrossRef]
  40. ASHRAE Handbook—Fundamentals (Chapter 19: Energy Estimating and Modeling Methods); American Society of Heating, Refrigerating and Air-Conditioning Engineers: Peachtree Corners, GA, USA, 2017.
  41. Abdel Haleem, S.M.; Pavlak, G.S.; Bahnfleth, W.P. Performance of Advanced Control Sequences in Handling Uncertainty in Energy Use and Indoor Environmental Quality Using Uncertainty and Sensitivity Analysis for Control Components. Energy Build. 2020, 225, 110308. [Google Scholar] [CrossRef]
  42. ANSI/ASHRAE Standard 62.1-2022; Ventilation for Acceptable Indoor Air Quality. American Society of Heating, Refrigerating and Air-Conditioning Engineers: Atlanta, GA, USA, 2022.
  43. Wei, D.; Ma, J.; Jiao, H.; Ran, Y. Model Predictive Control for Multi-Zone Variable Air Volume Systems Based on Artificial Neural Networks. J. Process Control 2022, 118, 185–201. [Google Scholar] [CrossRef]
  44. Kim, H.-J.; Cho, Y.-H. Optimization of Supply Air Flow and Temperature for VAV Terminal Unit by Artificial Neural Network. Case Stud. Therm. Eng. 2022, 40, 102511. [Google Scholar] [CrossRef]
  45. Wei, S.; Tien, P.W.; Chow, T.W.; Wu, Y.; Calautit, J.K. Deep Learning and Computer Vision Based Occupancy CO2 Level Prediction for Demand-Controlled Ventilation (DCV). J. Build. Eng. 2022, 56, 104715. [Google Scholar] [CrossRef]
  46. Xu, K.; Chen, Z.; Xiao, F.; Zhang, J.; Zhang, H.; Ma, T. Semantic Model-Based Large-Scale Deployment of AI-Driven Building Management Applications. Autom. Constr. 2024, 165, 105579. [Google Scholar] [CrossRef]
  47. Shi, S.; Miyata, S.; Akashi, Y. Event-Driven Model-Based Optimal Demand-Controlled Ventilation for Multizone VAV Systems: Enhancing Energy Efficiency and Indoor Environmental Quality. Appl. Energy 2025, 377, 124683. [Google Scholar] [CrossRef]
  48. Fang, H.; Tan, H.; Kosonen, R.; Yuan, X.; Jiang, K.; Ding, R. Study of the Data Augmentation Approach for Building Energy Prediction beyond Historical Scenarios. Buildings 2023, 13, 326. [Google Scholar] [CrossRef]
  49. Wang, G.; Wang, Z.; Tang, P.; Zheng, J.; Ren, X.; Feng, B.; Ma, C. OccGen: Generative Multi-Modal 3D Occupancy Prediction for Autonomous Driving. arXiv 2024, arXiv:2404.15014. [Google Scholar]
  50. Doma, A.; Amara, F.; Ouf, M. A Parameter-Based Transfer Learning Approach for Predicting Occupancy in Institutional Buildings; Department of Building, Civil, and Environmental Engineering, Concordia University, Canada Hydro Quebec: Quebec, QC, Canada, 2024. [Google Scholar]
  51. Li, B.; Jin, X.; Wang, J.; Shi, Y.; Sun, Y.; Wang, X.; Ma, Z.; Xie, B.; Ma, C.; Yang, X.; et al. OccScene: Semantic Occupancy-Based Cross-Task Mutual Learning for 3D Scene Generation. arXiv 2024, arXiv:2412.11183. [Google Scholar]
Figure 1. Algorithm of the AI-VAV model for optimising the control of ventilation systems.
Sustainability 17 04140 g001
Figure 2. Mounting of sensors (red circles) in Building B: (a) PIR sensors under the desk; (b) indoor climate measurement station with CO2 sensor.
Sustainability 17 04140 g002
Figure 3. The location of occupancy-monitoring PIR sensors: (a) Building A; (b) Building B; (c) Building C. Note: dark circles show occupied tables.
Sustainability 17 04140 g003
Figure 4. Standard structure for SLFNN.
Sustainability 17 04140 g004
Figure 5. Diagram of indoor air change and CO2 concentration change.
Sustainability 17 04140 g005
Figure 6. Monitored occupancy density in terms of duration (compared to the measured period).
Sustainability 17 04140 g006
Figure 7. Monitoring data on CO2 concentration in terms of duration (compared to the measured period).
Sustainability 17 04140 g007
Figure 8. AI-VAV training results for Building A in the fifth test.
Sustainability 17 04140 g008
Figure 9. AI-VAV and VAV carbon dioxide recurrence histogram for Building A: (a) the results of the third test; (b) the results of the fifth test.
Sustainability 17 04140 g009
Table 1. Main characteristics of monitored buildings.
BuildingYear of Construction,
Heated Area
Energy Performance ClassHeating Energy Demand,
kWh/m2/Year
Monitoring Period
DesignActual *
A
Engineering company office
2017,
22,164 m2
B,
LEED GOLD
1956Before the pandemicFrom 01 August 2019
to 30 December 2019
B
Engineering company office
2017,
2405 m2
B4359From total lockdown to the post-quarantine periodFrom 5 January 2021
to 27 November 2021
C
University office
2014,
4107 m2
B26174Post-quarantineFrom 16 December 2021
to 30 May 2022
* Note—to eliminate the influence of the external air temperature, consumption was normalised—recalculated at standard outdoor temperatures.
Table 2. Brief description of monitored spaces (open-plan offices).
Building ABuilding BBuilding C
Area, m2168123.5793.1
Height, m2.93.322.80
Designed supply/extract air flow rate, m3/h-505/400-
Diameter and quantity of air supply ducts8 branches with a diameter of 125 mm2 branches with a diameter of 160 mm-
Diameter and quantity of air extract ductsGrille in the wall8 branches with a diameter of 200 mm-
Number of desks32148
Table 3. Data used for control model development.
BuildingMonitoring Duration in WeeksInitial Data Set
(Extracted from Sensors)
Data Set Used for Prediction
(Unified 5 Min Time Step)
CO2,
5 Min Step
Occupancy,
1 Min
CO2Occupancy
A2141,587207,93116,27916,279
B4793,814469,07059,61659,616
C2243,056215,27643,05643,056
Table 4. Assumptions used for energy savings calculations.
Assumed ParameterValue
Duration of the heating season, days225
Duration of the cooling season, days140
The average outdoor temperature of the heating season, °C0.2
The average indoor temperature during the heating period, °C22
AHU fan efficiency, %50
AHU fans motors efficiency, %90
Heat recovery thermal efficiency, %70
Pressure losses of the ventilation system, Pa350
Table 5. Forecasting reliability at different occupation conditions for building B.
Severe Quarantine
(Extremely Low Occupation)
Light Quarantine
(Low Occupation)
Post-Quarantine
(Normal Occupation)
R20.270.50.56
RMSE0.760.630.75
Table 6. Tests of AI-VAV model in different conditions.
TestBuildingsAI-VAV Training StepsThe Ventilation System Is Controlled by AI-VAV and/or VAVIAQ Is Not Ensured If CO2 Is More Than 1000 ppm,
% of Time
Forecasting
Reliability
Outcome
RMSER2
IB100AI-VAV-0.610.07Not trained, low reliability
C-0.590.20Not trained, low reliability
IIA8000AI-VAV----
C2.20.630.33Trained, lower than average reliability
IIIA9500AI-VAV1.62.170.71Trained, sufficient reliability
C10,0001.50.590.34Trained, lower than average reliability
IVA9500AI-VAV3.73.380.29Trained, low reliability
C10,000 only working hours01.280.20Not trained, low reliability
VA9500The AI-VAV is on, except when the CO2 level is above 950 ppm. In that case, the VAV will bring it down to below 900 ppm.02.280.70Trained, sufficient reliability
C10,00000.610.30Trained, lower than average reliability
Table 7. Duration of non-assurance of air quality for validation of AI-VAV methodology.
Building ACO2 Concentration,
When More Than 1000 ppm
TestPeriod
(Time Steps)
Duration, Hours≥1000 ppm, Hours≥1000 ppm, %
III678656691.6%
V678656600.0%
Table 8. The potential for energy savings using different ventilation control options.
TestElectricity,
kWh/person
Heat,
kWh/person
Electricity
Difference, %
Heat
Difference, %
AI-VAVVAVCAVAI-VAVVAVCAVAI-VAV/VAVAI-VAV/CAVAI-VAV/VAVAI-VAV/CAV
III9.510.944.629.533.9138.712.9%78.7%12.9%78.7%
V10.311.144.632.034.6138.77.5%76.9%7.5%76.9%
Disclaimer/Publisher’s Note: The statements, opinions and data contained in all publications are solely those of the individual author(s) and contributor(s) and not of MDPI and/or the editor(s). MDPI and/or the editor(s) disclaim responsibility for any injury to people or property resulting from any ideas, methods, instructions or products referred to in the content.

