Abstract
Replacing peat with biochar in nursery growing media could help offset carbon emissions and reduce environmental degradation caused by mining wetlands for peat. However, the effects of replacing peat with biochar on CO2 emissions are little known. In this study, we measured CO2 flux rates in growing media with varying proportions of biochar (0%, 25%, 50%, 75%, and 100% levels) as a replacement for peat. Overall, we found that higher biochar levels (≥75%) in growing media resulted in a reduction in CO2 fluxes compared to pure peat (0% biochar), approaching near-zero emissions. In contrast, lower biochar levels (≤25%) had little to no effect on CO2 fluxes. When the growing media was fertigated or irrigated, we observed a decrease in CO2 fluxes in mixes containing 25%, 50%, and 75% biochar, though this effect was absent in mixes that were pure peat or pure biochar, suggesting that irrigation and fertilization regimes could be strategized to enhance biochar’s carbon emission impacts. Our study offers insights into the development of sustainable growing media to reduce the carbon footprint of horticulture and forestry nursery production systems and may help balance productivity with environmental conservation.
1. Introduction
Biochar, the carbon (C)-rich product derived from biomass combusted in an oxygen-limited environment (i.e., pyrolysis), transforms carbon (C) sequestered from the atmosphere by plants into a stable form that can be stored in soil or added to peat-based growing media used in nurseries [1]. Replacing peat with biochar in nurseries and other operations could offset the greenhouse gas (GHG) emissions and environmental degradation caused by mining wetlands for peat [2,3]. The United States’ (US) market uses approximately 2 Tg of peat annually, with a significant carbon and environmental footprint. Approximately 80% of the peat consumed in the US is imported, with >95% sourced from Canada [1,4]. This supply may become unstable if Canada bans peat mining (as the U.K. planned for 2024) [5] or reduces its use to curtail GHG emissions. The looming import tariff negotiations between US and Canada further add to the uncertainty of importing Canadian peat to the US. For forests and horticultural nurseries, peat is critical for growing containerized seedlings [6,7]. For example, peat is the primary medium for growing containerized nursery seedlings in commercial pines of the southern United States, especially longleaf pine (Pinus palustris Mill.). Approximately 240 million container-grown southern yellow pine seedlings are produced annually in the southern United States. Similarly, containerized nurseries produce the majority of northern and western commercial conifer seedlings [8,9]. During nursery operations, peat is usually discarded after use, and its decomposition further contributes to GHG emissions [10]. Damaged peatlands are an additional source of GHG emissions, responsible for almost 5–10% of global anthropogenic CO2 emissions [2,10,11]. Additionally, the environmental impact of horticultural production, including CO2 fluxes from container systems, has been highlighted [12].
Studies have suggested that as much as 80% of peat moss could be substituted by pine-derived biochar in commercial container mixes [13,14]. If 80% of peat moss can be replaced by pine-derived biochar, it is estimated that 0.12 M m3, 0.05 M m3, and 2.08 M m3 of peat moss could be saved annually in the US, the United Kingdom, and Europe [3]. This is equivalent to approximately 46.2 M m2, 19.2 M m2, and 800 M m2 of peatland saved annually from being disturbed in the US, the United Kingdom, and Europe, respectively [3].
With its high cation exchange capacity (CEC) as well as its ability to absorb water and nutrients, biochar’s properties closely resemble those of peat [15,16,17]. Multiple studies have demonstrated that biochar improves seed germination and seedling growth for a variety of plants [18,19]. Several studies have also examined biochar or other wood-based substitutes’ effects on CO2 emissions when used as peat replacements, though findings of these studies have been mixed. Some of these studies suggest that amended peat mixes result in lower carbon emissions due to woody substitutes or biochar’s addition [20,21]. However, others indicate that biochar can increase CO2 fluxes under certain conditions, particularly when exposed to moisture or nutrients [22,23]. While these studies provide important insights, most studies focus on biochar as a soil amendment rather than as a component of nursery media, leaving a gap in understanding of biochar’s direct impact on carbon flux in peat-based substrates. Nevertheless, biochar is more chemically resistant to microbial decomposition than peat [24], which is expected to lead to reduced CO2 emissions when added to peat [11]. However, frequent fertilization and irrigation inputs in typical nursery production systems could complicate the carbon flux dynamics.
Therefore, we conducted this study to examine the effects of adding biochar to peat on CO2 fluxes. For this purpose, we added biochar to peat in varying proportions and measured the CO2 fluxes of these mixtures. In forestry and horticultural operations, the plants grown in peat mixes are regularly irrigated and often fertilized [25]. Irrigation and fertilizers can affect and even increase CO2 emissions over time in these growing systems [26,27]. This is likely due to increased microbial activity following moisture and nutrient inputs. However, these effects may diminish as sources are consumed and microbial communities stabilize. Therefore, we measured CO2 fluxes in peat–biochar mixes treated with irrigation and fertigation over time.
Our specific objectives were to quantify (1) CO2 flux rates in peat mixes with varying proportions of biochar (0–100%), and (2) changes in CO2 flux rates over time in these mixes treated with irrigation and fertigation. We expected that (1) adding biochar would reduce CO2 fluxes from the peat mixes and that a higher proportion of biochar would result in a greater reduction in fluxes, and (2) that irrigation and fertigation would lead to higher CO2 fluxes, which would decrease over time since treatment. This study helps determine if replacing peat with biochar in nursery growing mixes could lead to a change in CO2 emissions. Findings of this study further our understanding of the CO2 flux dynamics in peat–biochar mixes and inform the development of sustainable growing systems with reduced emissions. Our study does not assess plant growth in different growing mixes.
2. Materials and Methods
2.1. Media Preparation and Experimental Treatments and Design
We added biochar to peat moss at five levels (0%, 25%, 50%, 75%, and 100% biochar by volume) to prepare five peat–biochar mixes. The peat moss used was Sun Gro Horticulture, a commonly used potting medium in forestry and horticultural nursery production. Sun Gro Horticulture (Sun Gro Horticulture Canada Ltd., Mississauga, ON, Canada) contains 75–85% sphagnum peat moss, perlite, dolomite, and 0.25% silicon dioxide. Biochar was procured from The Ashwood Trinity (Auburn, AL, USA) (https://www.ashwoodtrinity.com). This biochar was manufactured from pine biomass residue in a single pyrolysis batch and contained 85.9% carbon, 6.7% ash, and 0.86% nitrogen. Its bulk density and pH were 190.6 kg m−3 and 7.16, respectively (see Supplemental Data for detailed characteristics of the biochar). The characteristics of the peat–biochar mixes are provided in Table 1. The addition of biochar to peat generally increased pH, sodium, and potassium and consistently decreased phosphorus, calcium, magnesium, copper, and zinc. Electrical conductance and soluble salt concentration were lowest at 50% biochar level and highest at 0% biochar level (Table 1).

Table 1.
Characteristics and nutrient status of peat–biochar mixes used in the study. Biochar was added to peat moss at five levels (0%, 25%, 50%, 75%, and 100% biochar by volume) to prepare five peat–biochar mixes.
Beginning 15 July 2024, each week for the next three weeks, we freshly prepared 15 trays of the peat–biochar mixes (5 biochar levels × 3). The tray dimensions were 41.00 cm × 30.50 cm × 15.25 cm, and each tray contained 4 quarts (3.78 L) of the mix. Each tray/mix received a single application of one of the following three treatments at the start of the measurement period:
- Irrigation: The tray/mix received 500 mL of water.
- Fertigation: The tray received 500 mL of fertilizer solution (492 mL of water mixed with 8 mL of 20-10-20 (N-P-K) fertilizer).
- Untreated control: No water or fertilizer was added to the tray/mix.
Following the treatments, we measured and calculated the CO2 flux rates of the treated mixes (irrigation and fertigation) once daily for four consecutive days (details in Section 2.2). The four-day measurement period was chosen to align with the typical irrigation and fertigation cycle in pine production nursery systems of the southern US, providing a relevant timeframe for observing CO2 flux changes. Measurements for a given week (four days of measurement) formed one replication. All measurements were independently repeated for three weeks using freshly prepared mixes. The three independent weekly measurements constituted the three replications for each treatment.
2.2. CO2 Respiration Measurements
We measured CO2 fluxes of the mixes under dark conditions using a gas analyzer (LI-830 CO2 Gas Analyzer, LI-COR, Inc., Lincoln, NE, USA) and a custom-built gas flux chamber [28]. We constructed this chamber from UV-resistant polycarbonate (Lexan 1/8 in or 3.175 mm thick sheets) sealed with UV-resistant silicone [29]. The chamber dimensions were 30 cm × 30 cm × 30 cm. The chamber featured three ports: two (4.23 mm diameter) for intake and output tubing connected to the gas analyzer, and one for a centrally positioned fan (Apevia CF4S-BK, City of industry, CA, USA) to ensure even air circulation within the chamber. The trays containing the mix were kept indoors, and the chamber was placed over them under dark conditions. The chamber covered 900 cm2 of the peat–biochar media surface in the trays. Air was drawn from the chamber into the gas analyzer using a motorized air pump (KNF NMP830, Trenton, NJ, USA). The intake tube delivered air from the chamber through a debris filter and to the gas analyzer, while the output tube returned air to the chamber. The gas analyzer was programmed to record CO2 concentrations at 0.5 s intervals for 20 min per measurement. We used the data from the final 10 min of each measurement to create a regression equation: y = a + bx (‘y’ the CO2 flux (mmol CO2 m−2) at a given time x (seconds), ‘a’ is the initial CO2 flux when x = 0, and ‘b’ is the slope of the regression line indicating the CO2 flux rate (mmol of CO2 m−2 s−1) of the mix. The measurements were recorded once daily in the morning (5–10 am) for 4 days (Day 1 to 4; Monday–Thursday) for the irrigation and fertigation treatment trays (Irrigation and Fertigation treatments were given one time only on Monday morning one hour before the day’s measurement). Measurements for untreated control trays were recorded on day 1, represented as day 0 in the data, serving as the baseline before any treatments were applied.
2.3. Data Analysis
The main effects of biochar level (0%, 25%, 50%, 75%, and 100% biochar), treatment (irrigation or fertigation), and measurement day (Day 1, 2, 3, and 4) on CO2 flux rate and their interactions were analyzed using a two-way analysis of variance (ANOVA). Tukey’s HSD post hoc tests were used for pairwise comparisons between treatments at alpha = 0.5. Temporal changes in CO2 flux over the four-day measurement period were assessed using a repeated measures ANOVA. Statistical analyses were conducted using R-Studio 3.6.0.
3. Results
We found the main effects of biochar level, treatment, and day on CO2 flux rate to be significant (all with p < 0.001). Interactions between biochar level and treatment (p < 0.001) and between biochar level and day (p < 0.001) were also significant (Table 2).
Table 2.
Main effects and interactions of biochar level, treatment, and day on CO2 flux rate (mmol of CO2 m−2 s−1) obtained from analysis of variance (ANOVA).
3.1. Effects of Combined Treatments and Biochar Level
When considering all treatments together, we observed a decrease in CO2 flux as biochar concentration increased. A mix containing 75% and 100% biochar had significantly lower CO2 flux than the mix containing 0% biochar (p-values < 0.001) (Figure 1). However, there was no significant difference between 0% and 25% biochar levels (p > 0.05).
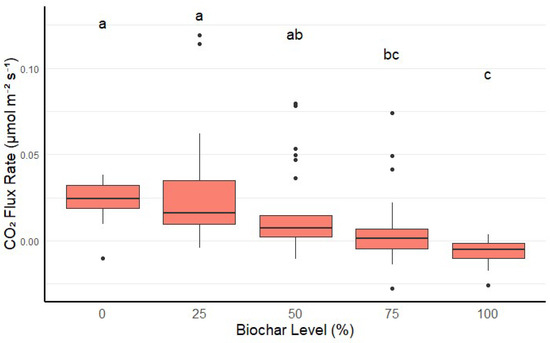
Figure 1.
CO2 flux rate at different biochar levels when considering all treatments together. Higher biochar levels (75% and 100%) significantly reduced CO2 emissions compared to 0% and 25%. Boxes represent interquartile ranges, with the horizontal line indicating each biochar level’s median CO2 flux rate. Values with the same letter (a, b, or c) are not significantly different from each other.
3.2. Effects of Treatment Across Biochar Levels
The impact of treatment (irrigation or fertigation) on CO2 flux rate depended on the biochar level, with no statistical difference observed between the two treatments at any given biochar level (p > 0.05). Fertigation and irrigation significantly decreased CO2 flux rates compared to control treatments in media with 25%, 50%, and 75% biochar levels. For example, at the 50% biochar level, fertigation led to a significantly lower CO2 flux rate (p < 0.01), and the difference was even more pronounced at the 75% biochar level (p < 0.001). However, no significant differences were observed among treatments at 0% and 100% biochar levels (p > 0.05) (Figure 2).
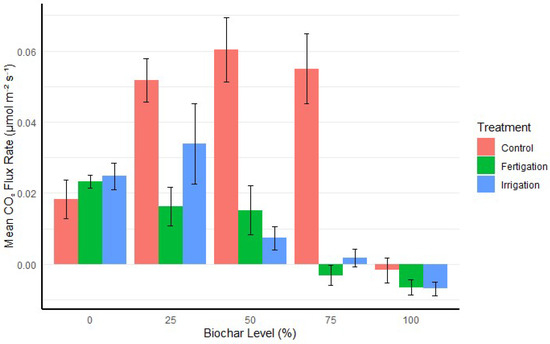
Figure 2.
CO2 flux rates for different biochar levels under irrigation and fertigation (fertilization + irrigation) treatments, including untreated control. Fertigation and irrigation treatments significantly decreased CO2 flux rates at 25%, 50%, and 75% biochar levels compared to control treatments, with no significant differences observed at 0% and 100% biochar levels. Error bars represent the standard error of the mean.
3.3. Temporal Patterns in CO2 Flux
Day had a significant main effect on CO2 flux rate (p < 0.001). However, this effect was only observed in peat–biochar mixes, not in pure peat (0% biochar) or pure biochar (100% biochar) (Figure 3). In peat–biochar mixes, there were substantial changes in CO2 flux rates in the initial day or two of irrigation of fertigation treatments that became increasingly stable by Day 3 and 4. By Day 3 and 4, clear patterns of CO2 flux rates for different treatments had emerged. As expected, we had the highest flux rates for pure peat and the lowest flux rate for pure biochar, with the rest of the treatments varying accordingly between these two extremes (Figure 3).
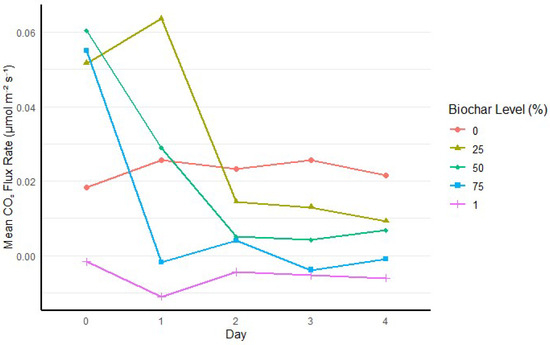
Figure 3.
Temporal patterns in CO2 flux rate across biochar levels over the four-day measurement period. Error bars represent standard error of the mean.
4. Discussion
We found that, overall, adding biochar in large amounts (75% or more) to peat significantly reduced CO2 flux rates compared to conventional peat moss growing medium (Figure 1). However, contrary to our expectations, irrigation and fertigation tended to further reduce flux rates, particularly in higher biochar mixes (50% or higher biochar level). When treatments were analyzed separately, 25–75% biochar levels in the control treatment (no irrigation and fertigation) significantly increased CO2 flux rates relative to peat (0% biochar). At these intermediate biochar levels, biochar likely creates an environment that supports microbial communities, enhancing the microbial decomposition of organic matter and, in turn, increasing CO2 emissions [30]. However, at the 100% biochar level, the lack of organic material likely leads to significantly lower CO2 emissions [31]. Both irrigation and fertigation treatments, however, tended to offset these increases by reducing flux rates (Figure 2).
The interaction between biochar and irrigation/fertigation appears to influence CO2 emissions, likely by modifying microbial activity and nutrient presence. By altering microbial composition and increasing microbial biomass, biochar can influence soil carbon mineralization rates [31]. Biochar’s high surface area and porosity improve soil aeration and water retention, which can affect microbial diversity and activity [32]. The addition of fertilizer may suppress these microbial responses by supplying nutrients that diminish enzymatic processes involved in carbon decomposition [33]. This dual role of biochar in altering both soil properties and microbial activity highlights the complexity of its impact on CO2 emissions and underscores the need to consider biological and chemical interactions when evaluating biochar’s potential for greenhouse gas mitigation. These results also highlight the importance of nutrient management in regulating CO2 emissions in biochar-amended soils and suggest that biochar’s role in greenhouse gas mitigation is highly dependent on environmental and microbial interactions. However, the ability of biochar as a greenhouse gas mitigation tool remains a critical factor for its widespread adoption. Several studies have shown that biochar can significantly sequester carbon over the long term, potentially helping to offset emissions from other sectors of agriculture, but we see the opposite unless soil nutrition is taken into consideration [17,20].
Similar to our observations, Saarnio et al. [34] found that lower application rates of pine-derived biochar were ineffective at lowering CO2 emissions in drained agricultural peat soils and did not mitigate the environmental problems of these soils. In the same study, the incubation of bare peat profiles enhanced peat decomposition, leading to high CO2 emissions (up to 1300 mg CO2 m−2 h−1). The study suggested that higher application rates of biochar pyrolyzed at high temperatures should be examined with peat soils. Our study suggests that replacing peat with biochar may significantly reduce CO2 fluxes; however, a high proportion of biochar, along with fertigation or irrigation, needs to be added to realize CO2 emission reductions in commonly used peat moss media.
Only a few other studies have examined the carbon emission consequences of biochar as a partial substitute for peat in growing media for plant production, reporting varying results. For example, like our study, Messiga et al. [35] found that replacing peat with biochar in growing media increased CO2 emissions. In contrast, Alvarez et al. [23] estimated that biochar and vermicompost could replace up to 20–25% and 30–35% of peat-based substrates, respectively, in ornamental containerized plant production, potentially reducing global CO2 emissions by up to 3 million tons annually. According to a life cycle assessment conducted by Hashemi et al. [11], replacing 25% of peat in growing media with bio-based alternatives, like wood fiber, compost, and hydrochar, could reduce greenhouse gas emissions by 16–33%.
Adding biochar to change the growing media composition will likely also alter plant growth [36], which may change net CO2 fluxes from the plant–mix complex [37]. While some studies have found that biochar could be added to peat at concentrations up to 75% without negatively affecting plant growth and potentially improving pH and electrical conductivity [15], other studies found that high biochar concentrations (70%) negatively affected plant growth and germination due to increased pH and electrical conductivity [38]. In pine nursery production systems, biochar can successfully replace up to 50% of peat in pine seedling production without compromising growth, potentially reducing fertilizer requirements [16,39]. In hardwood seedling production, biochar amendment did not improve Douglas fir seedling quality compared to peat-based growing media, except for slightly increasing cold hardiness and root growth potential [40]. Our study is limited in scope as it did not include plant growth effects of biochar in addition to peat moss. In general, many studies show either positive or neutral effects of biochar additions to soils or peat moss on plant growth [41,42,43,44], with a few studies reporting negative effects [45]. However, most of these studies considered much lower biochar additions by weight to peat or soil than the biochar levels at which we found significantly lowered CO2 fluxes with the use of fertigation and irrigation. Studies are needed to evaluate plant growth and GHG fluxes at higher biochar levels. If mixes with higher levels of biochar and moisture lead to reduced fluxes from the plant–mix complex while maintaining satisfactory plant growth, high biochar level-based mixes could serve as a sustainable alternative to peat, leading to reduced emissions when implementing the correct fertigation strategies, especially in regions where peat mining is ecologically damaging or where peat availability is limited [46]. This shift could have significant policy implications, especially for countries where peat extraction is a major environmental concern (e.g., Canada) and the countries that depend on other countries for peat (e.g., the US which imports 80% of the peat used in the country).
Additionally, our study suggests that combining biochar with fertilizer may help further reduce CO2 emissions while providing essential nutrients, offering a balance between soil health and emission control. We found that fertigation and irrigation tended to result in nearly zero CO2 emissions at 75 to 100% biochar levels. In agricultural and forest restoration, biochar’s potential for emission reduction could support carbon sequestration goals, but its effectiveness could be influenced by factors such as nutrient levels (fertilizers). It is important to note that the impact of biochar may vary by species, ecosystem, or soil type, so management practices should consider these variables for targeted applications. Moreover, our study only considered CO2 fluxes, while other studies have shown that biochar can also lower methane (CH4) and nitrous oxide (N2O) emissions [47]. A more comprehensive analysis of biochar’s greenhouse gas footprints should include other gases, like CH4 and N2O, to fully assess its environmental benefits.
5. Conclusions
Our study demonstrates that incorporating biochar into peat moss can potentially reduce CO2 flux rates, especially at higher concentrations of biochar (75% and 100%) where nutrients are abundant. The negative impact of increased CO2 emissions is lessened by decreased flux rates when irrigation and fertigation are applied, particularly in mixes containing 25–75% biochar. These findings suggest that while high concentrations of biochar can effectively lower CO2 emissions from peat-based growing media, the extent of reduction is influenced by both the amount of biochar and the type of treatment utilized. While this study adds to the evaluation of biochar as a sustainable alternative to peat in forestry and horticultural nursery production systems, the real-world applications would require careful consideration of cost-effectiveness and long-term impacts of biochar integration. With life-cycle assessment, it is critical to determine the carbon intensity of producing and using biochar in horticultural and forestry nursery production systems. Additionally, cost-benefit analyses in commercial horticulture and forestry systems will be essential to assess the scalability of biochar as a sustainable amendment. Future research should also focus on species-specific long-term effects of peat–biochar mixes on both greenhouse gas emissions and plant growth, as well as on optimizing biochar application rates for both greenhouse gas reduction and improved plant growth.
Supplementary Materials
The following supporting information can be downloaded at https://www.mdpi.com/article/10.3390/su17094139/s1. Figure S1: Biochar testing report (International BioChar Initiative (IBI) Laboratory Tests for Certification Program).
Author Contributions
Conceptualization, A.S., J.L., A.M., R.C., C.D. and J.V.; methodology, A.S., J.L. and J.V.; validation, A.S., J.L. and J.V.; formal analysis, J.L.; investigation, J.L. and A.S.; resources, A.S., R.C. and J.V.; data curation, J.L.; writing—original draft, J.L. and A.S.; writing—review and editing, J.L., A.S., A.M., C.D., R.C. and J.V.; visualization, J.L.; supervision, A.S.; project administration, A.S.; funding acquisition, A.S. All authors have read and agreed to the published version of the manuscript.
Funding
This work was supported, in part, by Research Capacity Fund (Hatch), Accession Number 7009308, from the USDA National Institute of Food and Agriculture.
Institutional Review Board Statement
Not applicable.
Informed Consent Statement
Not applicable.
Data Availability Statement
The raw data supporting the conclusions of this article will be made available by the authors on request.
Acknowledgments
The authors acknowledge Nina Payne and Annakay Abrahams of the Southern Forest Nursery Management Cooperative (SFNMC), and Rishi Prasad for providing the space, logistical support, and invaluable project advisement. Marc Ricker of Ashwood Trinity is gratefully acknowledged for providing the biochar used in this study. Auburn University Soil Testing Laboratory performed tests on peat–biochar mixes.
Conflicts of Interest
The authors declare no conflicts of interest. The funders had no role in the design of the study; in the collection, analyses, or interpretation of data; in the writing of the manuscript; or in the decision to publish the results.
Abbreviations
The following abbreviations are used in this manuscript:
| CO2 | Carbon Dioxide |
| GHG | Greenhouse Gas |
| N-P-K | Nitrogen–Phosphorus–Potassium |
| ppm | Parts per million |
References
- Di Lonardo, S.; Baronti, S.; Vaccari, F.P.; Albanese, L.; Battista, P.; Miglietta, F.; Bacci, L. Biochar-based nursery substrates: The effect of peat substitution on reduced salinity. Urban For. Urban Green. 2017, 23, 27–34. [Google Scholar] [CrossRef]
- Loisel, J.; Gallego-Sala, A. Ecological resilience of restored peatlands to climate change. Commun. Earth Environ. 2022, 3, 208. [Google Scholar] [CrossRef]
- Yu, P.; Qin, K.; Niu, G.; Gu, M. Alleviate environmental concerns with biochar as a container substrate: A review. Front. Plant Sci. 2023, 14, 1176646. [Google Scholar] [CrossRef] [PubMed]
- Brioche, A.; National Minerals Information Center; United States Geological Survey. Peat Statistics and Information. 2022. Available online: https://www.usgs.gov/centers/national-minerals-information-center/peat-statistics-and-information (accessed on 4 November 2024).
- GOV.UK. Sale of Horticultural Peat to Be Banned in Move to Protect England’s Precious Peatlands. Available online: https://www.gov.uk/government/news/sale-of-horticultural-peat-to-be-banned-in-move-to-protect-englands-precious-peatlands (accessed on 4 November 2024).
- Starkey, T.; Enebank, S.; South, D.B. Tree Planters’ Notes—Reforestation, Nurseries and Genetics Resources. Rngr. Net. 2015, 58, 1. Available online: https://rngr.net/publications/tpn/58-1 (accessed on 4 November 2024).
- Meng, W.; He, M.; Li, H.; Hu, B.; Mo, X. Greenhouse gas emissions from different plant production system in China. J. Clean. Prod. 2019, 235, 741–750. [Google Scholar] [CrossRef]
- South, D.B.; Enebak, S.A. Forest Nursery Practices in the Southern United States. Reforesta 2016, 1, 106–146. [Google Scholar] [CrossRef]
- Enebak, S.A.; Newell, A. PMSP for Pine Tree Nursery in the Southeastern United States. National IPM Database. 2022. Available online: https://ipmdata.ipmcenters.org/ (accessed on 17 March 2025).
- Harris, L.I.; Richardson, K.; Bona, K.A.; Davidson, S.J.; Finkelstein, S.A.; Garneau, M.; McLaughlin, J.; Nwaishi, F.; Olefeldt, D.; Packalen, M.; et al. The essential carbon service provided by northern peatlands. Front. Ecol. Environ. 2021, 20, 222–230. [Google Scholar] [CrossRef]
- Hashemi, F.; Mogensen, L.; Smith, A.M.; Larsen, S.U.; Knudsen, M.T. Greenhouse gas emissions from bio-based growing media: A life-cycle assessment. Sci. Total Environ. 2024, 907, 167977. [Google Scholar] [CrossRef]
- Marble, S.C.; Prior, S.A.; Runion, G.B.; Torbert, H.A.; Gilliam, C.H.; Fain, G.B.; Sibley, J.L.; Knight, P.R. Determining Trace Gas Efflux from Container Production of Woody Nursery Crops. J. Environ. Hortic. 2012, 30, 118–124. [Google Scholar] [CrossRef]
- Guo, Y.; Niu, G.; Starman, T.; Volder, A.; Gu, M. Poinsettia Growth and Development Response to Container Root Substrate with Biochar. Horticulturae 2018, 4, 1. [Google Scholar] [CrossRef]
- Huang, L.; Yu, P.; Gu, M. Evaluation of Biochar and Compost Mixes as Substitutes to a Commercial Propagation Mix. Appl. Sci. 2019, 9, 4394. [Google Scholar] [CrossRef]
- Steiner, C.; Harttung, T. Biochar as a growing media additive and peat substitute. Solid Earth 2014, 5, 995–999. [Google Scholar] [CrossRef]
- Dumroese, R.K.; Pinto, J.R.; Heiskanen, J.; Tervahauta, A.; McBurney, K.G.; Page-Dumroese, D.S.; Englund, K. Biochar Can Be a Suitable Replacement for Sphagnum Peat in Nursery Production of Pinus ponderosa Seedlings. Forests 2018, 9, 232. [Google Scholar] [CrossRef]
- Dumroese, R.K.; Page-Dumroese, D.S.; Pinto, J.R. Biochar potential to enhance forest resilience, seedling quality, and nursery efficiency. Tree Plant. Notes 2020, 63, 61–68. [Google Scholar]
- Ali, L.; Xiukang, W.; Naveed, M.; Ashraf, S.; Nadeem, S.M.; Haider, F.U.; Mustafa, A. Impact of Biochar Application on Germination Behavior and Early Growth of Maize Seedlings: Insights from a Growth Room Experiment. Appl. Sci. 2021, 11, 11666. [Google Scholar] [CrossRef]
- Das, S.K.; Ghosh, G.K.; Avasthe, R. Evaluating biomass-derived biochar on seed germination and early seedling growth of maize and black gram. Biomass Convers. Biorefin. 2020, 12, 5663–5676. [Google Scholar] [CrossRef]
- Murphy, A.-M.; Runion, G.B.; Prior, S.A.; Torbert, H.A.; Sibley, J.L.; Fain, G.B.; Pickens, J.M. Effects of Growth Substrate on Greenhouse Gas Emissions from Three Annual Species1. J. Environ. Hortic. 2021, 39, 53–61. [Google Scholar] [CrossRef]
- Fryda, L.; Visser, R.; Schmidt, J. Biochar replaces peat in horticulture: Environmental impact assessment of combined biochar & bioenergy production. Detritus 2018, 5, 1. [Google Scholar] [CrossRef]
- Wang, J.; Xiong, Z.; Kuzyakov, Y. Biochar stability in soil: Meta-analysis of decomposition and priming effects. Change Biol. Bioener. 2015, 8, 512–523. [Google Scholar] [CrossRef]
- Alvarez, J.M.; Pasian, C.; Lal, R.; Lopez-Nuñez, R.; Fernández, M. A biotic strategy to sequester carbon in the ornamental containerized bedding plant production: A review. Span. J. Agric. Res. 2018, 16, e03R01. [Google Scholar] [CrossRef]
- Bolan, S.; Hou, D.; Wang, L.; Hale, L.; Egamberdieva, D.; Tammeorg, P.; Li, R.; Wang, B.; Xu, J.; Wang, T.; et al. The potential of biochar as a microbial carrier for agricultural and environmental applications. Sci. Total Environ. 2023, 886, 163968. [Google Scholar] [CrossRef] [PubMed]
- South, D.; Nadel, R. Irrigation in pine nurseries. Reforesta 2020, 10, 40–83. [Google Scholar] [CrossRef]
- Sainju, U.M.; Jabro, J.D.; Stevens, W.B. Soil Carbon Dioxide Emission and Carbon Content as Affected by Irrigation, Tillage, Cropping System, and Nitrogen Fertilization. J. Environ. Qual. 2008, 37, 98–106. [Google Scholar] [CrossRef]
- Jassal, R.S.; Black, T.A.; Roy, R.; Ethier, G. Effect of nitrogen fertilization on soil CH4 and N2O fluxes, and soil and bole respiration. Geoderma 2011, 162, 182–186. [Google Scholar] [CrossRef]
- Tarkhov, M.O.; Matyshak, G.V.; Ryzhova, I.M.; Goncharova, O.Y.; Chuvanov, S.V.; Timofeeva, M.V. Temperature Sensitivity of Peatland Soils Respiration Across Different Terrestrial Ecosystems. Eurasian Soil Sci. 2024, 57, 1616–1627. [Google Scholar] [CrossRef]
- Knight, S.L. Constructing Specialized Plant Growth Chambers for Gas-exchange Research: Considerations and Concerns. HortScience 1992, 27, 767–769. [Google Scholar] [CrossRef]
- Srivastava, P.; Gadi, Y.; Supriya; Bhojendra; Lytand, W.; Singh, B.V.; Katiyar, D. Biochar’s Influence on Soil Microorganisms: Understanding the Impacts and Mechanisms. Int. J. Plant Soil Sci. 2023, 35, 455–464. [Google Scholar] [CrossRef]
- Graaff M-Ade Classen, A.T.; Castro, H.F.; Schadt, C.W. Labile soil carbon inputs mediate the soil microbial community composition and plant residue decomposition rates. New Phytol. 2010, 188, 1055–1064. [Google Scholar] [CrossRef]
- Palansooriya, K.N.; Wong, J.T.F.; Hashimoto, Y.; Huang, L.; Rinklebe, J.; Chang, S.X.; Bolan, N.; Wang, H.; Ok, Y.S. Response of microbial communities to biochar-amended soils: A critical review. Biochar 2019, 1, 3–22. [Google Scholar] [CrossRef]
- Atilano-Camino, M.M.; Canizales, A.P.; Ortega, A.M.; Valenzuela, A.K.; Pat-Espadas, A.M. Impact of Soil Amendment with Biochar on Greenhouse Gases Emissions, Metals Availability and Microbial Activity: A Meta-Analysis. Sustainability 2022, 14, 15648. [Google Scholar] [CrossRef]
- Saarnio, S.; Kekkonen, H.; Lång, K. Addition of softwood biochar did not reduce N2O emissions or N leaching from peat soil in the short term. Sci. Total Environ. 2024, 944, 173906. [Google Scholar] [CrossRef] [PubMed]
- Messiga, A.J.; Hao, X.; Noura Ziadi Dorais, M. Reducing peat in growing media: Impact on nitrogen content, microbial activity, and CO2 and N2O emissions. Can. J. Soil Sci. 2022, 102, 77–87. [Google Scholar] [CrossRef]
- Zulfiqar, F.; Wei, X.; Shaukat, N.; Chen, J.; Raza, A.; Younis, A.; Nafees, M.; Abideen, Z.; Zaid, A.; Latif, N.; et al. Effects of Biochar and Biochar–Compost Mix on Growth, Performance and Physiological Responses of Potted Alpinia zerumbet. Sustainability 2021, 13, 11226. [Google Scholar] [CrossRef]
- Prior, S.A.; Runion, G.B.; Murphy, A.-M.; Hoffman, H.; Johnson, M.G.; Torbert, H.A. Influence of Biochar Addition to Nursery Container Media: Trace Gas Efflux, Growth, and Leachate, N. J. Environ. Hortic. 2023, 41, 141–151. [Google Scholar] [CrossRef]
- García-Rodríguez, Á.F.; Moreno-Racero, F.J.; García de Castro Barragán, J.M.; Colmenero-Flores, J.M.; Greggio, N.; Knicker, H.; Rosales, M.A. Influence of Biochar Mixed into Peat Substrate on Lettuce Growth and Nutrient Supply. Horticulturae 2022, 8, 1214. [Google Scholar] [CrossRef]
- Eskandari, S.; Mohammadi, A.; Sandberg, M.; Eckstein, R.L.; Hedberg, K.; Granström, K. Hydrochar-Amended Substrates for Production of Containerized Pine Tree Seedlings under Different Fertilization Regimes. Agronomy 2019, 9, 350. [Google Scholar] [CrossRef]
- Sarauer, J.; Coleman, M. Douglas-fir seedling quality in biochar-amended peat substrates. Reforesta 2019, 7, 1–14. [Google Scholar] [CrossRef]
- Demirkaya, S.; Ay, A.; Gülser, C.; Kızılkaya, R. Enhancing Clay Soil Productivity with Fresh and Aged Biochar: A Two-Year Field Study on Soil Quality and Wheat Yield. Sustainability 2025, 17, 642. [Google Scholar] [CrossRef]
- Chen, X.; Liu, L.; Yang, Q.; Xu, H.; Shen, G.; Chen, Q. Optimizing Biochar Application Rates to Improve Soil Properties and Crop Growth in Saline–Alkali Soil. Sustainability 2024, 16, 2523. [Google Scholar] [CrossRef]
- Helliwell, R. Effect of biochar on plant growth. Arboric. J. 2015, 37, 238–242. [Google Scholar] [CrossRef]
- Gale, N.V.; Sackett, T.E.; Thomas, S.C. Thermal treatment and leaching of biochar alleviates plant growth inhibition from mobile organic compounds. Peer J. 2016, 4, e2385. [Google Scholar] [CrossRef] [PubMed]
- Schulz, H.; Glaser, B. Effects of biochar compared to organic and inorganic fertilizers on soil quality and plant growth in a greenhouse experiment. J. Plant Nutr. Soil Sci. 2012, 175, 410–422. [Google Scholar] [CrossRef]
- Fidel, R.; Laird, D.; Parkin, T. Effect of Biochar on Soil Greenhouse Gas Emissions at the Laboratory and Field Scales. Soil Syst. 2019, 3, 8. [Google Scholar] [CrossRef]
- Shaukat, M.; Samoy-Pascual, K.; Maas, E.D.; Ahmad, A. Simultaneous effects of biochar and nitrogen fertilization on nitrous oxide and methane emissions from paddy rice. J. Environ. Manag. 2019, 248, 109242. [Google Scholar] [CrossRef]
Disclaimer/Publisher’s Note: The statements, opinions and data contained in all publications are solely those of the individual author(s) and contributor(s) and not of MDPI and/or the editor(s). MDPI and/or the editor(s) disclaim responsibility for any injury to people or property resulting from any ideas, methods, instructions or products referred to in the content. |
© 2025 by the authors. Licensee MDPI, Basel, Switzerland. This article is an open access article distributed under the terms and conditions of the Creative Commons Attribution (CC BY) license (https://creativecommons.org/licenses/by/4.0/).