1. Introduction
The construction sector holds significant global relevance for actions aimed at combating global warming, energy scarcity, preserving natural resources, proper waste disposal, and promoting a circular economy. The sector’s transformative potential and capacity to produce significant effects make it crucial for achieving necessary goals.
The rising need for new buildings is intensifying the depletion of existing non-renewable natural resources, highlighting the need for sustainable consumption. Incorporating alternative materials, particularly those derived from waste, not only helps conserve natural resources but also minimizes the environmental impact of landfills while lowering energy consumption and reducing gas emissions.
The concrete industry plays a significant role in sustainability, as its high consumption means that even small changes can yield substantial results. According to [
1], in Europe in 2019, 86% of the concrete produced belonged to class C30/C37 or lower. The average binder content (cement + additives) was approximately 320 kg/m
3, with an average of 9.1% supplementary cementitious materials, a percentage mainly constrained by the limited availability of inputs to meet demand. Therefore, concrete achieving about 35 MPa compressive strength in cube specimens presents wide commercial opportunities.
The availability of fly ash, which is widely used in concrete production, is decreasing as a result of the closure of coal-fired power plants. Its pozzolanic properties make it an effective alternative to PC. On one hand, the reaction between alumina (Al
2O
3) in fly ash and gypsum in cement during early hydration forms ettringite, which helps fill pores and microcracks, leading to matrix densification. On the other hand, silicates react with available calcium hydroxide (C-H) to form additional C-S-H gel, which plays a crucial role in the development of long-term strength [
2]. As noted in [
3], higher substitution levels result in reduced early-age strength. However, over time, fly ash improves strength development, becoming more pronounced in the long run.
Developed to be ecological, durable, and efficient, high-volume fly ash concrete (HVFA) is formulated with a composition of 50 to 60% fly ash, with studies reporting incorporation rates as high as 70 to 80%. Generally, this substitution is accompanied by the use of superplasticizer to reduce (w/b) ratio, ranging between 0.25 and 0.40 [
2,
4]. Compressive strengths in the range of 80 MPa have been achieved at 90 days for concrete containing 50% fly ash and 40 MPa for concrete containing 80% fly ash [
2].
As the amount of fly ash in concrete rises, the calcium hydroxide formed during cement hydration is unable to fully react with all the fly ash particles, leaving some unreacted in the mixture. As a result, both the pore size and the overall porosity of the matrix increase [
5,
6].
With a higher fly ash content, drying shrinkage is reduced at all stages, primarily due to the reduced water content [
7]. In terms of chloride ion permeability, HVFA concrete demonstrates superior performance. The alumina content boosts the amount of C
3A, while the pozzolanic reaction contributes to the creation of additional C-S-H gel. As a result, HVFA concrete has a high chloride-binding capacity, reducing the availability of free chlorides that could initiate corrosion [
8]. A study by [
9] reported reductions in charge of more than 88.6% for concrete containing 50% fly ash compared to concrete without additives, at 28 days with a w/b of 0.4. However, the lower resistance to carbonation in HVFA concrete is likely caused by the decalcification of the C-S-H gel when CO
2 is present [
10]. Atis [
7] evaluated concrete containing 50% and 70% fly ash subjected to an accelerated carbonation test. He obtained reductions between 51.5% to 62.2% higher than reference concrete, made without SCM.
High volumes of fly ash in concrete can create significant problems, including slower initial setting and corrosion of reinforcement due to carbonation [
2]. Therefore, it is necessary to adopt greater technological control and implement actions to mitigate these effects. Among them, particle size reduction of fly ash, use of setting accelerators to ensure timely formwork removal, or inclusion of other additives (e.g., hydrated lime) to reduce carbonation can be mentioned. These measures, along with others, have made it possible to use high percentages of fly ash in concrete, with successful applications reported at levels as high as 70%; see, for example, Reis [
11].
Although the amount of fly ash available worldwide is still high (1200 Mton/year [
12]), there are regions in the world where this is no longer the situation. Europe plans to close its thermoelectric power plants by 2050 and, in countries like Portugal, there is no longer any fly ash [
13]. The lack of fly ash increases the likelihood of disruptions in cement and concrete production. Therefore, it is crucial to identify an alternative, with glass powder showing promising viability.
The use of glass for packaging results in a large amount of waste, posing challenges for landfill management, as it is non-biodegradable. However, its recyclability and abundance make it particularly interesting. In 2020, 17,830,000 tons of glass waste were generated in Europe, with an average of 50% being recycled [
14]. Typically, packaging glass is soda-lime glass, rich in SiO
2 (70%), making it favorable for pozzolanic reactions. The presence of high levels of sodium oxide (Na
2O) and calcium oxide (CaO) is concerning because of the high alkali content.
Studies have evaluated the use of glass powder in concrete manufacturing, either as aggregate or binder, used in substitutions or incorporated into compositions [
15,
16,
17,
18,
19,
20,
21,
22]. There is a trend in the literature to determine an optimal percentage for incorporation [
16,
17,
18,
19,
20,
21,
23], typically in the range of 10% to 30%, as there seems to be consensus that increasing percentage leads to reductions in mechanical strength. Despite this reduction, the use of concrete with glass powder in typical applications may remain unaffected [
16,
17,
18,
19,
20,
21,
22,
23], where conventional concrete is being used. There is a wide range of factors that influence these results: particle size distribution, w/b ratio, curing and mixing methods. The effectiveness of glass powder as a cement substitute depends largely on its particle size. According to [
23,
24,
25,
26,
27,
28,
29], below a certain particle size (about 75 μm), alkali–silica reaction (ASR) does not occur, and when the particles are coarser, they become harmful.
Concrete with glass powder shows a slower and more gradual development of mechanical strength. This is highlighted in the research of Du and Tan (2017) [
30] using a high percentage of incorporation. Whereas the control concrete exhibited higher strength at 7 days compared to concrete with 60% glass powder incorporation, the opposite behavior occurred at 365 days [
30]. The slow pozzolanic reaction of glass powder initially reduces strength at early ages. Over time, however, the amorphous silica in the glass powder dissolves in the alkaline environment and reacts with Ca
2+ to form C-S-H gels, improving the compactness of the paste matrix, particularly in the Interfacial Transition Zone [
30].
The increased compactness of concrete incorporating glass powder residue enhances its resistance to chlorides by improving particle packing, which reduces porosity and permeability. At curing periods of 28, 56, and 91 days, concrete with 10% and 20% glass powder replacement showed reduced migration coefficients compared to the control concrete and the concrete with 20% fly ash at all ages tested [
31]. By including 20% to 30% glass powder as a cement substitute, chloride ion penetration was reduced by 40% to 90% [
32]. This reduction is attributed to the pozzolanic reaction, which refines the pore structure, decreasing both porosity and pore connectivity, thus limiting chloride transport. Glass powder outperforms fly ash in enhancing chloride resistance [
18,
31,
33].
The incorporation of glass powder generally decreases resistance to carbonation, which is a result of reduced calcium hydroxide levels due to reactions with cementitious supplementary materials (SCMs) in the hardened mix. Calcium hydroxide is primarily responsible for the concrete pH. Carbonation (where CO
2 reacts with C-H to form CaCO
3) lowers the pH to values below 9, causing the concrete to no longer protect the reinforcements. Results indicate a tendency for SCM use to increase carbonation depth [
11,
34,
35].
The durability of cementitious materials is closely linked to how easy or difficult it is for fluids to penetrate through pores and cracks (such as through capillarity, immersion, or diffusion), as harmful atmospheric substances generally penetrate the material via fluids, leading to reactions that degrade the matrix over time. Concrete containing 10%, 20%, 30%, and 40% substitution of cement with glass powder showed reductions of 4%, 13%, 15%, and 18% in capillary absorption indices, respectively. This reduction is explained by the denser microstructure of concrete containing glass powder, which is formed through the pozzolanic reactions of the material [
36]. According to Du and Tan [
30], water penetration depth decreases progressively with higher glass powder content. For cement replacement levels of 15%, 30%, 45%, and 60%, water penetration depth was reduced by 54%, 65%, 68%, and 80%, respectively, compared to plain concrete. Rodier and Savastano [
17] indicate that the effect of glass powder on the volume of permeable voids and water absorption after immersion of mortars at 28 days, with partial substitution of cement by 10% by weight of glass powder, results in a 15% reduction in the volume of permeable voids and water absorption compared to the control. When the amorphous silica in the glass powder reacts with lime, it produces more C-S-H that fills the capillary pores. The densification of these pores by C-S-H decreases the total volume of permeable voids [
17].
Kamali [
31] studied the electrical resistivity of concrete using electrochemical impedance spectroscopy (EIS). Concrete containing glass powder demonstrated a notable enhancement in electrical resistivity when compared to both the reference concrete and fly ash concrete. This improvement in electrical resistance can be attributed to the increased compactness of the material. The pozzolanic reaction in cementitious materials helps to fill the pores more effectively, leading to better mechanical properties and enhanced durability of the mixtures. Although several studies have explored the use of high volumes of glass powder in cementitious materials [
30,
32,
36,
37], there remains a significant knowledge gap. Most research has primarily concentrated on using smaller amounts of glass powder. The potential of utilizing high volumes of glass powder in concrete production for everyday applications shows promise. Given the large global availability of glass and the anticipated scarcity of fly ash in the near future, repurposing glass in concrete production supports the circular economy and helps mitigate the environmental impact of concrete
4. Procedure and Test Setup
To eliminate any external influence, all tests were conducted using the same equipment, operated by the same technician, strictly following identical procedures and under consistent temperature and humidity conditions.
4.1. Compressive Strength
The mechanical compressive performance was assessed following EN 12390-3 [
41] at the ages of 7, 14, 28, 90, and 180 days. The results were obtained from the average of 3 specimens for each of the compositions established in
Table 3. An ELE universal press with a capacity of 300 kN was used for this test.
4.2. Open Porosity
This test was performed following the LNEC E394 standard [
42]. The specimens were oven-dried at 105 °C until a constant mass was obtained, after which the dry mass (
W1) was recorded. Subsequently, the specimens were subjected to gradual water immersion at a rate of one-third of their volume per hour. Mass measurements were conducted at 24 h intervals until equilibrium was reached, indicated by negligible variation between successive readings. The saturated mass (
W2) and the hydrostatic mass (
W3) were then determined. Water absorption was obtained by using Equation (1).
4.3. Capillary Absorption
The capillary absorption test was carried out following the guidelines of the LNEC E393 standard [
43]. The specimens were oven-dried at 105 °C until a constant mass was achieved. Subsequently, a 25 mm height from the base of each cube specimen was sealed on all lateral faces using silicone sealant gel. This procedure was performed to ensure unidirectional water ingress by capillary action, restricted exclusively to the bottom surface. Following sealing, the initial mass of each specimen was recorded. The specimens were then positioned in a water-filled container to allow contact with water to a depth of approximately 5 ± 1 mm from the bottom surface. Mass measurements were conducted at predetermined time intervals: 0, 10, 20, 30, and 60 min; subsequently, measurements were taken hourly up to 6 h, and thereafter every 24 h until a constant mass was attained. Capillary absorption at time “t” was calculated by using Equation (2).
4.4. Chloride Migration Test
The determination of chloride penetration resistance was conducted following the LNEC E463 standard [
44]. A 50 mm thick disc was extracted from a cylindrical specimen or core. Each disc was labelled and subjected to vacuum saturation in a saturated calcium hydroxide (CH) solution. Following saturation, the disc was positioned between two liquid cells, with its lateral surface sealed using an impermeable coating to ensure unidirectional ionic flow through the top and bottom faces only. The anodic chamber was filled with a 0.3 M sodium hydroxide (NaOH) solution, while the cathodic chamber contained a 3% sodium chloride (NaCl) solution. An electrical potential was applied across the specimen for the prescribed duration. Upon completion of the test, the specimens were axially split, and a 0.1 M silver nitrate (AgNO
3) solution was applied to the exposed cross-section. The AgNO
3 reacts with free chloride ions to form a white silver chloride (AgCl) precipitate, which serves as a visual indicator of chloride ingress. Penetration depth was measured at 10 mm intervals from the center toward the edges of the specimen, with a total of seven measurements recorded for each test piece. The non-steady state migration coefficients were subsequently calculated using Equation (3).
where
D is the diffusion coefficient in the non-steady state, ×10−12 (m2/s).
U is the absolute value of the applied voltage (V).
T is the average value of the initial and final temperatures in the anodic solution (°C).
L is the thickness of the specimen (mm).
Xd is the average value of the depth of penetration (mm).
t is the duration of the test, in hours.
4.5. Accelerated Carbonation
Determining the resistance to carbonation generally followed the procedure described in LNEC specification E 391 (1993) [
45]. The test was carried out on just one beam, from which slices about 50 mm thick were extracted for each age as the test progressed.
Immediately after the beam was molded, it was protected with plastic wrap. After demolding the beam on the following day, it was cured by immersion in water until the age of 28 days. It was then left for 14 days in a laboratory environment (20 ± 2 °C, 60 ± 5% HR), after which it was coated on top and two opposite sides with paraffin in order to induce the carbonation process on the remaining two opposite sides. The beams were then submitted to the carbonation chamber, with 5 ± 0.1% CO2, temperature 20 ± 2 °C, and humidity control at 60 ± 5%, until they were submitted to the test at 0, 30, 60, and 90 days. After spraying the removed slice with a 0.1% alcoholic phenolphthalein solution, 5 measures of the carbonation depth were taken per face, and the average was determined.
4.6. Electrical Resistivity
A low frequency alternating current (AC) is applied between the two outer electrodes, while the voltage is measured on the two inner electrodes. The electrical resistivity measurements were made using a RESIPOD device, made by Proceq, Zurich, Switzerland.
To ensure greater precision in the tests, the specimens were marked with 4 fixed measurement points in three cross-sections, ensuring that the points of contact between the equipment and the specimen were the same in all the readings taken, at any age. The measure was always taken immediately after removing the specimen from the water, while it was still saturated. The measure was recorded 3 times on each of the marked faces, and the average of all the measures determined the resistivity of the specimen.
5. Results and Discussion
5.1. Compressive Strength
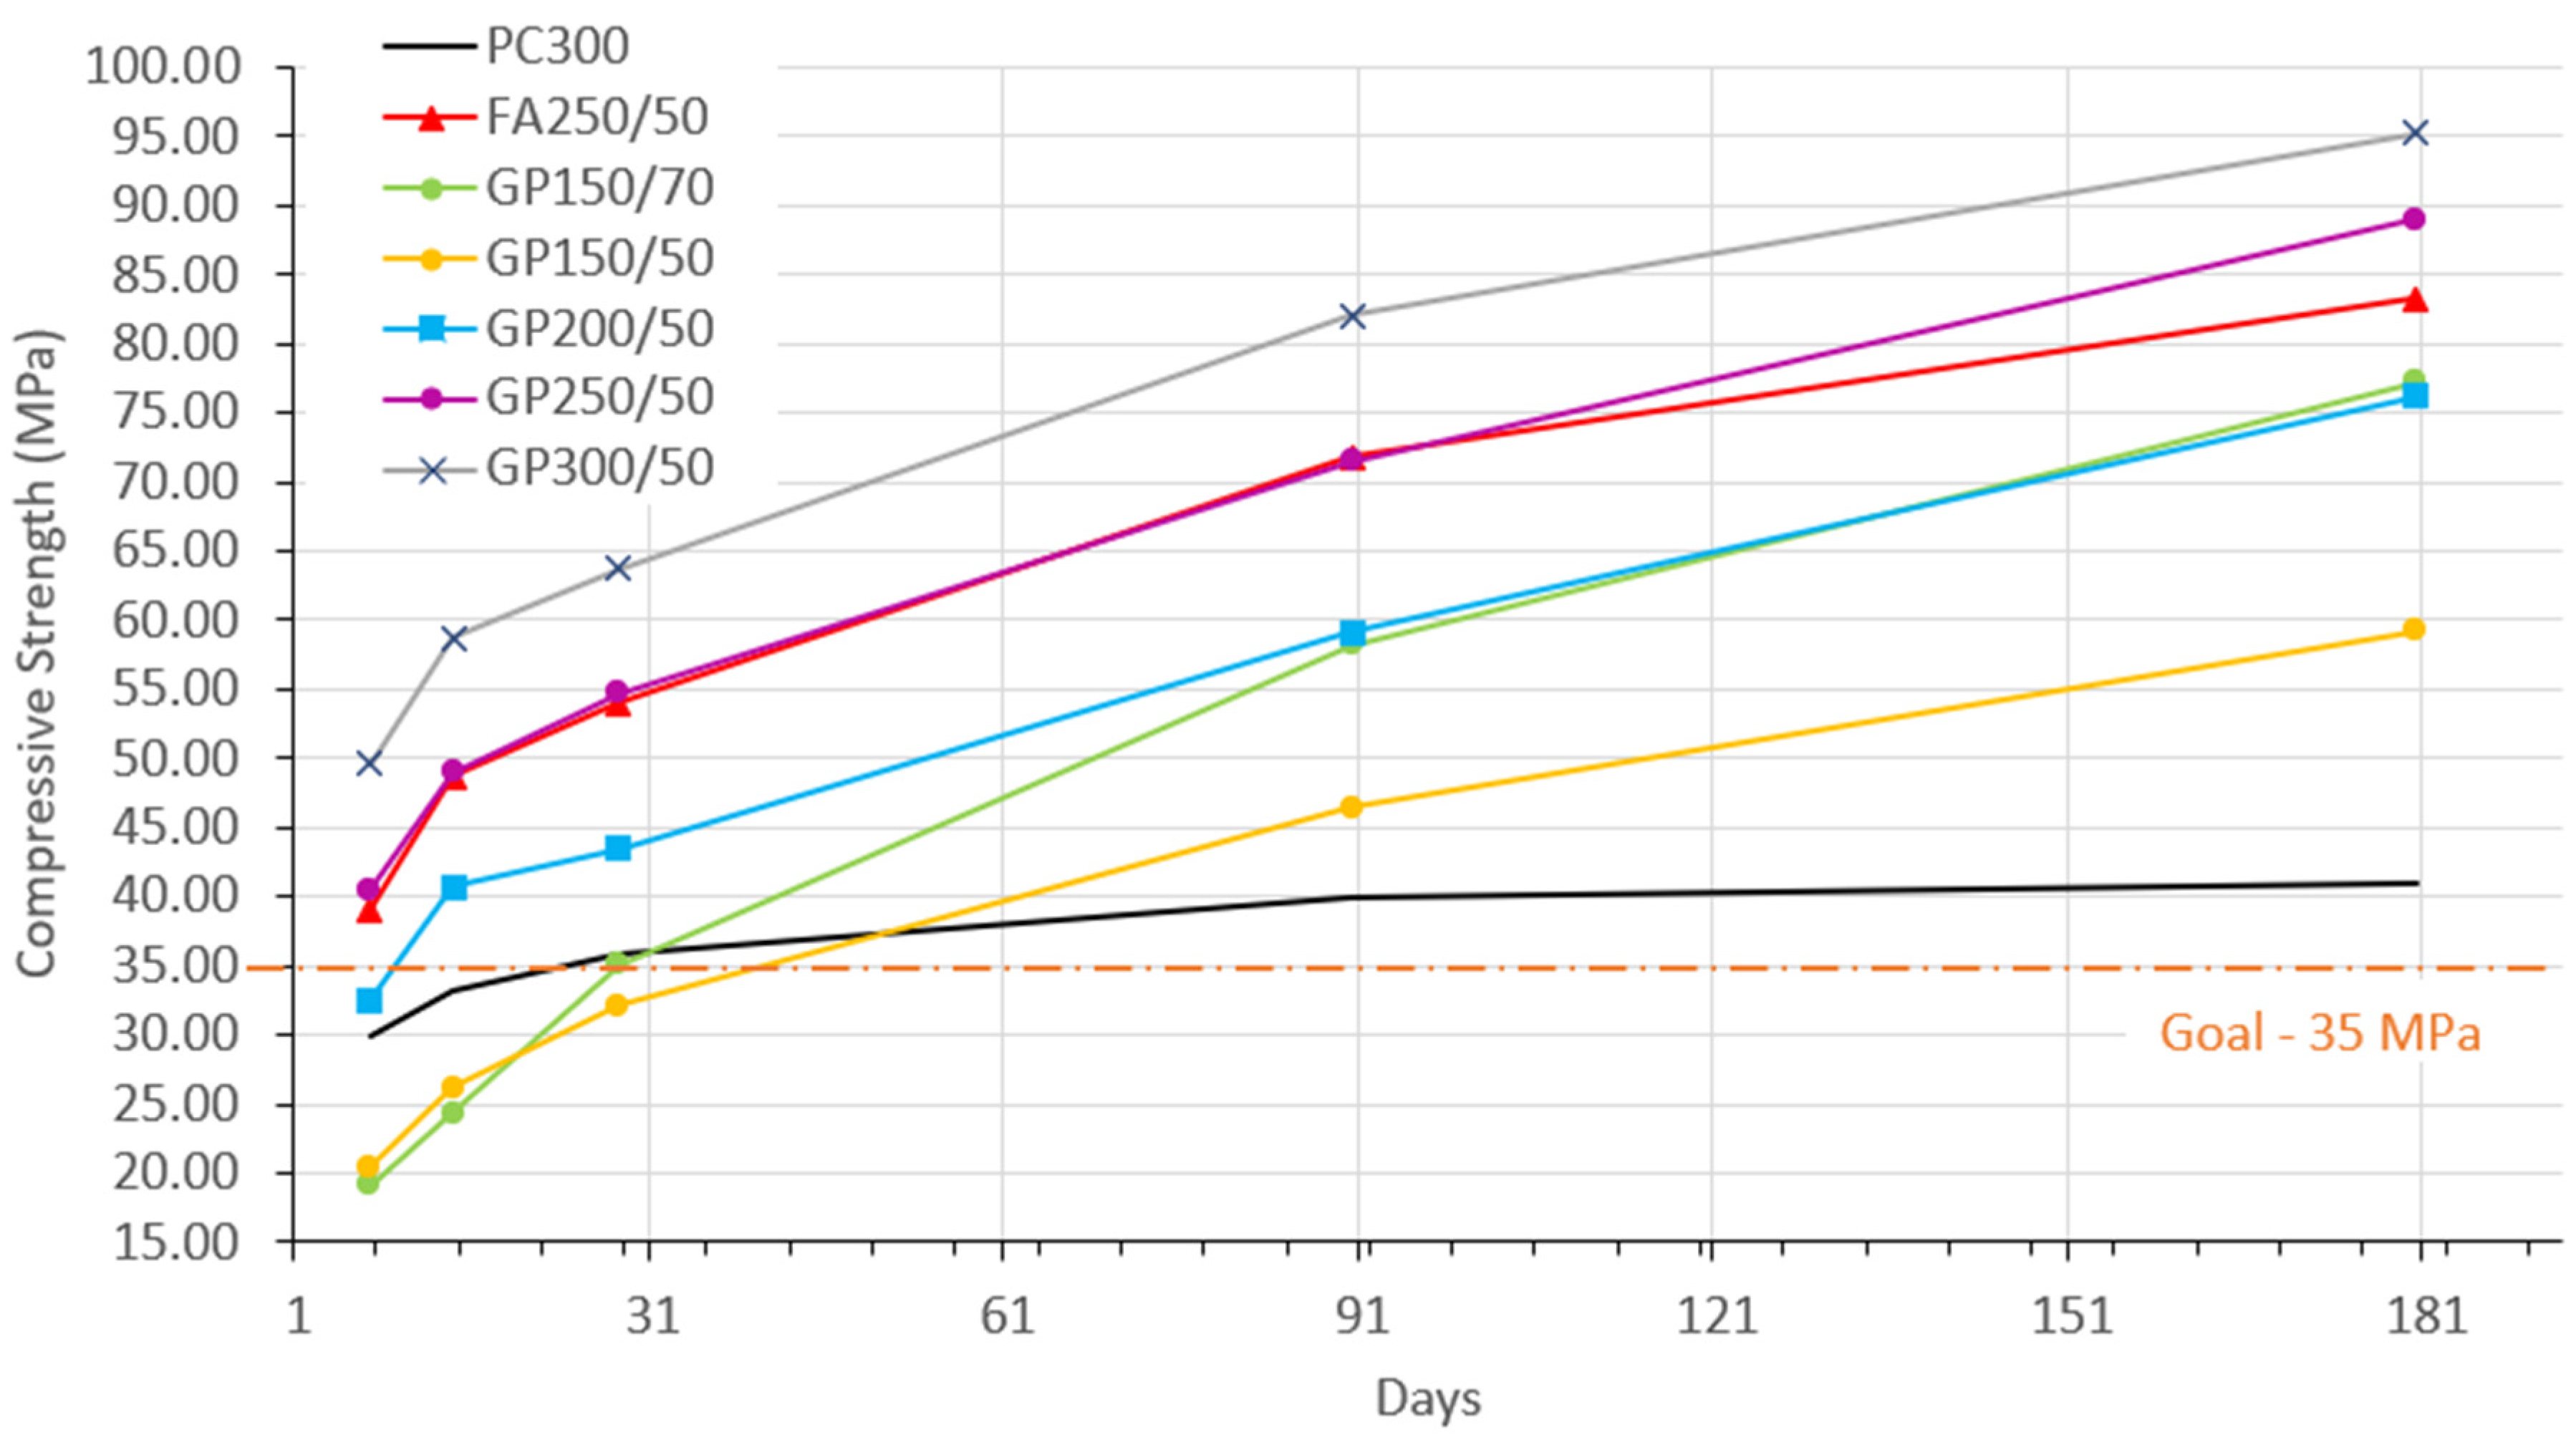
Figure 3 presents the development over time, from 7 to 180 days. The graph was created using the average values obtained from all the tested specimens, with the coefficient of variation ranging from 0.28% to 7.86%.
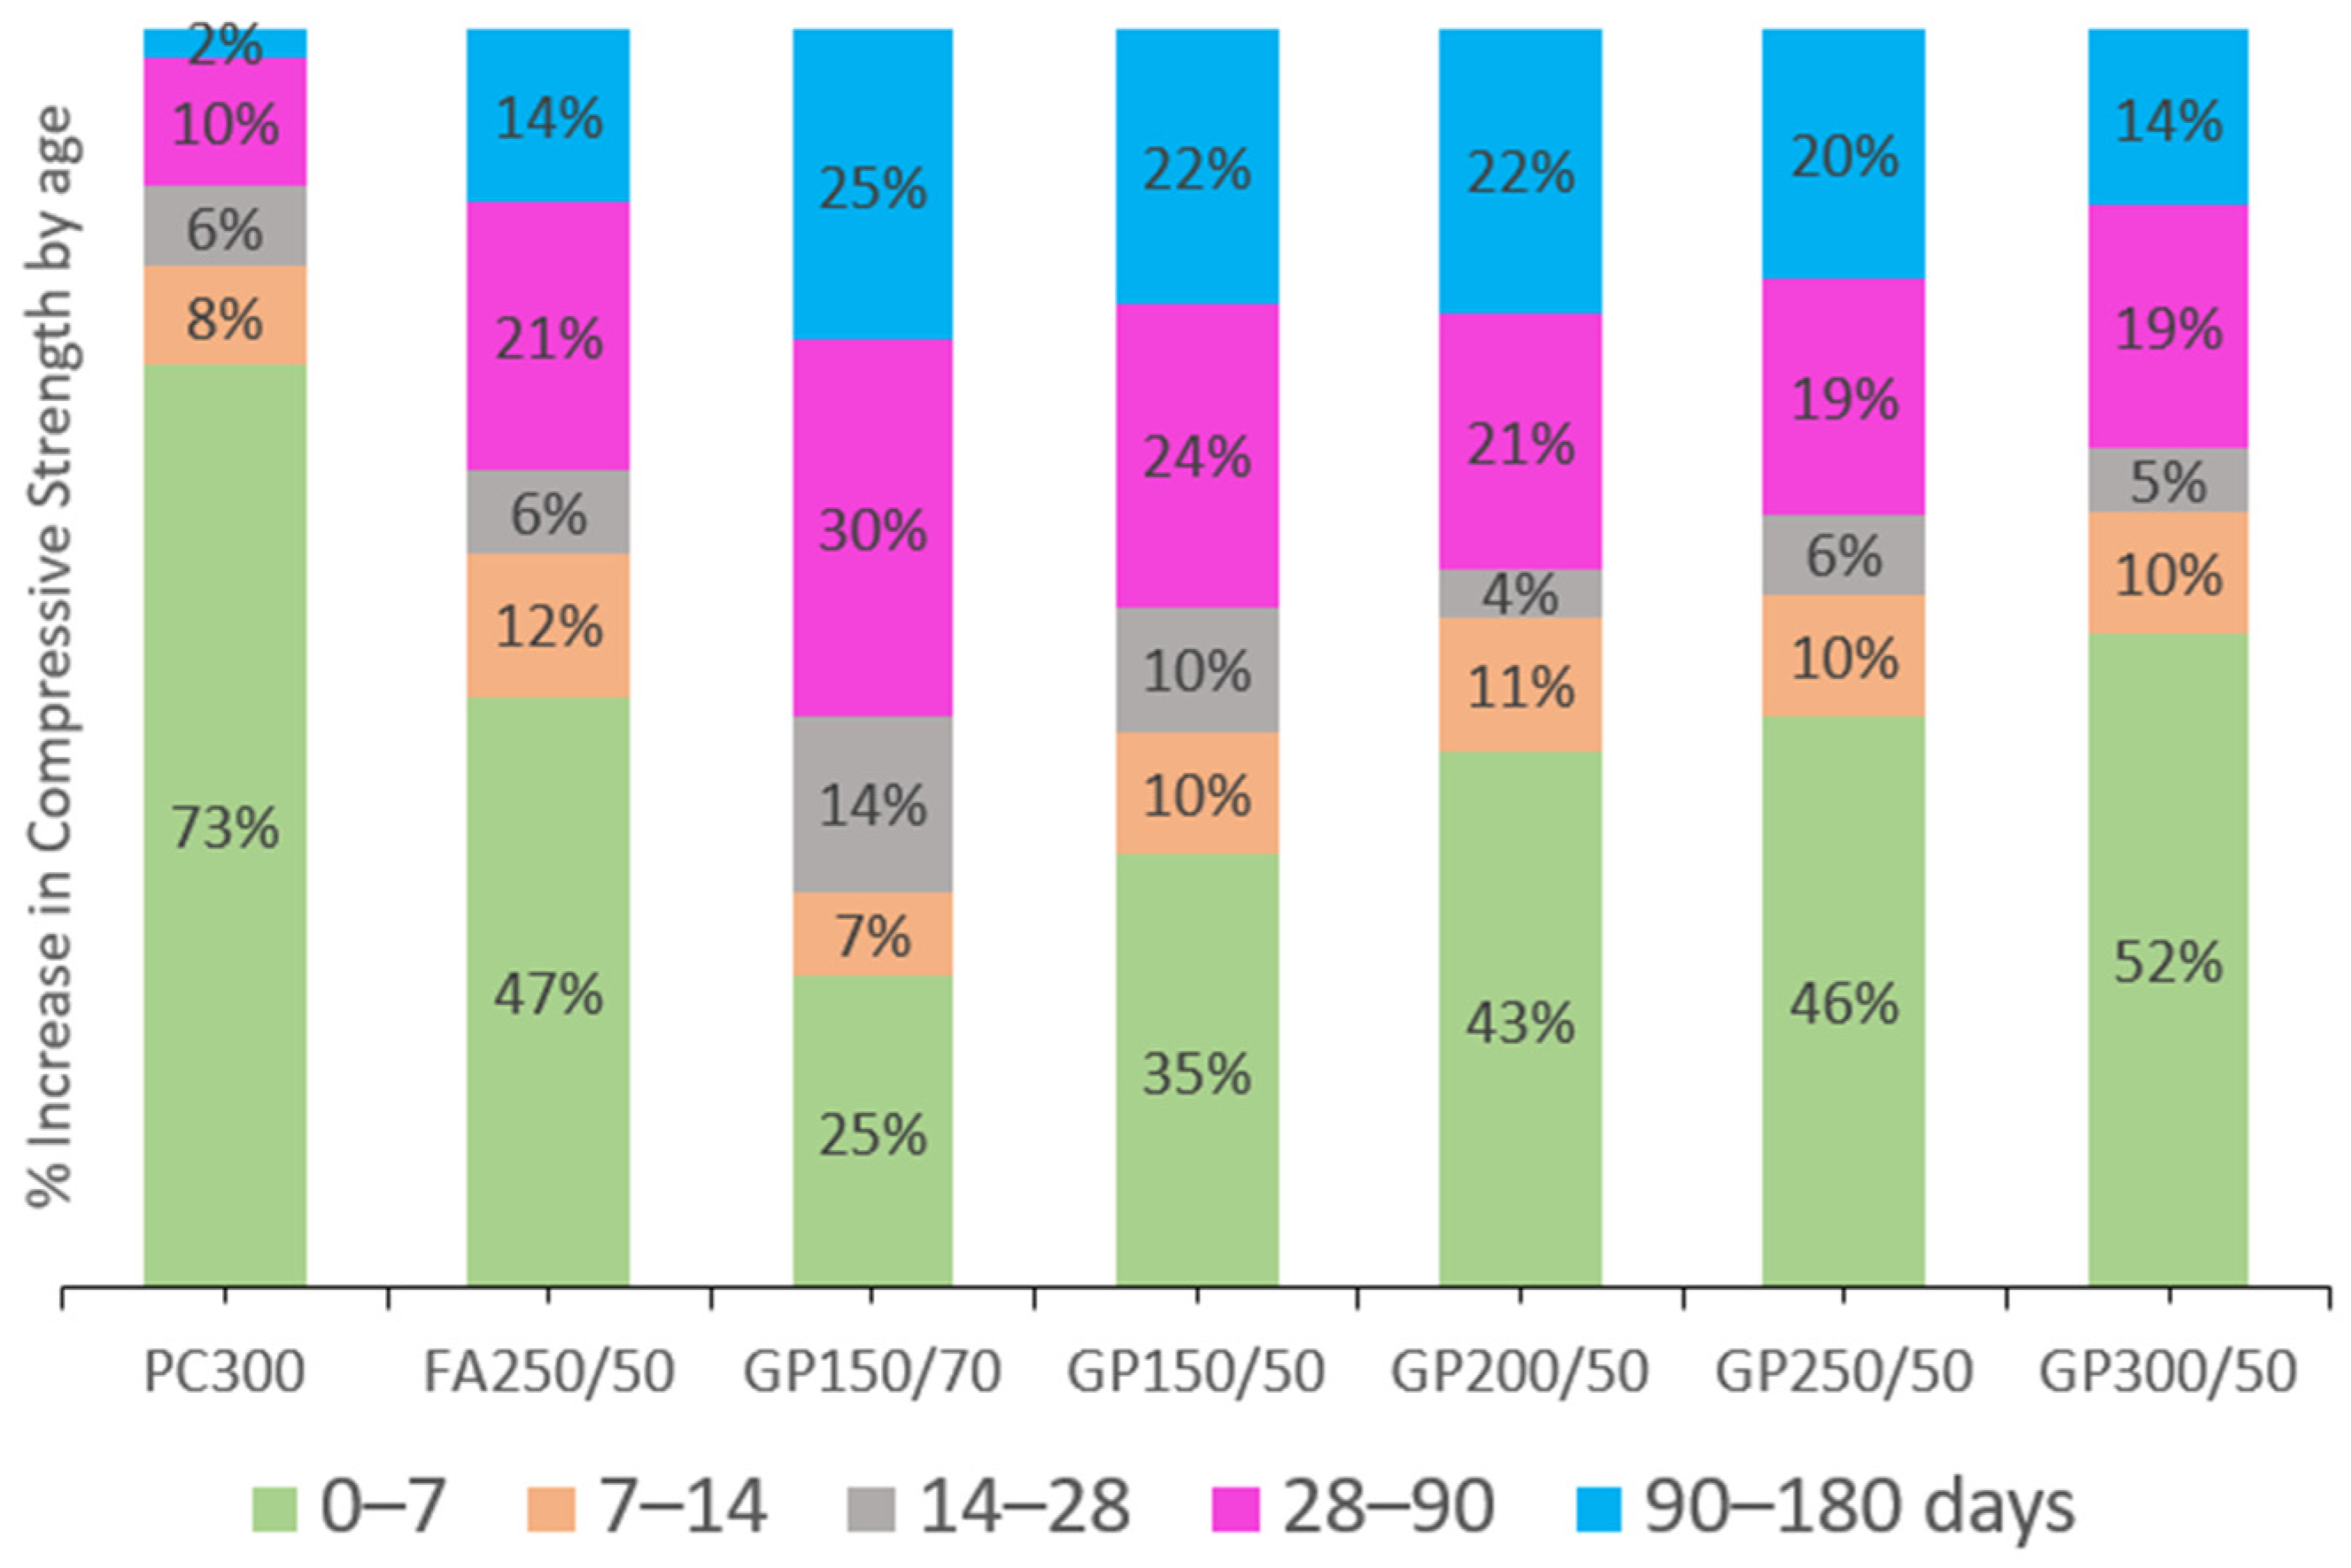
Figure 4 illustrates the percentage gains in compressive strength at each age.
There is an increase in the compressive strength values as the curing period progresses. The 35 MPa target line shows that at 28 days, only the mixture with 300 kg/m
3 of binder and 50% glass (GP150/50) was below (32.09 MPa), all the others were above, meeting the initial target. At 90 days, all the mixtures not only exceeded the target, but the results were also higher than the reference (PC300). This behavior is likely linked to the gradual progression of pozzolanic reactions, a characteristic feature of concrete containing supplementary cementitious materials (SCM), as previously noted by Du and Tan [
30].
Figure 3 also highlights the similar development between the mixture containing FA (FA250/50) and the mixture with GP (GP250/50), which had an equivalent cement dosage of 250 kg/m
3. Concerning the increase in compressive strength (
Figure 4), the FA and GP behaviors were also similar. At 7 days, PC300 had 73% of its final strength. The GP and FA concrete developed more slowly initially but achieved more significant gains at later ages. However, GP gains more strength after 90 days when compared to FA. Considering these results, it is possible to say that GP has satisfactory mechanical characteristics to replace FA in this type of concrete.
This study did not focus on determining the optimal level of glass powder incorporation but instead aimed to demonstrate the feasibility of producing concrete with high substitution rates (50% or 70%) while significantly reducing cement consumption. Therefore, the results obtained are promising because, among the experimental compositions, those with the lowest cement dosage (only 150 kg/m
3), such as the GP150/70 and GP150/50 mixes, achieved strengths of 58.18 MPa and 46.42 MPa, respectively, at 90 days. These strengths make these concretes suitable for use in most current construction projects. Recent studies show a similar trend to the results presented here [
30,
36]. This behavior can be related to the reduction in concrete porosity. In the slow pozzolanic reaction of the glass powder, at older ages, the amorphous silica in the glass powder slowly dissolves under the alkaline environment of the concrete, reacting with Ca
2+ to form additional C-S-H gel, reducing the porosity of the concrete. Furthermore, the results obtained can be attributed to factors such as the particle size of the glass powder and aggregates, the decreased w/b ratio, optimal curing conditions, and the concrete manufacturing process. It cannot be said that one composition is better than another. As stated above, the ideal dosage will be the one that best adjusts the performance vs. demand ratio.
5.2. Open Porosity
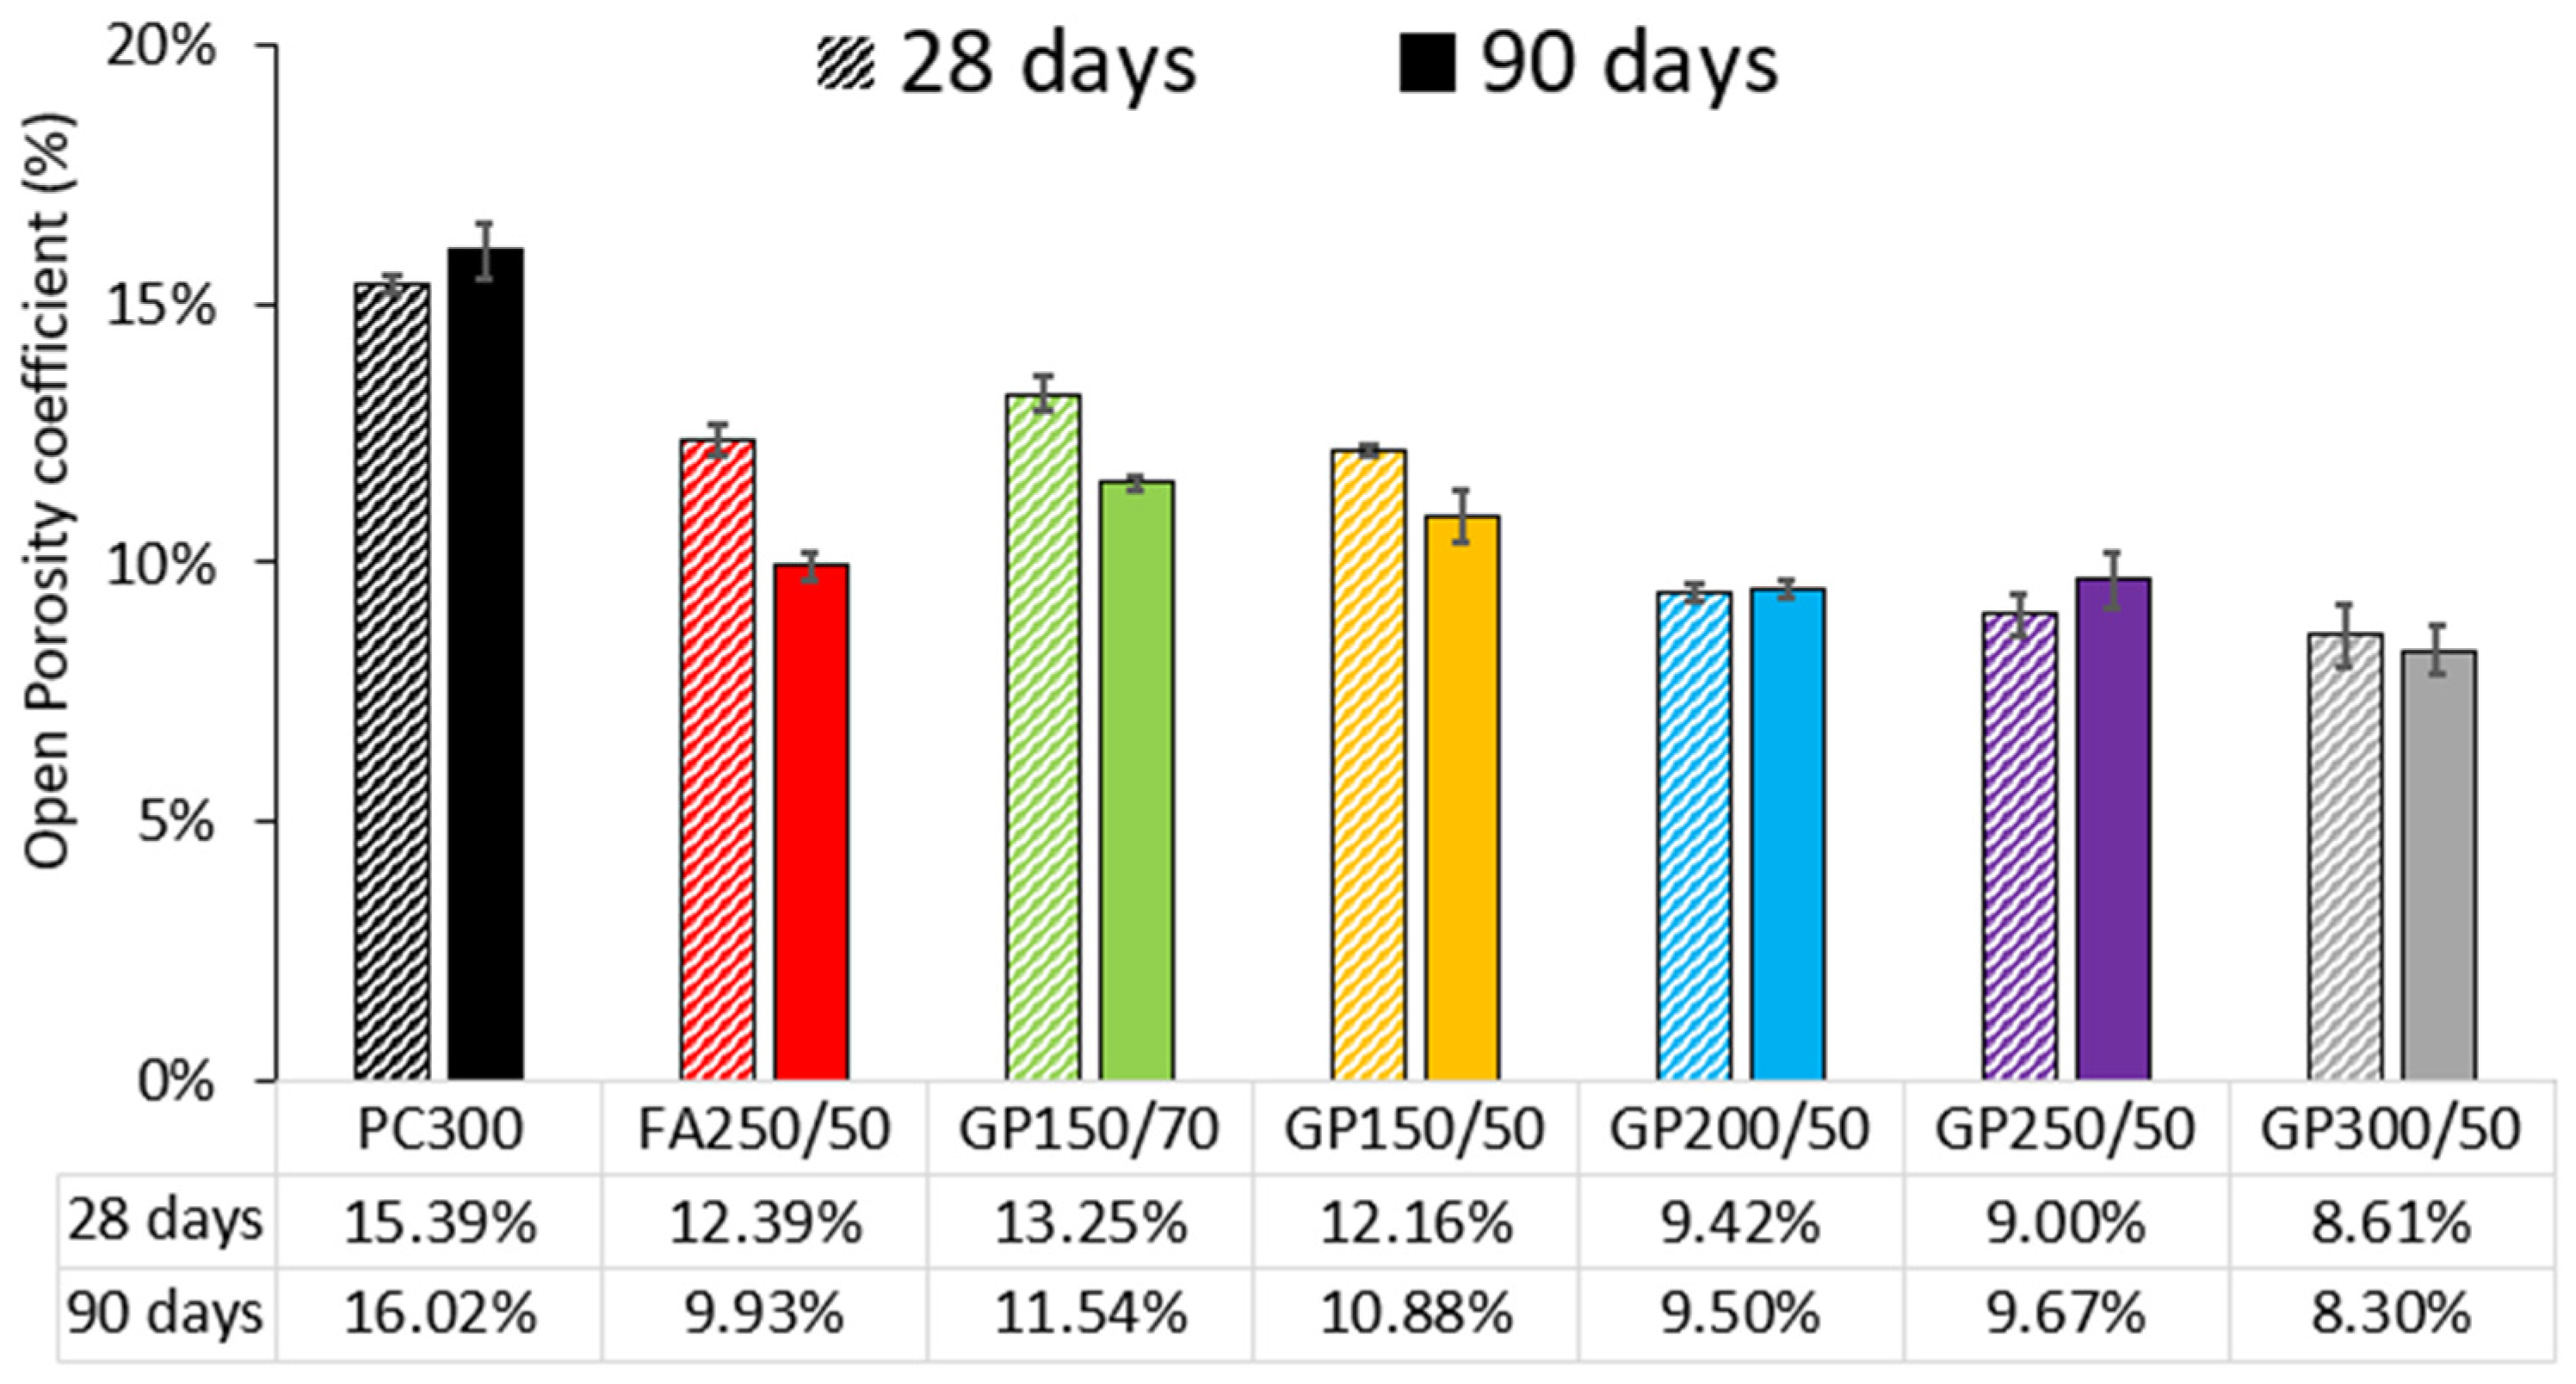
Figure 5 presents the open porosity average (3 samples by age) measured at 28 and 90 days.
Concrete with PC replaced by GP shows better performance when compared to reference concrete, without additions. Among the compositions containing GP, the one with the worst result is the one containing 70% (GP150/70), both at 28 and 90 days. It can also be seen that as the dosage of binder is increased, there is a tendency for the reduction in absorption, i.e., among the concrete with 50% GP, the worst is GP150/50 (300 kg of binder), followed by GP200/50, GP250/50, and finally GP300/50. Another relevant observation is related to fly ash. At 28 days, except for GP150/70 (70% GP), all the other compositions containing GP show better performance than the FA composition (FA250/50). At 90 days, there is a similar trend, with only the GP150/70 and GP150/50 compositions showing greater absorption than the FA composition. Comparing the composition of FA (FA250/50) with its equivalent containing 50% GP (GP250/50), in 28 days, the FA had 12.39% compared to 9% GP, a difference of 37.6%, meaning that the glass powder proved to be much better. However, at 90 days, this difference had narrowed considerably. FA had 9.93% and GP 9.67%, only 2.6% difference.
There is a decrease in absorption as the GP content increases. This happens because of the dense porous microstructure of concrete with GP, provided by the pozzolanic reaction. Deepa Paul et al. [
36] found similar results.
Since the absorption test serves as an indicator of concrete porosity, it can be concluded that concrete with 50% GP has lower porosity compared to the reference concrete.
Examining the connection between compressive strength and open porosity, a strong correlation is evident, where concrete with lower porosity exhibits higher compressive strength. However, this relationship is not linear, and porosity alone may not be a determining factor in achieving high strength.
5.3. Capillary Water Absorption Test
Figure 6 displays the capillary absorption kinetics curve (for specimens cured in water for 90 days), reflecting the average values of three samples.
There are two distinct phases in this test. The initial phase involves filling the larger pores, resulting in a steeper initial curve. In the second phase, water penetrates the smaller pores, gradually filling the capillary network, causing the curve to stabilize [
46].
The concrete (PC300) stands out, showing a curve with a significantly steeper slope compared to the curves of the concrete mixtures containing fly ash (FA250/50), 70% glass powder (GP150/70), and 50% glass powder (GP150/50, GP200/50, GP250/50, and GP300/50). This difference may be attributed to the presence of a higher number of larger capillary pores in the reference concrete. It can be observed that as the glass powder content increases, water absorption decreases. This occurs because the glass powder enhances the packing density, reducing pore size and the connectivity between pores.
The reference concrete reaches this stability plateau, with the capillary network fully filled, at approximately 16 kg/m2. Compared to the concrete containing GP, the composition with the worst performance is the one containing 70% GP (GP150/70), reaching only 6.65 kg/m2 of water absorption in the stable phase, i.e., around 41% of what was obtained in the reference.
This behavior may suggest the presence of a less interconnected and/or smaller pore network in concrete with GP.
Figure 6 also shows that the 150 kg/m
3 compositions (GP150/70 and GP150/50) are almost the only ones to perform worse than fly ash (FA250/50), with all the other compositions containing glass powder performing better. When comparing the GP composition (GP250/50) with a dosage equivalent to FA (FA250/50), the glass powder compositions show better performance.
The capillary absorption coefficient was calculated using the time intervals (first 4 h) suggested by Browne [
47], as presented in
Table 5.
The results obtained show that at 90 days, there was a percentage reduction in the capillary absorption of the specimens with glass powder of between 51.2% (GP150/50) and 64.5% (GP300/50) when compared to the reference concrete (PC300). Regarding fly ash, only the (GP150/50) composition performed worse (−5.2%). The others are around 14.8% to 23.5% better. In the same direction, Du and Tan [
30] and Deepa Paul et al. [
36] showed in their tests that the depth of water penetration consistently decreased as the glass powder content increased.
5.4. Diffusion Coefficient of Chlorides
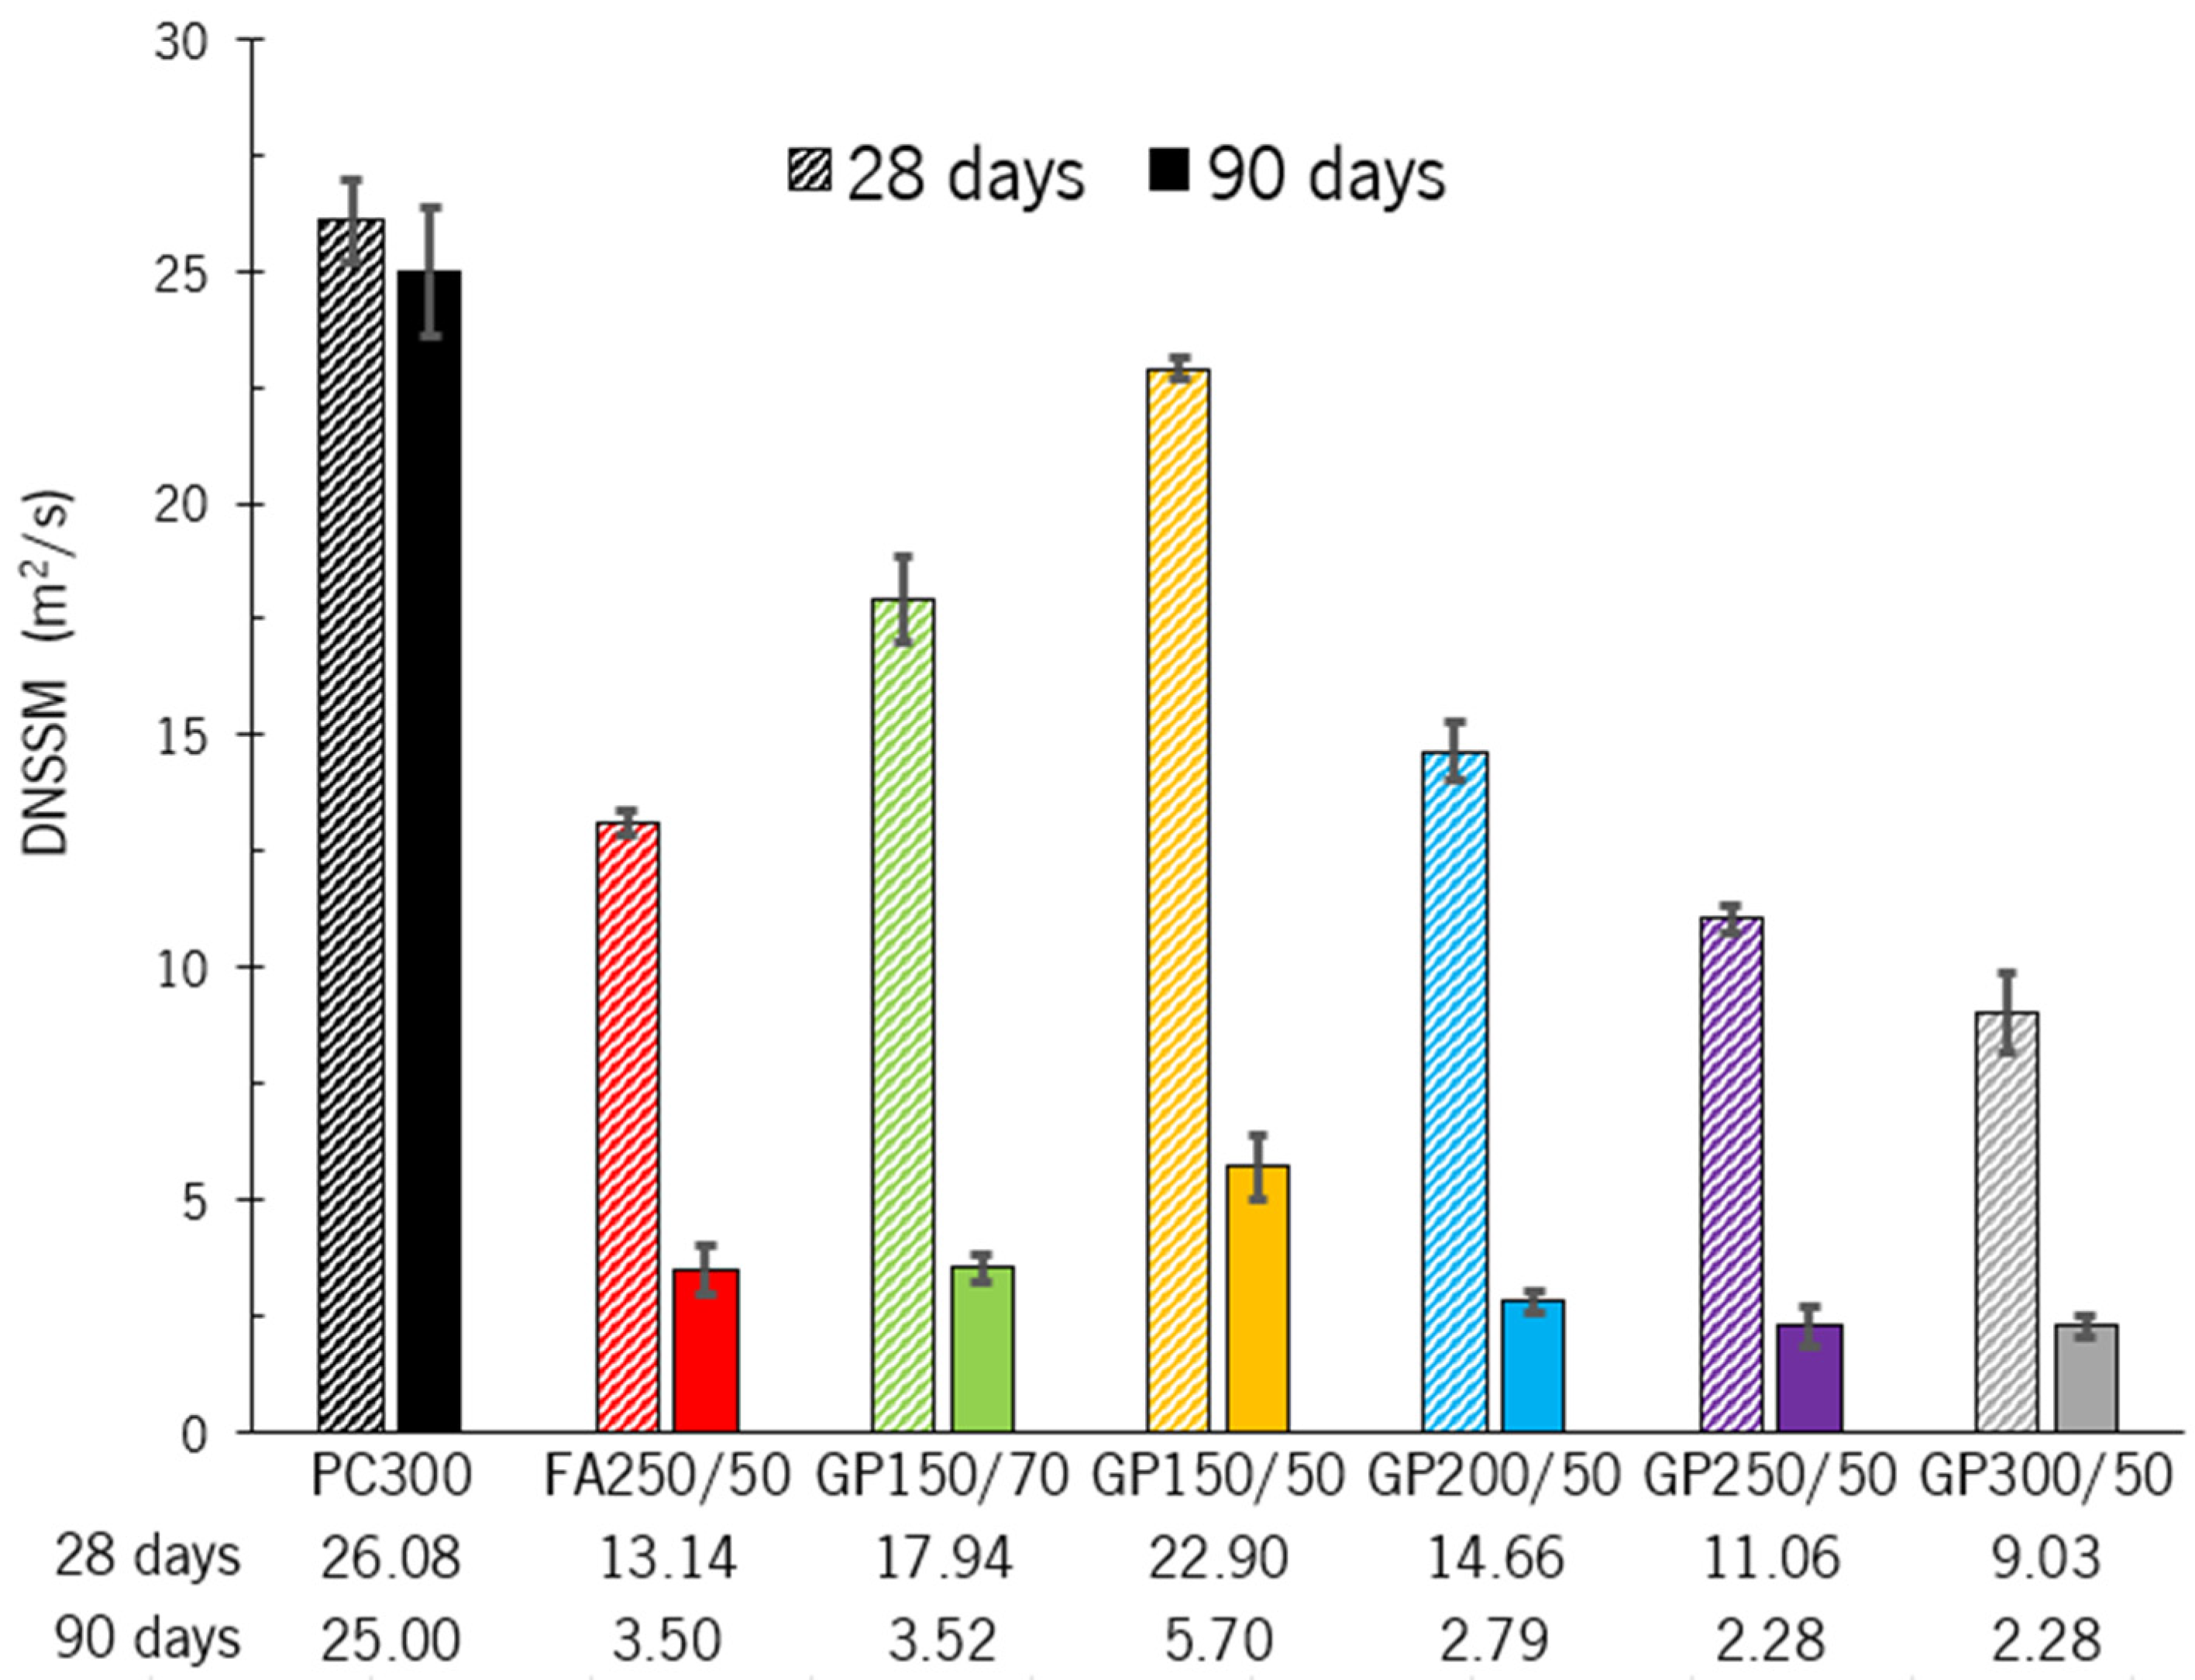
The average (3 samples by age) of the chloride diffusion coefficient for specimens, at 28 and 90 days, is presented in
Figure 7.
The impact of GP on the chloride diffusion coefficient is clearly noticeable. Concrete incorporating GP exhibits a distinct decreasing trend in chloride diffusion. This reduction becomes more pronounced as the binder content increases. Additionally, all GP-containing concrete mixtures show a significant decrease in chloride diffusion between 28 and 90 days.
At 28 days, the GP150/50 mixture showed the smallest variation compared to the reference concrete, achieving a 13.9% reduction (from 26.08 to 22.90). At 90 days, the scenario is the same, but the difference increases to 438.6% (25.0 to 5.7). It is worth noting that this concrete contains just 150 kg/m3 of PC (half the amount of the reference concrete), which makes the results even more meaningful. The GP300/50 composition showed the best results at both ages, with a reduction from 26.08 to 9.03 (288.9%) at 28 days and from 25.0 to 2.28 (1096.5%) at 90 days.
When comparing the composition with FA (FA250/50) with its equivalent containing GP (GP250/50), it can be seen that the glass powder shows a slightly better result at both ages.
The enhanced resistance to chloride ion penetration in glass powder concrete is due to the filling effect of the finely ground glass particles, which improve granular packing through varying binder dosages. Furthermore, the pozzolanic activity generates additional C-S-H, which further reduces pore size and connectivity. When comparing the chloride diffusion coefficient of PC300 with the worst result from concrete incorporating GP (GP150/50), it is evident that porosity has a greater influence. In this regard, the incorporation of GP is beneficial, as the filling effect provided by its use reduces porosity, regardless of the activity index. In concrete with 50% GP, the following trend is observed: higher binder content (cement plus GP) leads to higher compressive strength, lower porosity, and a reduced chloride diffusion coefficient. As the binder content decreases, the opposite trend is observed, as illustrated in
Figure 8.
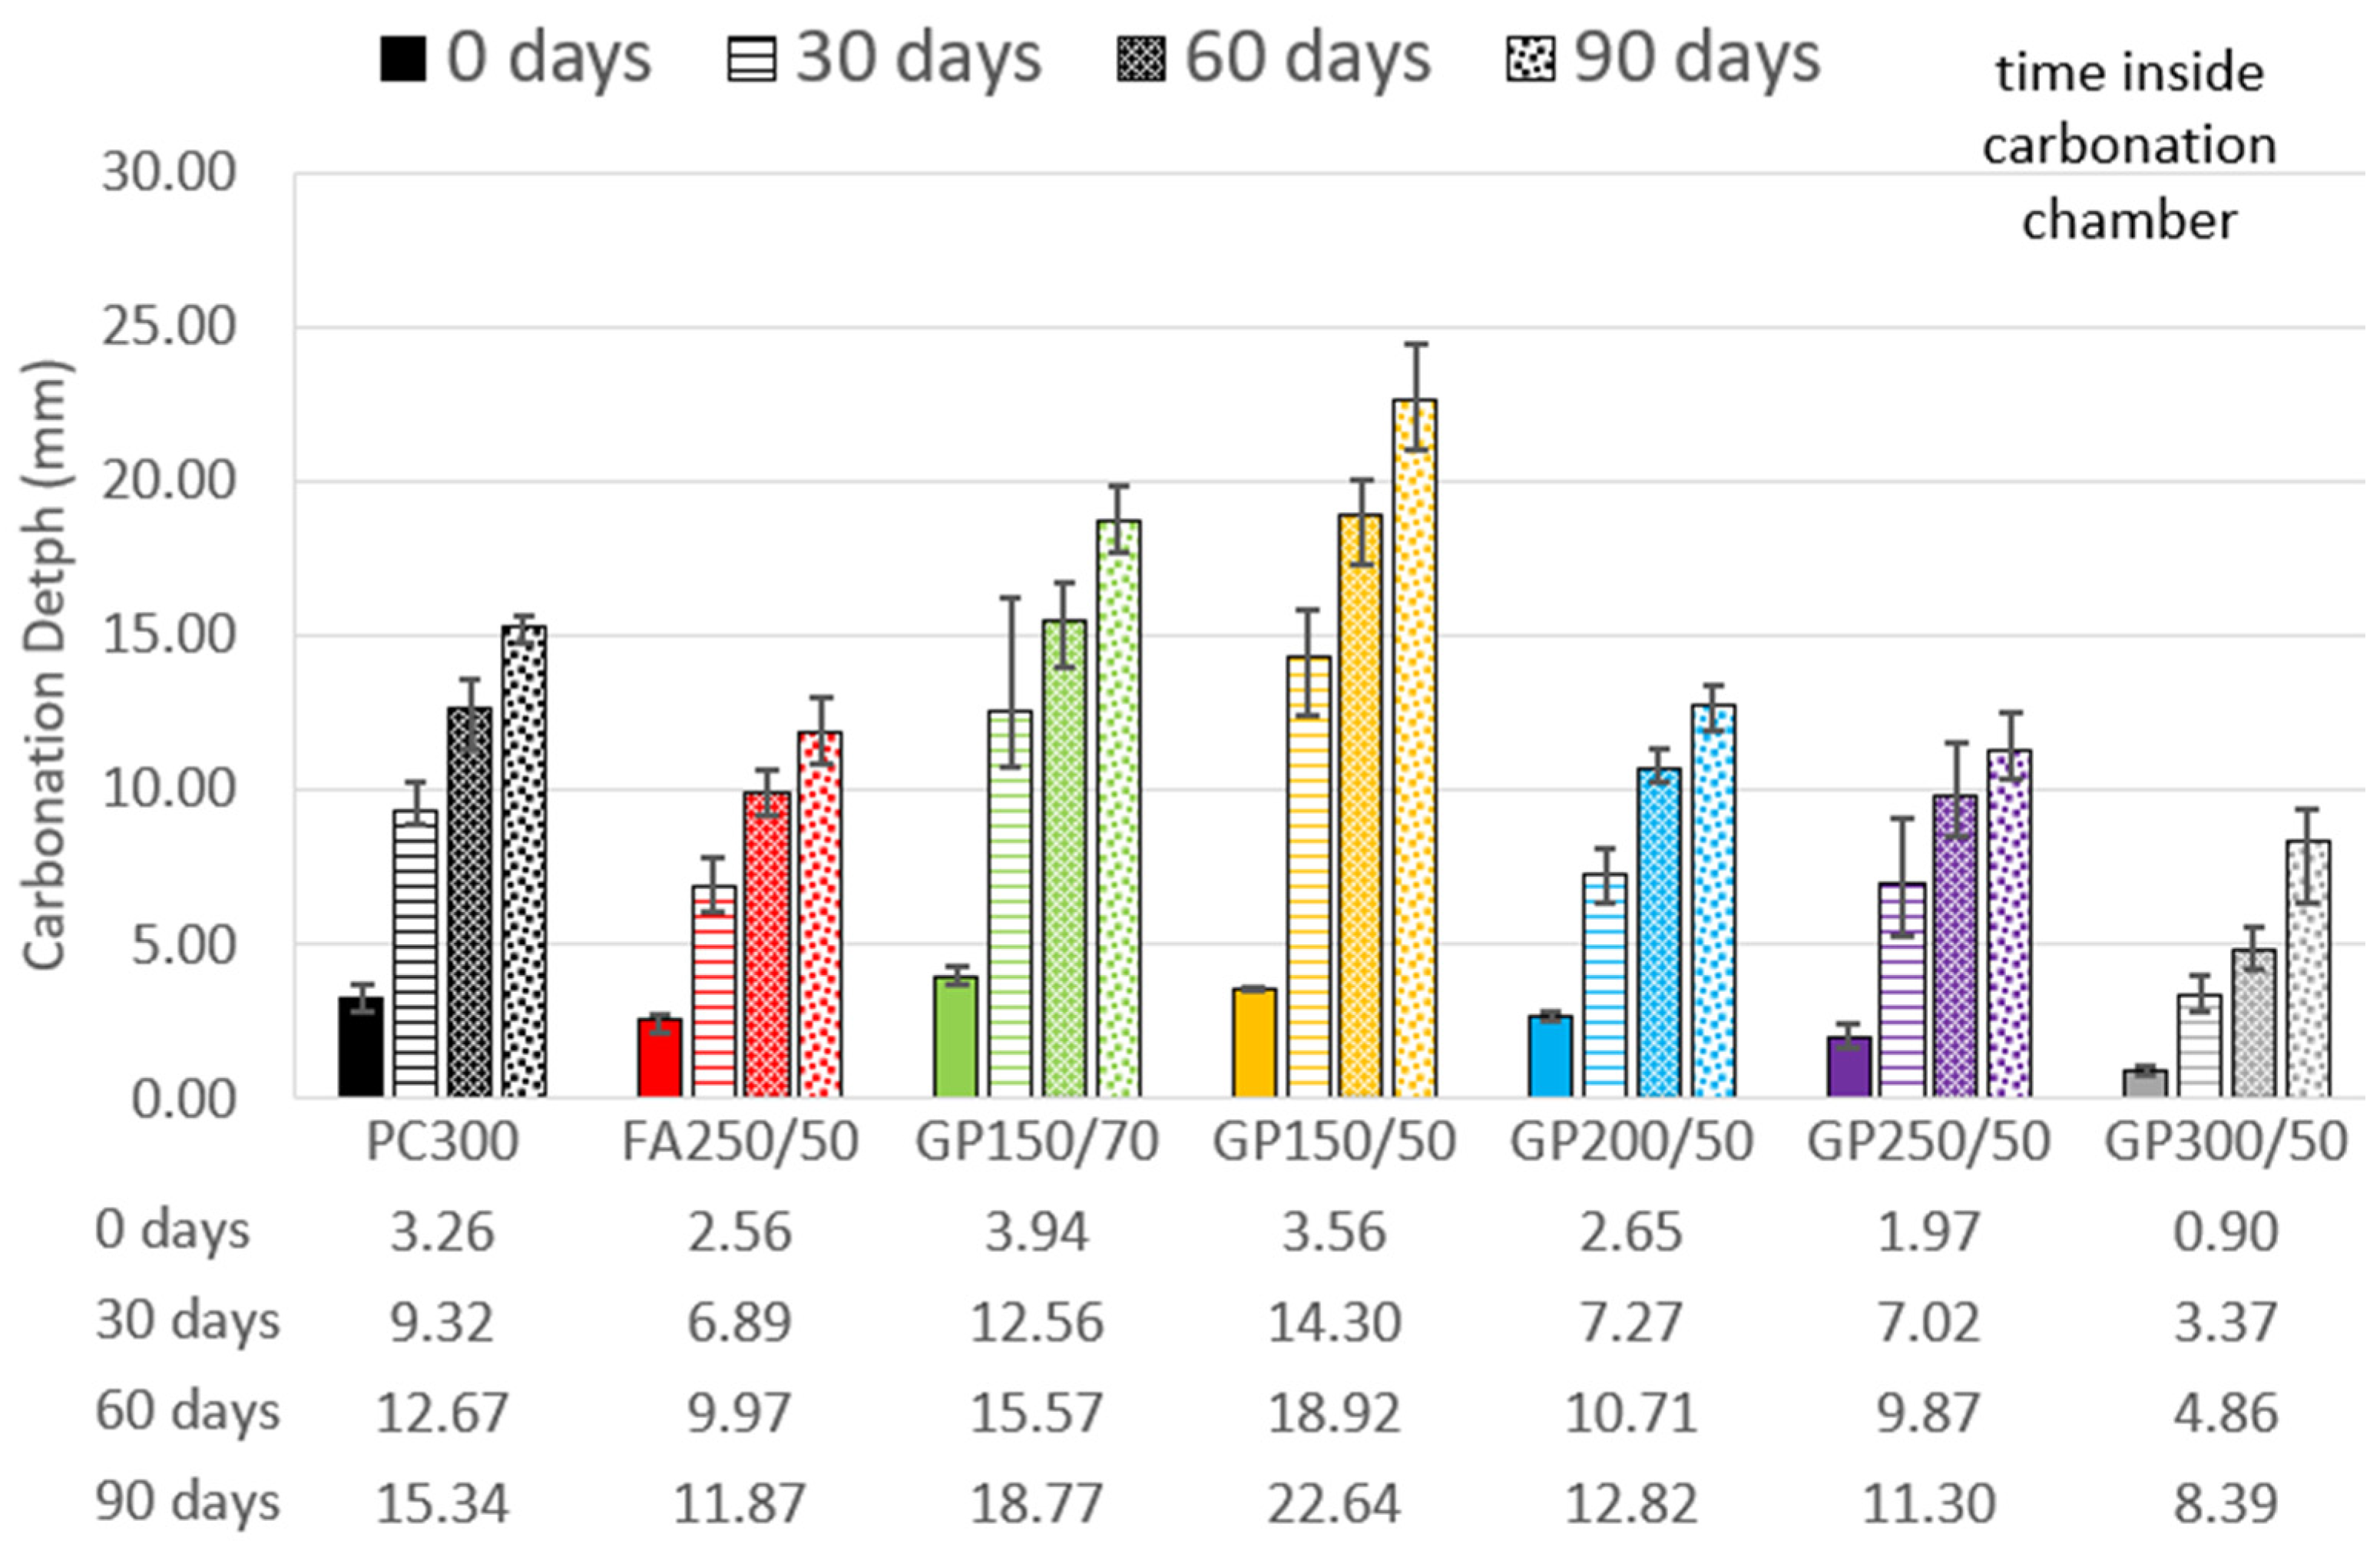
5.5. Accelerated Carbonation
Figure 9 shows the evolution of the carbonation depth at 0, 30, 60, and 90 days after being placed in the carbonation chamber. The starting point “0” was recorded on the date the specimens were placed in the carbonation chamber, that is, after 28 days of curing, followed by 14 days in a laboratory environment.
As can be seen in
Figure 9, the GP150/70 and GP150/50 compositions performed worse than the reference regardless of the age. The GP200/50 and GP250/50 compositions behave similarly to the fly ash FA250/50. At all ages, these three compositions recorded a slightly better carbonation depth than the reference, approximately 20% less. It is interesting because they have the same or slightly lower cement dosage (50 kg/m
3 less in the case of GP200/50), and initially it is expected there will be a tendency for the introduction of GP to worsen carbonation behavior. This may be related to the lower permeability of these compositions. A joint analysis of
Figure 6 and
Figure 7 shows that the compositions with GP have a porosity between 2.6% and 4.4% lower than the FA composition. The GP300/50 composition, on the other hand, performs much better than both the reference and fly ash at all ages.
According to studies by Matos et al. [
48], Guo et al. [
34], W. Ashraf [
35], and Reis [
11], the use of SCMs causes a decrease in calcium hydroxide, generating an increase in the depth of carbonation, which is only seen in the results of the (GP150/70 and GP150/50) compositions. The other compositions studied here showed an improvement in carbonation resistance. One possible explanation for this behavior is the age of the tests. The compositions containing FA and GP show slow pozzolanic reactions but have consistent gains in strength after the first 28 days. Those compositions that were subjected to the carbonation test at ages that were not yet fully developed, as can be seen in
Figure 3, ended up suffering more carbonation. The compositions that had the best results were precisely those that had developed the most prematurely. The ideal solution to isolate this effect, since GP develops over the long term, would be to re-run these tests after curing for at least 180 days.
It is also worth mentioning that the composition with the highest level of carbonation of all (GP150/50), at 90 days, was 22.64 mm. Considering the coatings usually used, it could be said that this does not make the solution unfeasible. There are alternatives for protecting structures from the action of carbonation, and perhaps, in some special cases, it would be advisable to do so. The use of a percentage of lime in the mixture, in order to increase the availability of calcium hydroxide available for reaction, as is already the case with fly ash (Reis, [
11]), should also be studied in this case.
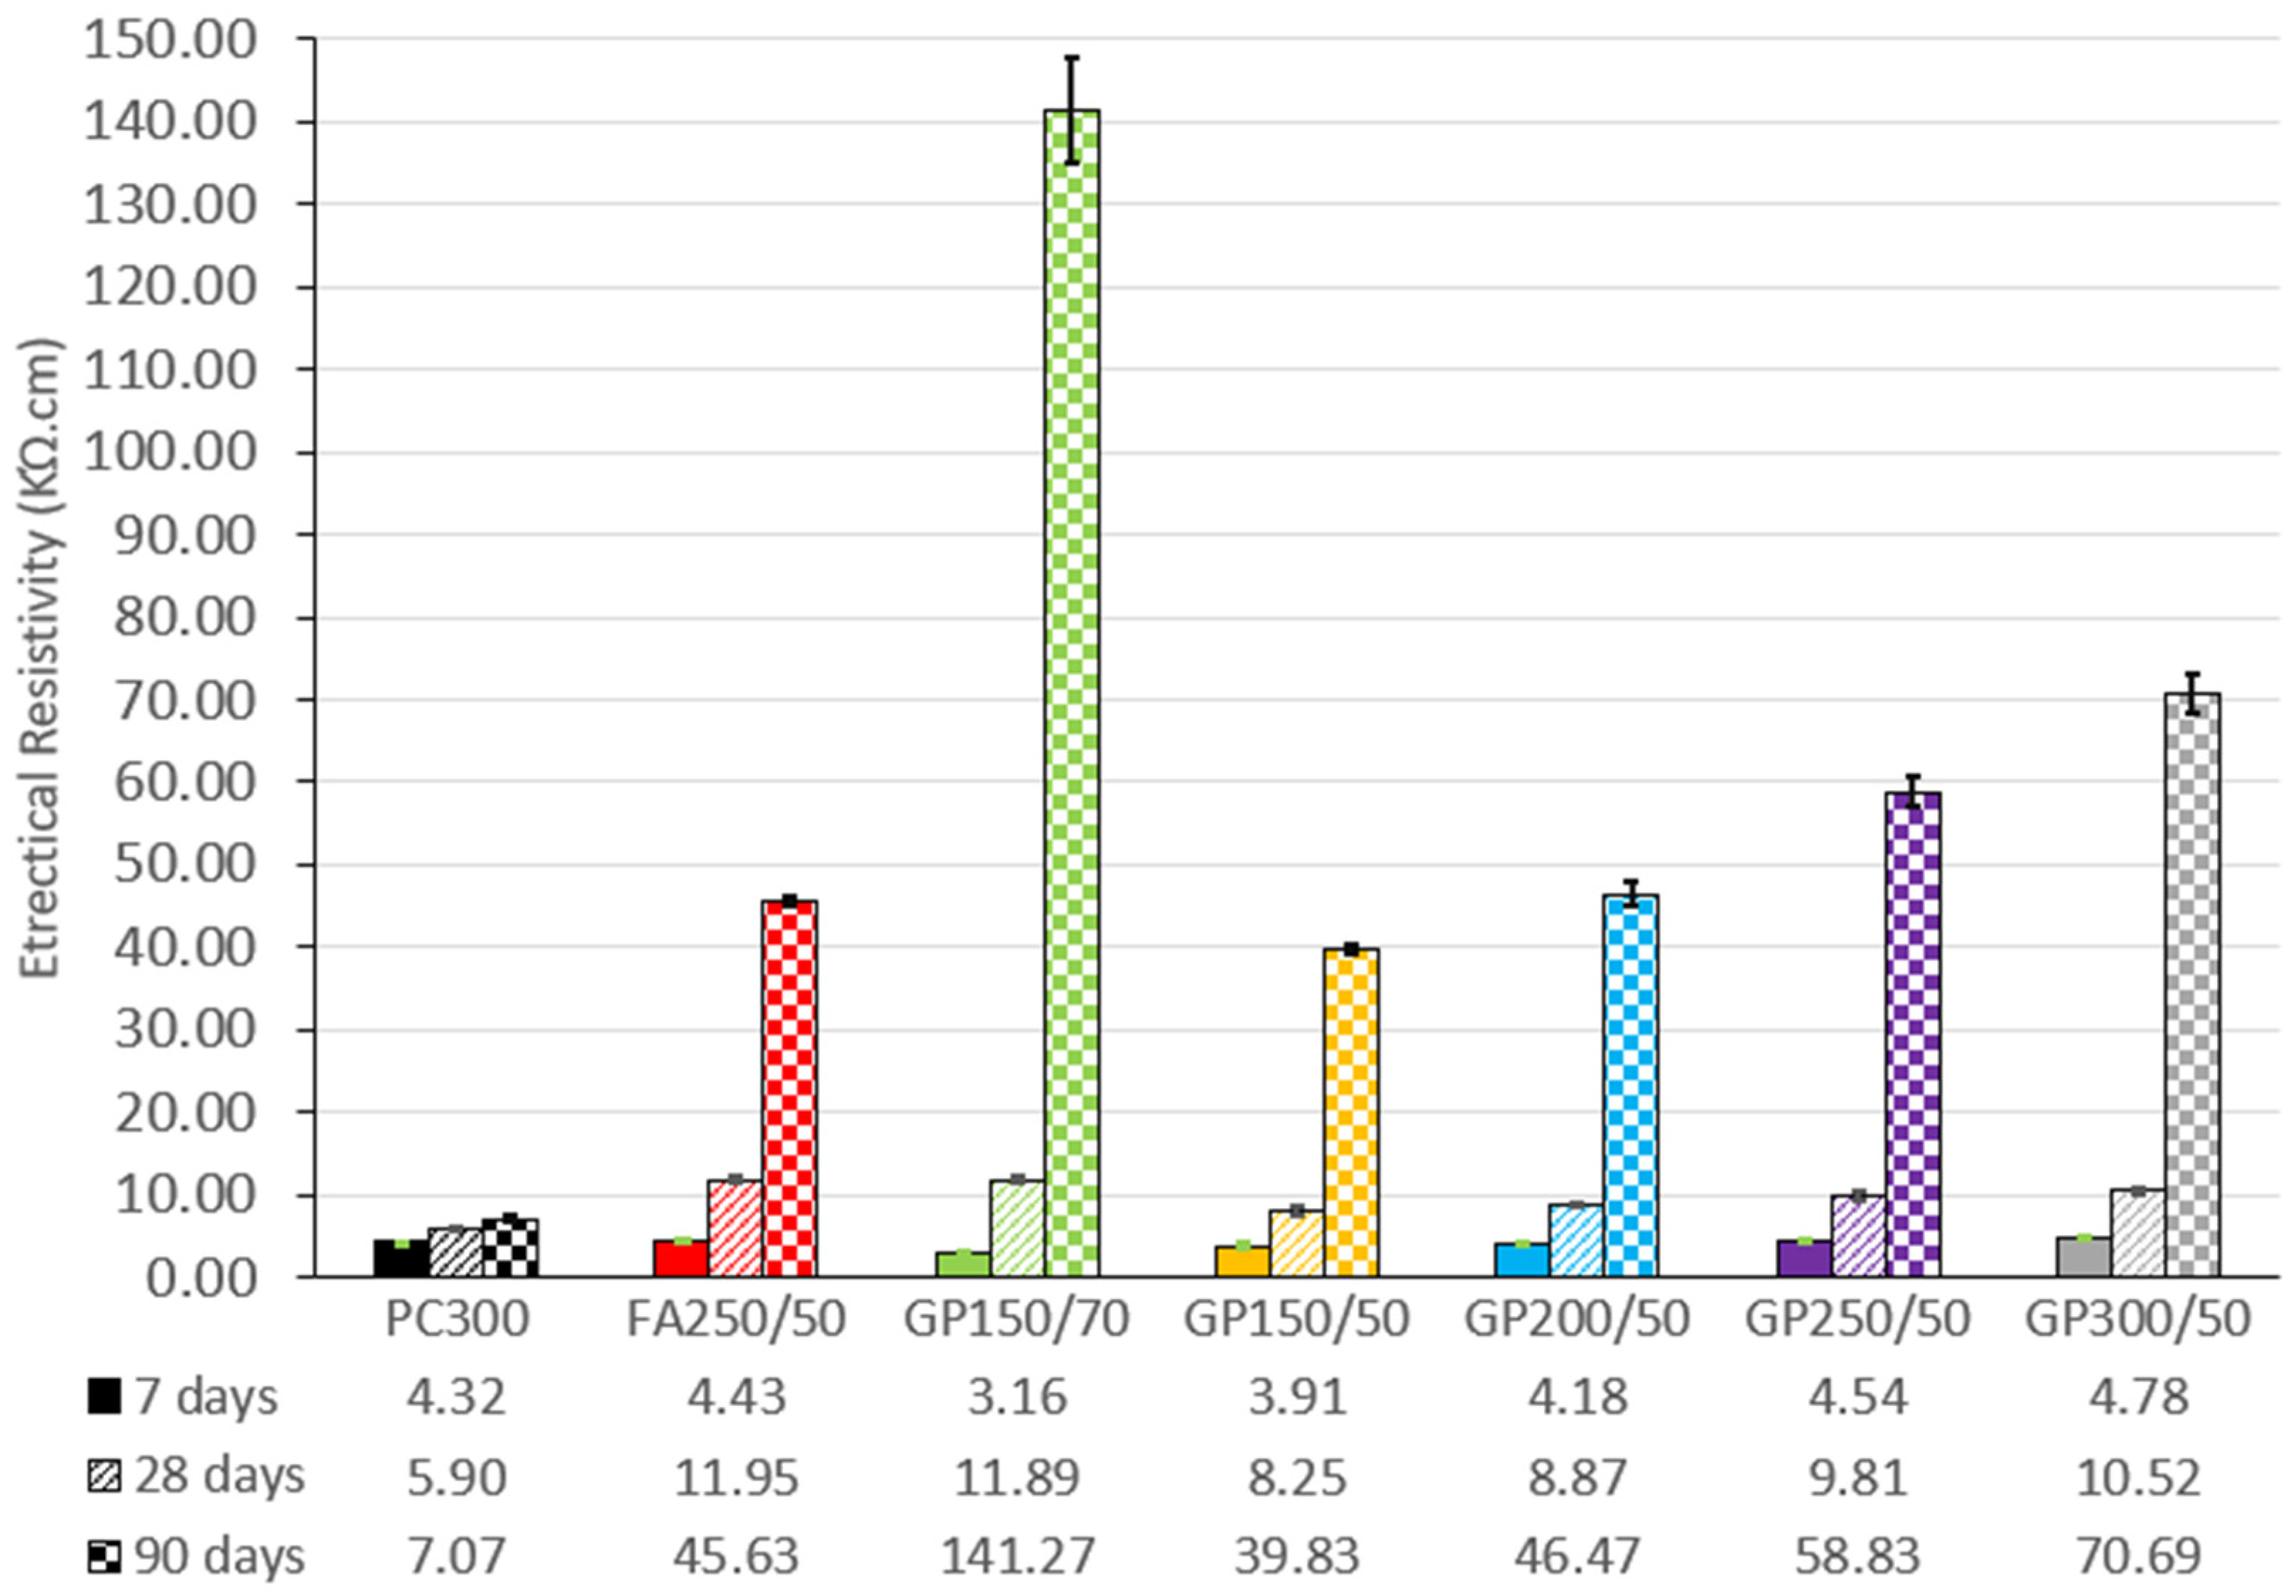
5.6. Electrical Resistivity
In
Figure 10 we can see the development of electrical resistivity, from 7 to 90 days of cure. The results are an average of the readings (3 lines on 2 specimens).
The incorporation of FA and GP in concrete significantly enhances its resistivity. Compared to the control, the composition with the lowest performance is GP150/50, but the difference is still notable, especially at 90 days. In this case, we have: −9.5% at 7 days, +39.8% at 28 days, and +563.4% at 90 days. The slow development of the pozzolanic reactions of the glass powder results in an exponential growth in the values, especially between the ages of 28 and 90 days.
It can also be seen that increasing the GP content of the compositions (between GP150/50, GP200/50, GP250/50, and GP300/50) results in an increase in resistivity at any age.
When comparing the fly ash composition (FA250/50) with its glass equivalent (GP250/50), it can be seen that at first (7 days) the values are equivalent, 4.43 and 4.54 kΏcm, respectively. At 28 days, there is a slight superiority of the fly ash, 11.95 and 9.81 kΏcm.
However, at 90 days, the trend changes, with the glass powder showing significantly higher values of 45.63 and 58.83 kΩcm. When focusing solely on the data from concrete containing 50% GP, the following pattern is observed: higher electrical resistivity, greater compressive strength, and a lower chloride diffusion coefficient, as depicted in
Figure 11.
The results obtained are similar to those of Kamali et al. [
31]. In their studies with concrete incorporating glass powder, the authors observed a substantial enhancement in electrical resistivity when compared to reference concrete and fly ash concrete. The improved compactness of the material was responsible for the significant increase in electrical resistance, which is in line with the concept that cementitious materials formed as a result of a pozzolanic reaction fill the pores better, contributing to an increase in the mechanical properties and durability of the mixtures.
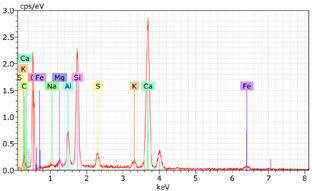
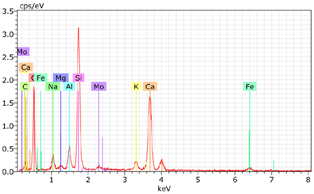
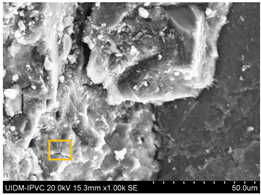
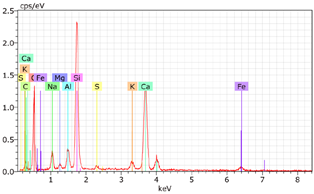
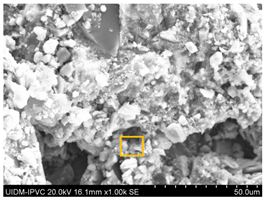
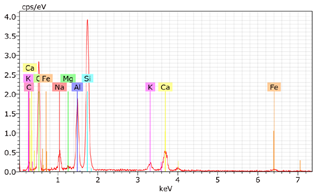
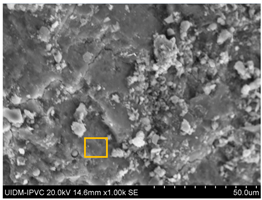
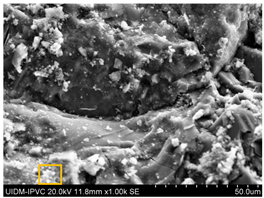
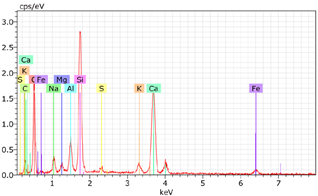
5.7. Microstructural Examination of Concrete Specimen (SEM/EDX)
A Hitachi SU1510 scanning electron microscope (SEM) equipped with energy dispersive spectroscopy (EDS) and a Bruker AXS detector were used to examine the nature of the concrete specimens (
Table 3), after 180 days of cure, as shown in
Table 6. The system also incorporated Quantax software, version Espirit 1.9, for chemical homogeneity analysis. In order to maximize the SEM analyses, part of the samples was pre-subjected to sputtering, allowing a thin layer of carbon to be deposited on their surface, ensuring good electronic conductivity on the sample surface.
As expected, the concrete containing GP exhibited a high silica content. The presence of small, elongated crystals suggests they may be ettringite or another form of calcium sulfoaluminate, as indicated by the EDX spectrum. In several areas, remnants of fine GP particles were observed, which appeared to have been consumed by the cement paste. EDX analysis revealed that these particles had transformed into Si- and Ca-rich phases while also retaining significant amounts of Na. Additionally, needle-shaped crystals were identified at certain locations where the pozzolanic reaction of GP occurred, with high alkali retention noted. Overall, SEM/EDX analysis showed no harmful reactions involving GP in concrete mixtures. The glass powder particles appeared to have been fully integrated into the concrete. No fractures or cracks were identified in the concrete. Furthermore, SEM/EDX observations indicated that the alkali originally present in the glass powder was incorporated into the cement paste and crystalline phases formed through the pozzolanic reaction of GP.
5.8. General Performance of Compositions Studied
The following is a general summary of the performance of compositions containing GP concerning the reference composition (PC300—
Table 7) and fly ash (FA250/50—
Table 8). To give a macro view of the results, the difference between the results obtained by the compositions with GP and the reference compositions was calculated as a percentage. It is important to note that in carbonation, capillarity, porosity, and chlorides, the negative sign before the percentages represents an improvement. However, in resistivity and compressive strength, the opposite situation occurs, that is, the minus represents something worse.
In summary, compared to the reference, the compositions with GP were much better in practically all the tests evaluated (
Table 7). Only in carbonation was there a significant deterioration in the compositions with a low cement content (150 kg/m
3). This fact is important because it may require applicability criteria to make the use of these concretes viable, such as raising the coating layer or applying a surface treatment to prevent carbonation.
Compared to fly ash (
Table 8), the compositions with the lowest cement content, GP150/70 and GP150/50, performed worse in almost all the tests. However, this should be put into perspective, as there is a significant difference in cement dosage between them. Those with FA have 250 kg/m
3, and those with GP have only 150 kg/m
3. A more coherent comparison is made with GP200/50 (50 kg less cement), GP250/50 (equal dosage), and GP300/50 (50 kg more cement). In this case, the scenario is completely different. The GP200/50 mixture has less cement and was still close to the FA’s, losing out only in compressive strength and carbonation. The GP250/50, which has the same cement dosage, proved to be better in practically all the tests, except compression, where the difference was insignificant. Finally, the GP300/50 had better results in all areas. It can therefore be said that it is possible to replace FA with GP in concrete without compromising its strength and durability, using criteria and adjusting the composition to the desired objectives.
The purpose of these comparisons is not to determine whether one composition is better or worse than another. As was said before, the aim has been to demonstrate that the use of glass powder is viable and that to make the best use of this solution, it is crucial to adjust the dosage to the demand, avoiding waste and providing added value in the production of sustainable concrete.
_Su.png)


 Better between 11 and 20%.
  Better up to 20%.
  Worse up to 20%.
 Better between 0 and 10%.
  Better between 11 and 20%.
  Better up to 20%.
  Worse between 0 and 10%.
  Worse between 11 and 20%.
  Worse up to 20%.