Article

Comprehensive Ecotoxicity of the Complex System of Polycyclic Aromatic Hydrocarbon-Contaminated Sites to Wheat (Triticum aestivum L.) During Microbial Remediation

1
Key Laboratory of Urban Stormwater System and Water Environment, Ministry of Education, School of Environment and Energy Engineering, Beijing University of Civil Engineering and Architecture, Beijing 100044, China
2
Beijing Energy Conservation & Sustainable Urban and Rural Development Provincial and Ministry Co-Construction National Collaboration Innovation Center, Beijing University of Civil Engineering and Architecture, Beijing 100044, China
*
Author to whom correspondence should be addressed.
Sustainability 2025, 17(9), 4127; https://doi.org/10.3390/su17094127
Submission received: 10 March 2025 / Revised: 25 April 2025 / Accepted: 30 April 2025 / Published: 2 May 2025

Abstract

Microbial remediation is an eco-friendly and cost-effective method for treating organic-contaminated soil, essential for sustainable land use due to its minimal secondary pollution and operational simplicity. However, during the degradation of polycyclic aromatic hydrocarbons (PAHs), the formation of polar or toxic intermediate metabolites can lead to unpredictable ecotoxicological impacts. In this study, we investigated the effects of the microbial remediation of organic-contaminated soils on wheat seedling growth and physiology, and evaluated soil ecotoxicity throughout the remediation process. The results showed that the concentrations of benzo[a]anthracene (BaA) and benzo[a]pyrene (BaP) decreased by 70.4% and 49.9%, respectively, following microbial degradation, with the degradation process following a second-order kinetic model. Despite the reduction in pollutants, soil toxicity increased from days 10 to 20, peaked on day 20, and then gradually decreased, but it remained elevated throughout the remediation process. Increased ecotoxicity inhibited wheat seed germination, seedling growth, and chlorophyll content, induced oxidative stress, and suppressed soil enzyme activity. Gas chromatography–mass spectrometry (GC-MS) analysis identified toxic intermediate metabolites as the primary contributors to enhanced ecotoxicity. Wheat seed germination potential, plant height, root length, and superoxide dismutase (SOD) and catalase (CAT) activity in roots can effectively indicate soil ecotoxicity throughout the microbial remediation process. These parameters facilitate the optimization of remediation strategies to ensure restored soil functionality and long-term ecological sustainability.

1. Introduction

The restructuring of urban industrial sectors, including petroleum, steel, and chemical manufacturing, has resulted in many contaminated sites [1,2]. Polycyclic aromatic hydrocarbons (PAHs), prevalent organic pollutants at these sites, often exceed standard guideline concentrations [3,4]. Due to the direct and indirect threats these pollutants may pose to regional organisms, and in the context of sustainable development, the remediation of polycyclic aromatic hydrocarbon contaminated sites is not only crucial for environmental protection, but also for the long-term availability of land resources. Consequently, the need for remediation of PAH-contaminated sites is a global imperative.
Physical and chemical remediation methods usually have some disadvantages, e.g., high costs, incomplete removal, and the potential for secondary pollution, rendering them less environmentally friendly. Microbial remediation techniques have been widely applied because they are simple and effective, and their application has minimal environmental impact [5,6,7,8]. In addition, the integration of microbial remediation into PAH-contaminated site management aligns with sustainability principles by minimizing the environmental footprint and promoting circular economy practices. Typically, to determine the effectiveness of a remediation technique, the concentration of a target contaminant in the soil is monitored, and it is also a popular method for conducting risk assessment after microbial remediation [9]. In fact, single chemical analyses of the target contaminant do not accurately reflect the ecotoxicity of the sites because of the generation of some uncertain secondary metabolites or intermediates during the remediation [10]. Moreover, multiple pollutants at a contaminated site can interact synergistically or antagonistically, potentially increasing soil ecotoxicity during microbial remediation [11,12]. Therefore, a more comprehensive assessment of ecotoxicity—the potential that a compound can have a deleterious effect on the environment and its species—based on species exposed to a polluted environment is necessary. This approach would better characterize soil hazards following microbial remediation, and the subsequent reuse of these contaminated sites.
To assess site ecotoxicity, the inhibitory effects of pollutants on certain organisms in direct contact with soil are typically determined. Plants such as wheat [13,14], radish [15], and lettuce [16], and invertebrates such as earthworms [17] have been used as the test organisms to evaluate the effects of contaminants on growth indicators such as seed germination rates, plant height, root elongation, and organismal survival and reproduction. Generally, the stronger the inhibitory effect, the more toxic the soil. Thus, the biological testing method for comprehensive ecotoxicity has been commonly used to evaluate contaminated site ecotoxicity following microbial remediation [18] and compare the ecotoxicity of the sites after applying different remediation technologies [19,20]. This method not only helps to understand the direct impact of pollution, but also provides insights into the long-term ecological health of soil, which is the foundation of sustainable land management.
Microbial remediation of organic contaminated sites is a continuous and complex process. For PAH-contaminated sites, uncertain secondary metabolites and intermediate compounds and residue from refractory components may cause stronger ecotoxicity than the target pollutants, exacerbating unpredictable toxic effects on soil ecosystems [21,22,23]. For example, some toxic volatile organic compounds were generated or leached out during the microbial remediation of PAH-contaminated sites [24]. Therefore, evaluating soil ecotoxicity solely after microbial remediation does not fully capture the ecotoxicological effects generated throughout the remediation process, or enable full evaluation of the effectiveness of a microbial remediation technology. Site ecotoxicity should be assessed throughout the remediation process to optimize the restoration process, minimize negative impacts on the environment, and ensure that the restored site can support sustainable ecology and human activities in the long term.
In this study, we use wheat (Triticum aestivum L.)—one of the most important grain crops in China directly planted into the soil—to test the ecotoxicity of PAH-contaminated soils during microbial remediation. Growth parameters and physiological indices, such as germination potential, plant height, root length, biomass, peroxidase (POD), superoxide dismutase (SOD), catalase (CAT), and malondialdehyde (MDA), were monitored throughout remediation, and potentially toxic intermediate metabolites generated during remediation were identified.

2. Materials and Methods

2.1. Chemicals, Reagents, and Sample

2.1.1. Chemicals and Reagents

N-hexane (Chromatographically pure) was purchased from Shanghai Aladdin Biochemical Technology Co., Ltd., (Shanghai, China). Dichloromethane, toluene, and acetone (Analytically pure) were purchased from Beijing Tong Guang Fine Chemical Company, (Beijing, China). Acetonitrile (Chromatographically pure) was purchased from Cleman Chemical, Changzhou City, Jiangsu Province, (Changzhou, China). The analytical standard of 16 PAHs in acetonitrile, with a concentration of 10 μg/mL, was purchased from TMRM Quality Inspection Technology Co., Ltd., Changzhou City, Jiangsu Province, (Changzhou, China). The total protein (A05-3-2), SOD (A001-1-2), CAT (A007-1-1), POD (A084-3-1) and MDA (A003-1-2) kits were purchased from Nanjing Jiancheng Bioengineering Institute, (Nanjing, China).

2.1.2. Soil Samples

Contaminated (C) soils were collected from an abandoned industrial site (Hangzhou, China). Uncontaminated (control) background (B) soils were taken from an undisturbed site (Hangzhou, China). PAH concentrations in soil were determined using high-performance liquid chromatography (HPLC). Benzo[a]anthracene (BaA) and benzo[a]pyrene (BaP) are predominant contaminants in the polluted soil, with concentrations of 14.2 mg·kg−1 and 11.2 mg·kg−1 respectively. Both contaminants exceed the risk screening values specified for Category I construction land in China’s national standard “Soil environmental quality Risk control standard for soil contamination of development land” (GB 36600-2018) [25], which are 5.5 mg·kg−1 for BaA and 0.55 mg·kg−1 for BaP. The total petroleum hydrocarbon concentration was measured at 134 mg·kg−1, remaining below the same standard’s screening value of 826 mg·kg−1. Furthermore, no detectable levels of halogenated hydrocarbons were observed in the soil samples. Other characteristics of organic contaminated and background soil samples are detailed in Table 1.
PAH-degrading microbial agents (Ultra Arb and Terramend®) were obtained from Enviro-chem Environmental Technology Co., Ltd. (Beijing, China). These agents were mixed in a ratio of 1:1 (w/w) and added to contaminated soil at a 2% (w/w) dosage to obtain a microbial-agent-treated (M) soil.

2.2. Batch Experiments

2.2.1. Wheat Seed Germination and Growth

Following the addition of microbial agents to organically contaminated soils, three 100 g samples of microbial agent-treated soil (M) and contaminated soil (C) from the original site were collected every 5 d for 40 days to comparatively assess wheat growth; background soil (B) was used as the control. Soil samples were air-dried and sieved to <2 mm; three replicate samples were placed into Petri dishes, and 10 wheat seeds were sown into each. The samples were then placed into a seed incubator (KM-685 Seed Incubator, Ningbo Kemai, China). Soil moisture content was maintained at 60% of the maximum water holding capacity of the soil; the temperature was kept at 25 ± 1 °C. Wheat seeds (T. aestivum) were purchased from the Beijing Academy of Agricultural Sciences. Seeds were kept in the dark for 48 h after being sown in the soil, and then exposed to a light/dark cycle of 14 h/10 h for 5 d. After 7 d of incubation, the wheat plant height, root length, and biomass were determined and averaged. Shoots and roots were transferred to an oven at 80 °C, and then heated to constant weight (recorded as dry weight) [26]. Wheat germination potential was measured as the number of germinated seeds divided by the total number of experimental seeds over the first 3 d [27] (germination status was determined by examining seeds from the bottom of the transparent Petri dish, and counting the number of sprouts emerging from the thin layer of soil).

2.2.2. Wheat Physiological Properties

Three containers (50 × 50 × 16 cm) were filled with 10 kg of B, C, and M soils. Wheat plants (100 seedlings) cultivated for 7 d in B-type soil under favorable and similar growth conditions were transplanted into each container. Soil moisture content was adjusted to 60% of the maximum field water holding capacity, and ambient temperature was maintained at 25 ± 1 °C. Every 5 d for 40 d, 10 plants were randomly selected and removed from each container. Leaf photosynthetic pigments, antioxidant enzyme activities, and MDA contents from different parts of root, stem, and leaf tissues were determined. Wheat leaves cultured in M-type soil for 25 d were washed with ultrapure water, and the epidermis was carefully peeled off using tweezers, cutting them into 1 × 1 cm fragments. The epidermis was spread flat in ultrapure water, pressed slightly with a cover glass, and then observed under a biomicroscope (BOSMA 605F04, BOSMA IND CO., LTD, China) [28]. A soil sample was collected every 5 d to determine BaA and BaP concentrations and soil enzyme activities.
Root, stem, and leaf samples were homogenized and centrifuged to obtain enzyme extracts to determine POD, SOD, CAT, and MDA levels using commercial kits purchased from Nanjing Jiancheng Bioengineering Institute, China [29].
Leaf samples (0.1 g) were ground with 10 mL of 95% ethanol in a mortar, and then centrifuged. The supernatant was collected for absorbance measurements at wavelengths of 470, 664, and 649 nm (752 UV-VIS, Shanghai Sunny Hengping, Shanghai, China). Leaf photosynthetic pigment contents (chlorophyll a (Chl a), chlorophyll b (Chl b), and carotenoids (CAR), mg·g−1) were calculated following [30].
C h l   a = ( 13.36 × A 664 5.19 × A 649 ) × V 1000 × W
C h l   b = ( 27.43 × A 649 8.12 × A 664 ) × V 1000 × W
C A R = 1000 × A 470 2.13 × C h l   a 97.64 × C h l   b 209 × V 1000 × W
where A470, A664, and A649 represent the absorbance values measured at 470 nm, 664 nm, and 649 nm, respectively. V is the volume of 95% ethanol (mL), and W is the fresh weight of the leaf (g).

2.3. Soil Properties

2.3.1. BaA and BaP Concentrations

Methods to extract PAHs from soils were based on Pillay [31]. The centrifuge tube was filled with 5.0 g of the soil sample, to which 30 mL of n-hexane-dichloromethane solution (1:1, v/v) was added; the mixture was then sonicated (AS-B Ultrasonic Cleaner, Beijing Heng Company Limited company of science and technology, Beijing, China) in a water bath at 35 °C for 20 min, and then centrifuged at 4000 rpm for 10 min to obtain the supernatant; this procedure was repeated twice. The two extracts were combined and concentrated to dryness by rotary evaporator, and then 5 mL of acetonitrile was added and 1 mL of the mixture was taken into a brown autosampler vial through a 0.22 μm filter membrane. Extracts were measured on an HPLC (Agilent 1260, America) equipped with a ZORBAX Eclipse Plus C18 liquid chromatography column with 85% acetonitrile and 15% ultrapure water as mobile phases, with a column temperature of 30 °C, detection wavelength of 295 nm, and injection volume of 10 μL. The soil concentrations of BaA and BaP were determined using external standards. Spiked recovery rates were measured 10 times. The recovery rates for both BaA and BaP were above 80% (n = 10). First-order Equation (4) and second-order kinetic Equation (5) models were used to describe their contents in soils during microbial degradation.
The kinetic equation is shown in the following equation:
C t = C 0 e x p ( k 1 t )
1 / C t = k 2 t + 1 / C 0
where Ct is the residual concentration of BaA and BaP in the soil after the treatment time t (mg·kg−1); C0 is the initial pollutant concentration (mg·kg−1); and k1 and k2 are rate constants for first- and second-order kinetics, respectively.
Potential intermediate compounds and metabolites of BaA and BaP were determined in soils by GC/MS (Agilent 7890 Gas Chromatograph, 5975C Mass Selective Detector (MSD)) for days 0, 10, 15, 20, and 60 following microbial remediation using the method of Pillay and Moodley [31].

2.3.2. Soil Enzyme Activity

Soil urease activity was measured according to the method described by Liu et al. [32], with the activity expressed in μg NH4+·g−1·h−1. Briefly, 5 g of soil was incubated with 10 mL of 10% urea and 20 mL of citrate buffer (pH 6.7) at 37 °C for 24 h. It was then mixed with 1 mL toluene for 15 min. Immediately after incubation, the mixture was filtered and 1 mL of supernatant was mixed with 10 mL of 37 °C distilled water, 4 mL of sodium phenol (1.35 m) and 3 mL of sodium hypochlorite (0.9% active chlorine) for 20 min. The amount of N-NH4+ released by urea hydrolysis in the supernatant was measured at 578 nm.
Soil phosphatase activity was determined following [33], with activity expressed in μg PNP·g−1·h−1. An amount of 5 g of soil was incubated at 37 °C for 3 h in 10 mL of acetate buffer (pH 5.0) and 5 mL of 20 mM buffered disodium phenyl phosphate solution; the release of phenol was determined at 614 nm using 2,6-dibromchinone-chlorimide as a color reagent [30].

2.3.3. Soil DOC Content

The soil dissolved organic carbon (DOC) content was determined following the method of Wang et al. [34]. Soil samples were mixed with ultrapure water at a ratio of 1:5 (w/v) and shaken at 180 rpm for 1 h on a reciprocating shaker (SHAX-100, Shanghai Precision Instruments Co., Ltd., Shanghai, China). The mixture was then filtered through a 0.22 μm polypropylene filter membrane (Jinteng, Tianjin, China). The filtered solution was used to determine DOC content using a total C/N analyzer (Jenamulti N/C3100, Carl Storz Instrument GmbH, Jena, Germany).

2.4. Analysis of the Soil Ecotoxicity

2.4.1. Partial Least Squares Discriminant Analysis

Partial least squares discriminant analysis (PLS-DA) was used to identify the effects of changing soil ecotoxicity on the metrics of plant germination and growth. A model that maximized the covariance between predictor and response variables was established to differentiate categories or groups. Variable importance in projection (VIP) represents variable weight values in the model; VIP size indicates the explanatory power of a plant-growth inhibition effect (independent variable) on soil ecotoxicity (dependent variable) [35]. The higher the VIP value for a growth indicator, the more sensitive that indicator is to soil ecotoxicity, increasing its value as an indicator of the effectiveness of soil remediation. In addition, observing the color depth of the colored box on the right side of the VIP figure can also assist in screening sensitive indicators. If an indicator is blue in the experimental group and red in the control group, it indicates inhibition in the experimental group.

2.4.2. Comprehensive Biotoxicity Analysis (IBRv2, Integrated Biomarker Response Version 2)

Y i = l o g ( X i / X 0 )
where Y i indicates the application of log to reduce variance; X i represents the biomarker data of C and M-type soil treatment; X 0 represents the biomarker data for the control soil treatment.
Z i = ( Y i μ ) / σ
where Z i is the average value of the standardized biomarker response; µ is the general mean of Y i ; and σ is the standard deviation of Y i .
A = Z i Z 0
where A is a parameter calculated for each biomarker; Z 0 is the average value of a standardized biomarker response in the control group.
I B R v 2 = A
Higher IBRv2 values indicate stronger ecotoxicity. The value of IBRv2 is obtained by summing the absolute values of parameter A calculated for each biomarker (chlorophyll a, chlorophyll b, and carotenoids content in wheat seedling leaves, SOD (superoxide dismutase), CAT (catalase), POD (peroxidase) activity, and MDA (malondialdehyde) content in wheat seedling roots). The IBRv2 method uses clean soil as a control, with a baseline value of 0. The further an indicator diverges from this baseline, the greater the IBRv2 value and impact.

2.5. Statistical Analysis

Data were analyzed using SPSS 26 (SPSS Inc., Chicago, IL, USA). One-way ANOVA determined the significance of differences among remediation times for each soil group, with p < 0.05 indicating statistical significance. All figures were created with Origin 2024 (OriginLab Corporation, Northampton, MA, USA), and Pearson correlation analysis was performed using Origin’s correlation plot plugin.

3. Results and Discussion

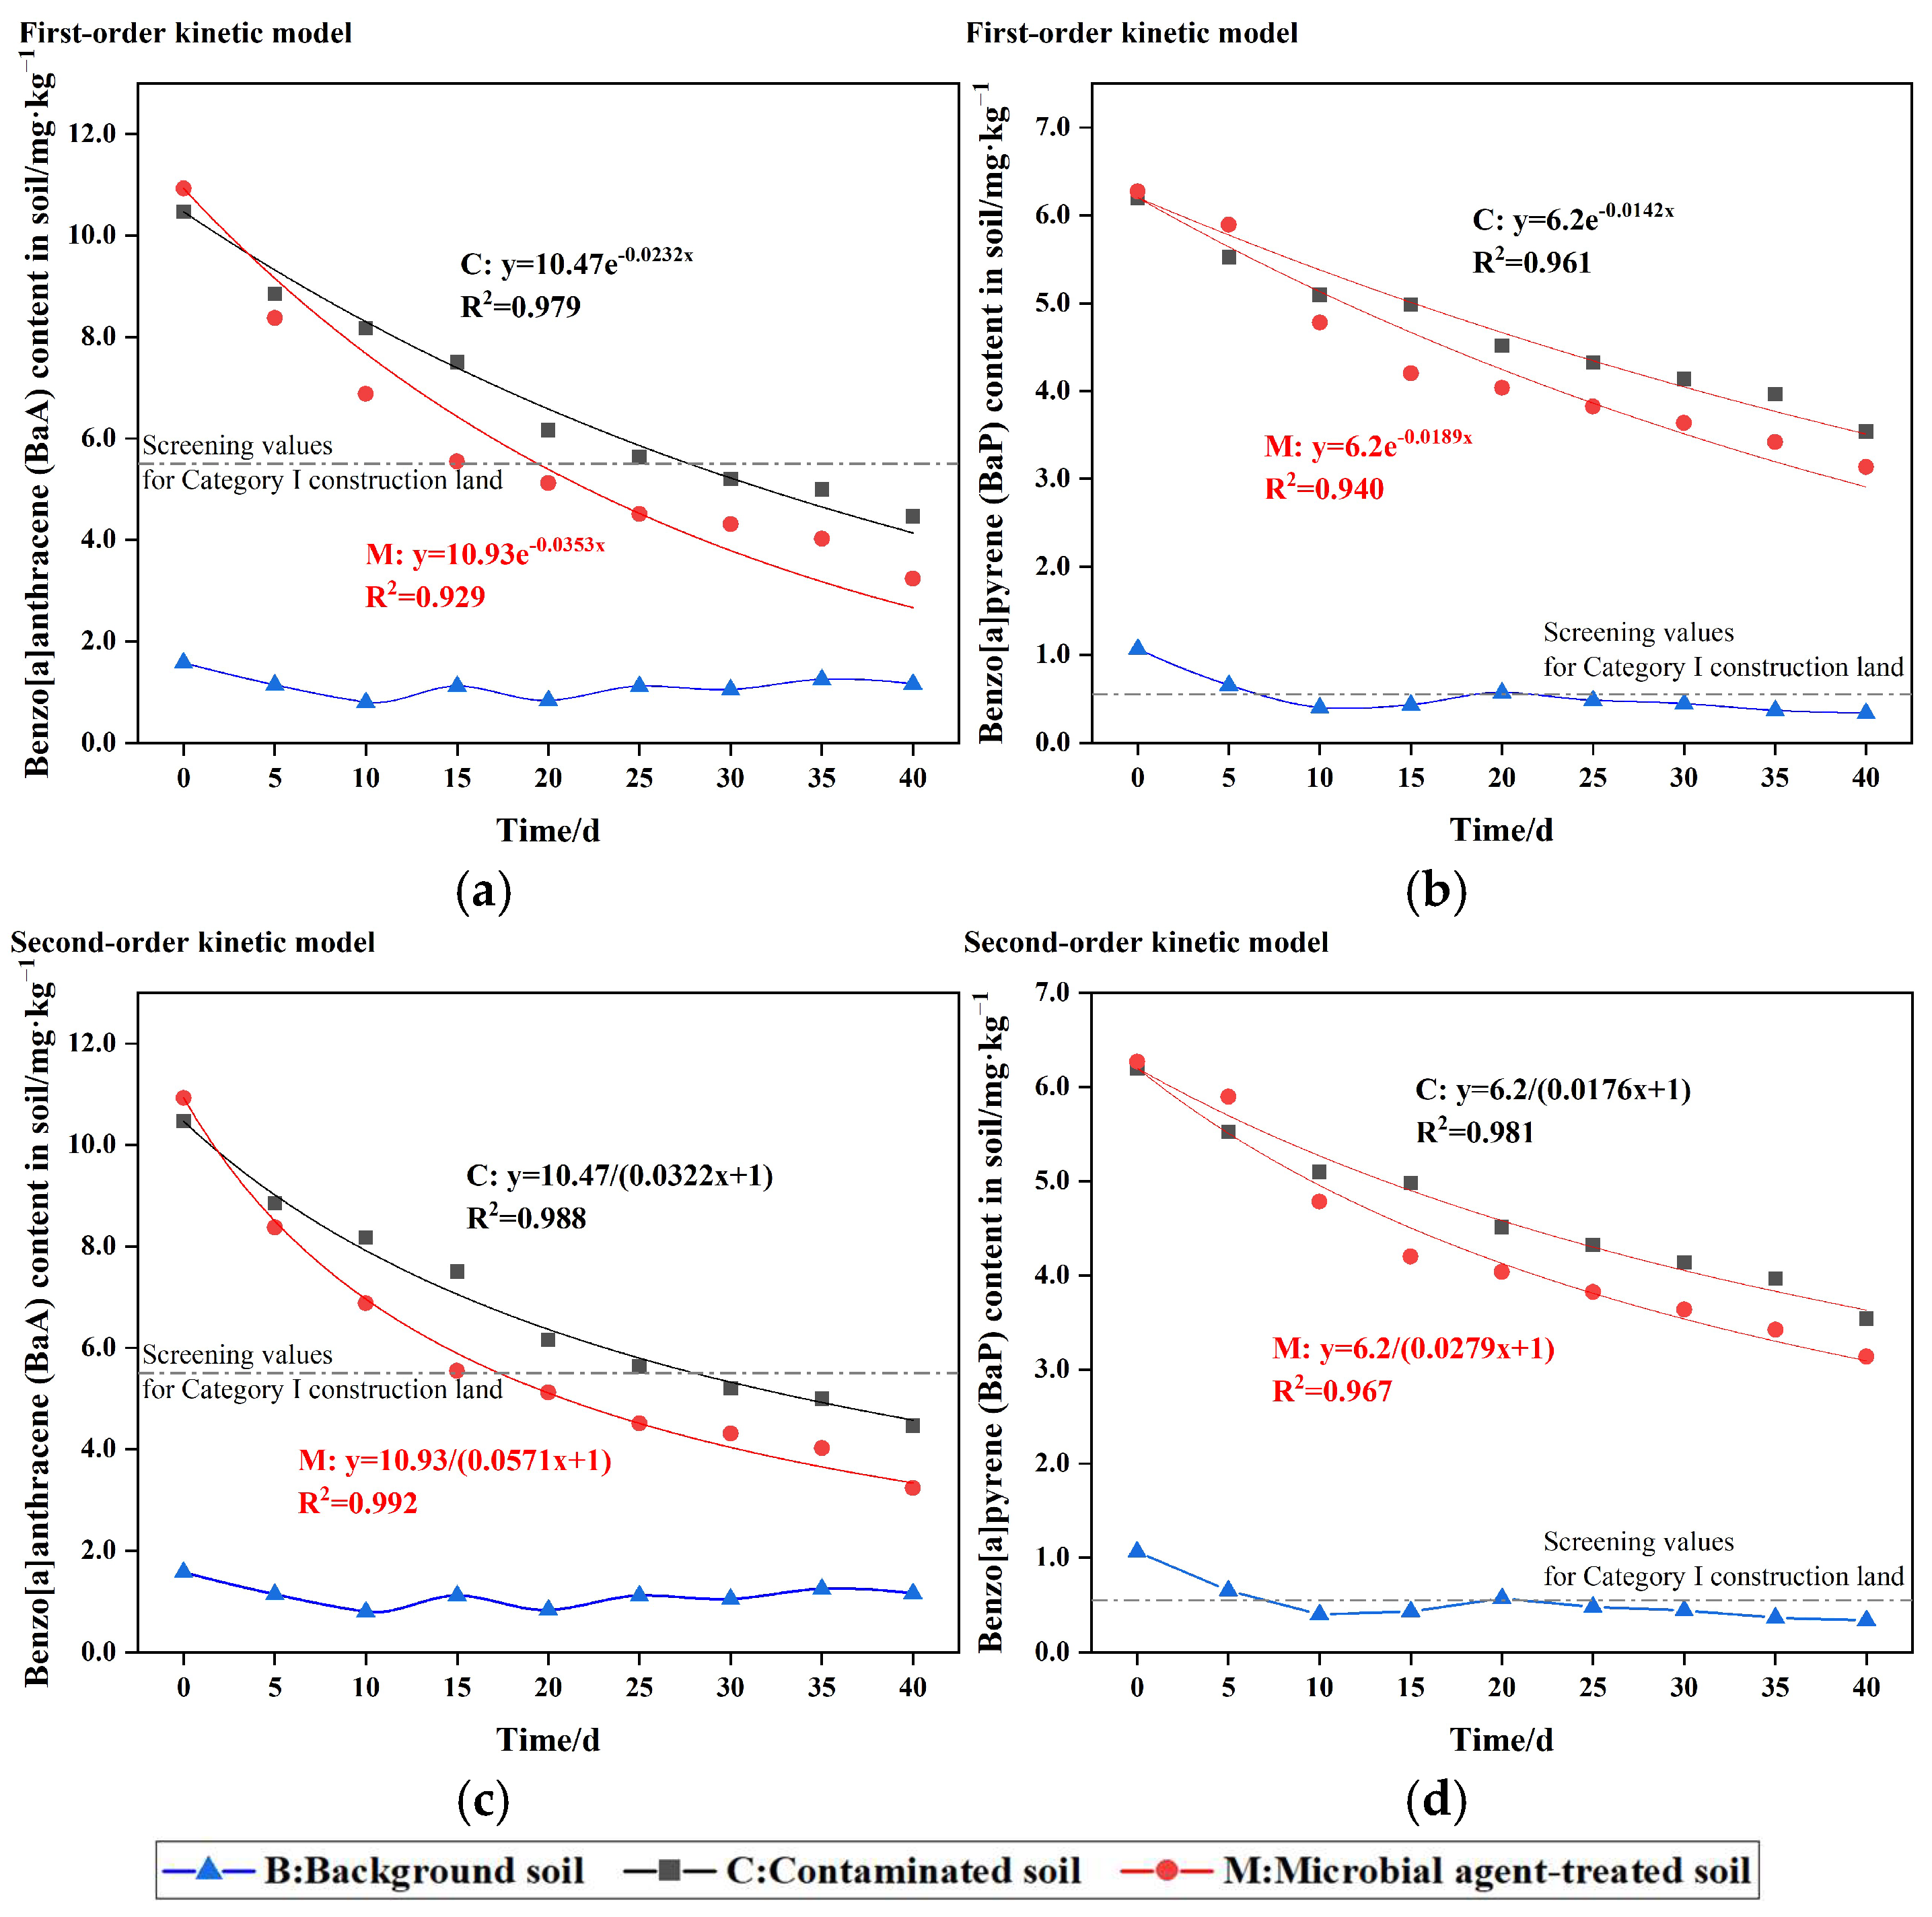
3.1. PAH Concentration During Microbial Remediation

The concentrations of BaA and BaP in the contaminated soils and the remediated soils decreased after 40 days. The removal rates of BaA and BaP in M soils were 70.4% and 49.9%, respectively; these values exceed those for C soils (57.4% and 42.9%, respectively) (Figure 1). This indicates that the microbial degradation of BaA and BaP was more effective than natural degradation. Plants can provide surfactants that facilitate PAH removal by exogenous or indigenous functional microorganisms [36], and a synergistic effect between the microbial agent and plants may have contributed to the degradation of BaA and BaP.
The degradation rates of BaA and BaP in M and C soils decreased after 20 d, possibly for three reasons: (1) Initially high soil concentrations of degradable PAHs and abundant nutrients may have favored microbial growth, resulting in rapid microbial proliferation and high metabolic activities may have increased the PAH degradation rate [37]. However, as the concentrations of degradable PAHs gradually decreased, and concentrations of recalcitrant intermediates gradually increased, the reduction in available carbon sources decreased the degradation rate [38]. Microbial remediation of DOC content in soil at different stages also supports this viewpoint (Figure S2). (2) An increase in soil enzyme activity (urease and phosphatase) (Figure S1) indicates an increase in the relative abundance of microorganisms that express soil enzymes [39]. However, as competition for essential environmental factors such as oxygen and soil nutrients increases, the growth and reproduction of microorganisms (e.g., PAH degrading microorganisms) can be inhibited, and the biodegradation efficiency of PAH will decrease [40,41]. (3) Some intermediate metabolites and incomplete decomposition products of PAHs that accumulate during degradation [23] may be highly toxic and affect the soil environment, inhibiting the growth and reproduction of microorganisms, and decreasing the degradation rate [42]. Because plant adsorption plays a relatively minor role in the microbial degradation of polycyclic aromatic hydrocarbons in sites with high levels of organic contamination [43], this factor was not considered in this study.
First- and second-order kinetic models were used to fit the degradation processes of BaA and BaP for M and C soils (Figure 1). Both models provided good fits, with the second-order kinetic model showing a better fit (Figure 1c,d). The correlation coefficients for BaA and BaP microbial degradation were 0.992 and 0.967, respectively. Generally, first-order and pseudo-first-order models are more commonly used to describe the adsorption process, mostly to reflect initial reactions [44]. Due to the complex reactions involved in the microbial degradation of PAH, the second-order kinetic equation was more suitable for describing the microbial degradation processes of BaA and BaP in M and C soils. Based on the screening value of 0.55 mg·kg−1 for BaP in the “Soil environmental quality Risk control standard for soil contamination of development land (GB 36600-2018),” predictions derived from the second-order kinetic model suggest that BaP could degrade below this value by 129 d of microbial remediation.

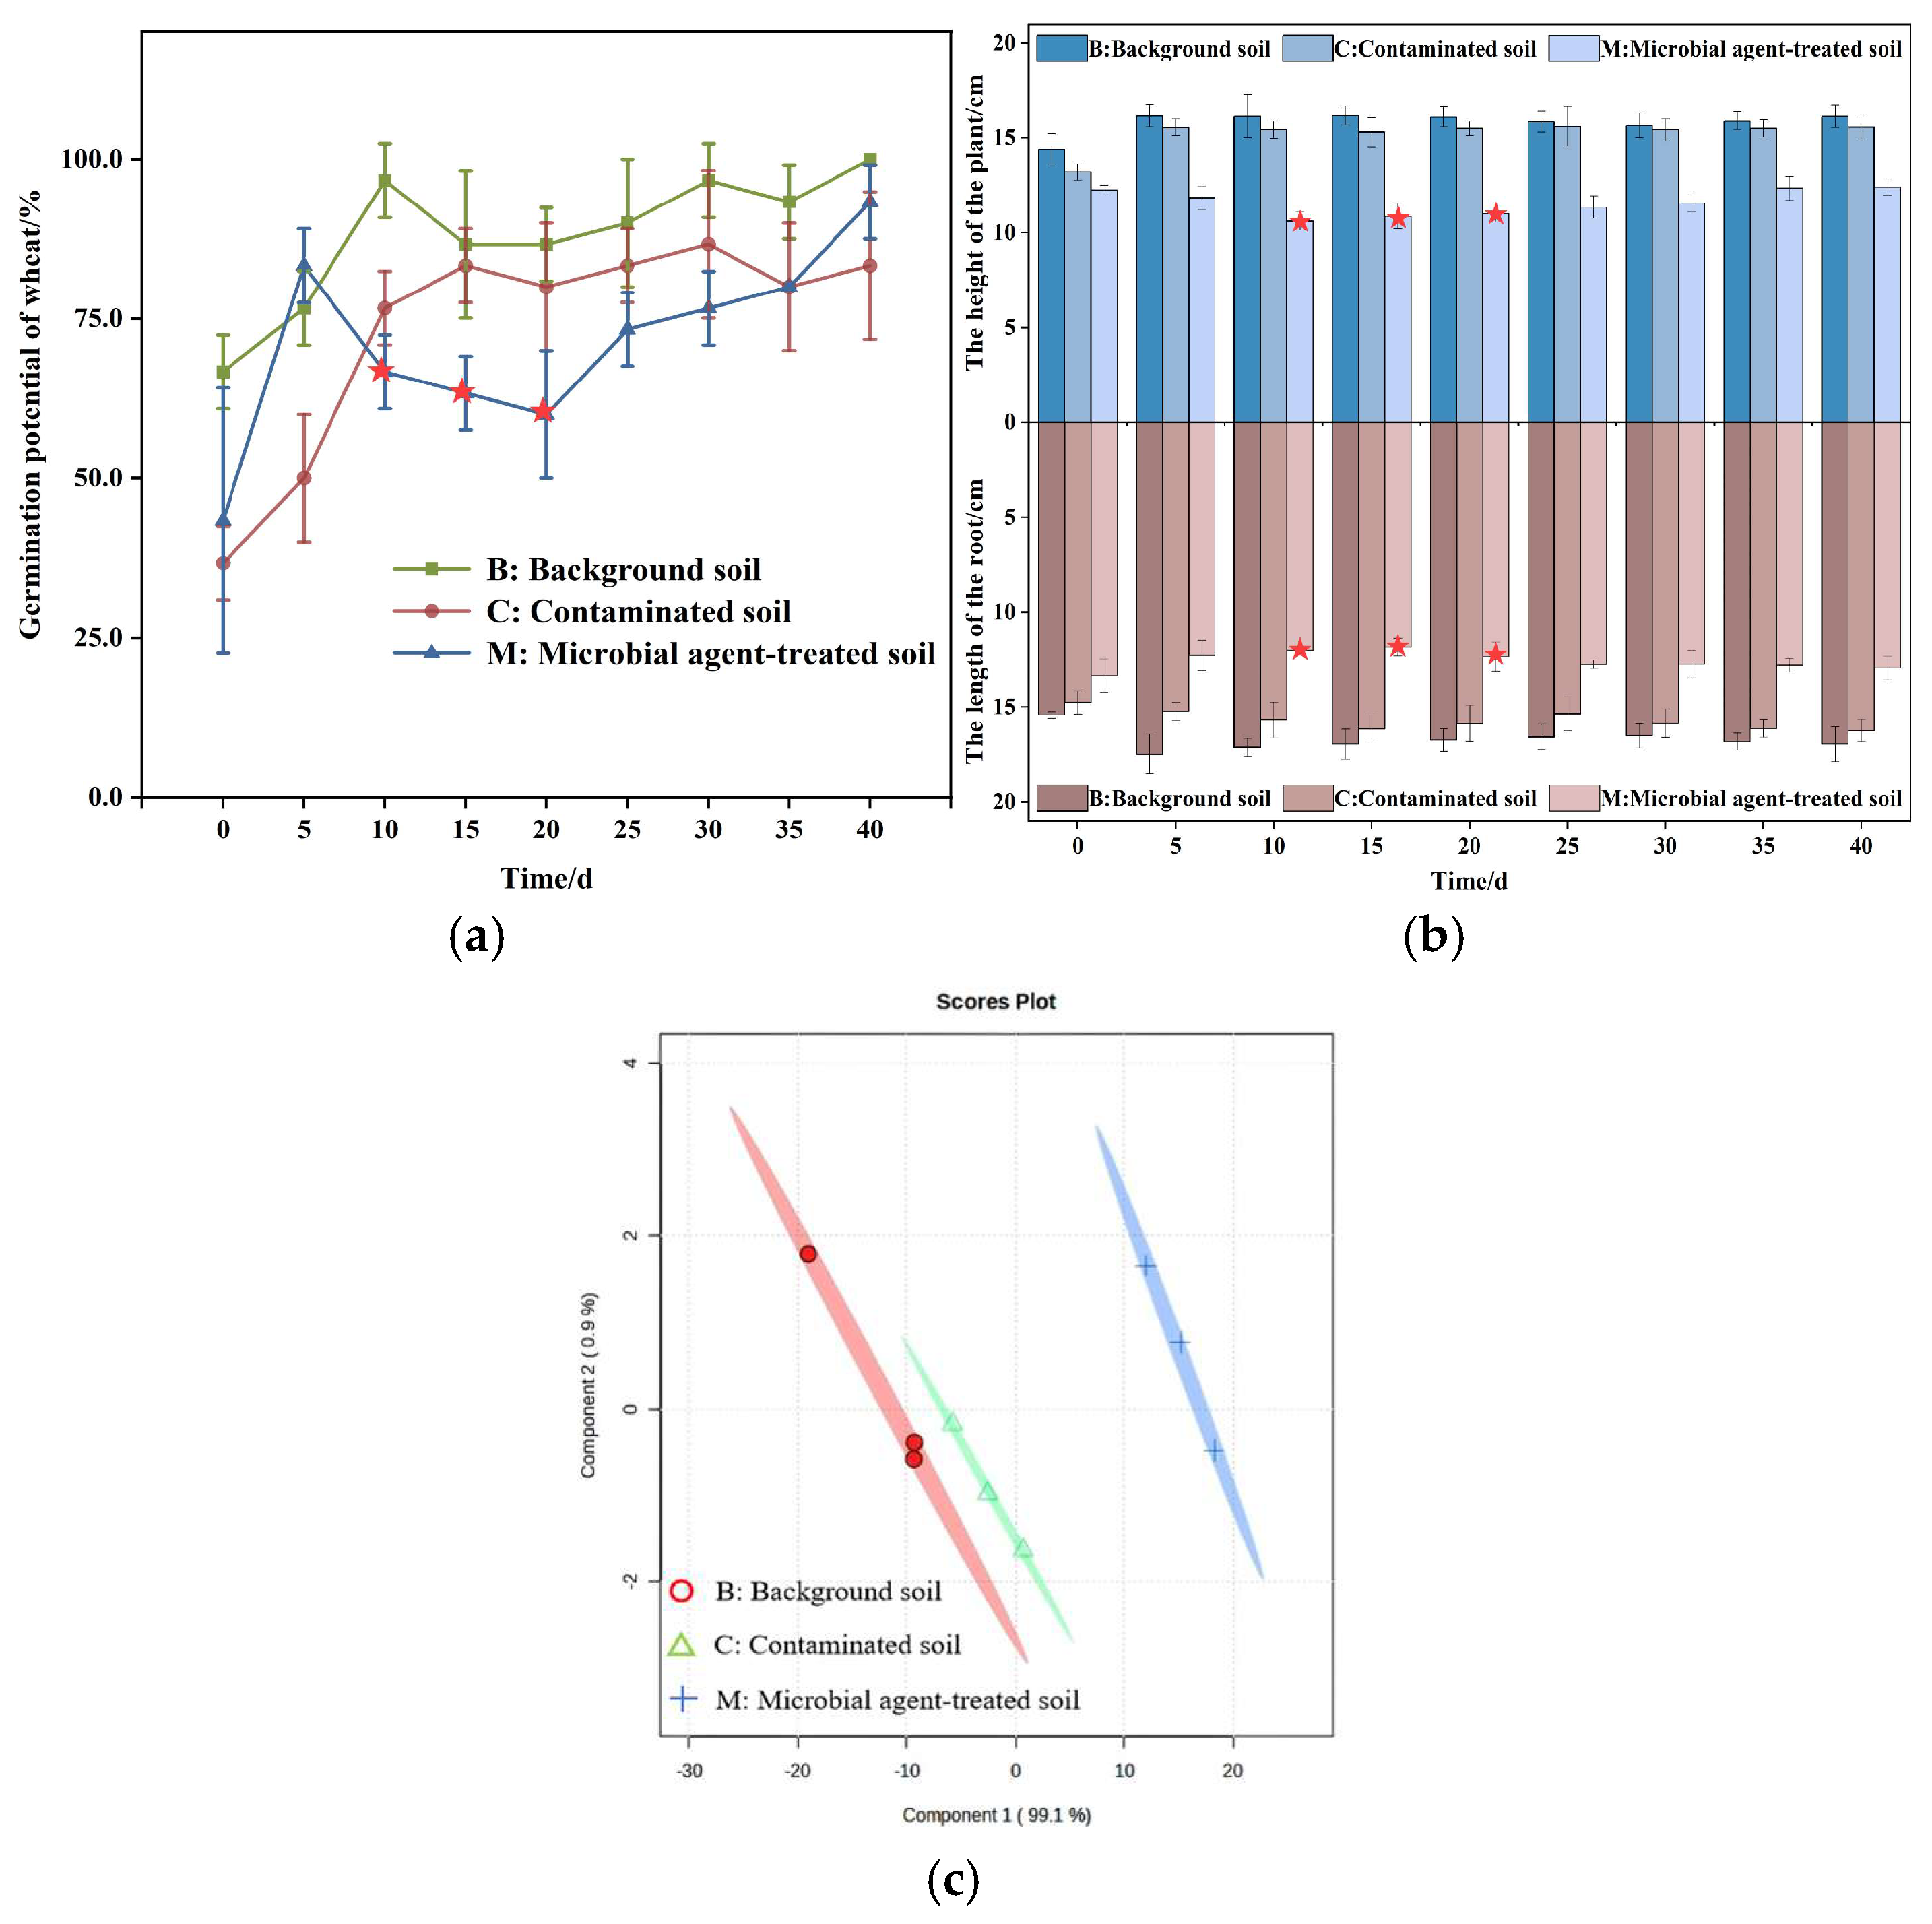
3.2. Wheat Growth Indicators

The germination potential of wheat seeds in B soils was consistently and significantly higher than that in C and M soils (Figure 2a). The results indicated that toxic substances in contaminated and remediated soils inhibited the seed germination of wheat seeds. The germination potential of wheat seeds in B soils obtained in the first 10 days and in C soils with less than 10 natural degradation days indicated low values, followed by relatively high stable values when the number of aging days or degradation days was higher than 10. However, the germination potential of seeds in M soils was different. During the first 5 days of microbial remediation, the germination potential was higher, but it gradually decreased in the subsequent period. The germination potential of seeds in M soils was lower than that in C soils between 10 and 20 d, with inhibition rates of 31.04%, 26.93%, and 30.77% on days 10, 15, and 20, respectively, compared to that of wheat seedlings in B soils. By day 35, the inhibition rate decreased to 14%, and the germination vigor in M soils exceeded that in C soils. The seedling height and root length on a given day or the remediation duration were the greatest in B soils and lowest in M soils, with values in M being significantly lower than those in B and C soils (Figure 2b). This indicates a stress effect. Compared with the seedling height in B soils, the seedling height inhibition rates in M soils during days 10–20 of microbial remediation were 34.10%, 32.76%, and 31.49%, higher than those in other periods. Similarly, the root length inhibition rates of wheat seedlings in M-type soils during this phase were also higher than in other periods, with values of 29.77%, 30.11%, and 26.24% on days 10, 15, and 20, respectively. After this period, the plant height and root length gradually increased in M soils, and by 40 days of remediation, they reached the initial level of remediation (day 0), but the plants were still shorter than those in B and C soils at the same time. Seedling biomass followed a similar trend (Table S1). Compared with the fresh weight of seedlings in B soils, the inhibition rates of whole wheat, shoot, and root fresh weight in M soils reached their highest levels during days 10–20 of microbial remediation. During this period, the inhibition rates gradually decreased: total plant fresh weight inhibition decreased from 24.74% to 18.82%, stem fresh weight inhibition decreased from 23.37% to 19.40%, and root fresh weight inhibition decreased from 14.15% to 11.27%. However, the fresh weight of seedlings in M soil was consistently lower than that in C soil during this period. Inhibition rates of the dry weight of various parts of seedlings in M soils during this period also peaked. This suggests that the addition of microbial remediation agents in PAH-contaminated soil may have inhibited seed germination potential and seedling growth during the microbial remediation period of 10–20 d, possibly because the degradation rate of BaA and BaP during the initial remediation period was fast, leading to the accumulation of many intermediate and potentially highly toxic metabolites, which temporarily increased soil ecotoxicity and inhibited seedling growth [45]. Over time, levels of these toxic intermediates decreased; their inhibitory effect on seed germination potential and seedling growth diminished after 20 d. Additionally, the activities of two soil enzymes in M soils trended down from 10 to 20 d, and were lower than those in B and C soils for the same period (Figure S1). This further indicates that soil enzymes in M soils experience toxicity stress, and that the soil is highly ecotoxic, further inhibiting seed germination and seedling growth [46].
Through the negative impacts on germination and growth indicators, it was found that the ecotoxicity of PAH-contaminated soil increased during 10–20 days of microbial remediation. As shown in Figure 2c, component 1 (99.1%) accounts for 99.1% of the variance in the dataset, indicating that it captures the primary patterns that distinguish the three soil types (B, C, and M). In contrast, Component 2 explains only 0.9% of the variance, indicating its limited role in differentiating the soil types. Visually, the three types of soil are separated, indicating differences in seed germination potential and growth metrics among them. M soils differ the most from B soils, while C soils also deviate from B soils, but with less pronounced differences than between M and B soils (Figure 2c). This suggests that toxic stress in PAH-contaminated soils during remediation affected wheat growth indicators the most, and even exceeded the effects observed in PAH-contaminated soils without added microorganisms. Based on the VIP values (Figure S3), we establish the following sensitivity ranking of indicators: germination potential > plant height > root length > whole plant fresh weight > root fresh weight > stem fresh weight > whole plant dry weight > root dry weight > stem dry weight. The greater the sensitivity of an indicator is, the more useful it is for assessing ecotoxicity change during microbial remediation.

3.3. Physiological Characteristics of Wheat Planted in Soils

3.3.1. Photosynthetic Pigments and Wheat Leaf Damage

Wheat leaves from seedlings in B, C, and M soils collected between 10 and 20 d were randomly selected for histopathological observation (Figure 3a–f). The upper epidermal cells of leaves from B soils were regularly and orderly arranged, with adjacent cells closely connected and several tile-like structures positioned parallel to the main leaf veins. Compared with pathological changes in leaves from seedlings grown in C soils, damage to the epidermis in leaves from M soils was more pronounced: cells were more sparsely arranged and not parallel, which would have affected the leaf photosynthetic area and yield. Additionally, it can be seen that Chl a and Chl b contents were lower in the M soils(Figure 3g,h), which may have negatively affected the cellular photosynthetic processes. Leaves of the seedlings grown in B soils were bright-green, while those from the C and M soils appeared dark-yellow–brown. The Chl a and b contents in leaves from the seedlings grown in the B soils increased gradually over time. Compared with those in the seedlings in the B soils, the chlorophyll a and b content in the seedlings grown in M soils decreased from 10 to 20 d of microbial remediation and were lower than those in the B and C soils. Compared to those in the B soils, the inhibition rates of chlorophyll a increased from 8.96% to 28.52%, and those of chlorophyll b increased from 23.32% to 42.24%.
Peak inhibition rates of chlorophyll contents in leaves from M soils were observed on day 20, and this inhibitory effect was stronger than that for leaves grown in C soils. PAHs can enter the cytoplasm through the cell wall and affect chlorophyll synthesis, thus affecting photosynthesis, with serious toxic effects on plants [47]. In contrast, changes in CAR content in leaves grown in M soils showed no significant toxic inhibitory effects. CARs play multiple roles in photosynthesis such as light trapping and serve as key antioxidants that reduce photodamage and photoinhibition [48]. We speculate that microbial remediation may enhance soil ecotoxicity in the early stages of remediation, which could potentially reduce photosynthetic chlorophyll efficiency in the leaves. However, CAR synthesis can serve as a compensatory mechanism, enabling wheat to enhance protective mechanisms by increasing CAR synthesis. Additionally, at 40× magnification, a decrease in trichome (red arrows and circles in Figure 3d–f) density was observed on the surfaces of the leaves in M soils, and the arrangement was extremely irregular. Trichomes assist in resisting biotic and abiotic stresses, retaining water, and absorbing atmospheric water vapor and nutrients, thereby improving the efficiency of water and fertilizer utilization [49]. This observation provides further evidence of the impact of the increased ecotoxicity of PAH-contaminated soil on wheat during microbial remediation.

3.3.2. Wheat Antioxidant System

PAHs and their toxic intermediates produced by microbial degradation cause oxidative stress in plant tissues, leading to the production of reactive oxygen species (ROSs) or reactive oxygen intermediates (ROIs) such as O2, H2O2, and ·OH. These substances can cause lipid peroxidation, disrupt cell membrane structure and composition [50], and bind with biomolecules such as DNA and RNA, resulting in DNA oxidative damage [51]. This damage includes the destruction of primary and secondary DNA and RNA structures, and even leads to DNA double-strand breaks [52]. These substances can also alter protein molecular structure, weaken the repair efficiency of damaged DNA, and even induce cell apoptosis [53,54].
Antioxidant enzymes such as SOD, CAT, and POD play important roles in plant responses to oxidative stress [14]. MDA, a marker of membrane lipid peroxidation, indicates cellular damage and plant resilience [52]. Antioxidant enzyme activities and MDA content in wheat roots are illustrated in Figure 4, with supplementary data for leaves and stems presented in Supplementary Figures S4 and S5.
SOD represents the first line of defense against ROI in plant cells, catalyzing the disproportionation of superoxide anion radicals O2 into H2O2 and O2 [55]. After over 40 days of microbial remediation, the SOD activity in the roots of wheat seedlings grown in M soil initially increased and then decreased, reaching higher levels between days 10 and 20, and it was consistently higher than that in any other group (Figure 4a). Compared to B soils, the induction rates of root SOD activity increased from 17.59% on day 10 to 17.81% on day 20. This phenomenon may be attributed to the activation of SOD by PAHs and other pollutants in the soil during early exposure, which catalyzed the decomposition of superoxide anion radicals O2 into H2O2 and O2. As the microbial degradation of PAHs generated more toxic intermediates or derivatives, superoxide anion radicals (O2) accumulated and SOD activity further increased. The degradation of toxic substances in the soil from microbial remediation then reduced soil ecotoxicity, which then alleviated plant stress, and SOD activity decreased. However, the SOD activity in root tissues of wheat grown in M soils still exhibited a certain level of ecotoxicity throughout the entire microbial remediation, suggesting a need for extended remediation time.
CAT and POD can also catalyze H2O2 into H2O and O2 to counteract oxidative stress caused by PAHs [56]. Changes in CAT activity throughout microbial remediation showed a similar trend to those in SOD activity (Figure 4b). The induction rate of CAT activity in the roots of seedlings grown in M soil increased from 128.52% on day 10 to 314.67% on day 25. In contrast, during the early microbial remediation, root POD activity in seedlings grown in M soils was significantly lower than that in B soils, with an inhibition rate of 22.3%, but higher than that in C soils (inhibition rate 42.77%) (Figure 4c). Subsequently, POD activity in roots gradually increased, peaking at day 20, but it then gradually declined as soil toxicity decreased. This also suggests that wheat roots scavenge excess O2 and H2O2 induced during microbial remediation mainly by regulating the activities of antioxidant enzymes (SOD and CAT), and then POD and other non-enzymatic antioxidants.
The MDA content of wheat roots grown in M soils initially increased and then decreased, and was consistently higher than the levels in roots from plants grown in Band C soils (Figure 4d). Under PAH stress and their toxic degradation intermediates and derivatives, ROS continuously generated and accumulated within root cells, with excess free radicals attacking unsaturated fatty acids in membranes. This led to cell membrane lipid peroxidation damage and an increase in MDA levels [57]. The MDA content in roots of seedlings grown in M soils was the highest from 10 to 20 d, and then gradually decreased. This indicates that the ecotoxicity of organic contaminated soil was higher during microbial remediation, and remained at a relatively high level throughout the 40-day period. Furthermore, the POD and SOD activities in leaves and the SOD activity in stems suggest enhanced ecotoxicity between days 10 and 20 of remediation in the soil (Figures S4 and S5).

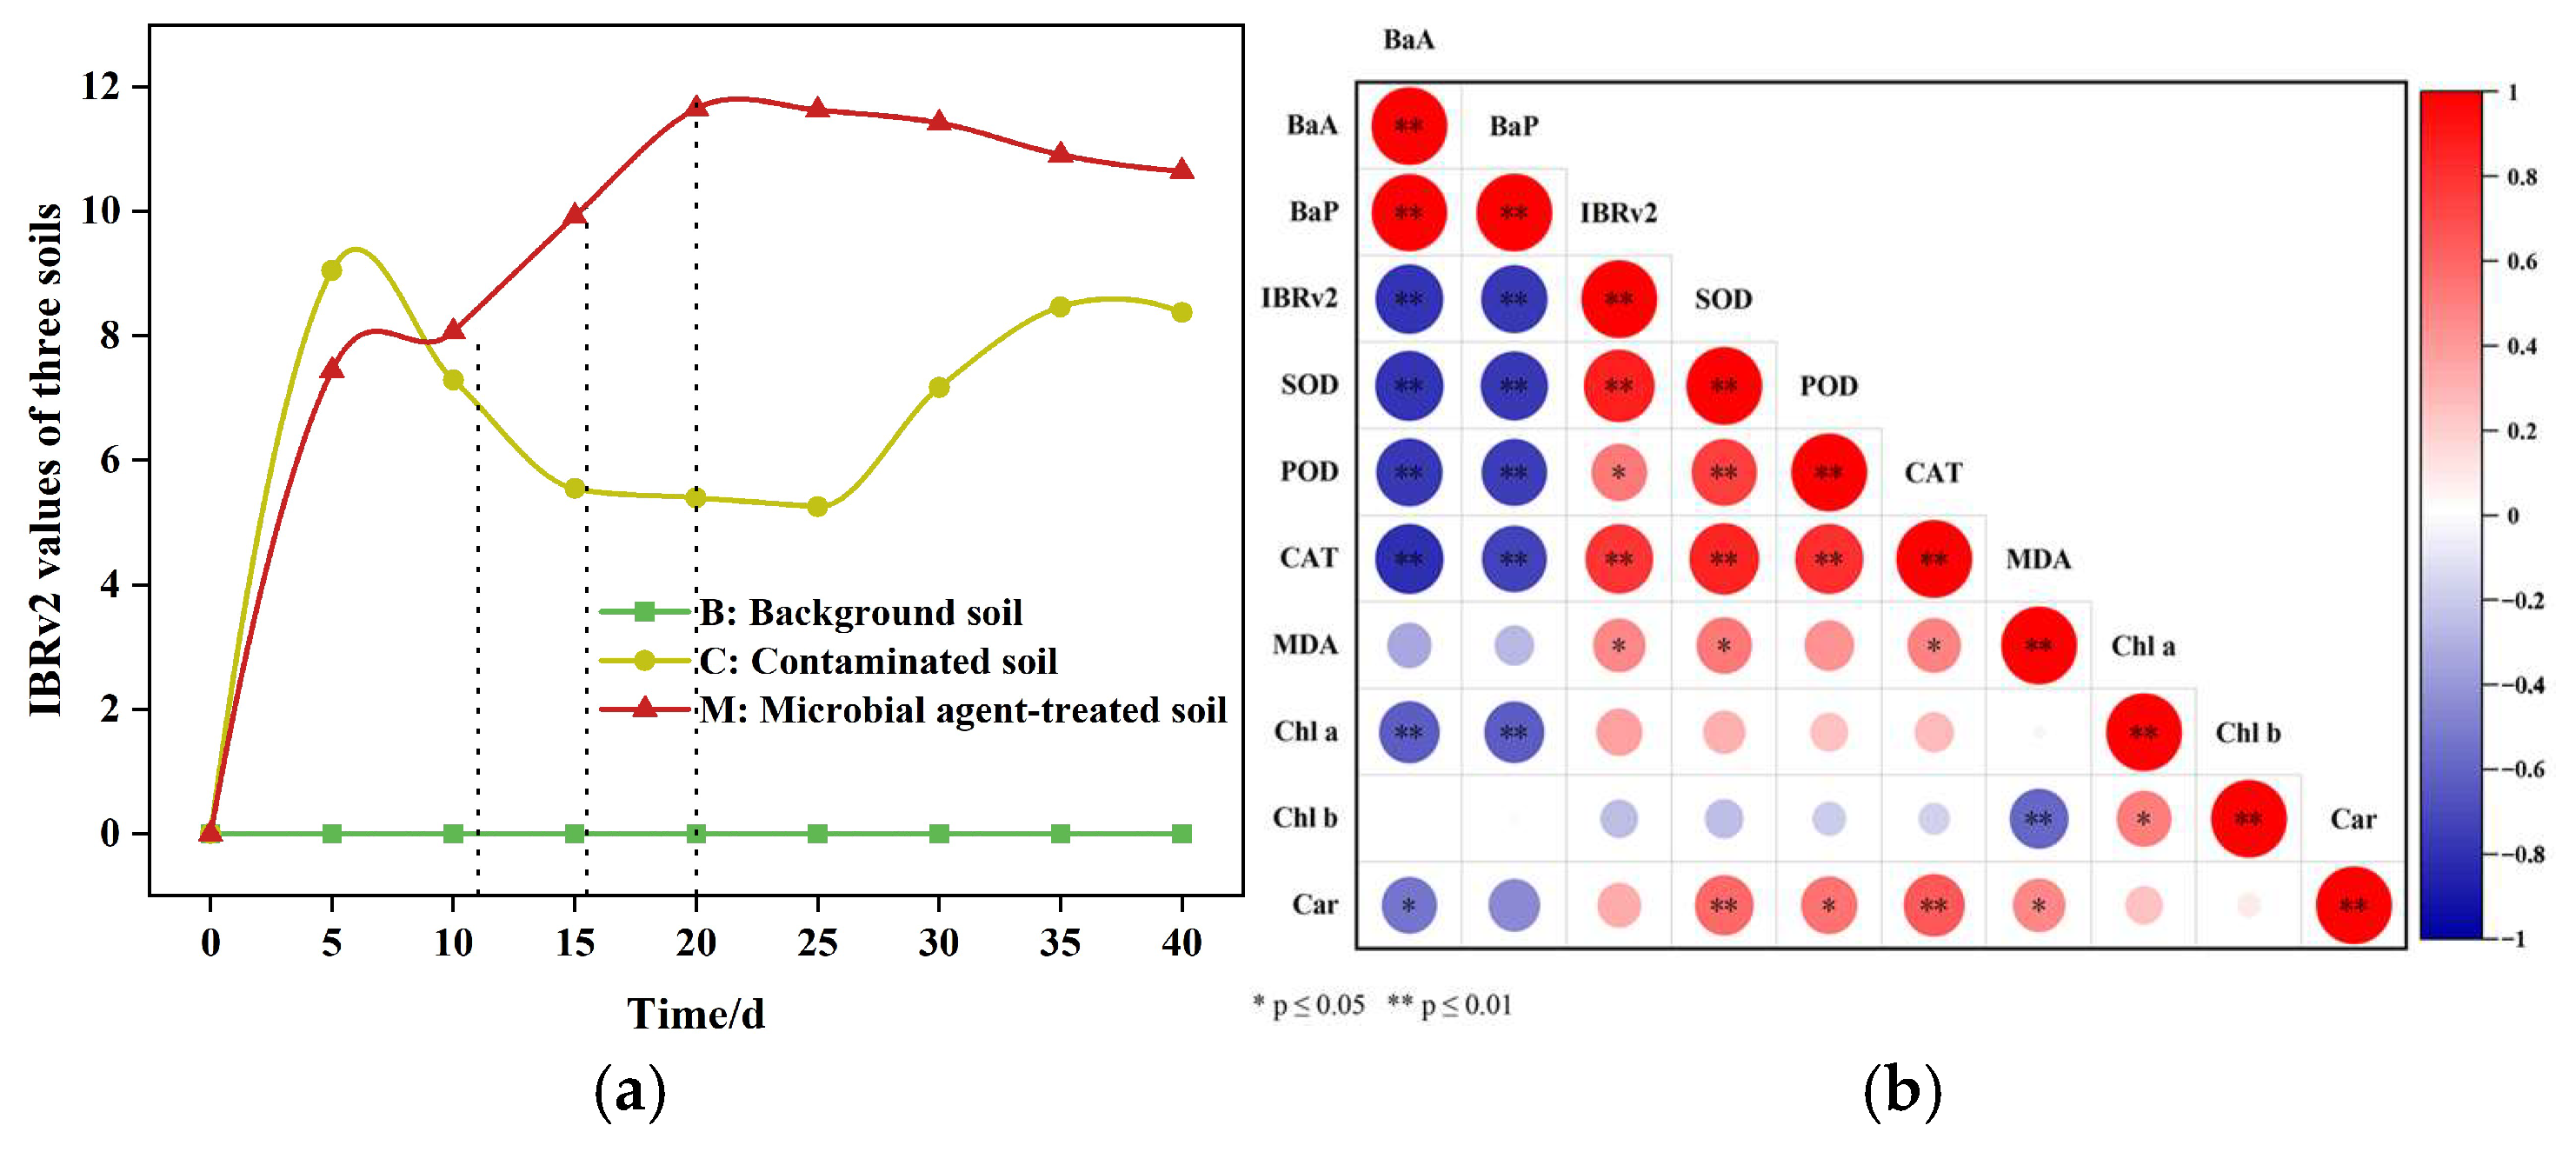
3.3.3. Evaluation of Soil Toxicity During Microbial Remediation Using the IBRv2 Index

Leaf chlorophyll contents and antioxidant enzyme activities in different tissue types indicate that soil ecotoxicity caused by microbial remediation may increase over the first 20 d before gradually decreasing, but they remain relatively high throughout the 40 d period. IBRv2 values were calculated using biomarkers (Figure 5a) to evaluate soil ecotoxicity over the 40 d remediation period. This index was then correlated with concentrations of target pollutants and various biomarker data to identify sensitive physiological indicators of changes in soil ecotoxicity during microbial remediation (Figure 5b).
As shown in Figure 5a, ecotoxicity in M soils decreased early on in the remediation process (days 5–10), and then increased, peaking on day 25, with a 53.68% rise in the IBRv2 index compared to that on day 10. Although ecotoxicity gradually decreased thereafter, it persisted at a relatively high level throughout the remediation period. We attribute this trend to the accumulation of toxic intermediates earlier in the remediation process, when PAHs rapidly degrade into highly soluble polar PAH metabolites. During this stage, microorganisms released large amounts of extracellular enzymes to degrade polycyclic aromatic hydrocarbons, resulting in the metabolism of HMW-PAHs into simpler, highly soluble organic substances [58,59], increasing their bioavailability and the soil’s ecotoxicity [23]. In the later stages of remediation, microorganisms use PAHs and their metabolites as sources of energy and carbon for growth and metabolism, leading to relatively low levels of soil ecotoxicity [38].
A significant negative correlation existed between IBRv2 values and PAH (BaA and BaP) concentrations during the 40 day microbial remediation period (p ≤ 0.01)(Figure 5b). This indicates that changes in soil ecotoxicity were not always directly related to contaminant levels, and relying solely on reducing pollutant concentrations may not be sufficient to ensure the long-term sustainable use of the repaired site. This seemingly contradictory relationship may be due to the microbial degradation of PAHs, which can generate highly toxic intermediate derivatives. While the total PAH content in the soil may decrease, these toxic intermediates and the original PAHs can be absorbed by plants through root uptake. The toxic substances then produce reactive oxygen species (ROS) through redox cycles, activating antioxidant enzymes in wheat roots. When toxicity stress exceeds a certain threshold, it leads to oxidative damage. This results in an increase in the IBRv2 index, which is calculated based on these biomarkers. Additionally, SOD and CAT activities were highly significantly correlated with the IBRv2 index (p ≤ 0.01), while POD and MDA showed significant positive correlations with IBRv2 (p ≤ 0.05). No strong correlation was found between IBRv2 values and photosynthetic pigments. Therefore, SOD and CAT activities in wheat roots could be used to indicate changes in soil ecotoxicity during microbial remediation. This further supports the conclusion that wheat roots primarily regulate the activities of antioxidant enzymes (SOD and CAT), followed by that of POD and other non-enzymatic antioxidants, to mitigate the excess O2 and H2O2 induced during the microbial remediation of organically contaminated soils.

3.4. GC-MS-Based Identification of Substances Increases Soil Ecotoxicity

GC-MS was used to analyze the temporal change in pollutant components in soil contamination following microbial remediation (Figure S6). A notable increase in the degradation of higher-molecular-weight substances was observed over the first 15 d of remediation. Remediating bacteria produced a range of new PAH-degrading metabolites, intermediates, and derivatives from 10 to 20 d (Figure S6b–d), including highly toxic cis-1,2-diacetoxy-1,2-dihydrochrysene, 2,4-di-tert-butylphenol, phthalic acid, bis(7-methyloctyl) ester, and others. Cis-1,2-diacetoxy-1,2-dihydrochrysene may be a derivative of PAH based on its structure, and was detected on day 15 of remediation. Due to its structural similarity to PAHs, it may exhibit hazardous, mutagenic, or teratogenic effects. 2,4-di-tert-butylphenol, a common toxic secondary metabolite produced by various organisms, may also serve as a toxic intermediate in the microbial degradation process of PAHs [60]; it exhibits strong toxicity to most organisms, including producers [61,62]. The compound can also inhibit the growth and reduce chlorophyll content in the freshwater green alga Chlamydomonas reinhardtii [63]. The solubility of this compound is slightly water-soluble, with higher solubility than BaA and BaP, making it more likely to be absorbed by plants and cause ecological toxicity stress. Its concentration gradually increased from day 0 to day 15, and then slightly decreased on day 20, persisting in the soil for approximately 20 days. The decrease in its concentration (Figure S6a–d) coincided with a reduction in the IBRv2 of soil ecotoxicity. Phthalic acid and bis(7-methyloctyl) ester appeared on day 15, and these are typical intermediate products in the microbial degradation process of PAHs [64] (Figure S6c); phthalic acid esters are highly toxic, and significantly inhibit plant growth and biomass [65,66,67]. Even if PAH concentrations decline, the combined toxicity of PAHs and intermediate metabolites may still sustain overall soil ecotoxicity. Song et al. [68] found that in a pyrene degradation experiment, while PAH parent compounds were partially degraded, nine intermediate metabolites (e.g., hydroxylated and carboxylated products) could not enter the TCA cycle, causing their accumulation in soil. These metabolites directly inhibited plant and microbial activity and increased the relative abundance of pathogenic microbes (e.g., Mimiviridae and Pithoviridae), further disrupting soil ecological functions. Therefore, wheat remained under toxic stress, explaining why, even though PAH levels had decreased and toxicity had somewhat reduced, the toxicity levels still remained relatively high. From day 60 (Figure S6e), previously toxic intermediates (e.g., phthalic acid and bis(7-methyloctyl) ester and Cis-1,2-diacetoxy-1,2 dihydrochrysene) disappeared, while new intermediates like phenol and 1,2-Benzenedicarboxylic acid, bis(2-methylpropyl) ester emerged. The content of these substances is relatively low and their toxicity is relatively weak [64,69,70], leading to a decreasing trend in soil ecotoxicity.

3.5. Practical Applications and Policy Recommendations

The results of this study indicate that even after the degradation of PAH, intermediate metabolites can still sustain high levels of ecotoxicity. However, current standards such as the Soil Environmental Quality Risk Control Standard for Soil Contamination of Development Land (GB 36600-2018) only focus on parent PAH concentrations. Therefore, it is recommended to include biotoxicity testing in regulatory standards to ensure successful remediation, for example using wheat seed germination potential, seedling height, root length, and SOD and CAT activity in roots as indicators to assess soil ecotoxicity during microbial remediation. Additionally, we suggest that regulatory agencies add toxicity equivalence factors (TEFs) for intermediate metabolites to establish more reasonable limits. Thus, a triple-evaluation framework of “target pollutant reduction, intermediate product monitoring, and toxicity effect assessment” needs to be established for the microbial remediation of PAH-contaminated soil.
To mitigate transient toxicity spikes during microbial remediation, the following strategy is suggested: biochar-assisted remediation; studies show that adding biochar during microbial treatment can increase soil DOC concentrations to enhance PAH biodegradation [71] and adsorb PAH intermediate metabolites (e.g., phthalates), lowering their bioavailability [72].
Gaining a better understanding of the mechanisms behind increased soil toxicity during microbial remediation will help in devising well-informed remediation strategies and conducting risk assessments for PAH-contaminated soil. This can minimize environmental harm and promote the coordinated development of ecological, social, and economic benefits in remediation projects.

4. Conclusions

Significant results were achieved for one organic-contaminated site after 40 d of microbial degradation. The concentration of the main pollutants (BaA and BaP) decreased by 70.4% and 49.9%, respectively. Residual concentrations of polycyclic aromatic hydrocarbons in soil decreased over time, with the degradation process best described by a second-order kinetic model, which can effectively predict microbial remediation processes in organic contaminated sites. However, toxicity experiments on wheat planted in organic-contaminated soil during microbial remediation revealed that the ecotoxicity of remediated soil first increased and then decreased, but remained at a relatively high level overall. Notably, toxicity was more pronounced during the earlier remediation period, manifested in the inhibition of seed germination and seedling growth, decreased chlorophyll content, and a significant increase in antioxidant enzymes. The wheat root system mainly alleviated oxidative stress caused by soil toxicity by regulating antioxidant enzyme (SOD and CAT) activities, and then POD and other non-enzyme antioxidants. Analysis using the IBRv2 confirmed that soil ecotoxicity significantly increased from 10 to 20 d of the remediation process, but then gradually decreased thereafter, and that toxicity persisted over 40 d. GC/MS revealed that early on in the remediation process, PAHs (BaA and BaP) degraded significantly to form highly toxic intermediate and incomplete decomposition products. The combined effect of these substances and pre-existing pollutants in the soil increased overall soil ecotoxicity. This highlights the importance of continuous monitoring during the remediation process to ensure that short-term toxicity increases do not cause long-term irreversible damage to soil ecosystems, which is crucial for sustainable land reuse. Additionally, indicators such as seed germination potential, seedling height, root length, and SOD and CAT activity in roots can serve as indicators to assess variations in soil ecotoxicity during the microbial remediation process, as well as the effectiveness of remediation techniques.

Supplementary Materials

The following supporting information can be downloaded at: https://www.mdpi.com/article/10.3390/su17094127/s1.

Author Contributions

Conceptualization, X.D.; methodology, X.D., W.S. and Z.C.; software, W.S.; validation, X.D.; formal analysis, X.D. and W.S.; investigation, W.S., Z.C. and X.L.; data curation, X.D.; writing—original draft preparation, W.S. and Z.C.; writing—review and editing, X.D., W.S., H.S. and F.L.; visualization, W.S. and X.L.; supervision, X.D.; project administration, X.D. All authors have read and agreed to the published version of the manuscript.

Funding

This research was funded by the National Key R & D Program of the Science and Technology of China (2020YFC1808805), the Project of Construction and Support for High-level Innovative Teams of Beijing Municipal Institutions (BPHR20220108) and the Graduate Innovation Project of Beijing University of Civil Engineering and Architecture (grant no. PG2024074).

Data Availability Statement

Data will be made available on request.

Acknowledgments

The authors gratefully acknowledge the financial supports by the National Key R & D Program of the Science and Technology of China (2020YFC1808805), the Project of Construction and Support for High-level Innovative Teams of Beijing Municipal Institutions (BPHR20220108) and the Graduate Innovation Project of Beijing University of Civil Engineering and Architecture (grant no. PG2024074). The authors also thank EditSprings (https://www.editsprings.cn, accessed on 9 April 2025) for the expert linguistic services provided.

Conflicts of Interest

The authors declare no conflicts of interest.

References

  1. Simpson, S.L.; Spadaro, D.A.; Batley, G.E.; Irvine, I.A.; Synnot, R.N. Remediation criteria for gasworks-impacted sediments: Assessing the effects of legacy hydrocarbons and more recent metal contamination. Sci. Total Environ. 2020, 737, 139725. [Google Scholar] [CrossRef] [PubMed]
  2. Jacek, G.; Rozan, A.; Desrousseaux, M.; Combroux, I. Brownfields over the years: From definition to sustainable reuse. Environ. Rev. 2021, 30, 50–60. [Google Scholar] [CrossRef]
  3. Jiao, H.; Wang, Q.; Zhao, N.; Jin, B.; Zhuang, X.; Bai, Z. Distributions and Sources of Polycyclic Aromatic Hydrocarbons (PAHs) in Soils around a Chemical Plant in Shanxi, China. Int. J. Environ. Res. Public Health 2017, 14, 1198. [Google Scholar] [CrossRef]
  4. Yang, M.; Wei, R.; Chen, W.; Yang, L.; Ni, J. Distribution patterns, toxic equivalence, and environmental risks of polycyclic aromatic hydrocarbons in different density fractions of long-term field-contaminated soils. J. Soils Sediments 2022, 23, 1370–1380. [Google Scholar] [CrossRef]
  5. Wu, C.; Li, F.; Yi, S.; Ge, F. Genetically engineered microbial remediation of soils co-contaminated by heavy metals and polycyclic aromatic hydrocarbons: Advances and ecological risk assessment. J. Environ. Manag. 2021, 296, 113185. [Google Scholar] [CrossRef] [PubMed]
  6. Davie-Martin, C.L.; Stratton, K.G.; Teeguarden, J.G.; Waters, K.M.; Simonich, S.L.M. Implications of Bioremediation of Polycyclic Aromatic Hydrocarbon-Contaminated Soils for Human Health and Cancer Risk. Environ. Sci. Technol. 2017, 51, 9458–9468. [Google Scholar] [CrossRef]
  7. Barathi, S.; Gitanjali, J.; Rathinasamy, G.; Sabapathi, N.; Aruljothi, K.N.; Lee, J.; Kandasamy, S. Recent trends in polycyclic aromatic hydrocarbons pollution distribution and counteracting bio-remediation strategies. Chemosphere 2023, 337, 139396. [Google Scholar] [CrossRef]
  8. Sui, X.; Wang, X.; Li, Y.; Ji, H. Remediation of Petroleum-Contaminated Soils with Microbial and Microbial Combined Methods: Advances, Mechanisms, and Challenges. Sustainability 2021, 13, 9267. [Google Scholar] [CrossRef]
  9. García Frutos, F.J.; Escolano, O.; García, S.; Babín, M.; Fernández, M.D. Bioventing remediation and ecotoxicity evaluation of phenanthrene-contaminated soil. J. Hazard. Mater. 2010, 183, 806–813. [Google Scholar] [CrossRef]
  10. Sleight, T.W.; Khanna, V.; Gilbertson, L.M.; Ng, C.A. Network Analysis for Prioritizing Biodegradation Metabolites of Polycyclic Aromatic Hydrocarbons. Environ. Sci. Technol. 2020, 54, 10735–10744. [Google Scholar] [CrossRef]
  11. Yang, Q.; Li, G.; Jin, N.; Zhang, D. Synergistic/antagonistic toxicity characterization and source-apportionment of heavy metals and organophosphorus pesticides by the biospectroscopy-bioreporter-coupling approach. Sci. Total Environ. 2023, 905, 167057. [Google Scholar] [CrossRef] [PubMed]
  12. Chang, J.; Fang, W.; Liang, J.; Zhang, P.; Zhang, G.; Zhang, H.; Zhang, Y.; Wang, Q. A critical review on interaction of microplastics with organic contaminants in soil and their ecological risks on soil organisms. Chemosphere 2022, 306, 135573. [Google Scholar] [CrossRef] [PubMed]
  13. Liu, S.; Wang, J.; Zhu, J.; Wang, J.; Wang, H.; Zhan, X. The joint toxicity of polyethylene microplastic and phenanthrene to wheat seedlings. Chemosphere 2021, 282, 130967. [Google Scholar] [CrossRef]
  14. Yang, H.; Zhu, Z.; Zhou, J.; Liu, J.; Chen, J.; Li, A.; Wang, C.; Zhang, C.; Dai, Y.; Jia, H. Accumulation, root-shoot translocation and phytotoxicity of substituted polycyclic aromatic hydrocarbons in wheat. Environ. Chem. Lett. 2023, 21, 2509–2517. [Google Scholar] [CrossRef]
  15. Nikolaeva, O.; Karpukhin, M.; Streletskii, R.; Rozanova, M.; Chistova, O.; Panina, N. Linking pollution of roadside soils and ecotoxicological responses of five higher plants. Ecotoxicol. Environ. Saf. 2020, 208, 111586. [Google Scholar] [CrossRef]
  16. Wang, J.; Luo, Z.; Song, Y.; Zheng, X.; Qu, L.; Qian, J.; Wu, Y.; Wu, X.; Wu, Z. Remediation of phenanthrene contaminated soil by g-C3N4/Fe3O4 composites and its phytotoxicity evaluation. Chemosphere 2019, 221, 554–562. [Google Scholar] [CrossRef]
  17. Zhao, W.; Teng, M.; Zhang, J.; Wang, K.; Zhang, J.; Xu, Y.; Wang, C. Insights into the mechanisms of organic pollutant toxicity to earthworms: Advances and perspectives. Environ. Pollut. 2022, 305, 119120. [Google Scholar] [CrossRef]
  18. Hu, J.; Adrion, A.C.; Nakamura, J.; Shea, D.; Aitken, M.D. Bioavailability of (Geno)toxic Contaminants in Polycyclic Aromatic Hydrocarbon–Contaminated Soil Before and After Biological Treatment. Environ. Eng. Sci. 2014, 31, 176–182. [Google Scholar] [CrossRef]
  19. Trine, L.S.D.; Davis, E.L.; Roper, C.; Truong, L.; Tanguay, R.L.; Simonich, S.L.M. Formation of PAH Derivatives and Increased Developmental Toxicity during Steam Enhanced Extraction Remediation of Creosote Contaminated Superfund Soil. Environ. Sci. Technol. 2019, 53, 4460–4469. [Google Scholar] [CrossRef]
  20. Zhao, S.; Li, Y.; Cao, Z.; Wang, J. Sorption-desorption mechanisms and environmental friendliness of different surfactants in enhancing remediation of soil contaminated with polycyclic aromatic hydrocarbons. J. Soils Sediments 2020, 20, 2817–2828. [Google Scholar] [CrossRef]
  21. Al-Mutairi, N.; Bufarsan, A.; Al-Rukaibi, F. Ecorisk evaluation and treatability potential of soils contaminated with petroleum hydrocarbon-based fuels. Chemosphere 2008, 74, 142–148. [Google Scholar] [CrossRef] [PubMed]
  22. Schrlau, J.E.; Kramer, A.L.; Chlebowski, A.; Truong, L.; Tanguay, R.L.; Simonich, S.L.M.; Semprini, L. Formation of Developmentally Toxic Phenanthrene Metabolite Mixtures by Mycobacterium sp. ELW1. Environ. Sci. Technol. 2017, 51, 8569–8578. [Google Scholar] [CrossRef] [PubMed]
  23. Zeng, J.; Li, Y.; Dai, Y.; Wu, Y.; Lin, X. Effects of polycyclic aromatic hydrocarbon structure on PAH mineralization and toxicity to soil microorganisms after oxidative bioremediation by laccase. Environ. Pollut. 2021, 287, 117581. [Google Scholar] [CrossRef]
  24. Hou, Y.; Li, Y.; Tao, H.; Cao, H.; Liao, X.; Liu, X. Three-dimensional distribution characteristics of multiple pollutants in the soil at a steelworks mega-site based on multi-source information. J. Hazard. Mater. 2023, 448, 130934. [Google Scholar] [CrossRef]
  25. GB 36600-2018; Soil Environmental Quality Risk Control Standard for Soil Contamination of Development Land. Ministry of Ecology and Emvironment of the People's Republic of China: Beijing, China, 2018.
  26. Qi, Y.; Yang, X.; Pelaez, A.M.; Huerta Lwanga, E.; Beriot, N.; Gertsen, H.; Garbeva, P.; Geissen, V. Macro- and micro-plastics in soil-plant system: Effects of plastic mulch film residues on wheat (Triticum aestivum) growth. Sci. Total Environ. 2018, 645, 1048–1056. [Google Scholar] [CrossRef]
  27. Zhu, M.; Wang, Q.; Sun, Y.; Zhang, J. Effects of oxygenated brackish water on germination and growth characteristics of wheat. Agric. Water Manag. 2021, 245, 106520. [Google Scholar] [CrossRef]
  28. Yuan, J.; Wang, X.; Zhou, H.; Li, Y.; Zhang, J.; Yu, S.; Wang, M.; Hao, M.; Zhao, Q.; Liu, L.; et al. Comparison of Sample Preparation Techniques for Inspection of Leaf Epidermises Using Light Microscopy and Scanning Electronic Microscopy. Front. Plant Sci. 2020, 11, 133. [Google Scholar] [CrossRef]
  29. Qiu, Z.; He, Y.; Zhang, Y.; Guo, J.; Wang, L. Characterization of miRNAs and their target genes in He-Ne laser pretreated wheat seedlings exposed to drought stress. Ecotoxicol. Environ. Saf. 2018, 164, 611–617. [Google Scholar] [CrossRef] [PubMed]
  30. Lichtenthaler, H.K. Chlorophylls and carotenoids: Pigments of photosynthetic biomembranes. In Methods in Enzymology; Academic Press: New York, USA, 1987; Volume 148, pp. 350–382. [Google Scholar]
  31. Pillay, V.; Moodley, B. Assessment of the impact of reforestation on soil, riparian sediment and river water quality based on polyaromatic hydrocarbon pollutants. J. Environ. Manag. 2022, 324, 116331. [Google Scholar] [CrossRef]
  32. Liu, Y.; Yang, H.; Li, X.; Xing, Z. Effects of biological soil crusts on soil enzyme activities in revegetated areas of the Tengger Desert, China. Appl. Soil Ecol. 2014, 80, 6–14. [Google Scholar] [CrossRef]
  33. Gao, T.; Tian, H.; Niu, H.; Wang, Z.; Dai, Y.; Megharaj, M.; He, W. Soil phosphatase assay to evaluate arsenic toxicity should be performed at the soil’s actual pH. Sci. Total Environ. 2023, 859, 160184. [Google Scholar] [CrossRef] [PubMed]
  34. Wang, D.; Yi, W.; Zhou, Y.; He, S.; Tang, L.; Yin, X.; Zhao, P.; Long, G. Intercropping and N application enhance soil dissolved organic carbon concentration with complicated chemical composition. Soil Tillage Res. 2021, 210, 104979. [Google Scholar] [CrossRef]
  35. Chen, X.; Huang, J.; Yi, M. Cost estimation for general aviation aircrafts using regression models and variable importance in projection analysis. J. Clean. Prod. 2020, 256, 120648. [Google Scholar] [CrossRef]
  36. Yao, D.; Wang, N.; Dai, W.; Liu, Y.; Tian, K.; Wang, H.; Liu, Y. Degradation of benzo [a] pyrene in the soil enhanced by soapwort: The role of soapwort and functional microbial community. J. Hazard. Mater. 2023, 485, 131993. [Google Scholar] [CrossRef] [PubMed]
  37. Zhou, X.; Jiang, Y.; Leng, G.; Ling, W.; Wang, J. The addition of Glomalin-related soil protein and functional microbial consortium increased bound PAH residue degradation in soil. Appl. Soil Ecol. 2023, 193, 105158. [Google Scholar] [CrossRef]
  38. Baran, S.; Bielińska, J.E.; Oleszczuk, P. Enzymatic activity in an airfield soil polluted with polycyclic aromatic hydrocarbons. Geoderma 2004, 118, 221–232. [Google Scholar] [CrossRef]
  39. Li, Y.; Li, W.; Ji, L.; Song, F.; Li, T.; Fu, X.; Li, Q.; Xing, Y.; Zhang, Q.; Wang, J. Effects of Salinity on the Biodegradation of Polycyclic Aromatic Hydrocarbons in Oilfield Soils Emphasizing Degradation Genes and Soil Enzymes. Front. Microbiol. 2022, 12, 824319. [Google Scholar] [CrossRef]
  40. Cruz-Paredes, C.; Tájmel, D.; Rousk, J. Can moisture affect temperature dependences of microbial growth and respiration? Soil Biol. Biochem. 2021, 156, 108223. [Google Scholar] [CrossRef]
  41. Gonzalez, J.M.; Aranda, B. Microbial Growth under Limiting Conditions-Future Perspectives. Microorganisms 2023, 11, 1641. [Google Scholar] [CrossRef]
  42. Chai, X.; Wang, M.; Fu, X.; Zhang, W.; Huang, Y.; Germaine, K.J.; Wang, J. Shift of combined ecotoxicity index in petroleum polluted soils during a bacterial remediation. Front. Environ. Sci. 2023, 11, 1141562. [Google Scholar] [CrossRef]
  43. Gao, Y.; Zhu, L. Plant uptake, accumulation and translocation of phenanthrene and pyrene in soils. Chemosphere 2004, 55, 1169–1178. [Google Scholar] [CrossRef]
  44. Rodrigues, A.E.; Silva, C.M. What’s wrong with Lagergreen pseudo first order model for adsorption kinetics? Chem. Eng. J. 2016, 306, 1138–1142. [Google Scholar] [CrossRef]
  45. Bandowe, B.A.M.; Wilcke, W. Analysis of polycyclic aromatic hydrocarbons and their oxygen-containing derivatives and metabolites in soils. J. Environ. Qual. 2010, 39, 1349–1358. [Google Scholar] [CrossRef]
  46. Song, X.; Li, C.; Chen, W. Phytoremediation potential of Bermuda grass (Cynodon dactylon (L.) pers.) in soils co-contaminated with polycyclic aromatic hydrocarbons and cadmium. Ecotoxicol. Environ. Saf. 2022, 234, 113389. [Google Scholar] [CrossRef] [PubMed]
  47. Płaza, G.A.; Nałecz-Jawecki, G.; Pinyakong, O.; Illmer, P.; Margesin, R. Ecotoxicological and microbiological characterization of soils from heavy-metal- and hydrocarbon-contaminated sites. Environ. Monit. Assess. 2009, 163, 477–488. [Google Scholar] [CrossRef]
  48. Simkin, A.J.; Kapoor, L.; Doss, C.G.P.; Hofmann, T.A.; Lawson, T.; Ramamoorthy, S. The role of photosynthesis related pigments in light harvesting, photoprotection and enhancement of photosynthetic yield in planta. Photosynth. Res. 2022, 152, 23–42. [Google Scholar] [CrossRef] [PubMed]
  49. Riederer, M.; Schreiber, L. Protecting against water loss: Analysis of the barrier properties of plant cuticles. J. Exp. Bot. 2001, 52, 2023–2032. [Google Scholar] [CrossRef]
  50. Yu, H.; Xia, Q.; Yan, J.; Herreno-Saenz, D.; Wu, Y.-S.; Tang, I.W.; Fu, P.P. Photoirradiation of polycyclic aromatic hydrocarbons with UVA light—A pathway leading to the generation of reactive oxygen species, lipid peroxidation, and dna damage. Int. J. Environ. Res. Public Health 2006, 3, 348–354. [Google Scholar] [CrossRef]
  51. Toyooka, T.; Ibuki, Y. New method for testing phototoxicity of polycyclic aromatic hydrocarbons. Environ. Sci. Technol. 2006, 40, 3603–3608. [Google Scholar] [CrossRef]
  52. Guha, S.; Bhaumik, S.R. Transcription-coupled DNA double-strand break repair. DNA Repair 2021, 109, 103211. [Google Scholar] [CrossRef]
  53. Xue, W.; Warshawsky, D. Metabolic activation of polycyclic and heterocyclic aromatic hydrocarbons and DNA damage: A review. Toxicol. Appl. Pharmacol. 2005, 206, 73–93. [Google Scholar] [CrossRef]
  54. Krishnamurthi, K.; Devi, S.S.; Chakrabarti, T. The Genotoxicity of Priority Polycyclic Aromatic Hydrocarbons (PAHs) Containing Sludge Samples. Toxicol. Mech. Methods 2007, 17, 1–12. [Google Scholar] [CrossRef]
  55. Song, Y.; Zhang, F.; Li, H.; Qiu, B.; Gao, Y.; Cui, D.; Yang, Z. Antioxidant defense system in lettuces tissues upon various As species exposure. J. Hazard. Mater. 2020, 399, 123003. [Google Scholar] [CrossRef]
  56. Dvořák, P.; Krasylenko, Y.; Zeiner, A.; Šamaj, J.; Takáč, T. Signaling Toward Reactive Oxygen Species-Scavenging Enzymes in Plants. Front. Plant Sci. 2020, 11, 618835. [Google Scholar] [CrossRef]
  57. Yalcinkaya, T.; Uzilday, B.; Ozgur, R.; Turkan, I.; Mano, J.I. Lipid peroxidation-derived reactive carbonyl species (RCS): Their interaction with ROS and cellular redox during environmental stresses. Environ. Exp. Bot. 2019, 165, 139–149. [Google Scholar] [CrossRef]
  58. Ortega-Calvo, J.J.; Tejeda-Agredano, M.C.; Jimenez-Sanchez, C.; Congiu, E.; Sungthong, R.; Niqui-Arroyo, J.L.; Cantos, M. Is it possible to increase bioavailability but not environmental risk of PAHs in bioremediation? J. Hazard. Mater. 2013, 261, 733–745. [Google Scholar] [CrossRef]
  59. Liu, J.; Zhang, Z.; Sheng, Y.; Gao, Y.; Zhao, Z. Phenanthrene-degrading bacteria on root surfaces: A natural defense that protects plants from phenanthrene contamination. Plant Soil 2018, 425, 335–350. [Google Scholar] [CrossRef]
  60. Manasa, M.; Kavitha, R.; Kumar, P.S.; Pooja, M.; Revathy, R.; Gayathri, K.V. Performance evaluation and mechanism analysis of halotolerant bacterial strains and cerium oxide nanoparticle to degrade Benzo[a]pyrene. Environ. Technol. Innov. 2021, 24, 101980. [Google Scholar] [CrossRef]
  61. Zhao, F.; Wang, P.; Lucardi, R.D.; Su, Z.; Li, S. Natural Sources and Bioactivities of 2,4-Di-Tert-Butylphenol and Its Analogs. Toxins 2020, 12, 35. [Google Scholar] [CrossRef]
  62. Yang, Y.; Yan, C.; Li, A.; Qiu, J.; Yan, W.; Dang, H. Effects of the plastic additive 2,4-di-tert-butylphenol on intestinal microbiota of zebrafish. J. Hazard. Mater. 2024, 469, 133987. [Google Scholar] [CrossRef]
  63. Wang, J.; Wang, J.; Liu, J.; Li, J.; Zhou, L.; Zhang, H.; Sun, J.; Zhuang, S. The evaluation of endocrine disrupting effects of tert-butylphenols towards estrogenic receptor α, androgen receptor and thyroid hormone receptor β and aquatic toxicities towards freshwater organisms. Environ. Pollut. 2018, 240, 396–402. [Google Scholar] [CrossRef] [PubMed]
  64. Kasai, D.; Iwasaki, T.; Nagai, K.; Araki, N.; Nishi, T.; Fukuda, M. 2,3-Dihydroxybenzoate meta-Cleavage Pathway is Involved in o-Phthalate Utilization in Pseudomonas sp. strain PTH10. Sci. Rep. 2019, 9, 1253. [Google Scholar] [CrossRef]
  65. Sun, H.; Lei, C.; Yuan, Y.; Xu, J.; Han, M. Nanoplastic impacts on the foliar uptake, metabolism and phytotoxicity of phthalate esters in corn (Zea mays L.) plants. Chemosphere 2022, 304, 135309. [Google Scholar] [CrossRef]
  66. Gao, M.; Dong, Y.; Zhang, Z.; Song, W.; Qi, Y. Growth and antioxidant defense responses of wheat seedlings to di-n-butyl phthalate and di (2-ethylhexyl) phthalate stress. Chemosphere 2017, 172, 418–428. [Google Scholar] [CrossRef] [PubMed]
  67. Huang, L.; Zhu, X.; Zhou, S.; Cheng, Z.; Shi, K.; Zhang, C.; Shao, H. Phthalic Acid Esters: Natural Sources and Biological Activities. Toxins 2021, 13, 495. [Google Scholar] [CrossRef]
  68. Song, Q.; Li, X.; Zhao, Z.; Li, D.; Li, Y.; Hou, N. Insights into ecotoxicity effects of PAHs and ecosystem responses of remediation strategies under cold stress: From PAHs degradation to ecological restoration regulated by signal molecular. Chem. Eng. J. 2023, 475, 146042. [Google Scholar] [CrossRef]
  69. Liu, B.; Chen, B.; Zhang, B.; Song, X.; Zeng, G.; Lee, K. Photocatalytic ozonation of offshore produced water by TiO2 nanotube arrays coupled with UV-LED irradiation. J. Hazard. Mater. 2021, 402, 123456. [Google Scholar] [CrossRef]
  70. Rabhi, L.; Cherifi, N.; Cecinato, A.; Lemou, A.; Balducci, C.; Romagnoli, P.; Ladji, R.; Yassaa, N. Concentration levels of anthropogenic organic compounds in suspended particulates matter and indoor settled from Algiers, Algeria. Atmos. Pollut. Res. 2024, 15, 102051. [Google Scholar] [CrossRef]
  71. Bao, H.; Wang, J.; Zhang, H.; Li, J.; Li, H.; Wu, F. Effects of biochar and organic substrates on biodegradation of polycyclic aromatic hydrocarbons and microbial community structure in PAHs-contaminated soils. J. Hazard. Mater. 2019, 385, 121595. [Google Scholar] [CrossRef]
  72. He, L.; Fan, S.; Müller, K.; Hu, G.; Huang, H.; Zhang, X.; Lin, X.; Che, L.; Wang, H. Biochar reduces the bioavailability of di-(2-ethylhexyl) phthalate in soil. Chemosphere 2016, 142, 24–27. [Google Scholar] [CrossRef]
Figure 1. Concentrations of BaA and BaP during microbial remediation: (a,b) are results of fitting residual BaA (benzo[a]anthracene) and BaP (benzo[a]pyrene) contents in soils at different periods of remediation using a first-order kinetic model, and (c,d) are fitting results using a second-order kinetic model. “Screening values for Category I construction land” refers to the screening values for Category I construction land, as specified in the Chinese national standard “Risk Control Standard for Soil Contamination of Construction Land” (GB 36600-2018).
Sustainability 17 04127 g001
Figure 2. Wheat seed germination potential (a), plant height and root length (b), and PLS-DA (partial least squares discriminant analysis) of the impact of soil ecotoxicity on wheat germination and growth parameters (c) for three soil types. Error bars in the figure represent the standard deviation (SD; n = 3). The red five-pointed star represents the stage with the highest inhibition rate.
Sustainability 17 04127 g002
Figure 3. Upper surfaces of wheat leaves at (ac) 10× magnification, and (df) 40× magnification (t, trichome); (gi) changes in chlorophyll a (g), chlorophyll b (h), and carotenoid (i) contents during microbial remediation. Error bars in the figure represent standard deviation (SD; n = 3).
Sustainability 17 04127 g003aSustainability 17 04127 g003b
Figure 4. Antioxidant enzyme activities in wheat roots throughout microbial remediation. (a) SOD: superoxide dismutase; (b) CAT: catalase; (c) POD: peroxidase; (d) MDA: malondialdehyde. Error bars in the figure represent the standard deviation (SD; n = 3). The red five-pointed star represents the stage with the highest induction rate.
Sustainability 17 04127 g004
Figure 5. (a) Changes in soil ecotoxicity during microbial remediation; (b) Pearson correlation analysis of the IBRv2 (Integrated Biomarker Response version 2) index with the target pollutant content and physiological indicators.
Sustainability 17 04127 g005
Table 1. Soil physical and chemical properties. TN: total nitrogen; TP: total phosphorus; TK: total potassium; CEC: cation exchange capacity.
Soil TypeTN
(G·KG−1)
TP
(G·KG−1)
TK
(G·KG−1)
CEC
[CMOL(+)·KG−1]
Particle-Size (mm) Distribution/%
<0.0020.002–0.020.02–2
BACKGROUND SOIL (B)0.571.2717.248.200.3799.630
CONTAMINATED SOIL (C)0.551.3720.074.510.1199.370.52
Disclaimer/Publisher’s Note: The statements, opinions and data contained in all publications are solely those of the individual author(s) and contributor(s) and not of MDPI and/or the editor(s). MDPI and/or the editor(s) disclaim responsibility for any injury to people or property resulting from any ideas, methods, instructions or products referred to in the content.

