Article

Analytic Hierarchy Process-Based Industrial Heritage Value Evaluation Method and Reuse Research in Shaanxi Province—A Case Study of Shaanxi Steel Factory

Department of Architecture, University of Strathclyde, Glasgow G1 1XQ, UK
*
Author to whom correspondence should be addressed.
Sustainability 2025, 17(9), 4125; https://doi.org/10.3390/su17094125
Submission received: 2 March 2025 / Revised: 6 April 2025 / Accepted: 29 April 2025 / Published: 2 May 2025

Abstract

:
Industrial heritage is relevant to social, cultural, scientific, technological, and architectural aspects, revealing the lifestyles of people, recording technological advances, and perpetuating cultures. However, with the renewal of cities, a large amount of industrial heritage has been abandoned. To avoid the waste of industrial heritage resources, a reasonable and accurate value evaluation of it is a prerequisite for its protection and reuse. Therefore, based on the perspective of value evaluation, this paper presents qualitative and quantitative research through a literature review and field research, combined with the Analytic Hierarchy Process (AHP). This study summarises industrial heritage value evaluation factors in Shaanxi and establishes a method for industrial heritage value evaluation. After considering factors such as industrial type, year, development process, surrounding environment, and remains, this study selected the industrial heritage of Shaanxi Steel Factory built in Xi’an in 1965 as a sample in order to verify the feasibility of the evaluation method, to provide theoretical guidance for subsequent conservation and reuse, and to serve as a reference for realising urban regeneration. The findings evidenced that the presented evaluation methodology is valid in evaluating the value of industrial heritage and that the AHP method is reliable in confirming the weights of the evaluation indicators. This study establishes an evaluation methodology for the value of industrial heritage, and studies on multiple criteria provide a series of auxiliary methods that reduce the uncertainty of evaluation and provide a new methodology for confirming the level of heritage protection.

1. Introduction

Since the Industrial Revolution in the mid-18th century, industrial civilisation has progressed rapidly, with industrial buildings springing up in major cities around the world and becoming an important part of the urban landscape [1,2]. These industrial sites not only witness technological progress and social development but also contain abundant historical and cultural values [2,3]. However, with the global economy changing from industrialisation to informationisation, many traditional industrial sites are gradually declining [2]. Their building structures, equipment, and landscape environment are increasingly outdated [2]. Moreover, problems of environmental pollution, resource waste, and unused space have surfaced [2]. Industrial buildings have a high potential for preservation or reuse due to their large span and space [4]. However, many industrial heritages have been left unused, have been demolished, or have even completely disappeared due to the lack of a scientific and reasonable value perception and evaluation system [4,5,6]. The question of how to rationally protect and reuse these industrial heritages has become an important issue in promoting sustainable urban development [5,7,8,9].
After the Sixth Wuxi Forum on the Protection of China’s Cultural Heritage in 2006 and the Third National Cultural Relics Census of the State Council in 2007, industrial heritage preservation and regeneration has become a research hotspot [8]. Cano-Sanchiz and Wang’s [10] study indicated that an important task in the conservation and utilisation of industrial heritage is to recognise its value, and they explored the technical value of mining heritage. Xie’s [11] and Yang’s [12] studies mentioned that simply transforming a heritage site into a tourist attraction and ignoring a comprehensive evaluation of industrial heritage value leads to the loss of cultural, historical, and social value. In other words, only after a comprehensive evaluation of industrial heritage value—including historical, technological, social, and multifaceted aspects—can such heritage be appropriately identified for conservation and adaptive reuse efforts [12,13,14,15]. According to analysis of the literature, it is found that current research on the identification criteria of the value of industrial heritage is still unclear. Therefore, there is an urgent need for a methodology to identify the value of industrial heritage and thus guide its preservation and reuse.
The Shaanxi region in China has developed a rich and unique type of industrial architecture due to its vast territory and abundant resources [16,17]. However, compared with the flourishing protection of industrial heritage in economically developed regions, the protection of industrial heritage in Shaanxi is relatively lagging [18]. At present, research on the value evaluation of urban industrial heritage in Shaanxi is mainly based on qualitative evaluation [16]; a systematic and complete value evaluation system has not been established, and value evaluation is not strongly targeted [18]. Therefore, it is necessary to research the value of industrial heritage in Shaanxi comprehensively in order to solve the problem of insufficient theoretical research on the evaluation of the value of industrial heritage.
In terms of evaluation methods, although the Analytic Hierarchy Process (AHP) has been less often used in the evaluation of industrial heritage, it has been effective in the evaluation of historic architectural heritage; for example, the studies of Mushtaha et al. [19] and Ribera et al. [20] have shown that a well-quantified evaluation system of historic buildings has been constructed by using the AHP, and the weighting table of the heritage value indexes obtained is highly scientific. Morano et al. [21] assessed the value of cultural heritage through the AHP and suggested that this method is particularly suitable for comparing and selecting project scenarios that are described using a variety of independent criteria that are often in conflict with each other. This is highly referential and significant for this paper in constructing a methodology for evaluating the value of industrial heritage.
This paper aims to construct a set of scientific, intuitive, and operable industrial heritage value evaluation systems to promote the reasonable protection and reuse of industrial heritage. Specifically, the research objectives include the following: (1) explore the scientific methods applicable to the evaluation of industrial heritage value, to make it intuitive and operable; (2) explore the diverse values of Shaanxi’s industrial heritage and establish an evaluation system; (3) quantify the importance of different values and present the weights of each value factor by number; and (4) verify the feasibility and applicability of the constructed evaluation system through actual case studies.
To achieve the goal, this paper adopts the AHP method to construct the assessment framework and combines it with the Delphi method to screen the value factors to enhance scientificity and persuasiveness. Using the AHP method of calculation, the multifaceted value of industrial heritage is quantified in order to visually present the importance scores of the values. Finally, Shaanxi Steel Factory is used as a case study to verify the applicability and effectiveness of the system.
This paper is divided into seven sections. The first is the introduction. The second is the literature review, reviewing the value classification and evaluation methods of industrial heritage and indicating the reasons for choosing the AHP method. The third part outlines the research methodology, focusing on the application of the AHP method. The fourth part demonstrates the construction process of the evaluation system. The fifth part presents a case application study of the methodology. The sixth part is a discussion of the results, analysing the applicability and limitations of the evaluation system. Finally, the seventh part is the conclusion, which summarises the main findings, theoretical contributions, and practical significance of this paper, and proposes future research directions.

2. Literature Review

With the development and progress of society, people’s understanding of industrial heritage is improving, and the theoretical research related to the evaluation of industrial heritage by scholars is also developing and changing. The studies related to the evaluation methods of industrial heritage can mainly be divided into the policies and systems related to the recognition of industrial heritage value and the studies of existing evaluation methods [9,22,23]. This section analyses the relevant studies and evaluation systems about industrial heritage, summarises and outlines the main issues, and provides a theoretical basis for the evaluation of industrial heritage value in Shaanxi.

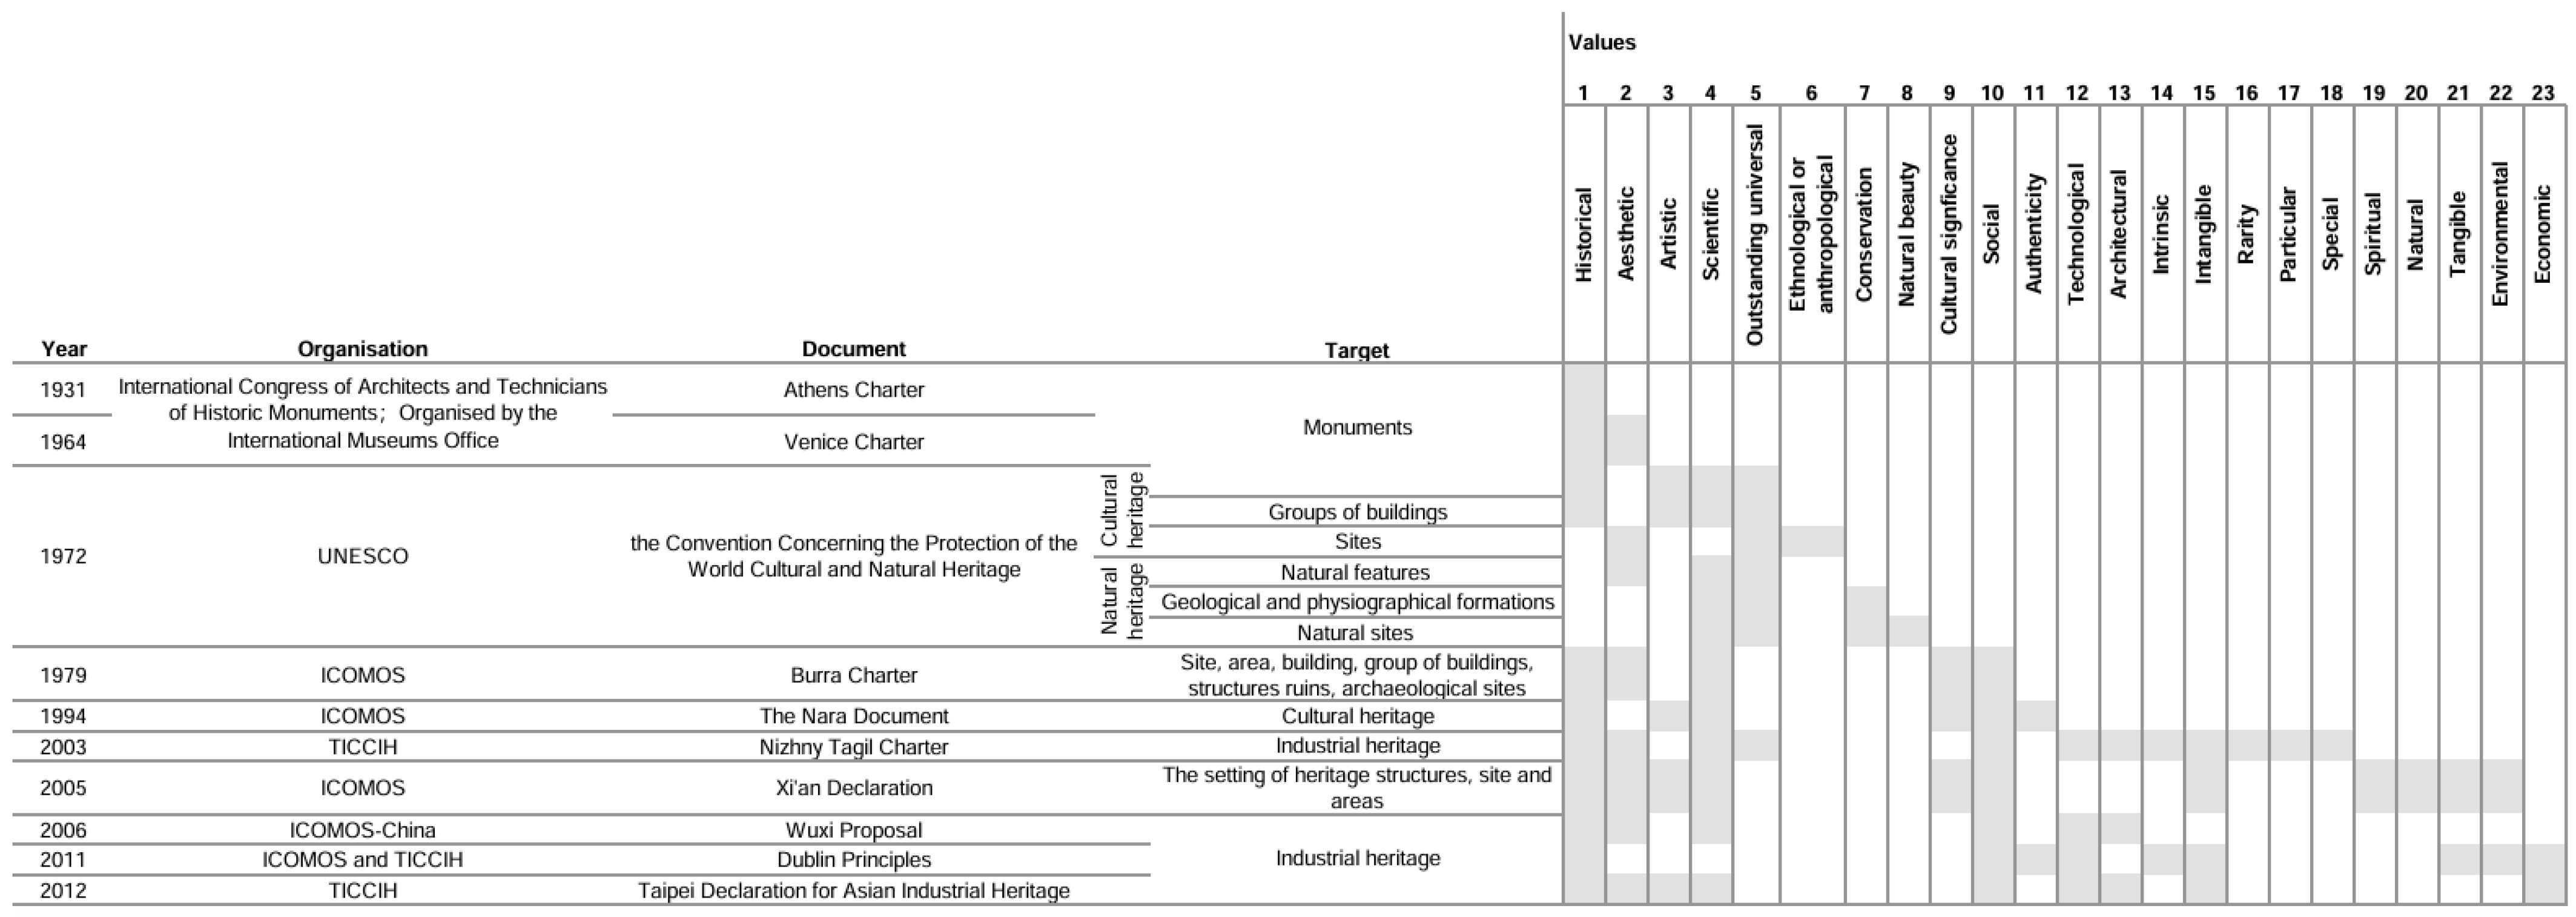
2.1. Identification of Industrial Heritage Values

The core work of industrial heritage protection is the identification of values [13,22]. To effectively and rationally understand and protect heritage, international organisations such as the UNESCO World Heritage Centre and ICOMOS, organisations dedicated to the protection of the world’s monuments and sites, developed charters and principles (Figure 1). Concerning the specific elements of evaluation, the emphasis has evolved from the value of heritage itself to its social, cultural, and intangible values. The Athens Charter, adopted at the First International Congress of Architects and Technicians of Historic Monuments in 1931, focuses on the historical value of historic monuments [24]. It was the first official document accepted by an international government for the protection of cultural heritage, signalling the beginning of an international consensus on the protection of cultural heritage [24].
Aesthetic values were added to the Venice Charter in 1964 [25,26]. In 1972, the Convention Concerning the Protection of the World Cultural and Natural Heritage added historical, artistic, scientific, aesthetic, and ethnographic or anthropological values [27]. The Convention emphasises outstanding universal value, which means that cultural and natural heritage has significance for all humankind beyond national boundaries, cultures, or times [27]. They form the common spiritual and material wealth of mankind and need to be protected and shared [27]. Cultural significance and social values are highlighted in the Burra Charter [28]. The NARA document on authenticity, adopted in 1994, emphasises the consideration of the authenticity of artistic, historical, social, and scientific sources of value [29].
In July 2003, TICCIH adopted the Nizhny Tagil Charter for the Industrial Heritage, which defines industrial heritage as the remains of the industrial culture of historical, technological, social, architectural, or scientific value [30,31,32]. The Charter states that industrial heritage not only has universal and social values but may also have technical and scientific, as well as aesthetic, values [32]. In addition to these intrinsic values, the Charter indicates that intangible values such as memory and customs should also be taken into consideration [32]. More than that, the Charter points out that industrial heritage has a rarity value [32]. The particular value of particular site types needs to be carefully assessed. Pioneering heritage has a special value [32]. The Nizhny Tagil Charter, based on the Venice Charter, is the first international standard for the identification and protection of industrial heritage.
ICOMOS adopted the Xi’an Declaration on the Conservation of the Setting of Heritage Structures, Sites and Areas (Xi’an Declaration) in 2005, raising the importance of the environment for heritage and monuments to a new level [33]. By extending the protection of cultural heritage to social or spiritual practices, customs, and traditional knowledge, the Declaration also increased the emphasis on the environment and intangible cultural heritage [33].
In 2006, ICOMOS China published the Wuxi Proposal—Focusing on the Protection of Industrial Heritage in a Period of Rapid Economic Development [34]. This is the first document on industrial heritage in China. The Wuxi Proposal defines industrial heritage and affirms the value it has [34]. The Proposal states that industrial heritage has historical, social, architectural, scientific, technological, and aesthetic values [34]. This was the earliest definition of the concept and categorisation of the value of industrial heritage in China, laying the foundation for subsequent research. ICOMOS adopted the Dublin Principles in 2011, which stressed the intangible values of industrial heritage [35]. They also state that the study and documentation of industrial heritage sites and structures must consider their historical, technological and social and economic values [35].
In 2012, TICCIH adopted the Taipei Declaration for Asian Industrial Heritage [36]. The Declaration proposes that the definition of Asian industrial heritage should be expanded to include pre-Industrial Revolution and post-Industrial Revolution technologies, machines and production facilities, architectural structures, and the built environment [28,33]. The Declaration emphasises the integrity of industrial heritage conservation, which means that not only the heritage itself should be preserved but also intangible resources such as operational techniques and related archives [36].
Moreover, besides the relevant documents and chapters that provide definitions and value statements for industrial heritage, many scholars have also studied the value of industrial heritage. Loures [37] analysed and presented the value and significance of industrial heritage from the perspective of cultural heritage, suggesting that industrial heritage has environmental, cultural, and social values. He also proposes firstly determining the intrinsic value of heritage, highlighting the importance of industrial heritage [37]. Some studies point out that the industrial heritage landscape is gradually changing and needs to be preserved dynamically [38,39,40], which provides a new perspective for the renewal of industrial heritage. Liu et al. [9] argue that industrial heritage valuation presents a complex interdisciplinary challenge, encompassing architectural, technological, cultural, and historical aspects. They applied fuzzy theory to construct an evaluation method for industrial heritage from the perspective of historical, artistic, technological, and socio-economic values [9].
Nocca et al. [41] show that to evaluate the impacts of adaptive reuse of industrial heritage, it is necessary to consider both tangible and intangible values of industrial heritage. Some other researchers believe that industrial heritage is closely connected with politics, economy, and culture and records social development [31,42,43,44]. Industrial buildings are the crystallisation of human civilisation and have high conservation value [13,39,45,46,47]. Wang and Wang [48] point out that in the process of industrial heritage conservation and utilisation, attention needs to be paid to its cultural heritage and humanistic care so that it can play a greater role in urban development and people’s lives.
International charters, documents, and scholarly research on the evaluation of the value of industrial heritage have systematically discussed the value of industrial heritage, which mainly includes historical, social, artistic, cultural, economic, and scientific and technological values, among which historical value is in a priority position [7,13,49]. Nowadays, with the deepening of research on industrial heritage, in addition to the recognised major categories of value, environmental value, economic reuse value, and so on are also gradually being paid attention to [50,51,52].
Through the interpretation of the documents related to industrial heritage, it is found that they all explain what value is contained in industrial heritage, and they all believe that industrial heritage has value and significance [13,18,25,27,28,29,30,31,33,35,36,38,49,53,54,55,56], but, in general, classification of the determination of the value of industrial heritage is scattered and fragmented, with different focuses, and does not form a unified system. Therefore, it is very important for the public to be able to clearly see the value of industrial heritage. In addition, regarding the value evaluation of heritage, scholars have made extensive explorations, generally involving both qualitative and quantitative methods [9,16,18,19], but an accurate evaluation method for the value of industrial heritage has not yet been established [9,13,22]. Researchers have mainly analysed the intrinsic value and reuse value of industrial heritage from the perspectives of history, art, culture, science, and technology, and they have emphasised the importance of its renovation and renewal by assessing the state of industrial heritage [13,23,41]. However, it is necessary to find a specific and appropriate methodology to analyse the value of industrial heritage in terms of what is of value and how it needs to be preserved.
Shaanxi Province, located in the northwest of China, is a major cultural and heritage region abundant in industrial heritage [18,57]. Notably, it played a significant role during the Third Line Construction Period—a strategic preparatory project initiated in 1964 that focused on defence science, technology, and infrastructure [18,22]. However, systematic research on the characteristics and value recognition of industrial heritage resources remains insufficient. To fully reveal the values and constituent elements of industrial heritage and thus provide a useful complement to existing conservation methods, targeted and in-depth research is urgently needed.
Combined with the previous research on the interpretation of the value composition system of industrial heritage, this study establishes the value evaluation system of Shaanxi industrial heritage according to the characteristics of Shaanxi Province, China. The purpose is to solve the problems of determining the weight of factors and identifying the protection level in the industrial heritage assessment system. This could provide a basic reference for the subsequent protection of industrial heritage.

2.2. Methods of Research on the Evaluation of Industrial Heritage
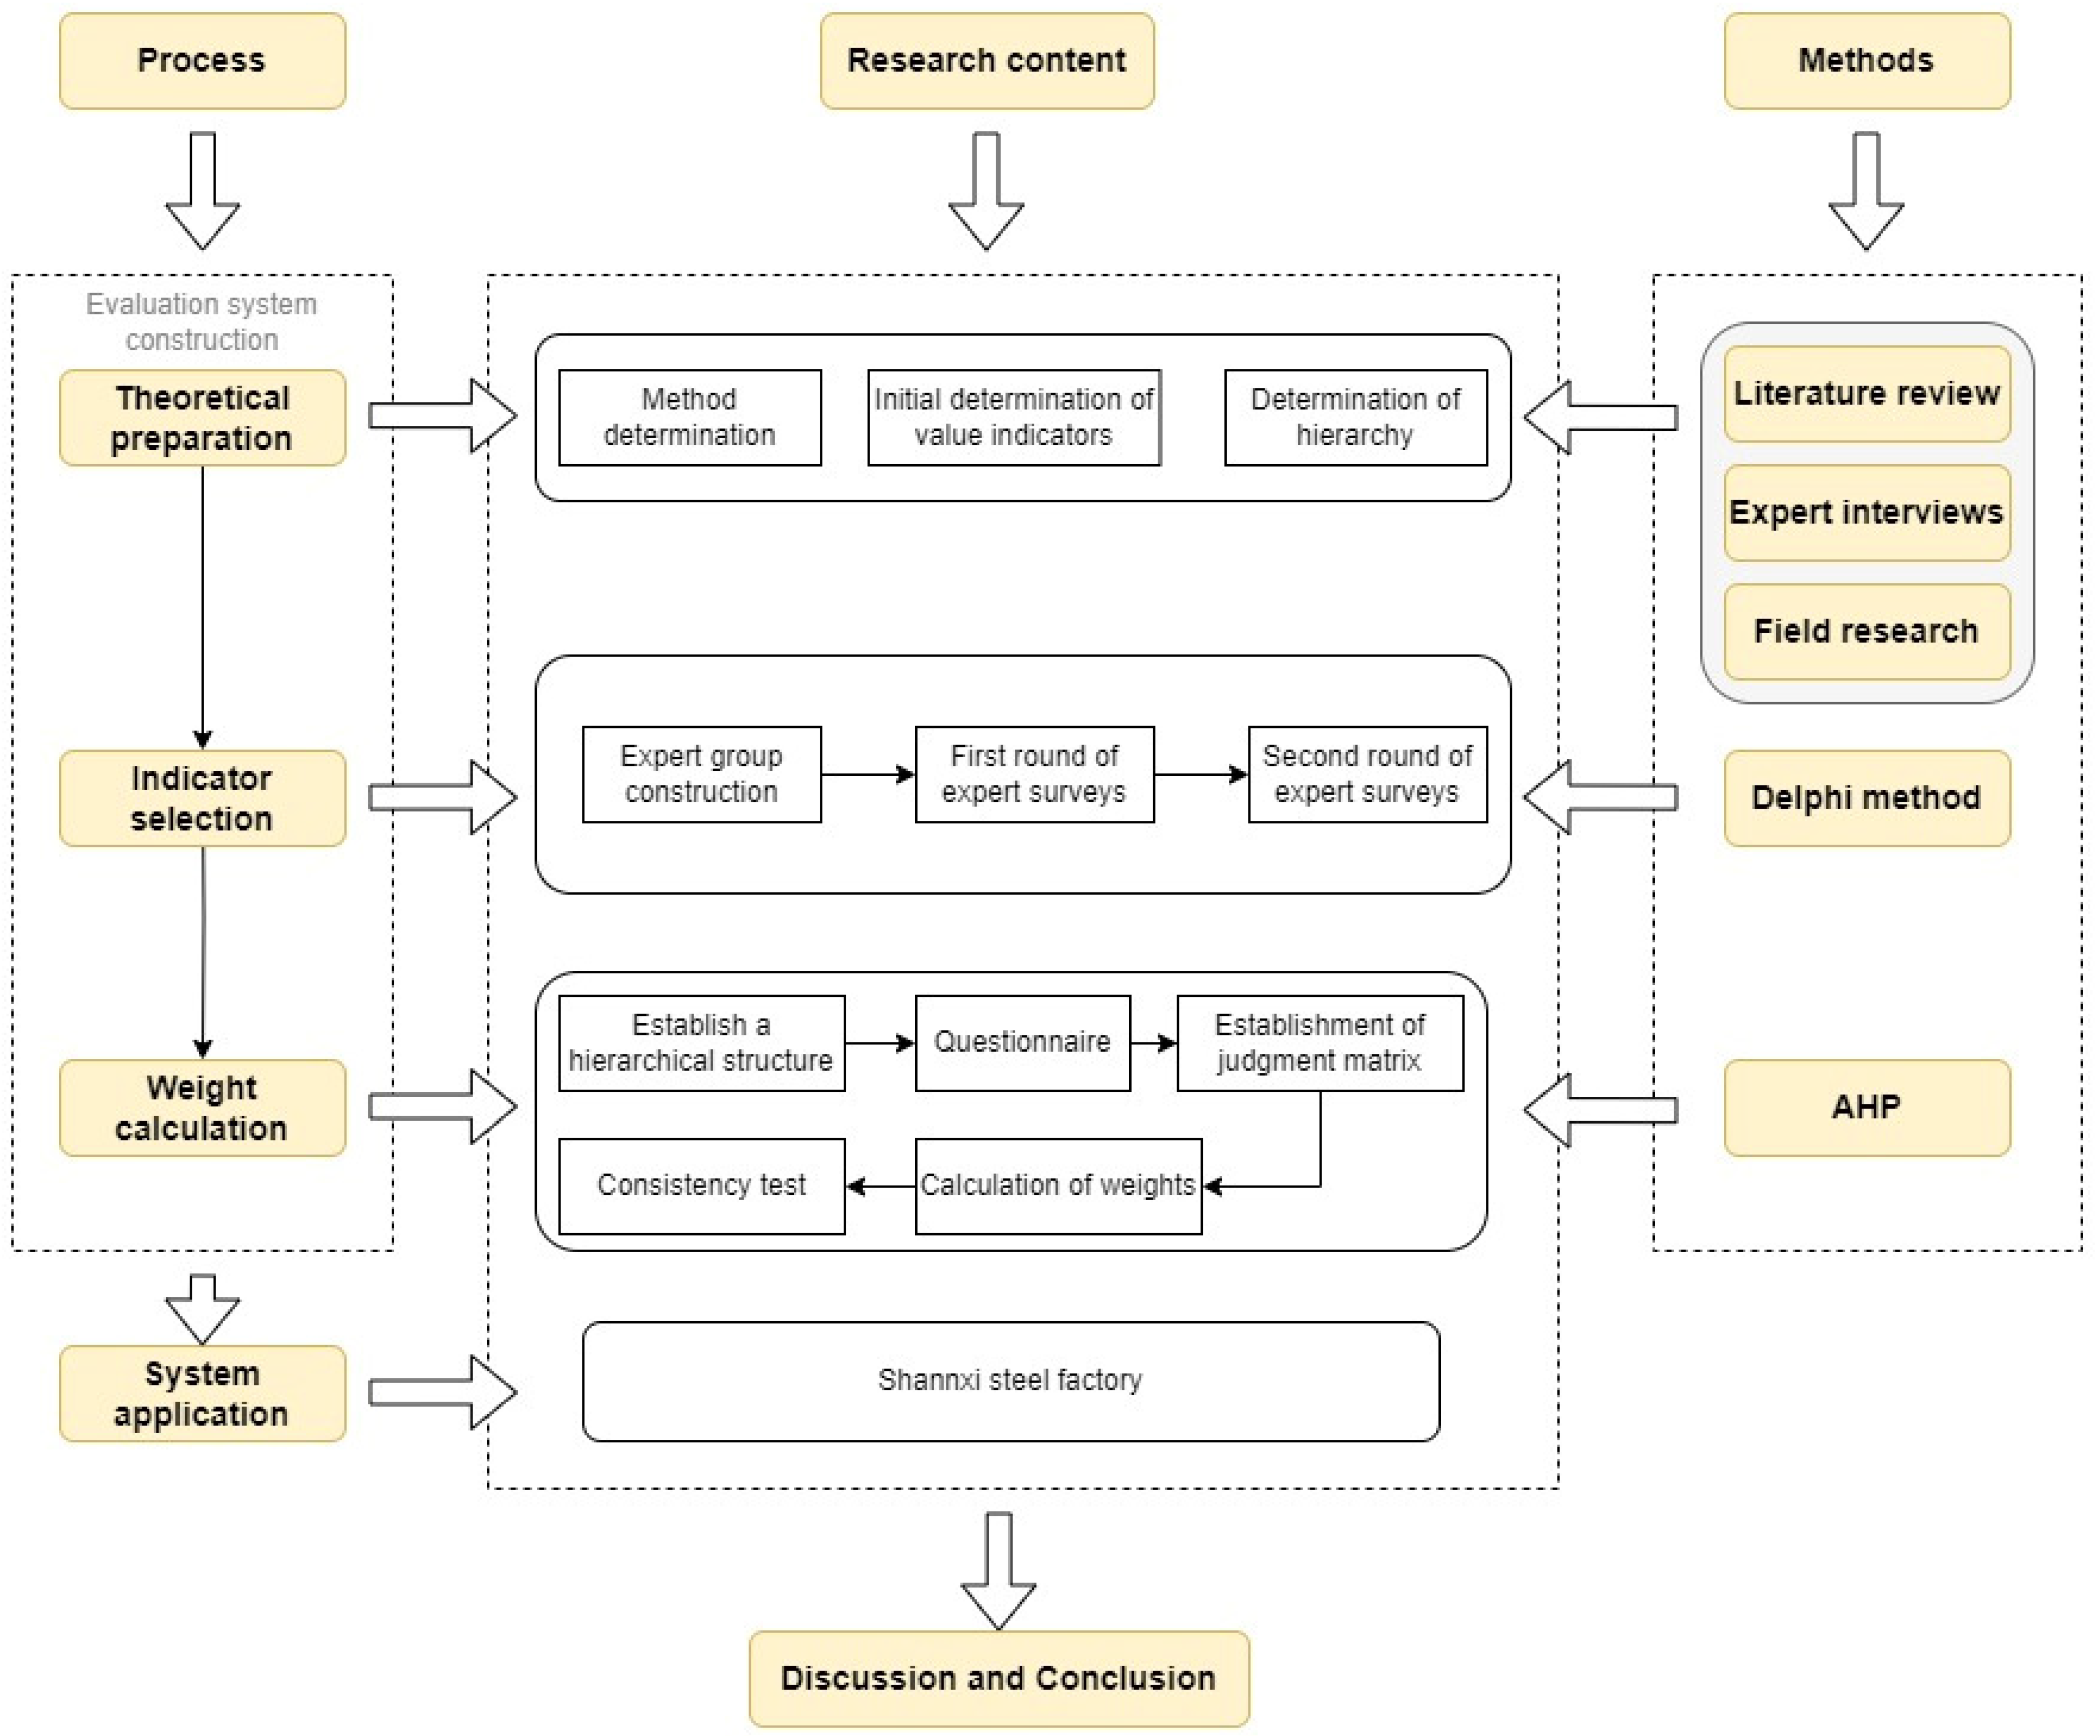
In recent years, the evaluation of industrial heritage value has received more and more attention from academics, leading to the development of various qualitative and quantitative methods. In heritage value assessment, many methods commonly rely on expert experience or textual descriptions to judge whether a site possesses historical, cultural, aesthetic, or other value [11,58]. However, such methods tend to be highly subjective and lack a uniform standard process. Therefore, it is difficult to apply assessment results directly to actual policymaking, and they are not suitable for policy comparisons and references between different regions or countries.
To address this problem, multi-criteria decision-making (MCDM) methods have widely been used for heritage evaluation. One of the most commonly used tools is the Analytic Hierarchy Process (AHP) proposed by Saaty [59,60]. The AHP breaks down a complex decision problem into a hierarchy consisting of objectives, criteria, sub-criteria, and alternatives. It allows for pairwise comparisons and calculates relative weights based on expert judgement. Studies by Mushtaha et al. [19], Ribera et al. [20], and Morano et al. [21] have successfully applied the AHP to historic cultural heritage, demonstrating its suitability for assessing multi-faceted values.
Nevertheless, the AHP method is not without limitations. For example, the final ranking of options may change when new indicators are added (known as rank reversal) [61]. Also, the AHP relies on expert judgments, which can be inconsistent, especially when comparing many indicators [62]. To make the evaluation more reliable, many studies use the Delphi method first. This method gathers expert opinions through several anonymous rounds, helping to filter and improve the indicators [63]. Delphi ensures that the chosen indicators are clear, relevant, and agreed upon by experts. When Delphi and the AHP are used together, the results are often more robust [64]. Delphi helps build a strong set of indicators, and the AHP then assigns weights to them based on expert input [64]. This combination balances expert agreement with numerical accuracy [56,63,64].
Beyond the AHP, other MCDM techniques have also emerged. Some studies have extended the AHP method, such as fuzzy AHP [3,9]. However, it has been argued that the fuzzy method does not provide more effective results compared to the traditional AHP [65,66]. Fuzzy AHP has also been applied to several MCDM (Multi-Criteria Decision Analysis) domains, including heritage buildings [66,67]. However, some scholars, including Saaty, do not support this fuzzy AHP, arguing that the very nature of the AHP method is inherently fuzzy [60,68].
Others have indicated that the Best–Worst Method (BWM) produces more consistent results. It also reduces the mental effort needed from experts [69,70]. However, its accuracy depends on how well the “best” and “worst” criteria are selected [71]. The Ranking Comparison Method (RANCOM) and the Stochastic Identification of Weights (SITW) are efficient for large and complex decision problems [72,73,74,75]. Another method, FN-MABAC (Fuzzy Normalisation-based Multi-Attributive Border Approximation Area Comparison), is a newer approach [76]. It is designed to handle problems where the data are fuzzy or the boundaries between indicators are unclear [66]. FN-MABAC has been applied in areas like transportation, energy, and supply chain management [66,76].
These new methods are novel, but their availability for the evaluation of industrial or related heritage has yet to be investigated. A comparison of the methods is shown in Table 1.
The purpose of this study is to identify and quantify the value of industrial heritage, which needs to be understood by the public and decision-makers via a clear, intuitive, and suitable methodology for the general public. Therefore, it is more authoritative and convincing to use a methodology that has already been more widely applied in the field of heritage conservation. This study adopts a combined Delphi–AHP method. The Delphi method is used to select relevant indicators based on expert consensus. The AHP is applied to determine the relative weights of these indicators. This combination ensures both expert reliability and quantitative clarity. A simplified sensitivity analysis is also included. It helps verify whether small changes in input affect the final results. Overall, this methodological approach provides a systematic and robust basis for evaluating industrial heritage value in Shaanxi Province. It also supports practical decision-making in heritage conservation and adaptive reuse.

3. Methods

Based on the perspective of industrial heritage value evaluation, this study adopts a combination of literature review, field research, and systematic analysis to construct a scientific and reasonable industrial heritage value evaluation system. It also uses the AHP and Delphi methods for indicator selection and weight calculation and finally applies and verifies them in the case of Shaanxi Steel Factory. To ensure the scientific, systematic, and operable nature of the research, this study is presented following four stages, which are theoretical preparation, indicator selection, weight calculation, and system application (Figure 2).

3.1. Theoretical Preparation—Literature Review, Field Research, and Expert Interviews

In the theoretical preparation stage, this study mainly focuses on the selection of methods, the construction of the hierarchical structure and the screening of preliminary evaluation indicators. This ensures that the evaluation system has a solid theoretical foundation and scientific analysis methods. Through extensive literature reading and analysis, this study considered a variety of evaluation methods. It was finally decided to adopt the AHP as the core method of this study, supported by the Delphi method to select indicators.

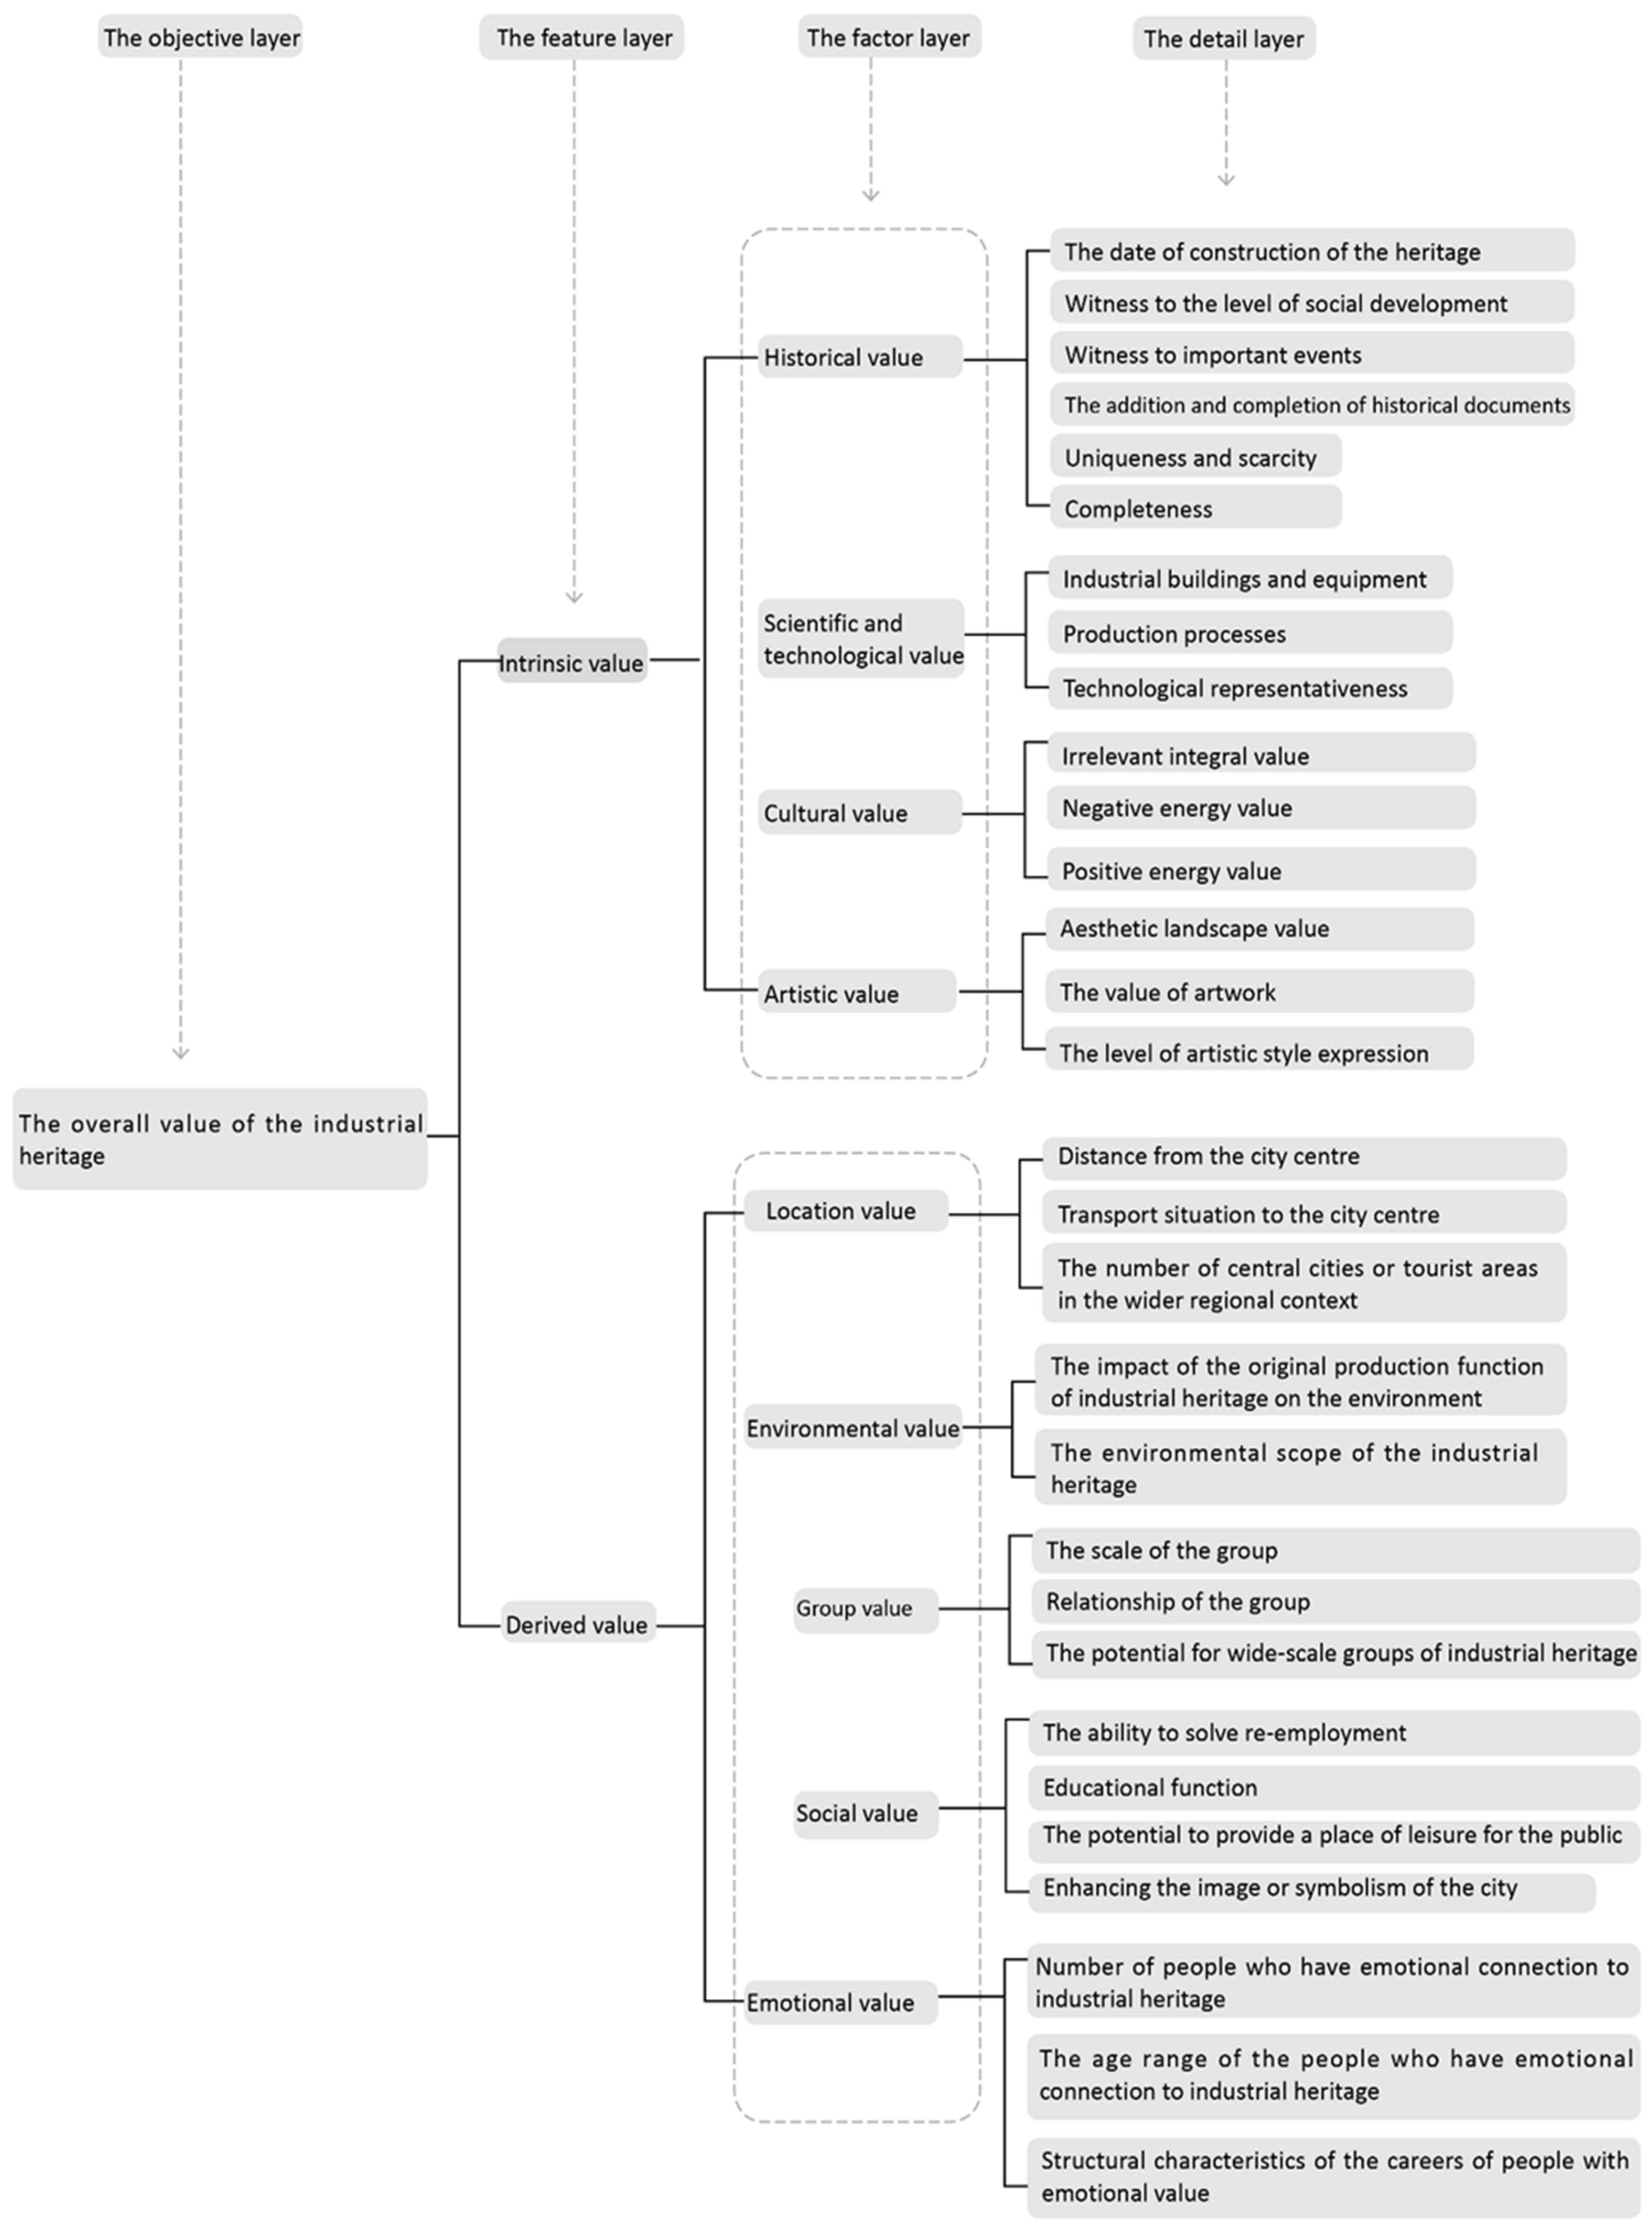
3.1.1. Construction of the Evaluation Hierarchy

In terms of constructing hierarchical structures, the basic principle of the AHP is to break down a complex decision-making problem into multiple levels. This allows the decision-maker to divide the overall objective into several more manageable sub-problems on a level-by-level basis, thus transforming qualitative judgements into quantitative weights [60]. In this study, about the principle of the AHP [77], the evaluation system of industrial heritage value is divided into four layers: objective, feature, factor, and detail layers. Objective layer: to clarify the overall evaluation objective, which is the overall evaluation of the comprehensive value of industrial heritage. Feature layer: to summarise the main value aspects that should be concerned with heritage conservation from a macro perspective, which are the intrinsic and derived values of industrial heritage. Factor layer: further refine the criteria under each major feature layer to clarify the specific connotations of each aspect, so as to ensure more targeted evaluation. Detail layer: quantify the factor layer into measurable indicators to facilitate data collection and analysis.
This hierarchical structure not only helps to break down the complex value system into manageable parts but also ensures that each level has a clear theoretical basis and empirical support. This makes the whole evaluation process hierarchical and logical and provides a scientific basis for actual conservation and reuse decisions.

3.1.2. Selection of Evaluation Indicators

Firstly, this paper studies the theory and practice of industrial heritage value evaluation and focuses on the charters and documents issued by international organisations such as ICOMOS and TICCIH and the research results of scholars. The selection of evaluation indicators should follow the following principles to ensure that the evaluation system combines integrality and representativeness, as well as feasibility, scientificity, comprehensiveness, and regional uniqueness [1,30,35,58,66,78,79,80,81].
Integrality requires that the evaluation indicators form an organic whole and that any single indicator is closely intrinsically linked to other indicators [80,81], while representativeness emphasises that the indicators should remain independent to avoid duplication and mutual inclusion [78]. Second, feasibility requires that the indicators are clearly defined and can reflect the various value aspects in the transformation and utilisation of industrial heritage [79] while being operable and easy to calculate and analyse for evaluation. Third, the scientificity principle requires that the evaluation method reflect the characteristics of industrial heritage. The evaluation criteria should match the evaluation object and reveal the value of industrial heritage at multiple levels and perspectives. The definition of indicators must be accurate and clear to form a complete system [78]. In addition, comprehensiveness requires that the constructed indicators cover a wide range of areas and information, fully reflecting the multiple values of industrial heritage. Adaptability means that the evaluation method can be flexibly adjusted according to the characteristics of different regions while maintaining the basic framework [58].
In addition, this study also verified and added to the evaluation indicators initially selected based on the literature through expert interviews and field research, combined with local literature, government documents, and other information. It was ensured that the indicators both had a theoretical basis and matched the actual situation of industrial heritage in Shaanxi.

3.2. Indicator Selection—Delphi Method

In this paper, the Delphi method is used to select and improve the evaluation indexes of industrial heritage value initially constructed, in order to ensure scientificity and consensus. The Delphi method is a method of forecasting and decision-making through expert opinion gathering and feedback [82]. The first round of questionnaires requires additional statistics on the authoritative coefficient (CR) of the experts. The aim is to assess the expert’s familiarity and judgement in the domain under discussion. Thus, it provides a reliable basis for subsequent data analyses. In addition, after each round of questionnaire data collection, the coefficient of variation (CV) and Kendall’s coefficient of concordance (W) need to be statistically calculated [83]. The CV is used to analyse the degree of dispersion of individual indicator ratings [83]. It finds out which indicators have a more concentrated distribution of ratings and which ones are more divergent. Kendall’s W is used to determine the consistency of expert opinion [83]. It is used to judge the degree of consistency of experts’ opinions in the current round, thus deciding whether the next round of questionnaires or further adjustment of indicators is needed [83,84]. The specific process is as follows:

3.2.1. Expert Group Construction

Twenty experts in the fields of industrial heritage, architectural conservation, and cultural studies were selected for this study. The number of experts was consistent with the recommended range of 10–30 experts in heritage studies in general [63].
The 20 expert group members were from universities (10), research organisations, (6) and government departments (4) to ensure a diverse range of perspectives.

3.2.2. The CR of Experts

The consultation questionnaire included two parts: their authoritative coefficient (CR) (first round only) and the experts’ judgement of the consultation indicators. Indicators were judged by experts according to their significance and were classified into five levels. Values 1–5 are assigned using a 5-point Likert scale, with larger values indicating better representation of the indicator [85]. The authoritative coefficient (CR) of the expert can be calculated as the arithmetic mean of the judgement rationale (Ca) and the familiarity score (Cs) (Table 2 and Table 3) [83]. The Cs is divided into five levels, and the Ca is determined by a combination of four components: theoretical analysis, practical experience, the literature, and intuitive judgement [83]. CR ≥ 0.7 is considered a high authority coefficient [83].
The first round of surveys was conducted to allow experts to make suggestions on the initial constructed indicators and to add possible missing factors [86].

3.2.3. Statistics on the CV

Then, the mean (M), standard deviation (S), and coefficient of variation (CV) of each indicator are calculated. Based on the reliability of expert opinions, indicators with an average importance score lower than 4 and a coefficient of variation greater than 0.25 are removed, and the evaluation index system is adjusted accordingly. The CV is the ratio of the standard deviation of each indicator to its mean within the evaluation index system [83,87]. A smaller CV value indicates a lower degree of dispersion in experts’ evaluation results for the indicator. Generally, if the CV of an indicator is greater than or equal to 0.25, it suggests that expert opinions on that indicator are not sufficiently consistent [62,83].
Assume that X i j represents the score given by the i-th expert for the j-th indicator, where there are n experts and m indicators. The mathematical representation is as follows:
Mean:
M j = 1 n i = 1 n X i j
Standard deviation:
S j = 1 n 1 i = 1 n X i j M j
Coefficient of variation:
C V j = S j M j
In subsequent rounds, experts score the revised indicator system using the Likert 5-point scale (1 = not important at all; 5 = extremely important) to assess the importance of each indicator [88,89].

3.2.4. Delphi Consistency Test

After each round of surveys, the researchers tested for consistency and used SPSS 22.0 to calculate Kendall’s coefficient of concordance (W) [82]. In this study, the focus is on achieving a preliminary consensus rather than requiring a high degree of uniformity. Therefore, if Kendall’s W > 0.2, it is considered that the experts have reached a preliminary consensus [90]. Kendall’s W reflects the degree of agreement among experts to a certain extent. There are two general formulas for its calculation [91,92]:
When experts did not give the same rating for each indicator of the evaluation system, the formula is as follows:
W = 12 j = 1 n d j 2 m 2 n ( n 2 1 )
When all experts give the same rating for each indicator of the evaluation system, a correction factor should be subtracted from the denominator of the above formula—in this case as follows:
W = 12 j = 1 n d j 2 m 2 n ( n 2 1 ) m i = 1 m T i
T i represents the correction index for tied scores and is calculated as follows:
T i = l = 1 L t l 3 t l
L is the number of groups with identical scores in the evaluation by expert i. t l is the number of identical scores in the l-th group. W is the coefficient of concordance, which measures the degree of agreement among experts. m is the total number of participating experts. n is the number of indicators in the evaluation system. d represents the difference between the sum of rankings for each indicator and the mean ranking sum across all indicators. dj is the difference between the total importance score of the j-th indicator and the average total importance score across all indicators.
The value of W ranges between 0 and 1, where a higher W value indicates stronger agreement among experts.
The significance test for expert opinion concordance adopts the rank consistency test.
If p > 0.05, it indicates that the reliability of expert evaluations is poor, and the evaluation results of the indicator system are not acceptable. If p < 0.05, it suggests that the reliability of expert evaluations is high, and the evaluation results of the indicator system are valid.
The significance test for concordance follows the K. Pearson X2 formula below:
X 2 = 1 m n ( n + 1 ) 1 n 1 i = 1 m T i j = 1 n d j 2

3.3. Weight Calculation—Analytic Hierarchy Process

In this study, the AHP, as a multi-criteria decision-making method, is used to calculate the weights of the industrial heritage evaluation index system filtered through the Delphi method. The basic principle of the AHP method is to break down complex problems into a hierarchical structure consisting of objective, feature, factor, and detail layers. By constructing pairwise comparison matrices, experts can conduct quantitative analysis based on qualitative judgments [93]. Specifically, based on the hierarchical structure established during the theoretical preparation phase, the comprehensive value assessment of industrial heritage is broken down into multiple aspects, such as historical, technological, social, artistic, and environmental value. On this basis, a pairwise comparison of indicators at each level is conducted to construct a judgement matrix. Through the questionnaire, respondents were asked to rate the importance of each pair of indicators using Saaty’s 1–9 scale. For example (Figure 3), if respondents considered indicator A to be equally important as indicator B, a value of 1 was assigned; if they considered indicator A to be slightly more important than indicator B, a value of 3 was assigned. After collecting and analysing the questionnaire data from all experts, judgement matrices were constructed for each hierarchical layer.
Next, the eigenvalue method is used to determine the maximum eigenvalue of the judgement matrix and its corresponding eigenvector, thereby obtaining the relative weights of each indicator [93]. To ensure the reasonableness of the experts’ subjective judgement, this study tests the consistency of the judgement matrix by calculating the consistency index (CI) and the consistency ratio (CR); the consistency of the judgement matrix is considered good when the CR is less than 0.1 [94]. By calculating the weights through the AHP, the qualitative indicator system selected by the Delphi method can be transformed into a quantifiable weight distribution.
In addition, it also provides a quantitative basis for the subsequent industrial heritage value assessment of the Shaanxi Steel Factory case.
The specific process is as follows:

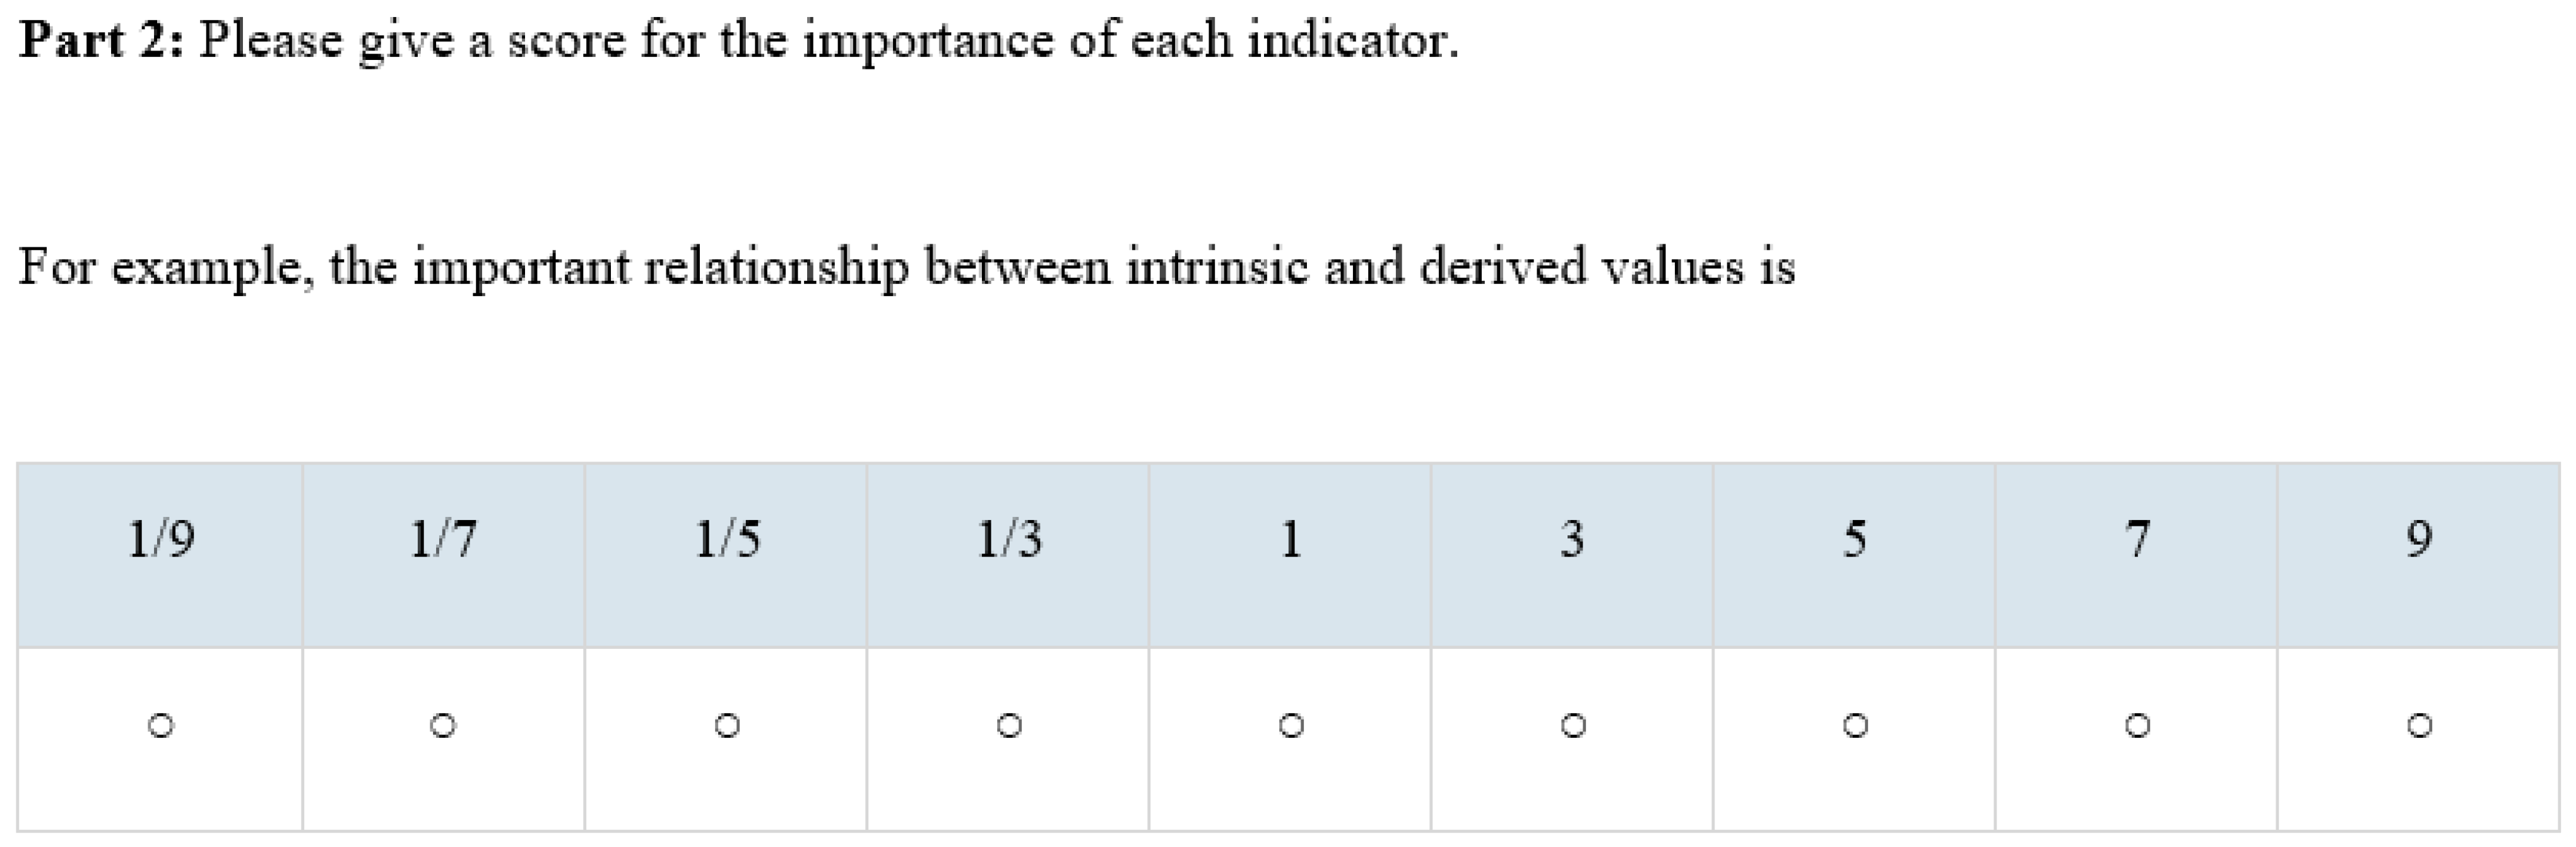
3.3.1. Building the Judgement Matrix

Once the hierarchy has been established, the affiliation of the elements of the evaluation system can be determined. Assuming that A is the upper-level factor and its lower-level factors are B1, B2, B3, …, and Bn, these factors need to be weighed according to their relative importance to objective A. In this step, we use the AHP to derive the weights of B1, B2, B3, …, and Bn. The pairwise comparison process is carried out by several experts. In this process, the experts need to answer the following question: which element is more important for goal A, Bx or By? The scale of importance is the 1–9 scale proposed by Saaty [93] (Table 4).
Then, pairwise comparisons are made for all elements in layer B, resulting in the comparison matrix presented below. The result of comparing the ith element with the jth element is denoted by bij. The result of the comparison of the ith element with the jth element is represented by bij in the matrix [93].
B = ( b i j ) n × n b 11 b 12 b 1 n b 21 b 22 b 2 n b n 1 b n 2 b n n

3.3.2. Calculation of the Weights

The calculation steps for the root method are as follows:
Calculate the product of the elements of each row in the judgement matrix B, as follows:
m t = j = 1 b i j , i = 1 , 2 n
Calculate the Nth root of mi, as follows:
w i = m i n
Normalising the vector of W = w 1 , w 2 , , w n T , as follows:
w i = w i i = 1 n w i
The computed weights are the weight vectors of the required solution, w1, w2, …, wn, which are the corresponding weight values for each element.

3.3.3. AHP Consistency Test

Then, the test for matrix consistency is performed.
Calculation of the consistency index (CI), as follows:
C I = λ max n n 1
The maximum characteristic root is calculated as follows:
λ max = 1 n i = 1 n B w i w i
The corresponding average random consistency indicator RI (Table 5) is found.
Calculation of the consistency ratio (CR) as follows:
C R = C I R I
When the CR is less than 0.1, the consistency of the judgement matrix B is considered acceptable; otherwise, some correction of the judgement matrix is required.

4. Results

4.1. Initial Factor Selection

This section first introduces the theoretical foundation of this paper to accurately understand the concept of industrial heritage. Secondly, it presents the relevant theories applied in this paper. Finally, through field research and literature analysis, the historical background and practical foundation of industry and industrial architecture in Shaanxi are studied. This section lays the theoretical and practical foundation for the subsequent research.
Through the authors’ research and investigation of the current status of industrial heritage in Shaanxi Province, a total of 52 industrial heritages have been identified and classified (Table 6).

4.1.1. Characteristics of Industrial Heritage in Shaanxi Province, China

In 1934, the Longhai Railway was built to Xi’an, and Shaanxi’s industrial development began to accelerate [18]. After the founding of the People’s Republic of China in 1949, the policies of the First Five-Year Plan (a plan formulated by the Chinese government for the development of the national economy) and the Third Line Construction (focusing on the construction of the northwestern part of China) were adopted [95,96]. The industrial layout of China was adjusted, and the main focus of industrial construction was gradually shifted to the western regions of China, which led to the rapid development of Shaanxi’s industry.
The Third Line Construction made Shaanxi’s transport, energy, defence, and electronics industries develop significantly [95]. This greatly consolidated the industrial foundation and improved the industrial system, and it had a profound impact on the economic and social development of Shaanxi Province in China [17,95]. The large amount of rich industrial heritage is important evidence of Shaanxi’s recent modern development and carries profound historical information [18]. It is also the imprint of its progress from an agrarian to an industrial civilisation [95].
Through field research, in terms of industry sectors, industrial heritage in Shaanxi is mainly concentrated in the machinery, food industry, and textile industries; in terms of regional distribution, these industrial heritages are mainly concentrated in the cities of Xi’an, Baoji, and Xianyang (see Table 6).
Influenced by the Westernisation Movement (1861–1895), industrial buildings in Shaanxi were constructed from mixed brick and timber, with steel structures [96]. The roof form combines the sloping roofs of the Guanzhong residential buildings in Shaanxi with sawtooth roofs, which have the functions of light and ventilation [97]. Influenced by the anti-Japanese war period (1931–1945), many factories were relocated inland from the coastal areas of China [96,98]. Most of the factories in this period were built along the mountains, using cave dwellings and earth-covered buildings to conceal production [96]. During the first five-year plan period (1953–1957), influenced by Soviet assistance, standardised designs for industrial plants, such as large-span, single-storey plants, prefabricated concrete components, and symmetrical plant planning were prevalent [95,99].
In the period of third-line construction from 1964 to 1980, influenced by the principles of hiding, dispersing, and leaning against the mountains, most of the factories in Shaanxi were located in the mountainous areas [43]. The buildings were low and scattered, with stone walls and wooden roof frames. This allowed for a great integration with the natural environment. From 1980 to the present day, influenced by modernism, the factory frame structure was popularised, and glass curtain walls and concrete were partly used. Space tends to be flexible and open [18].
The Shaanxi region has more than 100 years of industrial development [100], and the industrial heritage in the region has the historical value of witnessing the development of the country and the city, the scientific and technological value of witnessing the advancement of industrial technology, the artistic value of witnessing the development and change in modern industrial architectural styles, and the socio-cultural value of supporting the renewal of the city and the cultural inheritance [18,101]. In addition, due to its unique geographical environment and cultural background, the location value and environmental value of industrial heritage should also be fully considered.

4.1.2. Determination of Industrial Heritage Value Factors in Shaanxi Region

The value of industrial heritage refers to the aspects of industrial heritage resources that have value and significance to people. Liu [102] divided the value of industrial heritage into two aspects: the intrinsic value of industrial buildings, including the historical, social, artistic, cultural, scientific and technological values that they confer on themselves; and the reuse value, which includes the environmental value, the economic reuse value, the educational value, and the technical feasibility value.
Firstly, this study undertook a comprehensive literature review, drawing on established international frameworks such as charters and guidelines issued by international organisations such as the ICOMOS and TICCIH, as well as relevant studies on industrial heritage [14,20,39,48,59,66].
To ensure that these value factors were relevant and reasonably actionable, this study undertook consultations with professionals in the field of cultural and industrial heritage. Also, the initial evaluation indicators (Table 7) and initial evaluation criteria were finalised by communicating with the project leaders and local residents during the field visits.

4.2. Delphi Method of Selecting Indicators

4.2.1. Calculation of the Expert Authoritative Coefficient (CR)

According to the initially established indicator system for value evaluation of industrial heritage in Shaanxi (Table 7), this study distributed questionnaires to 20 experts by email. Twenty valid questionnaires were recovered. Based on the data collected from the two rounds of questionnaires, the authority coefficients of the experts were calculated as indicated in Table 8 and Table 9.
As can be seen from the above tables, the values of Ca, Cs, and CR for each expert are above 0.7. This indicates that the level of the selected experts is relatively high. Also, the overall Ca, Cs, and CR mean values are more than 0.8. This shows that there is a high internal consistency of authority. Therefore, the data results obtained by the Delphi method are valid.

4.2.2. Consistency Test Statistics

Using SPSS, both rounds showed Kendall’s coefficient of concordance above 0.2. This indicates good expert agreement and high reliability. Both rounds’ p-values were below 0.05 (Table 10). This demonstrates statistical significance.
Indicators were screened by calculating the mean, standard deviation, and coefficient of variation in the indicators. According to the statistics of questionnaire data, the indicators with a mean value of 4 points or less, or with a coefficient of variation greater than 0.25, were deleted. Based on the statistics, A23, A25, A26, A43, B13, B22, and B43 needed to be deleted. The detailed screening of indicators is shown in Table 11, with deleted indicators marked in grey. In the final calculation, the range of mean, standard deviation, and coefficient of variation values did not exceed the specified range in the calculation process. Therefore, expert consultation was concluded, and the indicator system was determined (Figure 4).

4.3. Weight Result

Weight Calculation

The comprehensive evaluation method in this study has two feature layers, nine factor layers, and thirty detail layers, which have different levels of importance in the comprehensive evaluation. This study mainly compares the importance of indicators through questionnaires and matrix weights of the AHP, and it finally verifies the consistency. A total of 212 questionnaires were collected from respondents of different genders, ages, and occupations.
In addition, due to the large sample size of the questionnaire, several measures were taken in the study to minimise the effect of “cold-called” answers on the results of the consistency test. The first strategy was optimising the questionnaire. The questionnaire was kept to a length that could be answered within 10 min. Draft questionnaires were sent to faculty colleagues and researchers of the University of Strathclyde to ask for their comments. Unclear questions from feedback were revised to form the final questionnaire. The second was asking beforehand. Respondents were given the background of the author’s study in advance and asked if they were interested in completing the questionnaire. The questionnaire was sent to respondents who provided positive feedback. In addition, the online questionnaire began with an introduction to the aim and background of the study, with two options set as interested—Continue to fill in and not interested—Close. Respondents were actively followed up with regarding their status, and any questions were answered at any time. In addition, the questionnaires were checked for missing items after collection, and those with a completeness level of less than 80% were eliminated. In addition, the validity of the questionnaire was verified through a rigorous consistency test. Together, these strategies reduced the influence of “cold” experts on the consistency test results.
After analysing the collected data and its results (See Appendix A), calculating and checking the consistency according to the matrix, industrial heritage weights were obtained and are shown in Table 12.

4.4. Interpretation of Evaluation Indicators and Evaluation Criteria

Based on the AHP method, it can be concluded that when the assessor evaluates the value of industrial heritage, the assessor actually assigns values and scores to the factors in the detail layer, then obtains the evaluation results of the indicators in the factor layer according to the weights, and then superimposes them upwards to obtain the comprehensive evaluation results of the feature layer and the objective layer [21,93,103]. To improve the scientificity and fairness of the evaluation results and reduce the assignment bias caused by the assessors’ lack of clarity of the indicator concepts, it is necessary to explain the evaluation contents of the detail layer indicators before the assessors assign the values and to obtain accurate interpretations, in order to enable the assessors to make the correct scoring judgement.
The evaluation of the value of industrial heritage is an assessment of its historically ascribed value and its current, conservation, and reuse value. In this paper, the evaluation criteria of industrial heritage are set to different scoring criteria of 4, 3, 2, and 1 in an order from high to low, which can be found in Appendix B (Table A13). This is based on learning the evaluation criteria of related heritage, combined with the industrial development and characteristics of Shaanxi, as well as consulting the experts’ opinions. Taking the date of construction of the heritage in detail as an example, Tian [104] suggests that although the development of industrial heritage is much shorter than cultural heritage, it can be divided according to the period of relative concentration of distribution. For example, the first period was before 1911 (limited technology, slow development); the second period was during 1911–1948 (war-affected, turbulence development); the third period was from 1949 to 1977 (policy-supported, focussed development); and the fourth period was from 1978 to the present (rapid development) [104]. According to research on the history of Shaanxi’s industrial development and architectural features, the older the heritage, the higher the score. The evaluation criteria are four points for those built before 1911 and one point for those built after 1978.
The industrial heritage of each region has its unique characteristics, depending on its geographical location, production conditions, and development history. A single value score does not indicate the overall value of different industrial heritage sites. Our evaluation of the value of industrial heritage is not to compare the value of industrial heritage in the region but to understand the value of industrial heritage comprehensively and objectively, and to identify the outstanding parts of industrial heritage in order to facilitate the protection and development of industrial heritage and to choose targeted protection methods and measures according to the value of the characteristics of the industrial heritage. Thus, the most important thing for the statistics of evaluation results of the value of industrial heritage is to categorise it according to its value and make comparisons within each category.
If the value of the surrounding environment of a certain industrial heritage is outstanding, attention should be paid to controlling the impact on the surrounding ecological environment in the process of protection and development, and also to the erosion of the surrounding countryside on mountains, forests, and water bodies and to proposing practicable protection methods for the protection of the natural environment in terms of policy and planning. If the location value is outstanding, it should be reasonably utilised in protection and development, and the construction of relevant supporting service facilities should be improved to attract more tourist flows. If the historical value of heritage is the most prominent, then attention should be paid to the protection of the overall historical landscape of the place to prevent excessive development. Of course, in practice, it is necessary to comprehensively consider the interrelationship and mutual constraints between the evaluation elements to prevent protection and development from deviating from the correct line due to incomplete interpretation of the results, which would result in irreparable losses.
The detailed evaluation criteria and scoring sheet are shown in Appendix B. A value score for each building in the industrial heritage can be derived based on the above criteria, with the overall value of the industrial heritage being taken as an average of the scores for each building.

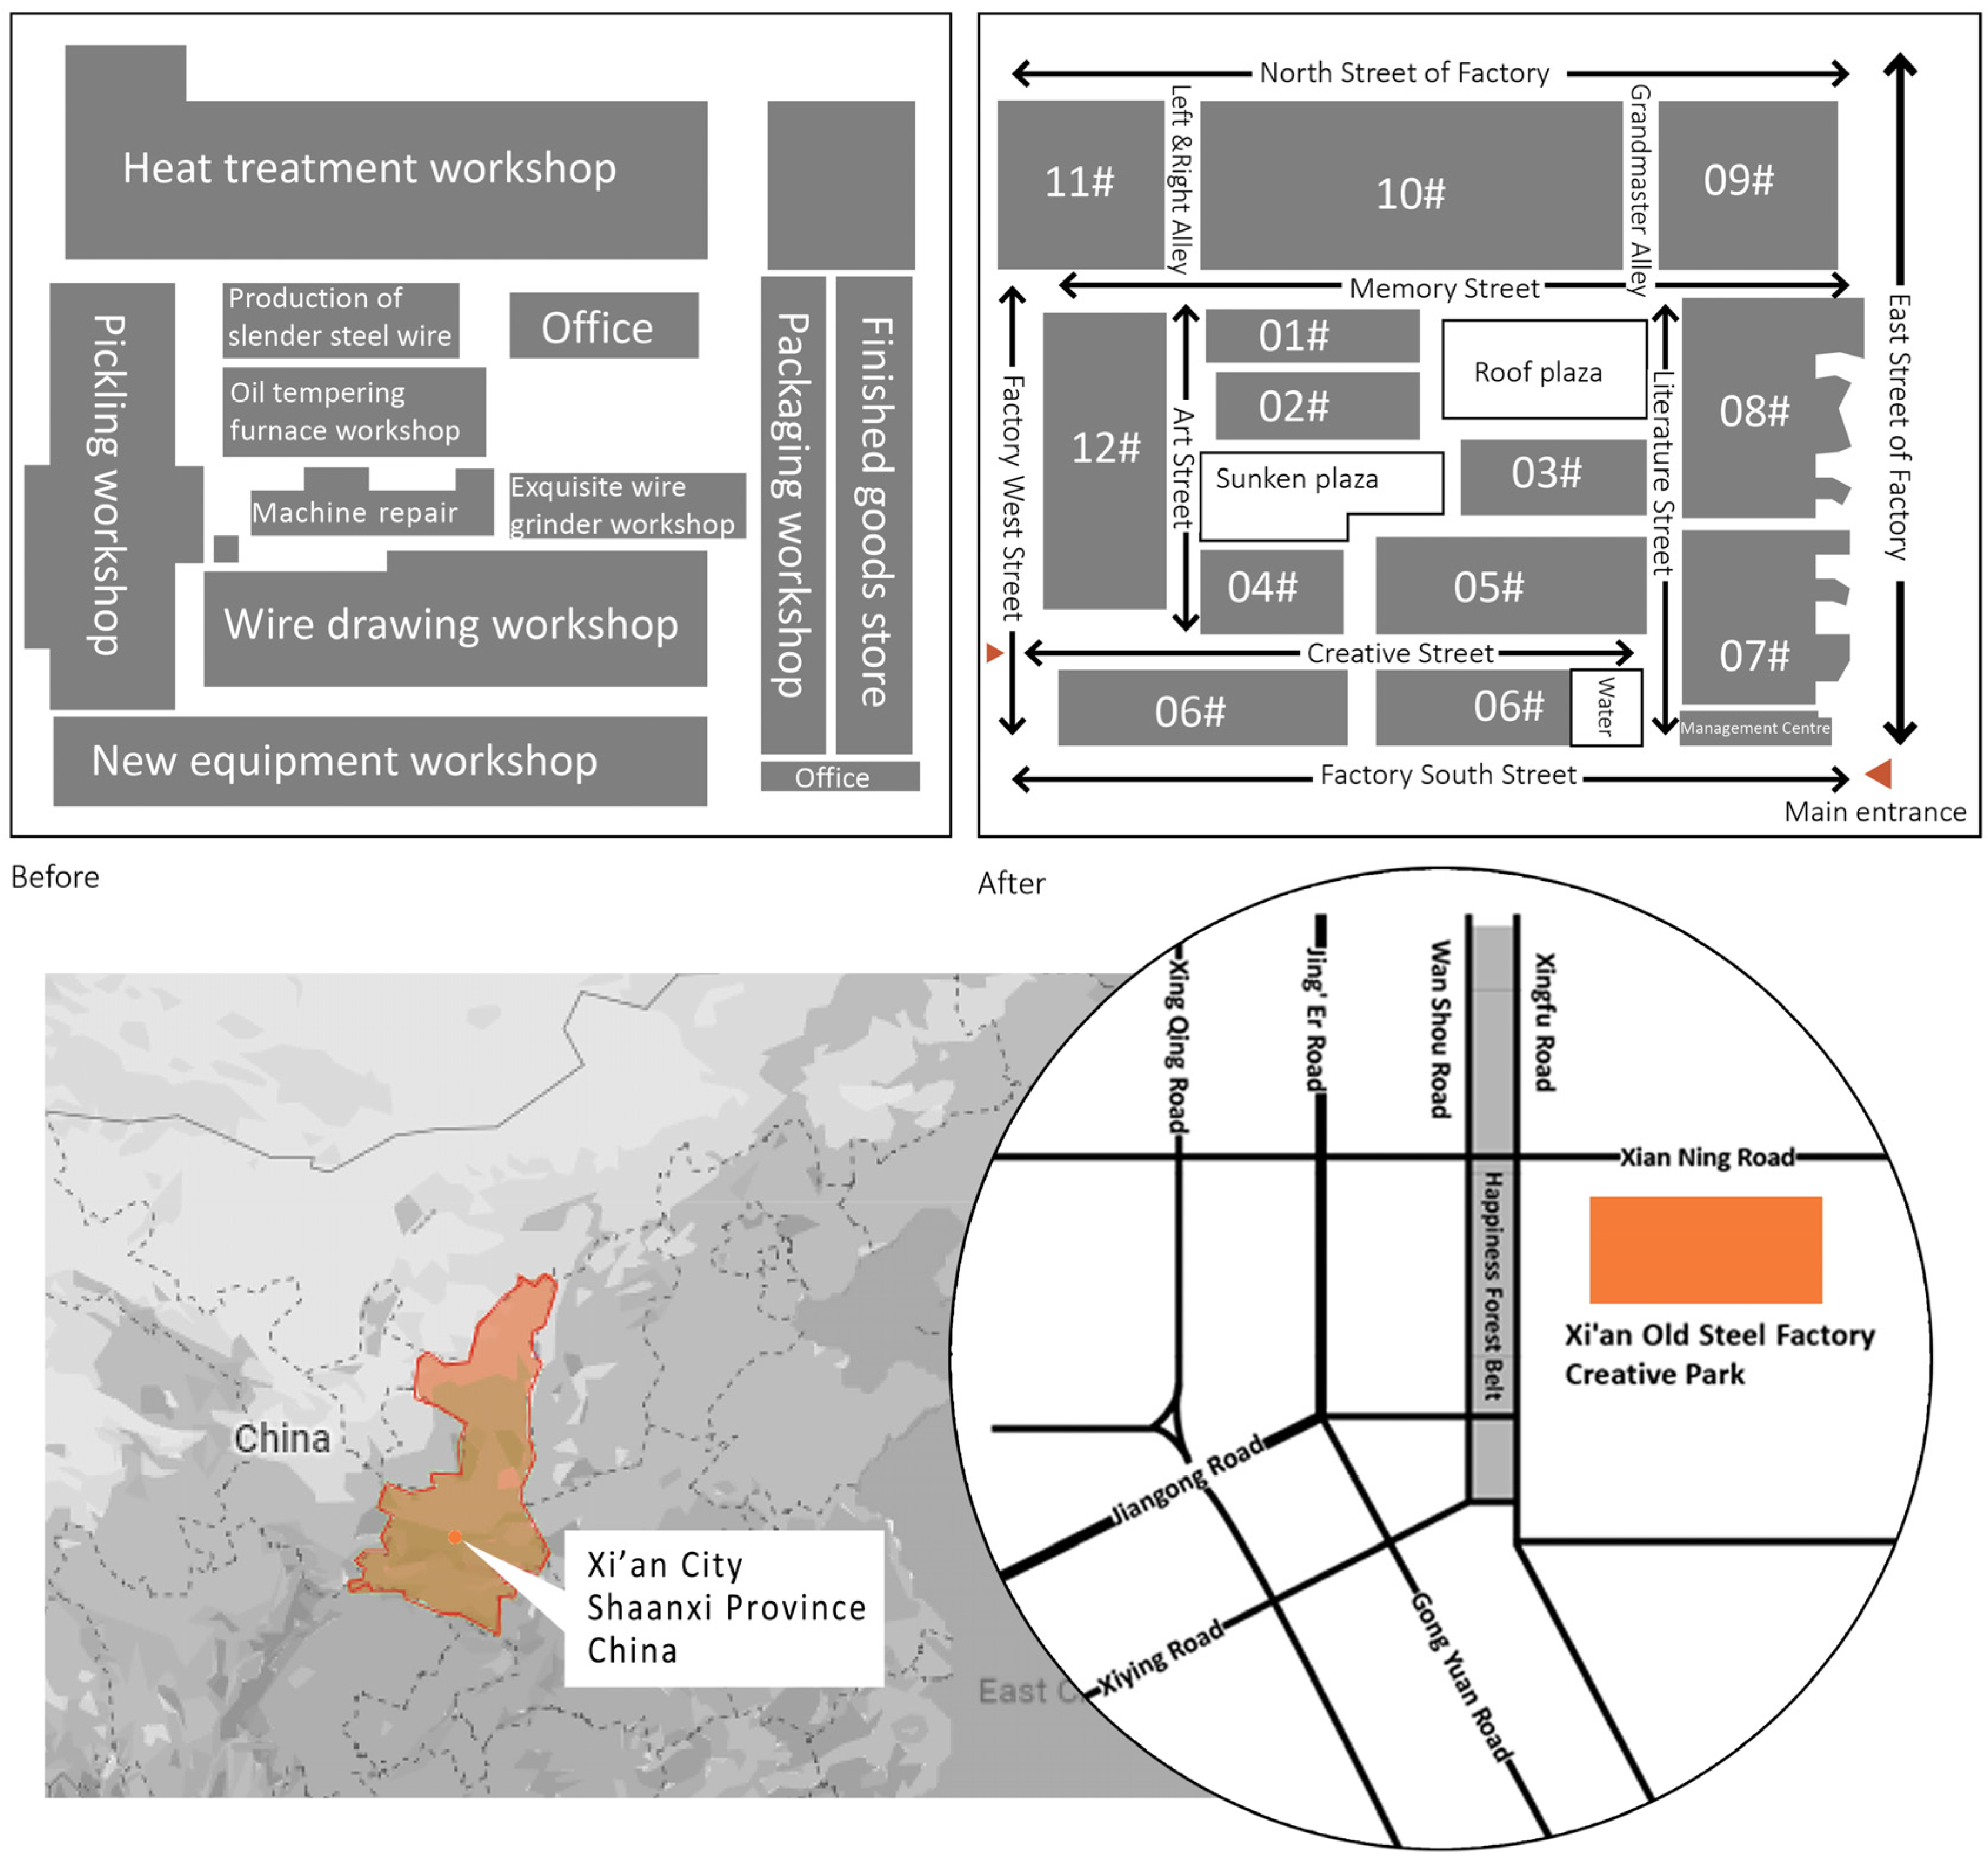
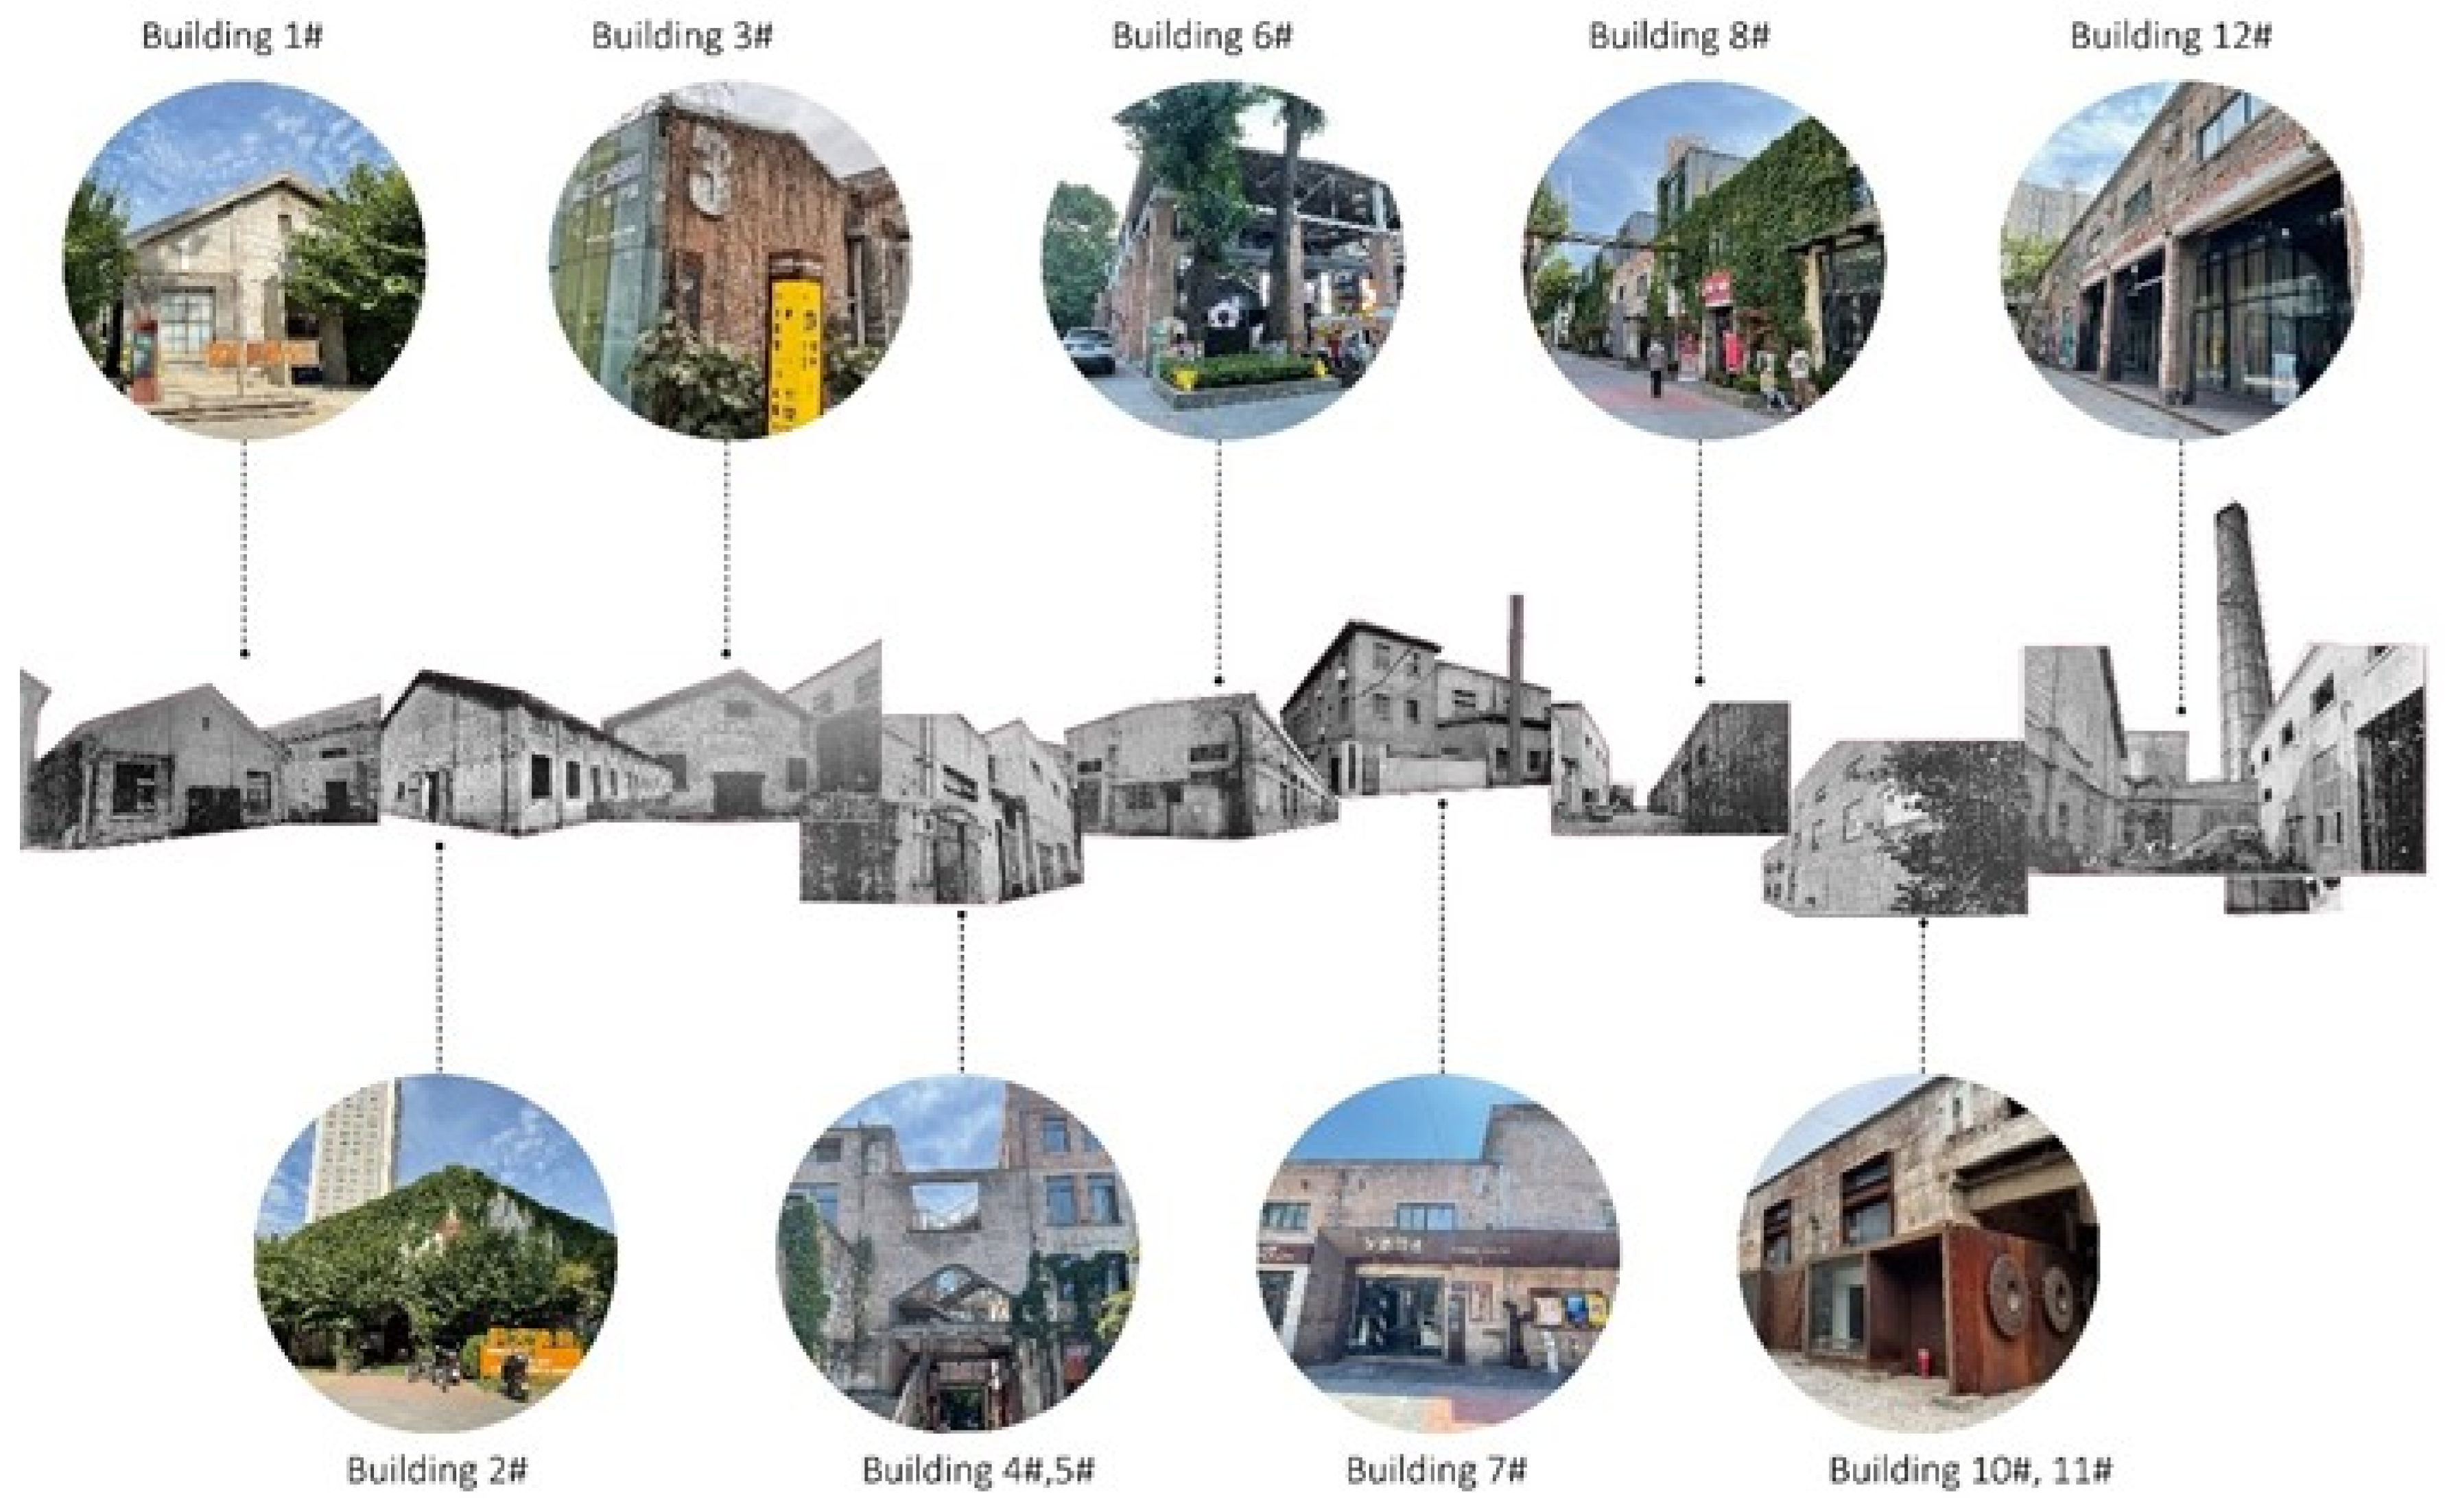
5. Case Study—Applicative Demonstration of the Method

5.1. Study Area

The case study selected for analysis in this paper is the Shaanxi Steel Factory, which is an important industrial heritage site formed during the development of the city of Xi’an. The Shaanxi Steel Factory was officially established in 1965, and after decades of development, it played an important role in improving the GDP indicator of Xi’an during its active production period [18,101]. By 2002, the Shaanxi Steel Factory went bankrupt due to economic and policy reasons, as well as poor management [105]. Once the largest modern steel enterprise in Xi’an, Shaanxi Steel Factory witnessed the development of modern industry in Xi’an [105,106]. With the decline of Shaanxi Steel Factory, a large number of industrial heritage sites were vacated, and abandoned production and processing equipment were left unmanaged, which led to the issues of preserving and reusing industrial heritage. In 2002, Xi’an University of Architecture and Technology Science and Education Industry Company Limited acquired Shaanxi Steel Factory and remodelled it, renaming it to Old Steel Factory Creative Park [18].
This case study focuses on the renovated Shaanxi Steel Factory, currently known as the Old Steel Factory Creative Park. Figure 5 shows its location as well as the layout and changes in building names before and after the renovation. This study will assess the value of Shaanxi Steel Factory in the context of its location, development history, and architectural preservation to verify the feasibility of the evaluation methods. Through fieldwork, a comparison of the current situation and the situation before renovation is shown in Figure 6.

5.2. Analysis of Shaanxi Steel Factory Value

5.2.1. Historical Value

Shaanxi Steel Factory was founded in 1958 [18]; the oldest buildings in the factory are the former heat treatment workshop west section and the former pickling workshop built in 1958. The Shaanxi Steel Factory not only witnessed the history of industrial development in Shaanxi Province from 1958 to 2001 but also witnessed the development of the iron and steel production industry in Northwest China, as well as a series of events such as the transition of the economic system, the restructuring of enterprises, relocation, closure, and layoff of employees [17,18]. In addition, the structures and buildings of the current plant prove the authenticity of the historical documents, which provide complete information on the technology and process of iron and steel production during the industrial period.
Shaanxi Steel Factory was the first, the largest, and most advanced steel factory in Northwest China at the beginning of its construction, and it was once listed as one of the top ten steel factories in China [17,57]. It was also the first modern medium-sized iron and steel plant built in Shaanxi, and it represented the highest level of Shaanxi’s iron and steel industry at that time. At present, except for Building No. 9, which has collapsed due to old age, most of the main structure of the building is well preserved.
Therefore, according to the evaluation criteria, its date of construction of the heritage is scored as 2, its score as a witness to the level of social development is 3, its score as a witness to important events is 3, and its additions and completions of its historical documents are scored as 2. The score for its uniqueness and scarcity is 4, and the score for its completeness is 4. In summary, the total score for its historical value is 18 (the total score could be 24), and after combining the weights the weighted calculation is 0.82 (Table 13).

5.2.2. Scientific and Technological Values

Shaanxi Steel Factory has only retained representative equipment for exhibition purposes. In terms of production processes, the main production technologies of the time can be analysed, contributing to an understanding of the relatively advanced iron and steel production processes in Northwest China. According to the evaluation criteria. Shaanxi Steel Factory steadily developed its production since 1965, and its product output, quality, variety, and efficiency improved year by year. It was a high-quality special steel production base in Shaanxi Province and one of the key special steel factories in China. Based on the evaluation criteria, the industrial buildings and equipment scored 3 points, the production process scored 3 points, and its technical representation scored 3 points.
In summary, its scientific and technical score is 10 (possible total score is 12), and its final score is 0.31 as calculated by combining each weighting (Table 14).

5.2.3. Cultural Values

In terms of positive energy value, Shaanxi Steel Factory’s enterprising spirit and steel factory culture reflect the ideology, values, and overall cultural identity of the employees within the steel factory. The corporate culture and spirit play a role in passing on the history of the company, uniting the industry’s spirit of struggle, and promoting positive energy in society.
From the negative energy value, the Shaanxi Steel Factory is representative of the early stage of China’s modern industrial development, when the industrial development path was difficult [95,100]. Nevertheless, Shaanxi Steel Factory went down in history in the iron and steel development of China [17,95]. This in turn inspired people’s passion for work and life.
In terms of neutral energy value, Shaanxi Steel Factory is able to enhance the sense of regional pride and regional identity of the neighbouring residents. According to the evaluation criteria, its positive energy value is 3 points, its negative energy value is 1, and its neutral value is 1 point. Therefore, the cultural value score is 6 (total possible score is 12), and by combining the weights, its final score is 0.40 (Table 15).

5.2.4. Artistic Value

Most of the industrial elements left over from Shaanxi Steel Factory have been reused and turned into large landscape sculptures in the park, blending industrial style with a cultural and creative atmosphere to form supporting facilities with industrial characteristics. Shaanxi Steel Factory was built in 1958 by the Chinese government by inviting experts from all walks of life from Shanghai, Wuhan, and Northeast China [18,57,95]. The architectural style of the building is simple and atmospheric, retaining the exposed structures of the original steelworks such as steel frames, concrete beams, and pipes. It represented the highest level of Chinese architecture and planning at that time, reflecting the changes in people’s aesthetic interest and art appreciation level. According to the evaluation criteria, the landscape aesthetic value scores 3. The value of artwork is scored as 3, and the level of artistic style expression is scored as 3.
To sum up, the artistic value score is 9 (out of a total of 12), and the final score is 0.53 when combining the weights of each item (Table 16).

5.2.5. Location Values

Shaanxi Steel Factory is located in the eastern part of Xi’an, only 9 km away from the city centre according to Google Maps, with a clear traffic advantage and good access to the city centre, surrounded by five municipal main roads. There are five bus stops and two metro stations in the vicinity, making for a well-developed transport system. There are many tourist attractions within a 100 km radius, such as the Xi’an Terracotta Warriors and Horses Museum and the Dahua 1935 Art District. According to the evaluation criteria, distance from the city centre scores 3, the transport situation to the city centre scores 4, and, in a wider regional context, the number of central cities or tourist areas scores 4. In summary, its location score is 11 (out of a total score of 12), and by combining the weighted items, its final score is 0.29 (Table 17).

5.2.6. Environmental Value

Shaanxi Steel Factory has retained most of the trees and shrubs of the original park during the regeneration process to reduce the damage to the original ecological balance of the park, and the factory is relatively well landscaped, with no obvious pollution detected during the assessment period. However, since the site is adjacent to the campus of Xi’an University of Architecture and Technology and the residential area of Huaqing Xuefu property, it is necessary to pass through the campus to reach the park, and accessibility is relatively limited. According to the evaluation criteria, the environmental impact of the original production function of the industrial heritage is scored as 3. The environmental scope of the industrial heritage is scored as 1. To summarise, the environmental value has a score of 4 (out of a total score of 8), and, combining the weights, its final score is 0.07 (Table 18).

5.2.7. Group Value

Shaanxi Steel Factory is located in the southeastern part of Xi’an, and together with the neighbouring building material component factories and the Oriental Machinery Factory, it constitutes a traditional industrial zone in Xi’an [57]. There are also science- and technology-based industrial parks such as the High-Tech Development Zone and the New Town Technology Industrial Park on the southwestern side. According to the evaluation criteria, it scores 4 points in terms of the scale of the group; 2 points in terms of the group relationship, as it belongs to the large industrial category with high accessibility; and 4 points in terms of the potential for a large-scale group of industrial heritage. In sum, the group value for Shaanxi Steel Factory is 10 points (out of a total of 12 points), and its final score is 0.15 when combining all the weights (Table 19).

5.2.8. Social Value

Shaanxi Steel Factory is currently being transformed into the Old Steel Factory Creative Park. The park has formed an industrial model combining offices and commerce. Through field research, it was found that there are more than 140 shops in total, having about 2500 employees, forming the most distinctive cultural and creative industry base in Xi’an, with a high reputation in the industry. The site includes a museum called Steelmark, which provides a basic understanding of Xi’an’s industrial history and the production process of steel products, but it lacks interactive and experiential programmes. There are badminton and table tennis courts on the site for recreation. The reuse of Shaanxi Steel Factory has changed the old site’s image of being a depressed and dilapidated place, and it has improved the quality of the surrounding environment. The renovation did not change the original appearance but preserved it and established a museum to allow people to better understand the culture and history of the old site, leaving an original landmark urban space for the city. According to the assessment criteria, the ability to solve the re-employment problem was scored as 3, its educational function was scored as 2, its potential to provide a place of leisure for the public was scored as 3, and the score in terms of enhancing the city’s image or symbolic significance was scored as 3. In summary, the social value score is 11 (out of a possible total of 16), and combining the weights of the items gives it a final score of 0.113 (Table 20).

5.2.9. Emotional Value

Older workers generally aged between 60 and 80 years old have the strongest feelings for Shaanxi Steel Factory, as they have given their time and energy to the factory for decades and attribute much emotional value to it. In addition, residents who have lived in the neighbourhood for many years, who have personally witnessed the changes in the factory, have a sense of affinity to the neighbourhood. Relatives of some of the factory’s employees and workers currently working in the reused factory, whose feelings towards the factory site include curiosity and some affection, as well as researchers or industrial heritage enthusiasts who are interested in industrial heritage, have an interest in Shaanxi Steel Factory.
Therefore, combining the evaluation criteria, the number of people who have an emotional connection to industrial heritage scored 2 points, the age range of the people who have an emotional connection to industrial heritage scored 4 points, and the structural characteristics of the careers of people with emotional value scored 3 points.
Therefore, the emotional value of Shaanxi Steel Factory is 9 points (out of a total score of 12), and combining the weights of the items, its final score is 0.15 (Table 21).

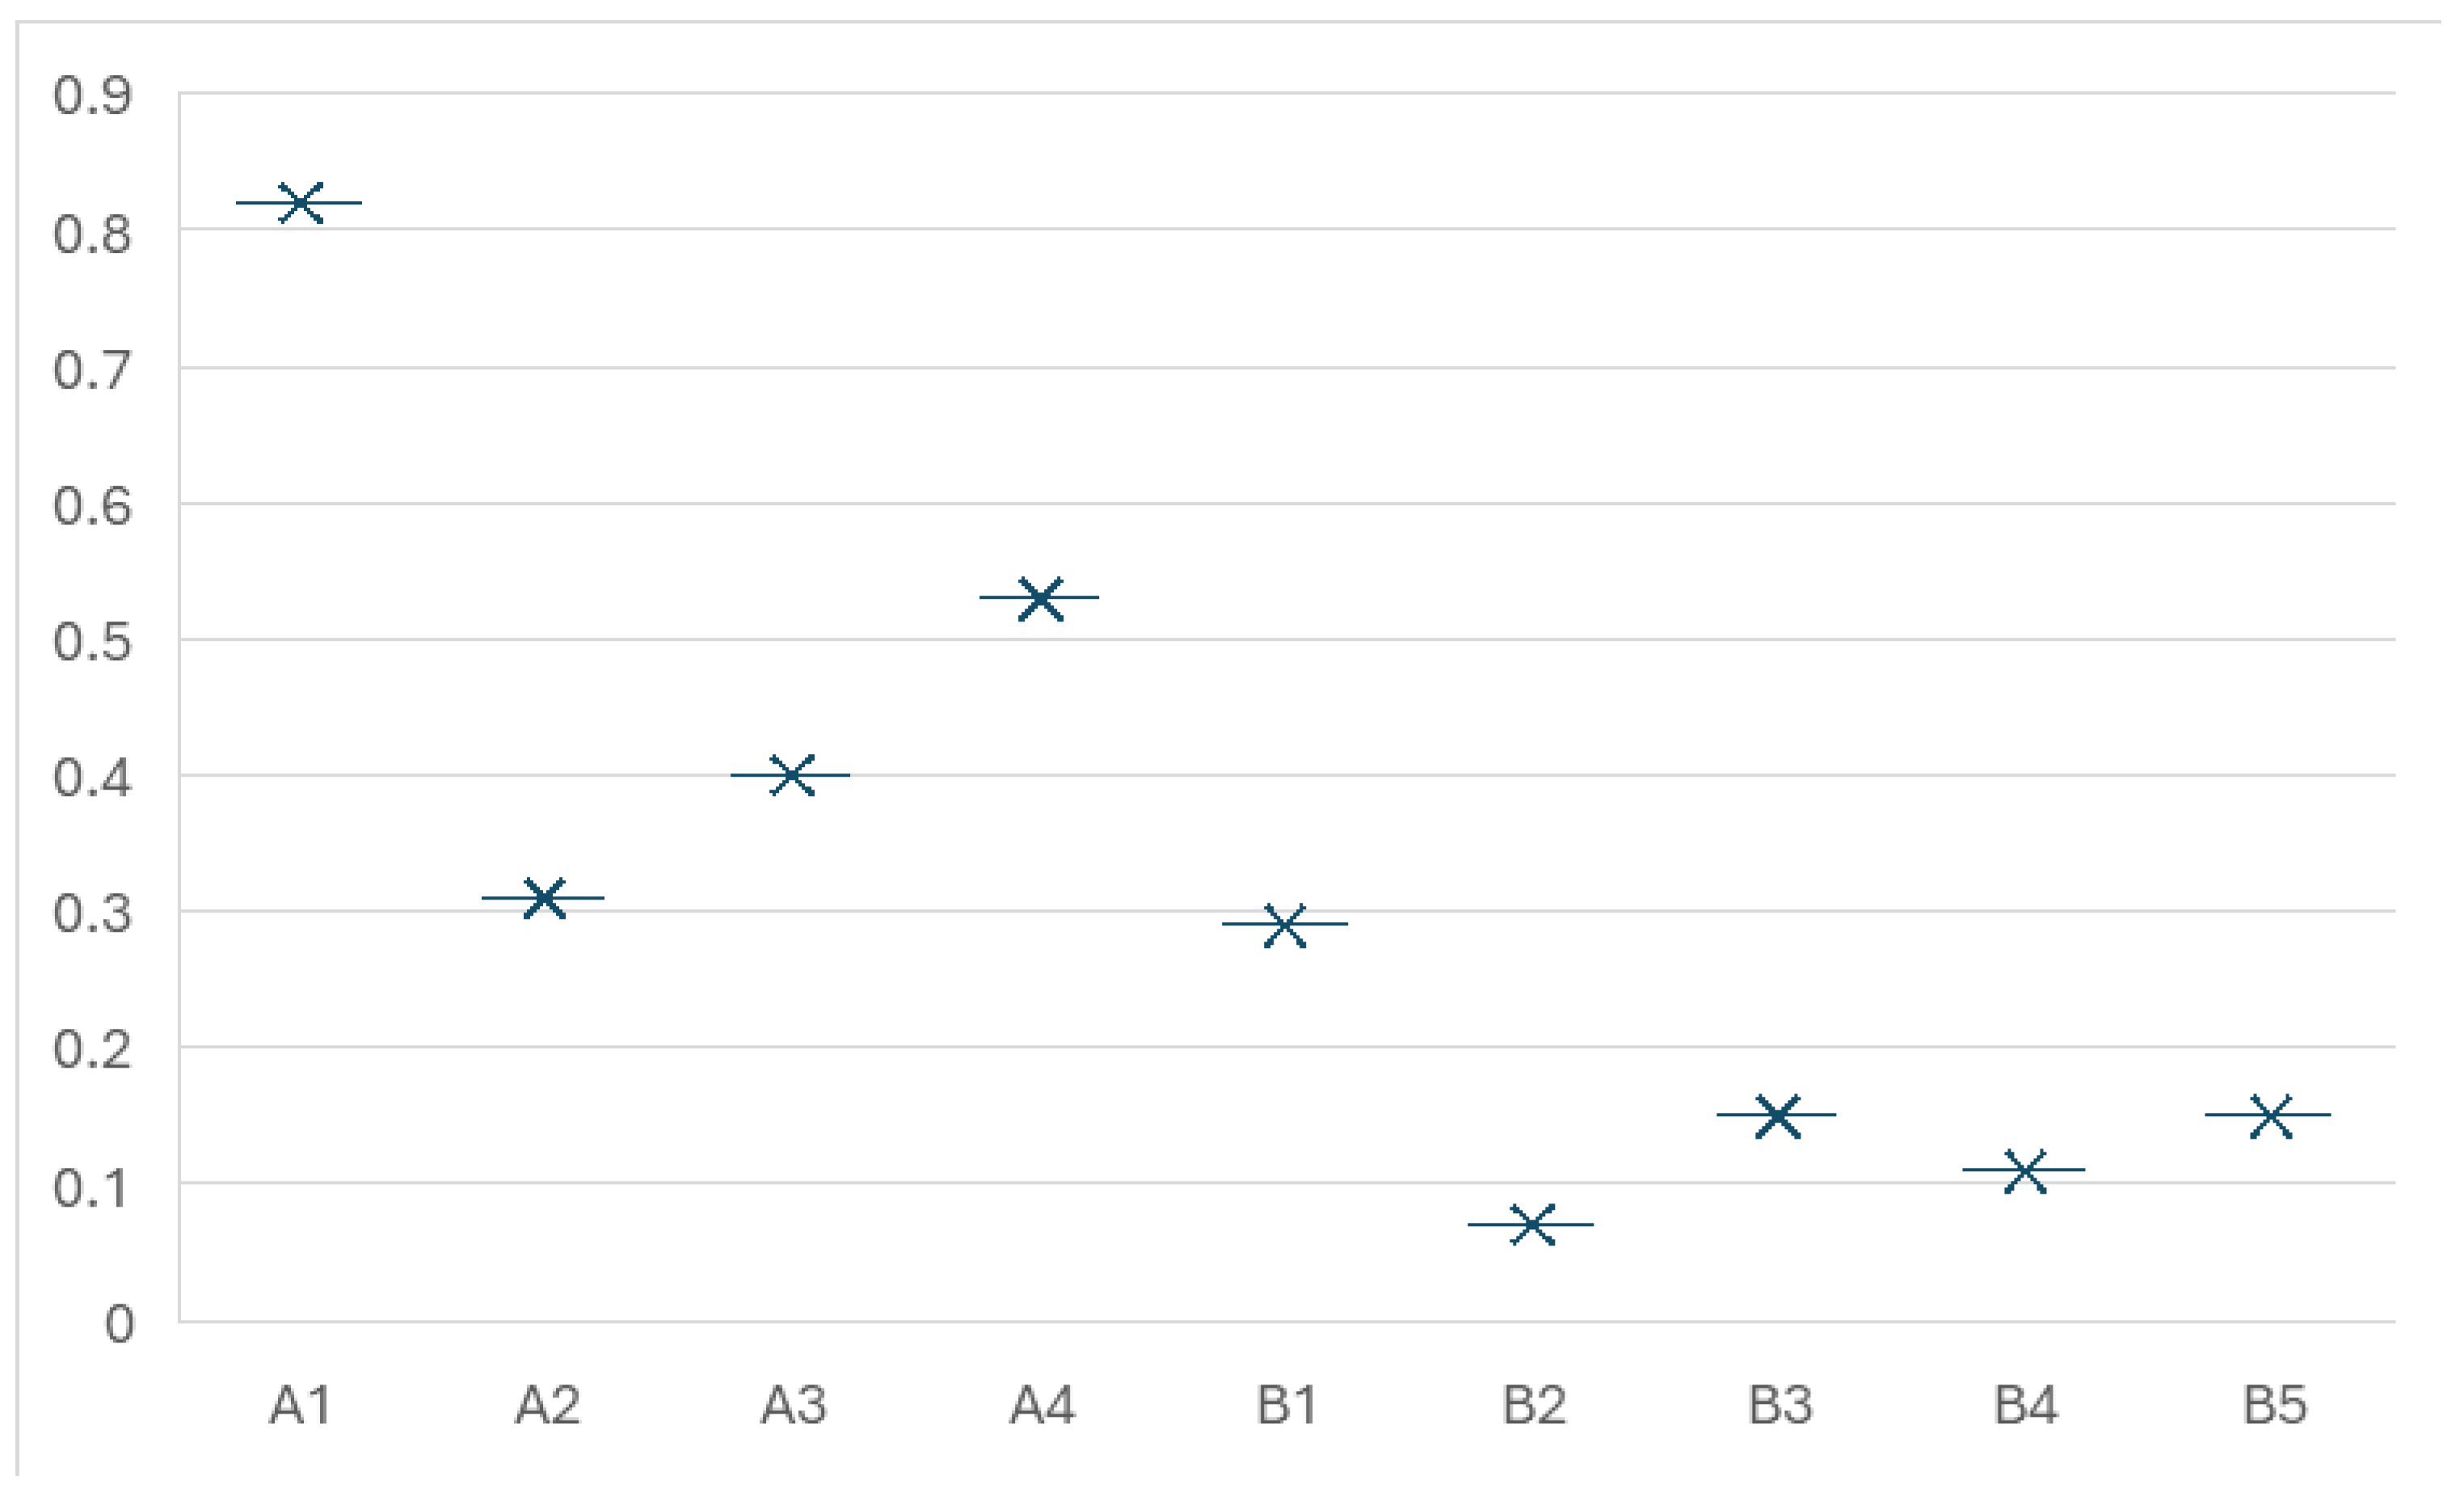
5.3. Analysis of Results

A summary table of the value scores (Figure 7) shows that the historical and artistic values in the ontological value of Shaanxi Steel Factory are more prominent, and the environmental and social values are relatively low. A comprehensive and objective understanding of the value composition and value evaluation of Shaanxi Steel Factory will be carried out to highlight the true value of the industrial heritage by focusing on targeted protection while carrying out protective reuse of it.
From the data, the A1 historical value of Shaanxi Steel Factory (0.82) is significantly higher than other indicators. This indicates that heritage has a prominent position in the transmission of industrial history and memory. Meanwhile, the A4 artistic value (0.53) and A3 cultural value (0.40) are more important, showing that the factory also has a greater potential for industrial aesthetics and cultural inheritance. In contrast, the A2 scientific and technological value is only 0.31, reflecting a weaker contribution in terms of technological innovativeness or industrial technological evolution, while the B2 environmental value is only 0.07, suggesting that the existing ecological conditions require improvement. In addition, among the external environment indicators, the B1 location value (0.29) indicates a certain advantage of its geographical location. However, B3 group, B4 social, and B5 emotional values are low (0.15, 0.11, and 0.15, respectively). This shows the need for upgrading in terms of urban functioning and community identity. The results are consistent with the field study, and the practicality of the methodology of this study is tested.
Based on the above evaluation results, combined with the problems identified in the field research, the following targeted optimisation and renovation strategies are proposed to enhance the conservation value and reuse the potential of the industrial heritage.

5.3.1. Enhancing Environmental Value and Optimising Spatial Experience

The low environmental value evaluation result (0.07) shows that the ecological environment and facilities of the site still need to be improved. Therefore, the following measures should be taken to improve the environment of the site.
Optimising transport accessibility: Currently, public transport connections to the park are inadequate. It is recommended to set up more direct bus lines between the industrial park and the nearest metro station to improve travelling convenience.
Improving parking and shared mobility facilities: This research found that there are insufficient parking spaces in the park, and there is a lack of planning for bicycle and shared bike parking areas. It is recommended to expand the parking area and set up standardised bicycle parking spots to meet the needs of employees and visitors.
Upgrading environmental management: there are many eateries in the park, and the waste disposal capacity needs to be further optimised to ensure cleanliness.

5.3.2. Strengthening Social Interaction and Enhancing Cultural Identity

Industrial heritage is not only a witness of history but should also be an important carrier of urban cultural vitality [3]. Therefore, the interaction between people and heritage should be strengthened in various ways to increase social value (the current score is only 0.11) to promote the public’s sense of identity and sense of belonging to industrial heritage.
Creating cultural publicity and experiential activities: for example, organising exhibitions, forums, or study activities on the topic of the ‘Spirit of Industrial Culture in Shaanxi steel factory’. This could enhance the public’s understanding of the history of industrial culture and stimulate a sense of cultural pride.
Construction of interactive display space: Combining modern display technology, an interactive industrial heritage exhibition area could be set up in the park. For example, digital projection and VR experiences will enable visitors to have a more intuitive understanding of the history and craftsmanship of the steel industry.
Provide space for diversified public activities: In the upgrading of the factory, leisure areas should be preserved to increase public participation, so that the industrial heritage could become an important place for social activities and community integration.

5.3.3. Creating an Industrial Atmosphere and Enhancing Artistic and Group Values

Shaanxi Steel Factory has relatively high artistic value (0.53) and cultural value (0.40), indicating that the factory has some potential in industrial aesthetics and cultural heritage. To further strengthen its cultural influence and group value (currently only 0.15), the following strategies could be adopted:
Connecting with neighbouring industrial heritage and building heritage group effect: Combined with other industrial heritage resources in Shaanxi Province, establish thematic excursion routes or cultural study bases. This could enhance the overall recognition and sense of value.
Through the above strategies, the industrial heritage improvement of Shaanxi Steel Factory not only enhances its ecological and infrastructural conditions but also effectively improves its social and cultural influence. This enables it to play a greater role in urban renewal and cultural heritage.

6. Discussion

To achieve the construction of a value evaluation method applicable to industrial heritage in Shaanxi Province. The research has carried out four stages in sequence: theoretical preparation, indicator screening, weight calculation, and system application. The drivers, barriers, and achievements of each stage are discussed below.

6.1. Theoretical Preparation Stage

1.
Drivers:
In the context of rapid urban development, there is an increasing demand for the practice of industrial heritage protection [3,104]. However, the current evaluation aspects are more qualitative than quantitative in methodology, the indicator system is not uniform, and it is difficult to operate in practice [12,105]. Therefore, to address the above issues, this study expects to construct an industrial heritage value evaluation method that is well supported theoretically, clearly structured, and applicable to the local context. This is also the primary driver of this study in the theoretical phase.
2.
Barriers:
The main barriers at this stage are the selection of the methods and the design of the system structure. On the one hand, it is necessary to select an evaluation method that is both theoretically mature and practicable; on the other hand, it is necessary to design an evaluation structure that is logically reasonable, clearly hierarchical, and considers multiple values. Therefore, in the theoretical preparation stage, this study first organised the current development of the value composition of industrial heritage. It identified history, culture, technology and art as the value indicators [5,9,51,95]. The principle of value indicator selection is clarified, and social, emotional, and group values are introduced as supplementary indicators and subdivided. The coverage of the evaluation framework is improved.
In this paper, based on previous studies, combined with the current situation of industrial heritage in Shaanxi Province, the evaluation methods were compared. Although multi-criteria decision-making methods such as fuzzy AHP, BWM, FN-MABAC, and RANCOM show strong theoretical advantages in the evaluation of complex systems, they require high data quality, computational ability, and operational expertise [5,9,51,95]. Considering that the AHP method has a mature theoretical foundation and rich empirical results in the field of heritage and social sciences [56,64,101], its structure is simple, logical and transparent, and the calculation process is clear and easy to understand. It is also suitable for multi-level and comparable value evaluation situations. Therefore, it is selected as the main method in this study. To reduce the possible subjectivity of the AHP in the indicator determination step, this study introduces the Delphi method. It can be used as an additional tool for initial factor selection through expert counselling.
3.
Achievements
The achievement of this stage is the initial construction of an indicator system divided into four levels, including the objective, feature, factor, and detail levels, covering the intrinsic value and potential value of industrial heritage and subdividing them. In the selection of indicators, the six principles of integrality, representativeness, feasibility, scientificity, comprehensiveness, and regional uniqueness were specified. It ensures that the evaluation factors have a theoretical basis and regional adaptability.
In summary, the theoretical preparation stage effectively completes the method selection and structure construction. It provides a clear theoretical framework and logical basis for indicator selection, weighting, and subsequent application.

6.2. Indicator Selection Stage

1.
Drivers:
The driver of this phase is to ensure that the evaluation indicator system is scientific, practical, and regionally adaptable. This study adopted the Delphi method to select and refine the indicators through an expert consultation. A total of 20 experts from the fields of industrial heritage, architectural conservation, and cultural studies were invited through two rounds of anonymous questionnaires. The preliminary constructed indicators were rated for importance and feedback.
2.
Barriers:
The Delphi method also faces many barriers in the application process. The main problems include the subjectivity of experts’ judgement, the long period of information coordination and feedback, and the uncertainty of the number of rounds needed to reach consensus [64,86,90]. In this study, the results of expert scoring were tested for statistical consistency by introducing the expert authority coefficient and combining Kendall’s W and p-values. The two rounds of scoring showed that the expert opinions were well coordinated and statistically significant, thus ensuring the scientificity and stability of the final indicator system.
3.
Achievements
After repeated consultations and corrections, the complete industrial heritage value evaluation system was finally constructed. It contains one objective layer, two feature layers, nine factor layers, and thirty detail layers. The system has good generality and can provide a reference basis for related research in other regions. In summary, the evaluation indicator base with stable structure and regional adaptability was constructed through the combination of expert consultation and quantitative testing in the indicator screening stage. It provides strong support for the weight calculation of the AHP model.

6.3. Weight Calculation Stage

1.
Drivers:
In constructing a scientific and reasonable industrial heritage value evaluation system, the determination of indicator weights is essential [3,9]. As a widely used multi-criteria decision-making tool, the AHP is widely used in the fields of value assessment, management decision-making, and resource allocation due to its clear structure, rigorous logic, and intuitive operation [21,64,101]. The method can not only effectively express the expert’s judgement on the importance of each indicator but also transform subjective experience into quantitative results. This study introduces the AHP to construct a judgement matrix based on the indicator system constructed by the Delphi method in the previous stage. It is used to further quantify the relative importance of each value factor to enhance the scientific and practicality of the value system.
2.
Barriers:
This stage also faces several barriers. On the one hand, the AHP method has some limitations. For example, it may have the problem of ‘Rank Reversal’ in decision-making [107,108]. That is, adding or deleting options may cause the original ranking to change. In this study, the risk of rank reversal is low because the indicators have been screened in the previous session and the judgement matrix is only used to calculate the weights.
In addition, this study provides a comprehensive evaluation framework based on the AHP. The consistency of the assessment structure was tested, and its stability was verified in the study. However, validation was performed through traditional pairwise comparisons. This can be tested and enhanced in the future by incorporating more detailed statistical validation of consistency within the AHP framework. Other, unavoidable personal preferences in expert scoring may still have an impact on the weighting of some indicators. Moreover, detailed sensitivity validation of the weights of the indicators is not currently performed. This makes it difficult to precisely quantify the specific impact of nuanced weight adjustments on the overall evaluation results. These issues suggest that in practical application, it is necessary to further explore how to reduce subjective interference by improving data collection and analysis methods. Also, it is possible to strengthen the tracking and assessment of the impact of weight fluctuations. This would help further confirm whether the evaluation structures are stable under minor variations in expert judgement, further enhancing the credibility of the results. Furthermore, the introduction of multi-method comparisons such as BWM and FN-MABAC is still recommended in future studies. This is to further verify the stability of the weight distribution and the reliability of the results.
3.
Achievements
Finally, this study constructs a set of weighting systems with a clear structure, consistent logic, and good expert consensus. The system satisfies the consistency requirement in theory and has good operability in practice. The combination of the AHP and the Delphi method is a complementary advantage of qualitative judgement and quantitative reasoning. It provides a reliable foundation for subsequent method application.

6.4. System Application Stage

1.
Drivers:
In the context of rapid urbanisation and regional regeneration, the need for industrial heritage preservation and reuse is increasing. Shaanxi Steel Factory, as a representative of China’s industrial heritage, has a rich historical background and unique industrial cultural characteristics. It can reflect the common problems of industrial heritage in urban renewal and economic development. The case provides us with an ideal test object. It not only verifies the effectiveness of the evaluation system, but it also provides solid data support for translating the evaluation results into specific conservation and reuse strategies.
2.
Barriers:
This study mainly focuses on constructing a value evaluation system for industrial heritage, exploring and identifying its multiple values. The feasibility of the system is verified in the case of Shaanxi Steel Factory. The question of how to apply the results of the quantitative evaluation into concrete and actionable conservation and reuse measures needs to be further explored. Moreover, this study is based on a single case, analysing Shaanxi Steel Factory, and has not yet been compared transversally with other industrial heritage assessment studies or actual conservation results. Therefore, the broad applicability and robustness of the methodology still need to be further verified.
In addition, it is worth noting that the reuse of industrial heritage needs to be wary of over-commodification [12]. In the case of Shaanxi Steel Factory, cultural and creative product development and tourism promotion can create economic benefits. However, if the architectural structure is overly modified or detached from history, the core cultural connotation of the heritage may be weakened. In addition, adaptive reuse needs to be combined with the results of value evaluation; for example, spaces with outstanding historical value should be prioritised for planning as cultural exhibition areas rather than commercial facilities.
3.
Achievements
Through field research and data collection, this study provides comprehensive value evaluation of Shaanxi Steel Factory. The results show that the heritage is outstanding in terms of historical and artistic values, while scoring low in social, emotional, group, and environmental aspects. Based on these data, this study initially proposes reuse strategies including enhancing public transport accessibility, strengthening cultural display facilities, and enriching social participation mechanisms. These strategies provide a scientific basis for improving existing conservation measures and optimising heritage functions. Although there are still deficiencies in how to interface the evaluation results with the actual policy system, this case proved that the evaluation system is of good practicality, laying a foundation for its future application in more industrial heritage.

7. Conclusions

This study actively explored the methodology of industrial heritage value evaluation. A multiple evaluation method based on the AHP combined with the Delphi method was proposed. The Delphi method constructed a scientific, reasonable, and operable indicator system through expert consultation. The AHP provided a systematic quantification of the relative importance between indicators. This achieved effective conversion of subjective perception to objective weights. This method integrates the structural and adaptive and balances the qualitative and quantitative. It is a feasible tool under current hierarchical evaluation needs. In terms of practical evidence, this paper took Shaanxi Steel Factory as an example and constructed and applied a four-level evaluation framework. This study not only shows the differences in the weights of different values (e.g., historical values are significantly higher than emotional and environmental values) but also proposes differentiated conservation and reuse strategies. It emphasises the historical display and cultural experience, combined with environmental improvement and community participation, which promote the revival of heritage resources. This study provides methodological support for the scientific evaluation and management practice of industrial heritage. It also offers a theoretical basis for local government’s cultural space planning and policy design.
Although this study successfully validated the feasibility of the AHP method, there are some limitations. Firstly, this study did not include a sensitivity analysis to fully understand the impact of weighting changes on the evaluation results. Secondly, the subjectivity of expert evaluation still exists. This study did not cross-validate with other industrial heritage evaluations or actual protection results. These problems might place some limitations on the universality of the evaluation results.
To address these concerns, future research may develop in the following ways. Firstly, sensitivity analyses and more detailed consistency tests could be introduced. These could be used to improve the stability of the system by testing the effect of weight changes on the results. Empirical validation should also be strengthened. For example, the applicability of the evaluation framework in different regions and types of industrial heritage could be tested through cross-regional and multi-case comparisons. Comparative studies with other emerging methods may also be conducted to verify the validity of the evaluation framework. In addition, future research could further explore how to develop a hierarchy of evaluation results, what measures should be given to each value range, and how to develop a clear implementation programme. Moreover, the visualisation of the value of industrial heritage can be explored based on this research combined with GIS information management techniques. Finally, subsequent research can delve into the commercialisation and adaptive reuse of industrial heritage in the context of rapid urbanisation. This would ensure a balance between economic benefits and social development while protecting cultural heritage.
In conclusion, this study provides a scientific methodology for the evaluation of the value of industrial heritage. It also provides actionable, strategic recommendations for conservation and reuse practices. Despite the limitations, the theoretical and empirical results provide a theoretical basis for the formulation of industrial heritage conservation policies and urban regeneration. Future work will promote the sustainable development of industrial heritage based on further improving the methodology and expanding the empirical cases. It will provide a more scientific and comprehensive decision-making basis for urban renewal and industrial heritage policymaking.

Author Contributions

This paper has been written by W.L. with supervision by B.D. W.L.: Conceptualization; methodology; software; formal analysis; investigation; data curation, writing—original draft preparation; B.D.: Writing—review and editing; supervision; project administration; validation. All authors have read and agreed to the published version of the manuscript.

Funding

This research received no external funding.

Institutional Review Board Statement

This study was approved by the University Ethics Committee (institutional review board equivalent, UEC) of the University of Strathclyde (details of the protocol available at https://www.strath.ac.uk/ethics/, accessed on 1 March 2025).

Informed Consent Statement

Informed consent was obtained from all the subjects involved in this study.

Data Availability Statement

Data are contained within the article. The specific process of calculation can be found in W.L.’s PhD thesis.

Acknowledgments

This study is part of W.L.’s research. We would like to thank each participant in the field study.

Conflicts of Interest

The authors declare no conflicts of interest.

Abbreviations

The following abbreviations are used in this manuscript:
AHPAnalytic Hierarchy Process
ANPAnalytical Network Process
BWMBest–Worst Method
CVMConditional Value Method
DCEThe Discrete Choice Experiment
DEMATELDecision-Making Trial and Evaluation Laboratory)
FN-MABACFuzzy Normalisation-based Multi-Attributive Border Approximation area Comparison
ICOMOSThe International Council on Monuments and Sites
MCDMMulti-Criteria Decision-making Methods
RANCOMRanking Comparison
SITW Stochastic Identification of Weights
TICCIHThe International Committee for the Conservation of Industrial Heritage
TOPSISTechnique for Ordering Similarity to Ideal Solutions
UNESCOThe United Nations Educational, Scientific and Cultural Organisation

Appendix A. Specific Calculation Process for Weights

According to the 1–9 scale method, the meaning and description of the numerical scale are shown in Table 4. The actual situation of the questionnaire consultation is collated, according to the comparison of the importance of each indicator, to obtain the judgement matrix of the feature layer (Table A1). The numbers in the matrix are calculated by rounding off the arithmetic average of the questionnaire results.
The first question was about the important relationship between feature layers (intrinsic value and derived value). Based on the comparison of the indicators’ importance received from the questionnaire, the judgement matrix of the feature layer is obtained.
Table A1. Judgement matrix of the feature layer.
Evaluation IndicatorsAB Wi
A130.7500
B 1/310.2500
From Table A1, λmax = 2.0000, CI = 0.0000, RI = 0, and CR = 0.0000, with satisfactory agreement. The table shows that the intrinsic value is three times that of the derived value, which gives a weighting of 0.75 and 0.25, respectively.
Intrinsic value contains a total of four factor layers (A1 Historical value, A2 Scientific and technological value, A3 Cultural value, and A4 Artistic value).
From Table A2, λmax = 4.0604, CI = 0.0201, RI = 0.9, CR =0.0224, and CR < 0.1, with satisfactory agreement.
Table A2. Judgement matrix for factor layer A.
Evaluation IndicatorsA1 A2 A3A4Wi
A112220.3933
A21/211/21/20.1390
A31/22110.2338
A41/22110.2338
The detailed procedure for calculating the weights of this judgement matrix is as follows:
Calculate the product of the elements of each row of the judgement matrix,
m i = j = 1 b i j = [ 8.0000 ,   0.1250 ,   1.0000 ,   1.0000 ]
Calculate the Nth root of
w i = m i n = [ 1.6818 ,   0.5946 ,   1.0000 ,   1.0000 ]
Normalise the vectors
w i = w i / i = 1 n w i = [ 0.3933 ,   0.1390 ,   0.2338 ,   0.2338 ]
Calculate the maximum eigenvalue
λ max = 1 n i = 1 n B w i w i = 1/4 × 16.2417 = 4.0604
In the formula, Bwi = [1.6067, 0.5695, 0.9424, 0.9424].
The consistency indicator CI is
C I = λ max n n 1 = ( 4.0604 4 ) / ( 4 1 ) = 0.0201
The RI table shows that when the judgement matrix n = 4, the RI is 0.9.
Calculate average consistency
C R = C I R I = 0.0201 / 0.9 = 0.0224 < 0.1 .
It is known to have passed consistency.
Derived value contains a total of five factor layers, which are B1 Location value, B2 Environmental value, B3 Group value, B4 Social value, and B5 Emotional value.
From Table A3, λmax = 5.1359, CI = 0.0340, RI = 1.12, CR = 0.0303, and CR < 0.1, with satisfactory agreement.
Table A3. Judgement matrix for factor layer B.
Evaluation IndicatorsB1 B2 B3 B4 B5Wi
B1 122220.3291
B2 1/2111/21/20.1247
B3 1/211110.1645
B4 1/22111/20.1645
B51/221210.2171
The detailed procedure for calculating the weights of this judgement matrix is shown below.
Calculate the product of the elements of each row of the judgement matrix
m i = j = 1 b i j = [ 16.0000 ,   0.1250 ,   0.5000 ,   0.5000 ,   2.0000 ]
Calculate the Nth root of
w i * = m i n = [ 1.7411 ,   0.6598 ,   0.8706 ,   0.8706 ,   1.1487 ]
Normalise the vectors
w i = w i / i = 1 n w i = [ 0.3291 ,   0.1247 ,   0.1645 ,   0.1645 ,   0.2171 ]
Calculate the maximum eigenvalue
λ max = 1 n i = 1 n B w i w i = 1/5 × 25.6797 = 5.1359
In the formula, Bwi = [1.6709, 0.6446, 0.8355, 0.8516, 1.1247].
The consistency indicator CI is
C I = λ max n n 1 = ( 5.1359 5 ) / ( 5 1 ) = 0.0340
The RI table shows that when the judgement matrix n = 5, the RI is 1.12.
Calculate average consistency
C R = C I R I = 0.0340 / 1.12 = 0.0303 < 0.1 .
It is known to have passed consistency.
The detail layer of historical value contains a total of six factor layers, namely A11 The date of construction of the heritage, A12 Witness to the level of social development, A13 Witness to important events, A14 The addition and completion of historical documents, A15 Uniqueness and scarcity, and A16 Completeness.
From Table A4, λmax = 6.3808, CI = 0.0762, RI = 1.24, CR = 0.0614, and CR < 0.1, with satisfactory agreement.
Table A4. The historical value of the detail layer.
Evaluation IndicatorsA11 A12A13A14A15A16Wi
A111222220.2803
A121/2111/2220.1573
A131/2111/21/21/20.0991
A141/2221210.1982
A15 1/21/221/2120.1402
A16 1/21/2211/210.1249
The detailed procedure for calculating the weights of this judgement matrix is as follows:
Calculate the product of the elements of each row of the judgement matrix
m i = j = 1 b i j = [ 32.0000 ,   1.0000 ,   0.0625 ,   4.0000 ,   0.5000 ,   0.2500 ]
Calculate the Nth root of
w i * = m i n = [ 1.7818 ,   1.0000 ,   0.6300 ,   1.2599 ,   0.8909 ,   0.7937 ]
Normalise the vectors
w i = w i / i = 1 n w i = [ 0.2803 ,   0.1573 ,   0.0991 ,   0.1982 ,   0.1402 ,   0.1249 ]
Calculate the maximum eigenvalue
λ max = 1 n i = 1 n B w i w i = 1/6 × 38.2849 = 6.3808
In the formula, Bwi = [1.7197, 1.0258, 0.6282, 1.2564, 0.9060, 0.8102].
The consistency indicator CI is
C I = λ max n n 1 = ( 6.3808 6 ) / ( 6 1 ) = 0.0762
The RI table shows that when the judgement matrix n = 6, the RI is 1.24.
Calculate average consistency
C R = C I R I = 0.0762 / 1.24 = 0.0614 < 0.1 .
It is known to have passed consistency.
The detail layer of scientific and technological value contains a total of three factor layers (A21 Industrial buildings and equipment, A22 Production processes, and A23 Technological representativeness).
From Table A5, λmax = 3.0536, CI = 0.0268, RI = 0.58, CR = 0.0462, and CR < 0.1, with satisfactory agreement.
Table A5. The scientific and technological value of the detail layer.
Evaluation IndicatorsA21 A22A23Wi
A211220.4934
A221/211/20.1958
A23 1/2210.3108
The detailed procedure for calculating the weights of this judgement matrix is as follows:
Calculate the product of the elements of each row of the judgement matrix
m i = j = 1 b i j = [ 4.0000 ,   0.2500 ,   1.0000 ]
Calculate the Nth root of
w i * = m i n = [ 1.5874 ,   0.6300 ,   1.0000 ]
Normalise the vectors
w i = w i / i = 1 n w i = [ 0.4934 ,   0.1958 ,   0.3108 ]
Calculate the maximum eigenvalue
λ max = 1 n i = 1 n B w i w i = 1/3 × 9.1609 = 3.0536
In the formula, Bwi = [1.5066, 0.5979, 0.9491].
The consistency indicator CI is
C I = λ max n n 1 = ( 3.0536 3 ) / ( 3 1 ) = 0.0268
The RI table shows that when the judgement matrix n = 3, the RI is 0.58.
Calculate average consistency
C R = C I R I = 0.0268 / 0.58 = 0.0462 < 0.1 .
It is known to have passed consistency.
The detail layer of cultural value contains a total of three layers (A31 Positive energy value, A32 Negative energy value, and A33 Neutral energy value).
From Table A6, λmax = 3.0536, CI = 0.0268, RI = 0.58, CR = 0.0462, CR < 0.1, with satisfactory agreement.
Table A6. The cultural value of the detail layer.
Evaluation IndicatorsA31 A32 A33 Wi
A31 1220.4934
A32 1/211/20.1958
A33 1/2210.3108
The detailed procedure for calculating the weights of this judgement matrix is as follows:
Calculate the product of the elements of each row of the judgement matrix
m i = j = 1 b i j = [ 4.0000 ,   0.2500 ,   1.0000 ]
Calculate the Nth root of
w i * = m i n = [ 1.5874 ,   0.6300 ,   1.0000 ]
Normalise the vectors
w i = w i / i = 1 n w i = [ 0.4934 ,   0.1958 ,   0.3108 ]
Calculate the maximum eigenvalue
λ max = 1 n i = 1 n B w i w i = 1/3 × 9.1609 = 3.0536
In the formula, Bwi = [1.5066, 0.5979, 0.9491].
The consistency indicator CI is
C I = λ max n n 1 = ( 3.0536 3 ) / ( 3 1 ) = 0.0268
The RI table shows that when the judgement matrix n = 3, the RI is 0.58.
Calculate average consistency
C R = C I R I = 0.0268 / 0.58 = 0.0462 < 0.1 .
It is known to have passed consistency.
The detail layer of artistic value contains a total of three factor layers (A41 Aesthetic landscape value, A42 The value of the artwork, and A43 The level of artistic style expression).
From Table A7, λmax = 3.0536, CI = 0.0268, RI = 0.58, CR = 0.0462, CR < 0.1, with satisfactory agreement.
Table A7. The artistic value of the detail layer.
Evaluation IndicatorsA41 A42 A43 Wi
A41 1220.4934
A42 1/211/20.1958
A43 1/2210.3108
The detailed procedure for calculating the weights of this judgement matrix is as follows:
Calculate the product of the elements of each row of the judgement matrix
m i = j = 1 b i j = [ 4.0000 ,   0.2500 ,   1.0000 ]
Calculate the Nth root of
w i * = m i n = [ 1.5874 ,   0.6300 ,   1.0000 ]
Normalise the vectors
w i = w i / i = 1 n w i = [ 0.4934 ,   0.1958 ,   0.3108 ]
Calculate the maximum eigenvalue
λ max = 1 n i = 1 n B w i w i = 1/3 × 9.1609 = 3.0536
In the formula, Bwi = [1.5066, 0.5979, 0.9491].
The consistency indicator CI is
C I = λ max n n 1 = ( 3.0536 3 ) / ( 3 1 ) = 0.0268
The RI table shows that when the judgement matrix n = 3, the RI is 0.58.
Calculate average consistency
C R = C I R I = 0.0268 / 0.58 = 0.0462 < 0.1 .
It is known to have passed consistency.
The detail layer of location value contains a total of three factor layers (B11 Distance from the city centre, B12 Transport situation to the city centre, and B13 The number of central cities or tourist areas in the wider regional context).
From Table A8, λmax = 3.0536, CI = 0.0268, RI = 0.58, CR = 0.0462, CR < 0.1, with satisfactory agreement.
Table A8. The location value of the detail layer.
Evaluation IndicatorsB11B12B13Wi
B111220.4934
B12 1/211/20.1958
B13 1/2210.3108
The detailed procedure for calculating the weights of this judgement matrix is as follows:
Calculate the product of the elements of each row of the judgement matrix
m i = j = 1 b i j = [ 4.0000 ,   0.2500 ,   1.0000 ]
Calculate the Nth root of
w i * = m i n = [ 1.5874 ,   0.6300 ,   1.0000 ]
Normalise the vectors
w i = w i / i = 1 n w i = [ 0.4934 ,   0.1958 ,   0.3108 ]
Calculate the maximum eigenvalue
λ max = 1 n i = 1 n B w i w i = 1/3 × 9.1609 = 3.0536
In the formula, Bwi = [1.5066, 0.5979, 0.9491].
The consistency indicator CI is
C I = λ max n n 1 = ( 3.0536 3 ) / ( 3 1 ) = 0.0268
The RI table shows that when the judgement matrix n = 3, the RI is 0.58.
Calculate average consistency
C R = C I R I = 0.0268 / 0.58 = 0.0462 < 0.1 .  It is known to have passed consistency .
The detail layer of environmental value contains a total of two factor layers (B21 The impact of the original production function of industrial heritage on the environment and B22 The environmental scope of the industrial heritage).
From Table A9, λmax = 2.0000, CI = 0.0000, RI = 0, and CR = 0.0000, with satisfactory agreement.
Table A9. The environmental value of the detail layer.
Evaluation IndicatorsB21 B22 Wi
B21 120.6667
B221/210.3333
The table shows that the B21 is twice as large as B22, which gives a weighting of 0.67 and 0.33, respectively.
The detail layer of group value contains three factor layers (B31 The scale of the group, B32 Relationship of the group, and B33 The potential for wide-scale groups of industrial heritage).
From Table A10, λmax = 3.0536, CI = 0.0268, RI = 0.58, CR = 0.0462, and CR < 0.1, with satisfactory agreement.
The detailed procedure for calculating the weights of this judgement matrix is as follows:
Table A10. The group value of the detail layer.
Evaluation IndicatorsB31 B32 B33 Wi
B31 1220.4934
B32 1/211/20.1958
B33 1/2210.3108
Calculate the product of the elements of each row of the judgement matrix
m i = j = 1 b i j = [ 4.0000 ,   0.2500 ,   1.0000 ]
Calculate the Nth root of
w i * = m i n = [ 1.5874 ,   0.6300 ,   1.0000 ]
Normalise the vectors
w i = w i / i = 1 n w i = [ 0.4934 ,   0.1958 ,   0.3108 ]
Calculate the maximum eigenvalue
λ max = 1 n i = 1 n B w i w i = 1/3 × 9.1609 = 3.0536
In the formula, Bwi = [1.5066, 0.5979, 0.9491].
The consistency indicator CI is
C I = λ max n n 1 = ( 3.0536 3 ) / ( 3 1 ) = 0.0268
The RI table shows that when the judgement matrix n= 3, the RI is 0.58.
Calculate average consistency
C R = C I R I = 0.0268 / 0.58 = 0.0462 < 0.1 .
It is known to have passed consistency.
The detail layer of social value contains four factor layers (B41 The ability to solve re-employment, B42 Educational function, B43 The potential to provide a place of leisure for the public, and B44 Enhancing the image or symbolism of the city).
From Table A11, λmax = 4.1836, CI = 0.0612, RI = 0.9, CR = 0.0680, and CR < 0.1, with satisfactory agreement.
The detailed procedure for calculating the weights of this judgement matrix is as follows:
Table A11. The social value of the detail layer.
Evaluation IndicatorsB41 B42B43B44Wi
B4112220.3976
B421/21120.2364
B431/2111/20.1672
B441/21/2210.1988
Calculate the product of the elements of each row of the judgement matrix
m i = j = 1 b i j = [ 8.0000 ,   1.0000 ,   0.2500 ,   0.5000 ]
Calculate the Nth root of
w i * = m i n = [ 1.6818 ,   1.0000 ,   0.7071 ,   0.8409 ]
Normalise the vectors
w i = w i / i = 1 n w i = [ 0.3976 ,   0.2364 ,   0.1672 ,   0.1988 ]
Calculate the maximum eigenvalue
λ max = 1 n i = 1 n B w i w i = 1/4   16.7343 = 4.1836
In the formula, Bwi = [1.6024, 1.0000, 0.7018, 0.8502].
The consistency indicator CI is
C I = λ max n n 1 = ( 4.1836 4 ) / ( 4 1 ) = 0.0612
The RI table shows that when the judgement matrix n = 4, the RI is 0.9.
Calculate average consistency
C R = C I R I = 0.0612 / 0.9 = 0.0680 < 0.1 .
It is known to have passed consistency.
The detail layer of emotional value contains three factor layers (B51 Number of people who have an emotional connection to industrial heritage, B52 The age range of the people who have an emotional connection to industrial heritage, and B53 Characteristics of the careers of people with emotional value).
From Table A12, λmax = 3.0536, CI = 0.0268, RI = 0.58, CR = 0.0462, and CR < 0.1, with satisfactory agreement.
The detailed procedure for calculating the weights of this judgement matrix is as follows:
Table A12. The emotional value of the detail layer.
Evaluation IndicatorsB51 B52B53Wi
B511220.4934
B521/2120.3108
B531/21/210.1958
Calculate the product of the elements of each row of the judgement matrix
m i = j = 1 b i j = [ 4.0000 ,   1.0000 ,   0.2500 ]
Calculate the Nth root of
w i * = m i n = [ 1.5874 ,   1.0000 ,   0.6300 ]
Normalise the vectors
w i = w i / i = 1 n w i = [ 0.4934 ,   0.3108 ,   0.1958 ]
Calculate the maximum eigenvalue
λ max = 1 n i = 1 n B w i w i = 1/3 × 9.1609 = 3.0536
In the formula, Bwi = [1.5066, 0.5979, 0.9491].
The consistency indicator CI is
C I = λ max n n 1 = ( 3.0536 3 ) / ( 3 1 ) = 0.0268
The RI table shows that when the judgement matrix n = 3, the RI is 0.58.
Calculate average consistency
C R = C I R I = 0.0268 / 0.58 = 0.0462 < 0.1 .
It is known to have passed consistency.

Appendix B. Evaluation Criteria

Table A13. Evaluation criteria for the value of industrial heritage in Shaanxi.
The Factors LayerThe Detail LayerEvaluation CriteriaScore
A1 Historical valueA11 The date of construction of the heritage(a) before 19114
(b) 1911–19483
(c) 1949–19772
(d) 1978–now1
A12 Witness to the level of social development(a) the beginning and transformation of the industrial age of an entire country4
(b) the industrial development of a particular province or region3
(c) the innovative application of industrial technology in a particular field2
(d) its own existence and decline1
A13 Witness to important events(a) the event or historical person witnessed has a worldwide impact4
(b) the event or historical person witnessed has a national impact3
(c) the event or historical person witnessed has a provincial impact2
(d) the event or historical person witnessed has a regional impact1
A14 The addition and completion of historical documents(a) independent confirmation of the authenticity of a documentary record4
(b) non-independent confirmation of the authenticity of a documentary record3
(c) complementary to the documentary record2
(d) related in some way to the documentary record1
A15 Uniqueness(a) one type in the province or wider area4
(b) less than three similar types within the province3
(c) more than three similar types within a provincial area2
(d) there are many similar types1
A16 Completeness(a) 81–100% complete4
(b) 51–80% complete3
(c) 21–50% complete2
(d) 0–20% complete1
A2 Scientific and technological valueA21 Industrial buildings and equipment(a) can express production technology from a variety of perspectives4
(b) can express the main production technologies of the time3
(c) can express basic functions2
(d) incomplete and represent only a few basic functions1
A22 Production processes(a) can be fully reflected in the industrial equipment4
(b) relatively complete, with a few missing elements3
(c) incomplete, but the core technical aspects can be reflected2
(d) only a small part of the processes of the period can be reflected1
A23 Technological representativeness(a) shows the most advanced industrial technology at the provincial or national level at the time and which has since been widely used4
(b) shows a technology that was commonly used at the provincial level3
(c) shows a technology that has been infrequently used but has been preserved2
(d) very little or no industrial technology has been preserved1
A3 Cultural valueA31 Positive energy value(a) it reflects the great energy of the country and the nation4 points if 4 criteria are met
(b) it reflects the collective spirit of the regional culture
(c) it reflects the pioneering role of the representatives in the industry
(d) it reflects the spirit of struggle based solely on the function of industrial production
A32 Negative energy value(a) negative energy involving national humiliation and insult to national dignity4 points if 4 criteria are met
(b) negative energy involving regional transformation by oppression
(c) the fact of being oppressed by technological backwardness
(d) the fact of an inequality involving former technical cooperation
A33 Neutral energy value(a) its value has a widespread impact on the industry4
(b) its value has a profound impact on a professional system3
(c) its value has a significant impact on a group of people2
(d) its value affects some of the people involved1
A4 Artistic valueA41 Aesthetic landscape value(a) industrial heritage as a whole has outstanding aesthetic value4
(b) some elements of industrial heritage have outstanding aesthetic value3
(c) a few parts of industrial heritage have aesthetic value2
(d) low aesthetic value1
A42 The value of the artwork(a) more than ten artworks4
(b) more than five and less than ten artworks3
(c) more than one and less than five dependent artworks2
(d) one artwork1
A43 The level of artistic style expression(a) the artistic style is obvious and well expressed in detail4
(b) the artistic style is clear and slightly simplified, highlighting the main elements3
(c) it partially reflects a certain artistic style, highlighting some of the key points2
(d) it is an elemental embodiment of a certain artistic style1
B1 Location valueB11 Distance from the city centre(a) it is within the central city4
(b) the distance to the central city is within 10 km3
(c) the distance to the central city is between 10 km and 50 km2
(d) the distance to the central city is above 50 km1
B12 Transport situation to the city centre(a) easy transport links, accessible by three or more modes of transport, with rail links4
(b) relatively easy transport links in the vicinity, accessible by two modes of transport3
(c) smooth and easily accessible roads in the vicinity2
(d) accessible but not convenient, with road links in the vicinity in need of renovation1
B13 The number of central cities or tourist areas in the wider regional context(a) four or more central cities or tourist attractions within a 100 km radius of the industrial heritage4
(b) three central cities or tourist attractions within a 100 km radius of the industrial heritage3
(c) two central cities or tourist attractions within a 100 km radius of the industrial heritage2
(d) one central city or tourist attraction within a 200 km radius of the industrial heritage1
B2 Environmental valueB21 The impact of the original production function of industrial heritage on the environment(a) not polluted during the industrial period4
(b) slightly polluted during the industrial period, but the pollution was no longer present during the value assessment period3
(c) heavily polluted during the industrial period, but the pollution was largely non-existent during the value assessment period2
(d) still suffered pollution during the value evaluation period and required investment in remediation1
B22 The environmental scope of the industrial heritage(a) few site constraints and the potential for improvement is high4
(b) one or several areas are not appropriate for improvement or have some restrictions3
(c) the surrounding area is an old multi-storey residential area or shantytown (generally over twenty years)2
(d) the surrounding site is a new high-rise multi-storey area or a large public building area, resulting in congestion around the industrial heritage site1
B3 Group valueB31 The scale of the group(a) a scale level of five or more4
(b) a scale level of four3
(c) a scale level of three2
(d) a scale level of two1
B32 Relationship of the group(a) they have formed industrial production chains4
(b) they were once part of the same enterprise or factory under a large enterprise or institution3
(c) belong to a large industrial category2
(d) low relationship1
B33 The potential for wide-scale groups of industrial heritage(a) three or more industrial heritage sites; easy access to each other; strong possibility4
(b) three or more industrial heritage sites with access to each other requiring capital investment; a high possibility3
(c) there are two industrial heritage sites with industrial links to each other, a certain possibility2
(d) industrial heritage sites with weak industrial links and transport links to each other, a low possibility1
B4 Social valueB41 The ability to solve re-employment(a) over a hundred people to be employed4
(b) fifty to a hundred people to be employed3
(c) twenty to fifty people to be employed2
(d) less than twenty people to be employed1
B42 Educational function(a) rich in scientific knowledge and display methods, with more than five experiential projects available4
(b) rich in scientific knowledge and display methods, with three to four experiential projects available3
(c) rich in scientific and popular knowledge and presentation, with one or two experiential programmes2
(d) limited in scientific and popular knowledge and presentation, with no experiential programmes1
B43 The potential to provide a place of leisure for the public(a) the public space available has the conditions of a heritage park4
(b) the public space available is similar to a street park regulation3
(c) the public space available can meet the basic requirements of viewing and visitor rest around the industrial heritage landscape2
(d) the places available are limited, but better than before the reuse1
B44 Enhancing the image or symbolism of the city(a) the industrial heritage landscape after reuse has a prominent image and far-reaching meaning, and is the first business card of the city4
(b) the industrial heritage landscape after reuse has a prominent symbolic meaning and is one of the image cards of the city3
(c) the industrial heritage landscape after reuse has a beautiful image and can effectively improve the cultural appearance of the city and the streetscape2
(d) the industrial heritage landscape after reuse has a significantly improved image compared before1
B5 Emotional valueB51 Number of people who have an emotional connection to industrial heritage(a) the number is over 10,0004
(b) the number of people is between two thousand and ten thousand3
(c) the number of people is between two hundred and one thousand2
(d) the number of people is under two hundred1
B52 The age range of the people who have an emotional connection to industrial heritage(a) the age range includes the five categories above4
(b) the age range includes the three to four categories above3
(c) the age range includes the two categories above2
(d) the age range includes the one category above1
B53 Structural characteristics of the careers of people with emotional value(a) people from nearly all careers4
(b) people from the majority of careers around the industrial heritage3
(c) people’s jobs related to the industrial heritage2
(d) few people1

References

  1. Douet, J. Industrial Heritage Re-Tooled: The TICCIH Guide to Industrial Heritage Conservation, 1st ed.; Douet, J., Ed.; Routledge: New York, NY, USA, 2016. [Google Scholar]
  2. Dong, M.; Jin, G. Analysis on the Protection and Reuse of Urban Industrial Architecture Heritage. IOP Conf. Ser. Earth Environ. Sci. 2021, 787, 012175. [Google Scholar] [CrossRef]
  3. Liu, F.; Qiang, W.; Yang, Y.; Song, Z. Evaluation of Silk Industrial Heritage Value Based on IAHP, D-S Theory and Mixed Decision Model: The Case of Hangzhou-Jiaxing-Huzhou in China. J. Asian Archit. Build. Eng. 2024, 23, 1–23. [Google Scholar] [CrossRef]
  4. Nic Craith, M. UNESCO, Cultural Heritage, and Outstanding Universal Value: Value-Based Analyses of the World Heritage and Intangible Cultural Heritage Conventions by Sophia Labadi Lanham: AltaMira, 2013. 204 Pp. Am. Anthropol. 2015, 117, 844–845. [Google Scholar] [CrossRef]
  5. Zhao, Q.; Liu, F.; Qiao, W. Evaluating Industrial Heritage Value Using Cloud Theory and Dempster–Shafer Theory. J. Cult. Herit. 2024, 68, 364–374. [Google Scholar] [CrossRef]
  6. Landorf, C. A Framework for Sustainable Heritage Management: A Study of UK Industrial Heritage Sites. Int. J. Herit. Stud. 2009, 15, 494–510. [Google Scholar] [CrossRef]
  7. Mo, C.; Wang, L.; Rao, F. Typology, Preservation, and Regeneration of the Post-1949 Industrial Heritage in China: A Case Study of Shanghai. Land 2022, 11, 1527. [Google Scholar] [CrossRef]
  8. Niu, S.; Lau, S.S.Y.; Shen, Z.; Lau, S.S.Y. Sustainability Issues in the Industrial Heritage Adaptive Reuse: Rethinking Culture-Led Urban Regeneration through Chinese Case Studies. J. Hous. Built Environ. 2018, 33, 501–518. [Google Scholar] [CrossRef]
  9. Liu, F.; Zhao, Q.; Yang, Y. An Approach to Assess the Value of Industrial Heritage Based on Dempster–Shafer Theory. J. Cult. Herit. 2018, 32, 210–220. [Google Scholar] [CrossRef]
  10. Cano-Sanchiz, J.M.; Wang, D. The Landscapes, Cultures and Heritage Values of Abandoned Mining Sites. Landsc. Archit. 2022, 29, 67–76. [Google Scholar] [CrossRef]
  11. Xie, P.F. A Life Cycle Model of Industrial Heritage Development. Ann. Tour. Res. 2015, 55, 141–154. [Google Scholar] [CrossRef]
  12. Yang, X.; Xu, H.; Wall, G. Creative Destruction: The Commodification of Industrial Heritage in Nanfeng Kiln District, China. Tour. Geogr. 2019, 21, 54–77. [Google Scholar] [CrossRef]
  13. Avrami, E.; Macdonald, S.; Mason, R.; Myers, D. Values in Heritage Management: Emerging Approaches and Research Directions; Getty Publications—Series; J. Paul Getty Trust: Los Angeles, CA, USA, 2019; ISBN 978-1-60606-618-8. [Google Scholar]
  14. Alfrey, J.; Putnam, T. The Industrial Heritage: Managing Resources and Uses, 1st ed.; Routledge: London, UK, 2003; ISBN 978-0-203-39291-1. [Google Scholar]
  15. Labadi, S.; Logan, W. Approaches to Urban Heritage, Development and Sustainability. In Urban Heritage, Development and Sustainability; Routledge: London, UK, 2015; ISBN 978-1-315-72801-8. [Google Scholar]
  16. Sun, Q.C. On the Protection and Utilization of China’s Cultural Heritage in the Digital Age—An Exemplification of Shaanxi Province. J. Ankang Coll. 2015, 27, 87–92. [Google Scholar] [CrossRef]
  17. Feng, R.; Ma, T. Research on the Protection of Modern and Contemporary Urban Industrial Architecture Heritage in Shanxi. In Proceedings of the 3rd International Conference on Architecture: Heritage, Traditions and Innovations (AHTI 2021), Moscow, Russia, 9–10 March 2021; Atlantis Press: Dordrecht, The Netherlands, 2021; pp. 214–223. [Google Scholar]
  18. Liu, Y.; Li, H.; Li, W.; Li, Q.; Hu, X. Value Assessment for the Restoration of Industrial Relics Based on Analytic Hierarchy Process: A Case Study of Shaanxi Steel Factory in Xi’an, China. Environ. Sci. Pollut. Res. Int. 2021, 28, 69129–69148. [Google Scholar] [CrossRef]
  19. Mushtaha, E.; Shamsuzzaman, M.; Abdouli, S.A.; Hamdan, S.; Soares, T.G. Application of the Analytic Hierarchy Process to Developing Sustainability Criteria and Assessing Heritage and Modern Buildings in the UAE. Archit. Eng. Des. Manag. 2020, 16, 329–355. [Google Scholar] [CrossRef]
  20. Ribera, F.; Nesticò, A.; Cucco, P.; Maselli, G. A Multicriteria Approach to Identify the Highest and Best Use for Historical Buildings. J. Cult. Herit. 2020, 41, 166–177. [Google Scholar] [CrossRef]
  21. Morano, P.; Locurcio, M.; Tajani, F. Cultural Heritage Valorization: An Application of AHP for the Choice of the Highest and Best Use. Procedia-Soc. Behav. Sci. 2016, 223, 952–959. [Google Scholar] [CrossRef]
  22. Liu, F.L.; Chu, D.Z. The Based-Value Assessing System and Methodology on the Industrial Heritages During Period of Sanxian Construction In Chongqing. Ind. Archit. 2011, 41, 54–59. [Google Scholar] [CrossRef]
  23. Liu, B.Y.; Li, K. Formation of Industrial Heritage and Method of Value Evaluation. ArchiCreation 2006, 41, 24–30. [Google Scholar] [CrossRef]
  24. Iamandi, C. The Charters of Athens of 1931 and 1933: Coincidence, Controversy and Convergence. Conserv. Manag. Archaeol. Sites 1997, 2, 17–28. [Google Scholar] [CrossRef]
  25. Jokilehto, J. The Context of the Venice Charter (1964). Conserv. Manag. Archaeol. Sites 1998, 2, 229–233. [Google Scholar] [CrossRef]
  26. Handzic, L.K.; Dimitrijevic, B. Criteria for Evaluation of Modern Architecture in Bosnia and Herzegovina to Support Its Preservation. Archnet-IJAR Int. J. Archit. Res. 2024; ahead-of-print. [Google Scholar] [CrossRef]
  27. Gruber, S. Convention Concerning the Protection of the World Cultural and Natural Heritage, 1972. In Proceedings of the UNESCO General Conference, 17th Session, Paris, France, 17 October–21 November 1972; UNESCO: Paris, France, 1972; pp. 60–66. [Google Scholar]
  28. Australia ICOMOS. The Burra Charter: The Australia ICOMOS Charter for the Conservation of Places of Cultural Significance (1979). Available online: https://australia.icomos.org/wp-content/uploads/Burra-Charter_1979.pdf (accessed on 23 February 2025).
  29. Falser, M.S. From Venice 1964 to Nara 1994-Changing Concepts of Authenticity? In Proceedings of the Conservation and Preservation: Interactions Between Theory and Practice: In Memoriam Alois Riegl (1858–1905): Proceedings of the International Conference of the ICOMOS International Scientific Committee for the Theory and the Philosophy of Conservation and Restoration, Vienna, Austria, 23–27 April 2008; Polistampa, 2010; pp. 1000–1018. [Google Scholar]
  30. Casanelles, E. TICCIH’s Charter for Industrial Heritage. In Industrial Heritage Re-Tooled; Routledge: London, UK, 2016; pp. 228–234. [Google Scholar]
  31. Ji, H. The Evolution of International Protection Notion of Industrial Heritage after Nizhny Tagil Charter: A Case Study of the Dublin Principles and Taipei Declaration on Asian Industrial Heritage. New Archit. 2017, 5, 74–77. [Google Scholar]
  32. The Nizhny Tagil Charter for the Industrial Heritage/July, 2003. Available online: https://ticcih.org/about/charter/ (accessed on 23 February 2025).
  33. Xi’an Declaration on the Conservation of the Setting of Heritage Structures, Sites and Areas. Available online: https://web.archive.org/web/20240401/https://www.icomos.org/images/DOCUMENTS/Charters/xian-declaration.pdf (accessed on 28 January 2025).
  34. Wuxi Proposal–Focusing on Industrial Heritage Conservation in a Period of High Economic Development. 2006. Archicreation: Wuxi, China. 2006, 199–200. Available online: http://en.wuxi.gov.cn/2023-03/06/c_866203.htm (accessed on 23 February 2025).
  35. Préambule, P. Joint ICOMOS–TICCIH Principles for the Conservation of Industrial Heritage Sites, Structures, Areas and Landscapes; ICOMOS General Assembly: Charenton-le-Pont, France, 2011. [Google Scholar]
  36. Taipei Declaration for Asian Industrial Heritage—TICCIH. Available online: Https://Ticcih.Org/about/Charter/Taipei-Declaration-for-Asian-Industrial-Heritage/ (accessed on 28 January 2025).
  37. Loures, L. Industrial Heritage: The Past in the Future of the City. WSEAS Trans. Environ. Dev. 2008, 4, 687–696. [Google Scholar]
  38. Liang, W.; Ahmad, Y.; Mohidin, H.H.B. The Development of the Concept of Architectural Heritage Conservation and Its Inspiration. Built Herit. 2023, 7, 21. [Google Scholar] [CrossRef]
  39. Ireland, T.; Brown, S.; Schofield, J. Introduction: (In)Significance—Values and Valuing in Heritage. Int. J. Herit. Stud. 2020, 26, 823–825. [Google Scholar] [CrossRef]
  40. Duval, M.; Smith, B.; Hœrlé, S.; Bovet, L.; Khumalo, N.; Bhengu, L. Towards a Holistic Approach to Heritage Values: A Multidisciplinary and Cosmopolitan Approach. Int. J. Herit. Stud. 2019, 25, 1279–1301. [Google Scholar] [CrossRef]
  41. Nocca, F.; Bosone, M.; Orabona, M. Multicriteria Evaluation Framework for Industrial Heritage Adaptive Reuse: The Role of the ‘Intrinsic Value’. Land 2024, 13, 1266. [Google Scholar] [CrossRef]
  42. Fredheim, L.H.; Khalaf, M. The Significance of Values: Heritage Value Typologies Re-Examined. Int. J. Herit. Stud. 2016, 22, 466–481. [Google Scholar] [CrossRef]
  43. Lian, W. Classification and Evaluation Methods of Modern Urban Industrial Heritage Landscape: A Case Study of Shaanxi Province, China. Ph.D Thesis, University of Strathclyde, Scotland, UK, 2024. [Google Scholar]
  44. Jones, S. Wrestling with the Social Value of Heritage: Problems, Dilemmas and Opportunities. J. Community Archaeol. Herit. 2017, 4, 21–37. [Google Scholar] [CrossRef]
  45. Birkeland, I. Making Sense of the Future: Valuing Industrial Heritage in the Anthropocene. Future Anterior 2017, 14, 61–72. [Google Scholar] [CrossRef]
  46. Dawson, M. Values in Heritage Management. Emerging Approaches and Research Directions: By Erica Avrami, Susan MacDonald, Randall Mason, David Myers, Los Angeles, Getty Conservation Institute, 2019. Hist. Environ. Policy Pract. 2021, 12, 259–261. [Google Scholar] [CrossRef]
  47. Mundo-Hernández, J.; Valerdi-Nochebuena, M.C.; Sosa-Oliver, J. Post-Occupancy Evaluation of a Restored Industrial Building: A Contemporary Art and Design Gallery in Mexico. Front. Archit. Res. 2015, 4, 330–340. [Google Scholar] [CrossRef]
  48. Wang, Y.-W.; Wang, X. Industrial Heritage Valorisation and Creative Industry Proliferation in Shanghai’s Urban Regeneration. Built Herit. 2018, 2, 76–92. [Google Scholar] [CrossRef]
  49. Zhang, J.; Cenci, J.; Becue, V.; Koutra, S.; Ioakimidis, C.S. Recent Evolution of Research on Industrial Heritage in Western Europe and China Based on Bibliometric Analysis. Sustainability 2020, 12, 5348. [Google Scholar] [CrossRef]
  50. Ayers, B.; Parangoni, I. Industrial Heritage in Albania: An Assessment. Ind. Archaeol. Rev. 2015, 37, 111–122. [Google Scholar] [CrossRef]
  51. Chen, X.; Jiang, L.; Cheng, B.; Zhang, Y.; Shi, X.L.; Zheng, Y.D.; Fu, Y. Evaluating Urban Industrial Heritage Value Using Industrial Heritage Matrix Analytic Hierarchy Process Models. Int. Rev. Spat. Plan. Sustain. Dev. 2024, 12, 99–118. [Google Scholar] [CrossRef]
  52. Davies, P. What Makes Industrial Sites Heritage Significant and How Can They Be Managed to Retain Their Heritage Value in an Operating System? The Heritage of Hydro Tasmania–a Case Study. Aust. J. Multi-Discip. Eng. 2008, 6, 21–26. [Google Scholar] [CrossRef]
  53. Stovel, H. Notes on authenticity. ICOMOS Sci. J. 1994, 3, 63–68. [Google Scholar]
  54. Wang, S.; Jiang, Y.; Xu, Y.; Zhang, L.; Li, X.; Zhu, L. Sustainability of Historical Heritage: The Conservation of the Xi’an City Wall. Sustainability 2019, 11, 740. [Google Scholar] [CrossRef]
  55. Zhao, Y.; Jin, K.; Zhang, D.; Wang, L.; Li, J.; Dai, T. Transforming Urban Landscapes: Reuse of Heritage Sites through Multi-Value Interpretations in Xi’an, China. Land 2024, 13, 948. [Google Scholar] [CrossRef]
  56. Qi, X. Evaluation and Analysis of Shenyang Urban Road Plant Landscape Based on AHP. Liaoning Agric. Sci. 2018, 2018, 29–34. [Google Scholar] [CrossRef]
  57. Zhang, N.; Li, L.; Ma, Y.; Dai, J. Study on the Attractiveness Enhancement of Industrial Cultural Heritage Based on Visitors’ Perceived Value. In Proceedings of the 2024 10th International Conference on Humanities and Social Science Research (ICHSSR 2024), Toronto, Canada, 25–27 July 2025; Atlantis Press: Dordrecht, The Netherlands, 2024; pp. 1280–1287. [Google Scholar]
  58. Fouseki, K.; Nicolau, M. Urban Heritage Dynamics in ‘Heritage-Led Regeneration’: Towards a Sustainable Lifestyles Approach. Hist. Environ. Policy Pract. 2018, 9, 229–248. [Google Scholar] [CrossRef]
  59. Wind, Y.; Saaty, T.L. Marketing Applications of the Analytic Hierarchy Process. Manag. Sci. 1980, 26, 641–658. [Google Scholar] [CrossRef]
  60. Saaty, T. LThe Analytic Hierarchy Process: A New Approach to Deal with Fuzziness in Architecture. Archit. Sci. Rev. 1982, 25, 64–69. [Google Scholar] [CrossRef]
  61. Munier, N.; Hontoria, E. Shortcomings of the AHP Method. In Uses and Limitations of the Analytic Hierarchy Process (AHP) Method: A Non-Mathematical Rational Analysis; Munier, N., Hontoria, E., Eds.; Springer: Cham, Switzerland, 2021; pp. 41–90. [Google Scholar] [CrossRef]
  62. McAllister, M.; Kirkwood, G. Using Bayesian Decision Analysis to Help Achieve a Precautionary Approach for Managing Developing Fisheries. Can. J. Fish. Aquat. Sci. 1998, 55, 2642–2661. [Google Scholar] [CrossRef]
  63. Hsu, C.-C.; Sandford, B.A. The Delphi Technique: Making Sense of Consensus. Pract. Assess. Res. Eval. 2007, 12, 1–8. [Google Scholar] [CrossRef]
  64. Khan, M.R.; Alam, M.J.; Tabassum, N.; Khan, N.A. A Systematic Review of the Delphi–AHP Method in Analyzing Challenges to Public-Sector Project Procurement and the Supply Chain: A Developing Country’s Perspective. Sustainability 2022, 14, 14215. [Google Scholar] [CrossRef]
  65. Saaty, T.L. There Is No Mathematical Validity for Using Fuzzy Number Crunching in the Analytic Hierarchy Process. J. Syst. Sci. Syst. Eng. 2006, 15, 457–464. [Google Scholar] [CrossRef]
  66. Nadkarni, R.R.; Puthuvayi, B. A Comprehensive Literature Review of Multi-Criteria Decision Making Methods in Heritage Buildings. J. Build. Eng. 2020, 32, 101814. [Google Scholar] [CrossRef]
  67. Milošević, M.R.; Milošević, D.M.; Stanojević, A.D.; Stević, D.M.; Simjanović, D.J. Fuzzy and Interval AHP Approaches in Sustainable Management for the Architectural Heritage in Smart Cities. Mathematics 2021, 9, 304. [Google Scholar] [CrossRef]
  68. Liu, F.; Peng, Y.; Zhang, W.; Pedrycz, W. On Consistency in AHP and Fuzzy AHP. J. Syst. Sci. Inf. 2017, 5, 128–147. [Google Scholar] [CrossRef]
  69. Rezaei, J. Best-Worst Multi-Criteria Decision-Making Method. Omega 2015, 53, 49–57. [Google Scholar] [CrossRef]
  70. Khan, S.A.; Kusi-Sarpong, S.; Naim, I.; Ahmadi, H.B.; Oyedijo, A. A Best-Worst-Method-Based Performance Evaluation Framework for Manufacturing Industry. Kybernetes 2022, 51, 2938–2963. [Google Scholar] [CrossRef]
  71. Khan, S.A.; Ojiako, U.; Marshall, A.; Dalalah, D.; Ceylan, S.; Ali Shabani, N.N.; Al Sharqawi, S.I. The Critical Risk Factors That Influence Production-Oriented Projects in the United Arab Emirates: A ‘Best-Worst Method’(BWM) Analysis. Eng. Manag. J. 2023, 35, 144–160. [Google Scholar] [CrossRef]
  72. Shekhovtsov, A. Evaluating the Performance of Subjective Weighting Methods for Multi-Criteria Decision-Making Using a Novel Weights Similarity Coefficient. Procedia Comput. Sci. 2023, 225, 4785–4794. [Google Scholar] [CrossRef]
  73. Więckowski, J.; Kizielewicz, B.; Shekhovtsov, A.; Sałabun, W. RANCOM: A Novel Approach to Identifying Criteria Relevance Based on Inaccuracy Expert Judgments. Eng. Appl. Artif. Intell. 2023, 122, 106114. [Google Scholar] [CrossRef]
  74. Kizielewicz, B.; Sałabun, W. SITW Method: A New Approach to Re-Identifying Multi-Criteria Weights in Complex Decision Analysis. Spectr. Mech. Eng. Oper. Res. 2024, 1, 215–226. [Google Scholar] [CrossRef]
  75. Kizielewicz, B.; Wiȩckowski, J.; Paradowski, B.; Shekhovtsov, A.; Wątróbski, J.; Sałabun, W. Stochastic Approaches for Criteria Weight Identification in Multi-Criteria Decision Analysis. In Proceedings of the Asian Conference on Intelligent Information and Database Systems, Ras Al Khaimah, United Arab Emirates, 15–18 April 2024; Springer: Berlin/Heidelberg, Germany, 2024; pp. 40–51. [Google Scholar]
  76. Kizielewicz, B.; Więckowski, J.; Sałabun, W. Fuzzy Normalization-Based Multi-Attributive Border Approximation Area Comparison. Eng. Appl. Artif. Intell. 2025, 141, 109736. [Google Scholar] [CrossRef]
  77. Saaty, T.L. Principles of the Analytic Hierarchy Process. In Expert Judgment and Expert Systems; Springer: Berlin/Heidelberg, Germany, 1987; pp. 27–73. [Google Scholar]
  78. Veldpaus, L.; Pendlebury, J. Heritage as a Vehicle for Development: The Case of Bigg Market, Newcastle upon Tyne. Plan. Pract. Res. 2023, 38, 376–390. [Google Scholar] [CrossRef]
  79. Guzman, P. Assessing the Sustainable Development of the Historic Urban Landscape through Local Indicators. Lessons from a Mexican World Heritage City. J. Cult. Herit. 2020, 46, 320–327. [Google Scholar] [CrossRef]
  80. Adlercreutz, T. Craig Forrest, International Law and the Protection of Cultural Heritage, Routledge, 2010. Pp. 480. ISBN 978-0415467810, $135.00. Int. J. Cult. Prop. 2011, 18, 397–403. [Google Scholar] [CrossRef]
  81. Langston, C.; Wong, F.K.; Hui, E.C.; Shen, L.-Y. Strategic Assessment of Building Adaptive Reuse Opportunities in Hong Kong. Build. Environ. 2008, 43, 1709–1718. [Google Scholar] [CrossRef]
  82. Dalkey, N.; Helmer, O. An Experimental Application of the Delphi Method to the Use of Experts. Manag. Sci. 1963, 9, 458–467. [Google Scholar] [CrossRef]
  83. Zhang, L.; Guo, X.; Yang, S.; Liu, S.; Li, H.; Chen, G.; Gao, H.; Zhang, H.; Tong, L. Application of the Delphi Method in the Construction of an Evaluating and Grading Scale for Evidence of Disease Prevention and Treatment in Ancient Books of Traditional Chinese Medicine. Evid.-Based Complement. Altern. Med. ECAM 2022, 2022, 3674663. [Google Scholar] [CrossRef]
  84. Keeney, S.; Hasson, F.; McKenna, H.P. A Critical Review of the Delphi Technique as a Research Methodology for Nursing. Int. J. Nurs. Stud. 2001, 38, 195–200. [Google Scholar] [CrossRef] [PubMed]
  85. Giannarou, L.; Zervas, E. Using Delphi Technique to Build Consensus in Practice. Int. J. Bus. Sci. Appl. Manag. 2014, 9, 65–82. [Google Scholar] [CrossRef]
  86. Okoli, C.; Pawlowski, S.D. The Delphi Method as a Research Tool: An Example, Design Considerations and Applications. Inf. Manag. 2004, 42, 15–29. [Google Scholar] [CrossRef]
  87. Stuart, A. Spearman-like Computation of Kendall’s Tau. Br. J. Math. Stat. Psychol. 1977, 30, 104–112. [Google Scholar] [CrossRef]
  88. Likert, R.A. A Technique for the Measurement of Attitudes; Archives of Psychology, Monograph No. 140; Columbia University: New York, NY, USA, 1932; pp. 1–55. [Google Scholar]
  89. Rowe, G.; Wright, G. The Delphi Technique as a Forecasting Tool: Issues and Analysis. Int. J. Forecast. 1999, 15, 353–375. [Google Scholar] [CrossRef]
  90. Landeta, J. Current Validity of the Delphi Method in Social Sciences. Technol. Forecast. Soc. Chang. 2006, 73, 467–482. [Google Scholar] [CrossRef]
  91. Kendall, M.G.; Smith, B.B. The Problem of m Rankings. Ann. Math. Stat. 1939, 10, 275–287. [Google Scholar] [CrossRef]
  92. Kendall, M.G. Rank Correlation Methods; Charles Griffin & Company Ltd.: London, UK, 1948; pp. 95–117. [Google Scholar]
  93. Saaty, T.L. How to Make a Decision: The Analytic Hierarchy Process. Eur. J. Oper. Res. 1990, 48, 9–26. [Google Scholar] [CrossRef]
  94. Saaty, T.L. Decision Making with the Analytic Hierarchy Process. Int. J. Serv. Sci. 2008, 1, 83–98. [Google Scholar] [CrossRef]
  95. Xiao, Y.; Ren, Y.Y.; Liu, S.H. Research on Heritage Values of Industrial Buildings of Xi’an in the First Five-Year Plan Period (1953–1957). Appl. Mech. Mater. 2014, 638–640, 2245–2248. [Google Scholar] [CrossRef]
  96. Liu, B.Y.; Li, K. Review of Three Important Historical Periods of Chinese Industrial Development. Beijing Plan. Constr. 2011, 2011, 8–12. [Google Scholar] [CrossRef]
  97. Liu, Z. Research on the Record of Industrial Building Heritage Information in the Early Days of Xi’an in the Perspective of Modern Heritage—Taking Shanxi Steel Plant as an Example. Archit. Cult. 2019, 2, 209–210. [Google Scholar] [CrossRef]
  98. Tian, X. A Analysis of Development of Industry in Shanxi Province in the Resistance War. Res. Anti-Jpn. War 2002, 45, 164. [Google Scholar] [CrossRef]
  99. Zhu, X.; Wu, Y.; Liu, H. Building Codes in the Soviet Union and Technological Transfer of the 156 Soviet-Aided Projects A Case Study of Wang Shi Wa Coal Mine in Tongchuan. J. Archit. 2016, 07, 87–92. [Google Scholar] [CrossRef]
  100. Vermeer, E.B. Shaanxi: Building a Future on State Support. China Q. 2004, 178, 400–425. [Google Scholar] [CrossRef]
  101. Fan, T.; Xue, D.Q. Sustainable Development of Cultural Industry in Shaanxi Province of Northwest China: A SWOT and AHP Analysis. Sustainability 2018, 10, 2830. [Google Scholar] [CrossRef]
  102. Liu, B.Y. An Overview of the Development of Industrial Building Heritage Conservation. Archit. J. 2012, 2012, 12–17. [Google Scholar] [CrossRef]
  103. Saaty, T.L.; Vargas, L.G. Uncertainty and Rank Order in the Analytic Hierarchy Process. Eur. J. Oper. Res. 1987, 32, 107–117. [Google Scholar] [CrossRef]
  104. Tian, Y. Study on the Conservation and Sustainable Utilization of Industrial Heritage in Wuhan. Chin. Landsc. Archit. 2013, 2013, 90–95. [Google Scholar]
  105. Jin, Y.B.; Wang, J.M.; Jia, M.T.; Ling, Y.F. A Study on the Renovation Mode of Industrial Building Heritage in the Old City: An Interview with Quan Jianbiao, the President of Old Steelworks Design and Creation Industrial Park in Xi’an. New Archit. 2016, 2016, 35–41. [Google Scholar] [CrossRef]
  106. Lv, J.; Yang, H.; Zhang, X.; Wang, Y.; Zhang, H.; Zhao, Y. Spatial and Temporal Distribution Characteristics and Genealogical Framework of Shaanxi’s Industrial Heritage. Buildings 2024, 14, 2527. [Google Scholar] [CrossRef]
  107. Kizielewicz, B.; Sałabun, W. A Robust Framework for Renewable Energy Policy Evaluation Using MCDA and Compromise Ranking with Stochastic Weight Identification. J. Intell. Manag. Decis. 2024, 3, 213–223. [Google Scholar] [CrossRef]
  108. Bouzon, M.; Govindan, K.; Rodriguez, C.M.T.; Campos, L.M.S. Identification and Analysis of Reverse Logistics Barriers Using Fuzzy Delphi Method and AHP. Resour. Conserv. Recycl. 2016, 108, 182–197. [Google Scholar] [CrossRef]
Figure 1. Documents related to the determination of the value of industrial heritage.
Sustainability 17 04125 g001
Figure 2. Workflow diagram.
Sustainability 17 04125 g002
Figure 3. Example of a questionnaire question.
Sustainability 17 04125 g003
Figure 4. Hierarchy of industrial heritage values.
Sustainability 17 04125 g004
Figure 5. Shaanxi steel factory layout and location.
Sustainability 17 04125 g005
Figure 6. Comparison of Shaanxi Steel Factory before and after renovation.
Sustainability 17 04125 g006
Figure 7. Value distribution map of Shaanxi Steel Factory.
Sustainability 17 04125 g007
Table 1. Comparison of MCDM methods.
MethodAdvantagesLimitationsTypical Applications
AHPSimple and widely used; combines qualitative and quantitative analysisSensitive to inconsistency; prone to rank reversalHeritage evaluation, architecture, urban planning, project management, policymaking, supply chain, environment
DelphiBuilds expert consensus; useful for indicator screeningNo quantitative results; fully depends on expert feedbackPolicy studies, heritage indicator development, qualitative research
BWMHigh consistency; reduces expert workloadSensitive to best/worst selection; accuracy may varySustainability, transport planning, consumer research
RANCOMEfficient in handling large-scale decisionsNot intuitive for experts; limited use in heritageEngineering, environmental management, smart decision systems
SITWRobust under uncertainty; effective in stochastic environmentsTechnically complexAI modelling, engineering systems, risk assessment
FN-MABACHandles fuzziness and unclear boundaries in complex systemsStill emerging in heritage field; limited empirical useTransportation, energy, logistics, system analysis
Fuzzy AHPCaptures uncertainty better than classic AHPDifficult to interpret results; more complex than AHPCultural heritage, risk analysis, complex system decisions
Table 2. Quantitative table for assigning values to CA by experts.
Ca Extent of Impact
Large MediumSmall
Practical experience0.50.40.3
Theoretical analysis0.30.20.1
The literature 0.10.10.1
Intuitive judgement 0.10.10.1
Table 3. Quantitative table for Cs assignment.
Familiarity LevelsScore
Very familiar0.9
More familiar0.7
Generally familiar0.5
Slightly familiar0.3
Not familiar0.1
Table 4. The 1–9 scale table of the AHP [93].
DefinitionIntensity of Importance
Bx is extremely more important than By9
Bx is very strongly more important than By7
Bx is strongly more important than By5
Bx is slightly more important than By3
Bx and By are equally important1
Means the middle value of the above adjacent judgement2, 4, 6, 8
If the ratio of the importance of the Bx factor to the By factor is Bxy, then the ratio of the importance of the By factor to the Bx factor is 1/BxyReciprocal
Table 5. RI comparison table.
n123456
RI000.580.901.121.24
n789101112
RI1.321.411.451.491.521.54
Table 6. The main categories and typical enterprises of Shaanxi’s industrial heritage.
Classification Case
Textile Industry (12)Dahua Yarn Factory (Xi’an); Northwest No. 1 Printing and Dyeing Factory (Xi’an); National Northwest No. 3, No. 4, No. 5 and No. 6 Cotton Spinning Factory (Xi’an); National Northwest No. 1 Cotton Spinning Factory (Xianyang); Shaanxi No. 8 Cotton Spinning Factory (Xianyang); Shaanxi Cotton No. 9 Factory (Baoji); Shaanxi Cotton No. 11 and No. 12 Factories (Baoji); and Yulin Woolen Weaving Factory (Yulin)
Petrochemical Industry (5)Yanchang Petroleum (Yan’an), Integrated Tri-Acid Factory (Xi’an), Northwest People’s Pharmaceutical Factory (Yan’an), Petroleum Steel Pipe Factory (Baoji), Shaanxi Diesel Engine Factory (Xianyang)
Power Industry (7)Xi’an No. 1 Power Plant (Xi’an); Baqiao Thermal Power Plant (Xi’an); Qinling Power Plant (Xianyang); Fuxian Power Plant (Yan’an); Ankang Hydroelectric Power Plant (Ankang); Shiquan Shui Power Plant (Ankang); Weiguang Power Plant (Shangluo)
Metallurgical Industry (4)Shaanxi Steel Factory (Xi’an); Wangshiwa Coal Mine (Tongchuan); Yuhua Coal Mine (Tongchuan); Luoyang Steel Factory (Hanzhong)
Non-ferrous metal industry (2)Shaanxi Huashan Non-ferrous Metallurgical Machinery Factory (Weinan); Baoji Non-Ferrous Metal Processing Factory (Baoji)
Machinery Industry (4)Northwest Machinery Factory (Xi’an); No. 1 Watch and Clock Machinery Factory (Xi’an); Fenglei Instrument Factory (Xi’an); Butterfly Watch Factory (Xi’an)
Building Materials Industry (4)Hongqi Cement Products Factory (Weinan); Yaoxian Cement Factory (Tongchuan); Chenfeng Ceramic Factory (Tongchuan); Baota District Cement Factory (Yan’an)
Food industry (9)Xifeng Jiu Factory (Baoji); Taibai Winery (Baoji); Changwu County Winery (Xianyang); Shaanxi Dukang Winery (Weinan); Tongguan Pickle Factory (Weinan); Dingbian Salt Farm (Yulin); Hanzhong Brewery (Hanzhong); Yangxian Yellow Wine Brewery (Hanzhong); Danfeng Winery (Shangluo)
Other Light Industries (3)Yan’an Cigarette Factory (Yan’an); Baoji Cigarette Factory (Boji); Hanzhong Cigarette Factory No. 2 (Hanzhong)
Table 7. The initial evaluation indicators.
The Objective LayerThe Feature LayerThe Factors LayerThe Detail Layer
The Overall Value of the Industrial HeritageA Intrinsic valueA1 Historical valueA11 The date of construction of the heritage
A12 Witness to the level of social development
A13 Witness to important events
A14 The addition and completion of historical documents
A15 Uniqueness and scarcity
A16 Completeness
A2 Scientific and technological value (0.1390)A21 Industrial buildings and equipment
A22 Production processes
A23 Building complexity
A24 Technological representativeness
A25 Distinctiveness
A26 Originality
A3 Cultural valueA31 Positive energy value
A32 Negative energy value
A33 Neutral energy value
A4 Artistic valueA41 Aesthetic landscape value
A42 The value of the artwork
A43 Re-creation potential
A44 The level of artistic style expression
B Derived valueB1 Location valueB11 Distance from the city centre
B12 Transport situation to the city centre
B13 Status of preservation
B14 The number of central cities or tourist areas in the wider regional context
B2 Environmental valueB21 The impact of the original production function of industrial heritage on the environment
B22 Surrounding environment
B23 The environmental scope of the industrial heritage
B3 Group valueB31 The scale of the group
B32 Relationship of the group
B33 The potential for wide-scale groups of industrial heritage
B4 Social valueB41 The ability to offer employment
B42 Educational function
B43 Social memory
B44 The potential to provide a place of leisure for the public
B45 Enhancing the image or symbolism of the city
B5 Emotional valueB51 Number of people who have an emotional connection to industrial heritage
B52 The age range of the people who have an emotional connection to industrial heritage
B53 Characteristics of the careers of people with emotional value
Table 8. Expert group authoritative coefficient for the first round.
Experts1234567891011121314151617181920Average Value
Cs0.70.90.90.90.90.90.70.90.90.90.70.90.70.90.70.90.70.90.70.70.82
Ca0.810.90.80.80.810.80.80.90.910.80.810.90.90.80.80.80.865
CR0.750.950.90.850.850.850.850.850.850.90.80.950.750.850.850.90.80.850.750.750.8425
Table 9. Expert group authoritative coefficient for the second round.
Experts1234567891011121314151617181920Average Value
Cs0.90.90.70.90.70.90.90.70.70.90.90.70.70.90.90.70.70.90.70.90.81
Ca0.810.90.910.80.90.80.910.80.90.80.910.90.90.90.90.90.895
CR0.850.950.80.90.850.850.90.750.80.950.850.80.750.90.950.80.80.90.80.90.8525
Table 10. Consistency test statistics.
RoundLayerNKendall’s WPearson Chi-Square (X2)Degrees of Freedom (df)Asymptotic Significance (p)
FirstFeature 200.3610.014
Factor 200.40965.4128<0.001
Detail 200.388279.53136<0.001
SecondFeature 200.3610.014
Factor 200.27944.6438<0.001
Detail 200.312181.03829<0.001
Table 11. Expert coefficient of variation (CV) statistics.
LayerIndicatorNMinMaxMSCV
1st2nd1st2nd1st2nd1st2nd1st2nd
A2044554.4000 4.6000 0.5026 0.5026 0.1142 0.1093
FeatureB2044554.7000 4.3000 0.4702 0.4702 0.1000 0.1093
FactorA1 2044554.7000 4.7000 0.4702 0.4702 0.1000 0.1000
A22044554.6000 4.7000 0.5026 0.4702 0.1093 0.1000
A32044554.5000 4.6000 0.5130 0.5026 0.1140 0.1093
A42044554.6000 4.5000 0.5026 0.5130 0.1093 0.1140
B1 2044554.5000 4.6000 0.5130 0.5026 0.1140 0.1093
B2 2044554.0500 4.5000 0.2236 0.5130 0.0552 0.1140
B3 2044554.6000 4.0500 0.5026 0.2236 0.1093 0.0552
B42044554.7000 4.7500 0.4702 0.4443 0.1000 0.0935
B52044554.6000 4.6000 0.5026 0.5026 0.1093 0.1093
DetailA11 2044554.6500 4.4000 0.4894 0.5026 0.1052 0.1000
A12 2044554.7500 4.7000 0.4443 0.4702 0.0935 0.1142
A13 2044554.7500 4.4000 0.4443 0.5026 0.0935 0.1093
A14 2024554.4500 4.6000 0.7592 0.5026 0.1706 0.1000
A15 2044554.6000 4.7000 0.5026 0.4702 0.1093 0.1000
A16 2044554.5000 4.7000 0.5130 0.4702 0.1140 0.1093
A21 2044554.6500 4.6000 0.4894 0.5026 0.1052 0.1140
A22 2044554.6000 4.5000 0.5026 0.5130 0.1093 0.1093
A23 2014552.9000 -1.2096 -0.4171 -
A24 2044554.1500 4.6000 0.3664 0.5026 0.0883 0.1140
A25 2014553.1500 -1.3870 -0.4403 -
A26 2014553.1000 -1.5861 -0.5117 -
A312024554.4000 4.5000 0.7539 0.5130 0.1714 0.0552
A322044554.4500 4.0500 0.5104 0.2236 0.1147 0.1142
A332044554.6000 4.4000 0.5026 0.5026 0.1093 0.1000
A412044554.4500 4.7000 0.5104 0.4702 0.1147 0.1142
A422044554.7500 4.4000 0.4443 0.5026 0.0935 0.1052
A432014553.1500 -1.3089 -0.4155 --
A442044554.6000 4.6500 0.5026 0.4894 0.1093 0.0935
B11 2044554.4000 4.7500 0.5026 0.4443 0.1142 0.0935
B122044554.5000 4.7500 0.5130 0.4443 0.1140 0.1045
B132014552.7500 -1.4096 -0.5126 -
B142044554.7000 4.2500 0.4702 0.4443 0.1000 0.1093
B212044554.4500 4.6000 0.5104 0.5026 0.1147 0.1140
B222014553.1500 -1.4244 -0.4522 -
B232044554.5500 4.5000 0.5104 0.5130 0.1122 0.1125
B312044554.400 4.3500 0.50260.4894 0.11420.1093
B322044554.4000 4.6000 0.5026 0.5026 0.1142 0.1142
B332044554.2000 4.4000 0.4104 0.5026 0.0977 0.0883
B412044554.7500 4.1500 0.4443 0.3664 0.0935 0.1147
B422044554.4500 4.4500 0.5104 0.5104 0.1147 0.1093
B432014552.7000 -1.0311 -0.3819 -
B442044554.8500 4.6000 0.3664 0.5026 0.0755 0.1140
B452044554.4500 4.5000 0.5104 0.5130 0.1147 0.1147
B512044554.8000 4.4500 0.4104 0.5104 0.0855 0.1093
B522044554.9500 4.6000 0.2236 0.5026 0.0452 0.1000
B532044554.4500 4.7000 0.5104 0.4702 0.1147 0.1000
Table 12. Table of calculated weights for industrial heritage.
Feature Layer’s Relative WeightFactors Layer’s Relative WeightDetail Layer’s Relative WeightsAbsolute Weight *Order
A Intrinsic value (0.75)A1 Historical value
(0.3933)
A11 The date of construction of the heritage
(0.2803)
0.08273
A12 Witness to the level of social development
(0.1573)
0.04648
A13 Witness to important events
(0.0991)
0.029215
A14 The addition and completion of historical documents
(0.1982)
0.05854
A15 Uniqueness and scarcity
(0.1402)
0.04139
A16 Completeness
(0.1249)
0.036811
A2 Scientific and technological value
(0.1390)
A21 Industrial buildings and equipment
(0.4934)
0.05157
A22 Production processes
(0.1958)
0.020419
A23 Technological representativeness
(0.3108)
0.032414
A3 Cultural value
(0.2338)
A31 Positive energy value
(0.4934)
0.08652
A32 Negative energy value
(0.1958)
0.034313
A33 Neutral energy value
(0.3108)
0.05456
A4 Artistic value
(0.2338)
A41 Aesthetic landscape value
(0.4934)
0.08651
A42 The value of the artwork
(0.1958)
0.034312
A43 The level of artistic style expression
(0.3108)
0.05455
B Derived value (0.25)B1 Location value
(0.3291)
B11 Distance from the city centre
(0.4934)
0.040610
B12 Transport situation to the city centre
(0.1958)
0.016123
B13 The number of central cities or tourist areas in the wider regional context
(0.3108)
0.025617
B2 Environmental value
(0.1247)
B21 The impact of the original production function of industrial heritage on the environment
(0.6667)
0.020818
B22 The environmental scope of the industrial heritage
(0.3333)
0.010426
B3 Group value
(0.1645)
B31 The scale of the group
(0.4934)
0.020320
B32 Relationship of the group
(0.1958)
0.008129
B33 The potential for wide-scale groups of industrial heritage (0.3108)0.012824
B4 Social value
(0.1645)
B41 The ability to offer employment (0.3976)0.016422
B42 Educational function
(0.2364)
0.009727
B43 The potential to provide a place of leisure for the public
(0.1672)
0.006930
B44 Enhancing the image or symbolism of the city
(0.1988)
0.008228
B5 Emotional value
(0.2171)
B51 Number of people who have an emotional connection to industrial heritage
(0.4934)
0.026816
B52 The age range of the people who have an emotional connection to industrial heritage
(0.3108)
0.016921
B53 Characteristics of the careers of people with emotional value
(0.1958)
0.010625
* Absolute weights indicate importance relative to the overall objective. Relative weights indicate the level of importance within the same hierarchy.
Table 13. The historical value score table for Shaanxi Steel Factory.
The Factors LayerThe Detail LayerWeightsShaanxi Steel Factory Score
A1A110.08272
A120.04643
A130.02923
A140.05852
A150.04134
A160.03684
Total score(Total possible score is 24) 18
Weighted score 0.82
Table 14. The scientific and technological value score table for Shaanxi Steel Factory.
The Factors LayerThe Detail LayerWeightsShaanxi Steel Factory Score
A2A21 0.05153
A220.02043
A23 0.03243
Total score(Total possible score is 12) 9
Weighted score 0.31
Table 15. The cultural value score table for Shaanxi Steel Factory.
The Factors LayerThe Detail LayerWeightsShaanxi Steel Factory Score
A3A310.08653
A320.03431
A330.05452
Total score(Total possible score is 12) 9
Weighted score 0.40
Table 16. The artistic value score table for Shaanxi Steel Factory.
The Factors LayerThe Detail LayerWeightsShaanxi Steel Factory Score
A4A41 0.08653
A420.03433
A43 0.05453
Total score(Total possible score is 12) 9
Weighted score 0.53
Table 17. The location value score table for Shaanxi Steel Factory.
The Factors LayerThe Detail LayerWeightsShaanxi Steel Factory Score
B1B11 0.04063
B120.01614
B13 0.02564
Total score(Total possible score is 12) 11
Weighted score 0.29
Table 18. The environmental value score table for Shaanxi Steel Factory.
The Factors LayerThe Detail LayerWeightsShaanxi Steel Factory Score
B2B210.02083
B22 0.01041
Total score(Total possible score is 8) 4
Weighted score 0.07
Table 19. The group value score table for Shaanxi Steel Factory.
The Factors LayerThe Detail LayerWeightsShaanxi Steel Factory Score
B3B31 0.02034
B320.00812
B33 0.01284
Total score(Total possible score is 12) 10
Weighted score 0.15
Table 20. The social value score table for Shaanxi Steel Factory.
The Factors LayerThe Detail LayerWeightsShaanxi Steel Factory Score
B4B41 0.01643
B420.00972
B43 0.00693
B440.00823
Total score(Total possible score is 16) 11
Weighted score 0.11
Table 21. The emotional value score table for Shaanxi Steel Factory.
The Factors LayerThe Detail LayerWeightsShaanxi Steel Factory Score
B5B51 0.02682
B520.01694
B53 0.01063
Total score(Total possible score is 12) 9
Weighted score 0.15
Disclaimer/Publisher’s Note: The statements, opinions and data contained in all publications are solely those of the individual author(s) and contributor(s) and not of MDPI and/or the editor(s). MDPI and/or the editor(s) disclaim responsibility for any injury to people or property resulting from any ideas, methods, instructions or products referred to in the content.

