Article

Energy Benchmarking Analysis of Multi-Family Housing Unit in Algiers, Algeria

by
Marwa Afaifia
1,*,
Meskiana Boulahia
1,
Kahina Amal Djiar
1,
Nariman Aicha Lamraoui
1,
Amina Naouel Mansouri
1,
Lyna Milat
1,
Sihem Chourouk Serrai
1 and
Jacques Teller
2
1
Laboratoire Ville, Urbanisme et Développement Durable (VUDD), Ecole Polytechnique d’Architecture et d’Urbanisme (EPAU), Algiers 16200, Algeria
2
Local Environment Management and Analysis (LEMA) Lab, Department of UEE, Faculty of Applied Sciences, Université de Liège, 4000 Liège, Belgium
*
Author to whom correspondence should be addressed.
Sustainability 2025, 17(9), 4120; https://doi.org/10.3390/su17094120
Submission received: 31 March 2025 / Revised: 25 April 2025 / Accepted: 30 April 2025 / Published: 2 May 2025
(This article belongs to the Section Energy Sustainability)

Abstract

:
Improving residential energy efficiency is essential for optimizing energy consumption. This article analyzes the electricity and natural gas consumption of a benchmark multi-family housing model in Algiers, based on data from 295 residential units collected over three consecutive years (2022, 2023, and 2024). A comprehensive approach combining data visualization, statistical analysis, a clustering approach, a tariff structure assessment, and an energy performance index is applied to assess residential energy-consumption trends. The findings reveal opposing trends between electricity and natural gas consumption. The electricity demand increased steadily (+15% from 2022 to 2024), particularly in the third trimester (summer), where 40% of the housing unit consumption exceeded 1000 kWh per trimester, indicating a growing reliance on air conditioning. In contrast, natural gas consumption declined significantly, with winter usage dropping by more than 20%, suggesting improved heating efficiency, better thermal insulation, and/or milder weather conditions. The clustering analysis also highlights a shift toward more homogenous consumption profiles, with fewer outliers and a narrower interquartile range, indicating greater energy efficiency across households. The results underscore the need for adaptive energy pricing policies and targeted household awareness programs. They further suggest that incentive-based measures, particularly during peak summer periods, could mitigate demand spikes and enhance energy system resilience. The energy benchmarking approach developed in this study can support decision-makers in adjusting tariff structures according to household energy profiles to improve overall energy efficiency.

1. Introduction

In Algeria, the residential sector is a significant energy consumer, with an energy consumption rate that represents 46% of national energy consumption [1], making it one of the main energy consumers on a national scale. This energy consumption is associated with a residential building stock of approximately 10 million units [2,3]. This extremely heterogeneous housing stock contains various housing types and configurations for different income levels. It includes both collective (multi-family) and individual (single-family) dwellings, each contributing differently to the overall residential energy demand. Understanding the diversity of the building stock is essential for designing targeted and effective energy-efficiency policies.
As part of the long-term strategic objectives of the Algerian government, it is committed to addressing the persistent challenges related to housing. To this end, plans have been made to construct numerous multi-family housing units in the upcoming decades. This initiative aims to alleviate the housing deficit [3]. Additionally, public authorities have also launched, in 2011, a national plan with the objective of controlling energy consumption and promoting energy efficiency [4]. However, this project still lacks specific energy guidelines and updated policies for residential buildings, based on reliable and verified data.
Therefore, the main objective of this article is to analyze the energy consumption of an Algerian benchmark model representing the electricity and natural gas consumption of the multi-family housing typology, which represents the most common model of multi-family public housing developed in Algiers intended for middle-income beneficiaries. According to the Ministry of Housing, Urban Planning, and the City, 1.4 million multi-family housing units will be launched based on this, starting from 2025 [5]. Hence, this study will attempt to answer the following research question:
“How can energy benchmarking of collective residential buildings support the development of adaptive energy pricing policies and targeted efficiency measures in Algiers (Algeria)?”
In an attempt to answer this research question, the paper focuses on benchmarking the most popular multi-family housing model and its energy-consumption profiles in Algiers. The objective is to critically reflect on the challenges and obstacles facing the future development of the project. This article is organized into five main sections. Firstly, the introduction aims to identify the research problem. Secondly, a literature review is conducted to analyze various studies related to the benchmark model and a residential energy-consumption analysis. Thirdly, the research methodology used in this research is explained in detail. Fourthly, the main outcomes obtained from this methodology are discussed in the results and discussion section. Finally, the last part presents the conclusion and gives an outline of the future work.

2. Literature Review

The literature review was conducted in October 2024, scoping research in databases such as Scopus, Springer, and MDPI. Various studies focusing on residential benchmarking approaches and techniques, building energy consumption patterns, and explanatory variables were explored. Only papers from relevant scientific journals were selected. A preliminary selection has been made by reading over 100 abstracts. Finally, the papers focusing on the analysis of benchmark housing unit models were examined in detail and synthesized. Table 1 presents the analysis parameters used to examine the literature review, and Table 2 summarizes the literature review that has been conducted based on the analytical parameters of Table 1.
Research on benchmarking and analyzing residential energy consumption relies on various methods and techniques, primarily involving mathematical approaches, simulations, and surveys. The reviewed literature is classified into two main groups:
  • Studies based on mathematical approaches to estimate residential energy consumption using survey or real-world datasets.
  • Studies employing simulation techniques.
Among the most significant and recent contributions to the benchmark model of housing, which primarily use mathematical methodologies such as regression analysis or clustering approaches, several works are highlighted in Table 2 [10,11,12,13,14,16,17,18,19,23,24]. The second group of literature is mainly based on the simulation for residential energy consumption or CO2 emissions and refers to the works listed in Table 2 [6,7,20,21].
In the Algerian context, the benchmarking approach in this specific area of research is still quite uncommon. Perhaps one of the few studies on benchmarking Algerian residential building is the work of A. Tellache et al. (2025) [21], who developed a benchmark model that helps in the assessment of the current system’s energy performance and recommends a number of steps to increase efficiency and thermal comfort going forward. The findings demonstrate that the archetype consumes 3.70 kWh/m2 of energy on average per year, whereas heating accounts for 13.20 kWh/m2 on average. These findings are significant, but they do not describe a type of housing that is more commonly used at the national level, let alone a variation that will likely be replicated extensively in the years to come by public authorities in order to meet the needs of the local population in terms of accommodation.
The present article takes into account the following four characteristics, based on the main gaps in the residential energy benchmarking approach, which has been depicted in previous studies and described in the literature review:
  • Longitudinal datasets: most papers only analyze partial residential datasets, i.e., the data usually focus on one typical year, month, or season. The present paper proceeds to the analysis of the energy consumption data of a residential neighborhood from its delivery date to customers (or householders) in 2022, the four trimesters of the year. The three-year period (2022–2024) represents the total duration of actual occupancy and recorded residential energy consumption. This timeframe, therefore, reflects the entire operational period of the dwellings, allowing for a relevant post-occupancy energy analysis.
  • Combining all available energy sources: the majority of the residential energy benchmark focuses on electricity consumption or natural gas consumption, but only a few studies have been performed to examine how two energies behave simultaneously. The objective of the present paper is to discuss the electricity and natural gas consumption used in the residential building stock as main energy sources.
  • The typology of housing with the highest rate: numerous benchmark models have been developed based on various typologies, both collective and individual. However, most research focuses on the selection of the typology and its percentage in the housing stock. In order to select the most responsive type of housing in the Algiers metropolitan area, a study of the statistics of the Algerian housing stock related to the demographics needs to be conducted. According to the ministry of housing, this type of habitat will be developed to a total of 1 million and 400,000 dwellings by 2025, in comparison to other types that are currently under construction [5].
  • Analysis of the impact of energy prices: a number of studies on energy benchmarking examine the impact of various factors on final residential energy consumption. However, few studies target the influence of the energy price on the evolution of residential energy consumption. The price factor set by the natural gas and electricity distribution company (Sonalgaz, Algiers, Algeria) in Algiers is investigated in this study with the objective of providing support to decision-makers for in reviewing the pricing system based on the identification of the energy profiles.
Consequently, the main objective of this work is to respond to three primary research questions:
  • What is the most intense period in terms of the energy consumption of both natural gas and electricity use among the targeted collective housing type provided by the housing improvement and development agency (AADL)?
  • What kind of energy is most commonly consumed in the selected type of housing?
  • What is the impact of the pricing that is set by the national energy company (Sonalgaz) on energy use in the selected type of housing?
The purpose of the next section is to describe, step-by-step, the methodology developed in this study in order to address the various research issues related to the AADL’s collective housing typology.

3. Methodology

The current study aims to assess the energy consumption behavior of one of Algeria’s most widely developed collective housing typologies implemented at the national level by public authorities (AADL). This research follows a data-driven methodology.
First, a literature review is conducted to examine and compare various energy benchmarking methods and approaches. Secondly, a statistical analysis of the housing typology is carried out to identify the most representative collective housing typologies at a national and metropolitan scale, to be chosen as a case study. Finally, a combined approach using statistical analysis and clustering methods is applied to develop a representative benchmark model of multi-family housing in Algeria. Figure 1 shows the conceptual framework, which can be divided into four main steps. Each step is described in detail in the following sections.

3.1. Data Collection

Data collection is a fundamental step that ensures the selection of the most relevant sources and the identification of key criteria for analysis. The primary objective of this initial step is to determine a representative housing typology in Algeria along with its energy consumption data. Since governmental authorities develop the majority of the collective housing projects in Algeria, these projects offer better data availability and reliability for analysis, particularly given that the Algerian residential building stock represents 10 million units [2,3]. There are a number of subtypes within this category of collective housing that cater to various societal segments, most of which have been developed by the Algerian government over the last few decades to alleviate the housing problem.

3.1.1. Data Sources

The first set of data, representing collective housing typologies in Algeria, was collected from several government sources, such as the Algerian Ministry of Housing, Urbanism and City (MHUV) [3], the housing department of Algiers’s Province [26], and the housing improvement and development agency (AADL) [27]. This dataset includes statistical information on the launch, the delivery, and the distribution of the various types of collective housing constructed in the last few decades.
The second set of data has been collected from the National Natural Gas and Electricity Distribution company (Sonalgaz) [28]. It provides statistics of the residential energy consumption in a neighborhood with 1500 housing units over three successive years (2022, 2023, and 2024), respecting customers’ anonymity. Both sets of data represent the most recently available statistics on the representative collective dwelling and its energy consumption.

3.1.2. Selection Criteria

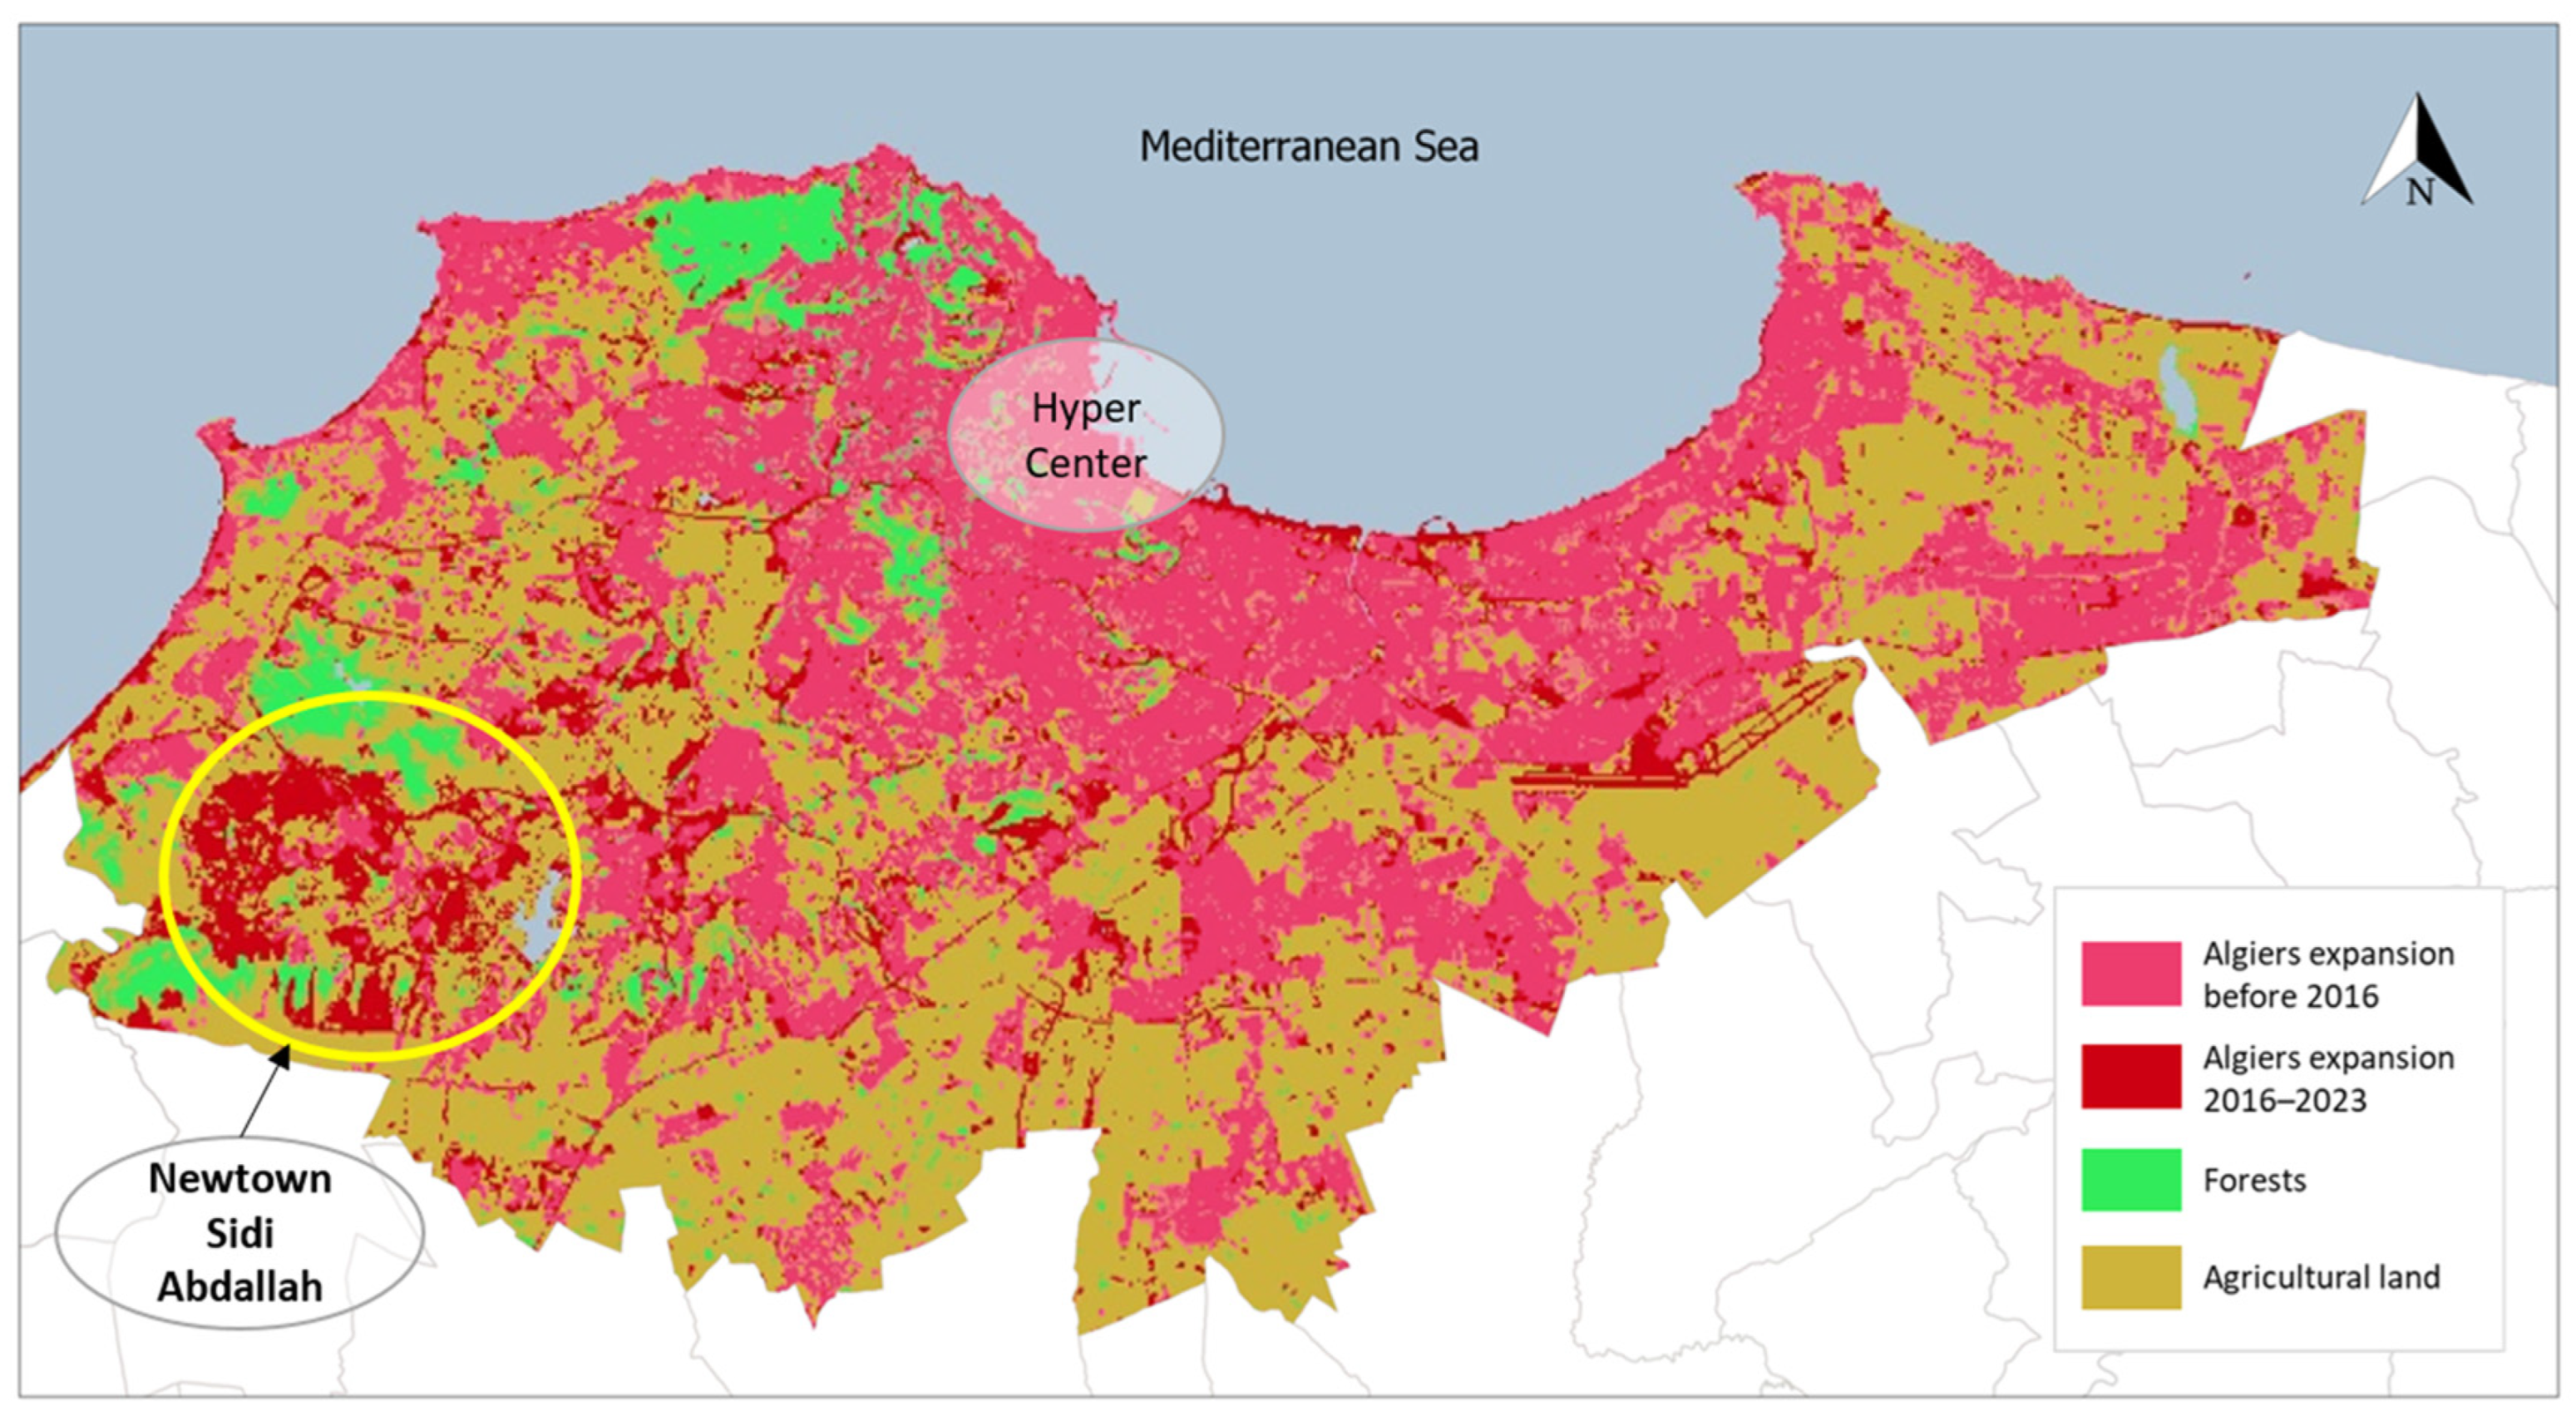
The selection of Sidi Abdellah as the study site was guided by both its climatic representativeness and its strategic role in Algeria’s national housing policy. The new town of Sidi Abdellah, located approximately 25 km southwest of central Algiers, has undergone rapid urban development since 2016, primarily through the AADL public housing program, which targets middle-income households. While the national residential development program aims to build 1.4 million housing units across the country, a significant share will be concentrated in northern Algeria [5], particularly in Climatic Zone A, where the population density and housing demand are highest (See Figure 2).
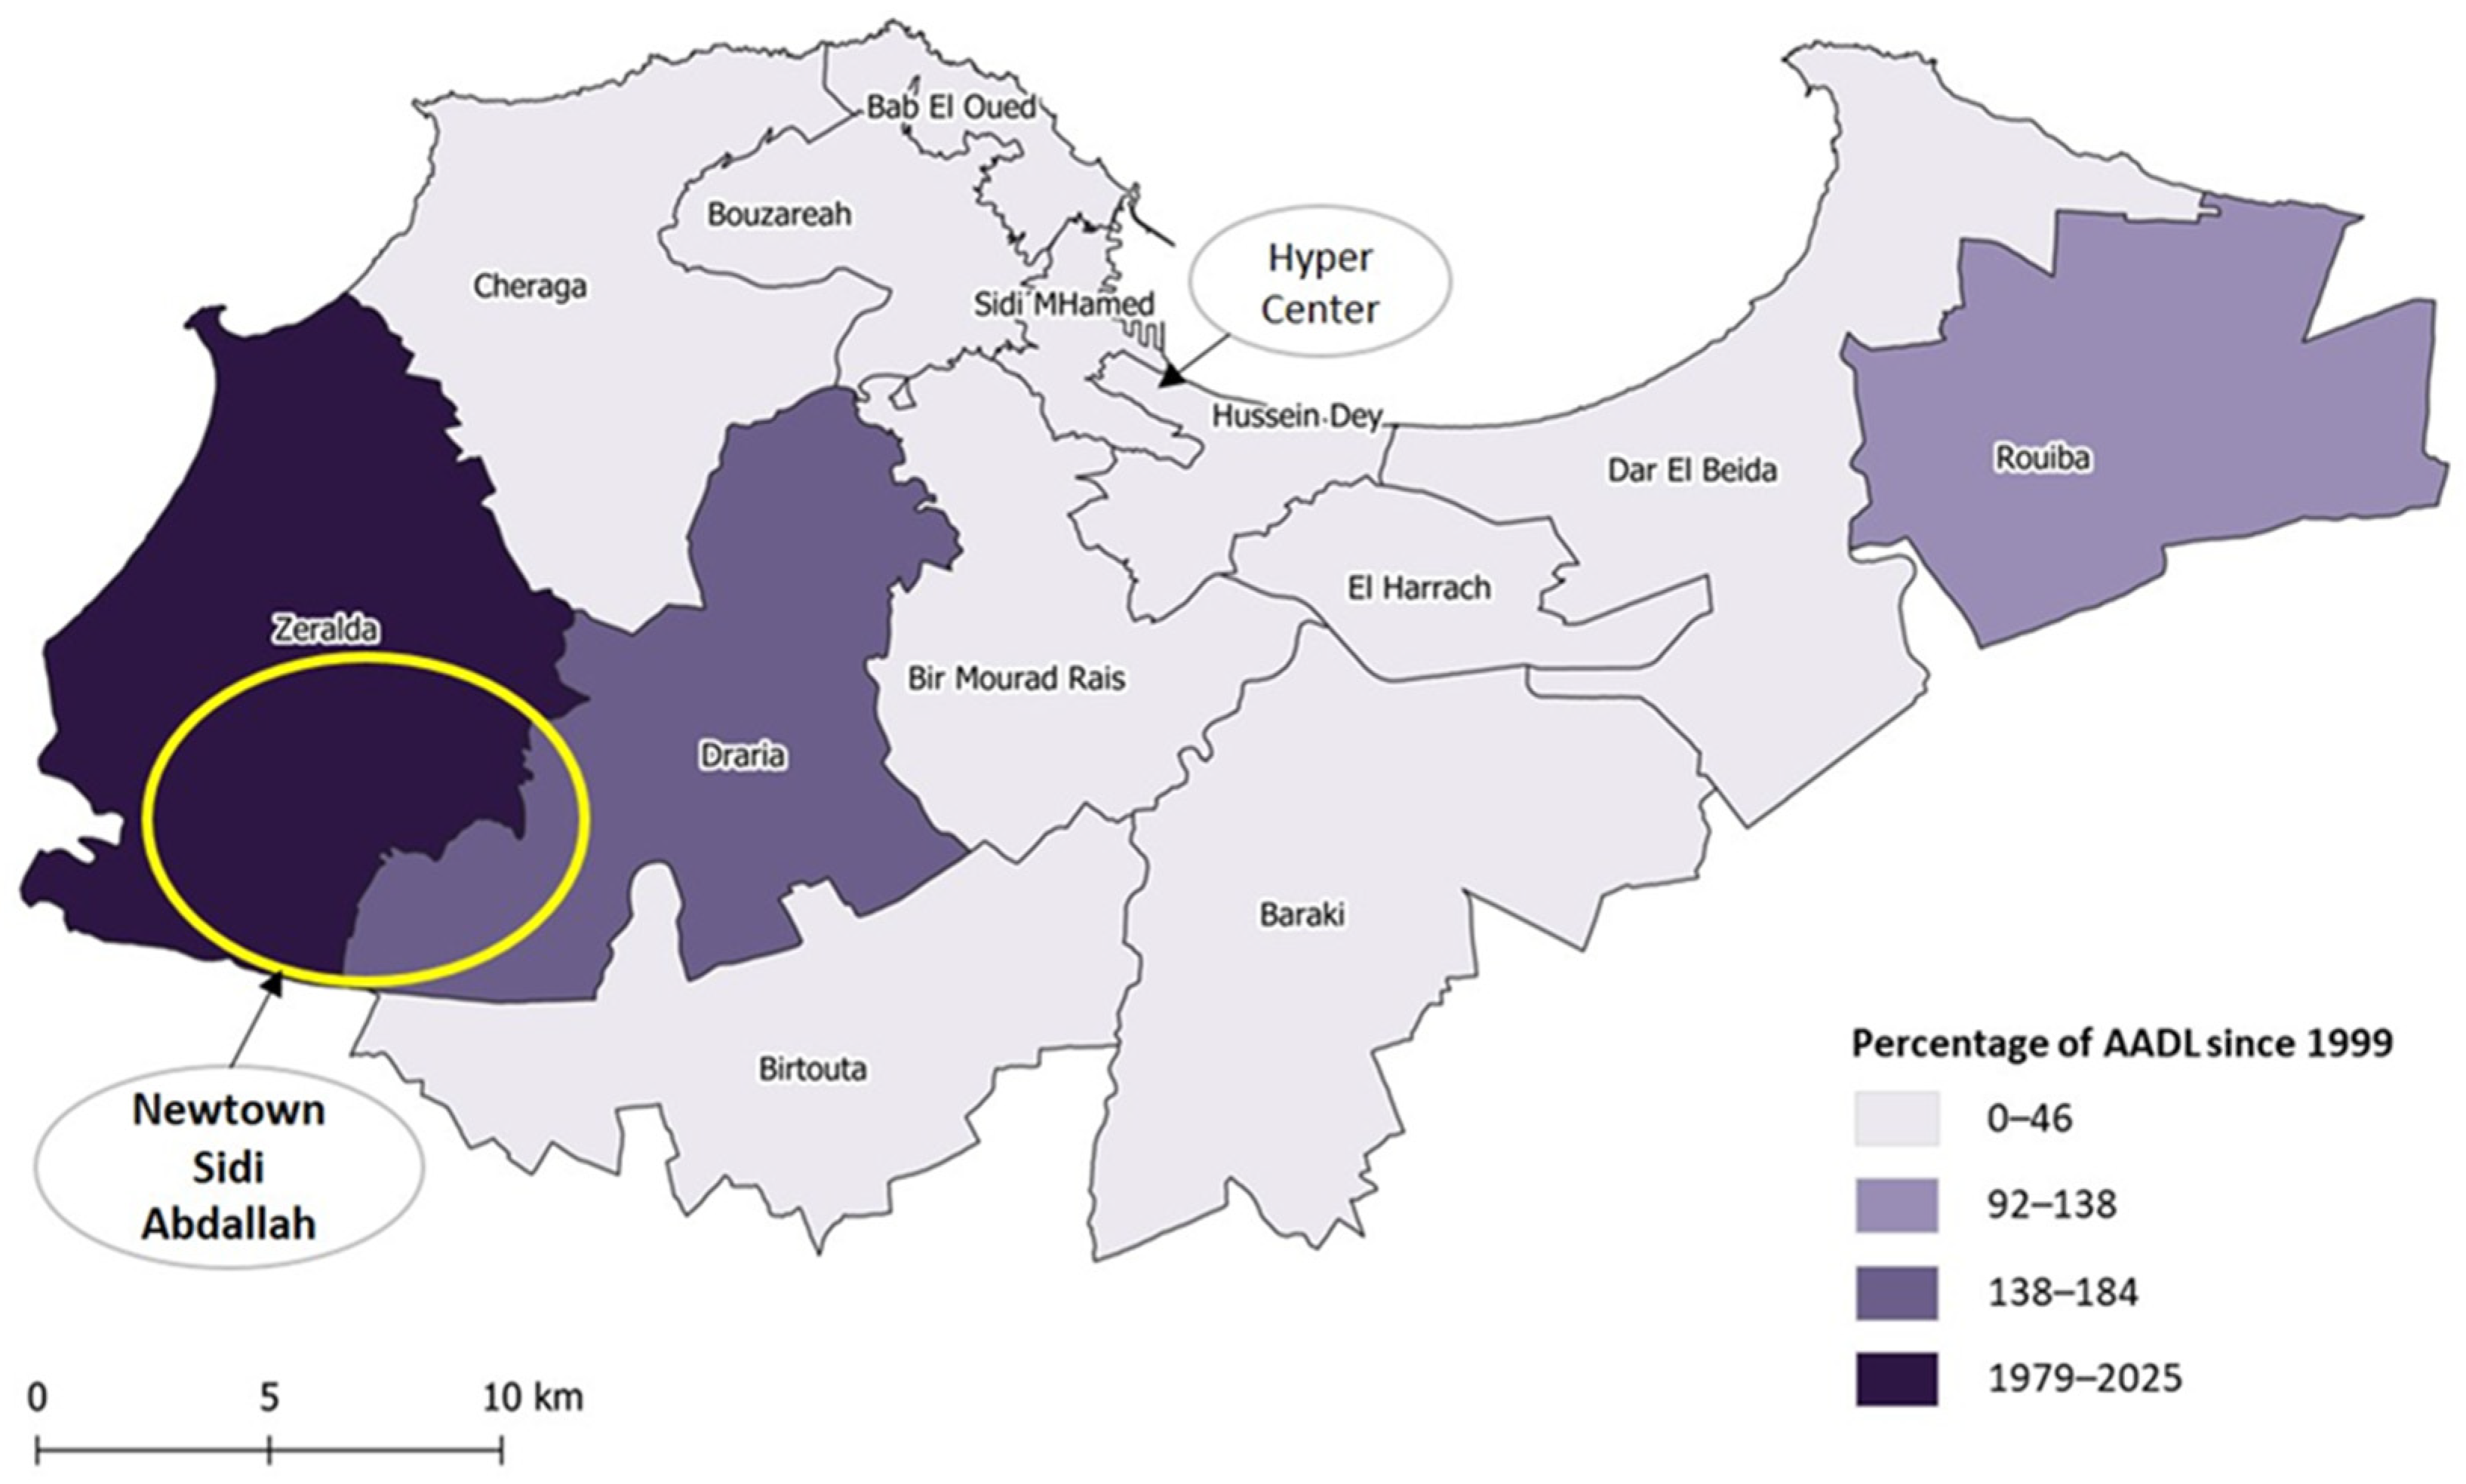
According to Algiers housing department, since 1999, the highest number of housing units that have been built in the city is the AADL housing type. It is, indeed, one of the most widespread housing types in Algeria, with 502,776 units built during the last decade [3]. Moreover, the present study targets the municipality of Sidi Abdallah (in Zeralda, Algiers), because the AADL type of housing accounts for the largest number of constructed housing units (see Figure 3).

3.1.3. Case Study

This study focuses on the new town of Sidi Abdallah, located in the Algiers metropolitan area and situated within Climate Zone A, which is known for its hot, dry summers and mild, humid winters, with a current population of approximately 450,000 [3]. Sidi Abdalah has emerged as a key site on Algeria’s national housing strategy, particularly under the AADL program targeting middle-income households. The selected district within Sidi Abdallah consists of 1500 recently delivered multi-family housing units with homogeneous construction (see Figure 4 and Figure 5).

3.1.4. Data Cleaning and Data Transformation

At first, a data-cleaning process was carried out specifically for residential energy consumption, in which the outliers were removed. The outliers corresponding to vacant flats that are unoccupied for a portion of the year were suppressed in order to avoid undermining residential energy-consumption behavior.
Considering that Algerian residential energy consumption is measured quarterly, a subset of 295 housing units was selected from an initial sample of 1500, based on the criterion of continuous occupation over all four quarters of each year during the study period (2022–2024). This approach ensures consistency and reliability in analyzing seasonal and interannual variations in energy consumption.
To ensure the reliability of the dataset and to reflect actual occupancy-related consumption, the data-cleaning process focused on excluding abnormally low consumption values, particularly those close to 0 kWh recorded during one or more consecutive trimesters. Such values interpreted as indicators of non-occupancy rather than valid residential energy use and were thus removed. In contrast, extremely high consumption values were retained, as the national utility company confirmed them as accurate meter readings. These high values were considered representative of energy-intensive user behavior and were essential for capturing the full variability of residential consumption patterns.
Then, the unit of measurement that concerns energy consumption used in this database, such as “thermie” for natural gas consumption, was converted into kilowatt-hours (kWh) using the energy conversion factor. This conversion helps to calculate the total energy consumption per housing unit.

3.2. Data Processing

In order to understand the energy behavior of the multi-family housing type that is most representative of what has been recently built at the metropolitan scale, a combination of approaches was adopted, involving, firstly a descriptive statistical analysis and a visualization of energy behavior, secondly, the development of a clustering approach, and finally a determination of the energy performance intensity index (EPIs) per square meter (kWh/m2) and per occupants (kWh/capita).

3.2.1. Analysis and Visualization of the Trends in Residential Energy Use over Time

In this section, a statistical analysis is conducted in order to identify the temporal evolution of electricity and natural gas consumption at the unit scale. This can be achieved through a classification into four quarters representing the official energy consumption trimester (see Table 3). The objective is to examine how energy use changed in the first year of occupancy in comparison to later years, during the four quarters, and according to the kind of energy used.
For a better interpretation of the variations in energy consumption of electricity and natural gas consumption, two climatic indicators are used to interpret variations in residential energy consumption. The Heating Degree Days (HDD) and the Cooling Degree Days (CDD) were calculated over the three years and the four trimesters [29]. These indicators are used to measure the difference between the outside temperature and a comfort temperature, set at 18 °C. The HDDs are the sum of the daily differences between the outside temperature and 18 °C when the temperature is below this threshold [29]. The calculation equation for the HDDs is as follows:
HDD = i = 1∑nmax(Tbase − Tavg,i,0)
where Tavr,I is the average outdoor temperature of day I (in °C) and Tbase is the base temperature (commonly 18 °C).
They therefore quantify heating demand over a given period, in our case study the four trimesters of the year. On the other hand, the CDDs measure the sum of daily variations when the outside temperature exceeds 18 °C, indicating an increased need for air conditioning [29]. The calculation equation for the CDDs is as follows:
CDD = i = 1∑nmax(Tavg,iTbase,0)
where Tavr,i is the average daily outdoor temperature and Tbase is the base temperature for cooling (commonly 18 °C).

3.2.2. Clustering of Electricity and Natural Gas Consumption According to Energy Prices

In order to identify the residential energy consumption profile of multi-family housing units since their delivery date to households, which means over the three periods 2022, 2023, and 2024, a hierarchical cluster analysis is performed to group the housing units with a similar energy consumption profile (electricity consumption, and natural gas consumption).
The clustering approach adopted in this study relies on the official consumption brackets defined by the electricity and natural gas regulatory commission (CREG), under decision n° D/22-15/CD of the 29 December 2015, which established the electricity and natural gas tariffs (excluding taxes) applicable from 1 January 2016 [30]. These pricing brackets follow a progressive block tariff structure aimed at encouraging energy conservations. By aligning our clusters with these regulatory thresholds, this paper provides a classification that reflects real-world billing logic and enables a more meaningful interpretation of residential consumption behaviors in relation to national energy pricing structures. This also facilitates potential insights into the socio-economic impact of tariff structures and supports the design of more adaptive and targeted energy-management strategies.
This analysis is executed using R software version 3.6.1 according to the following steps:
Step 1: the energy data are first processed into a data matrix with rows representing 295 multi-family housing units and columns representing electricity and natural gas consumption for three years, 2022, 2023, and 2024.
Step 2: hierarchical ascending classification is then carried out using the distances between units. The cluster agglomeration method employed in this study is based on the official classification of the national natural gas and electricity company (Sonalgaz) into four groups. Each group represents an energy consumption with a different energy price, and the goal is to make households more aware of their energy consumption, under the current government energy strategy aimed at energy consumption reduction (see Table 4).
Step 3: a variation of the cluster analysis is compared in order to identify the hierarchy of residential energy consumption according, on one hand, to the four quarters’ profiles, and on the other hand, to the type of energy used (electricity and natural gas; Table 4).

3.2.3. The Energy Performance Intensity Index (EPI) of Multi-Family Housing Units

In research on building energy benchmarking, the energy performance intensity index (EPI) represents an important factor [31]. It represents the rate of energy consumption, which helps to select energy-efficient technology during the design phase [16]. In this study, the annual energy consumption per square meter and per household size were calculated in order to determine the performance of multi-family housing units, according to the following formulas:
EPI_area = E_total/A
where The EPI _area is the energy performance index per square meter (kWh/m2/year), E_total is the annual energy consumption (electrcity and natural gas) in kWh, and A is the average floor area of the dwelling of 85.37 m2 for four-bedrooms plats (F4) and 70.29 m2 for three-bedrooms flats (F3).
EPI_hh = E_total/N
where Epi_hh is the energy performance index of household members (kWh/person/year), and the household size corresponds to the average size of householders [22].
E_total is the annual energy consumption (electricity and natural gas) in kWh, and N is the average household size.

4. Results and Discussion

4.1. Evolution of Annual Multi-Family Energy Consumption (2022–2024)

Between 2022 and 2024, residential electricity consumption in Algeria increased steadily from 2250 kWh/year/housing unit to 2400 kWh/year/housing unit, likely due to the growing reliance on household appliances. This trend highlights the urgency of implementing energy efficiency measures. In contrast, natural gas consumption decreased from 11,500 thermies/year/housing unit to approximately 8000 thermies/year/housing unit, possibly due to climate-related reductions in heating needs. These shifts underline the importance of adapting residential energy strategies for evolving demand patterns and environmental factors (See Figure 6).

4.2. Dispersion and Temporal Evolution of Multi-Family Energy Consumption per Type of Energy and per Trimester

4.2.1. Electricity Consumption During 2022, 2023, and 2024

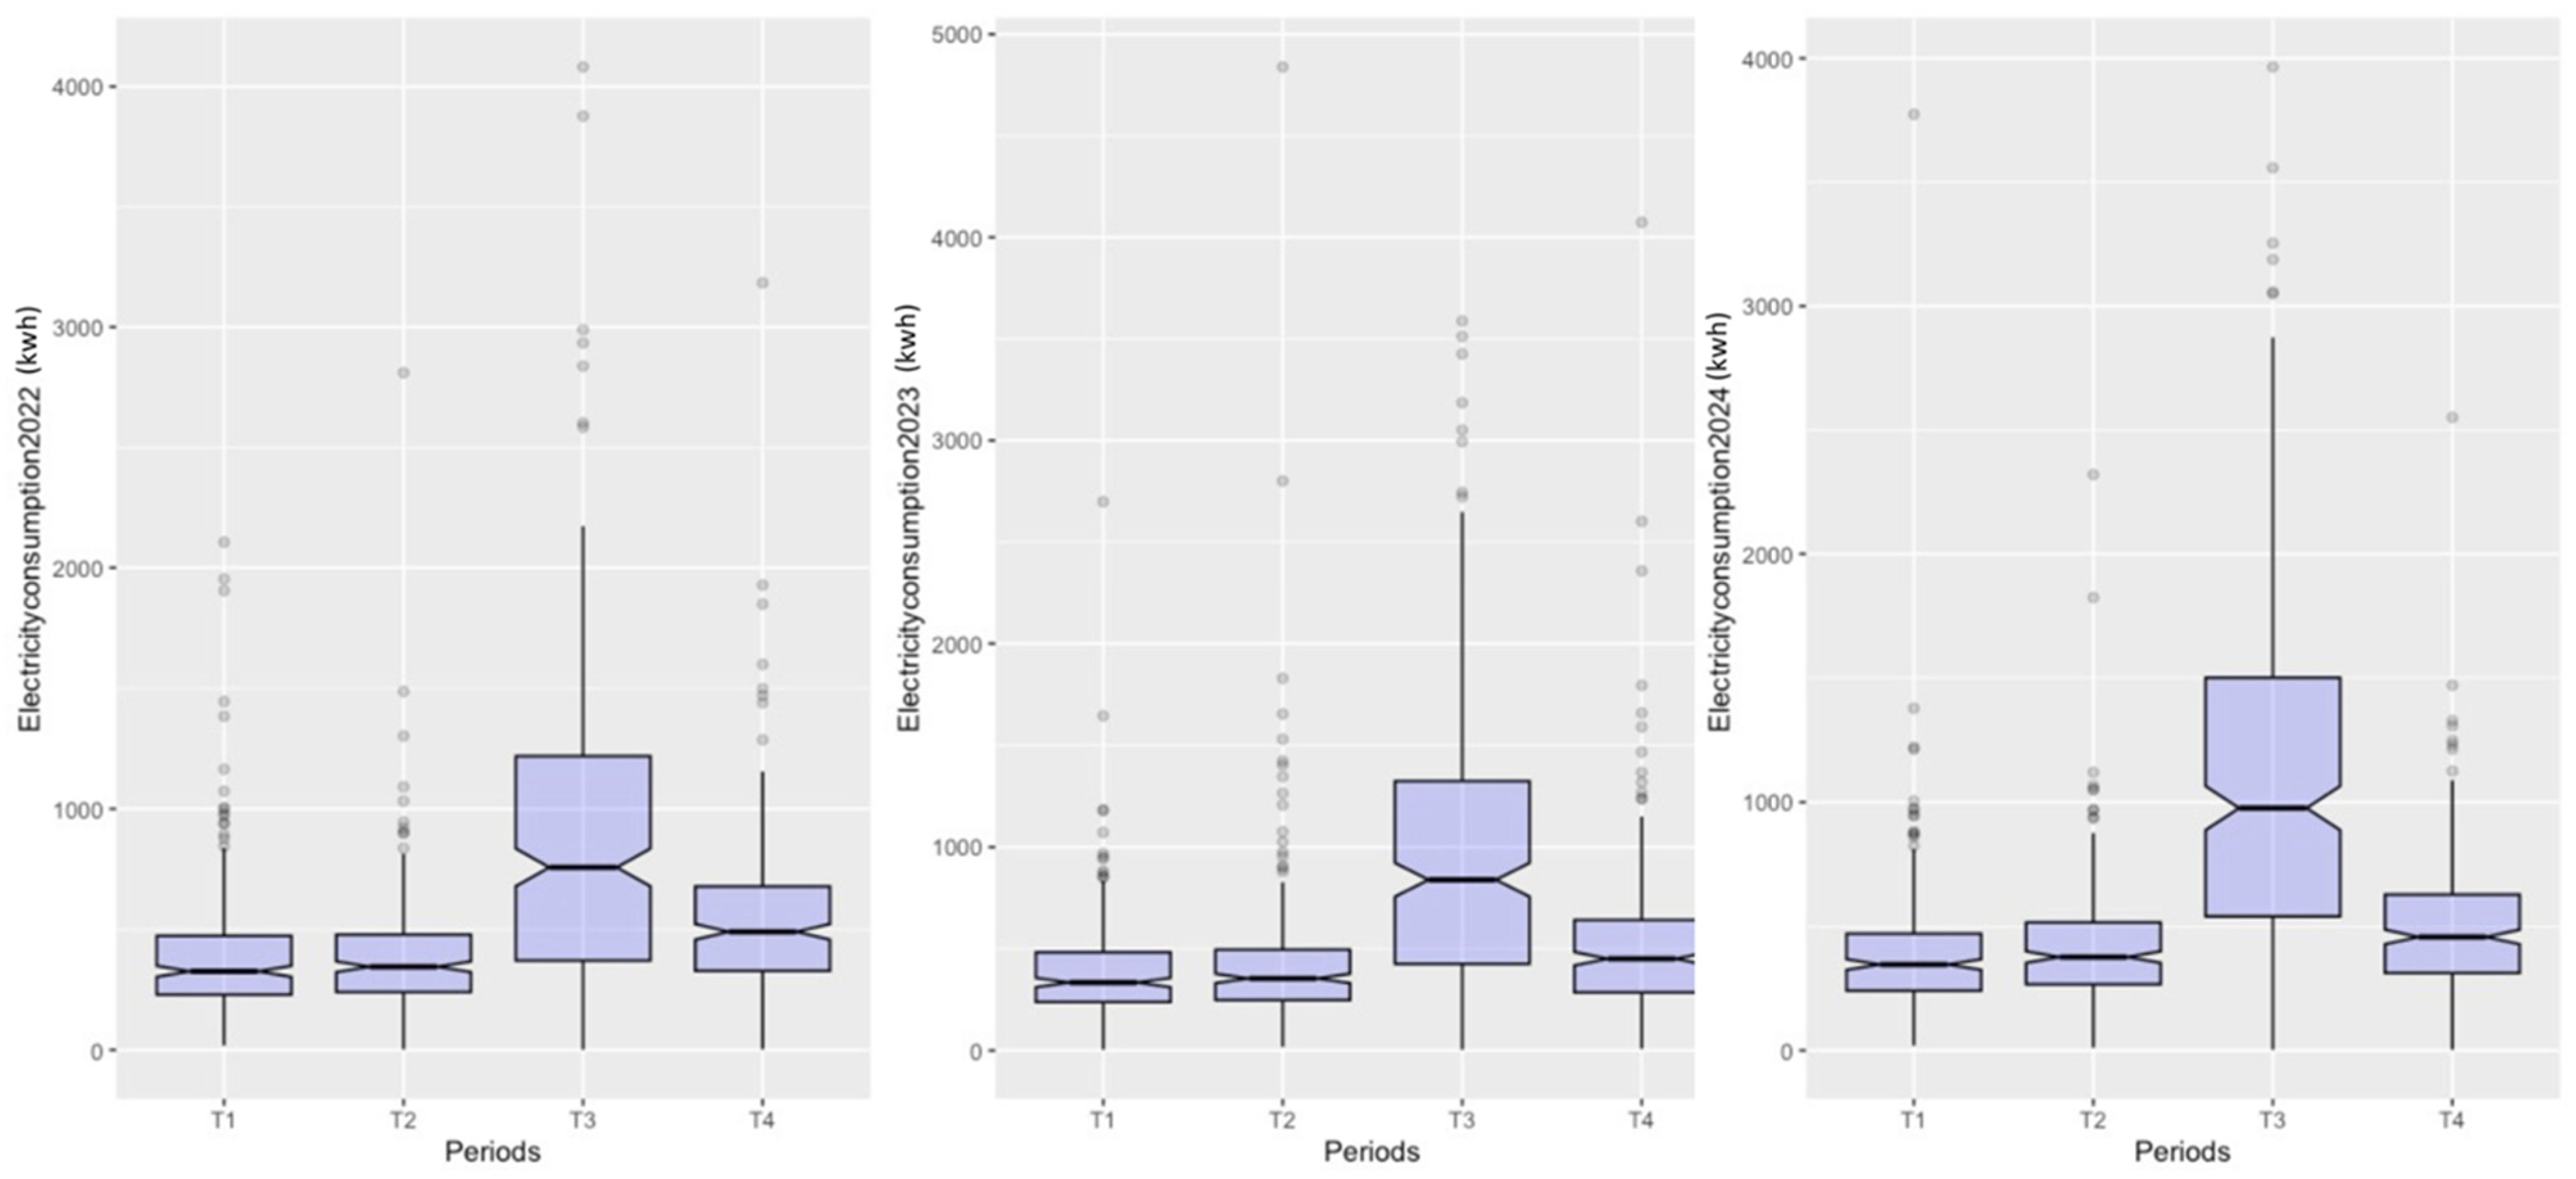
The box plots presented in Figure 7 show the distribution of residential electricity consumption for the four semesters of the years 2022, 2023, and 2024. Each trimester is defined as follows: T1 (20 November–20 February), T2 (21 February–20 May), T3 (21 May–20 August), and finally T4 (from 21 August–20 November). The box plots show the dispersion, medians, and outliers for each period.
In 2022, the median consumption was relatively stable for trimesters T1, T2, and T4, with values below 250 kWh. The interquartile range (IQR) for these trimesters was small, indicating relative homogeneity in household consumption. In contrast, the third trimester T3 from 21 May to 20 August shows a marked increase in electricity consumption with a noticeable spread and several outliers above 1000 kWh, some as high as 3000 kWh, revealing the existence of households with high electricity consumption during this summer period.
During 2023, the energy trend continues, with T1, T2, and T4 showing medians below 250 kWh and relatively low variability. T4 again stands out, with a higher median, close to 600 kWh. This period shows the greatest dispersion of the three years studied. The presence of outliers is even more pronounced in T3, with some reaching over 4000 kWh, highlighting an increase in electricity consumption by specific households. This polarization indicates a concentration of consumption peaks during the summer season.
In 2024, the results confirm the observations of previous years, with stable medians for T1, T2, and T4 at around 250 kWh and relatively modest variability. T3 continues to stand out for its higher consumption, with a median in excess of 600 kWh, and a wide spread. In addition, several outliers are observed during T3, with consumption reaching up to 3500 kWh. This recurring behavior during the summer suggests increased energy requirements during this period, probably linked to the intensive use of air conditioning or other energy-consuming equipment.
The results reveal a marked seasonal variation in electricity consumption, with a significant rise during T3, likely linked to summer temperatures and the increased use of air conditioning. This period also showed the greatest dispersion in consumption and an increased number of outliers, some exceeding 4000 kWh, indicating particularly intense use in some households. In comparison, semesters T1, T2, and T4 show stable and less dispersed consumption, with medians close to 250 kWh, reflecting energy needs that are less influenced by seasonality, particularly due to the absence of electric heating. The inter-annual stability of non-summer trimesters T1, T2, and T4 contrasts with the more volatile summer consumption, underlining the importance of demand-management strategies targeting the summer period. The peaks in consumption that are observed justify action in terms of energy efficiency and pricing policies to mitigate the effects of the high demand during the summer.
Despite the general assumption that high energy consumption correlates with higher income, the findings in this study challenge that logic within the context of Algerian middle-income housing. The analyzed housing typology, developed under the AADL public program, is legally restricted to households not exceeding a defined income threshold [27]. As such, the observed extreme electricity consumption values, particularly during the third trimester (T3), are more likely attributed to inefficient energy use (e.g., continuous air conditioning or old air-conditioning equipment, which consume much more energy than new equipment with a green energy label) than to luxury-oriented consumption. These consumption spikes highlight the need to reconsider the existing tariff segmentation established by the CREG (decision D/22-15/CD) of 29 December 2015) [30], which may not sufficiently penalize excessive use. A more nuanced tariff system that accounts for both socio-economic eligibility and consumption behavior would better incentivize energy-saving practices within subsidized housing programs.

4.2.2. Natural Gas Consumption During 2022, 2023, and 2024

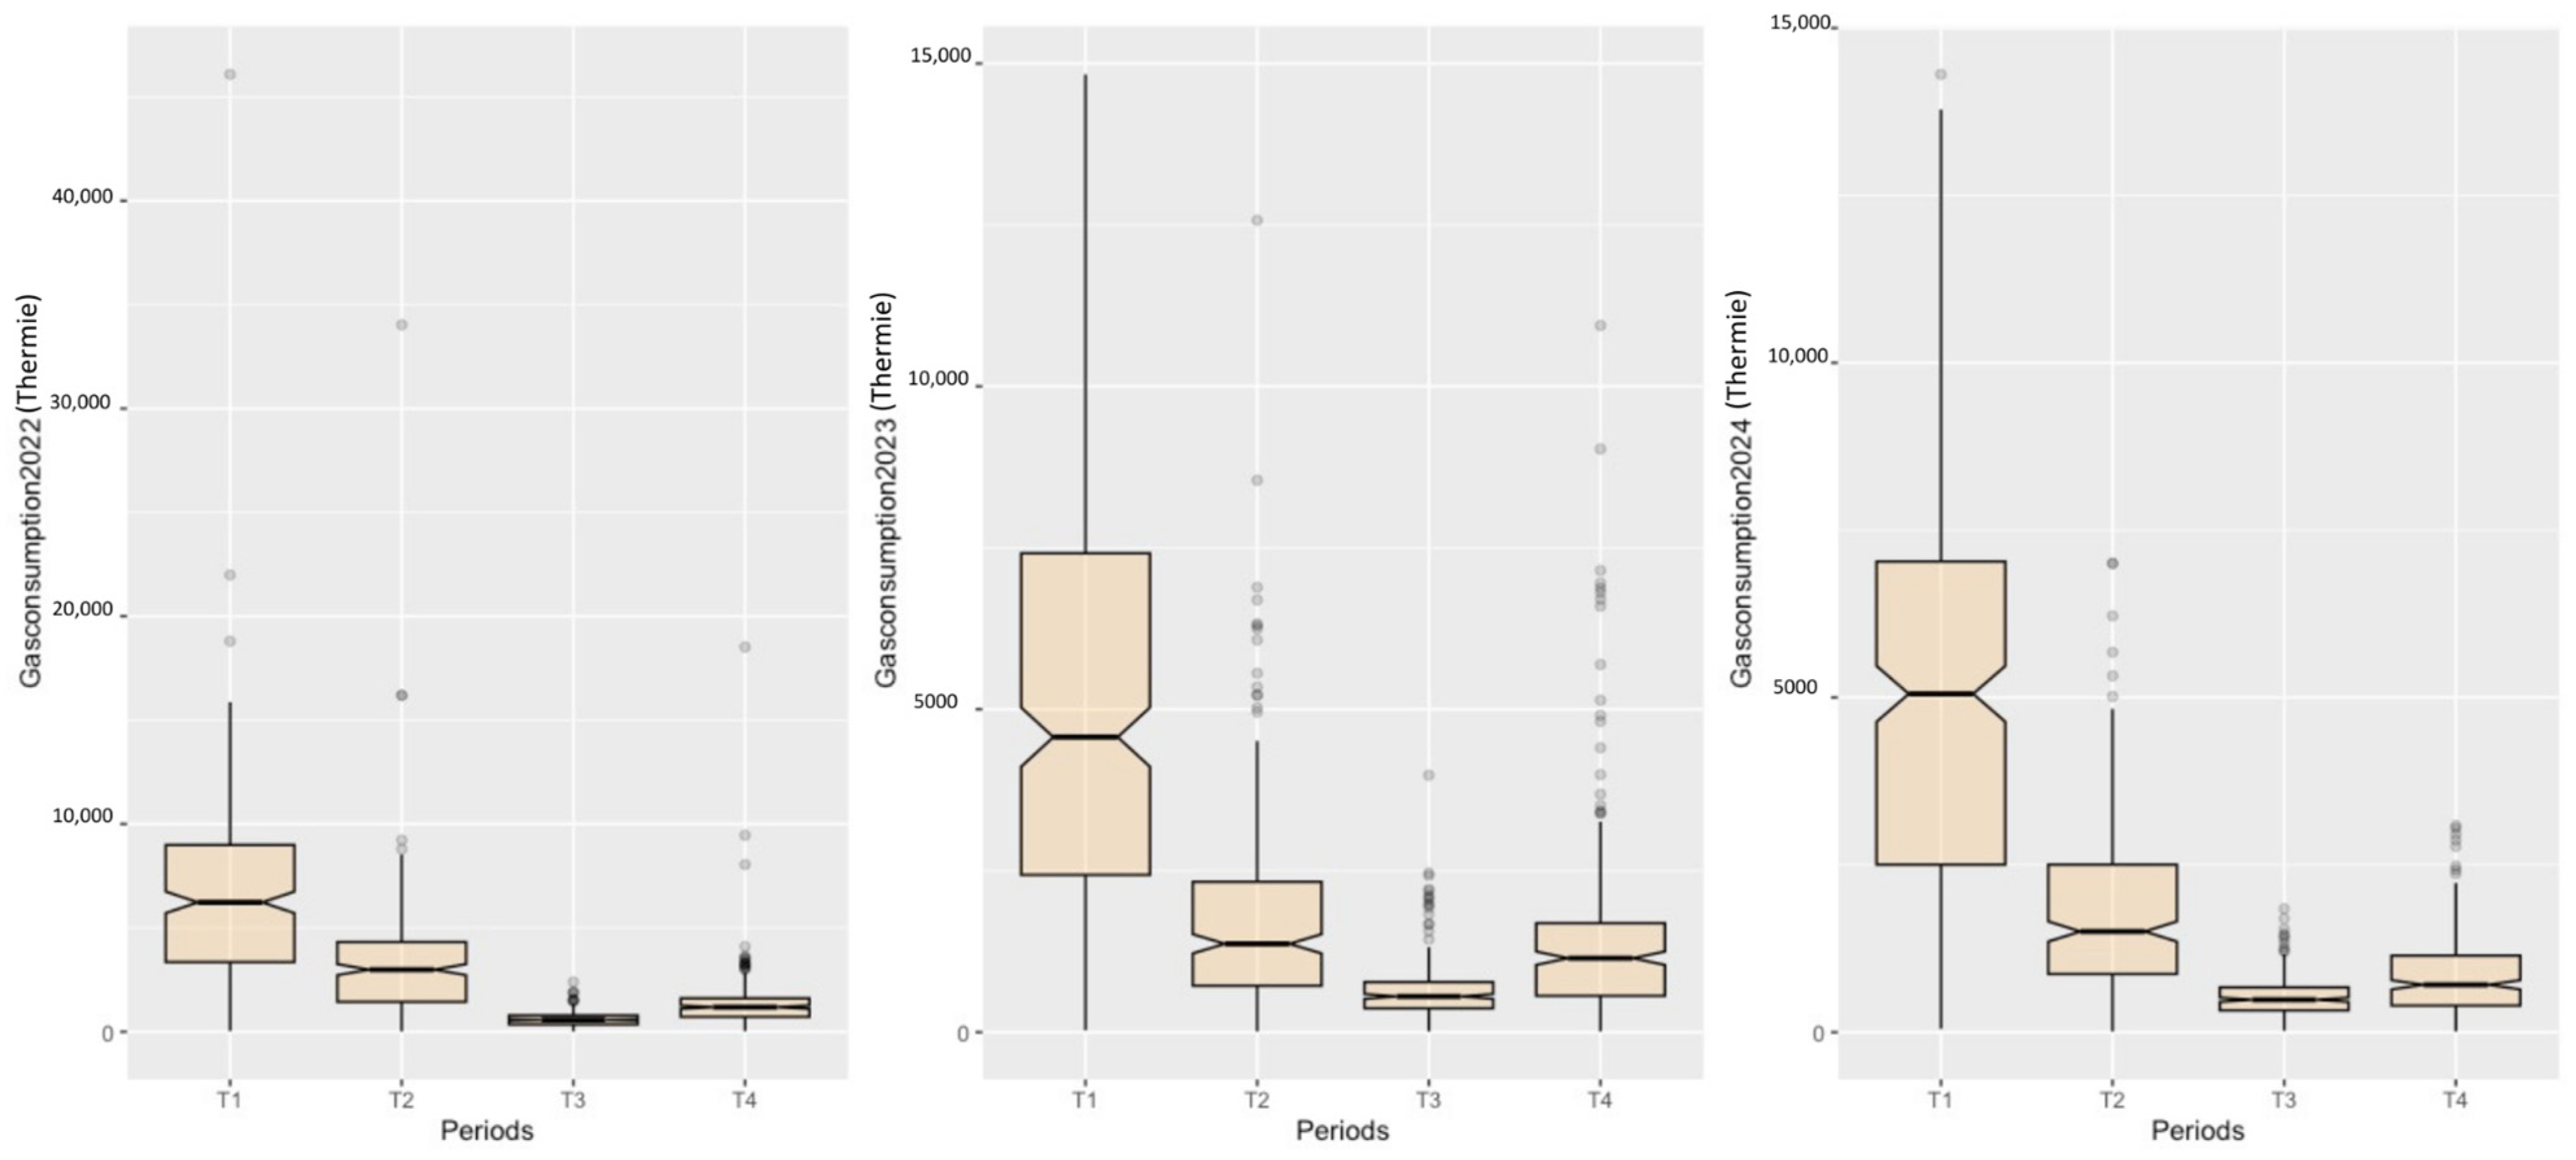
The box plots of natural gas consumption between 2022 and 2024 (see Figure 8), broken down by semester (T1: from 20/11 to 20/02, T2: from 21/02 to 20/05, T3: from 21/05 to 20/08, and T4: from 21/08 to 20/11), reveal significant variations depending on the period and the year.
In 2022, significant variability in consumption is observed during T1, with a wide spread around the median (around 5000 thermie), and several outliers reaching extreme levels above 40,000 thermie. This suggests higher consumption in winter, probably due to heating needs. On the other hand, the other semesters show a marked decrease, with a concentration around lower values, particularly in T3 (summer) where consumption remains low, indicating less demand for gas during the summer.
In 2023, the overall trends remain similar to those in 2022, but the spread in T1 is less pronounced with a reduction in extreme values. Median consumption in T1 is slightly lower than in 2022, which could suggest an optimization or reduction in consumption during this period. Consumption levels remain relatively low in T2, T3, and T4, confirming a marked seasonal pattern.
During 2024, the pattern observed remains similar, with a more marked concentration of consumption around the median in T1, suggesting greater regularity in energy requirements. The absence of large outliers above 15,000 thermie in T1 could indicate better management of energy resources or efficiency measures put in place. In T3 and T4, consumption remains stable with few fluctuations, as observed in previous years.
Analyses of the box plots for the three years show a marked seasonality in natural gas consumption, with increased consumption during T1, coinciding with the winter months. This trend is expected due to heating requirements, in particular that it is a newly built project that has been delivered with a natural gas heating system. The decrease seen in T2 and T3 illustrates reduced demand during the warmer months, in line with seasonal weather expectations.
Comparatively, 2022 appears to show the greatest variability in gas requirements, particularly with several outliers in T1. This could indicate a variation in the energy demand due to specific factors, such as colder-than-normal temperatures or changes in consumption patterns. In 2023 and 2024, the reduction in the dispersion of the data, particularly in T1, may indicate better consumption practices, the optimization of heating systems, or the impact of policies encouraging reduced energy consumption.
The most likely hypothesis is that the observed improvements in the management of natural gas consumption could be partly explained by climatic factors. Specifically, winters in Algiers are becoming progressively milder [31], which reduces the need for gas heating during the colder months. This climatic trend has been well documented and likely plays a significant role in the reduction of natural gas consumption. Furthermore, the trend towards milder winters has been confirmed based on seasonal temperature averages in recent years, which would decrease the demand for gas heating in collective housing.
The results of this study highlight the importance of managing energy consumption during the winter period and the need for strategies to improve the energy efficiency of homes during this period.

4.3. Visualization of Energy-Consumption Behavior over Time

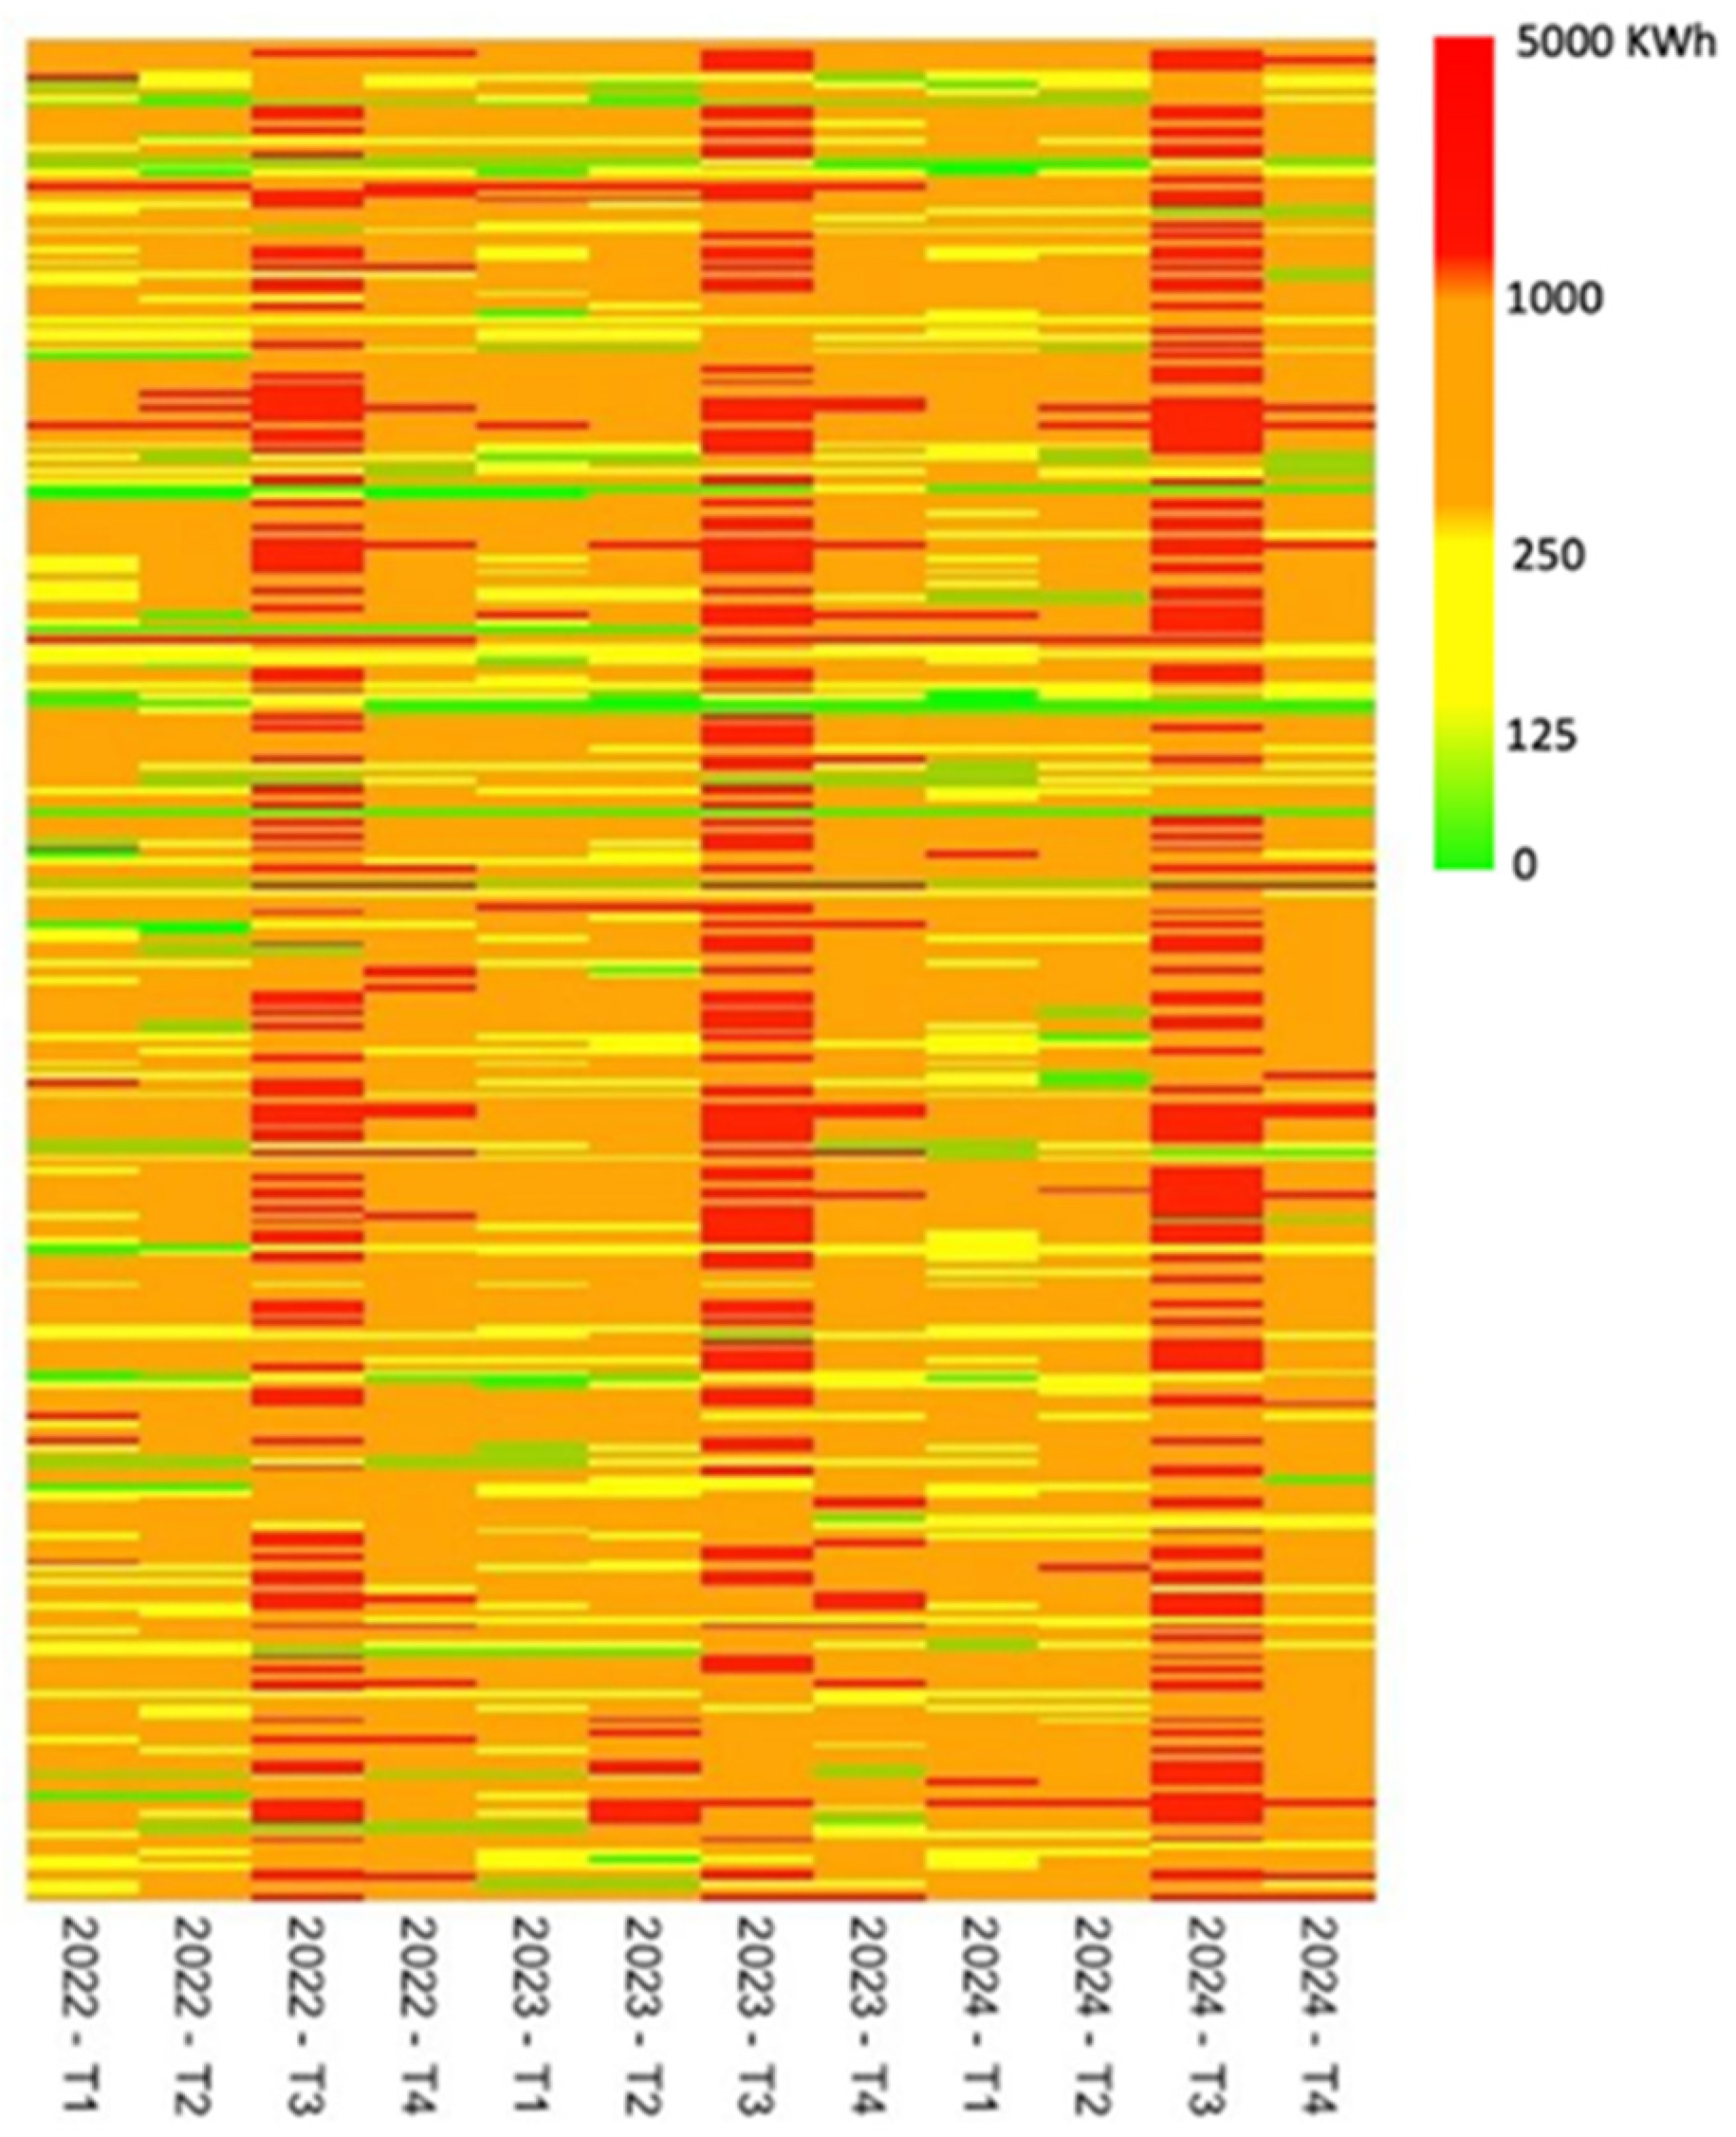
4.3.1. Heat Map of Electricity Consumption (2022–2024)

Figure 9 shows a heat map, which allows for visualizing the distribution of electricity consumption for 295 homes over a three-year period from 2022 to 2024 and for the four semesters of each year. The data have been segmented into four energy-consumption bands. The colors vary according to consumption levels: green representing low consumption (0 to 250 kWh), yellow moderate consumption (125 to 250 kWh), orange intermediate consumption (250 to 1000 kWh), and red high consumption (over 1000 kWh). These bands have been established in accordance with the consumption categories imposed by the electricity distribution companies, in order to encourage a reduction in consumption.
  • Prevalence of Moderate Consumption Across All Periods
The dominant color in the heat map across all years is yellow to orange, indicating that most households consistently consume between 250 and 1000 kWh per quarter. This suggests that the majority of residential electricity consumption remains within an intermediate range, likely reflecting standard household usage patterns, including lighting, appliances, and moderate cooling or heating demands.
However, within this dominant range, subtle variations exist. In 2024, the density of orange–red areas appears higher compared to 2022, suggesting a progressive increase in the household energy demand, which requires further investigation into its underlying causes.
  • Seasonal Peaks and Rising Summer Consumption (T3)
A notable and consistent pattern across all years is the significant increase in high-energy consumption (>1000 kWh) during T3, as indicated by the red zones. This aligns with the summer season, probably the air conditioning and cooling systems driving it. The intensity of red zones increases progressively from 2022 to 2024, suggesting that summers are becoming progressively hotter, pushing households to rely more on energy-intensive cooling systems. This trend poses challenges for the energy supply stability, especially during peak demand hours, and raises concerns about the resilience of the electricity grid in extreme summer conditions.
  • Extension of High Consumption Beyond Summer
While T3 shows the most pronounced increase in high consumption, a secondary observation is the persistence of elevated consumption levels into T4, particularly in 2024. This suggests a possible shift in energy-consumption behavior, where the cooling period extends beyond summer, or that other energy-intensive appliances are being used more frequently during fall and winter.
  • Limited Presence of Low-Consumption Households
The green zones (<250 kWh), representing low-energy-consumption households, are scarce throughout all three years. This finding suggests that very few households consistently maintain low-energy consumption, which can be attributed to several factors, among them the tariff structures that do not sufficiently incentivize low consumption. The diminishing presence of green zones over time further suggests that energy conservation efforts may not be effectively reducing the household demand, necessitating stronger policy measures, such as incentives for energy-efficient appliances, demand-side management programs, and awareness campaigns.

4.3.2. Heat Map of Natural Gas Consumption (2022–2024)

The heat map dominates by green, indicating that gas consumption remains mostly low to moderate, with occasional peaks (yellow, red, and black). Unlike electricity, gas consumption is more seasonal, with extended low-consumption periods. However, variability increases toward the end of 2024, suggesting a potential rise in demand or changing usage patterns (see Figure 10).
For a better interpretation of variations in energy consumption, two climatic indicators are analyzed in the following sections.

4.3.3. Analysis of Energy Consumption Variation According to the Degree-Days (HDD and CDD) per Trimester (2022–2024)

Figure 11 shows the variation in heating Degree Days (HDD) and the Cooling Degree Days (CDD) over the four trimesters from 2022 to 2024 in Algiers. The HDD represents the cumulative temperature deficit below the base temperature, chosen as 18 °C in our study [29], indicative of the heating demand, while the CDD quantifies the excess temperatures above 18 °C, reflecting cooling needs [29].
  • Seasonal trends and energy demand implications
Based on climate data for the three years [32], the first trimester T1 (20 November–20 February) shows the highest HDD values, confirming a significant heating demand during the cold season. The interannual variations in HDD suggest fluctuations in winter severity, which may be linked to global warming effects. Meanwhile, CDD remains negligible, indicating minimal cooling needs.
Regarding the second trimester T2 (21 February–20 May), a progressive decline in HDD is observed, accompanied by a slight increase in CDD. This trend marks the transitional nature of this period, where heating requirements decrease while cooling needs begin to emerge. However, the total degree-day values remain relatively low, suggesting a moderate energy demand.
For the third trimester T3 (21 May–20 August), the highest CDD values are registered, highlighting the dominance of cooling energy consumption. However, the HDD values are absent, confirming that heating demand is virtually eliminated during this period. The intensity of CDD, particularly in 2023, suggests that summers are becoming increasingly warmer, which may indicate a rising demand for air conditioning.
For the fourth trimester T4 (21 August–20 November), a sharp decline in CDD is observed, signaling the end of the cooling season, while the HDD values start increasing due to lower ambient temperatures. This period marks the shift from cooling to heating energy demand, making it a crucial phase for energy planning strategies.
  • Interannual variability and climate change considerations
The comparative analysis between the three years 2022, 2023, and 2024 reveals notable interannual variations. The increase in CDD in 2023 suggests a potential warming trend, while the variations in HDD may indicate milder or more severe winters. The fluctuations could be attributed to broader climatic shifts, necessitating further investigation into long-term temperature trends and their implications for energy systems.
Based on these results, we can suggest that the dominance of CDD in summer, increasing the reliance on cooling systems, emphasizing the need for renewable energy integration, particularly solar-based cooling solutions, has sustainability implications. Conversely, the high winter HDD highlights the importance of efficient heating technologies to minimize energy consumption.
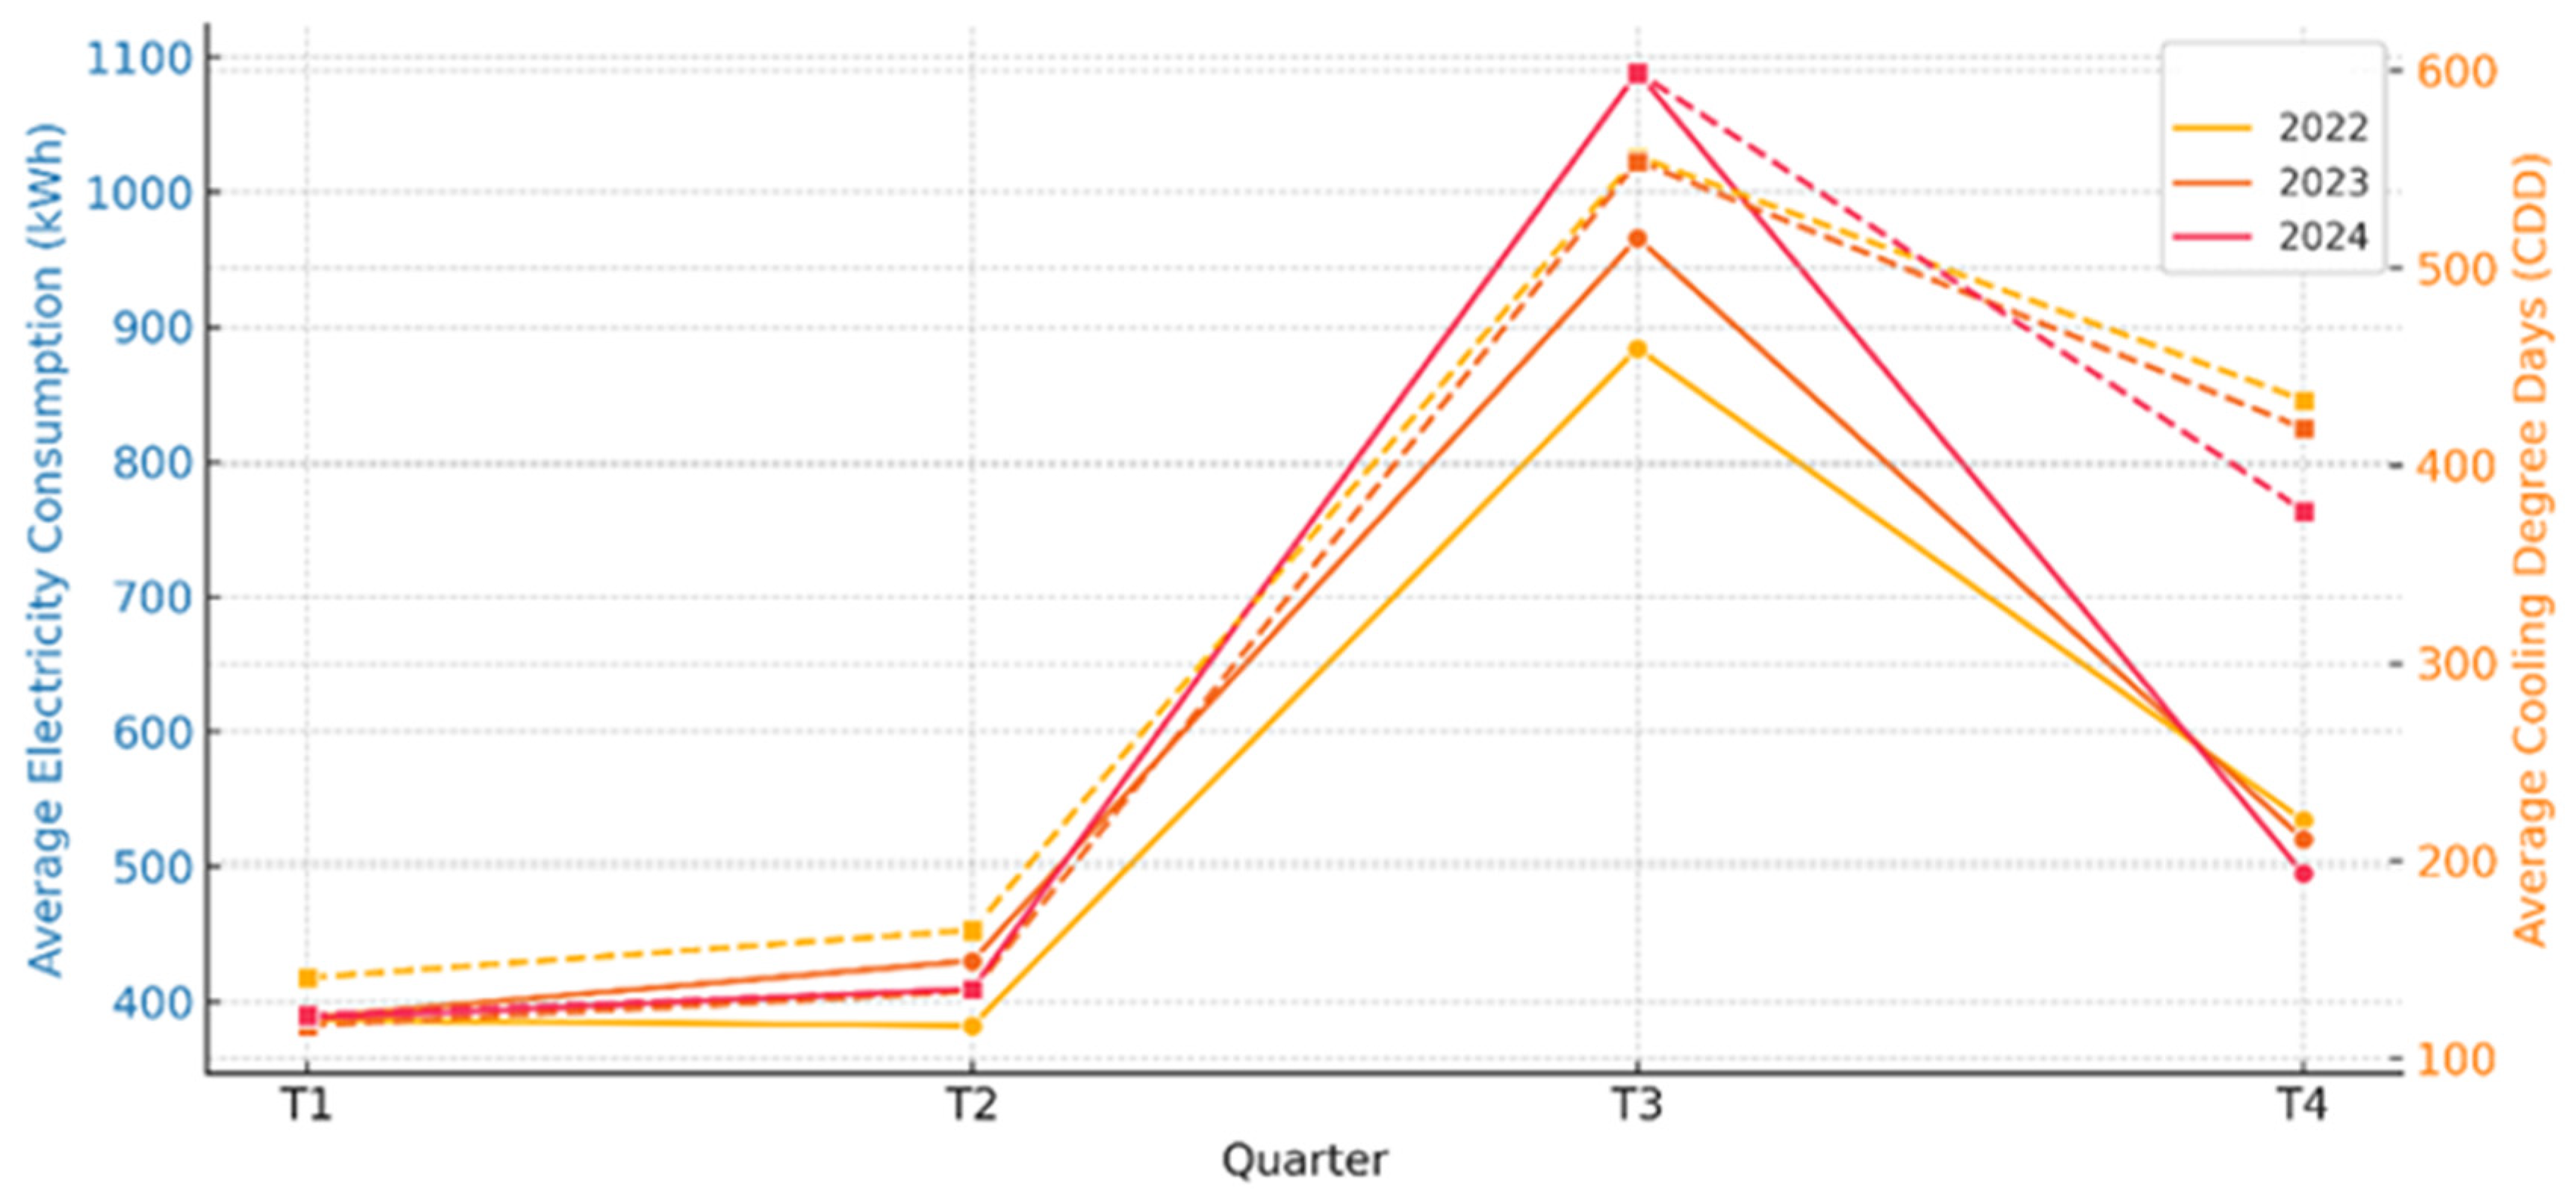
Figure 12 shows the variation in electricity consumption across the four trimesters from 2022 to 2024, alongside the evolution of Cooling Degree-Days (CDD). A clear seasonal trend is observed, where electricity consumption peaks in T3 and decreases in T1 and T4. This trend aligns with the variation in CDD, which shows higher values in T3, indicating a strong influence of ambient temperature on electricity usage.
The observed increase in electricity consumption during T3 can be attributed to a higher demand for air conditioning due to elevated temperatures. Conversely, the lower consumption in T1 and T4 corresponds to a decrease in cooling needs. The strong similarity between the trends of electricity consumption and CDD suggests a significant correlation between these variables, reinforcing the hypothesis that cooling demand is the primary driver of seasonal electricity consumption.
Despite this overall correlation, some variations are noticeable across different years. For instance, the electricity consumption in T3 of 2023 appears slightly higher than in 2022 and 2024, despite comparable CDD values. This discrepancy may be due to factors such as changes in occupancy patterns, variations in appliance efficiency, or shifts in consumer behavior.
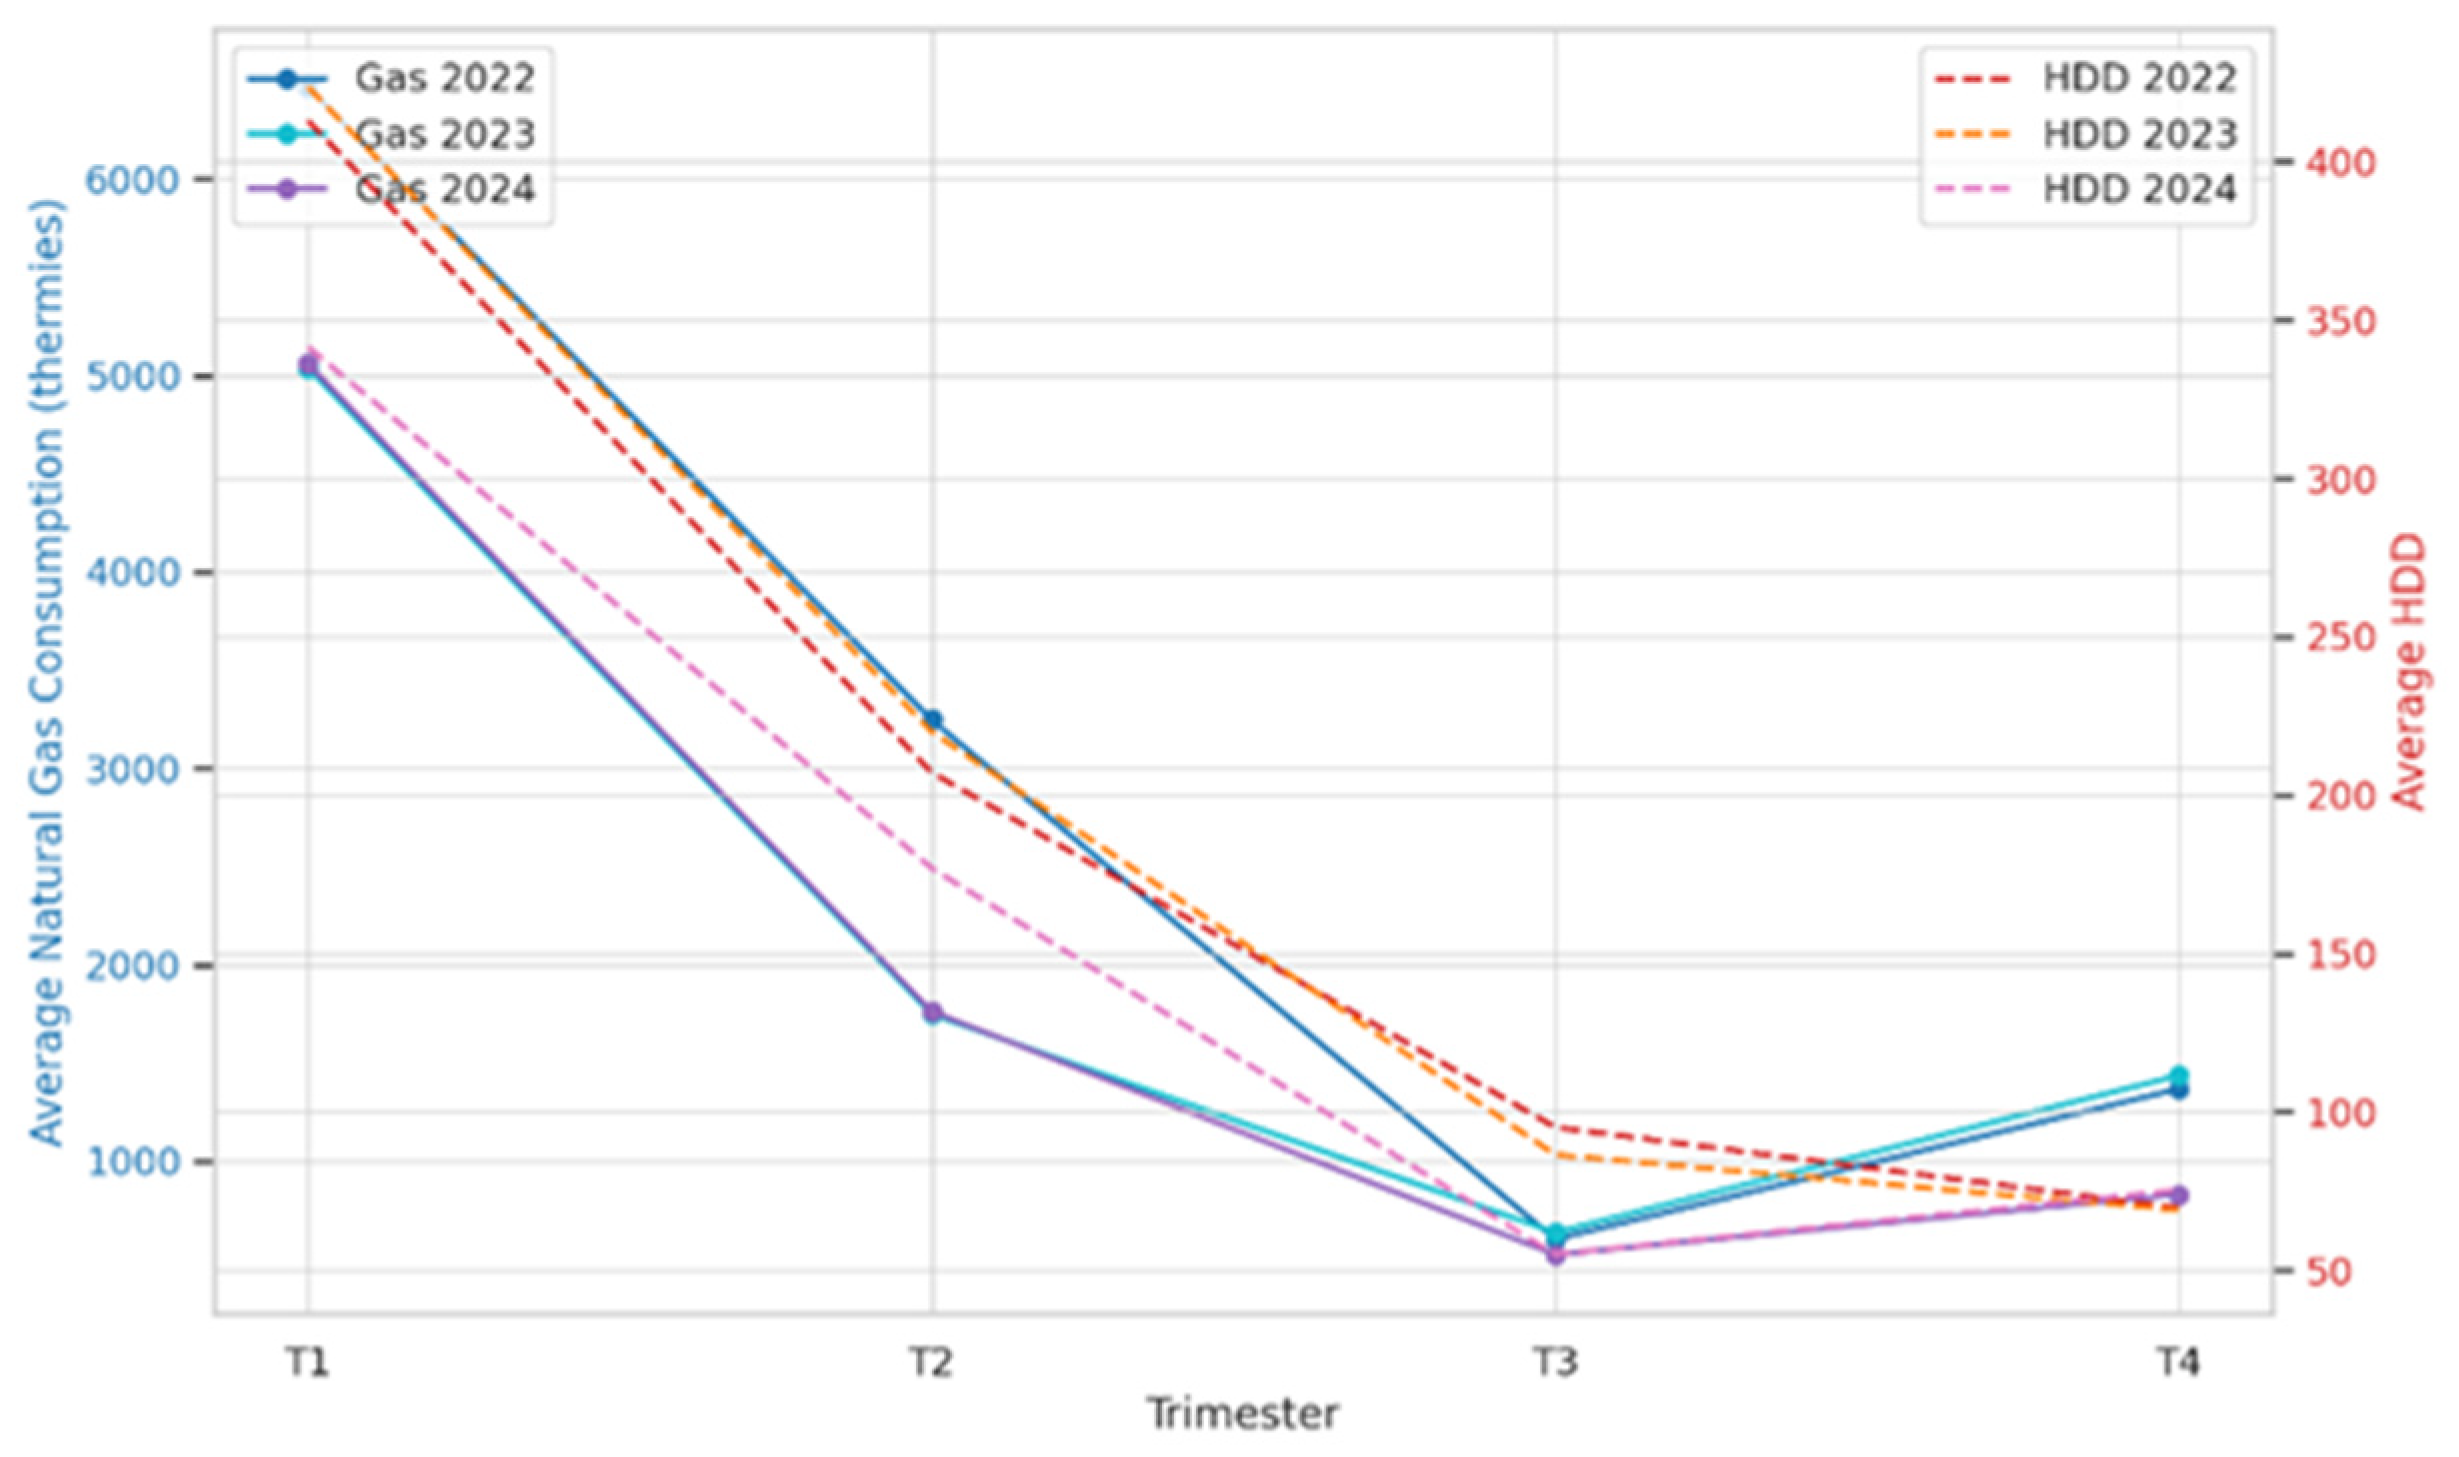
Figure 13 shows the variation in average natural gas consumption (in thermie) and Heating Degree-Days (HDD) for the years 2022, 2023, and 2024, spread over four trimesters. The natural gas consumption follows a marked seasonal pattern, with peaks in trimesters T1 and T4, due to high HDDs, indicating increased heating requirements. Conversely, T2 and T3, with lower HDDs, show a reduction in consumption, confirming the influence of climatic conditions on energy demand for heating.
For the comparison of the interannual consumption, the overall trend is similar for all three years; a slight decrease in gas consumption is observed in 2023 and 2024, although other factors can also influence the trend in gas energy consumption, such as occupant behavior.

4.4. Clustering Analysis Based on Energy Prices

4.4.1. Clustering Analysis of Electricity Consumption Between 2022 and 2024

This study focuses on segmenting the electricity consumption of 295 multi-family dwellings over three years (2022, 2023, and 2024), with an analysis by trimester. The energy consumption clusters were defined according to the graduated prices set by the distribution company to encourage energy-saving consumption. Here, the analysis targets the segmentation of consumption using clusters to identify recurring trends and behaviors over the three years.
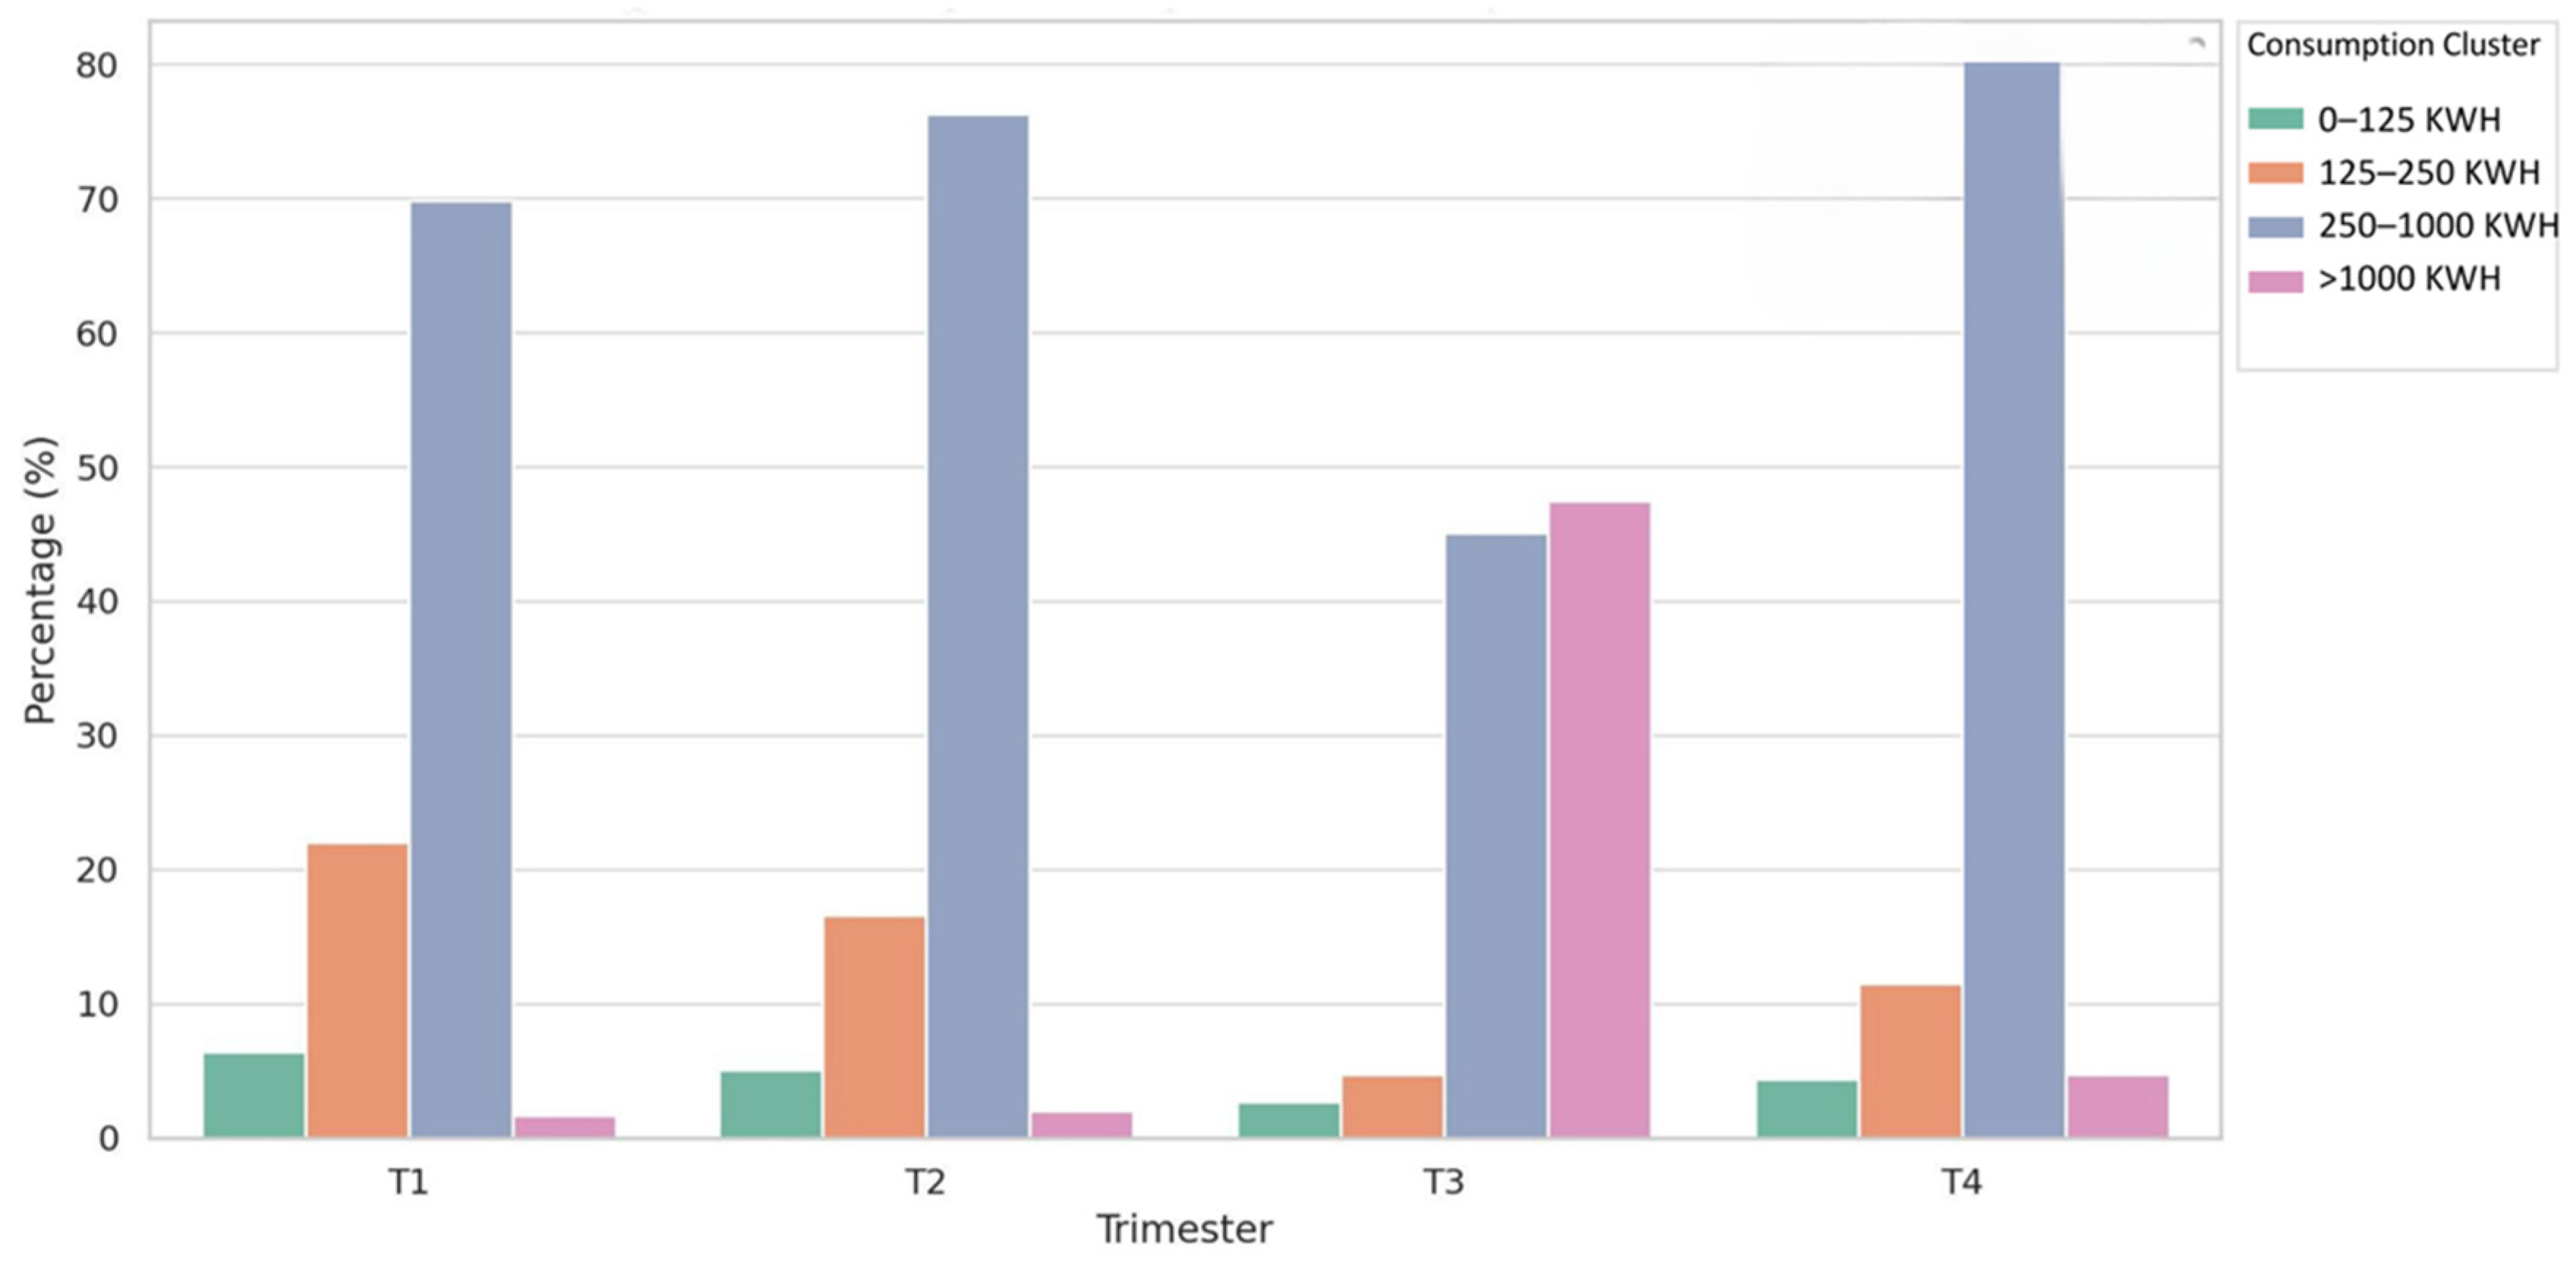
During the first two trimesters of 2022 (T1 and T2), the majority of consumers fell within the 250–1000 kWh range, according to approximately 70% of the total. A significant proportion of the households (20–25%) belonged to the 125–250 kWh range, while a much smaller fraction (less than 10%) consumed below 125 kWh. The highest consumption cluster, exceeding 1000 kWh, remains marginal at the beginning of the year.
In the third trimester, which corresponds to the summer season, the proportion of consumers exceeding 1000 Kwh increased significantly, reaching approximately 30–35%. This surge suggests a rise in the electricity demand, likely due to the increased use of air conditioning. The 250–1000 Kwh cluster saw a slight decline but remained the most dominant category. Meanwhile, the share of households consuming between 125–250 kWh decreased, indicating a general shift towards higher consumption.
During T4, electricity consumption patterns reverted to the levels observed in T1 and T2. The 250–1000 kWh cluster once again became dominant, while the share of households consuming more than 1000 kWh dropped to a lower level, similar to that of the beginning of the year (see Figure 14).
Figure 15 shows that the electricity consumption patterns in the first two quarters of 2023 remained highly similar to those observed in 2022. The 250–1000 kWh cluster continued to dominate, representing approximately 70% of consumers, while the 250–1000 kWh cluster accounted for around 20%. Households exceeding 1000 kWh remained a small fraction during these months.
However, in T3, the share of consumers exceeding 1000 kWh grew even more compared to 2022, reaching approximately 40%. This continued increase in high electricity consumption further reinforces the hypothesis that air conditioning use played a significant role in driving up the demand. The 250–1000 kWh cluster experienced a slight decrease, reflecting the shift towards higher energy consumption among a portion of households.
In T4, the distribution of consumption levels returned to the patterns observed in T1 and T2. However, compared to previous years, there was a slight increase in the number of households exceeding 1000 kWh, suggesting that some consumers maintained a higher electricity usage even outside the summer season.
During 2024 (see Figure 16), the electricity consumption trends observed in T1 and T2 followed the same general pattern as in previous years, with the 250–1000 kWh cluster remaining dominant at ~70% and the 125–250 kWh cluster maintaining a stable share of ~20%.
Regarding T3, there was a sharper increase in the number of consumers exceeding 1000 kWh, with the proportion surpassing 40% for the first time. This suggests that summer electricity consumption continued to rise significantly compared to 2023. Additionally, the 125–250 kWh cluster experienced a notable decline, indicating that fewer households managed to maintain a lower level of energy consumption during this period.
By T4, the 250–1000 kWh cluster regained its dominance, similar to the patterns observed in previous years. However, the proportion of households exceeding 1000 kWh continued to rise, suggesting a gradual shift toward higher energy consumption, even in non-summer months. During 2024 (see Figure 14), the electricity consumption trends observed in T1 and T2 followed the same general pattern as in previous years, with the 250–1000 kWh cluster remaining dominant ~70% and the 125–250 kWh cluster maintaining a stable share of ~20%.
Regarding T3, there was a sharper increase in the number of consumers exceeding 1000 kWh, with the proportion surpassing 40% for the first time. This suggests that summer electricity consumption continued to rise significantly compared to 2023. Additionally, the 125–250 kWh cluster experienced a notable decline, indicating that fewer households managed to maintain a lower level of energy consumption during this period.
By T4, the 250–1000 kWh cluster regained its dominance, similar to the patterns observed in previous years. However, the proportion of households exceeding 1000 kWh continued to rise, suggesting a gradual shift toward higher energy consumption, even in non-summer months.
A comparison of electricity consumption trends over the three years reveals a clear and consistent pattern. In T1 and T2, the 250–1000 kWh cluster remained stable at around 70%, with no significant fluctuations observed between 2022, 2023 and 2023.
However, the summer period T3 witnessed a progressive increase in the proportion of consumers exceeding 1000 kWh. In 2022, this cluster accounted for approximately 30–35% of households, rising to around 40% in 2023 and exceeding 40% in 2024. This continuous increase in high-energy consumption suggests a growing demand for cooling appliances, likely driven by warmer summers and changing occupant behaviors.
In conclusion, the analysis of electricity consumption from 2022 to 2024 highlights several important trends. Firstly, the 250–1000 kWh range remains the most common consumption level throughout the year, indicating that most households fall within this intermediate tariff bracket. However, the proportion of consumers in the 125–250 kWh range is gradually decreasing, while the share of households exceeding 1000 kWh is increasing, particularly in the summer season. T3 consistently shows a surge in electricity consumption, most likely due to increased air conditioning.
From an economic standpoint, if electricity tariffs increase with consumption, an increasing number of households will fall into higher tariff brackets, leading to higher electricity bills. This trend underscores the importance of energy efficiency policies to encourage netter consumption management, particularly during peak summer months. Further research integrating climate data and socio-economic factors would be valuable in understanding the precise drivers of the increasing energy consumption and informational strategies for demand-side energy management. The Table 5 summarizes the evolution and comparison of electricity consumption between 2022 and 2024.

4.4.2. Clustering Analysis of Natural Gas Consumption Between 2022 and 2024

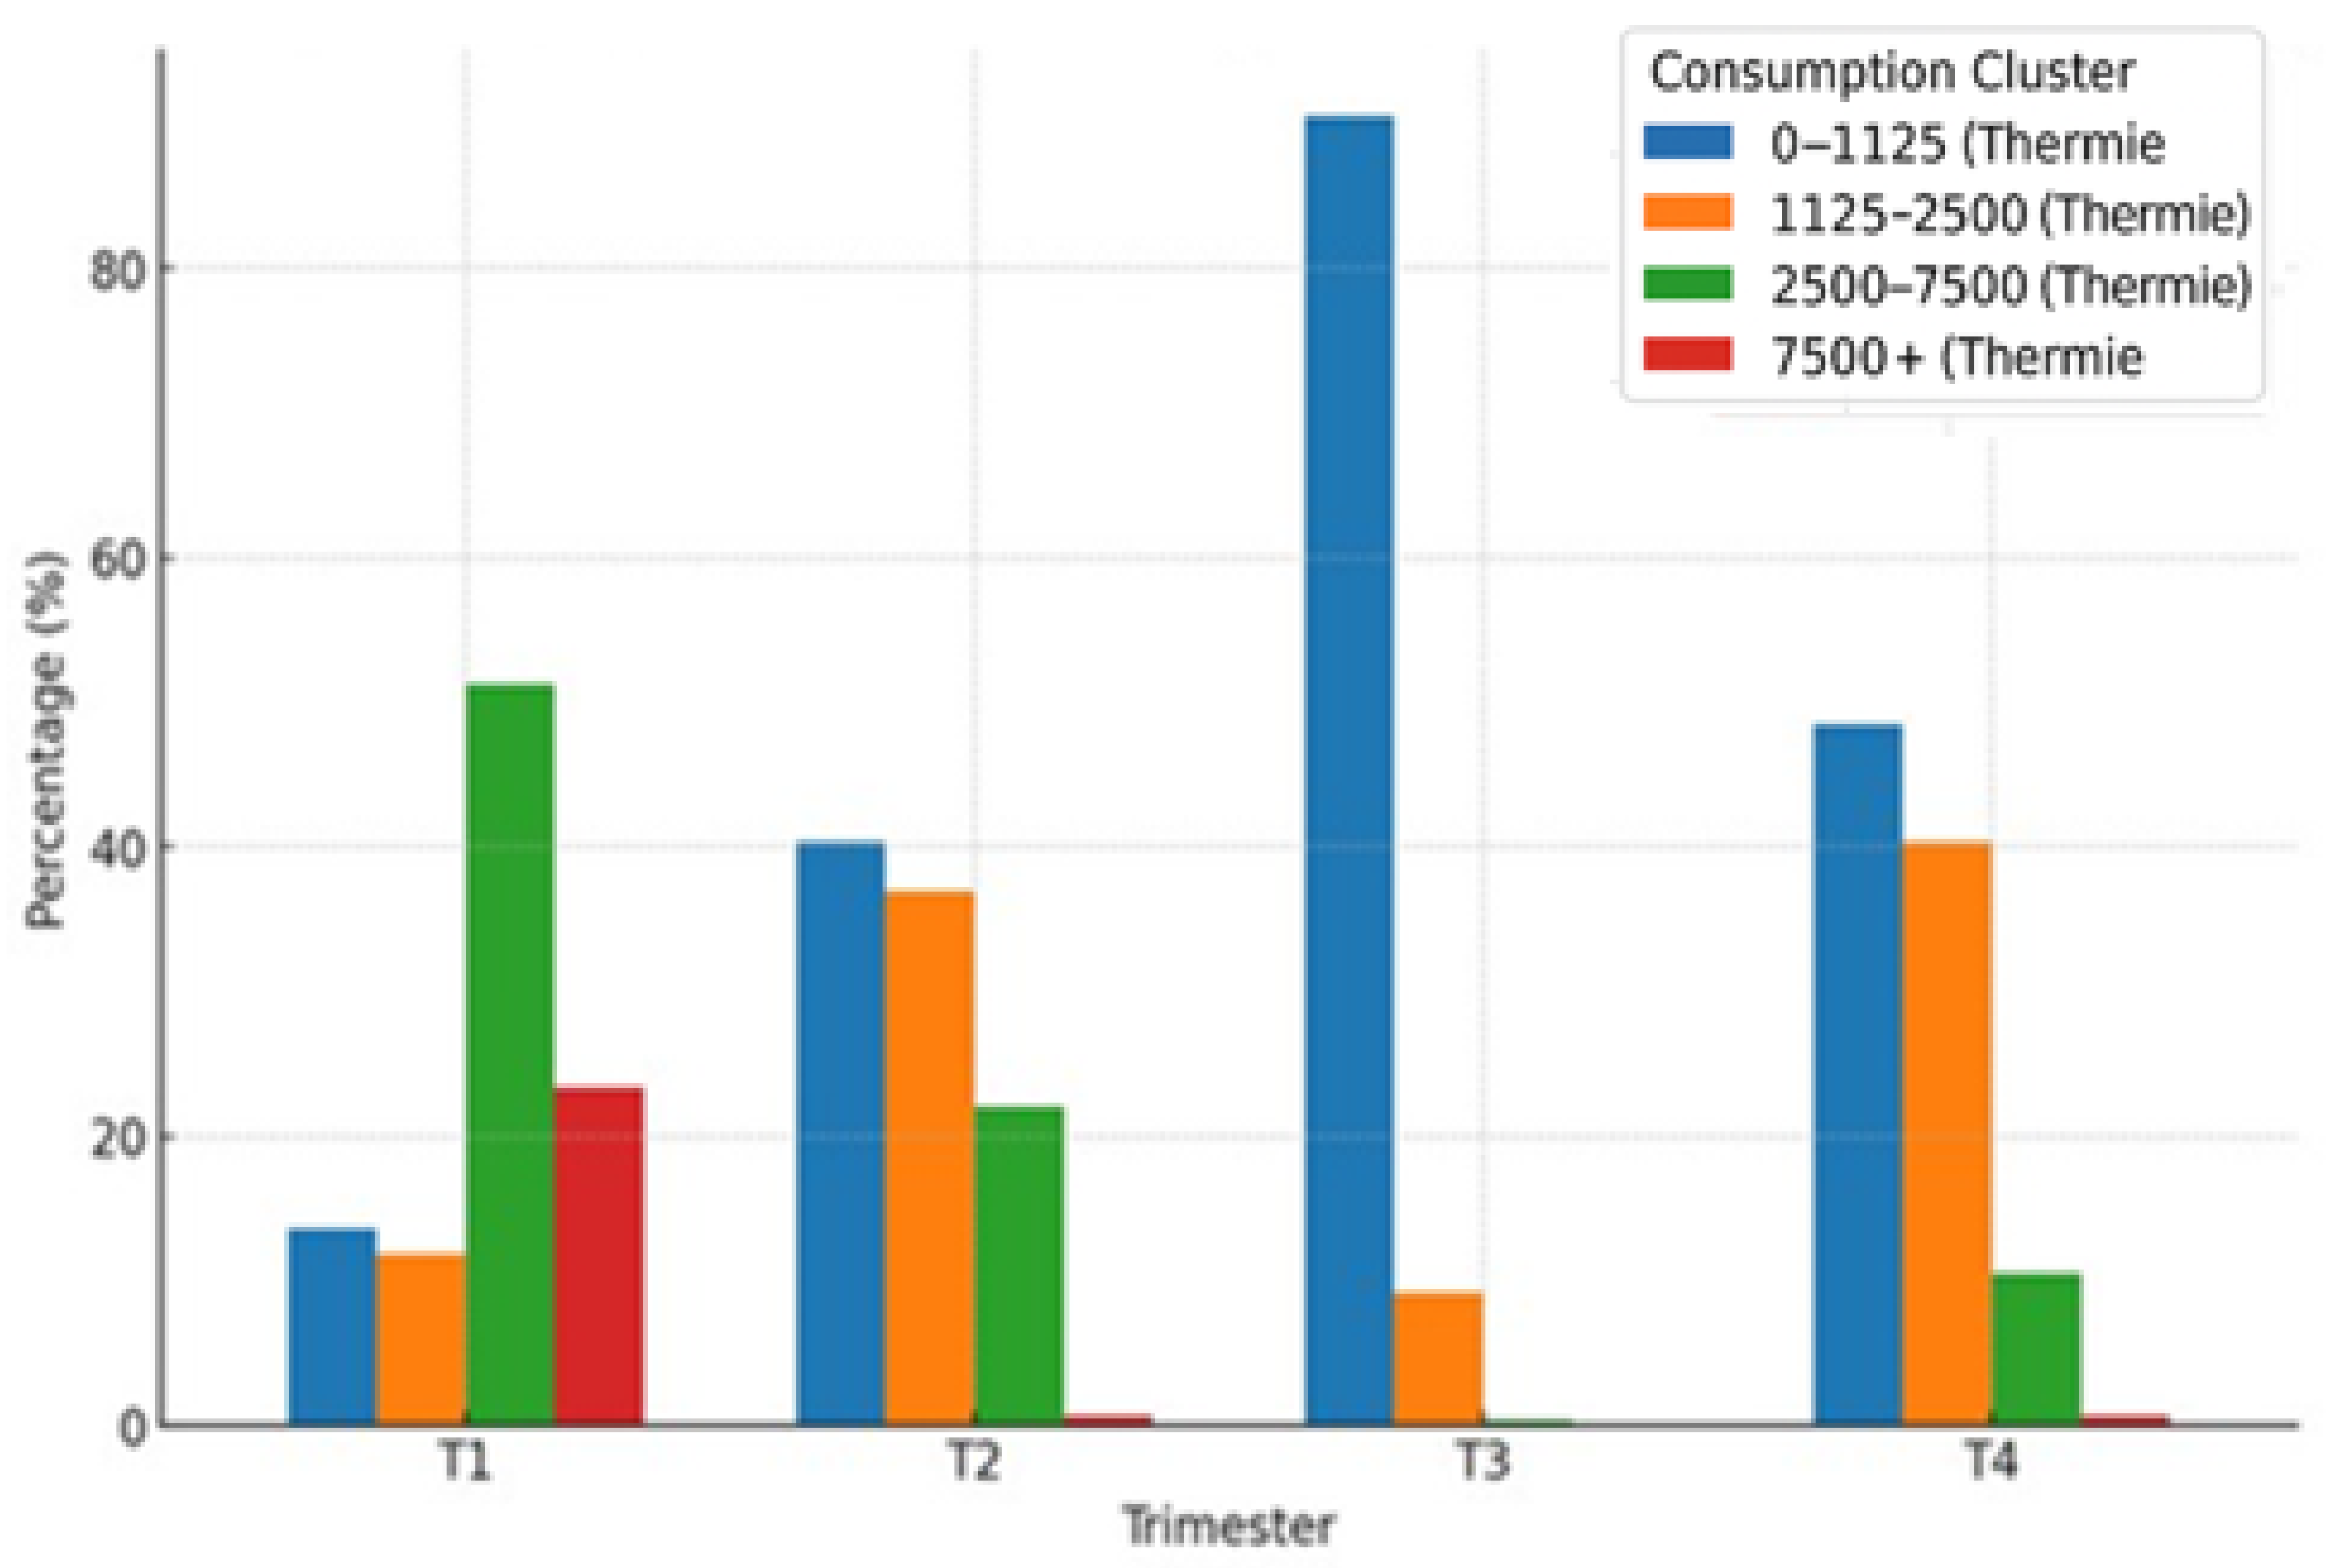
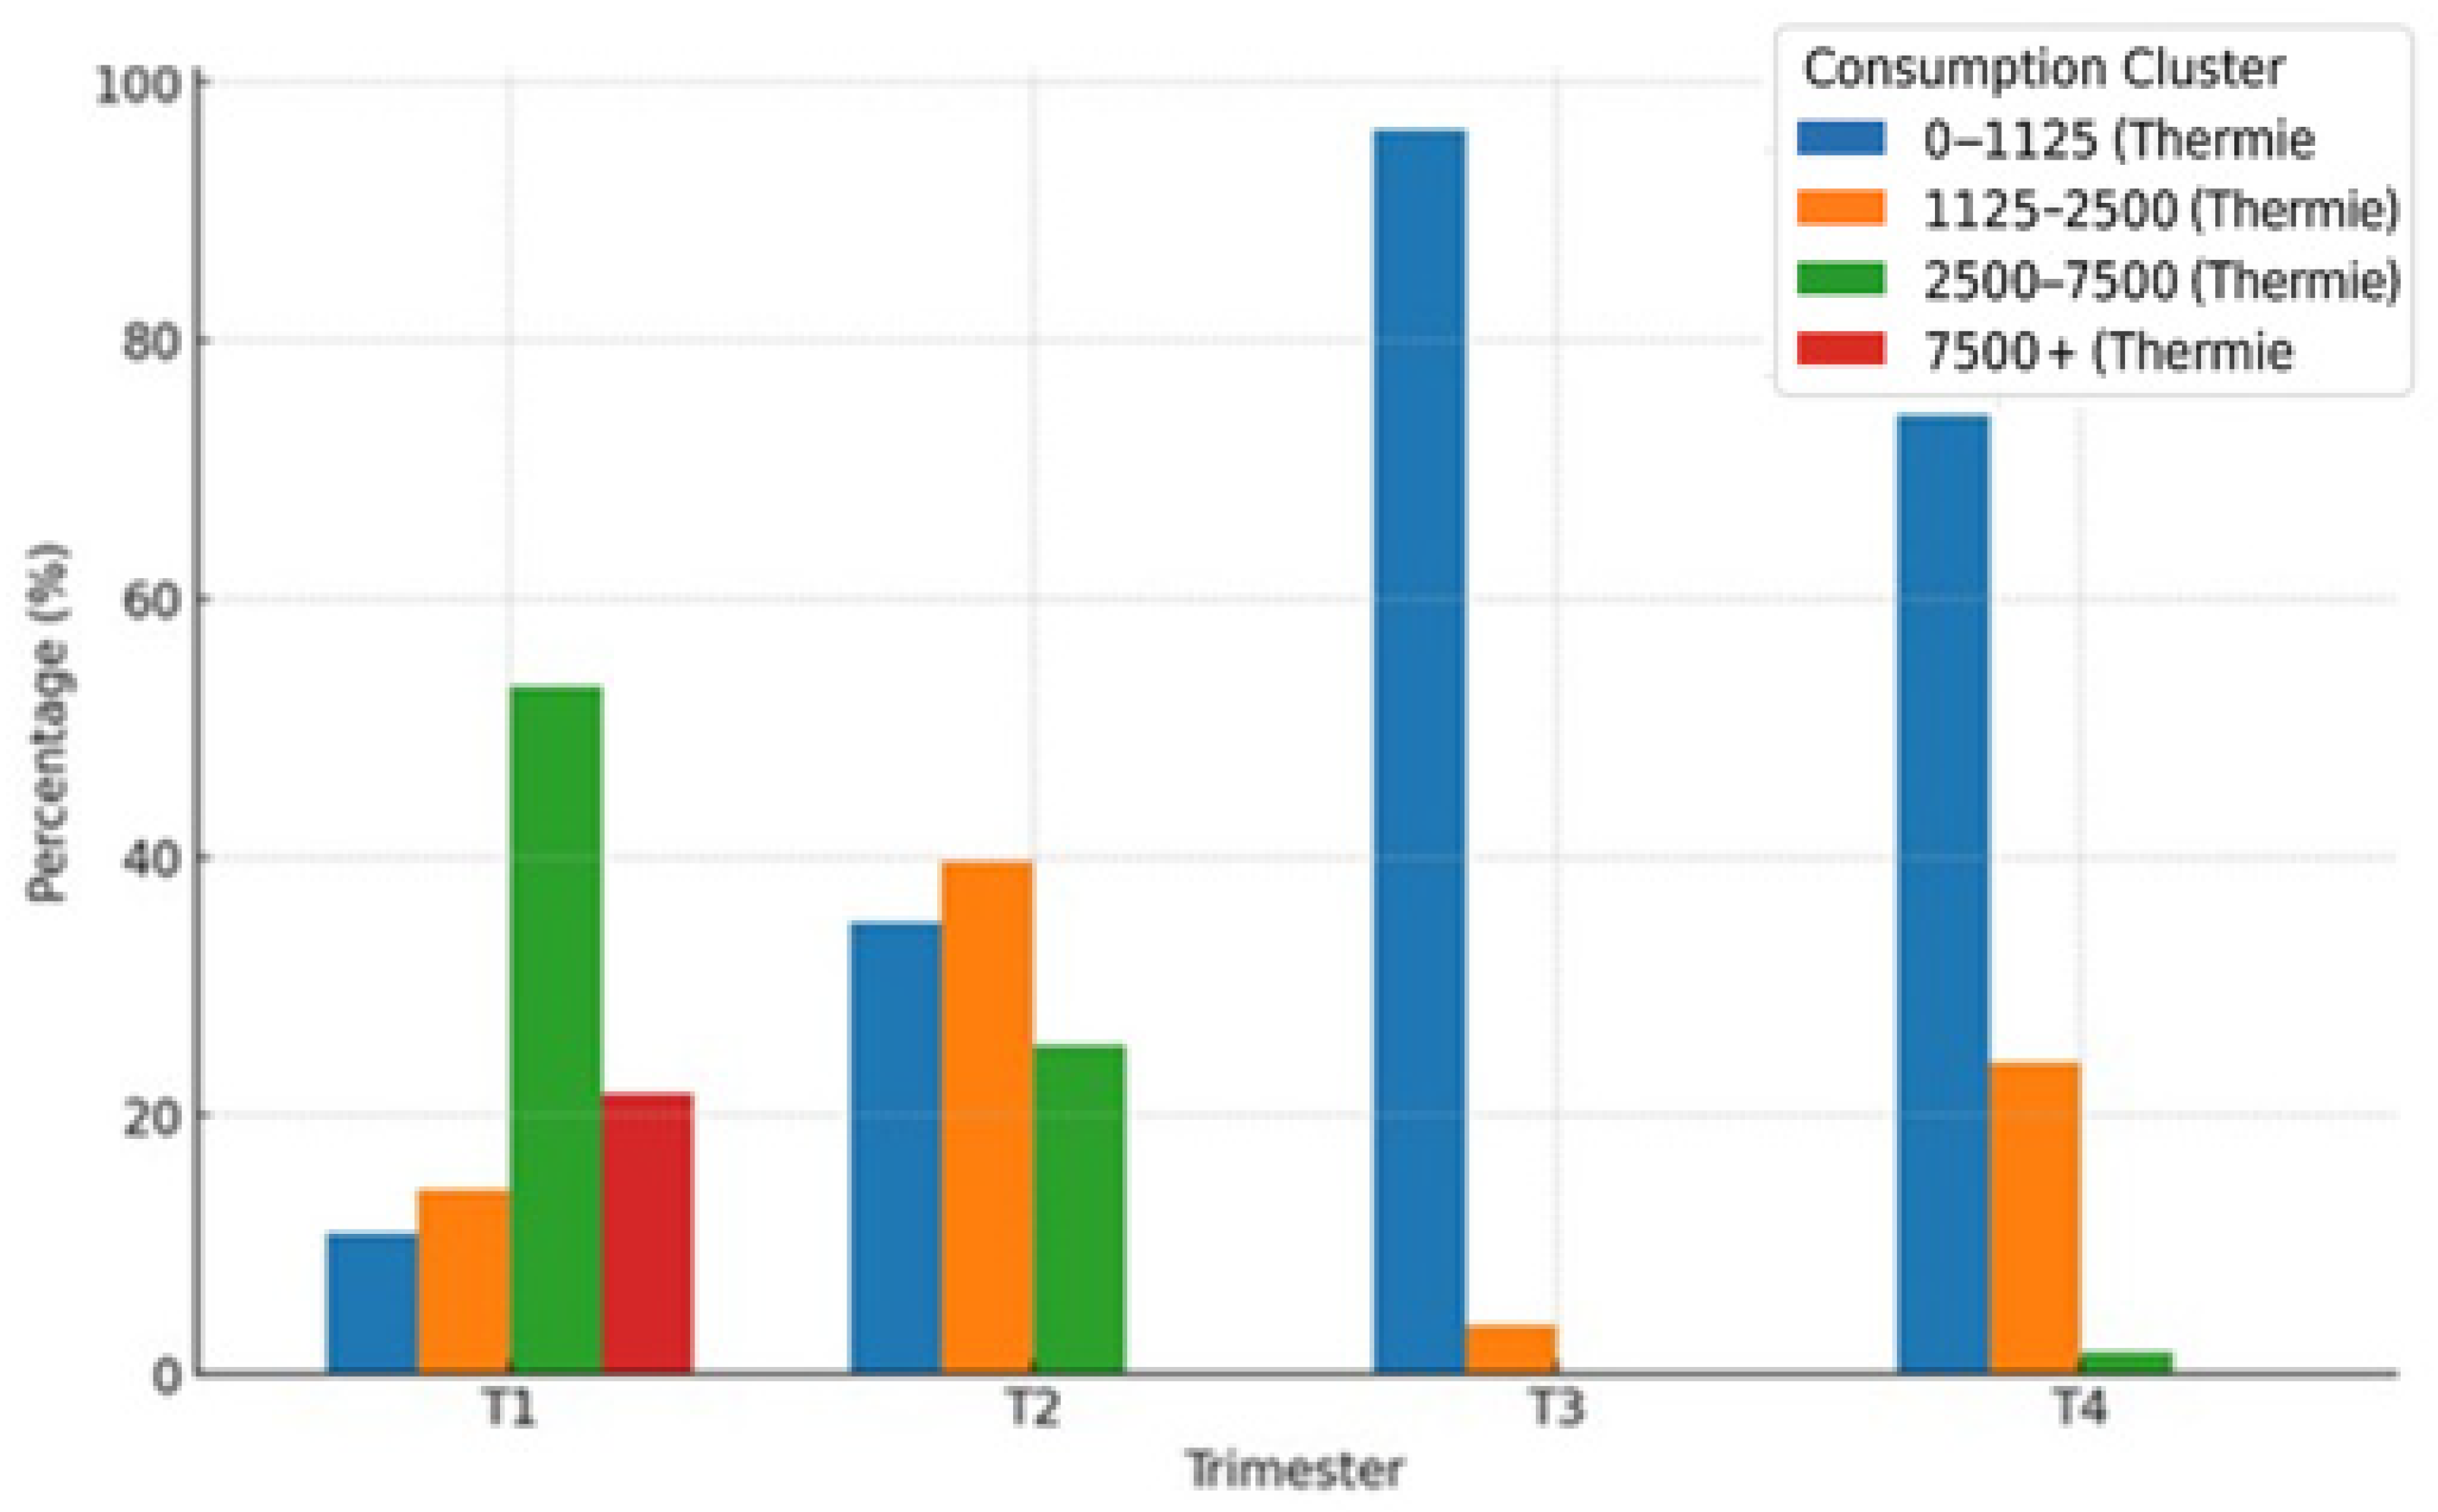
This study applies a clustering approach to classify natural gas consumption into four categories: low consumption (0–1125 Thermie), moderate consumption (1125–2500 Thermie), high consumption (2500–7500 Thermie), and very high consumption (+7500 Thermie), by examining yearly trends from 2022 to 2024 and the potential impact of energy efficiency measures. The three following charts illustrate the distribution of natural gas consumption across four consumption clusters:
The year 2022 exhibits a strong seasonal dependence on natural consumption. See Figure 17. In T1 a significant proportion of consumers fall into the high (2500–7500 Thermie) and very high (+7500 Thermie) clusters, reflecting the intense heating demand. During T2, a transition towards moderate consumption (1125–2500 Thermie) occurs, indicating reduced heating usage. In T3 (summer), the majority of consumers shift to the low-consumption (0–1125 Thermie) cluster. Finally, during T4, the consumption starts increasing again, with households progressively returning to moderate and high categories in preparation for winter.
This year serves as a baseline, where a large proportion of consumers are in the highest consumption clusters during winter, suggesting heavy reliance on gas heating with little evidence of efficiency measures.
The 2023 data reveal some noticeable shifts in the clustering distribution compared to 2022. In T1, the proportion of households in the very-high-consumption (+7500 Thermie) cluster decreases, with more users shifting into the high (2500–7500 Thermie) and moderate (1125–2500 Thermie) categories. This suggests an initial move towards reduced gas consumption, possibly due to improved insulation. In T2 and T4, there is a further increase in the share of moderate-consumption (1125–2500 Thermie) users, indicating continued efficiency improvements. During T3, the low-consumption (0–1125 Thermie) cluster remains dominant, consistent with the very-high-consumption category (see Figure 18).
The 2024 clustering results (see Figure 19) show a further reduction in high gas consumption compared to previous years (see Figure 14). In T1, the very-high (+7500 Thermie)-consumption category is further reduced, while the moderate (1125–2500 Thermie) and low (0–1225 Thermie) clusters expand. This indicates continued energy efficiency gains.
In T2 and T4, a clear shift towards moderate- and low-consumption clusters is observed, reinforcing the hypothesis that users are optimizing their heating needs. In T3, similar to previous years, natural gas consumption remains at a minimal level, confirming the seasonal effect.
By 2024, a distinct shift towards lower energy consumption during winter is evident, suggesting the success of energy-saving behaviors, improved heating technologies, or insulation upgrades.
Based on the clustering analysis, a comparative assessment of the three years reveals that the natural gas consumption from 2022 to 2024 shows significant shifts in the energy demand. The data indicate a decline in extreme consumption levels, a shift towards moderate usage, and consistent seasonal variations. A large proportion of users maintain low to moderate consumption levels. The Table 6 summarizes the natural gas consumption clusters between 2022 and 2024.

4.5. The Energy Performance Intensity Index (EPI) of Multi-Family Housing Units

4.5.1. Descriptive Analysis of Energy Performance Index

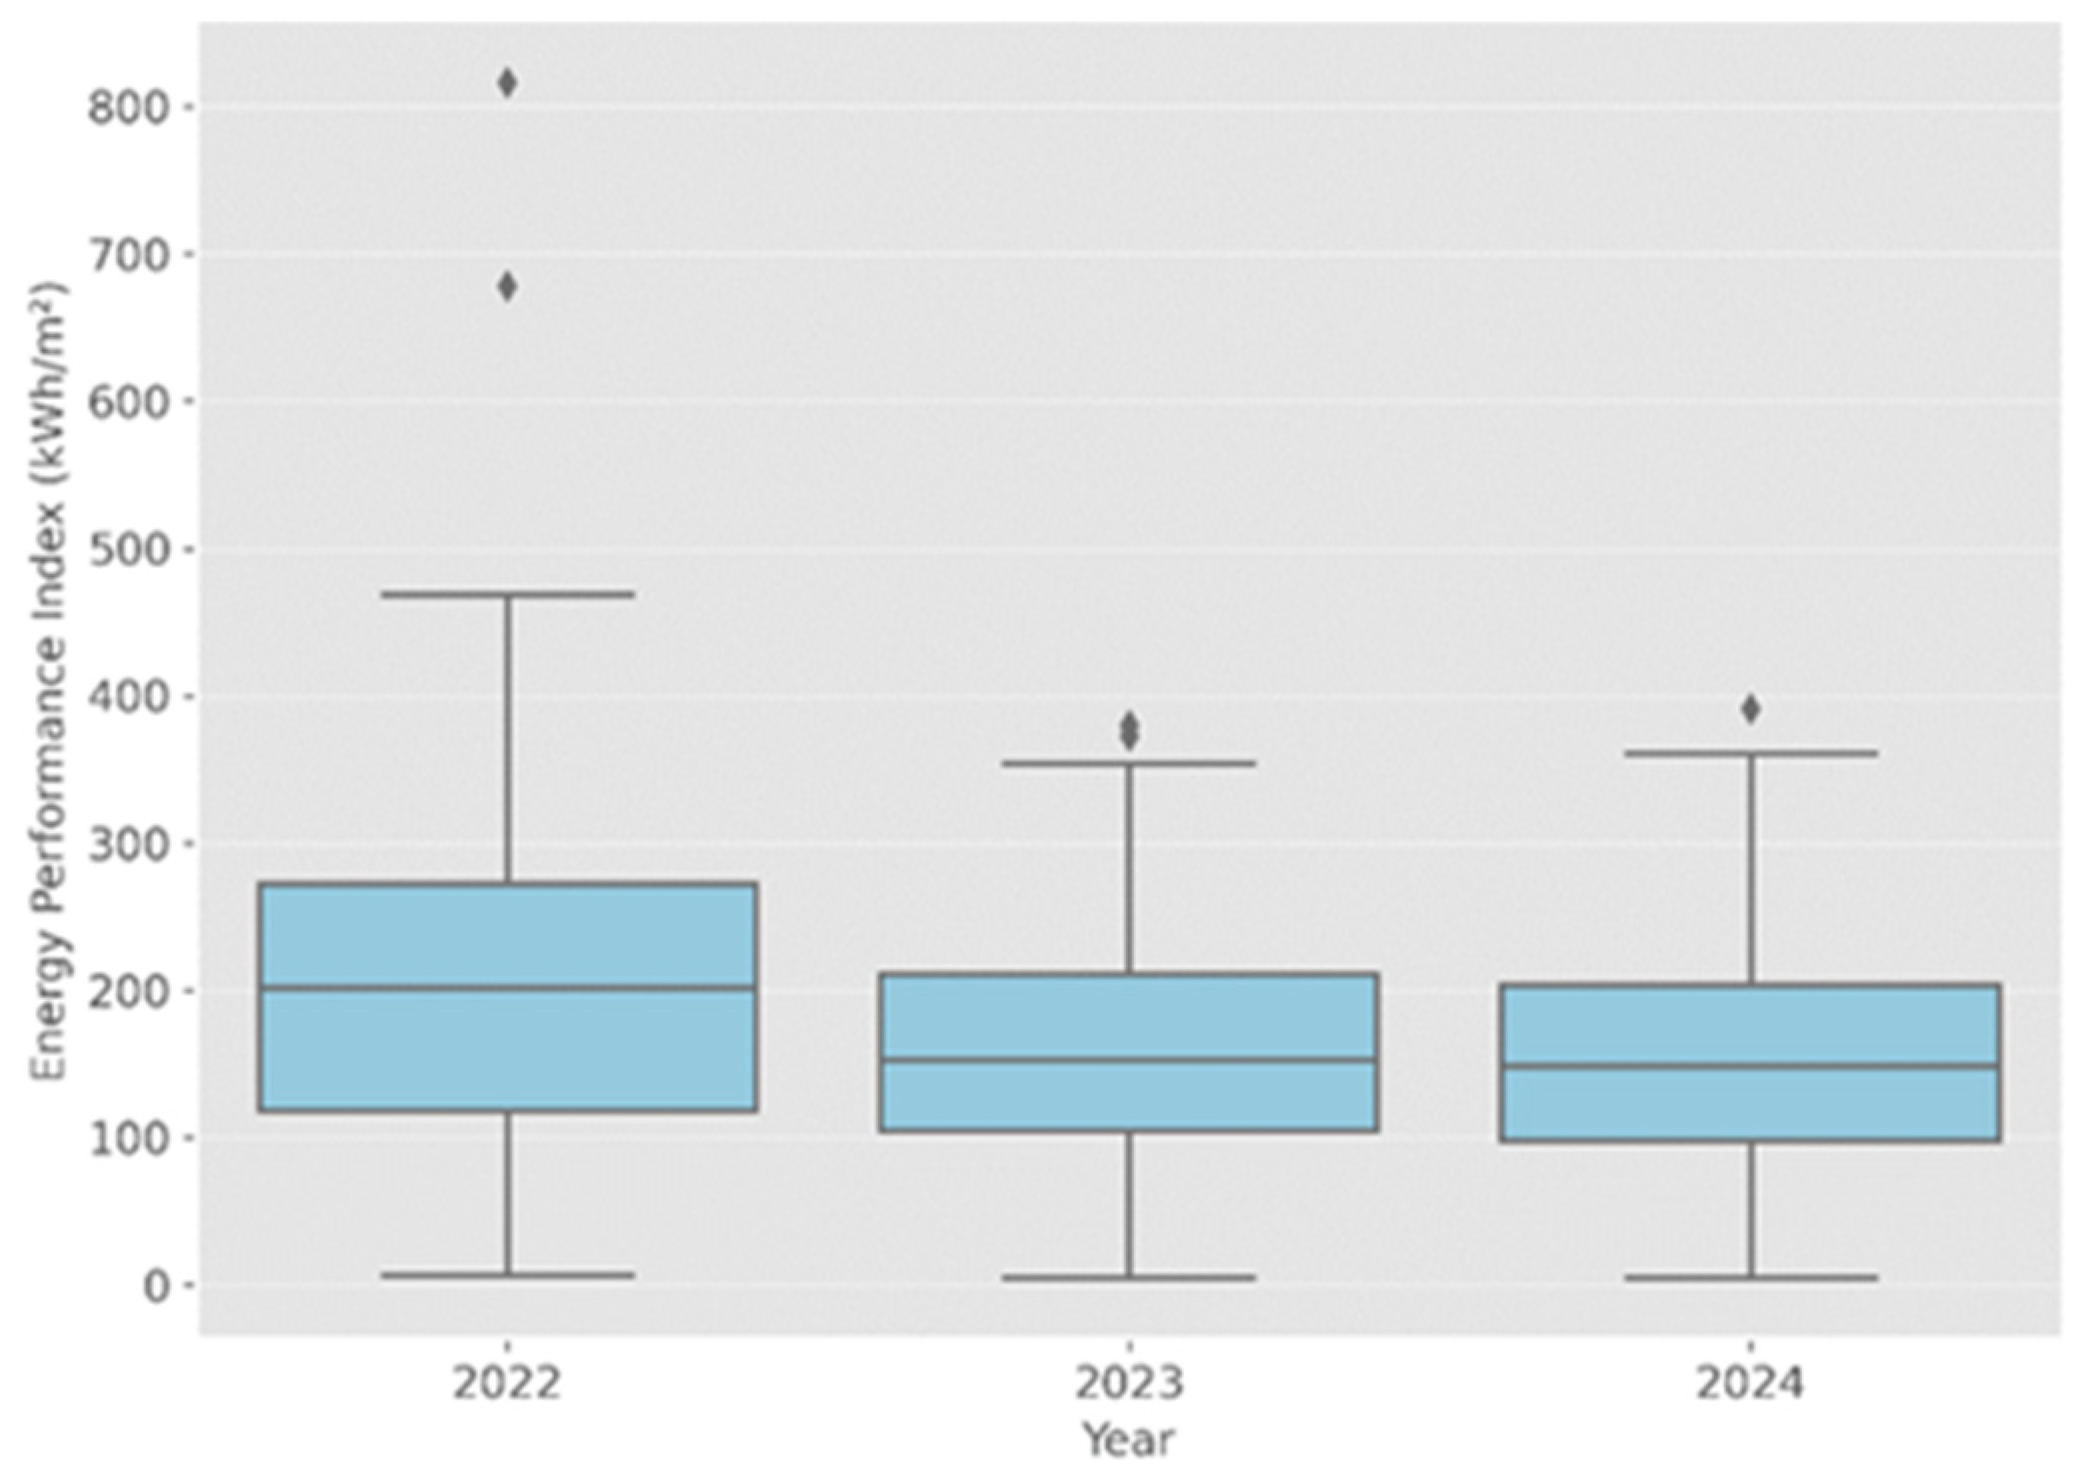
The descriptive analysis of the energy performance index (EPI) per square meter (kWh/m2) and per household size (kWh/household size) identified significant trends over the three years, from 2022 to 2024.
Table 7 shows a clear decrease in the average energy consumption per square meter, from 202.7 kWh/m2 in 2022 to 161.95 kWh/m2 in 2023 and 152.74 kWh/m2 in 2024. This 24.6% reduction over three years suggests improved efficiency, behavioral adjustments, and/or climate conditions.
A similar downward trend is observed for the EPI normalized by household size, decreasing from 3585.52 kWh/household size in 2022 to 2701.8 kWh/household size in 2024 (−24.6%). Despite this overall improvement, high variability persists, with household-level consumption reaching up to 14,430 kWh in 2022, indicating substantial heterogeneity in energy-use patterns.
These results may reflect the combined effect of climate conditions, tiered pricing, and the increased awareness of energy consumption. The persistence of wide consumption ranges highlights the need for further analysis by household typology.

4.5.2. Distribution of Energy Performance Index from 2022 to 2024

These boxplots represent, respectively, the distribution of the energy intensity index of energy consumption per square meter (kWh/m2) and the energy consumption per number of occupants (kWh/households size) during 2022, 2023, and 2024.
Figure 20 shows that there is a progressive decline in EPI values, with the mean decreasing from 2027.7 in 2022 to 161.9 in 2023 and 152.7 in 2024, reflecting a 25% overall reduction. Despite improvements, high outliers remain, most notably in 2022. These anomalies warrant a targeted analysis to revise the tariff structure based on the typologies of households and their heterogeneous behavior in terms of energy consumption.
In Figure 21, the distribution of the energy performance index (EPI) in kWh per household size among 2022, 2023, and 2024 shows that there is a similar downward trajectory in energy consumption at the household level, with average EPI values consistently decreasing across the three years.
Although the mean values are higher due to aggregation at the household scale, the decline mirrors the pattern observed per square meter, reinforcing the hypothesis of possible improved behavioral changes and/or reflecting the impact of climate conditions. Variability in energy use also decreases slightly over time, suggesting a convergence in performance across different household sizes.
Notably, extreme outliers remain, particularly in 2022, with some households consuming over 14,000 kWh/year. These cases merit future investigation, as they may reflect atypical energy-use patterns.

5. Conclusions

This study provides a comprehensive benchmarking analysis of electricity and natural gas consumption in the multi-family AADL housing model in Algiers. By examining three years of energy consumption data from 2022 to 2024 for 295 residential units, the findings offer valuable insights into energy-use trends, seasonal variations, and consumer clustering. The results highlight key patterns in the residential energy demand and suggest potential pathways for improving energy efficiency in similar urban housing developments.
A major finding of this study is the increasing reliance on electricity, particularly during summer months, where over 40% of households exceeded 1000 kWh per semester in 2024, compared to lower proportions in previous years. This surge suggests a growing dependence on air conditioning, potentially linked to rising temperatures. In contrast, natural gas consumption has shown a declining trend, with the winter heating demand decreasing by over 20% from 2022 to 2024.
The clustering analysis further reveals a shift toward more homogeneous consumption patterns, with fewer extreme outliers and a narrowing interquartile range over time.
These results carry important implications for both policymakers and energy providers.
  • The rising summer electricity demand highlights the need for demand-side management strategies, such as time-of-use pricing, incentives for efficient cooling systems, and targeted consumer awareness programs.
  • Declining natural gas consumption suggests that expanding energy efficiency initiatives, such as insulation improvements, could lead to greater energy savings and reduce household expenditures.
  • Identified consumption clusters support the implementation of differentiated energy policies tailored to specific user profiles and seasonal patterns.
In conclusion, this study demonstrates the effectiveness of a data-driven approach to energy benchmarking, highlighting significant shifts in electricity- and natural-gas-consumption patterns. By leveraging these insights, policymakers can design targeted interventions to enhance residential energy efficiency, mitigate peak electricity loads, and promote sustainable energy-consumption behaviors.
In the context of the studied climatic zone, characterized by hot summers and mild winters, a revision of the current energy-pricing scheme appears essential. The existing block tariff structure may not sufficiently incentivize conservation during critical peak periods. Introducing seasonal or climate-adjusted pricing, particularly for electricity, would help align consumer behavior with grid capacity and environmental goals, a more dynamic pricing model that reflects local climatic stress and peak load conditions.
Future research should explore the socio-economic and climatic drivers of energy consumption in detail, integrating occupant behavior modeling and high-resolution climate data to refine energy demand forecasts. Expanding this research to broader climate zones could provide a more comprehensive understanding of energy-consumption dynamics in multi-family housing across different regions.

Author Contributions

The research was designed and performed by M.A. and J.T. The data were collected and analyzed by M.A., N.A.L., A.N.M. and L.M. The paper was written by M.A., M.B., N.A.L., A.N.M. and L.M. and finally checked and revised by K.A.D., S.C.S. and J.T. All authors have read and agreed to the published version of the manuscript.

Funding

This research received no external funding.

Institutional Review Board Statement

Not applicable.

Informed Consent Statement

Not applicable.

Data Availability Statement

The original contributions presented in this study are included in the article. Further inquiries can be directed to the corresponding author(s).

Conflicts of Interest

The authors declare no conflicts of interest.

Abbreviations

The following abbreviations are used in this manuscript:
HDDHeating Degree-Days
CDDCooling Degree-Days
EPIEnergy performance index

References

  1. Region, T. Ministry of Energy. Available online: https://www.energy.gov.dz/ (accessed on 1 October 2024).
  2. Afaifia, M.; Djiar, K.A.; Bich-Ngoc, N.; Teller, J. An energy consumption model for the Algerian residential building’s stock, based on a triangular approach: Geographic Information System (GIS), regression analysis and hierarchical cluster analysis. Sustain. Cities Soc. 2021, 74, 103191. [Google Scholar] [CrossRef]
  3. Ministère de L’habitat de l’urbanisme et de la ville, Ministère de L’habitat de L’urbanisme et de la Ville. Available online: https://www.mhuv.gov.dz/?page_id=5458&lang=fr (accessed on 10 October 2024).
  4. Guides et Ouvrages—Agence Nationale Pour la Promotion et la Rationalisation de l’Utilisation de l’Energie. Available online: https://www.aprue.org.dz/ (accessed on 10 November 2024).
  5. “AADL 3”—Ministère de L’habitat de L’urbanisme et de la Ville. Available online: https://www.mhuv.gov.dz/?s=AADL+3 (accessed on 15 November 2024).
  6. Attia, S.; Evrard, A.; Gratia, E. Development of Benchmark Models for the Egyptian Residential Buildings Sector. Appl. Energy 2012, 94, 270–284. [Google Scholar] [CrossRef]
  7. Fumo, N.; Mago, P.; Luck, R. Methodology to estimate building energy consumption using EnergyPlus Benchmark Models. Energy Build. 2010, 42, 2331–2337. [Google Scholar] [CrossRef]
  8. Li, Z.; Han, Y.; Xu, P. Methods for benchmarking building energy consumption against its past or intended performance: An overview. Appl. Energy 2014, 124, 325–334. [Google Scholar] [CrossRef]
  9. Tereci, A.; Ozkan, S.T.E.; Eicker, U. Energy benchmarking for residential buildings. Energy Build. 2013, 60, 92–99. [Google Scholar] [CrossRef]
  10. Gupta, G.; Mathur, S.; Mathur, J.; Nayak, B.K. Comparison of energy-efficiency benchmarking methodologies for residential buildings. Energy Build. 2023, 285, 112920. [Google Scholar] [CrossRef]
  11. Morris, J.; Allinson, D.; Harrison, J.; Lomas, K.J. Benchmarking and tracking domestic gas and electricity consumption at the local authority level. Energy Effic. 2016, 9, 723–743. [Google Scholar] [CrossRef]
  12. Huang, H.; Zhu, K.; Lin, X. Research on Formulating Energy Benchmarks for Various Types of Existing Residential Buildings from the Perspective of Typology: A Case Study of Chongqing, China. Buildings 2023, 13, 1346. [Google Scholar] [CrossRef]
  13. Wang, E.; Shen, Z.; Alp, N.; Barry, N. Benchmarking energy performance of residential buildings using two-stage multifactor data envelopment analysis with degree-day based simple-normalization approach. Energy Convers. Manag. 2015, 106, 530–542. [Google Scholar] [CrossRef]
  14. Wang, X.; Feng, W.; Cai, W.; Ren, H.; Ding, C.; Zhou, N. Do residential building energy efficiency standards reduce energy consumption in China?—A data-driven method to validate the actual performance of building energy efficiency standards. Energy Policy 2019, 131, 82–98. [Google Scholar] [CrossRef]
  15. Gupta, G.; Mathur, S.; Mathur, J.; Nayak, B.K. Blending of Energy Benchmarks Models for Residential Buildings. Energy Build. 2023, 292, 113195. [Google Scholar] [CrossRef]
  16. Ghajarkhosravi, M.; Huang, Y.; Fung, A.S.; Kumar, R.; Straka, V. Energy Benchmarking Analysis of Multi-Unit Residential Buildings (MURBs) in Toronto, Canada. J. Build. Eng. 2020, 27, 100981. [Google Scholar] [CrossRef]
  17. Zhou, Y.; Lork, C.; Li, W.-T.; Yuen, C.; Keow, Y.M. Benchmarking Air-Conditioning Energy Performance of Residential Rooms Based on Regression and Clustering Techniques. Appl. Energy 2019, 253, 113548. [Google Scholar] [CrossRef]
  18. Edalatnia, S.; Das, R.R. Building Benchmarking and Energy Performance: Analysis of Social and Affordable Housing in British Columbia, Canada. Energy Build. 2024, 313, 114259. [Google Scholar] [CrossRef]
  19. Shabunko, V.; Lim, C.M.; Brahim, S.; Mathew, S. Developing building benchmarking for Brunei Darussalam. Energy Build. 2014, 85, 79–85. [Google Scholar] [CrossRef]
  20. Shabunko, V.; Lim, C.M.; Mathew, S. EnergyPlus Models for the Benchmarking of Residential Buildings in Brunei Darussalam. Energy Build. 2018, 169, 507–516. [Google Scholar] [CrossRef]
  21. Tellache, A.; Lazri, Y.; Laafer, A.; Attia, S. Development of a Benchmark Model for Residential Buildings with a Mediterranean Climate: The Aero-Habitat in Algiers City. Sustainability 2025, 17, 831. [Google Scholar] [CrossRef]
  22. Chung, W. Review of building energy-use performance benchmarking methodologies. Appl. Energy 2011, 88, 1470–1479. [Google Scholar] [CrossRef]
  23. Papadopoulos, S.; Bonczak, B.; Kontokosta, C.E. Pattern recognition in building energy performance over time using energy benchmarking data. Appl. Energy 2018, 221, 576–586. [Google Scholar] [CrossRef]
  24. Wenninger, S.; Wiethe, C. Benchmarking Energy Quantification Methods to Predict Heating Energy Performance of Residential Buildings in Germany. Bus. Inf. Syst. Eng. 2021, 63, 223–242. [Google Scholar] [CrossRef]
  25. Parvaneh, M.; Seyrfar, A.; Movahedi, A.; Ataei, H.; Le Nguyen, K.; Derrible, S. Energy Consumption Prediction of Residential Buildings Using Machine Learning: A Study on Energy Benchmarking Datasets of Selected Cities Across the United States. In CIGOS 2021, Emerging Technologies and Applications for Green Infrastructure; Ha-Minh, C., Tang, A.M., Bui, T.Q., Vu, X.H., Huynh, D.V.K., Eds.; Springer Nature: Singapore, 2022; pp. 197–205. [Google Scholar] [CrossRef]
  26. Administration Centrale. Ministère de L’habitat de L’urbanisme et de la Ville. Available online: https://www.mhuv.gov.dz/?p=5041&lang=fr (accessed on 5 November 2024).
  27. A.A.D.L. Available online: https://www.aadl.com.dz/ (accessed on 10 November 2024).
  28. Sonelgaz. Available online: https://www.sonelgaz.dz/fr (accessed on 15 December 2024).
  29. Auffhammer, M.; Mansur, E.T. Measuring climatic impacts on energy consumption: A review of the empirical literature. Energy Econ. 2014, 46, 522–530. [Google Scholar] [CrossRef]
  30. Tarification—CREG. Available online: https://creg.gov.dz/?page_id=6757 (accessed on 15 November 2024).
  31. Météo Algérie. Available online: https://www.meteo.dz/ (accessed on 5 December 2024).
  32. Global Historical Climatology Network-Daily (GHCN-Daily), Version 3, Access. Available online: https://www.ncei.noaa.gov/access (accessed on 1 March 2025).
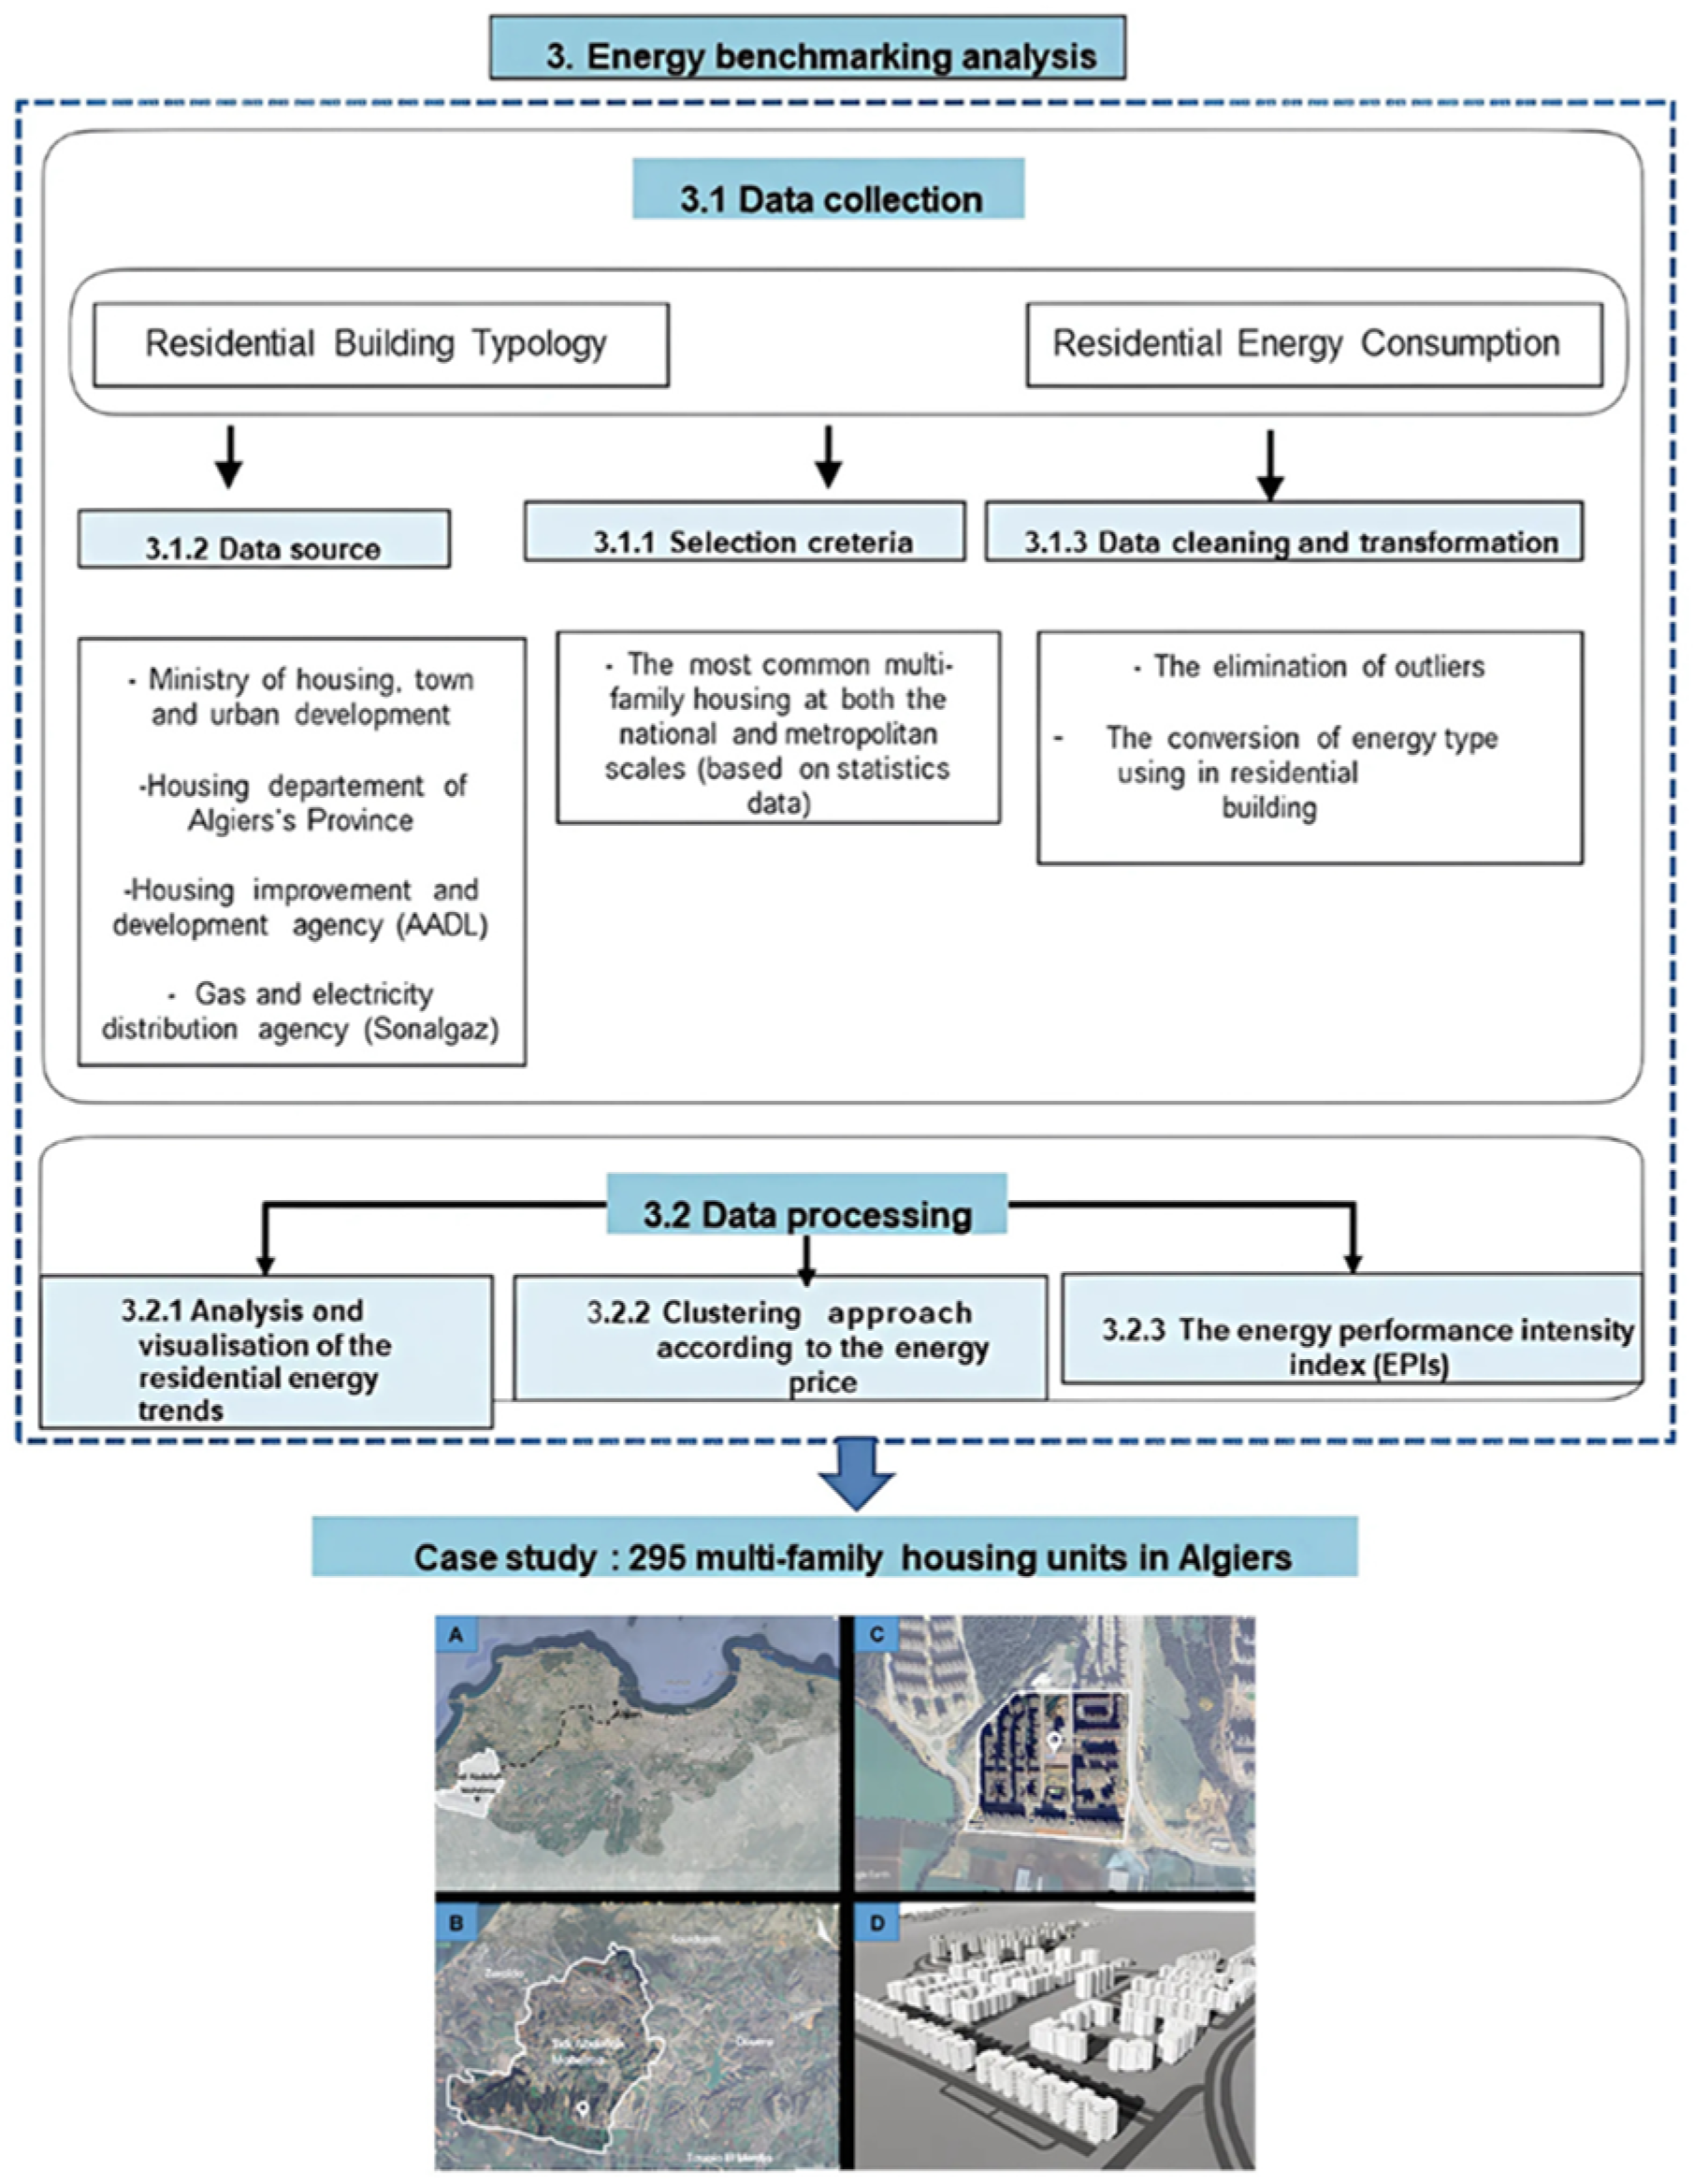
Figure 1. The conceptual framework of the study. (A): shows the location of the Sidi Abdalah commune in the Algiers metropolitan area. (B): represents the perimeter of the commune of Sidi Abdallah. (C): represents the 1500 AADL housing estate. (D): 3D view of the 1500 AADL housing estate.
Sustainability 17 04120 g001
Figure 2. Algiers Urban expansion from 2016 to 2023, land use/land cover by a remote sensing.
Sustainability 17 04120 g002
Figure 3. The distribution of the AADL program from 1999 to 2025. Data source: [27].
Sustainability 17 04120 g003
Figure 4. The selected neighborhoods. (A): shows the location of the Sidi Abdalah commune in the Algiers metropolitan area. (B): represents the perimeter of the commune of Sidi Abdallah. (C): represents the 1500 AADL housing estate. (D): 3D view of the 1500 AADL housing estate. Source: Google Earth.
Sustainability 17 04120 g004
Figure 5. Typical floor plan of the multi-family housing typology in Sidi Abdallah Zaatria (Algiers).
Sustainability 17 04120 g005
Figure 6. Average electricity and natural gas consumption per year.
Sustainability 17 04120 g006
Figure 7. The distribution of electricity consumption during four periods in 2022, 2023, and 2024.
Sustainability 17 04120 g007
Figure 8. The distribution of natural gas consumption during four periods in 2022, 2023, and 2024.
Sustainability 17 04120 g008
Figure 9. Heat map of electricity consumption of 295 multi-family housings by trimester from 2022 to 2024.
Sustainability 17 04120 g009
Figure 10. Heat map of natural gas consumption of 295 multi-family housings by trimester from 2022 to 2024.
Sustainability 17 04120 g010
Figure 11. Comparison of HDD and CDD per trimester (2022−2024).
Sustainability 17 04120 g011
Figure 12. Comparison of electricity consumption and CDD by trimester from 2022 to 2024.
Sustainability 17 04120 g012
Figure 13. Comparison of natural gas consumption and HDD by trimester from 2022 to 2024.
Sustainability 17 04120 g013
Figure 14. Percentage of electricity consumption clusters per trimester during 2022.
Sustainability 17 04120 g014
Figure 15. Percentage of electricity consumption clusters per trimester during 2023.
Sustainability 17 04120 g015
Figure 16. Percentage of electricity consumption clusters per trimester during 2024.
Sustainability 17 04120 g016
Figure 17. Percentage of natural gas consumption clusters per trimester during 2022.
Sustainability 17 04120 g017
Figure 18. Percentage of natural gas consumption clusters per trimester during 2023.
Sustainability 17 04120 g018
Figure 19. Percentage of natural gas consumption clusters per trimester during 2024.
Sustainability 17 04120 g019
Figure 20. Energy consumption distribution per square meter (2022–2024).
Sustainability 17 04120 g020
Figure 21. Energy consumption distribution per household size (2022–2024).
Sustainability 17 04120 g021
Table 1. Analytical parameters for the literature review analysis.
ParametersExplication
Case studyThe analyzed housing typology and the sample size reported
Study periodIndicates the timeframe of data collection; it may correspond to a typical year, a specific season, a representative month, a single day, or an extended period
ApplicationSpecifies the application type employed in the article, such as mathematical models, simulations, and surveys
Models and techniquesMethods applied in different studies, such as multiple linear regression, simple linear regression, and artificial neural networks
Response variable The type of energy consumption studied
Explanatory variablesFactors influencing residential energy consumption, including building physical characteristics, type of energy, energy price, climate, occupant behavior, and income
Analytical tools and softwareAn overview of the tools and software employed for modeling and simulation
Table 2. Summary table of the 20 analyzed papers.
RefCase Study Study PeriodApplication Response Variables (Energy Use)Explanatory VariablesTools & Software
[6]Residential apartments (Egypt: Alexandria, Cairo, and Asyut)August and September 2008Simulation and benchmarkingElectricity and natural gasBuilding characteristics, climate, occupant behaviorEnergyPlus 2010
[7]Hypothetical building (Atlanta, GA, and in Meridian)Hourly electrical and fuel energy consumptionSimulation and degree day method Electricity and fuel energyClimate, building operationEnergyPlus
[8]No case study, the paper is a review-Review and comparison of energy benchmark methods, black, grey, and white box methods ---
[9]Residential building quarters (Stuttgart)2012Urban energy benchmarkingHeating/cooling, CO2 emissionsUrban density, urban form building typologyEnergyPlus, SUN tool (CISBAT 2005)
[10]Residential buildings in the city of Jaipur (2700 houses) Indian city of Jaipur-MLR, PCA, Bayesian regressionEnergy performance index (EPI)Income, built-up area, appliancesSPSS version 21, Python (PyCaret library)
[11]The existing data (with national coverage) of 500–700 households (England)2008–2011Regression and energy indexNatural gas and electricityHousehold income, climate, heating fuel typeSPSS, GIS
[12]370 residential buildings (Chongqing, a city in southwestern China)2017–2021Clustering and regressionElectricityBuilding typology, shape coefficientEnergyPlus, plugin Urban Modeling Interface (UMI)
[13]189 residential buildings (single-family) (Woodbine, Iowa) in the U.S.2008–2010 (3-year longitudinal panel data)DEA, MLR, clustering, Tobit regressionGas, coal, electricityBuilding age, floor area, AC type, degree-day-
[14]1128 households in Chongqing China2016Regression, propensity score matchingElectricityHousehold characteristics, occupant behaviorStatistical tools (survey)
[15]2800 dwellings of Jaipur city2023Blending approachElectricityHouse type, appliances, incomePyCaret (python)
[16]120 multi-unit residential buildings (Toronto, Canada)2010Regression and PRISM modelsElectricity and gasBuilding size, occupants, Heating Degree DaysStatistical tools
[17]The staff apartment of Singapore University of Technology and Design2016Regression and clusteringAC energy useWeather, AC set pointsMATLAB 2017b
[18]23 community housing buildings in British Columbia (BC)2019–2022ESPM, regressionEnergy use intensity (EUI), CO2 emissionsFloor area, occupancy patternsENERGY STAR Portfolio Manager (ESPM) 2022
[19]3 of such housing estates with a total of 256 samples, Brunei Darussalam2010–2013OLS, SVMElectricity (kWh/m2)Floor area, AC usage, weatherEnergyPlus, libsvm) libsvm, version 2.6 in R programming
[20]400 residential buildings (three types of buildings), Brunei Darussalam 2012Simulation and utility billsElectricityBuilding type, occupancyEnergyPlus
[21]284 homes: Aero-Habitat (Algiers, Algeria)-Modeling and Simulation Energy use Reference archetype (F4)EnergyPlus
[22]-2011Public benchmarking and Internal benchmarkingThe energy-use performance--
[23]Data from 15,000 properties in New York2011–2016Clustering approach and statistical testsEnergy use intensityNumber of floors, unit density-
[24]25,000 single and two-family buildings (Germany)2016–2018Artificial Neural Network, D-vine copula quantile regression, Extreme Gradient Boosting, Random Forest, and Support Vector RegressionElectricity Physical building attributes and geometry, the installed heating system, the location-
[25]Datasets for eight U.S. cities-XGBoost, RF, and ANNEnergy consumption Floor area, year built, and energy star score-
Table 3. Designation of energy consumption quarters according to the national gas and electricity distribution company.
Energy Consumption Quarters (Trimester)Designation of The Energy Consumption Period
T1From 20/11 to 20/02
T2From 21/02 to 20/05
T3From 21/05 to 20/08
T4From 21/08 to 20/11
Table 4. The categorization of energy consumption according to the four official stages of energy consumption measurements [28,30].
Electricity ConsumptionNatural Gas Consumption
Energy Consumption BandsThe Unit PriceEnergy Consumption BandsThe Unit Price
0–125 kWh1.7787 DA/kWh0–1125 thermie *0.1682 DA **/thermie
125–250 kWh4.1789 DA/kWh1125–2500 thermie 0.3245 DA/thermie
250–1000 kWh4.8120 DA/kWh2500–7500 thermie 0.4025 DA/thermie
>1000 kWh5.4796 DA/kWh>7500 thermie0.4599 DA/tehrmie
* The unit used by the Algerian electricity and natural gas regulatory commission and provider to bill residential gas consumption is the “thermie” [30], where 1 thermie equals 1000 kilocalories, which corresponds to approximately 1.163 kilowatt-hours (kWh). ** DA refers to the Algerian Dinar, the official currency of Algeria.
Table 5. Comparison of electricity consumption clusters between 2022 and 2024.
Trimesters202220232024
T1 and
T2
Stable: 70% in 250–1000 kWhStable: 70% in 250–1000 kWhStable: 70% in 250–1000 kWh
T3Increase
in >1000 kWh (30–35%)
Even
higher increase (~40%)
Strongest
increase (>40%)
T4Return to
normal, low >1000 kWh consumption
Slight
increase in >1000 kWh
Continued
rise in >1000 kWh
Table 6. Comparison of natural gas consumption clusters between 2022 and 2024.
Trimesters 202220232024
T1High in 2500–7500 Thermie and 7500+ ThermieSimilar to 2022, slight efficiency gainSlight drop in 7500+ Thermie consumption
T2Moderate consumption gains (1125–2500 Thermie)Efficiency trend continuesMore shift to 1125–2500 Thermie cluster
T30–1125 Thermie dominatesMore pronounced drop in consumptionMaintains low consumption trend
T4Gradual rise, but with low to moderate clusters leadingSimilar pattern, less increase in high consumptionSlight decrease in high consumption clusters
Table 7. Descriptive analysis of energy performance index.
YearEPI (kWh/m2)EPI (kWh/Household Size)
MeanMinMaxMeanMinMax
2022202.705.81815.793585.52102.7914,430.22
2023161.954.13379.822864.637.06718.5
2024152.745.51391.062701.879.86917.3
Disclaimer/Publisher’s Note: The statements, opinions and data contained in all publications are solely those of the individual author(s) and contributor(s) and not of MDPI and/or the editor(s). MDPI and/or the editor(s) disclaim responsibility for any injury to people or property resulting from any ideas, methods, instructions or products referred to in the content.