1. Introduction
Environmental sustainability has expanded beyond its initial ecological focus to include social and economic aspects of management. The pressures of industrialization and intensified agriculture demand comprehensive sustainability models to address pollution, emissions, and resource use. Achieving sustainability requires reducing pollution in all environmental matrices: air, water, and soil. While air pollution is widely recognized, soil pollution is increasingly understood as a crucial issue that affects food security, biodiversity, and ecosystem resilience. Distinguishing between soil contamination (elevated chemical levels) and soil pollution (toxic substances at harmful levels) is essential for environmental assessment, with the latter particularly affecting agroecosystem safety [
1]. Agroecosystems, which are human-managed landscapes, offer critical services like food production, soil conservation, and carbon storage. However, these systems are threatened by soil contamination from industrial waste and overuse of agrochemicals. Agricultural soil pollution poses a serious risk to human health and food security, both by directly reducing crop yields due to toxic levels of contaminants and, indirectly, by causing the produced crops to be unsafe for people and livestock consumption [
1]. Actually, toxic substances spread into agricultural soils can not only contaminate other environmental matrices but also interact with crop plants, thus increasing the percentage of harmful chemicals that people and livestock absorb through food chains [
2]. Such contamination disrupts vital ecosystem functions, particularly in European agricultural regions, spotlighting the need for innovative monitoring and remediation strategies.
Assessing soil contamination across large agricultural areas is challenging due to the complexity and cost of traditional monitoring methods, such as labor-intensive soil sampling and laboratory analysis. To overcome these challenges, remote sensing (RS) and bioindication have emerged as promising alternatives, providing efficient, scalable, and cost-effective ways to monitor soil health and pollution impacts. Bioindicators, organisms that respond to environmental stressors, serve as natural sensors for detecting pollution levels. Among these, plant species possess particularly interesting characteristics such as immobility on the ground, wide distribution, and notable sensitivity to toxic substances spread in the environment, to which they react with visible and specific symptoms [
3]. These features make plants excellent candidates for use in bioindication as natural “sensors” of pollution phenomena. Indeed, plant bioindication, especially using globally widespread crops such as cereals or forage crops, offers the significant advantage of assessing the concrete danger that a pollutant may represent not only for environmental quality but also for human health [
4]. This is possible because the effects of mixed contamination detected by a bioindicator plant are correlated not only with the amount of pollutants in soil but also with their actual bioavailability in the environment, thus allowing the analysis of interactions and combined effects of toxic substances on non-target organisms. Moreover, the broad distribution of agroecosystems in the landscape also makes them an ideal subject for environmental monitoring through RS technologies, offering the possibility of cost-effective and time-saving surveillance of soil pollution issues.
The integration of remote sensing technologies with bioindication methodologies significantly enhances the capability to detect and analyze environmental stressors in agroecosystems. Among RS platforms, unmanned aerial vehicle (UAV)-mounted multispectral (MS) and hyperspectral (HS) imaging systems facilitate large-scale vegetation monitoring, enabling the capture of subtle physiological and structural alterations that indicate pollution stress. UAV-based technologies, in fact, favor the obtaining of useful information on the main plants’ chemical-physical parameters, thus mapping the spatial-temporal variability in crop conditions. As the plants’ attributes influence their spectral properties, effective proximal and remote monitoring methods can facilitate early detection of vegetation changes, thereby allowing for timely intervention and sustainable land management practices [
5,
6]. In particular, Vegetation Indices (VIs), calculated from reflectance ratios in two or more spectral bands, represent a widely used tool in proximal/remote biomonitoring, given their sensitivity to key plant features. In the specific context of soil pollution monitoring [
7], found strong correlations between the level of organic pollutants and the ground cover of spontaneous vegetation derived from popular VIs by flying a multirotor UAV equipped with an MS image camera over a large oil processing facility in northeast England. As regards the heavy metal (HM) contamination, [
8] combined geochemistry and remote sensing techniques to offer a preliminary soil pollution assessment of a vast abandoned spoil heap in the surroundings of a mining site in Spain. In this study, an area with spontaneous herbaceous vegetation was covered by a UAV carrying a high-resolution MS camera with four bands (red, green, red-edge, and near-infrared) to obtain a correlation between plant stress and high concentrations of HMs analyzed in the soil. Among a database containing up to 55 vegetation indices, however, only VIs sensitive to both chlorophyll content and canopy structure showed proper correlation with the main detected heavy metals. Moreover, [
9] proposed a methodology for mapping the content of several metals in leaves under realistic field conditions and from airborne imaging. For this purpose, the reflectance of a pioneer species of industrial brownfields was linked to leaf metal content using optimized normalized vegetation indices. High correlations were found between the VIs exploiting pigment-related wavelengths and leaf metal content, allowing some of them to be predicted with good accuracy both in the field and in the image.
However, plant bioindication for soil pollution monitoring requires accurate multidisciplinary and multiscale analyses to be more effective compared to traditional methods. In this type of investigation, it is necessary to take into account multiple factors (related not only to the plant species and the pollutant under observation but also to technical aspects or other confounding elements) that can influence the data reliability and then the success of remote monitoring technologies [
10,
11]. For all these reasons, it is essential, especially during the phase of methodology tuning, to investigate the response of bioindicators at different levels of detail, changing analysis typology and observation scales, and also conducting an evaluation over time to identify the different reactions at different phenological stages. Vegetation, indeed, is frequently studied by combining proximal/remote sensing technologies and on-site measurements, in order to ravel the complex mechanisms that underlie plants response to the presence of toxic substances in the soil matrix. Only in this way, plants bioindication can become an operational tool for environmental monitoring.
This study presents an innovative approach to linking environmental impact assessment with sustainability. The goal is to demonstrate that it is possible to monitor pollution in agricultural systems by directly observing crops used as plant bioindicators, combining proximal and remote sensing with in situ analysis. The approach is validated through a real-world case study that considers the effect of soil contamination with heavy metals on maize. By combining expertise in engineering, environmental science, agronomy, and remote sensing, this research represents an interdisciplinary approach that links key ecological concepts with technological advances in environmental monitoring. The integration of plant physiology, spectral analysis, and geospatial technology provides a comprehensive framework for pollution assessment, making the findings highly valuable to policymakers, environmental scientists, and agricultural stakeholders.
2. Materials and Methods
To effectively assess soil contamination in agroecosystems, this study employs a multiscale approach that integrates bioindication with remote sensing technologies. In the STOPP (“Earth Observation Tools and Techniques in Proximity and Persistence”) project, funded by the Italian Space Agency (ASI), outdoor experiments were conducted using Zea mays L. (maize) as a bioindicator species, selected for its sensitivity to soil pollutants and its widespread cultivation in the Campania region. Soil contamination was simulated by introducing controlled concentrations of heavy metals (Pb, Zn, Cr) and an organic pollutant (benzo[a]pyrene), reflecting real-world pollution conditions observed in agricultural soils. Experimental plots consisted of bin-like containers filled with a standardized clay-loam soil, divided into control (untreated) and treatment (contaminated) groups. To monitor plant responses, a combination of on-ground and remote sensing techniques was applied. Morphological and physiological traits, including plant height, Leaf Area Index (LAI), and chlorophyll content, were measured in situ. Fluorescence parameters such as optimal quantum yield (Fv/Fm) and Non-Photochemical Quenching (NPQt) were analyzed to assess photosynthetic efficiency. UAV-based remote sensing campaigns were conducted using multispectral, hyperspectral, and thermal imaging sensors mounted on DJI Mavic 3 and Foxtech Hover 1 drones. Multispectral indices, for example, Normalized Difference Vegetation Index (NDVI) and Normalized Difference Red Edge Index (NDRE), were derived to evaluate vegetation health, while thermal imaging detected variations in leaf temperature linked to stress responses. Data were processed using Pix4D Fields 2.9, QGIS 3.40, and MATLAB R2023a. This integrated methodology ensures a comprehensive evaluation of pollutant impacts, bridging the gap between traditional soil assessments and scalable, technology-driven monitoring solutions.
2.1. Experimental Setup
Maize plants (
Zea mays L., var. Limagrain) were grown in bin-like containers (1 × 1 m) from May to July 2024 under natural conditions (ambient temperature and natural light) at the Castel Volturno (CE) Experimental Station of the University of Naples Federico II. The experimental design consisted of three separate bins for control (untreated, CT) and four for spiked soil (treated, TR). The clay-loam soil used for the experiment was collected at the same experimental farm, as it was considered representative of the chemical-physical characteristics of most agricultural soils in the Campania region. For the TR (treated) theses, the soil was contaminated with an aqueous solution containing a mixture of one organic contaminant (benzopyrene) and three inorganic ones (Zn, Cr, and Pb) at a concentration 4 times (three bins, Tx4) or 3 times (a single bin, Tx3) higher than the soil contamination thresholds described by the Italian legislation (D.Lgs. 152/2006), as exceeding tolerable levels of soil quality [
12]. The background values of potentially toxic inorganic elements in the soils of the Campania region were previously reported by [
13]. Particularly, in the Caserta (CE) territory where the soil used in this study was sampled, the range of background values for the three tested metals is around 4–16, 56–100 and 13–80 mg/Kg for Cr, Zn and Pb, respectively. During the entire duration of the experiment, the environmental conditions were monitored, with a frequency of 15 min, thanks to a weather station (GMR Strumenti) installed near the experimental bins. Such data recorded during the two measurement campaigns (17 and 25 July 2024) are reported in
Table 1.
2.2. On-Ground Measurements
Six weeks after sowing (17 July 2024), both morphological and physiological plant parameters were measured in situ. In particular, plant height (PH) was measured manually as the distance between the soil surface and the highest point of central leaves of 7 representative plants of each untreated and treated thesis, and an indirect measure of canopy cover was conducted by using the Lapin LP110 (Photon Systems Instruments sro., Czech Republic,
https://psi.cz/) device. The LaiPen instrument measures the one-sided green leaf area per unit ground surface area (LAI = leaf area/ground area m
2/m
2) in maize canopies. The Leaf Area Index (LAI) was then calculated from solar irradiance measurements made below the vegetation canopy using a radiative transfer model in vegetative canopies [
14]. On the same date, leaf chlorophyll and fluorescence measurements were additionally conducted by using the MultispeQ handheld device (PhotosynQ Inc., East Lansing, MI, USA). The Multiset instrument works as a chlorophyll meter that measures the light transmitted by a plant leaf at red (650 nm) and infrared (940 nm) wavelengths, thus providing a spectral index, SPAD (Soil–Plant Analysis Development Index), highly correlated to leaf chlorophyll (Chl) content, as well as a portable PAM (Pulse Amplitude Modulated) fluorometer that allows for fast and precise measurements of some key parameters related to active leaf Chl fluorescence, such as Fv/Fm (Optimal Quantum Yield),
ϕII (Effective Quantum Yield) and NPQ
t (Non-Photochemical Quenching) [
15]. Such measurements were taken on two uppermost fully developed leaves of 7 representative plants of each untreated and treated thesis, for a total of 14 leaf measurements per bin and 42 per experimental thesis. The same on-ground measures were also repeated the following week, on 25 July 2024, simultaneously with the drone flight campaign. Analysis of variance (one-way ANOVA) was applied to all measures to determine the statistical significance (Tukey’s test at
p < 0.05) of the differences between the mean values of the control bins and the contaminated ones by using MATLAB R2023a software.
2.3. UAV Acquisitions
2.3.1. Multispectral and Thermal Sensors
In this study, two drones from the DJI Mavic (Nanshan, Shenzhen, China) series were employed. The first is a DJI Mavic 3T, whose payload consists of a three-sensor array. Specifically, these sensors are as follows: a thermal camera, consisting of an uncooled microbolometer VOx (Vanadium Oxide); a 12 MP digital camera with CMOS of ½ inch and hybrid zoom; a 48 MP digital camera with CMOS of ½ inch. This drone is able to record simultaneously visible and thermal infrared data. The incorporation of thermal sensors into UAV systems has shown to be an effective tool for detecting pollution sources and following contaminated watercourses, as evidenced by aircraft infrared thermography in Italy’s Campania region [
16]. The second drone is a DJI Mavic Multispectral equipped with an RGB camera of 20 MP and four multispectral cameras of 5 MP each (green, red, red-edge and near-infrared). In the same manner, the drone can simultaneously record data with the five cameras. This is actually designed for the computation and analysis of the MS index and georeferenced multi-band data. Both the drones employ a GPS (Global Positioning System) RTK (Real Time Kinematic) sensor embedded in the platforms, which works in conjunction with a GNSS (Global Navigation Satellite System) D-RTK (Differential Real-Time Kinematics) 2 dedicated ground station was used to improve geolocation accuracy.
On 25 July 2024, several flights were executed with the various drones. Three flights were carried out with the DJI Mavic 3T, two manually operated and one autonomous, at the height of 7 m, obtaining a spatial resolution of ~0.25 cm. In the autonomous mode, the flight area, the path, the altitude, and the frequency of shots are planned in advance with the aim of optimizing the quality and consistency of the recorded data, allowing the drone to operate autonomously. Similarly, three flights were also executed with the DJI Mavic 3 Multispectral, two autonomous and one manual, at an altitude of 20 m with a GSD (Ground Sample Distance) of 1 cm. Advanced processing of MS images, together with the creation of orthomosaics and vegetation indices computation, was conducted using Pix4D Fields. Thermal images were processed in DJI Thermal Analysis Tool 3.0, and spectral signature analysis and visualization were conducted in QGIS.
2.3.2. Hyperspectral Sensor
The customized Foxtech Hover 1 quadcopter was equipped with the Cubert Ultris 5 (CU-5) cameras and its DLS (Downwelling Light Sensor) [
12,
17]. The drone’s original battery has been replaced with a better-performing one, capable of higher current despite the autonomy. In this configuration, the complete system weight is around 3.5 kg with battery autonomy of approximately 20 min. The CU-5 is a hyperspectral camera provided with 51 bands covering the visible and near-infrared (
NIR) range. Differently from the majority of hyperspectral cameras, the CU-5 acquires images with a global shutter sensor rather than a push-broom sensor. Given the specific technology, the image spatial resolution is the same for each band (290 × 275 pixels), and there is no misalignment among them. However, it is important to consider that the low spatial resolution could introduce the spectral mixing issue (e.g., in the current application, pixels at the edges of bins may contain information from both vegetation and soil). Taking into consideration the previous observations, by adopting appropriate corrections, the CU-5 provides detailed data on the reflectance properties of the target objects. The CU-5 camera is particularly useful for identifying specific substances and monitoring environmental conditions on a fine scale with the ability to implement many vegetation indices.
The camera frame rate and drone flight plan were set, respectively, to 1 FPS (frames per second) and at an altitude of 10 m. In this way, we obtained a GSD of 2 cm for the CU-5. Before take-off, a camera calibration phase is needed.
4. Discussion
The findings of this study demonstrate the viability of using UAV-based remote sensing in conjunction with bioindication methodologies as an effective approach for assessing soil contamination in agroecosystems.
The on-ground results showed that maize functional parameters measured six weeks after sowing (
Table 2) were discriminated in identifying a stress condition due to soil contamination by three heavy metals (HMs) and a Polycyclic Aromatic Hydrocarbon (PAH), as previously stated in [
12]. In line with our results, many authors have already reported an alteration of the photosynthetic process in different crops grown on soils contaminated by HMs or PAHs, with consequent depletion of leaf chlorophyll content, fluorescence efficiency, and net carbon assimilation rate [
24,
25,
26,
27]. This stress response of maize plants has been related to the indirect effect of pollutants on the soil’s physicochemical proprieties, as well as to their toxic-oxidative action on plant membranes [
28,
29]. However, low efficacy of physiological parameters in distinguishing the experimental theses was observed following the second in situ campaign (
Table 2), possibly indicating either an overcoming of the “critical” stress phase of maize plants under soil contamination or a misalignment of phenological growth stages between the two experimental theses. Actually, at the time of such measurements, the untreated plants (CT) were in a more advanced vegetative phase (almost earing) than the spiked ones (TR), with the consequent beginning of the leaf senescence process, which could have determined lower SPAD values for these samples (
Table 2). Further detailed analyses are still necessary to confirm these hypotheses. On the other hand, the on-ground measured morphological parameters proved to be excellent indicators of soil contamination stress. In both in situ campaigns, in fact, significantly higher PH and LAI values were measured in CT plants rather than TR ones (
Table 2), in agreement with previous studies where a negative effect on growth and structural parameters, such as plant height, shoot biomass, or leaf area, was also found in maize plants grown on HM- or PAH-polluted soils [
24,
25,
26,
27]. In particular, a significantly higher LAI was determined in the CT bins compared to the TR ones (
Table 2), further confirming the negative impact of soil contamination by HMs and PAHs on the development of maize plants, which particularly impacted the structural traits by slowing down growth and leading to irregular canopy development.
Satisfactory results were also obtained from remote analyses. Multispectral, hyperspectral, and thermal imaging effectively identified vegetation stress in maize plants exposed to heavy metals and organic pollutants. In particular, the most notable difference that was appreciated through an observation in the visible and multispectral concerned the morphological aspect, that is, the extent of plant growth. As a matter of fact, although multispectral
NDRE showed limited variation among the experimental theses, the extent of the plants was visibly different between the control and contaminated bins. These results suggest that basic plant features (higher height and growth of control plants) can be identified using the multispectral data, while the vegetation indices derived from such spectral data may be poorly discriminating for this type of investigation. It is evident from our MS results that the control bins had higher germination rates than the polluted ones (
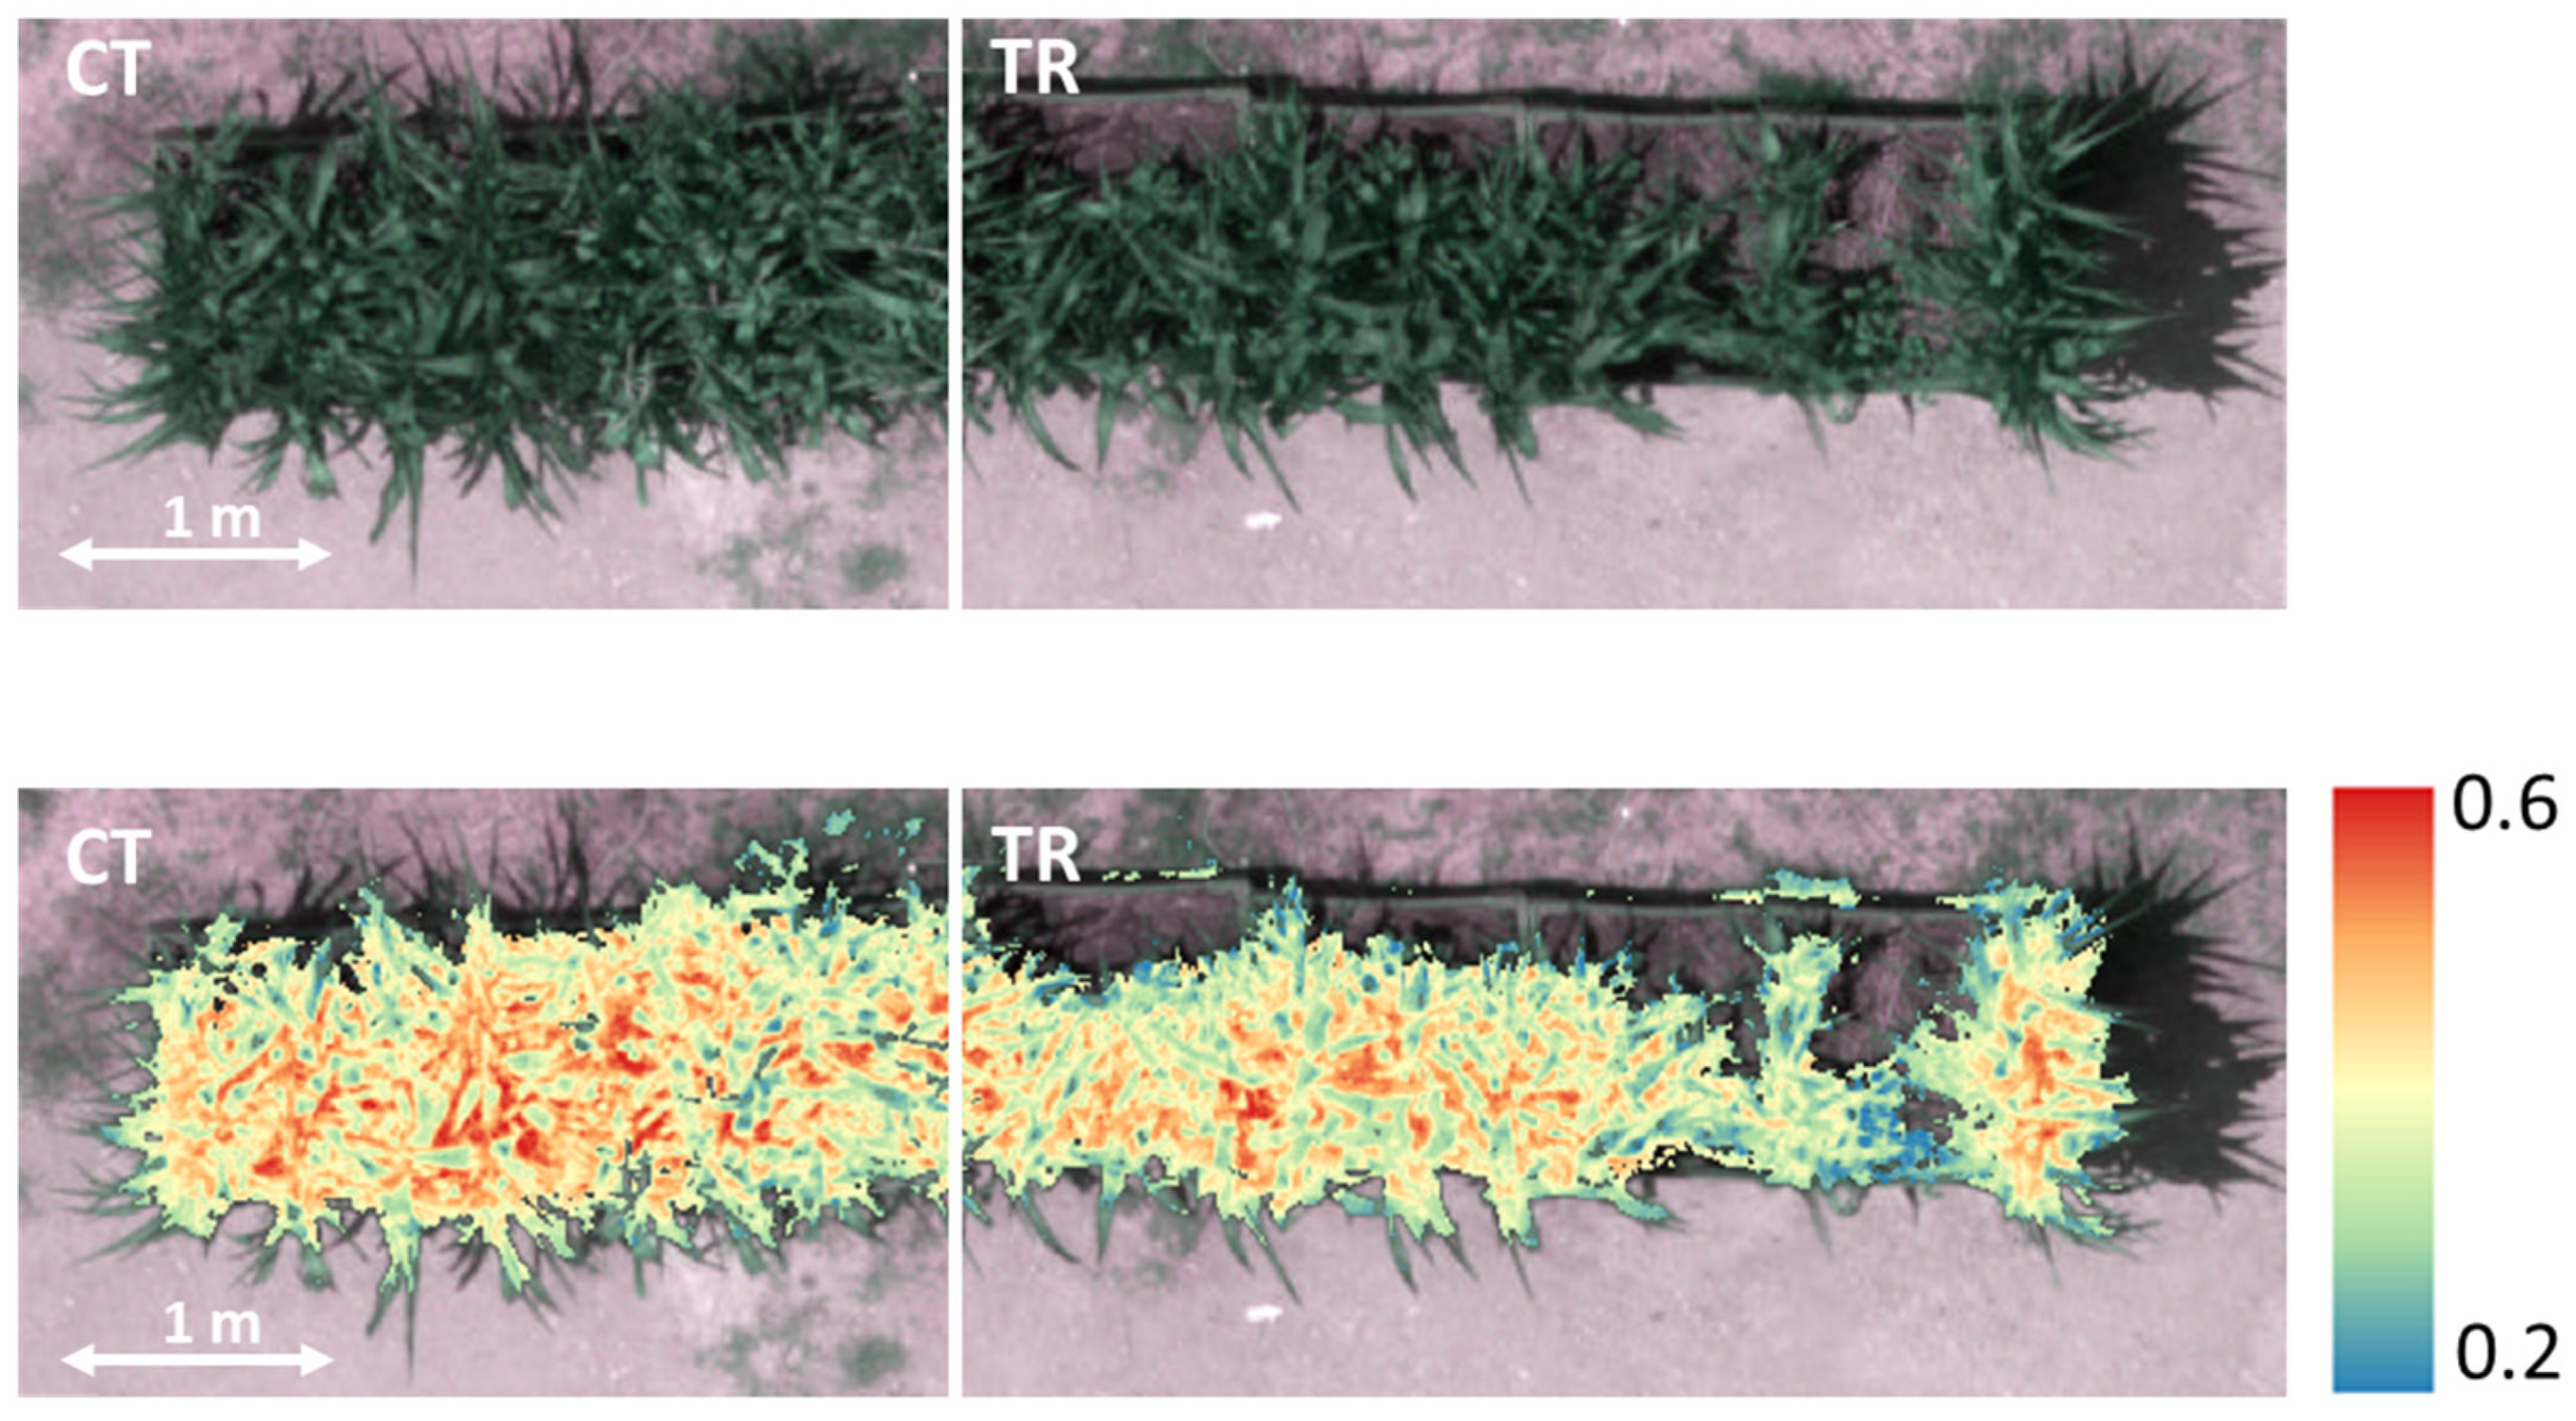
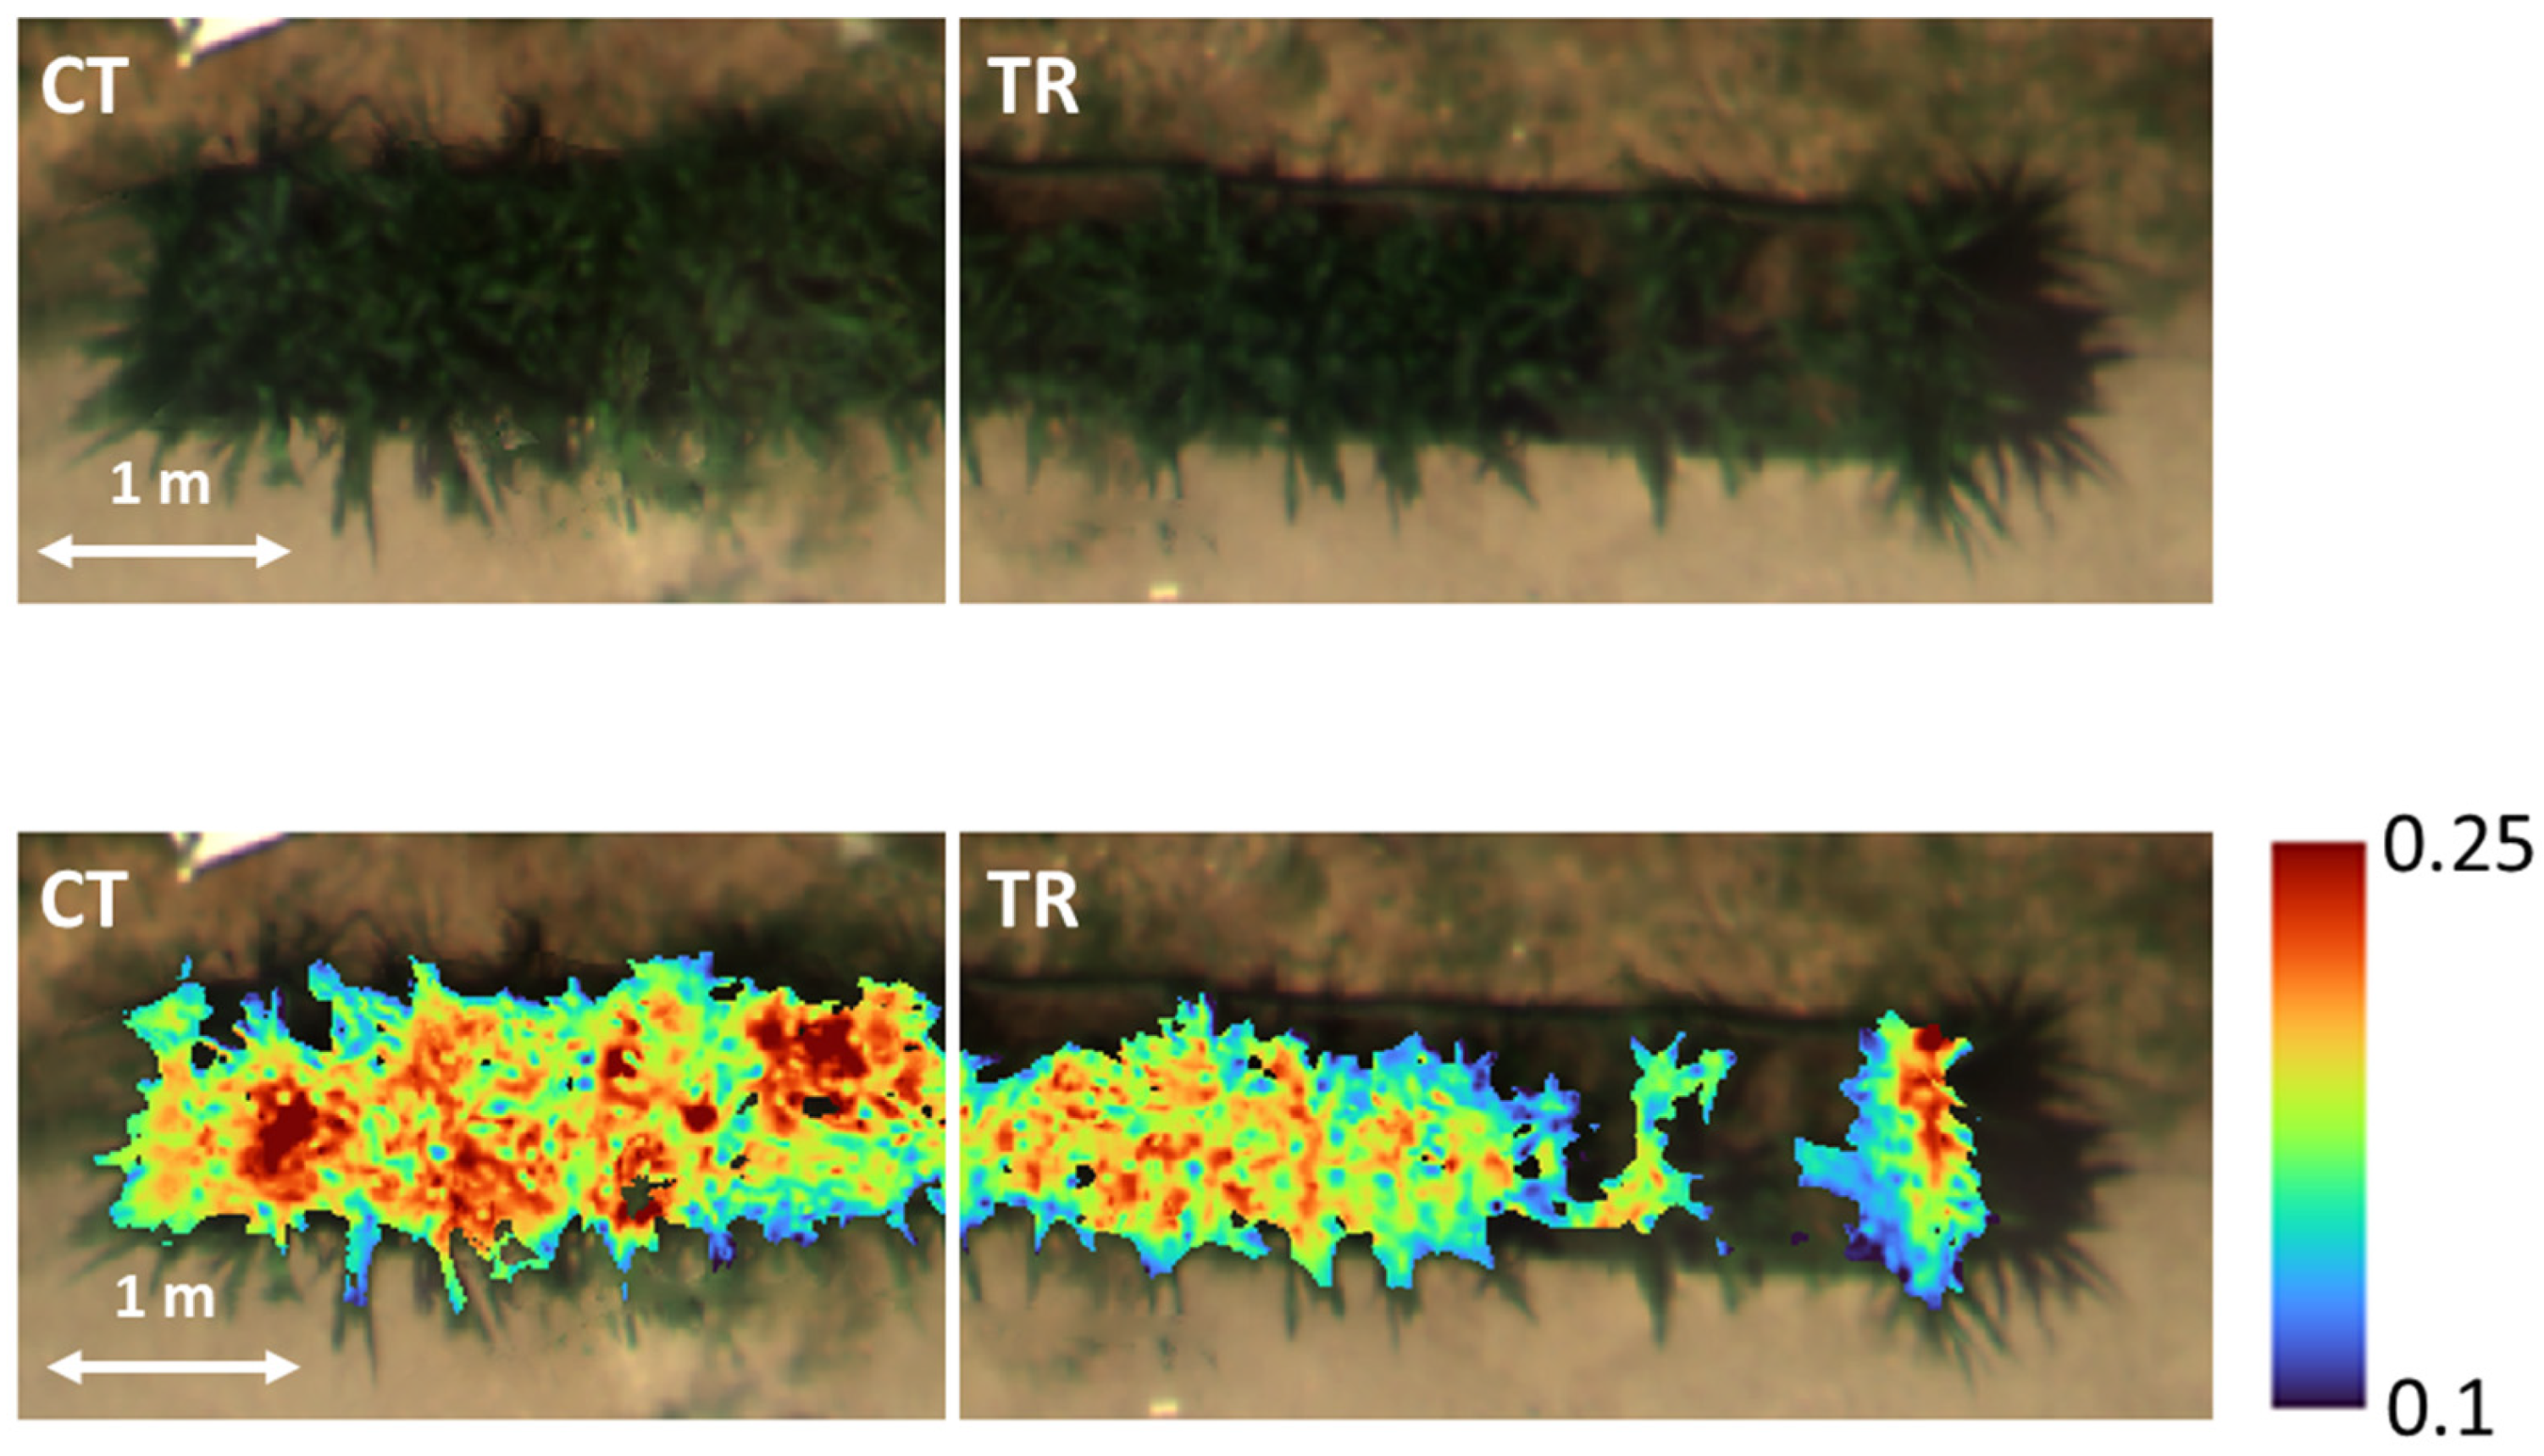
Figure 1). Therefore, the multispectral data make it possible to obtain a broad picture of the maize’s health condition, but the indices cannot offer more specific information that can be helpful for accurate environmental impact assessments. In this type of study, it may hence be useful to support conventional vegetation monitoring methods with the integration of additional information derived from UAV hyperspectral imagery. Indeed, our HS results revealed that with the same specified indices, it was possible to identify differences between the two experimental theses at the pixel value level, thus being able to visually distinguish two areas: CT (untreated) with higher
NDRE values and TR (contaminated soil) with lower values (
Figure 2). These data were coherent with the on-ground measurements of morphological maize properties (PH and LAI) that were statistically significant, thus remotely confirming the negative impact of soil contamination by HMs and PAHs on the development of maize plants, which particularly impacted the structural traits by slowing down growth and leading to irregular canopy development.
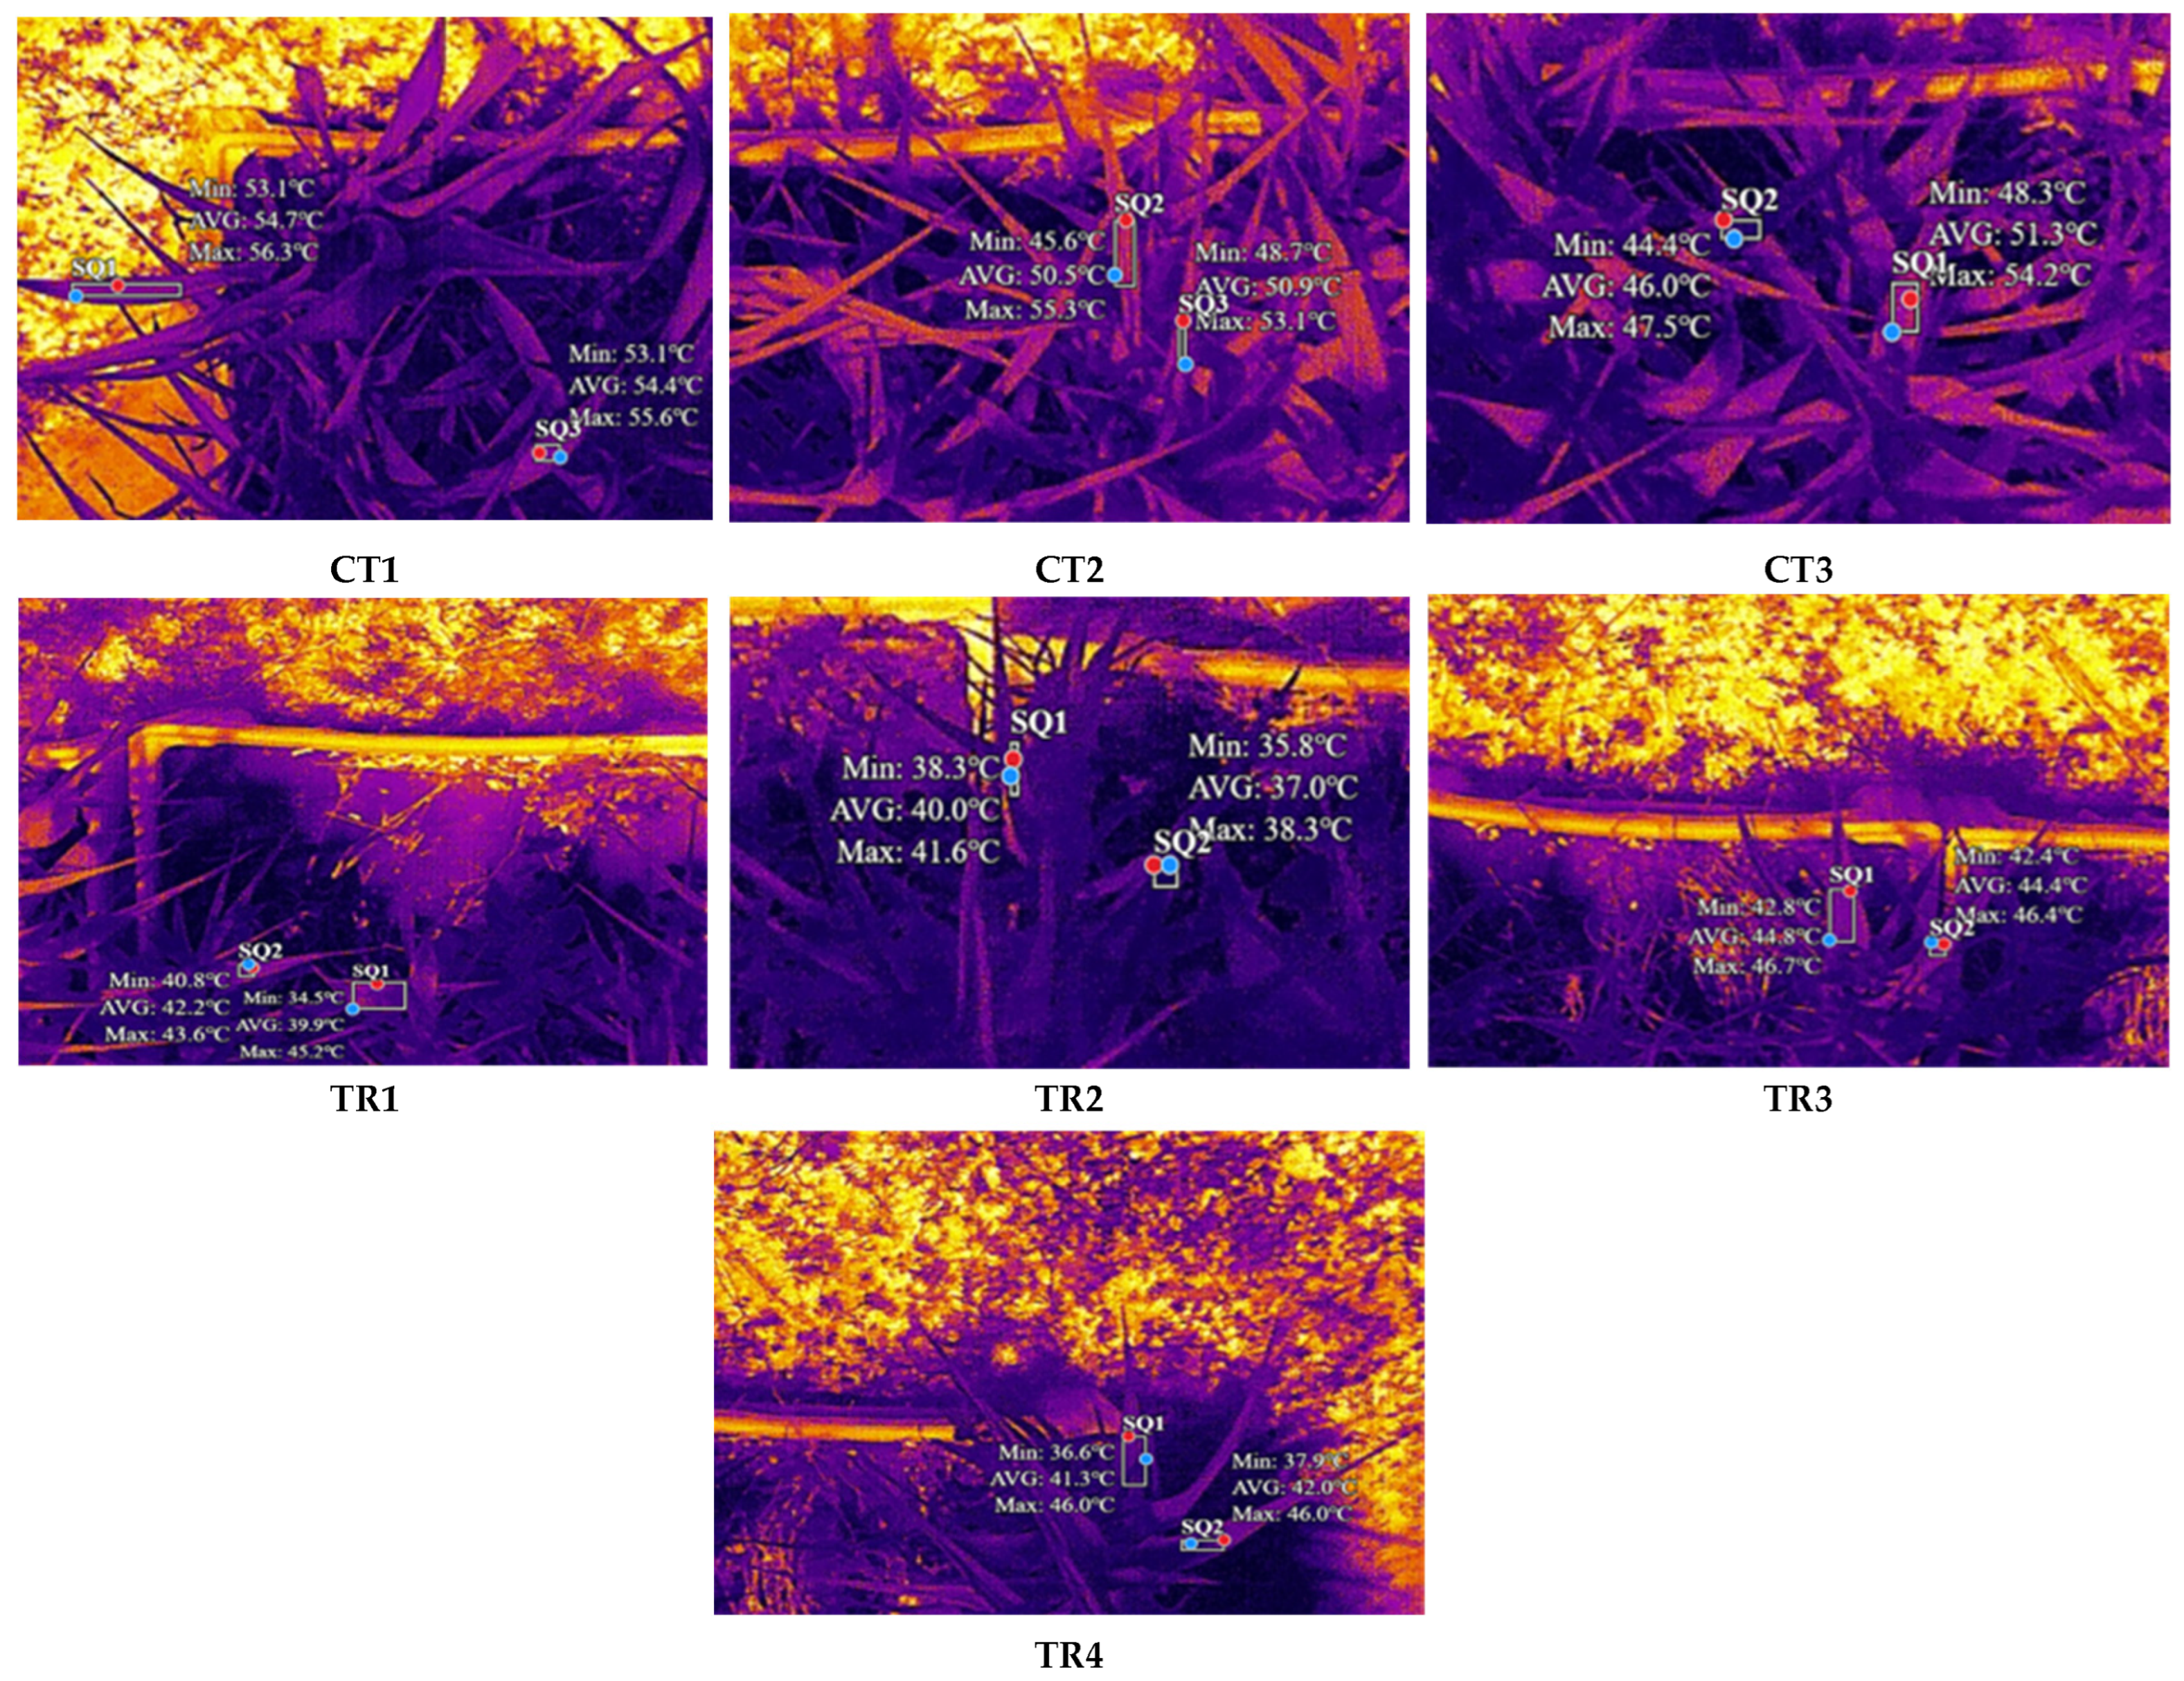
Finally, in this study, thermal data were extracted to show the capability of UAV thermal imaging in highlighting subtle temperature differences related to vegetation health. Such integration of multispectral and thermal imaging can potentially represent a robust technique in environmental monitoring and impact assessment. Our data pointed out a consistent thermal shift in temperatures between the treated and control plants, showing a clear thermal response to the treatment (
Figure 3). It is important to note that the absolute values of temperature attained in this experiment may not be perfectly accurate, which can fluctuate within a certain range of emissivity of maize depending on surface characteristics [
30]. These variations in emissivity result in errors associated with precision in the surface temperature measurement. Additionally, environmental conditions such as ambient temperature, humidity, and any wind are apt to make yet further influences upon the thermal values that shall have been recorded, emphasizing the need to focus on relative temperature differences rather than absolute values. However, it is evident that the control plants showed higher temperatures than the treated ones (
Table 4 and
Table 5). This thermal response could derive from the different leaf cover shown by the two experimental theses, which was significantly greater in the untreated plants (control) compared to the contaminated bins. Although maize plants received the same amount of irrigation throughout the experiment, in fact, it could be possible that the water available to control leaves was lower at the time of the flight campaign due to the higher canopy density in these experimental containers. Therefore, control plants may have experienced water shortages in the central hours of the day, corresponding to the time of the measurement campaigns, thus showing higher leaf temperature values. Conversely, treated plants maintaining less canopy density due to growth inhibition by soil contamination may have experienced complete water availability in the experimental bins, thus resulting in overall lower leaf temperatures recorded for these samples.
The study emphasizes the necessity of continuous monitoring since plant responses to contaminants vary across phenological stages. Additionally, while multispectral indices alone may not suffice for precise contamination detection, their combination with hyperspectral data and thermal imaging enhances the accuracy of environmental impact assessments. This study highlights the effectiveness of a multi-scale approach as it integrates remote sensing with bioindication, offering valuable insights for sustainable agricultural management and environmental monitoring. Furthermore, integrating multiple scientific disciplines is crucial, as combining plant physiological responses with remote sensing techniques improves the accuracy and efficiency of environmental assessments. This interdisciplinary research merges agronomic knowledge with remote sensing analytics, showcasing the potential of technology-driven strategies in sustainable land management. The findings pave the way for developing adaptable, cross-disciplinary environmental monitoring frameworks suitable for various agricultural landscapes and contamination scenarios.
5. Conclusions
This study underscores the potential of integrating bioindication with advanced remote sensing technologies to enhance environmental impact assessment in agroecosystems. By utilizing UAV-based multispectral, hyperspectral, and thermal imaging, the research establishes a scalable and efficient methodology for detecting pollutant-induced stress in crops. The findings highlight that while vegetation indices provide valuable insights, structural plant traits and thermal responses offer a more reliable means of identifying contamination stress. This interdisciplinary approach, which merges agronomy, environmental science, and geospatial analysis, demonstrates how technological advancements can revolutionize environmental monitoring by bridging conventional soil assessment methods with sustainable agricultural practices.
By integrating expertise from multiple fields, this research offers a model for future studies seeking to enhance environmental impact assessments with cutting-edge technological solutions. The ability to combine plant physiological responses with remote sensing analytics ensures a more precise, scalable, and cost-effective methodology for pollution monitoring. These findings contribute to the broader goal of sustainable agroecosystem management, offering practical tools for early contamination detection and informed decision-making.
Although only a test bed case was presented and evaluated in the paper, the derived insights extend beyond the singular methodology, offering a holistic perspective on addressing ecological challenges. The objectives of future research in this field will focus on expanding experimental studies by testing the response of additional plant bioindicators to various types and mixtures of pollutants. The ultimate goal is to develop a comprehensive catalog linking bioindicators, soil characteristics, pollutants, and their typical spectral signatures, thereby enhancing the applicability of this methodology across different geographical areas and pollution phenomena. Ultimately, this interdisciplinary framework supports sustainable land management by equipping stakeholders with actionable insights, ensuring long-term agroecosystem resilience and food security.


 ,
, 

