1. Introduction
In recent years, autonomous vehicle technology has advanced rapidly, leading to significant changes to our daily lives and transportation systems. These vehicles, which integrate a range of sophisticated technologies such as artificial intelligence, sensor technology, and big data analytics, can drive themselves without human intervention. These innovations are set to revolutionize current transportation frameworks, with autonomous vehicles attracting considerable attention for their potential to enhance safety, efficiency, convenience, and sustainability [
1,
2,
3]. The emergence of autonomous vehicles is expected to offer numerous benefits, including a reduction in traffic accidents, decreased congestion, and improved transportation convenience [
4,
5]. For example, autonomous driving technology has the potential to significantly reduce traffic accidents caused by human error and to provide sustainable mobility solutions for vulnerable populations, such as the elderly and people with disabilities. Moreover, autonomous vehicles are positioned to enhance environmental sustainability by optimizing route calculations, improving traffic flow, and reducing carbon emissions. As this technology continues to develop, the need for an international standard to classify the levels of autonomous driving has become apparent. In response to this, the Society of Automotive Engineers (SAE) in the United States has defined six levels (Level 0 to Level 5) based on the functions and automation levels of autonomous vehicles [
6,
7]. This standard has been widely adopted worldwide and serves as an important reference for evaluating and comparing the progress of autonomous vehicle technology.
Table 1 summarizes the six levels of autonomous vehicles defined by SAE and the characteristics of each level.
The SAE autonomous vehicle level standards, as summarized in
Table 1, clearly distinguish the development stages and capabilities of autonomous vehicle technology. This standard is crucial for developers, policymakers, and consumers, offering insights into the evolution of autonomous vehicle technology and its current state of advancement. Despite the accelerated pace of development in safety support technologies for autonomous vehicles, the majority of commercially available autonomous vehicles remain in the early stages of this evolutionary process [
8].
According to the SAE classification system, the most autonomous vehicles currently in operation are at Levels 2 and 3. Level 2 autonomous vehicles provide partial automation, enabling the driver to delegate certain fundamental driving tasks to the system. For instance, adaptive cruise control (ACC) and lane keeping assist (LKA) systems allow the vehicle to autonomously regulate speed and maintain lanes. While these functionalities help mitigate driver fatigue and enhance driving convenience, they still require the driver to continuously monitor the driving environment and intervene when necessary. Consequently, the driver remains ultimately responsible for the vehicle’s safety and operation [
9]. Level 3 autonomous vehicles offer conditional automation, allowing the vehicle to perform all driving tasks under specific conditions. For example, on a highway where autonomous driving is feasible, the vehicle can determine driving paths, control speed, and execute land changes autonomously. However, in the event of an unanticipated situation, the vehicle requests intervention from the driver, who must be prepared to respond promptly. Although Level 3 technology reduces the need for driver intervention, it does not yet achieve full autonomous driving [
10].
Fully autonomous driving, as represented by Level 4 and 5 vehicles, aims to achieve complete autonomy, but these levels have not yet been fully realized [
11]. A Level 4 autonomous vehicle can operate without driver intervention in most situations, but only under specific, limited conditions, such as within designated urban zones or on highways [
12]. Conversely, Level 5 autonomous vehicles are designed to perform all driving tasks in any environment without driver intervention, potentially replacing human driving altogether. However, these technologies are still in the developmental phase, and it is anticipated that significant time will elapse before they are ready for widespread commercialization [
13,
14].
The current state of autonomous vehicle technology, predominantly at Level 2 and Level 3, represents a critical transitional phase towards fully autonomous driving. Alongside technological advancements, it is essential to address legal, ethical, and social issues to ensure the safe and efficient integration of autonomous vehicles into daily life. Vehicles at these levels are equipped with various safety support systems that enable partially automated driving, assisting the driver and enhancing the safety and convenience of driving. Among these systems, ACC allows the vehicle to automatically maintain a distance from the vehicle ahead and adjust its speed accordingly [
15]. For example, if the vehicle in front slows down, the ACC system automatically reduces speed and returns to the set speed once the path is clear [
16]. This reduces driver fatigue during long-distance driving or in congested traffic. Similarly, LKA is an essential safety support system designed to prevent the vehicle from deviating from its lane [
17]. Utilizing advanced lane recognition technology, LKA automatically corrects steering to ensure the vehicle remains within its intended lane, even if the driver momentarily loses attention [
18]. Furthermore, the automatic emergency braking (AEB) system is a fundamental safety feature of autonomous vehicles. If an unexpected obstacle appears in the vehicle’s path, the AEB system automatically applies the brakes to prevent a collision, even without the driver’s input. The AEB system uses a combination of radar and camera technology to monitor the vehicle’s surroundings in real-time, alerting the driver to potential hazards and automatically applying the brakes when necessary [
19,
20]. Additionally, autonomous vehicles are equipped with safety systems such as blind spot detection (BSD) and the rear cross traffic alert (RCTA). BSD identifies vehicles in the side and rear blind spots, alerting the driver and facilitating safe lane changes [
21,
22], while the RCTA detects vehicles approaching from behind when reversing, preventing collisions.
These safety support systems enable autonomous vehicles to operate safely and efficiently, reducing the need for driver intervention. While drivers must still monitor the driving environment and intervene when necessary, these systems significantly enhance the safety and convenience of driving, playing a critical role as autonomous vehicles progress toward full autonomy. However, the emergence of autonomous vehicles has also introduced new types of vehicular collisions. For example, the 2021 National Law Review [
23] reported that the average accident rate for autonomous vehicles is 9.1 per million miles driven, higher than the 4.1 rate for traditional vehicles [
24]. These figures suggest that the technology behind autonomous driving is still in its early stages. A 2022 report by the National Highway Traffic Safety Administration indicates 392 reported accidents involving Level 2 autonomous vehicles, with approximately 273 occurring in Tesla vehicles [
25]. These accidents likely result from a combination of technological limitations and driver inattention [
26,
27]. Additionally, by 2023, the state of California recorded 612 incidents involving autonomous vehicles, 17 of which resulted in fatalities [
25,
28]. These data highlight ongoing concerns about the safety of autonomous vehicles and underscore the need for active driver monitoring alongside technological advancements.
As shown in
Table 1, while autonomous vehicle-related technologies are continuously developing, most vehicles on the market remain at Level 2 [
29]. As this level, vehicles can perform tasks such as steering and acceleration/deceleration simultaneously, but drivers must still continuously monitor the driving environment and be ready to intervene when necessary [
30]. Since vehicles at this level do not provide complete autonomous driving, driver attention is essential. Even Level 3 vehicles can only drive autonomously under specific conditions, requiring immediate driver intervention in emergencies. In such cases, if the driver is not paying attention, it becomes difficult to respond quickly, potentially leading to accidents.
An analysis of accident cases involving autonomous vehicles reveals that many accidents occur due to driver inattention and an inability to respond promptly to unexpected situations [
31]. According to the California Department of Motor Vehicles and Traffic [
32], most autonomous vehicle accidents happen during turns at intersections, while driving straight, or during sudden stops or accelerations, often leading to rear-end collisions. Accidents also occur when regular vehicles overtake autonomous vehicles or when autonomous vehicles change lanes. These accidents highlight the current technological limitations of autonomous vehicles and suggest that continuous driver monitoring and intervention are still necessary. To prevent traffic accidents involving autonomous vehicles, a forward gaze monitoring system for drivers is essential. Such a system ensures that drivers remain attentive to road conditions, reducing distractions and enabling quick responses to unexpected situations. This system can effectively prevent various traffic accidents during the early stages of autonomous vehicle adoption by reducing driver fatigue and enhancing driving safety. This paper proposes a forward gaze monitoring method for drivers, considering the technical limitations of autonomous vehicles and aiming to maximize the prevention of traffic accidents. The goal is to contribute to the establishment of autonomous vehicles as a safer and more reliable means of transportation.
The structure of this paper is as follows:
Section 1.1 reviews related research,
Section 2 describes the proposed method,
Section 3 presents the experimental results of the proposed method, and
Section 4 and
Section 5 provide discussion and conclusion.
1.1. Related Works
Research on monitoring the driver’s condition while driving has been conducted for a considerable time using various approaches. Before the emergence of autonomous driving technology, much of this research focused on preventing drowsy driving, primarily by analyzing the driver’s eyelid movements. These methods were developed to monitor driver fatigue in real-time and reduce the risk of impaired driving due to diminished attention.
R. Mohana, et al. proposed a method for detecting driver fatigue in real time using a multi-task cascaded convolutional neural network model [
33]. This method assesses the driver’s fatigue status by measuring eye blink rates and mouth openings through facial recognition and expression analysis. If fatigue is detected, an alarm sounds, and persistent fatigue prompts the system to guide the driver to a nearby rest area via Google Maps. However, this method is sensitive to environmental variables, such as lighting conditions, changes in location, and facial obstructions. Additionally, its generalization performance is limited across different driving environments due to constraints in the training dataset.
F. Ou, et al. developed a system that monitors the driver’s hand movements, facial expressions, and body postures to analyze the driver’s status in real-time and provide feedback [
34]. While this system offers high accuracy by analyzing various behavioral indicators, it requires significant computational resources, as well as a large number of cameras and sensors. This complexity increases installation and maintenance costs and poses challenges for maintaining reliability within a moving vehicle.
A. Mishra, et al. introduced an in-cabin monitoring system that combines AI-based cameras and onboard devices to monitor the vehicle’s interior and analyze various scenarios to enhance safety and security [
35]. Although this system effectively detects and analyzes passenger behavior and situations in real-time, it is limited in monitoring driver drowsiness or inattentiveness due to its primary focus on passenger monitoring rather than driver monitoring.
D. Kim, et al. proposed a real-time driver monitoring system based on facial landmarks [
36]. This system utilizes two modules, one employing a CNN algorithm and the other using the Dlip library, to detect and analyze the face and eye conditions. By analyzing the location and distance of landmarks around the eyes, the system determines whether the eyes are open or closed, issuing a drowsiness warning if the eyes remain closed for an extended period. However, the system’s accuracy is susceptible to external conditions such as lighting changes or drivers wearing glasses.
H. Beles, et al. developed a method to detect driver drowsiness by analyzing electrooculogram signals and eye state images using a CNN deep learning algorithm [
37]. The method evaluates the driver’s attention state and suggests a mechanism for the autonomous driving system to intervene and control the vehicle when necessary. By combining various signals and images, it assesses the driver’s drowsiness in real-time with high accuracy and can effectively prevent accidents when integrated with the autonomous driving system.
Y. F. Su, et al. proposed an image-based system that monitors the driver’s status using an IR camera [
38]. This method evaluates the driver’s attention through face recognition, head pose estimation, eye state detection, and gaze tracking. Specifically, a CNN-based face detector is employed to detect the face, while a depth camera and an IR camera work in tandem to calculate the head rotation angle, determining whether the driver is focused on the driving task.
Recent research in drone navigation and trajectory optimization has demonstrated several techniques that could inform advancements in autonomous vehicle technology. A relevant study is Machmudah et al. [
39], which investigates optimizing flight trajectories of fixed-wing UAVs through the bank-turn mechanism. The challenges faced by UAVs in flight path optimization share similarities with autonomous vehicle navigation, such as adjusting to dynamic obstacles, ensuring real-time system efficiency, and maintaining safety in unpredictable environments. For example, in Machmudah et al. [
39] the authors propose methods for reducing energy consumption during UAV flight path optimization, which aligns with concerns about reducing energy consumption and optimizing driving routes in autonomous vehicles. By applying these UAV-based techniques, autonomous vehicle systems could achieve better route planning and more efficient real-time monitoring of driver attention. These parallels illustrate the value of incorporating findings from UAV trajectory optimization into the development of advanced autonomous vehicle safety systems.
Various studies have introduced methods for detecting driver drowsiness and determining whether drivers are focused on the road, with most focusing on feature information located in the face and pupils. However, these methods face challenges in real-world driving environments, such as partial occlusion (e.g., masks, glasses) or changes in lighting conditions. In contrast, this paper proposes a method for determining in real-time whether the driver is looking forward while driving in a Level 3 or higher autonomous vehicle. In autonomous driving mode, drivers may neglect to look forward, necessitating intervention in emergency situations. Therefore, a system that monitors whether the driver is looking ahead is essential.
The proposed method differs from traditional approaches by using a YOLOX-based face detection system, which is known for its real-time processing, high accuracy, and computational efficiency. YOLOX is an advanced version of the YOLO model family [
40], offering superior performance due to its anchor-free design, which reduces computational overhead while maintaining high accuracy. Unlike traditional systems that often struggle with occlusions caused by objects such as masks or glasses, the YOLOX-based system performs robustly in such scenarios. It also provides a significant advantage in low-light conditions, where many other systems, including MTCNN [
41] and CNN-based approaches [
38], fail to maintain high performance.
The proposed YOLOX-based method can handle dynamic environments with better efficiency and accuracy compared to previous methods that rely on facial landmark detection or IR camera-based systems. Moreover, YOLOX’s anchor-free approach makes it faster and more computationally efficient, which is essential for real-time applications in autonomous vehicles. By addressing common issues such as partial occlusion and lighting changes, the proposed method offers a more robust solution for real-time monitoring of the driver’s gaze and attention.
2. Proposed Method
2.1. Overview
The method proposed in this paper comprises four main steps: a pre-processing step, a face detection step, a facial feature extraction step, and a normal gaze classification step, as shown in
Figure 1. The input image is obtained from an IR camera installed inside a vehicle.
Figure 2 shows an IR image of the driver’s face [
42]. Since the IR image is captured in a low-light environment, identifying facial features can be challenging. In the proposed method, the positions of occluded facial features are estimated using statistical information about facial feature positions, even when the vehicle driver is wearing glasses, sunglasses, or a mask. In the first step of the proposed method, the IR image is resized, noise is removed, and image quality is enhanced. In the second step, a box containing the driver’s face and facial feature regions is detected within the input IR image. In the third step, the distance between the detected rectangular vertices and the facial features is calculated, and the eccentricity of the elliptical facial region is calculated. Next, in the fourth step, these extracted facial features are analyzed to determine whether the driver’s gaze is directed forward.
The proposed method determines whether the gaze is normal by analyzing changes in the distance between the corners of the detected facial region and the center points of the facial features, as well as by evaluating the degree of distortion in the elliptical facial region. Moreover, even when some facial features are covered by a mask, the method can accurately estimate their relative positions to determine whether the gaze is directed normally.
2.2. Pre-Processing Step
IR images acquired inside a vehicle while driving often struggle to provide reliable features due to low lighting, vehicle vibrations, and overall image quality deterioration. Particularly, the use of IR images instead of CCD images introduces limitations in extracting detailed information about objects of interest because these images are expressed in grayscale, lacking color information. While CCD images can be used to detect the driver’s face during the day, in low-light conditions such as nighttime, cloudy weather, or fog, images captured inside the vehicle are often darker, making the detection of the driver’s face difficult. To address this problem, the proposed method utilizes an IR camera capable of capturing the driver at a fixed distance.
In the first step of the proposed method, the pre-processing of IR images is conducted to enhance the accuracy of face and facial feature detection. This step involves reducing the input image size, removing noise, and improving image quality. The input IR image is a 24-bit color image with a resolution of 800 × 1280 pixels. To facilitate efficient computational processing, a region of interest (ROI) is selected, resized, noise is removed, and the brightness and contrast of the ROI are enhanced. When selecting the ROI, the image acquired from the IR camera, installed inside the vehicle, is centered on the driver’s seat, where the driver’s face is typically located. Consequently, a central region where the face is most likely to be found is selected as the ROI, with a size of 800 × 620 pixels. The image is then resized using bilinear interpolation to a resolution of 400 × 310 pixels, reducing its size by a factor of 0.5. A 5 × 5 median filter is subsequently applied to remove salt-and-pepper noise.
Given that IR images captured inside a vehicle are relatively dark and may suffer from blurring, image enhancement is necessary for accurate facial feature detection. Various image enhancement techniques have been studied, and recently, deep learning-based methods have gained attention [
43,
44]. However, deep learning-based techniques require pre-training data, involve repetitive pixel-level calculations, and are often limited by real-time processing constraints [
45,
46]. Therefore, the proposed method employs a technique that quickly enhances the brightness and contrast of images through straightforward pixel matrix operations, considering the need for real-time processing.
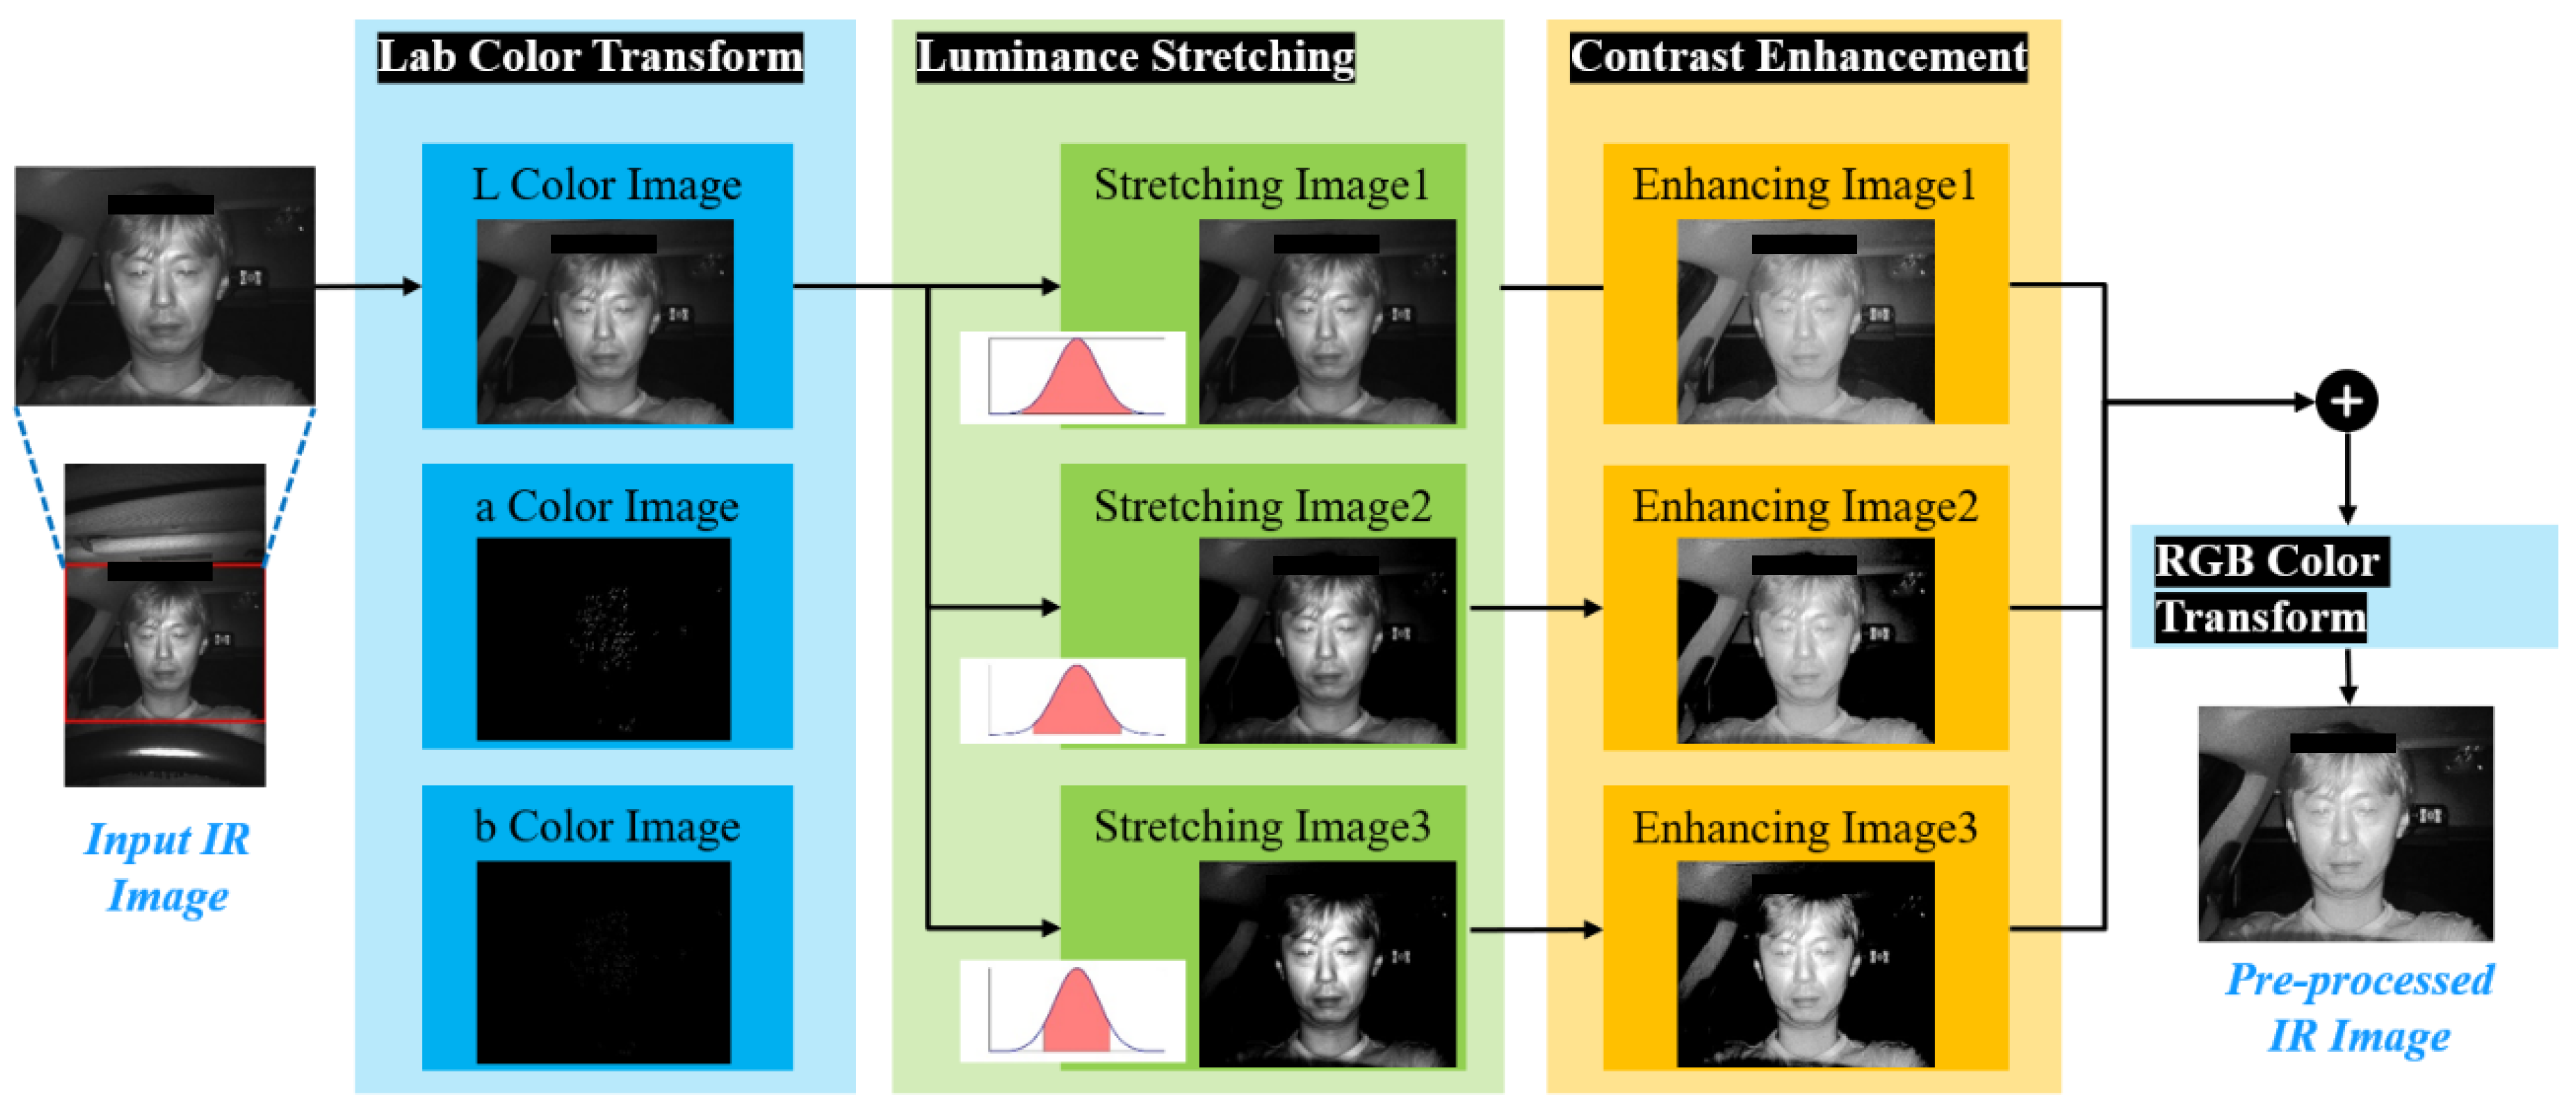
Figure 3 is the processing flow of the image enhancement procedure.
The input IR image is expressed in RGB color space; however, the proposed method focuses on detecting the face region and facial features using brightness values rather than color information. To ensure the reliable detection of the driver’s face and facial features in both daytime and nighttime conditions, a method capable of effective operation in low-light environments is necessary. To this end, the RGB color space is converted to the Lab color space, and the primary processing is performed in the Luminance (
L) channel. The Lab color space offers a color representation more closely aligned with human visual perception. It is device-independent and capable of representing a broad range of colors. The Lab color space consists of a luminance channel and two-color difference channels, which reflect relative differences in color information. In contrast, the RGB color space is primarily suited for digital devices. However, the Lab color space is more appropriate for tasks requiring color consistency [
47].
In this step, the input IR image is converted from RGB color space to
Lab color space, and then luminance values are adjusted and contrast is enhanced in the Luminance channel. As shown in
Figure 3, the IR image is initially converted to Lab color space, and then luminance contrast is enhanced through a three-step luminance stretching process. In this process, the lower 1%, 5%, and 10%, as well as the upper 1%, 5%, and 10%, of the luminance values of all pixels, are set as limits to accommodate saturation processing. Saturation processing is employed to ensure that the luminance values of specific pixels do not exceed or fall below the pre-established limits. For example, values exceeding the upper 1% and lower 1% of the luminance range are mapped to the upper 1% and lower 1% values, respectively, while the remaining luminance values are linearly mapped between 0 and 1. This process enhances the image’s contrast. Equation (1) represents the formula used to enhance contrast by saturating the luminance values.
Here, if the luminance value
of a pixel is less than the set lower limit
low, the luminance value of that pixel is set to
low. This prevents the image from becoming too dark due to low luminance values. Conversely, if the luminance value
of a specific pixel falls within the designated
low to
high range, no further alteration is required, as the value is already within optimal parameters. Finally, if the luminance value
of a specific pixel exceeds
high, the value is set to
high. This prevents parts of the image from becoming overly bright due to excessively high luminance values. This equation applies these conditions to each pixel in the image, improving overall contrast and preventing the over-representation of extremely bright or dark areas.
As a result, this process contributes to creating a more balanced image by adjusting the range of luminance values. When applying Equation (1), pixels with high luminance values are adjusted within a more limited range. This process clips the darkest and brightest parts of the image, enhancing the mid-range details. As shown in
Figure 4, the larger the upper and lower bounds for luminance stretching, the more pixels with very high or low luminance values are saturated, and luminance values within the upper and lower bounds are linearly mapped between 0 and 1. This allows the driver’s facial features to be expressed in greater detail, thereby enhancing the overall image quality.
To brighten the dark regions while preventing the oversaturation of the bright regions in each luminance-stretched image, a contrast enhancement step is applied. In the luminance-stretched image, dark regions are brightened without saturating the bright regions, proportionate to the darkness of the local region. To apply contrast enhancement, as shown in
Figure 5, an inverse image (
Sinv) is first generated to distinguish dark and bright areas in the input luminance-stretched image (
S1). Subsequently, a dehazing step is applied to generate a dehazed image (
D) and a haze thickness image (
T) indicating the thickness of the haze [
48]. Based on the generated dehazed image and haze thickness image,
Dinv and
Tinv images are produced through an inverse transformation process. The final image (
R1) with improved contrast is then generated by applying the alpha blending technique, as expressed in Equation (2).
The R1 image generated through this process provides optimized contrast, brightening dark areas while preventing the oversaturation of bright areas.
As shown in
Figure 5, in the pre-processing step, the three-final luminance-stretched images are merged to produce a pre-processed image with enhanced brightness and contrast.
2.3. Face Detection Step
This step detects the face and the elliptical face region in the pre-processed ROI. The YOLOX deep learning model is employed for face detection, as shown in
Figure 6. YOLOX is the latest model in the YOLO series, renowned for its state-of-the-art real-time object detection capabilities. It introduces various enhancements to the existing YOLO architecture, offering improved efficiency and accuracy [
40,
49]. The primary advantages of YOLOX over other YOLO models are as follows: First, YOLOX adopts an anchor-free approach, simplifying the learning process and reducing computational overhead. Unlike previous YOLO models, which relied on predefined anchor boxes, YOLOX directly predicts the location of objects, thereby enhancing both accuracy and speed. Second, YOLOX separates the detection head into distinct branches for classification and regression (bounding box coordinate prediction), significantly improving the model’s efficiency and performance [
50].
The YOLOX architecture consists of an input layer, a backbone network, a feature pyramid network (FPN), a path aggregation network (PAN), and a head network. The primary feature extraction network in YOLOX is based on CSPDarknet-53, which comprises 72 convolutional layers with a 3 × 3 kernel size and a stride of 2. These layers perform feature extraction and gradual down-sampling, allowing the network to efficiently detect objects of varying size from small to large. The early layers of the network capture low-level details, while the deeper layers extract high-level abstract information. FPN and PAN are techniques used to combine and enhance features extracted from the backbone network. FPN generates feature maps at different resolutions and merges higher-level feature maps with lower-level ones, providing richer information. PAN then enhances the output feature maps from FPN and passes the higher-level information to the lower levels, thereby enriching the contextual information. The final head network is divided into two branches: a classification branch and a regression branch. In the classification branch, the probability that an object belongs to a specific class at each location is predicted using the SoftMax activation function. In the regression branch, the center coordinates, width, and height of the bounding box containing the object at each location are predicted.
2.3.1. Face Detection
The driver’s face is detected in the ROI, where luminance has been stretched during the pre-processing step, using the YOLOX deep learning network.
Figure 7 shows the result of driver face detection using YOLOX. During the YOLOX training process, even if the face region is partially obscured by a mask, glasses, a hat, or other factors, the face is still identified and used as training data if it remains distinguishable. In most images, the driver’s face is positioned directly in front of the camera and stays within a specific range, as the driver remains seated in the driver’s seat throughout the driving task.
2.3.2. Elliptical Face Region Detection
To detect the elliptical face region that includes the driver’s face and determine the slope of this ellipse within the pre-processed ROI, the procedure outlined in
Figure 8 is followed. The input data consist of the pre-processed ROI and the location of the bounding box of the detected face, while the output is the elliptical region containing the face and the gradient value of the ellipse. To detect elliptical face shapes, a two-stage threshold value is calculated using the Otsu thresholding method applied to the luminance channel, which has been normalized to the range [0,1]. A binary image is then created by connecting pixels with similar luminance values using the average and minimum threshold value (
T1) of the luminance values along the horizontal and vertical axes passing through the center point of the detected face bounding box. A morphology operation is applied to the generated binary image, resulting in a filled binary image with fewer empty holes. Subsequently, the major and minor axes of the binary image are calculated to detect the elliptical region, and the slope value of this ellipse is determined.
The accurate detection of the pixels corresponding to the driver’s face in the pre-processed ROI is essential for identifying the ellipse containing the face region. Although various image segmentation methods [
51,
52] could be applied, real-time processing is critical in a driving environment. In the proposed method, since the driver’s skin color cannot be discerned from the input image and only the luminance value is available for analysis, a rapid image processing technique is employed to identify pixels within the facial region.
Figure 9 presents a visual representation of a three-dimensional graph, constructed using the luminance values of the pre-processed ROI. In this figure, the brightest luminance pixels are predominantly concentrated in the driver’s facial region, neck, and shoulder area. This phenomenon can be attributed to the fixed positioning of the IR camera close to the driver’s face, resulting in a strong reflection and capture of the IR signal in the area immediately surrounding the face. Consequently, the face region in the foreground, which is closest to the IR camera, exhibits the highest luminance values. By conducting a connected component analysis based on similar luminance values, it becomes evident that the pixels included in the face can be accurately extracted.
The input data for the elliptical face detection step include the pre-processed ROI and the face bounding box detected by the YOLOX face detector. Pixels corresponding to the face are labeled by assigning labels to those with luminance values within a certain range in the detected face region. To accomplish this, it is necessary to determine the range of pixels with similar luminance values. This range is calculated using a multi-step Otsu thresholding method based on the luminance value in the pre-processed ROI. When the Otsu threshold level is 1 (
T1), the driver’s neck and upper body are identified as a single region, necessitating the application of a second level to further delineate these areas.
Figure 10 illustrates the histogram results obtained by applying the two-step thresholding method to the luminance image of the input ROI, leading to the labeling of the image into three distinct regions.
The luminance value
B(
xc,
yc) of the pre-processed ROI
I and the center point of the detected face bounding box are selected. After analyzing the luminance value and adjacent pixels in 8 directions with similar luminance values within a certain range, the flood-filling algorithm [
53] is applied to connect the pixels. The range of similar luminance values is defined as the minimum threshold (
Tval) derived through multi-step Otsu threshold analysis in the ROI
I, as shown in Equation (3). The pixel similarity is judged based on the upper and lower limits according to the pixel luminance value, as shown in Equation (4).
The luminance value
B(
xc, yc) at the center point of the detected face region
B is used as a reference point for examining all pixels within that region. This examination is conducted using the range and connected components of the pixels within the corresponding luminance value range, as shown in Equation (5).
2.3.3. Face Mask Detection
This step detects whether a mask is present in the detected face region. If a mask is detected, the positions of the nose and mouth need to be estimated. As shown in
Figure 11, the presence of a mask is inferred by comparing the number of edge pixels in the blue-filled area among the blocks situated at the bottom center of the facial region. Typically, images of the driver are captured by IR cameras installed inside the vehicle, showing the driver looking ahead at the road, resulting in frontal facial images. However, some images may include additional factors such as phone calls, smoking, yawning, and eating. During the facial feature learning process, if the facial features are visible in the image, they are used as learning data even if partially obscured by objects like cigarettes or phones, provided they are not entirely occluded.
In the face detection step, the learning process was conducted on the face region within the input image, regardless of whether a mask was worn. Consequently, the face region was identified with a high degree of accuracy, even when a mask was present. This step does not employ the YOLOX-based detector used in the face detection step. Instead, it determines whether a mask is being worn using image processing techniques. This approach is chosen because training a YOLOX network would require a large dataset of mask-wearing images, which is currently challenging to obtain. Moreover, determining whether a mask is worn can be effectively achieved using a simple image processing method.
To determine whether a mask is worn in the detected face region, a Canny edge detector is applied to generate a binary edge image. As shown in
Figure 11, when a mask is worn, the number of edge pixels in the nose and mouth regions is significantly reduced. Based on this observation, the detected face region is divided into a total of 30 blocks, arranged in a 6 × 5 grid. The number of edge pixels in a total of 9 blocks, where facial features are statistically located, is then analyzed.
Figure 12 compares the total number of edge pixels in the detected face images based on whether or not a mask was worn, focusing on the number of edge pixels in the 9 blocks marked in blue in
Figure 11. The analysis of 29,990 mask-wearing images out of the 100,303 training images used in the experiment shows that the total number of edge pixels in the face image decreases when a mask is worn, with a notable reduction in the number of edge pixels within the nine blocks containing the nose and mouth. Consequently, if the number of edge pixels in the blocks situated at the bottom center of the detected face image falls below a specified threshold, it can be inferred that a mask is being worn.
2.3.4. Facial Features Detection
In this step, facial features are detected within the detected face region. The facial features include the left and right eyes, nose, and mouth, each of which is enclosed in a bounding box. During the training of the facial feature detector using YOLOX, if the driver is wearing a mask and the nose or mouth region cannot be visually identified, those features are not labeled. Consequently, only the visible facial features are labeled and used for training. Additionally, even when the driver is wearing glasses or sunglasses, the pupils are identified through the IR camera. By labeling this information and training the YOLOX detector, the eye region is accurately detected in most cases.
Figure 13 shows the result of detecting the driver’s face in the pre-processed input image, displaying the bounding boxes containing the facial features and their center points within the detected region. Additionally, the center points of the left eye, right eye, and mouth are connected to form a triangle, and the slope of this triangle is represented in three dimensions. The slopes correspond to the line from the left eye to the right eye, the line from the mouth to the right eye, and the line from the mouth to the left eye. These slope values are useful in determining whether the driver is looking straight ahead.
As shown in
Figure 14, the facial feature detector must identify at least three facial features (left eye, right eye, and mouth) within the detected face region. However, due to the specific conditions inside the vehicle, some facial features may be mis-detected or not detected at all due to factors such as low light, vibrations, and involuntary driver movements. To address this challenge, the facial feature estimation step shown in
Figure 14 is employed.
First, if only the right eye is detected within the face region, the estimated size of the left eye is assumed to be the same as that of the right eye. A vertical line passing through the center point of the mouth and nose region, and a horizontal line passing through the center of the right eye, are drawn to intersect. The slope of the vertical line is adjusted to reflect the orientation of the ellipse extracted from the face ellipse region. The center point of the left eye is estimated to be located one-third of the distance from the left end of the horizontal line.
Second, if the nose and mouth regions are not detected within the face region, a horizontal line is drawn connecting the center points of the left and right eyes. A vertical line is then drawn downward from the midpoint of this horizontal line, with the slope of the vertical line adjusted to reflect the orientation of the ellipse obtained from the face ellipse region. The center points of the nose and mouth are estimated to be located at points two-fifths and four-fifths down the vertical line, respectively. Additionally, the size of the nose and mouth regions is assumed to be the same as the size of the smaller of the two detected eye regions.
2.4. Facial Feature Detection Step
In this step, the distance between the detected face bounding box and the bounding boxes of the detected facial features is calculated. First, a straight line is drawn connecting each vertex of the detected face bounding box to each vertex of the detected facial feature’s bounding box, and the position and length of this line are calculated. Additionally, the eccentricity of the elliptical face region obtained during the face detection step is also calculated. However, variations in the distance between the IR camera and the driver or in the size of the driver’s face can cause discrepancies in the length of the lines connecting the detected facial features and the vertices. To address this variability, the relative distance between the facial feature bounding boxes can be evaluated using a normalized distance, based on the size (diagonal length) of the detected face bounding box.
Figure 15 shows the result of connecting the vertices of the detected face bounding box to the vertices of the facial feature bounding boxes with straight lines. The distance from the vertices of the detected face bounding box to the center point of each facial feature is expressed as a vector. By measuring changes in this vector, it is possible to determine whether the driver is looking straight ahead or to the side. In addition, the eccentricity of the elliptical face region detected in the previous step is calculated. Eccentricity serves as an indicator of the flatness of the ellipse, numerically expressing the degree of elongation. It is calculated using the formula presented in Equation (6).
Here,
a represents half of the major axis of the ellipse, and
b represents half of the minor axis. The eccentricity, e, assumes a value between 0 and 1, which defines the shape of the ellipse. When e = 0, the ellipse is a perfect circle; as
e increases between 0 and 1, the ellipse becomes more elongated. As e approaches 1, the ellipse becomes increasingly elongated, eventually transforming into a hyperbola as the two foci become infinitely far apart. Eccentricity is a crucial indicator that defines the shape of the ellipse. It is observed that when the driver is not looking forward, the face region becomes smaller, and the length of the ellipse increases. This characteristic is employed in forward gaze monitoring.
2.5. Driver Forward Gaze Classification
This step classifies whether the driver is gazing forward in the input image using a CNN. The feature vector used to train this CNN classifier include the detected face region, facial features, 16 distance vectors to the vertices of the bounding box encompassing the face region, the size of the triangle formed by connecting the center points of the detected eyes and mouth, the slope of each side of the triangle, and the eccentricity of the face ellipse. The CNN-based driver gaze classifier is trained by the labeling of detected facial regions as either exhibiting normal or abnormal gaze. Labeling for abnormal gaze includes instances such as talking, drowsiness, yawning, and looking at an object or direction other than straight ahead. The CNN model consists of a simple structure composed of convolutional layers, batch normalization, ReLU activation functions, fully connected layers, and a SoftMax layer.
Figure 16 shows the process flow for classifying whether the driver is gazing ahead. In this step, instead of using a pre-trained CNN model, a simple layer structure is employed to quickly produce the classification result. Finally, the feature vector extracted from the detected face region is combined with the CNN output to classify whether the driver is gazing forward.
3. Experimental Results
The proposed method was tested on a Windows 11 operating system with dual CPUs running at 3.7 GHz (16 cores, 36 MB cache), 128 GB RAM, dual GPUs 4090 (24 GB), and an 8 TB SSD. For training the YOLOX face detector, images were obtained from AI Hub [
42], comprising a total of 100,303 images of eight drivers simulating various scenarios (e.g., talking, drowsiness, yawning, and smoking) in a stationary vehicle. Additionally, 185,748 images were collected from four types of vehicles (truck, sedan, bus, and taxi) driving on actual roads. These images included labels for the driver’s face, eyes, nose, mouth, and gaze status, all at a resolution of 800 × 1280 pixels in 24-bit color. However, when the driver wore sunglasses or a mask, or engaged in activities such as smoking, some facial features might have been obscured. In such cases, during the labeling process, only the visible facial features were labeled. For example, when the driver wore glasses, the eye regions were not labeled due to light leakage caused by reflection from the IR sensor. Similarly, when the driver wore a mask, the nose and mouth were not labeled.
The proposed method consists of four steps: pre-processing, face detection, features extraction, and gaze classification. It begins by taking an IR image with a resolution of 800 × 1280 pixels as input, selecting an ROI of 800 × 620 pixels where the driver is located, and reducing this ROI by half to 400 × 310 pixels. The proposed four-step process is then applied to this reduced ROI, resulting in an average processing time of approximately 0.27 s. The experimental results showed that the proposed method achieved a face detection accuracy of 97.1% and a 96.1% accuracy in identifying facial features within the detected faces. For cases where facial features were undetected, feature information estimation was employed. The final accuracy for classifying the driver’s gaze was approximately 97.3%. Approximately 3% of the errors occurred when the driver wore a black mask, as the mask caused the elliptic region of the face to have an abnormal size and shape. Consequently, most errors involved inaccuracies in estimating the location of facial features. Nevertheless, the proposed method was able to accurately determine whether the driver was looking forward in the majority of images. It was experimentally confirmed that this method could be applied to systems designed to support safe driving in autonomous vehicles in the future.
3.1. Results of the Pre-Processing Step
IR images captured inside a vehicle often suffer from quality degradation due to low-light conditions and the vibrations that occur while driving. In this step, the quality of low-light images is enhanced through real-time image processing. In the input IR image, the driver’s face is typically located in the upper central region. To facilitate real-time processing, a predefined ROI is extracted, and the size of the region is reduced by half. Next, a stretching step is applied to remove noise and adjust the image brightness.
Figure 17 shows the results of applying the pre-processing step to the input image. The experimental results demonstrate that the pre-processing step led to an improvement of approximately 1.4% in the face detection rate and a reduction of approximately 0.12 s in processing time.
3.2. Results of the Face Detection Step
To detect the driver’s face in the input image acquired from the IR camera, face detection is performed within the ROI. In this step, the YOLOX face detector was utilized. To train the YOLOX face detector, a series of abnormal gaze scenarios (e.g., smoking, drowsiness, yawning, and talking on the phone) that can occur during actual driving were simulated in a passenger vehicle. The IR camera was mounted on the vehicle dashboard and oriented toward the driver’s seat, ensuring that the driver’s face was centered within the camera’s field of view.
To create the YOLOX face detector, training images were collected in both controlled and actual road environments. The base network for the YOLOX detector is the Tiny-COCO network [
40], which was pre-trained on the Microsoft COCO (Common Objects in Context) dataset. The Tiny-COCO network is a lightweight version of the YOLO deep learning network, utilizing a smaller CSPDarknet-53 with fewer filters as the base network [
54]. This network enables efficient object detection while maintaining high performance by learning various object categories from the COCO dataset [
55,
56].
The training options for the YOLOX face detection model involved training the neural network using stochastic gradient descent (SGD) with a momentum of 0.9. The initial learning rate was set to 0.001, decreasing by a factor of 0.2 every five epochs. The maximum number of epochs was set to 30, with a mini-batch size of 64 observations per iteration. A mini-batch is a subset of the training set used to compute the gradient of the loss function and update the weights. During training, the model’s performance was evaluated using validation data. This was achieved by splitting 20% of the training data into a validation set and comparing the validation predictions with the validation target values using driver face labeling data.
Figure 18 shows the results of evaluating the trained YOLOX face detector on the experimental image set, using average precision as a metric. Average precision is a comprehensive metric that represents the detector’s ability to accurately classify the face region (precision) and its ability to detect faces without missing them (recall). The precision–recall (PR) curve visually represents the detector’s precision at various recall levels.
The proposed method labels the region including the mask as the face so that the face region can still be detected even if the driver is wearing a mask.
Figure 19 shows the results of face detection using the YOLOX face detector. The YOLOX face detector achieved an accuracy of approximately 97.1%. However, the experimental results indicated that in some images acquired from vehicles driving on the road, there were limitations in detecting faces when the driver was wearing a black mask and looking at the side mirror or sunroof, or when the face was obscured by other objects, such as during smoking or talking on the phone.
3.3. Results of Facial Feature Detection Step
To detect an elliptical face region in the face region detected by the YOLOX face detector, two thresholds were calculated using the two-level Otsu threshold method, as shown in
Figure 20. To reduce computation time, the thresholds (
Level 1 and
Level 2) were calculated without directly labeling the face region. Based on the brightness value
I(
xc,
yc) of the center point pixel of the face region, the connected components of all pixels within the range (
I −
Level 1) ≤
I ≤ (
I +
Level 1) were analyzed, and a morphology operation was applied to fill empty holes.
In this step, an elliptical region was detected based on the major and minor axes of the connected pixels passing through the center point of the face region, and the slope value of the face was derived from this. However, when the driver wore a black mask, while face detection was accurate, there were issues with false detection in the elliptical area. During the multi-step threshold pixel connection analysis, based on the central pixel brightness of the detected face region, background elements such as the head or glasses frame were sometimes incorrectly labeled as part of the face, leading to the detection of an incorrect ellipse. This resulted in the slope value of the ellipse being falsely detected, sometimes close to −90 degrees. However, when this false detection was considered alongside other feature information (such as the size of the region), it did not significantly affect the overall accuracy of determining whether the driver was looking forward.
The accuracy of the mask detection in the detected face region, was approximately 96%. However, when white masks were worn, the number of edge pixels detected by the Canny edge detector increased, sometimes leading to the incorrect conclusion that no mask was being worn. In other cases, errors in mask detection were infrequent. Additionally, the estimation results for undetected facial features are shown in
Figure 21. When the mask was worn, the nose and mouth regions were estimated, and even if one eye was not detected, its location could be estimated based on the ratio and size information of the ellipse in the detected face region. However, if the driver wore a mask and turned their head to one side, causing only one eye to be detected, errors occurred in estimating the location of other facial features. Therefore, to accurately estimate the facial features, at least two or more facial features needed to be detected to reliably estimate the locations of the remaining undetected features.
Figure 22 shows the result of extracting the distance vectors between each feature and the slope information of the triangle formed by connecting these features based on the facial feature detection results. In the experiment, the distance vectors of the lines connecting the detected face region and facial features were extracted. Specifically, the straight-line lengths connecting the vertices of the bounding box of the detected face to the center points of the bounding boxes of the detected and estimated left eye, right eye, nose, and mouth regions were extracted. The lengths of the lines connecting the four vertices of the detected face region to the center points of the four facial feature regions were extracted as 16 vectors. Additionally, the slope of the upper side connecting the left and right eyes, as well as the slopes of the sides connecting the mouth to the left eye and the mouth to the right eye, were extracted from the inverted triangle formed by connecting the three center points of the detected left eye, right eye, and mouth bounding boxes. Finally, the eccentricity of the ellipse was calculated from the elliptical face region. This process was used as feature information to more accurately analyze the shape of the face.
3.4. Results of Gaze Classification Step
In the proposed method, a feature vector was trained using the detected face region and facial features to classify whether the driver’s gaze was normal or abnormal while driving. Abnormal gaze was defined as any behavior such as yawning, drowsiness, talking on the phone, smoking, or looking at the side mirror or behind the driver’s seat while driving. The CNN model was trained to classify whether the driver’s gaze was a normal gaze by labeling the training data based on simulated driving scenarios in a controlled environment.
In an actual road driving environment, behaviors such as drowsiness or talking on the phone can result in traffic violations. Training data were generated in a stationary vehicle to simulate these scenarios. The drowsiness scenario included various behaviors such as yawning, drowsiness, talking on the phone, smoking, and looking away from the road. The proposed method focused on training the model for two cases: normal gaze and abnormal gaze. Experimental results showed that the proposed method successfully detected faces in nearly all input images, as detailed in
Table 2. A detection was considered successful only when the overlap between the labeled face region and the detected face region exceeded 60%. Although face regions were detected in all cases, some inaccuracies were observed in the detected face regions due to factors such as smoking, phone use, or food consumption.
The accuracy of normal gaze classification, based on the detected face regions, was approximately 98.7% for Scenario 1, around 97.5% for Scenario 2, and about 95.7% for Scenario 3. The majority of errors occurred when normal gaze was mistakenly identified as abnormal. This misclassification typically happened when the eye region was difficult to discern due to the use of a black mask or sunglasses, or when a mask combined with diffuse reflection from glasses caused by the IR sensor led to errors.
3.5. Results of Comparion with Proposed Method
The experiments were not conducted with typical footage of a driver, but rather with footage where the driver was not focused on the driving task. Specifically, the experiments involved scenarios where the driver was smoking, drinking, wearing a mask, wearing sunglasses, or talking on the phone while driving. For comparison, MTCNN-based gaze monitoring and CNN-based gaze tracking methods were considered. The MTCNN-based gaze monitoring method utilizes a deep neural network model for real-time face landmark extraction and gaze tracking. The CNN-based gaze tracking method uses CNNs to extract facial and eye features and track the gaze direction.
The experimental results were categorized into normal and abnormal gaze behavior. Abnormal gaze behavior was defined as when the driver was engaged in non-driving activities such as smoking, talking on the phone, or drinking. Additionally, experiments were conducted with drivers wearing sunglasses, glasses, or masks. In normal driving scenarios, the proposed method accurately detected the eyes, nose, mouth, and facial regions. However, when the driver was engaged in non-driving tasks such as smoking, drinking, or talking on the phone, or when wearing masks or sunglasses, the proposed method outperformed both the MTCNN-based and CNN-based methods in detecting whether the driver was gazing forward. The MTCNN-based method showed a decrease in accuracy in low-light environments and when the driver’s face was partially occluded, such as when wearing masks or glasses. Similarly, the CNN-based method showed reduced accuracy when parts of the face were obscured, and it required high-performance hardware for real-time processing.
Table 3 shows the results of a comparison between the proposed method and the other gaze monitoring techniques.
4. Discussion
For the safe operation of Level 3 and above autonomous vehicles, it is crucial that the driver is prepared to intervene in emergency situations that may arise during driving. Although the complete realization of autonomous driving is still facing challenges, the likelihood of achieving it will increase in the near future due to advancements in autonomous driving technology and improvements in road infrastructure safety technologies. Currently, Level 3 autonomous vehicles are becoming more widespread, requiring the driver to remain attentive and ready to intervene in the driving task. Level 3 autonomous driving functions are generally applicable in scenarios where the vehicle is traveling on flat roads at a constant speed, such as on highways. However, the autonomous driving system may encounter limitations in unexpected situations, such as road obstructions, vehicular collisions, or urban roadways. Therefore, it is essential to ensure that the driver is monitoring the road ahead during autonomous driving and to prompt the driver to take control when necessary.
This study proposes a method for determining whether a driver is looking forward using an IR camera. To classify whether a driver is looking forward in real time while driving, facial features are first detected, and then the positional relationships between them are analyzed. If certain conditions are met, the driver is classified as looking forward normally. The proposed method involves detecting the driver’s face, identifying facial features, and analyzing the statistical correlations between these features to determine whether the driver is looking forward. The method utilizes an IR camera, considering the challenges posed by low-light conditions inside a vehicle and image quality degradation due to vehicle movement. IR images offer the advantage of providing relatively clear facial images even in low-light settings; however, they also present challenges related to low brightness and noise. To address these issues, the proposed method includes steps for ROI selection, size reduction, noise removal, and brightness adjustment during pre-processing. Furthermore, even when the driver is wearing glasses, sunglasses, a mask, or other facial coverings, the positions of facial features are estimated, and their correlations are analyzed. Specifically, after determining whether the driver is wearing a mask, the nose and mouth regions are estimated based on the positions of the two eye regions, thereby improving the accuracy of determining whether the driver is looking forward normally.
In the proposed method, a bounding box containing the driver’s face is detected within the ROI using the YOLOX face detector from the input image. Subsequently, face ellipse region detection is performed within the detected face region. The face ellipse region is defined as a region that optimally surrounds and connects pixels with similar brightness values. The size of the ellipse within the face region, as well as its major and minor axes, are calculated to extract the slope and eccentricity of the ellipse. As a result of this process, the location, distance, and slope information between each detected region—including the face region, ellipse region, and facial features such as the eyes, nose, and mouth—are obtained. Finally, the proposed method extracts feature information from input images using a deep learning method, incorporates the position, distance, and slope information of the detected facial features, and uses a CNN classifier to determine whether the driver’s gaze is normal.
The proposed method demonstrated an accuracy of approximately 97.3% in both controlled experimental environments and actual road driving conditions. Some misclassifications occurred when the driver was wearing sunglasses and a black mask. Nevertheless, by applying the proposed method to autonomous vehicles, unnecessary forward-looking guidance warnings can be minimized, and it will be possible to support safe driving by prompting the driver to pay attention to the road ahead, thereby preventing potential traffic accidents.
In addition to the technical contributions, several ethical and practical considerations must be acknowledged for real-world deployment. Since the proposed system relies on in-cabin infrared (IR) cameras, it raises potential privacy concerns related to continuous video monitoring of drivers. To address this, future implementations should incorporate privacy-preserving mechanisms, such as on-device processing without data transmission, and ensure compliance with data protection regulations and informed consent protocols.
Furthermore, the practical integration of the proposed system into commercial vehicles may face challenges due to variability in vehicle interior layouts, dashboard structures, and camera mounting positions across different car models. These factors can influence detection accuracy and system performance. Therefore, adaptive calibration techniques and flexible hardware configurations should be considered to enhance generalizability and usability in diverse vehicle environments.
By incorporating these ethical and deployment perspectives, this research aligns more closely with broader societal and industry needs, supporting the safe and responsible application of gaze monitoring systems in autonomous driving scenarios.


