1. Introduction
The history of district heating as we know it today began in the mid-19th century in the United States, where the supply of homes with an extensive heat delivery system began with just one house and quickly grew to the scale of major American cities. In Europe, district heating systems began to appear as early as the late 19th century in Germany, Denmark and France [
1]. In Warsaw (Poland), the first building heated by a district heating system was built in 1841, and at the same time, district heating systems along the lines of the district heating network were developing in many Polish cities—Łódź, Poznań, Wrocław, Szczecin, Kraków. During the reconstruction of Warsaw after World War II, the concept of combining local heating plants into a single network was created by Witold Szuman. Heat plants were first built locally, then on the scale of districts, for example, the Wola Heat Plant or the Kawęczyn Heat Plant; then, the focus was on integrating large production units, including the Powiśle Heat and Power Plant (decommissioned in the 1990s), the Żerań Heat and Power Plant and the Siekierki Heat and Power Plant. In 1952, a decision was made at the state level to build an integrated district heating network for the entire city, leading to the first section of the municipal district heating network in Warsaw’s Downtown being put into operation as early as 1953. Most of the work had to be carried out manually due to the considerable land development in the Downtown district. Currently, the municipal district heating network continues to develop in terms of modernization and the construction of new connections. At present, Warsaw’s district heating network, which is more than 1800 km long, is the most extensive district heating system in the entire European Union and the fourth largest in the world [
2].
The urban district heating network system is characterized by a complex structure that includes many interconnected entities [
3]. In a case study, it is important to approach the problem in the context of the entire urban agglomeration as opposed to individual investments. The relationships between individual investments can be used in the preparation of subsequent new investments. The BIM (Building Information Modeling) model, which characterizes the completeness of information about a building object, can be used as a basis for the implementation of a new investment [
4]. The implementation of BIM into the management structure of heating infrastructure is a path that requires considerable cooperation of participants of not only the investment project, but also public entities. It is important to create solutions at the level of managers of energy units together with the city authorities to create models of three-dimensional spaces. In this case, it is important to consider the development of the city’s structure and the state of the technical infrastructure [
5]. On the other hand, the introduction of measures that integrate the entire process can allow for the sustainable development of entire urban district heating networks that affect the structure of the city.
A smart city is a city that combines technology and communication to improve the quality of life of residents, protect the environment, reduce heat loss and save energy [
6]. A municipal heat network modeled with BIM technology can become the first step in realizing the above, as there is a constant need for urban development in the context of remote monitoring of the integrity of space [
7]. Unfortunately, due to insufficient awareness of the benefits that can be obtained from using BIM models, which are rich in graphical and non-graphical information, the idea is still at an early stage of development. Also, public entities are still not adequately using the BIM methodology, leading to the creation of physical versions of documentation and further copies by investors [
8]. On the other hand, in the context of district heating network design, the aspect of introducing new solutions that have the potential to marginalize problems that may occur throughout the process is particularly important. Land development consists of many elements including, but not limited to, water mains, sewers and power or fiber optic networks located in the ground, with which there may be a potential collision. There is therefore a critical need to implement BIM in the design, implementation and operation of district heating networks. Geographic Information System (GIS) data can be helpful in achieving this goal. GIS spatial databases are used in environmental studies and for sustainable development purposes [
9]. The integration of GIS and BIM at the level of management units should provide opportunities for strategic planning and management of urban space [
10]. Digital documentation would allow work to be carried out easily, not only during the implementation of the project but also when obtaining information from archival records in case of failure, network reconstruction, connection construction or decommissioning. In conditions that can be potentially dangerous, digital documentation can be risky to implement. In Poland, on the other hand, ad hoc solutions are being used in the form of implementing a digital construction log or browser-based applications to view technical documentation. However, it is important to introduce new digital solutions that can be a start for the idea of a virtual city [
11]. An integrated 3D model of underground assets linked to city-wide cadastral data can improve the understanding and interpretation of underground legal and physical aspects [
12]. There is a lack of research to date on the modeling of transmission infrastructure, especially district heating networks, and the subsequent management of information about these facilities. There is some research, but it concerns, for example, the operation and maintenance phase [
13]. Hence, an attempt was made to model a piece of urban space in a BIM environment and perform a collision analysis. The purpose of this article is to show the benefits of using such an integrated approach that includes modeling not only buildings or infrastructure, but also underground networks.
3. Case Study
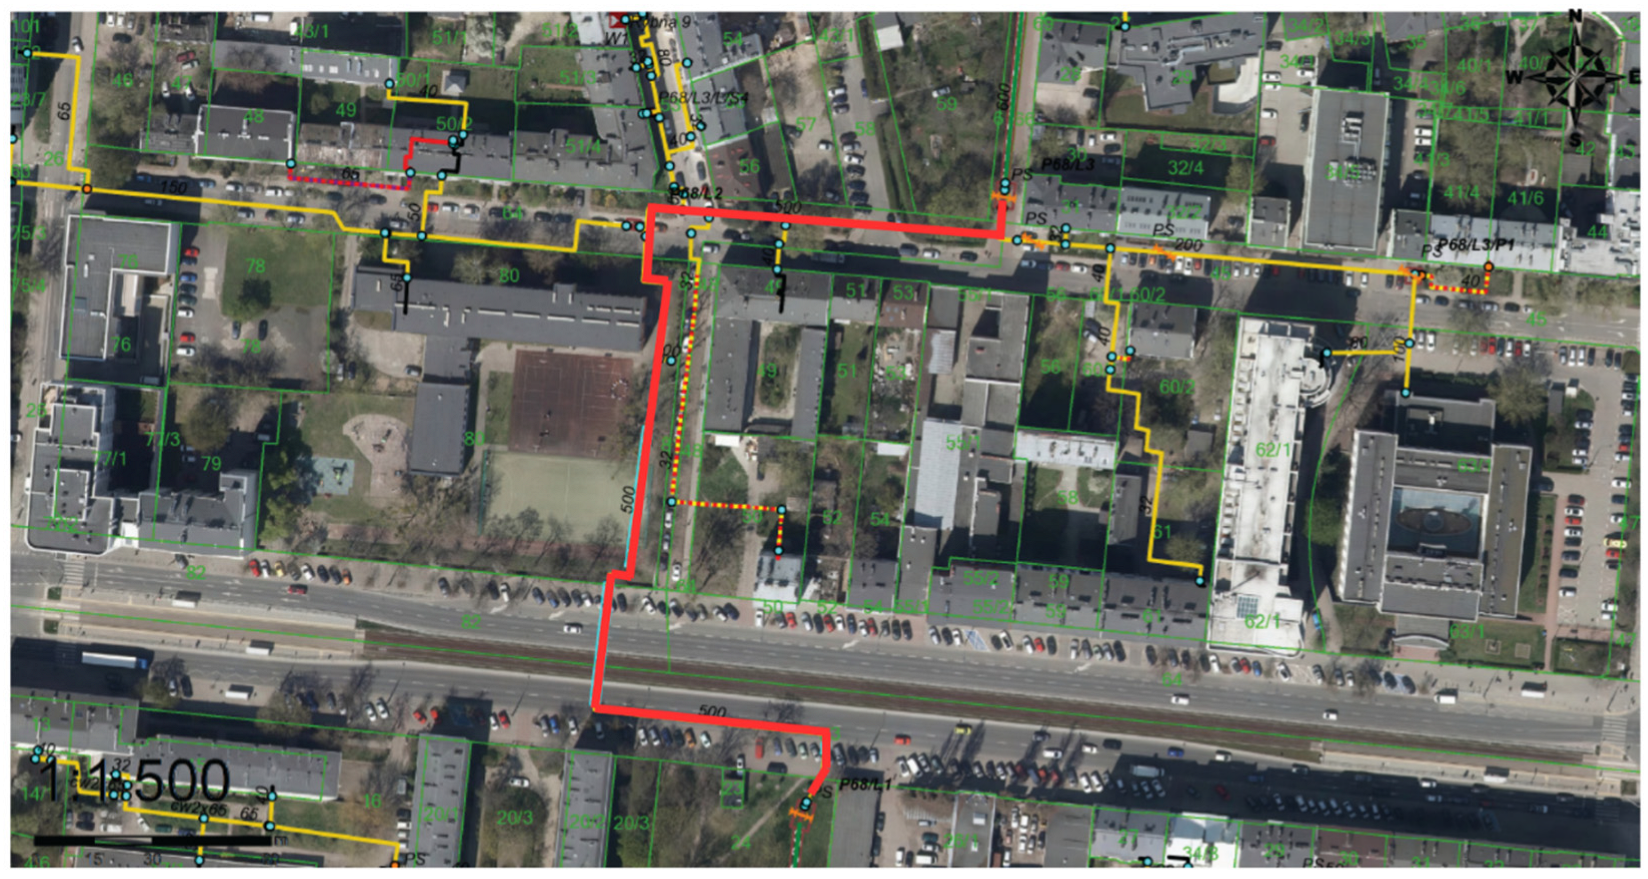
The subject of the built integrated BIM model is a linear investment concerning the reconstruction of a district heating network from chamber P-68/L-1 to chamber P-68/L-3 at the intersection of Grochowska and Kamionkowska Streets in Warsaw, Poland (
Figure 3). The area subject to analysis is in the northern part of the Praga Południe district in the Kamionek MSI unit in the eastern part of Warsaw (latitude and longitude coordinates are 52.237049, 21.017532) near the Vistula River (Poland, temperate climate). The choice of the above investment is supported, among other things, by the collision with the sewerage system under Grochowska Street. Giving a third dimension to the projected network helped to illustrate the collision, which later in the study required the creation of a replacement design. To this end, two variants of the district heating main were prepared, considering the version with the collision and after the designer made changes, resolving the problem of collision. The reconstruction of the district heating mainly required cutting down trees and introducing new greenery plantings. It was also routed through diverse urban spaces such as roadways, school grounds, greenery and sidewalks. In the immediate vicinity, due to the historic nature of the site, there are historic buildings and infrastructure. Each of these elements makes up a complex investment that requires a multi-faceted approach. A model of the district heating network considering spatial development will provide a clear picture of the investment.
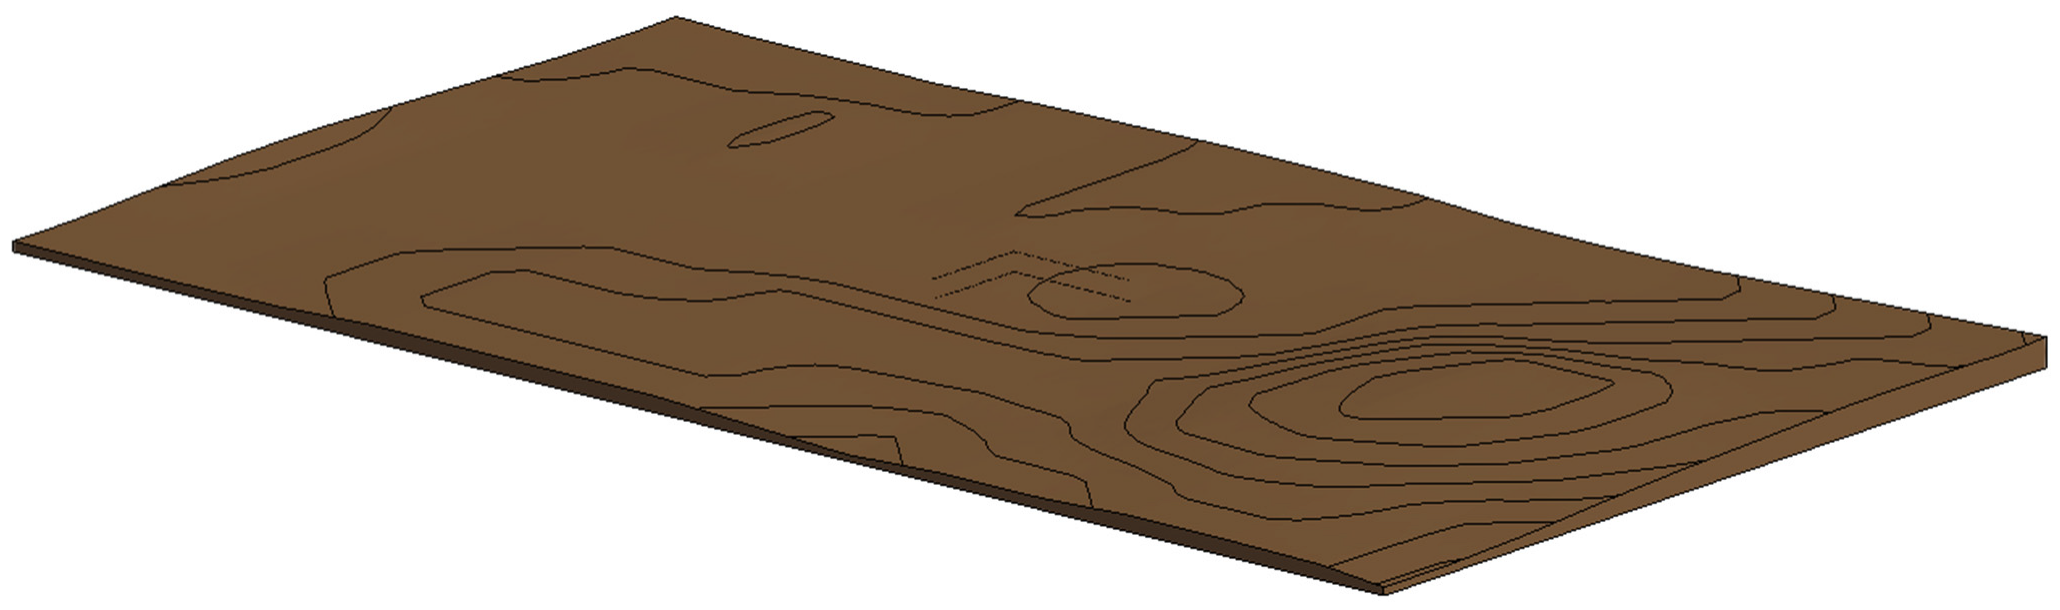
Surface elevation is an important element when creating a land use model. Determining the ordinates of the land allows for defining the depth of the network in the ground. In the first stage of this work, the general shaping of the surface was realized using SketchUp 2024 software. The location of the area was determined and marked in the software. The boundaries of the study were defined, as well as individual strategic locations, e.g., the office of the district of Praga Południe and an elementary school. The result of the work was a flat fragment of space obtained using the Google Earth service, which was then enriched with height ordinates. The detailed terrain model was then imported into Revit 2024.1 software (
Figure 4). The surface relief in the process of creating the model for the linear investment required its detailing in terms of the area directly above the network. Using the profile of the district heating network, information on the elevation ordinates of the terrain was obtained, and the depth of the main line relative to the ground surface was determined.
Land cover data, including the locations of sidewalks, lawns and the street in the case of the neighborhood with the district heating network, were obtained from technical documentation. The remaining objects were modeled based on the large-scale spatial database BDOT500 [
17] and updated with current aerial photographs and observations from a site visit. The materials of the individual components were also determined based on current photographic documentation and orthophotos. Publicly available materials from the Enscape materials library and the Poly Haven website [
18] were used for this purpose. The Procreate application [
19] was utilized in editing the materials to allow for visual approximation to reality.
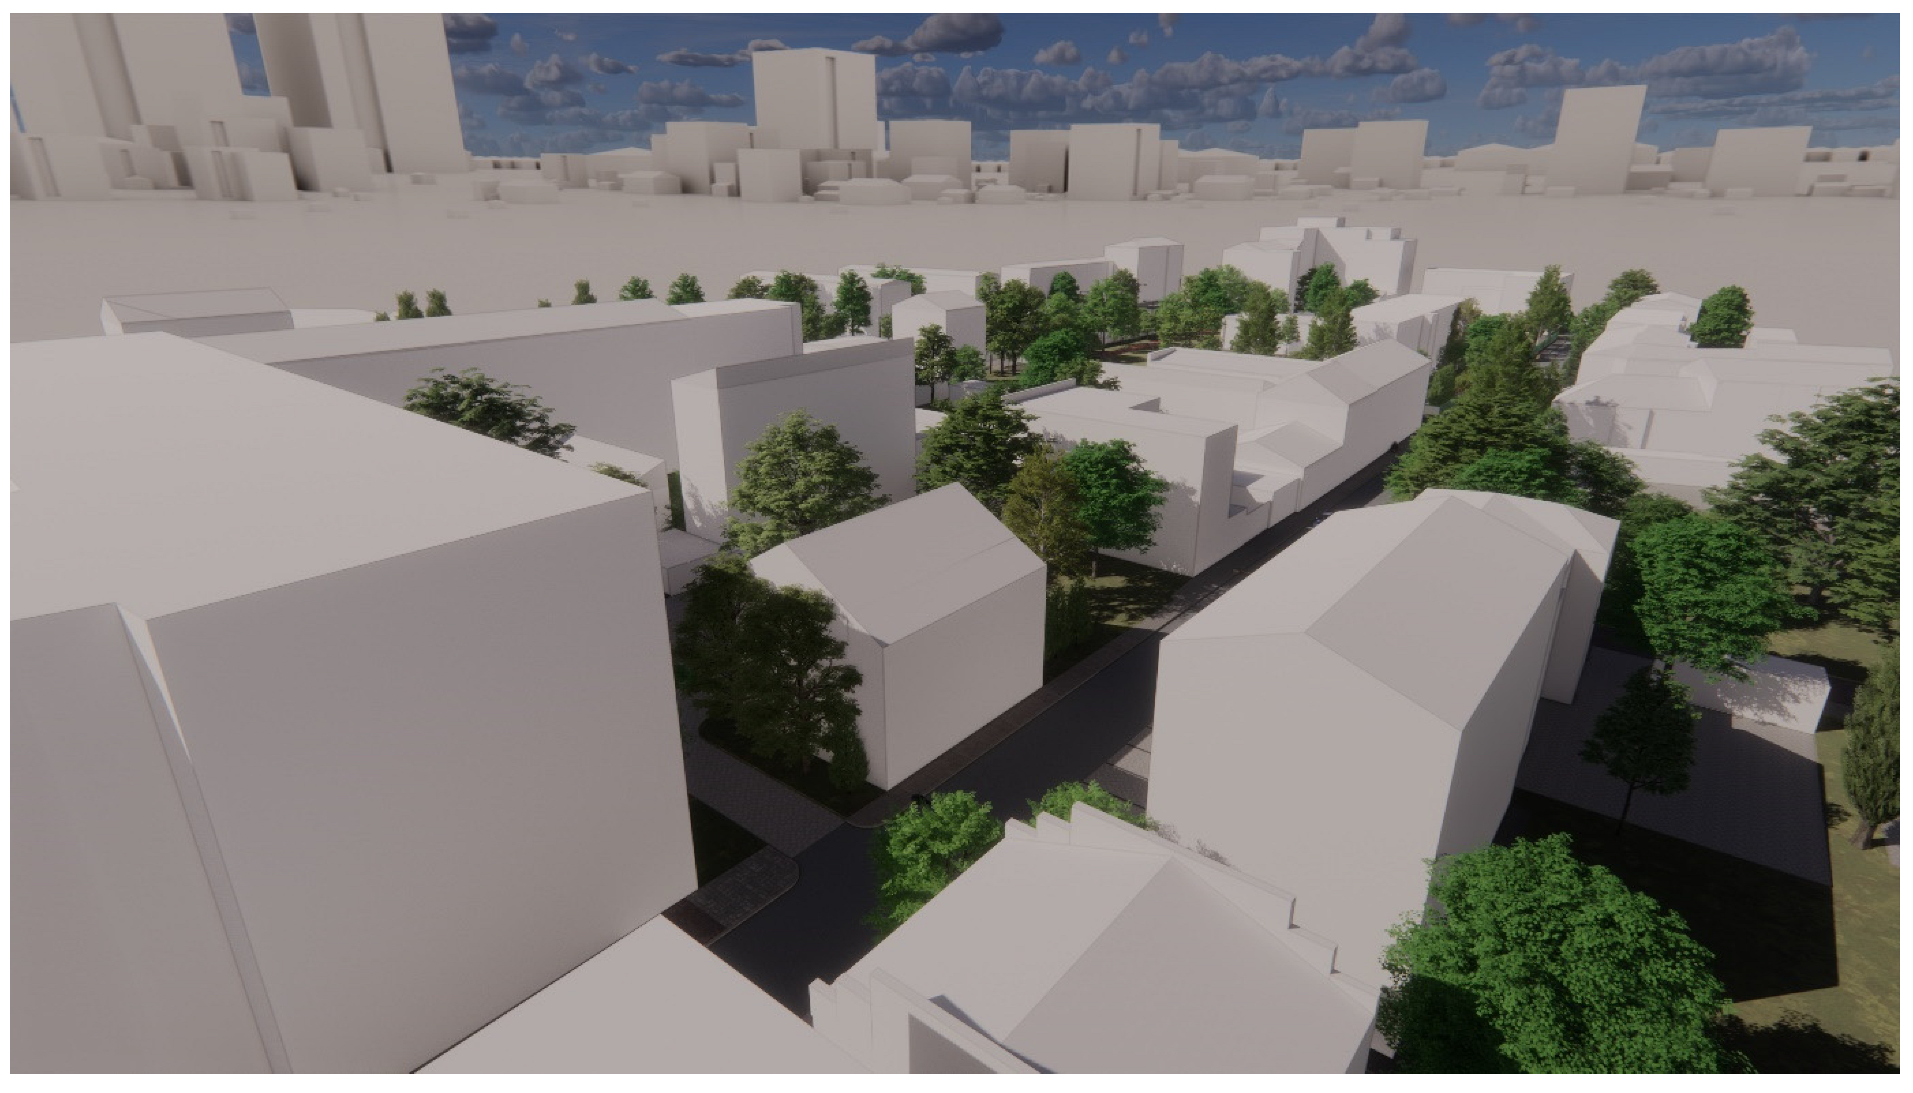
The presence of buildings in the model being created plays a critical role. Information on the solidity of the object, limited to its height and shape, defines sensitive points important in the entire process of creating a model, especially a model composed of numerous elements that depend on each other. The model being created, which demonstrates the essence of integrated design, includes its essential component, which is the built-up area (
Figure 5). The urban environment is highly complex [
20], so even the smallest buildings or street furniture must be considered to avoid collisions or unplanned construction work.
The next step using the obtained data on the boundaries of the development was to determine its height. The point cloud, which is made up of data placed in three-dimensional space, allows the depiction of the development model in BIM. Acquisition of the point cloud is also possible using the National Geoportal website. However, the number and sheer density of data-enriched points in this case are insignificant. The creation of an accurate model of development is possible with a highly detailed point cloud. The developed model based on a limited number of points in space also carries value in the development process. The point cloud determines the exact height of the building, thus allowing the creation of a model with a level of detail limited to the body of the building itself. Data provided by terrestrial laser scanning will always be more accurate than publicly available point cloud databases (
Figure 6). To use the point cloud in Revit, it was required to convert it. The tool that was first used to modify the point cloud was ArcGIS Pro software. With the plug-in used, called Data Interoperability, the LAZ file extension was changed to LAS to make the file modifiable in the program. In the properties tab, the other elements defining land cover were unchecked. The result of the changes was a point cloud in LAS dataset format composed of data on the development itself. Again, using the Data Interoperability plug-in, the point cloud extension was changed to LAS format. Another software product used to broadcast the changes to the file was ReCap Pro. After reading the file in the application and analyzing the point cloud for accuracy, it was exported to a file with the RCP extension. After completing the various steps, the point cloud allowed it to be imported into the final software, which was Revit.
A model of the buildings was created in Revit software along with the use of a point cloud containing building height data. Using the Local Model tool, the shape of the buildings was created in LoD1 (level of detail) in the CityGML standard [
21]. Roofs were then modeled using data extracted from the point cloud (
Figure 7).
Tall greenery in the study area in the part that is near the district heating network was inventoried in the technical documentation. The site development project includes data on greenery, considering a site visit to verify their validity. Based on the technical documentation, it was possible to determine the locations of trees and shrubs and verify them with the actual state. Establishment of the above criteria made it possible to implement greenery into the model in the immediate vicinity of the designed network (
Figure 8).
Other sources were used for the rest of the study area. Tree species were obtained from the Map Service website of the city of Warsaw. In turn, using BDOT500, the exact locations of deciduous and coniferous trees were obtained. The timeliness of the acquired data was also verified through a site visit. The occurrence of natural monuments that would need to be inventoried was also checked. There are no such objects in the area under development. Intermediate greenery was obtained from technical documentation, local inspection and BDOT500. The counterparts of the inventoried greenery were components obtained from the object library of the Enscape plug-in. Maintaining information on tree species, their twin models were placed. The heights of the trees and the spans of their crowns were obtained from the prepared point cloud, which in this case was not limited to the development itself.
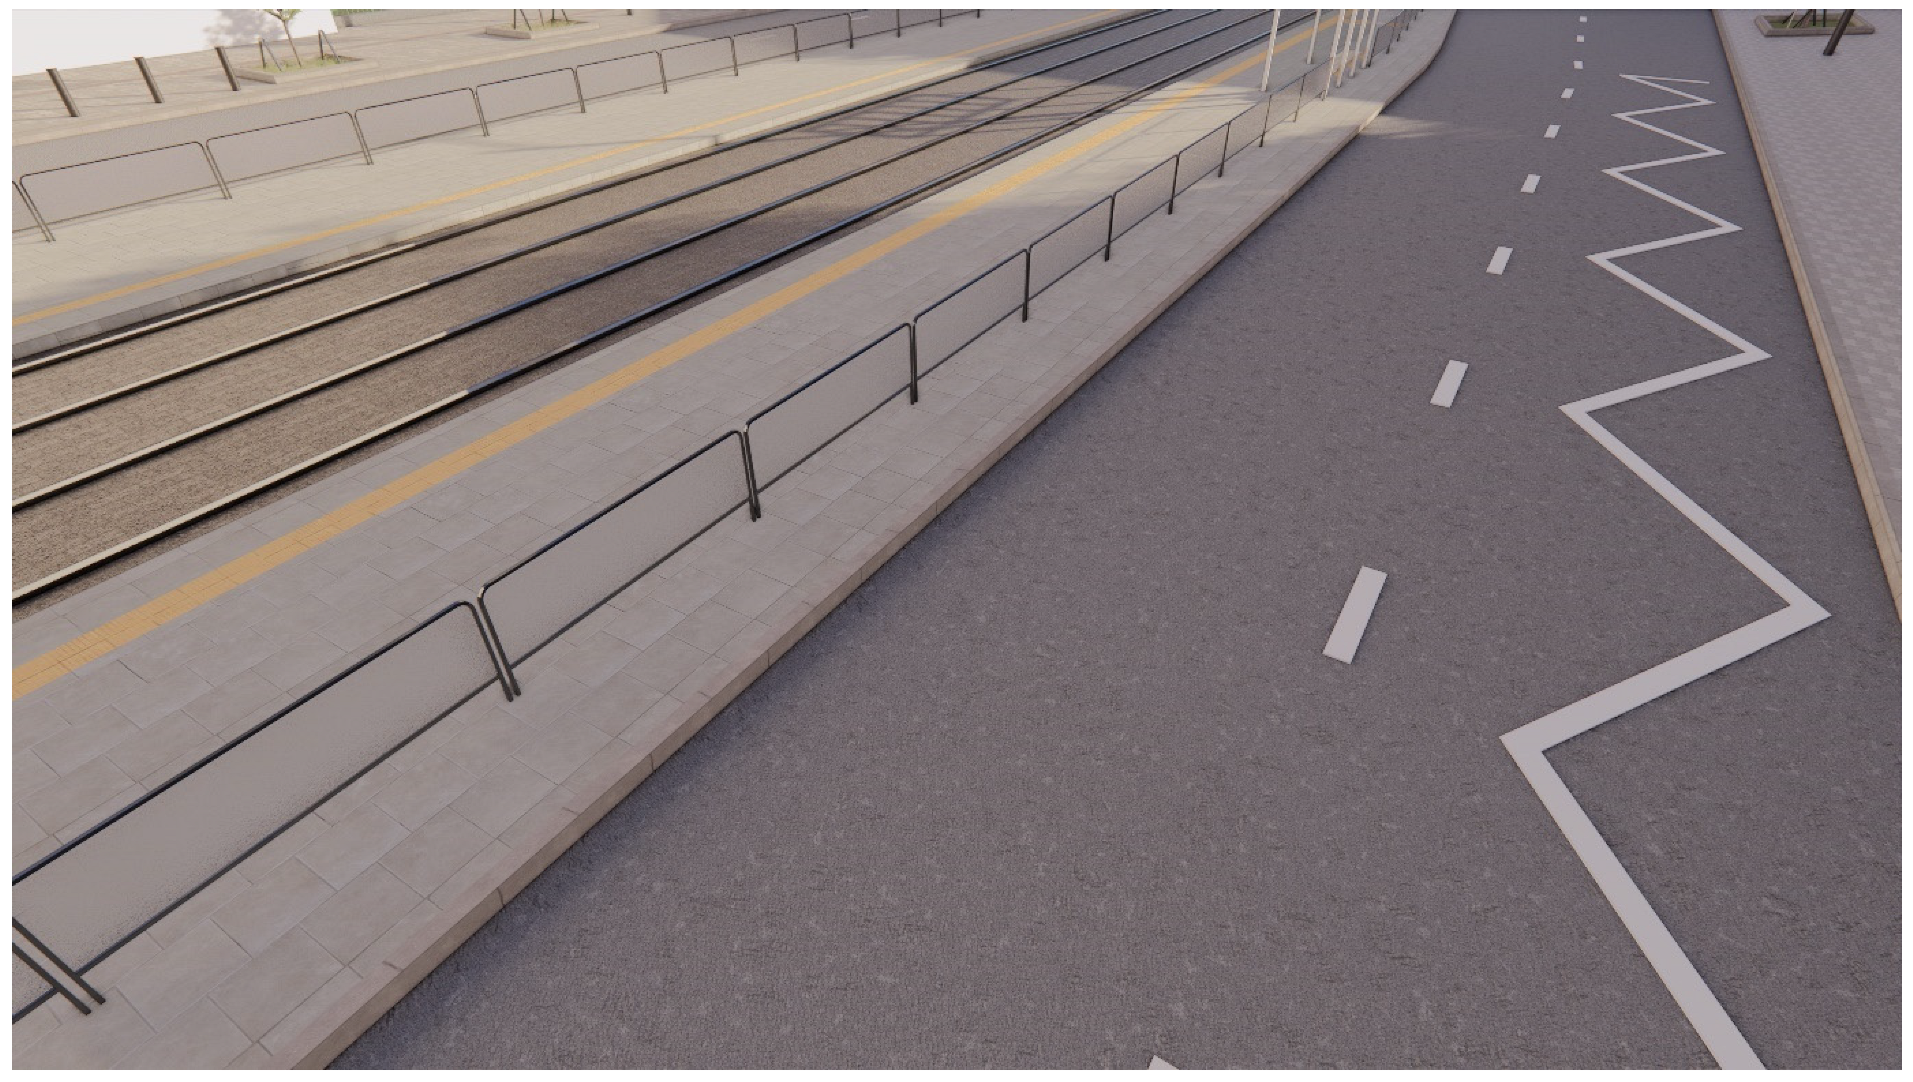
Small architectural objects that are tied to the ground play an important role during model development. Using the BIMobject library [
22], individual component models were obtained that fully reflect or closely resemble reality (
Figure 9). Through the plug-in used to perform Enscape model visualizations, important components were also obtained. To maintain a faithful representation of the real state of the area, the finished models were modified in terms of colors, materials or their shape and structure. In the case of objects not available as public models, it was necessary to create them in the Revit graphic component editor. This mainly concerned street furniture (e.g., railings) and technical infrastructure (e.g., streetlamps).
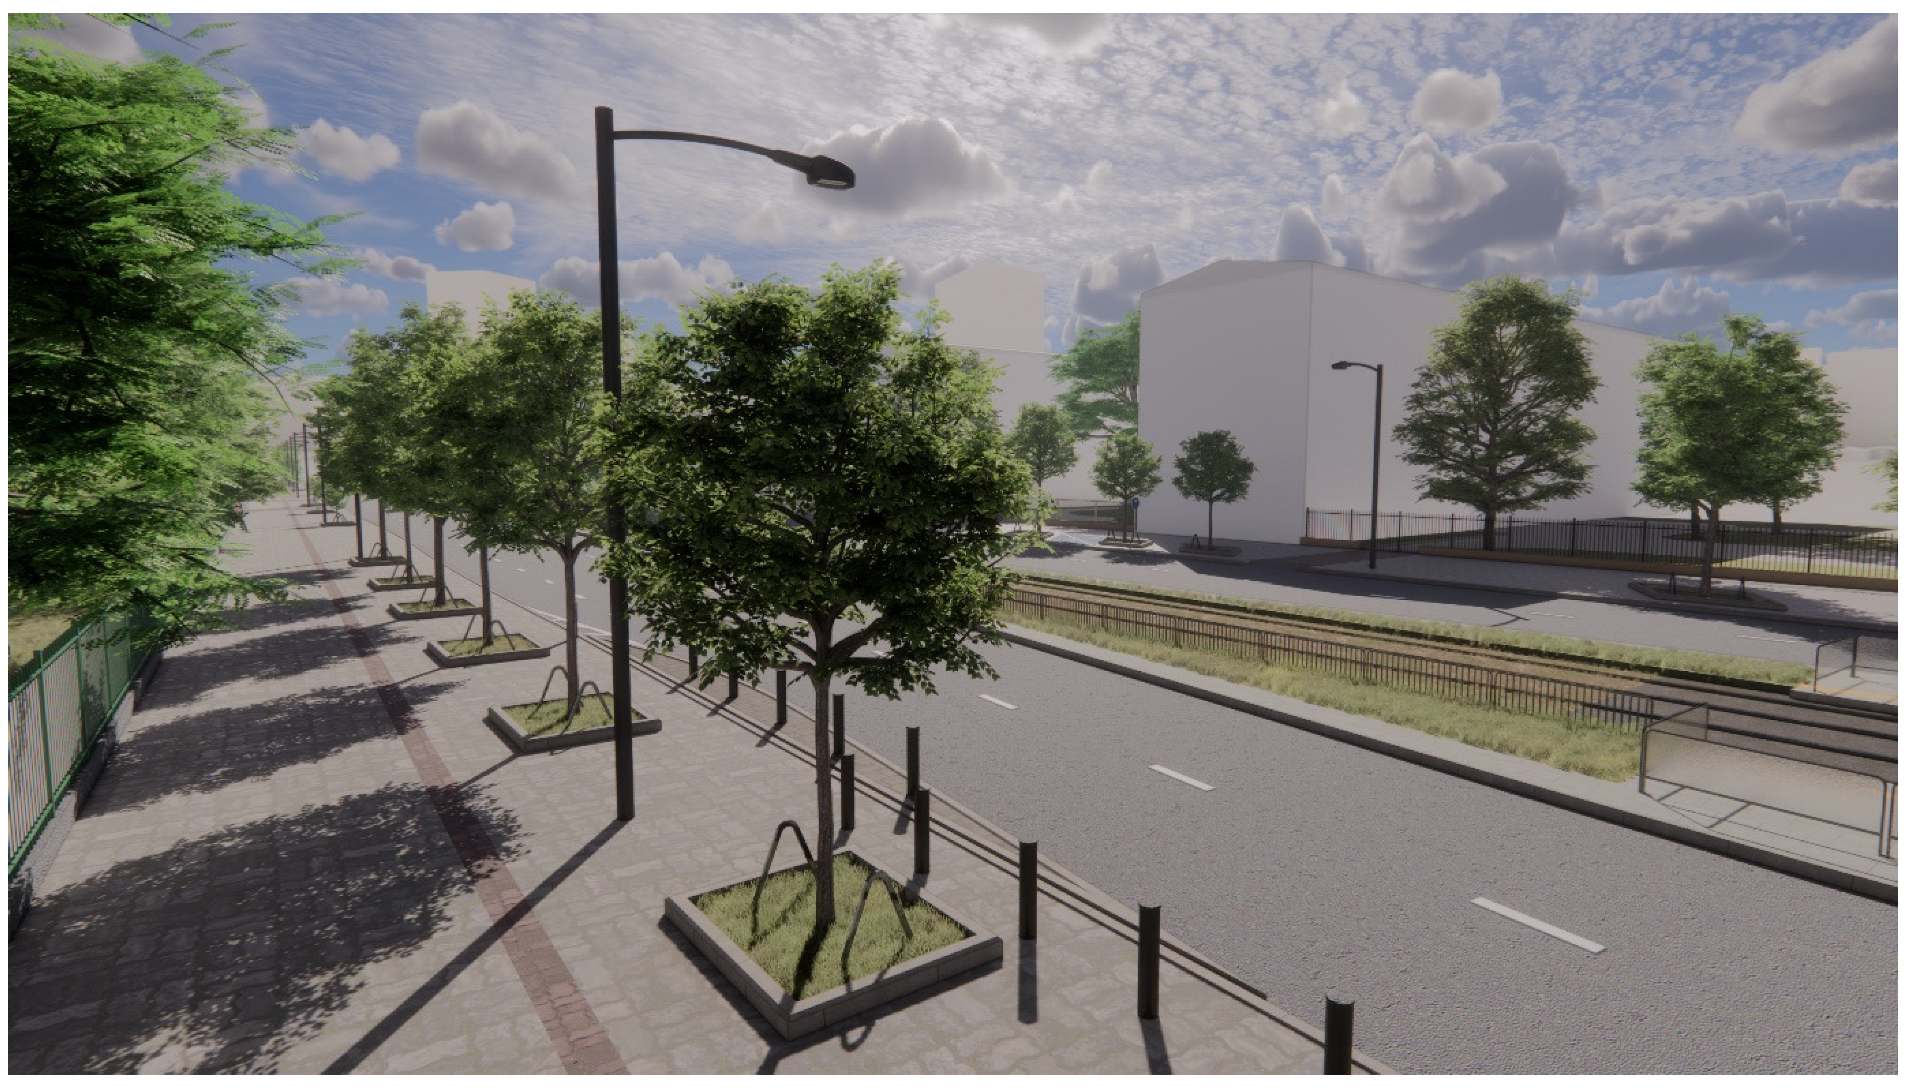
In the final stage of enriching the model with components, non-ground objects that play a visual role were included. To represent an urban space characterized by a high intensity of pedestrian and vehicular traffic, the model was supplemented with models of people and cars (
Figure 10).
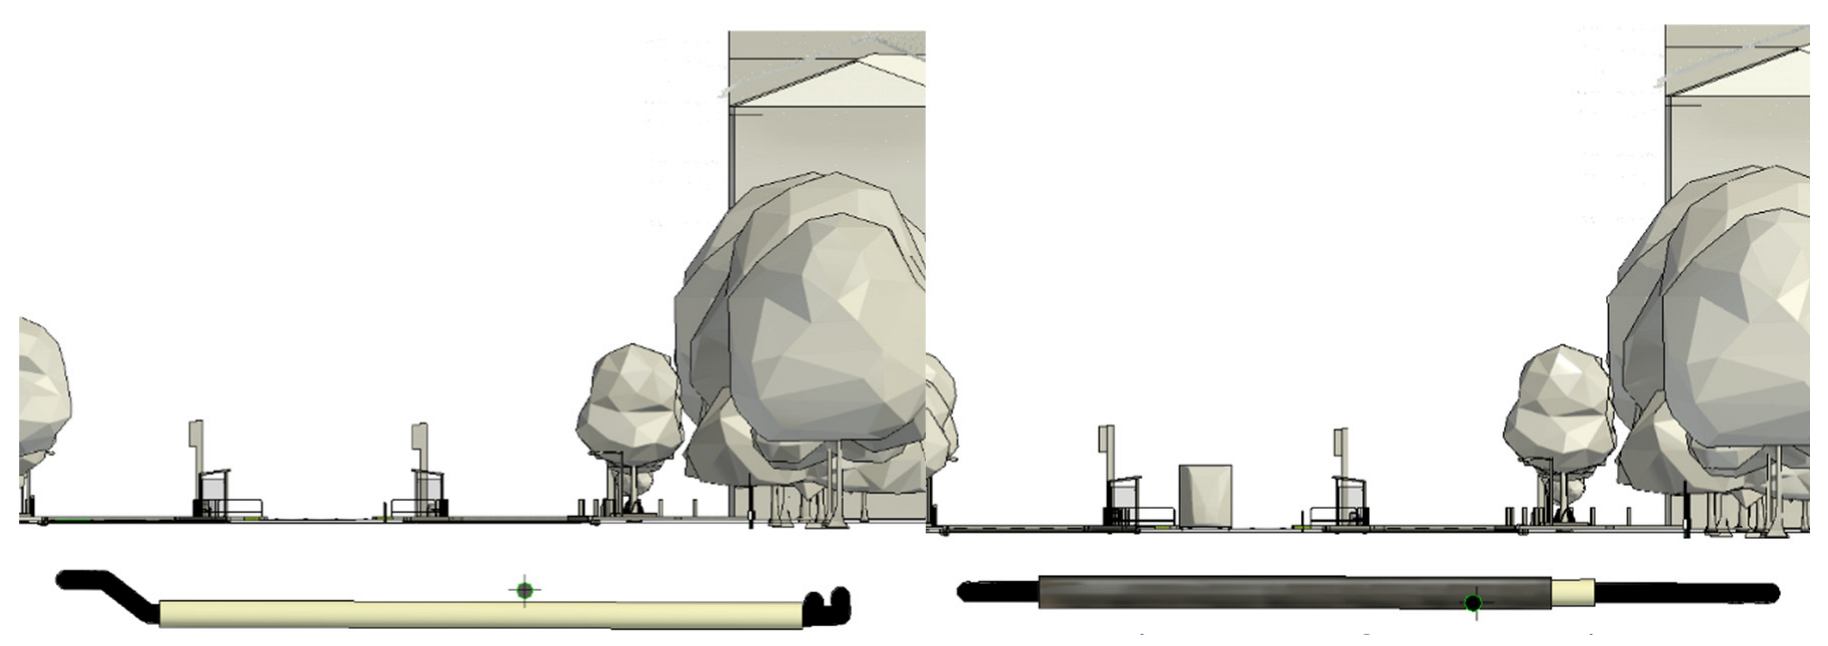
The linear investment involving the reconstruction of the district heating network was depicted in the created model because of its technical documentation. The direct location of the main in the ground was possible based on the as-built inventory. It provided information on the location of the district heating network and the land cover directly above it. The profile of the district heating network was used to determine the depth of the network in the ground and its exact location.
The model of the district heating network was made with the Pipe tool (in Revit), which allowed for changing the diameter and materials. The properties specified the system type as Hot Water. Using the Insulation tool, casing pipes and jacking pipes located under Grochowska Street, among others, were made. When creating an integrated model, areas of potential collision with infrastructure can be identified at an early stage. Tall greenery that was identified for cutting in the technical documentation was also imported into the model. The sewerage network, which lay on the route of the planned network, was also modeled.
Giving a third dimension to the project allowed the implicit transfer of information, which is particularly relevant in the vicinity of the district heating network itself. On the other hand, the defined area of the study is much larger because of the possible potential for model development in many aspects. One of these is the development of the district heating network itself, which could be supplemented with fixtures or connections to surrounding buildings. This would represent potential in terms of future network analysis for failure, management or decommissioning of the mains. The life cycle of the developed district heating network could be monitored based on a BIM model [
23]. Also, it is possible to develop the project with the remaining utilities of the area by forming a complete infrastructure. In this case, integration of multiple units is required, which should be defined by law.
In the case of the linear project under development, there was a collision with the sewer system, which shows how important it is to have verified information on the inventoried utilities. The installation scheme also specified the diameter of the network, casing and jacking pipes. The replacement design specified a change in the route of the district heating network in terms of Grochowska Street (
Figure 11). Two variants of the model were made to perform a comparative analysis of the route of the main. Producing the replacement design based on the BIM model of the district heating network makes it possible to find the optimal solution to bypass the collision. Having an integrated model through various components such as land cover and utilities creates an opportunity to protect the investment schedule. Modeling district heating networks involves many challenges, such as the calculation time and complexity [
24]. Since district heating networks account for the largest share of investments in municipal heating, modeling them in 3D can bring many benefits.
4. Collision Analysis
An integrated BIM model provides the ability to perform analyses on it, such as collisions [
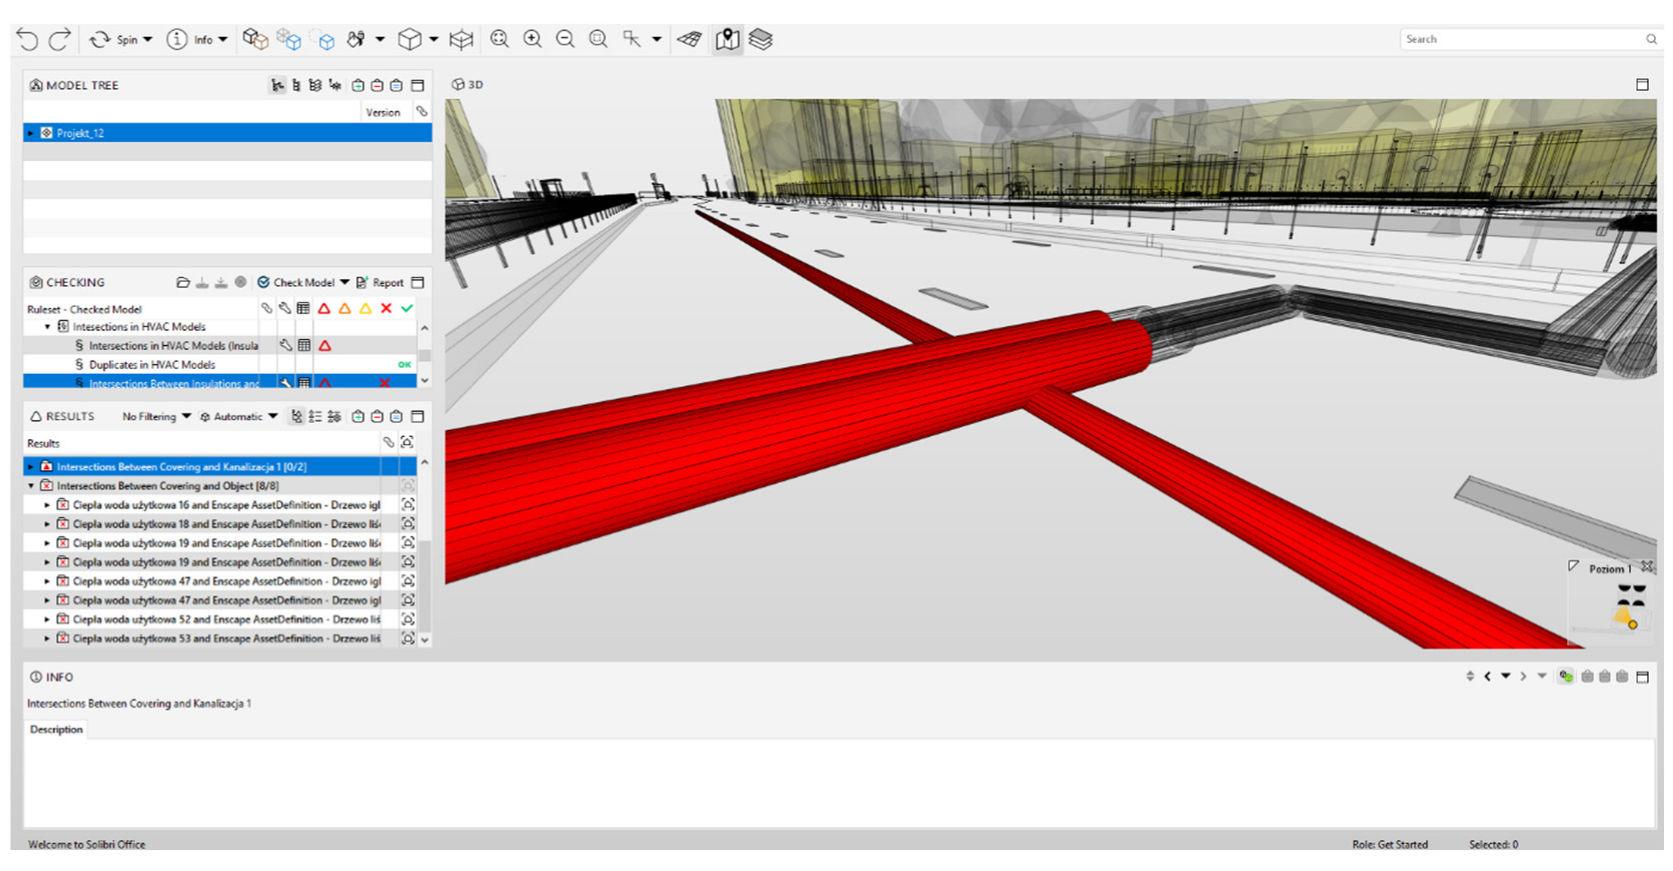
25]. Usually, geometric collisions are the easiest to identify, but it is also possible to search for standard or functional collisions. A correctly built BIM model containing integrated data allows the automatic identification of potential anomalies. Using Solibri Model Checker, analyses were performed on the created BIM model. The first of these was the collision of the district heating network with the sewer system routed under Grochowska Street.
Figure 12 on the left shows the program’s messages regarding the elements that are in collision between the district heating network and the sewer system. The elements highlighted, on the other hand, show the exact sections of the intersecting networks. In the version of the model before the replacement project, this was automatically detected by the program and marked as an anomaly. If full land development in the form of, for example, water supply, telecommunications and electricity networks were to be included in the development of technical documentation prepared traditionally, the analysis and detection of collisions would be much more difficult. A model containing full infrastructure data will automatically detect any geometric anomalies, thus introducing time savings and making it possible to solve them or minimize their occurrence.
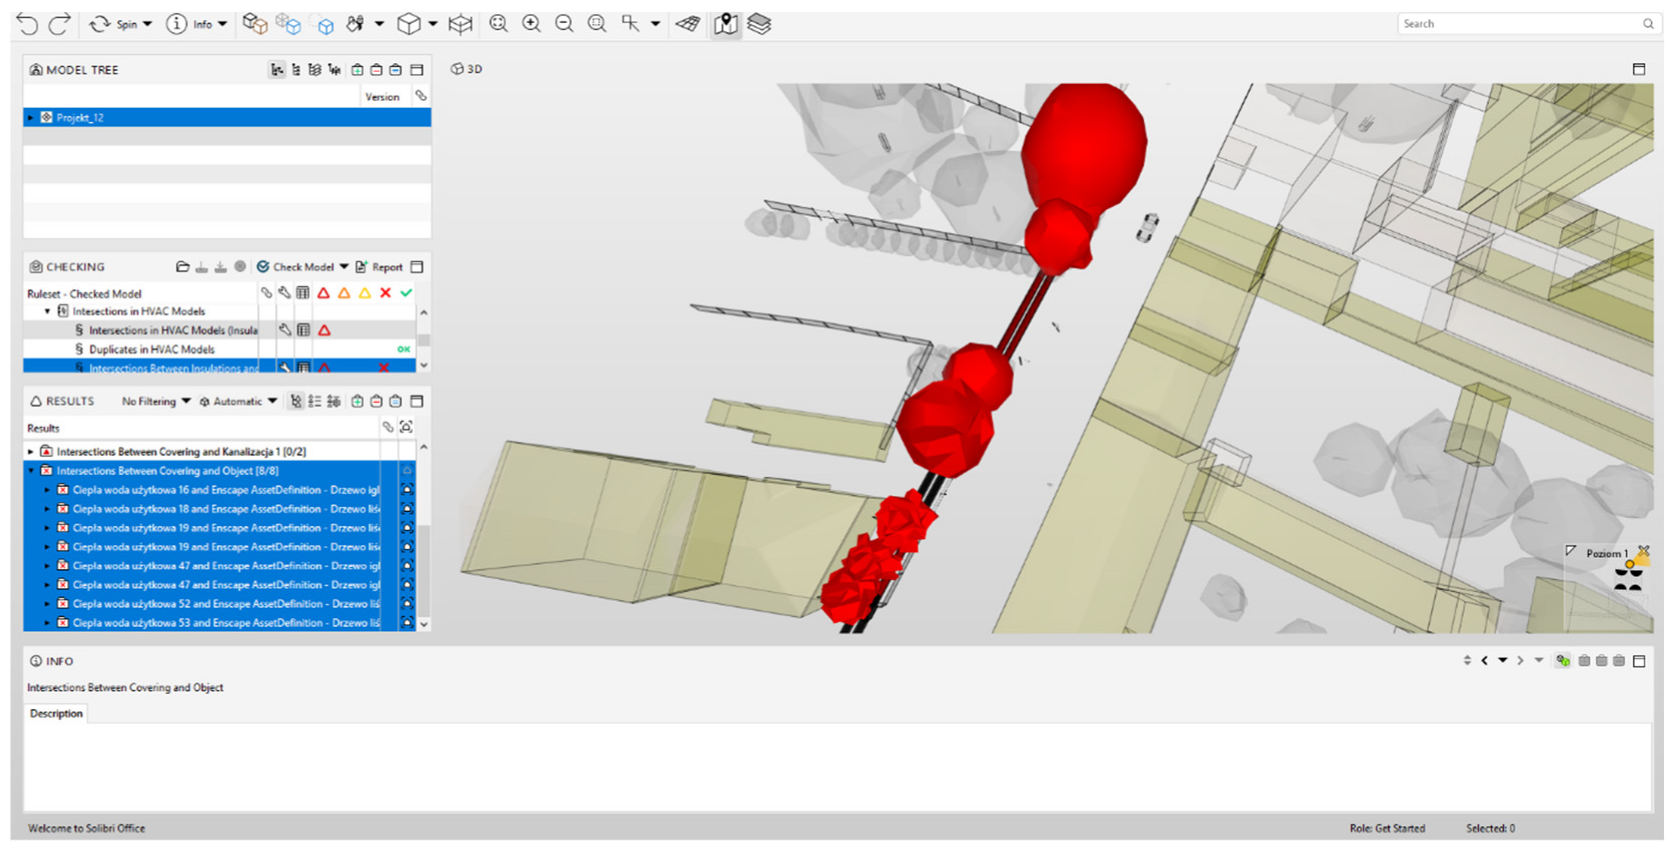
The developed BIM model, which also includes components on the ground surface, allows for expanding the analysis area. The Solibri Model Checker 9.13.8 software was able to detect a collision with tall greenery, which was also identified as greenery to be removed according to the tree and shrub inventory found in the technical documentation. A detailed analysis showed that the tree roots could adversely affect the functioning of the heating network and its potential maintenance or replacement. Noticeable in
Figure 13 on the left are the displayed inconsistencies regarding the interference of the tree model with the heat network model. On the other hand, sections of the district heating network and tall greenery that form a collision with each other have been marked in red on the right (
Figure 13).
The analysis carried out allowed the verification of the proposed linear investment. The introduction of solutions that allow analysis at the design stage and construction management is important for the entire development of the city. The BIM model can be supplemented with data on other elements of the model that relate to time, safety or cost [
26]. Such an integrated BIM model (
Figure 14), enriched with non-graphical information, makes it possible to increase the level of safety of the investment and the existing urban infrastructure. The aspect of the environment of the planned investment is of extraordinary importance, as is noticeable from the analyses. Starting with the safety of the investment itself, the existing tall greenery in the event of a collision can cause changes in the schedule. Also, elements permanently attached to the ground that would be overlooked in such an analysis could lead to losses and out-of-pocket costs. Throughout the life cycle of a district heating network, it is possible to minimize or prevent such situations.
To achieve the goals of the circular economy, it is necessary to achieve the idea of a digital twin. Without semantically correct BIM models, it is hard to imagine achieving this concept [
27]. Therefore, it is necessary to build BIM models that are geometrically rich (at the required LoD), appropriately saturated with information (at a certain LoI—level of information) and linked by relationships. There is also room for integration with other technologies, such as the Internet of Things (IoT) or artificial intelligence (AI). Experience to date shows that the correct mapping of objects to classes and the setting of a reasonable LoD are crucial for interoperability in the investment process. Hence, BIM education is extremely important, both in terms of operating BIM applications and knowledge of the BIM process [
28].
For several years now, BIM has been increasingly used in the design and construction phases of building projects. However, there is little data on the implementation and subsequent verification of BIM in the longest phase of a building’s life cycle: the operational phase [
29]. BIM models should therefore store past, present and future states to become digital twins.


