Article

Coupling Coordination Analysis of the Marine Low-Carbon Economy and Carbon Emission Reduction from the Perspective of China’s Dual Carbon Goals

1
Key Laboratory of Coastal Science and Integrated Management, First Institute of Oceanography, Ministry of Natural Resources of the People’s Republic of China, Qingdao 266061, China
2
Institute of Marine Development of Ocean University of China, Qingdao 266100, China
3
Qingdao Urban Planning & Design Research Institute, Qingdao 266000, China
4
School of Public Administration and Policy, Renmin University of China, Beijing 100872, China
*
Author to whom correspondence should be addressed.
Sustainability 2025, 17(9), 4100; https://doi.org/10.3390/su17094100
Submission received: 28 February 2025 / Revised: 20 April 2025 / Accepted: 28 April 2025 / Published: 1 May 2025

Abstract

:
Against the backdrop of global warming, the marine low-carbon economy has emerged as a crucial pathway to achieving carbon peaking and carbon neutrality goals. This paper develops an evaluation index system for the marine low-carbon economy and carbon emission reduction. Using data from China’s coastal provinces (2012–2021), the study employs methods such as the entropy weight method, the coupled coordination model, K-means++ clustering, and grey correlation analysis to analyze the interaction between the marine low-carbon economy and carbon emission reduction. The study revealed the following findings: (1) From 2012 to 2022, the development of the marine low-carbon economy exhibited an “N”-shaped pattern, while the trend of carbon emission reduction generally followed the opposite pattern due to a “lag” effect. (2) The coordination between the two systems improved gradually, reaching an intermediate level from 2018 to 2021. (3) Among the internal factors related to the interaction between the marine low-carbon economy and carbon emission reduction, fossil energy consumption and wetland areas are the primary sensitivity factors. (4) External factor analysis through the use of grey correlation analysis revealed that the structure of the marine industry and technological innovation are the main drivers of the interaction, while carbon market trading showed the lowest correlation out of all the external factors, indicating that the mechanism design needs further improvement. (5) Compared with other coastal countries, China still has much room for progress in regard to the construction of MPAs and the restoration of blue carbon ecosystems. This paper introduces a method to quantify the development level of the marine low-carbon economy and assess the effects of marine carbon emission reduction, analyzing the coupling coordination between China’s marine low-carbon economy and carbon emission reduction. This research provides a foundation for Chinese policymakers and offers insights into green and sustainable development of the global marine economy.

1. Introduction

In the context of global climate warming, energy conservation and emission reduction have become urgent challenges for the international community. China has committed to achieving its ‘dual carbon’ goals (carbon peaking by 2030 and carbon neutrality by 2060) to align with the Paris Agreement. This requires not only reducing the carbon intensity of energy consumption, but also offsetting industrial emissions through ecosystem carbon sequestration. The ocean, as the largest active carbon sink on Earth, hosts blue carbon ecosystems that can sequester carbon at a rate more than ten times that of terrestrial ecosystems, annually [1]. Additionally, marine renewable energy sources, such as tidal currents, waves, and the thermohaline gradient in the ocean, are key factors in achieving sustainability and zero-carbon emissions in terms of future energy systems [2]. In this context, the marine low-carbon economy facilitates carbon reduction through technological innovation, industrial transformation, and new energy development, and serves as a key strategy to achieve the “dual carbon” goals.
China is the world’s largest carbon emitter, and its ‘dual carbon’ goals aim to achieve carbon peaking by 2030 and carbon neutrality by 2060. According to the International Energy Agency (IEA), China’s carbon dioxide emissions in 2023 totaled 12.6 billion tons, making up 35% of the global total. In terms of carbon source control, coal consumption in China accounted for 55.3% of the total energy consumed by the end of 2023 [3]. Coal remains China’s primary energy source, and the industrial sector is the largest consumer of coal, which is facing substantial pressure in regard to its structural transformation and the low-carbon energy transition. In this context, the marine low-carbon economy offers a pathway for carbon reduction. According to the “2024 China Ocean Economic Statistical Bulletin”, China’s total marine GDP in 2024 reached CNY 10.5438 trillion, marking a 5.9% year-on-year increase, outpacing national GDP growth by 0.9%, indicating the thriving state of China’s marine economy [4]. The low-carbon transformation of the marine economy has been relatively successful, with the tertiary sector accounting for 59.6% of total low-carbon energy and low-carbon industries (including offshore wind power and ecological tourism) making up about 51%. By the end of 2024, China’s cumulative offshore wind power capacity exceeded 39 GW, ranking first globally, while demonstration projects for tidal and wave energy continue to advance.
In recent years, there has been extensive discussion within the international academic community on the relationship between the marine economy and carbon reduction. Studies have shown that the blue economy and blue factors significantly impact long-term carbon reduction [5], involving pathways such as technological innovation, the low-carbon transformation of marine industries, and renewable energy development. For example, Jeong-On Eom et al. (2023) used digital twin technology to optimize port operations, with the potential to achieve a reduction in carbon emissions of over 75%, highlighting the importance of technological innovation in the marine industry for carbon reduction [6]. Rida Waheed (2022) found that during the post-“Vision 2030” period in Saudi Arabia, “blue factors”, such as marine fisheries, maritime trade, and sustainable marine tourism, can reduce carbon emissions, indicating the crucial role of low-carbon transformation of the marine industry [7]. Klaudia Ligęza et al. (2023) and Khan et al. (2022) pointed out that offshore wind power [8] and marine energy [2] can contribute to achieving decarbonization goals. Therefore, scholars are also actively exploring how to establish a sustainable blue economy. For instance, Wuwung et al. (2024) argue that Indonesia needs to formulate and implement effective marine governance policies [9], while Ronnie Noonan-Birch et al. (2024) focus on how the United Nations Sustainable Development Goals (SDGs) can guide Canada’s marine industry toward a “blue economy” that prioritizes environmental sustainability, which involved developing a framework for assessing blue economy capabilities [10].
Recent domestic research in China has focused on local development paths for the low-carbon development of the marine economy. Scholars generally agree that the transformation of marine industries [11,12,13], technological innovation [12,14], marine energy development [12], and blue carbon ecosystem restoration [1,12] are crucial measures to support the “dual carbon” goals. In terms of industrial transformation, Li Na et al. (2024) proposed promoting the low-carbon transformation of marine industries through policy support and technological innovation [13]. Huang Jinyang (2019) found a significant positive correlation between upgrading marine industry structures and the development of a low-carbon economy, noting that industrial restructuring should account for regional resource endowment differences [11]. Zhao Meng et al. (2022) called for strengthening the leading role of technological innovation in emission reduction [14]. Zhou Shouwei (2022) argued that achieving the “dual carbon” goals requires coordinating the development of marine energy, the marine economy, and marine ecological protection [12]. Yang Yufeng (2021) pointed out that large-scale seaweed cultivation is an effective way to increase ocean carbon sinks [1].
Scholarly research indicates a positive feedback loop between the marine low-carbon economy and carbon emission reduction, as many countries pursue green transformations to meet climate targets. Driven by the ‘dual carbon’ goals, China has implemented strategies to transition its marine economy toward low-carbon models, yielding measurable emission reductions. However, no quantitative analysis has been conducted on the development level of this low-carbon transition or its specific effects on carbon emissions. Additionally, research on the temporal evolution of the coupling and coordination between the two is lacking. Therefore, this paper develops an indicator evaluation system for the marine low-carbon economy and carbon emission reduction, providing a comprehensive assessment of both. This paper includes the application of methods such as the entropy weight method and the coupling coordination model (CCD model) to carry out an in-depth analysis of the relationship between the marine low-carbon economy and carbon emission reduction from 2012 to 2022.
This paper approaches the issue of carbon emission reduction from the perspective of the marine low-carbon economy and, in line with the essential requirements of the “dual carbon” goals, explores the coupling coordination between the marine low-carbon economy and carbon reduction. This paper introduces innovations from both technological and marine sector perspectives. From a technological standpoint, the two indicator evaluation systems developed in this paper provide a method to quantify the development level of the marine low-carbon economy and its effects on carbon reduction. From a marine sector perspective, the CCD model is applied to analyze the coordination between China’s low-carbon marine economy and carbon reduction. This study offers valuable insights for policymakers, aiding in the design and implementation of policies to facilitate the low-carbon transformation of the marine economy. It also provides a reference for green and sustainable development of the global marine economy.

2. Coupling and Coordination Mechanism of the Ocean Low-Carbon Economy and Carbon Emission Reduction

A coupling and coordination mechanism exists between the marine low-carbon economy and carbon reduction. On one hand, the marine low-carbon economy helps to reduce carbon emissions, while, on the other hand, carbon reduction fosters the development of the marine low-carbon economy. The specific logical relationship is outlined in Figure 1.

2.1. The Marine Low-Carbon Economy Can Help Reduce Carbon Emissions

Guided by the concept of sustainable development, the marine low-carbon economy involves the development and utilization of marine resources through technological and institutional innovation, industrial transformation, and new energy development. The goal is to minimize the consumption of coal, oil, and other high-carbon energy resources, reduce greenhouse gas emissions, and promote a resource-efficient, environmentally friendly marine economic model [15]. Therefore, the development of the marine low-carbon economy can help reduce carbon emissions. The relevant influence mechanism is outlined as follows.
The marine low-carbon economy promotes the adoption of low-carbon technologies in the marine industry. For instance, improving marine resource utilization efficiency, reducing emissions during production processes, and developing carbon capture and sequestration technologies can significantly reduce carbon emissions in the marine industry.
The development of the marine low-carbon economy requires government action through the use of policy incentives and the improvement of relevant laws, regulations, and management systems, which strengthens carbon emission reduction efforts.
The development of a low-carbon marine economy includes green industrial transformations, such as adopting green shipping practices in regard to maritime transportation. The use of new energy vessels, such as electric and hydrogen-powered ships, along with green fuels, reduces carbon emissions from maritime transportation.
A key component of this economy is the development and utilization of marine renewable energy sources, such as wind, tidal, and wave energy, which can significantly reduce the sector’s dependence on fossil fuels and reduce carbon emissions.
An important aspect of the low-carbon marine economy also includes the protection and sustainable utilization of marine carbon sinks. Marine carbon sinks, such as seagrass beds, mangroves, and salt marsh wetlands, can absorb and store large amounts of carbon dioxide, and the protection and restoration of these sinks is an effective means of reducing emissions.

2.2. Carbon Emission Reduction Can Promote the Development of the Ocean Low-Carbon Economy

Carbon emission reduction is a key requirement for achieving the “dual carbon” goals. It is not only a central objective of the marine low-carbon economy, but also drives and ensures its development.
Achieving the marine carbon emission reduction target requires collaborative research, development, and the application of low-carbon technologies, alongside breakthroughs in green technologies and industrial innovation. For instance, advancements in carbon capture and storage (CCS) and marine renewable energy technologies (such as wind and wave energy) have driven the development of related industries and facilitated the formation of a marine low-carbon economy.
These carbon emission reduction measures have encouraged governments and businesses to focus more on the sustainable use of marine resources. Faced with carbon reduction pressures, businesses emphasize green development, adopt resource recycling, green production, and other sustainable practices, which foster the growth of low-carbon economic models.
Carbon markets and trading mechanisms further drive the development of the marine low-carbon economy by incentivizing emission reduction efforts. For example, emission reduction projects in the marine sector can generate economic returns through carbon credit trading, incentivizing more businesses and projects that invest in marine low-carbon technologies and green industries, creating a positive cycle.
Moreover, carbon emission reduction initiatives are typically coupled with ecological protection policies, such as those that aim to safeguard marine carbon sinks and restore blue carbon ecosystems. These measures not only enhance carbon emission reduction, but also improve the health and functionality of marine ecosystems, supporting the sustainable development of the marine low-carbon economy.

2.3. Links with the Dual Carbon Goals

Achieving the “dual carbon” goals involves multidimensional pathways, including energy structure transition, industrial upgrading, technological innovation, and ecosystem carbon sink enhancement. The coordinated development of the marine low-carbon economy and carbon emission reduction involves the practical implementation of these pathways in the marine sector. For example, large-scale offshore wind power development can replace fossil fuel consumption in coastal regions, directly reducing carbon emissions in the energy sector. The growth of tertiary industries, such as marine biomedicine and eco-tourism, reduces the proportion of energy-intensive marine industries, promoting low-carbon industrial restructuring. Meanwhile, conserving and restoring blue carbon ecosystems enhances carbon sequestration, offsetting residual industrial emissions. Additionally, innovations in marine low-carbon technologies amplify the emission reduction potential of technological advancements. The marine low-carbon economy integrates synergistically with traditional carbon emission reduction measures, forming a critical component of the broader ‘dual carbon’ framework. As a result, the coordinated development of the marine low-carbon economy and carbon reduction is a critical pathway for achieving the “dual carbon” goals.
However, unlocking the potential of the marine low-carbon economy requires synergistic policy–market mechanisms. On the one hand, governments can establish legislative frameworks, such as the Marine Protected Area Law, and ecological compensation mechanisms, like blue carbon trading pilot programs, to steer resource allocation toward low-carbon sectors. On the other hand, markets should employ carbon pricing and green financial instruments, including blue carbon bonds and green credit, to incentivize corporate participation in marine ecological restoration and technological innovation. This “policy–market” dual-wheel drive model can effectively address the conflict between marine resource development and ecological protection, promote the low-carbon transformation of the marine economy, and provide essential marine solutions for achieving the “dual carbon” goals.

3. Research Design

This study explores the coupling and coordination relationship between the “marine low-carbon economy” and “carbon reduction” using the following research design. The paper constructs two indicator evaluation systems and applies the entropy weight method to assess each one, comprehensively. The CCD model is then used to analyze the degree of coordination between the two systems. An ARIMAX model is employed for cross-validation to validate the reliability of the results. Additionally, grey relational analysis is used to assess the correlation between external factors and the degree of coupling coordination.

3.1. Model Construction

The entropy weight method assigns weights to each indicator based on data variability, providing objective evaluation values for the CCD model. The CCD model evaluates the interactions and coordination between two or more systems. Combining these two methods enables the objective analysis of the coordination relationship between the different systems.
(1)
Determination of Weights and Comprehensive Evaluation Index Measurement
The entropy weight method [16] is an objective weighting approach that determines index weights, based on the variation degree of each evaluation indicator, through the use of an entropy calculation. Entropy measures the degree of disorder of an indicator: the smaller the entropy value, the greater the data variation, and the more information it contains, justifying a higher weight. Conversely, a larger entropy value indicates greater data convergence, leading to the allocation of a lower weight. Based on data variability, the entropy weight method avoids subjective weighting bias, providing strong scientific validity and reliability. It can be used to provide objective evaluation values for a CCD model. The utilization of this method for this research relies on objective data sourced from the China Marine Economic Statistical Yearbook, with only a few data points requiring completion, ensuring a high level of reliability and applicability. Therefore, this study uses the entropy weight method to assign weights to the indicators in both the marine low-carbon economy and carbon emission reduction systems. To process dimensionless data, min–max normalization is applied to eliminate dimensional inconsistencies, followed by entropy weight calculations. The specific steps are outlined as follows:
Step 1: Data standardization:
s i j = ( 1 a ) + a x i j x i j m i n x i j m a x x i j m i n   ( P o s i t i v e   i n d i c a t o r s )
s i j = ( 1 a ) + a ( x i j m a x x i j ) ( x i j m a x x i j m i n )     ( N e g a t i v e   i n d i c a t o r s )
where s i j is the value obtained after standardization, x i j is the original value of the ith indicator in year j, x i j m a x is the maximum value in the sequence of the ith indicator, and x i j m i n is the minimum value in the sequence of the ith indicator. At the same time, a is deemed to be 0.95 to avoid a situation wherein the data cannot be processed. All the standardized metrics were positive, and positive perturbations were uniformly applied to the standardized metrics in subsequent sensitivity analyses.
Step 2: Determine the weight of each indicator, which is calculated using the formula:
p i j = s i j j = 1 n   s i j
r i = 1 l n ( n ) j = 1 n   p i j l n p i j
w i = 1 r i i = 1 m   ( 1 r i )
where n is the number of years, m is the number of indicators, p i j is the percentage of the ith indicator in the jth year, r i denotes the information entropy, r i denotes the coefficient of variation, and w i denotes the weighting coefficient.
Step 3: On this basis, the comprehensive evaluation index of the two systems is measured, and the formula is as follows:
Z 1 = t = 1 m 1   Q i U i j
Z 2 = t = 1 m 2   R i V i j
where Z 1 and Z 2 are the comprehensive evaluation indexes of the marine low-carbon economic system and carbon emission reduction system, respectively; m 1 and m 2 are the number of indicators in the marine low-carbon economic system and carbon emission reduction system, respectively; Q i and R i are the weights of the indicators in the marine low-carbon economic system and carbon emission reduction system, respectively; U i j and V i j are the standardized values of the ith indicator for the jth year in the marine low-carbon economic system and carbon emission reduction system, respectively; and U i j and V i j are the standardized values of the ith indicator for the jth year in the marine low-carbon economic system and carbon emission reduction system, respectively. U i j and V i j are the standardized values of the ith indicator in year j in the marine low-carbon economic system and carbon emission reduction system, respectively.
(2)
Coupling Coordination Model
The CCD model is an analytical method used to assess the interaction and coordinated development between two or more systems. It is commonly employed in fields such as environmental science and management science to evaluate the coordination and interdependence between different systems or subsystems [17]. Therefore, this paper uses the coupled coordination model to study the coordinated relationship between marine low-carbon economy development and carbon emission reduction. The specific formulas are as follows:
C = 2 Z 1 × Z 2 / Z 1 + Z 2
T = α Z 1 + β Z 2
D = C × T
Among them, C is the coupling degree of the marine low-carbon economy development level and carbon emission reduction effect; a larger value indicates that the level of marine low-carbon economy development and the carbon emission reduction effect of the correlation between the two systems is high; T is the comprehensive coordination index between the two systems; α, β is a coefficient to be determined; this paper assumes that the development of the marine low-carbon economy and the carbon emission reduction effect occur due to the interactions between the two elements and the impacts of the interaction, so α = β = 0.5. D is the degree of coupling coordination in terms of the development level of the marine low-carbon economy and the carbon emission reduction effect, and the closer the value of D is to 1, the higher the degree of coordinated development in terms of the development level of the marine low-carbon economy and the effect of carbon emission reduction.
Drawing on the relevant studies [17], the types of coupling coordination between public infrastructure and the regional economy are classified according to the size of the coupling coordination degree (Table 1).
(3)
External Validation
An ARIMAX model was used for cross-validation to validate the dynamic interactions between the marine low-carbon economy and carbon emission reduction. The ARIMAX model is an extended version of the Autoregressive Integrated Moving Average (ARIMA) model. It extends the ARIMA model by incorporating exogenous variables to capture trends, seasonality, and the effects of external factors in time series data [18]. The exogenous variables were selected based on their correlation with the coupling coordination degree (D), calculated using Pearson’s correlation coefficients. Due to the limited sample size (2012–2022), only the two indicators with the highest absolute correlations were included to avoid overfitting. The general form of the ARIMAX (p, d, q) model is expressed as:
D t = i = 1 p   ϕ i D t i + j = 1 q   θ j ϵ t j + β 1 X 1 , t 1 + β 2 X 2 , t 1 + ϵ t
where X 1 and X 2 represent the two exogenous variables with the strongest correlations to D, ϕ i   and θ j are autoregressive and moving average coefficients, β 1 and β 2 denote the impacts of the exogenous variables, and ϵ t is the white noise term.
(4)
GRA: Analysis of External Factors
Grey relational analysis (GRA) [19] is suitable for quantifying factor correlations in systems that involve small sample sizes and uncertain information. Its core principle lies in assessing the degree of association, based on the similarity or divergence of developmental trends, between factors. Specifically, it calculates correlation coefficients between sub-sequence indicators and the parent sequence (coupling coordination degree) to indirectly characterize system behavior. High correlation coefficients indicate greater consistency in terms of the changes between factors and stronger associations. The relevant steps in the process are as follows:
(1)
Data Normalization
Both the parent sequence (coupling coordination degree) and sub-sequences (individual influencing factors) undergo mean value processing.
x i = x i / x ¯ i
(2)
Calculation of Grey Relational Coefficients
Calculate the correlation coefficient between the coupling coordination degree and each external factor.
γ x 0 ( k ) , x i ( k ) = m i n i   m i n k   x 0 ( k ) x i ( k ) + ρ m a x i   m a x k   x 0 ( k ) x i ( k ) x 0 ( k ) x i ( k ) + ρ m a x i   m a x k   x 0 ( k ) x i ( k )
where x 0 ( k ) denotes the normalized coupling coordination degree D in year k, x i ( k ) represents the normalized value of each influencing factor in year k, and ρ is the distinguishing coefficient (ρ = 0.5).
(3)
Calculation of Grey Relational Degree
The grey relational degree, r i , for each factor is obtained by averaging the relational coefficients. A value closer to 1 indicates a stronger influence of the factor on the target sequence.
r i = 1 n k = 1 n   γ x 0 ( k ) , x i ( k )

3.2. Indicator System Construction

(1)
The Development Level of the Marine Low-Carbon Economy
According to Sun Jiatao’s research on the marine low-carbon economy [20], China’s main focus in regard to its marine low-carbon economy should be on adjusting the marine industrial structure, as well as using low-carbon technologies to transform traditional marine industries, actively developing marine renewable energy and carbon sequestration industries, and emphasizing the restoration of the marine ecological environment, while increasing blue carbon sinks. Therefore, four dimensions, namely the industrial green transition, marine renewable energy development, low-carbon technology innovation, and marine ecosystem conservation, are selected as criteria for the system’s evaluation layer. Considering the availability of data, an evaluation index system is established, including 11 indicators for assessing the development level of the marine low-carbon economy. The rationale for selecting the indicators is outlined as follows:
X1 and X2: Marine industries, such as fisheries [21], power generation [2,8], seawater utilization [22], biomedicine [23], and tourism [24], contribute to low-carbon development through carbon sequestration, reduced fossil energy consumption, and inherently low carbon emissions. The proportion of these industries within the national marine industry reflects the extent of green transformation of the industrial structure;
X3 and X4: Offshore wind power [8] and marine energy [2] play a significant role in marine renewable energy generation. Marine renewable energy primarily includes offshore wind, tidal, and current energy. According to the China Marine Economic Statistical Yearbook, the “Total installed capacity of ocean energy power plants” specifically refers to offshore wind power stations, while “Newly installed capacity of offshore wind power” predominantly denotes facilities utilizing non-wind marine energy sources (e.g., tidal and current energy);
X5~X9: The application of low-carbon technologies in the marine economy can effectively reduce carbon emissions in marine industries. Referencing the article by Xu Sheng et al. on the construction of indicators for “marine scientific and technological innovation” [25], metrics such as talent, policy, and innovation outputs were considered to evaluate the effectiveness of low-carbon technology innovation. Consequently, five indicators were selected from the China Marine Economic Statistical Yearbook, namely the number of personnel engaged in scientific and technological activities, R&D personnel and internal funding, as well as the number of scientific papers and patents granted in low-carbon technology innovation sectors;
X10 and X11: In regard to marine ecological conservation, indicators were selected based on two perspectives, namely “conservation actions” and “conservation outcomes”. Given phytoplankton’s critical role in marine carbon sequestration [26], the total area of marine protected zones [27] and the mean phytoplankton diversity index in marine monitoring areas were adopted as specific metrics.
At the same time, the entropy weight method is used to calculate the weight of the indicators, and the results are shown in Table 2.
(2)
Marine Carbon Emission Reduction
According to the connotations of carbon peaking and carbon neutrality [28], achieving carbon peaking as soon as possible requires controlling carbon sources and managing the peak in emissions, creating more time and space to achieve carbon neutrality. Achieving carbon neutrality requires reducing carbon dioxide emissions from human activities and increasing carbon dioxide absorption to maintain a balance between emission reduction and absorption. Based on this understanding, the following marine carbon emission reduction index system is constructed based on three perspectives: the carbon emission level, carbon source control, and emission reduction. The “carbon emission level” is the key indicator for identifying carbon peaking, “carbon source control” reflects the requirement for “peak management”, and “emission reduction” represents measures for achieving “carbon neutrality”. The rationale for selecting these indicators is as follows:
X12 and X13: Referring to the indicator design for “carbon emissions” by Huang Ruifen et al. [29], total carbon emissions and per capita emissions are selected for measurement. The total carbon emissions from marine industries helps quantify their contribution to overall carbon emissions. The per capita marine carbon emissions in coastal areas measures the contribution of the marine industry and related activities to the carbon emissions produced as a result of local residents’ lives and production activities, providing a more accurate assessment of carbon intensity and emission reduction pressure in coastal areas;
X14~X16: Traditional energy consumption constitutes a significant source of carbon emissions. Analyzing energy consumption patterns provides insight into the degree of carbon source control required. Calculating the total energy consumption in regard to marine industries reflects the emission potential from the energy usage. The burning of fossil fuels and industrial production are the main factors contributing to human-induced carbon emissions [30]. The energy consumption in terms of the value-added output of major marine industries reflects the demand for energy. Controlling this demand can help reduce carbon emissions. The proportion of fossil energy consumption by marine industries measures the reliance on fossil fuels, and controlling this through the use of measures like renewable energy substitution helps to reduce emissions;
X17 and X18: To reduce carbon emissions, China promotes green transportation. The passenger volume of public buses (trolleys) in coastal regions demonstrates efforts to advance green mobility and reduce transportation-related emissions [31]. Wetlands, as critical carbon sinks, effectively absorb CO2 and lower atmospheric greenhouse gas concentrations [32]. The total wetland area in coastal regions reflects the capacity for ecological conservation and carbon absorption.
At the same time, the entropy weight method is used to calculate the weight of the indicators, and the results are shown in Table 3.

3.3. Data Sources

The statistical data from 2012 to 2022 are used as the material for the existing empirical analysis, and the national carbon emission data used to calculate the total carbon emissions from the marine industry come from the China Carbon Accounting Database (available from https://www.ceads.net.cn/). The other data are mainly from the “China Marine Economy Statistical Yearbook”, the “China Energy Statistical Yearbook”, and the statistical yearbooks for the 11 coastal provinces.
In regard to the missing data for certain sub-industries in 2021–2022, the historical proportion method was used for the relevant estimations. Specifically, for the seawater utilization industry, the value-added output of the industry for 2021 and 2022 was estimated based on the average proportion of the original industry’s value-added output compared to the combined industry’s value-added output from 2018 to 2020 (referred to as the “historical average proportion method”). For indicators X5–X9, the missing data for 2022 was also estimated using this method. To verify the reliability of the data processing, statistical tests were used to compare the results of this method with those from the median and weighted average methods, to carry out a robustness check (see Section 4.3 for details).

4. Analysis of the Results

Based on the above indicator system and model, the comprehensive evaluation values for the marine low-carbon economy and carbon emission reduction systems, as well as their coupling coordination relationship, can be derived. In addition, the robustness of the CCD model can also be validated. The following analysis will discuss the results and will include robustness testing of the data imputation methods.

4.1. Analysis of the Development Level of the Marine Low-Carbon Economy and Carbon Emission Reduction

The entropy weight method enables a comprehensive system evaluation to be carried out by calculating both overall composite scores and subsystem (criterion layer) scores. Using the index systems detailed in Table 2 and Table 3, this method was applied to assess the marine low-carbon economy and carbon emission reduction systems. The development level of the marine low-carbon economy system is visualized in Figure 2, with Figure 3 providing supplementary data on personnel and financial investments. The results for the carbon emission reduction system are presented in Figure 4. Line charts are used to illustrate subsystem development levels and trends, aiding in identifying the key drivers of systemic progress. Area charts are used to depict the systems’ holistic development, derived by aggregating the subsystem scores to reflect the cumulative performance.
(1)
Marine Low Carbon Economy System
China’s marine low-carbon economy development level is generally on the rise, but there are large fluctuations, presenting an “N”-shaped characteristic, which can be observed from 2012 to 2022 (Figure 2).
The “N” shape of the marine low-carbon economy’s development level in 2012–2021 can be explained as follows: During 2011–2015, the “Twelfth Five-Year Plan” was in effect, and the State Council of China issued the “National Marine Economic Development” plan, which emphasized the scientific development of marine resources, the promotion of the recycling economy, energy conservation, and emission reduction in marine industries, as well as the prevention and control of land-based pollution to protect the marine ecological environment. These policy directions led to increased attention been given to the marine low-carbon economy, with more investment in terms of financial resources, technology, and human resources to support marine renewable energy R&D and promote the green transformation of the marine industry.
Secondly, in 2016 and 2017, insufficient investment in marine low-carbon technology R&D (X7) and scientific personnel (X6) led to a drastic reduction in the development of the sector compared to previous years (Figure 3), hindering innovation and causing a significant decline in marine low-carbon economy development. This was because 2015 marked the final year of the 12th Five-Year Plan, with policy resources concentrated at earlier stages, leaving limited room for new policy initiatives in 2016. Although the “National Marine Science and Technology Plan (2016–2020)” was issued in 2016, there was a delay in implementing supporting resources and detailed measures.
Thirdly, at the end of 2016, the State Oceanic Administration issued the “Marine Renewable Energy Development ‘13th Five-Year Plan’”, which outlined key demonstration projects for marine energy development, including island renewable energy and multi-energy complementary projects, and clarified the focus areas for marine energy technology development. The development of new types of marine energy, such as wind, tidal, and tidal current energy, has intensified, with increased investment in science and technology. In 2018, the results of marine energy development were evident, such as the stabilized operation of the LHD tidal current energy project, with the successful launch of second- and third-generation units for sea-based power generation. This restored the level of development in regard to the marine low-carbon economy and spurred growth.
(2)
Carbon Emission Reduction System
As shown in Figure 4, the carbon emission reduction level fluctuated between “decrease–increase–decrease” from 2012 to 2022. This paper suggests that the overall trend of carbon emission reduction, being opposite to the marine low-carbon economy development trend, is mainly due to the “lag” in the transformation of the innovation results, technology promotion, and policy implementation.
From 2012 to 2015, the carbon emission reduction system’s development level declined, but there was a significant increase in 2016, primarily due to delayed policy implementation. Although the “Interim Measures for Voluntary Emission Reduction Trading Management” were launched in 2012, the supporting regulations were delayed. The management rules for corporate greenhouse gas emission accounting and carbon trading were not fully developed until 2014 [33], resulting in low corporate participation. However, from 2016 onwards, as measures improved, the level of carbon source control increased. Additionally, starting in 2016, with central government funding, the “Blue Bay” restoration initiative was implemented in coastal areas, restoring wetlands, shorelines, and islands. The increase in carbon sinks further improved the overall level of carbon emission reduction.
From 2019 to 2022, the development of the system experienced a further decline. The main cause of this decline was the significant reduction in wetland areas in coastal regions, from 5360.26 hectares in 2018 to 2356.87 hectares in 2022. The reasons for this reduction remain unidentified in the research. Additionally, the COVID-19 pandemic during this period reduced the ability to travel of Chinese residents and the public transport passenger volume, affecting the overall trend of carbon emission reduction.
Despite the overall decline during this phase, the carbon source control level remained relatively high. This was mainly due to the gradual application of scientific and technological achievements in regard to marine low-carbon technology from 2012 to 2015. For example, as shown in Figure 2, the installed capacity of offshore wind farms and marine energy stations increased during this period. Renewable energy effectively replaced some fossil fuels, improving carbon source control.

4.2. Analysis of the Level of Coupling Between the Marine Low-Carbon Economy and Carbon Emission Reduction

The results on the level of coupling coordination between the marine low-carbon economy and carbon emission reduction for 2012–2022, based on the coupling coordination model, are shown in Table 4. As shown in Figure 1 and Figure 2, 2012–2015 was a period involving primary coordination, during which the development of the marine low-carbon economy was emphasized and achieved some results. However, due to a lag in the carbon emission reduction effect, the level of carbon emission reduction did not synchronize with the marine low-carbon economy development level.
The very low level of marine low-carbon economy development and the high carbon emission reduction level in 2016 and 2017 led to minimal coordination between the two systems. During these two years, insufficient investment, a lack of technological innovation, and other issues led to a significant decline in the development level of the marine low-carbon economy. Meanwhile, the carbon emission reduction measures from the previous period began to show results, leading to a relatively high level of carbon emission reduction.
From 2018 to 2021, with increasing state attention being paid to the marine low-carbon economy and continued investment in new energy sources, low-carbon technological innovation, and marine ecology protection, the development level of the marine low-carbon economy recovered and steadily grew. Meanwhile, carbon emission reduction measures continued to play a role in the development of the marine low-carbon economy, with some short-term fluctuations, but the overall level of carbon emission reduction remained high. In 2022, the system declined to the primary coordination level, primarily due to a sharp reduction in wetland areas, which significantly reduced the carbon emission reduction levels. Strengthening marine ecological protection is essential.
In summary, the mutual support and promotion between the two systems have become increasingly evident, laying a solid foundation for achieving the “dual carbon” goals.

4.3. Robustness Checks

To address potential biases arising from the revision of the statistical industry classifications in 2021, robustness tests were conducted using two alternative data imputation methods: the median-based approach and the weighted average method. The procedures and statistical validation steps are detailed below.
(1)
Data Imputation Framework
Weighted average approach: This method assigns linearly increasing weights to historical proportions, prioritizing more recent data. For the seawater utilization industry (2018–2020 data used for 2021/2022 imputation), weights were set at 1/6 (2018), 1/3 (2019), and 1/2 (2020). Similarly, for low-carbon technology indicators (X5–X9) (2018–2021 data used for 2022 imputation), weights were distributed as 1/10 (2018), 1/5 (2019), 3/10 (2020), and 2/5 (2021). The weighted average was then calculated to derive post-revision values.
Median-based method: As a robustness check, the median of the historical proportions (pre-revision sub-industry shares) was used to impute the missing values. This method reduces sensitivity to annual fluctuations or outliers, providing a stable baseline for comparison.
(2)
Statistical Validation
The Wilcoxon signed-rank test [34] was applied to evaluate differences between the original and revised coupling coordination degree (D values), according to the following hypotheses:
H0: No significant difference exists (Doriginal = Drevised);
H1: Significant differences exist (DoriginalDrevised)
The mean absolute error (MAE) further quantified practical deviations. The results confirmed that there were minimal discrepancies (MAE < 0.0005) and statistically insignificant p-values (p > 0.15), validating the robustness of the original methodology.
(3)
Results
Table 5 shows that the coupling coordination degree (D value) after revision using the median and weighted average methods is highly consistent with the original method. The Wilcoxon signed-rank test further indicates that the revision had no statistically significant impact on the D value (p = 0.157 and p = 0.180), with mean absolute errors (MAEs) of 0.0002 and 0.0003, respectively. This validates the robustness of the original method (historical average proportion method). Although the Wilcoxon test relies on normal approximation due to the small sample size and zero differences, its results align with the error analysis, reinforcing the reliability of the original method. Future research could optimize the approach by incorporating larger samples or micro-level data.

4.4. Results of External Validation

The following results were obtained based on the ARIMAX model constructed as outlined in Section 3.1. First, Pearson’s correlation coefficients between D and the 18 indicators (X1–X18) were calculated, selecting the two most strongly correlated variables, X1 (proportion of the marine low-carbon industry, r = 0.689) and X16 (proportion of fossil energy consumption in the marine industry, r = −0.576), as exogenous variables. These variables were incorporated into the ARIMAX model. The comparison between the in-sample predicted D values and the actual D values, shown in Figure 5, indicates that the ARIMAX model’s predictions closely align with the coupling coordination model’s results.
The ARIMAX model’s prediction accuracy was quantified using the mean absolute error (MAE) and root mean square error (RMSE). The results showed an MAE = 0.060 and an RMSE = 0.071. The Ljung–Box test p-value (0.511) suggests no autocorrelation in regard to the residuals. This indicates that the model captures the dynamic relationship between the marine low-carbon economy and carbon emission reduction, with small prediction errors. This validation result highlights the robustness of the time series characteristics in regard to the coupling coordination model. Nevertheless, prediction errors exceeding 0.1 were identified in specific years (e.g., 2016). The limited sample size (n = 11) imposed critical modeling constraints that restricted both the inclusion capacity of the exogenous variables and the integration of policy-related predictors into the model specification, thereby resulting in this observed discrepancy. Future research should expand the data range and explore higher-order models to improve the stationarity of the residuals.

5. Discussions

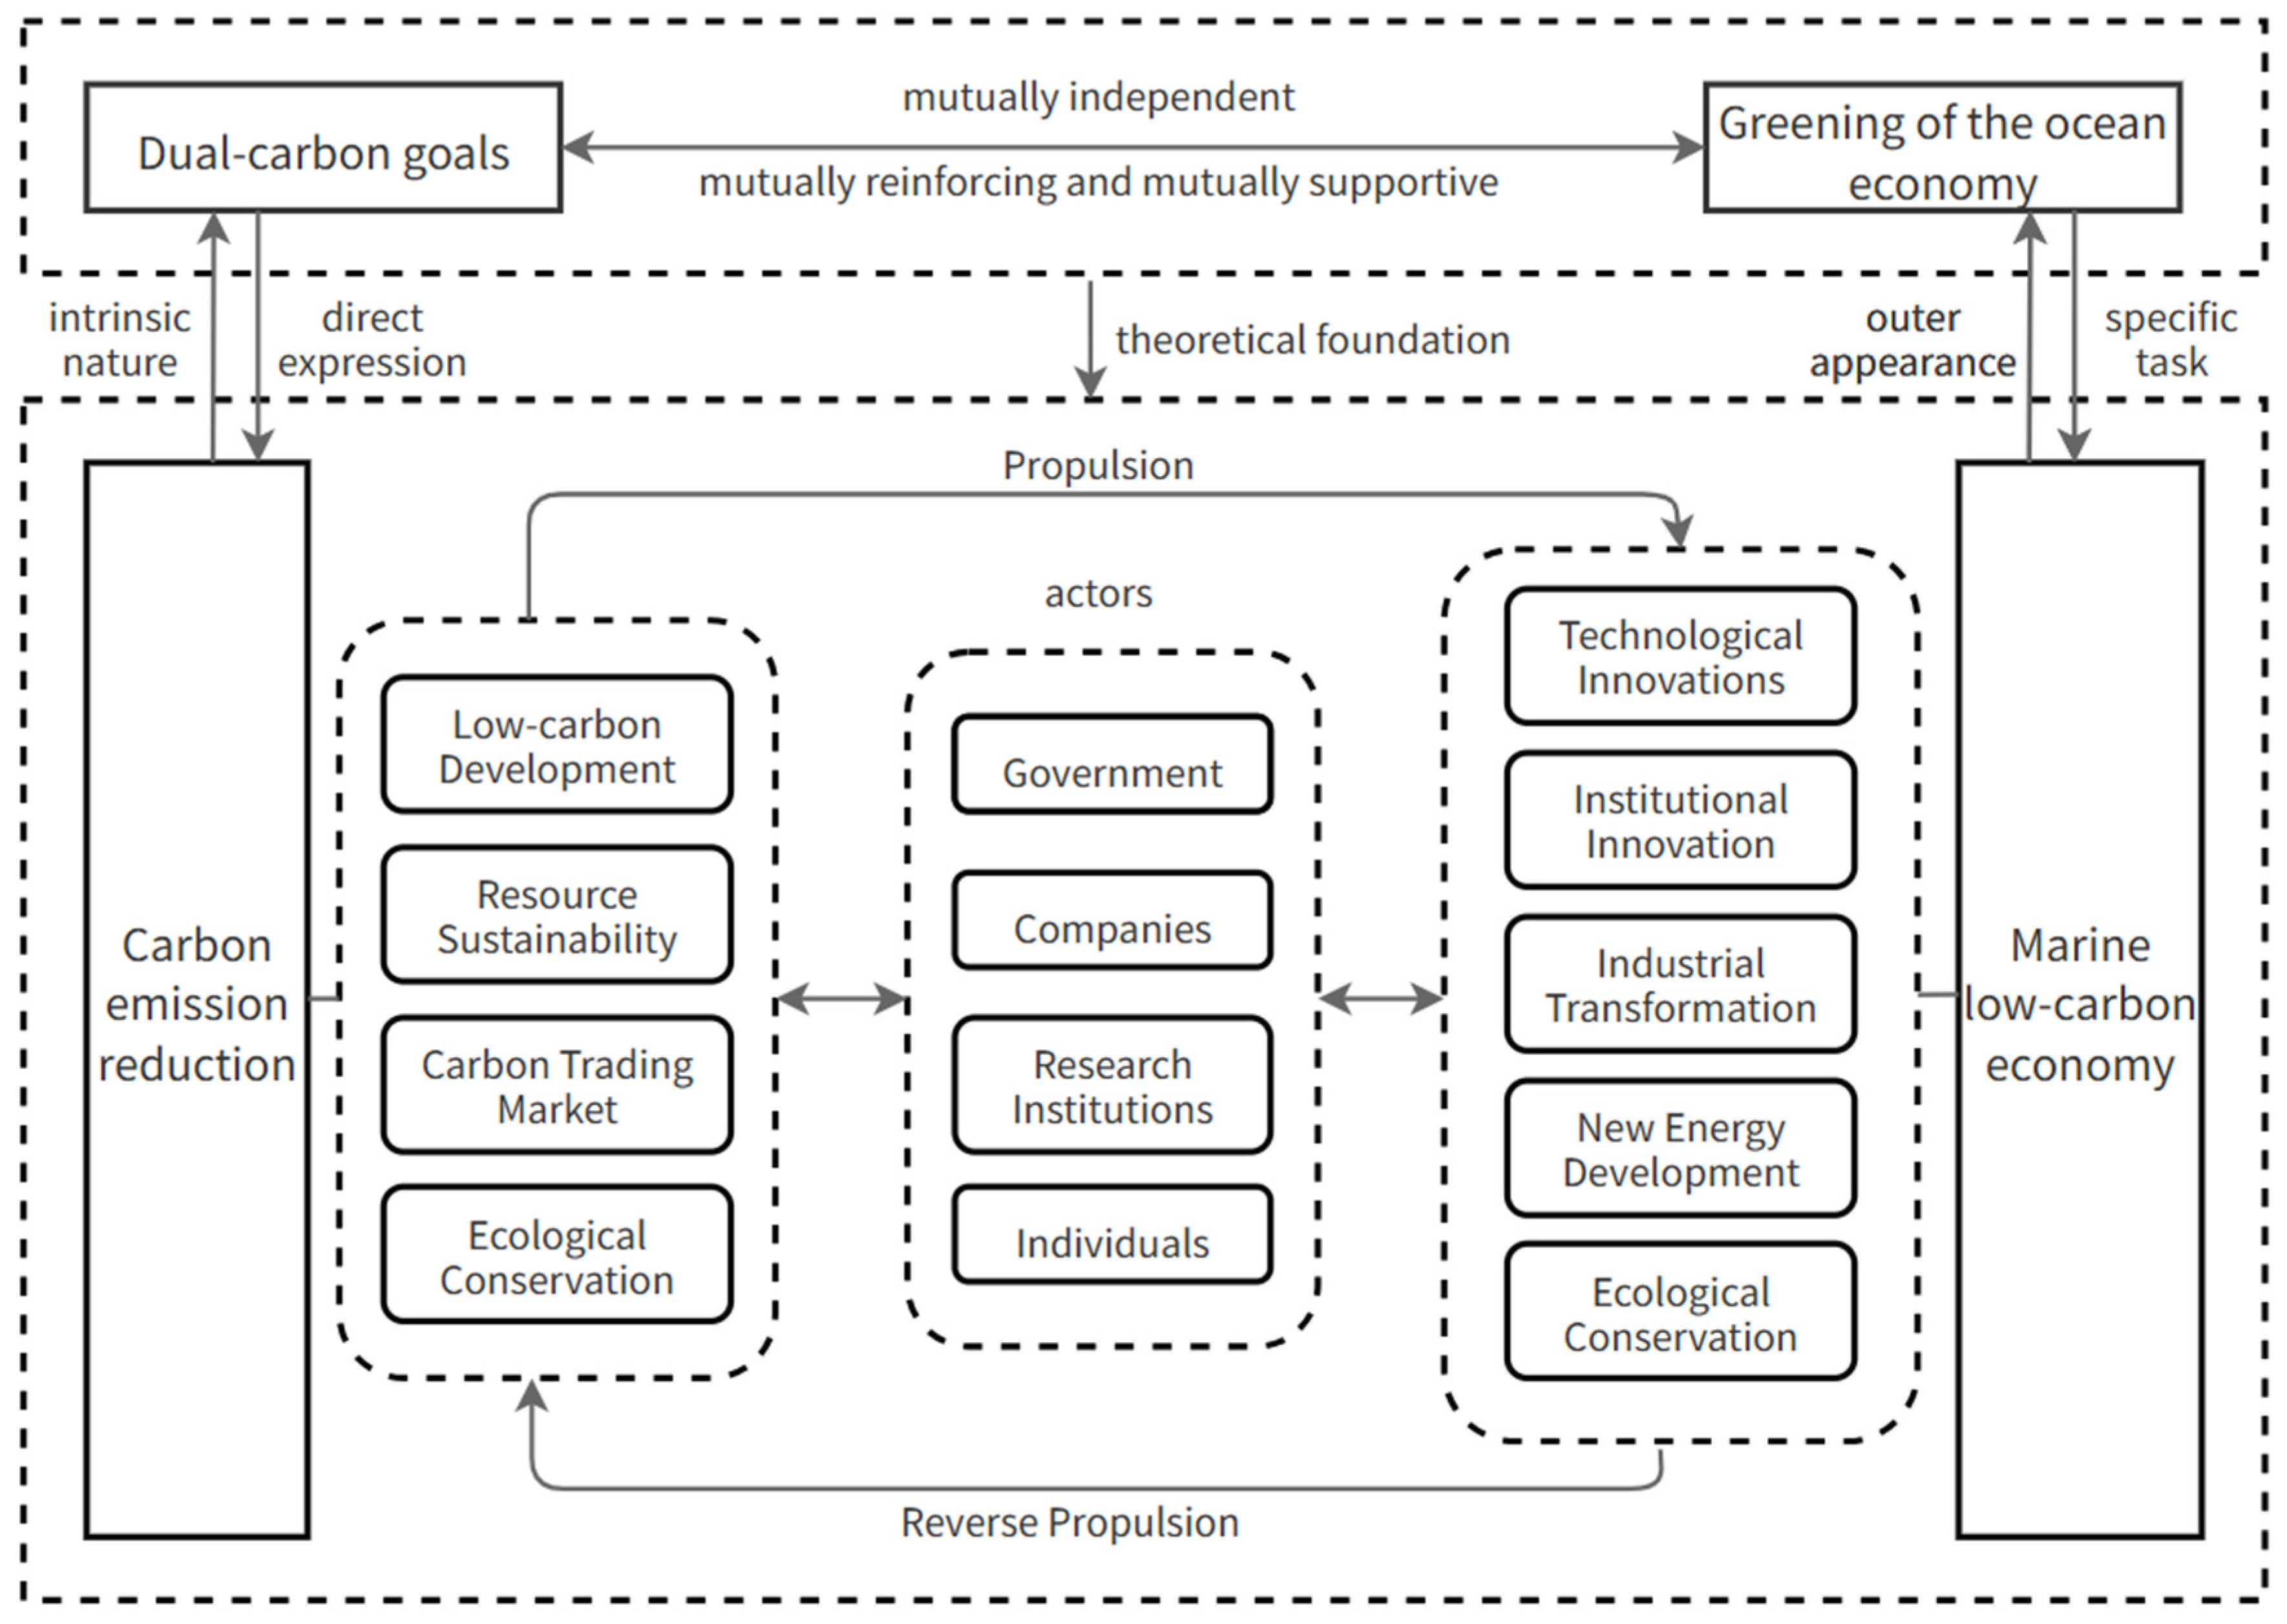
The coupling coordination analysis reveals significant potential for improving the synergy between the two systems. In order to develop targeted recommendations, key internal and external influencing factors must be identified, and the situations in different coastal regions of China should be discussed. Additionally, successful international experiences should be referenced to inform improvements. Therefore, this section will address these matters.

5.1. Sensitivity Analysis

To identify key internal influencing factors and develop targeted policies, a sensitivity analysis is necessary. Through the use of one-factor sensitivity analysis, core sensitive factors can be identified, providing a basis for prioritizing policy adjustments. This study uses the one-factor perturbation method to quantify the marginal contributions of each indicator to the coupling coordination degree, identifying key indicators affecting the coordination level between the two systems. A perturbation of ±20% was applied to 18 standardized indicators, and the sensitivity coefficient S i was calculated using Formula (15):
S i = Δ D / D 0 Δ X i / X i 0
where D represents the coupling coordination degree, and X i denotes the standardized value of the indicator. All the analyses were implemented in Python 3.10, with a perturbation step size of 5%, using 2022 data as the baseline. The results are shown in Figure 6.
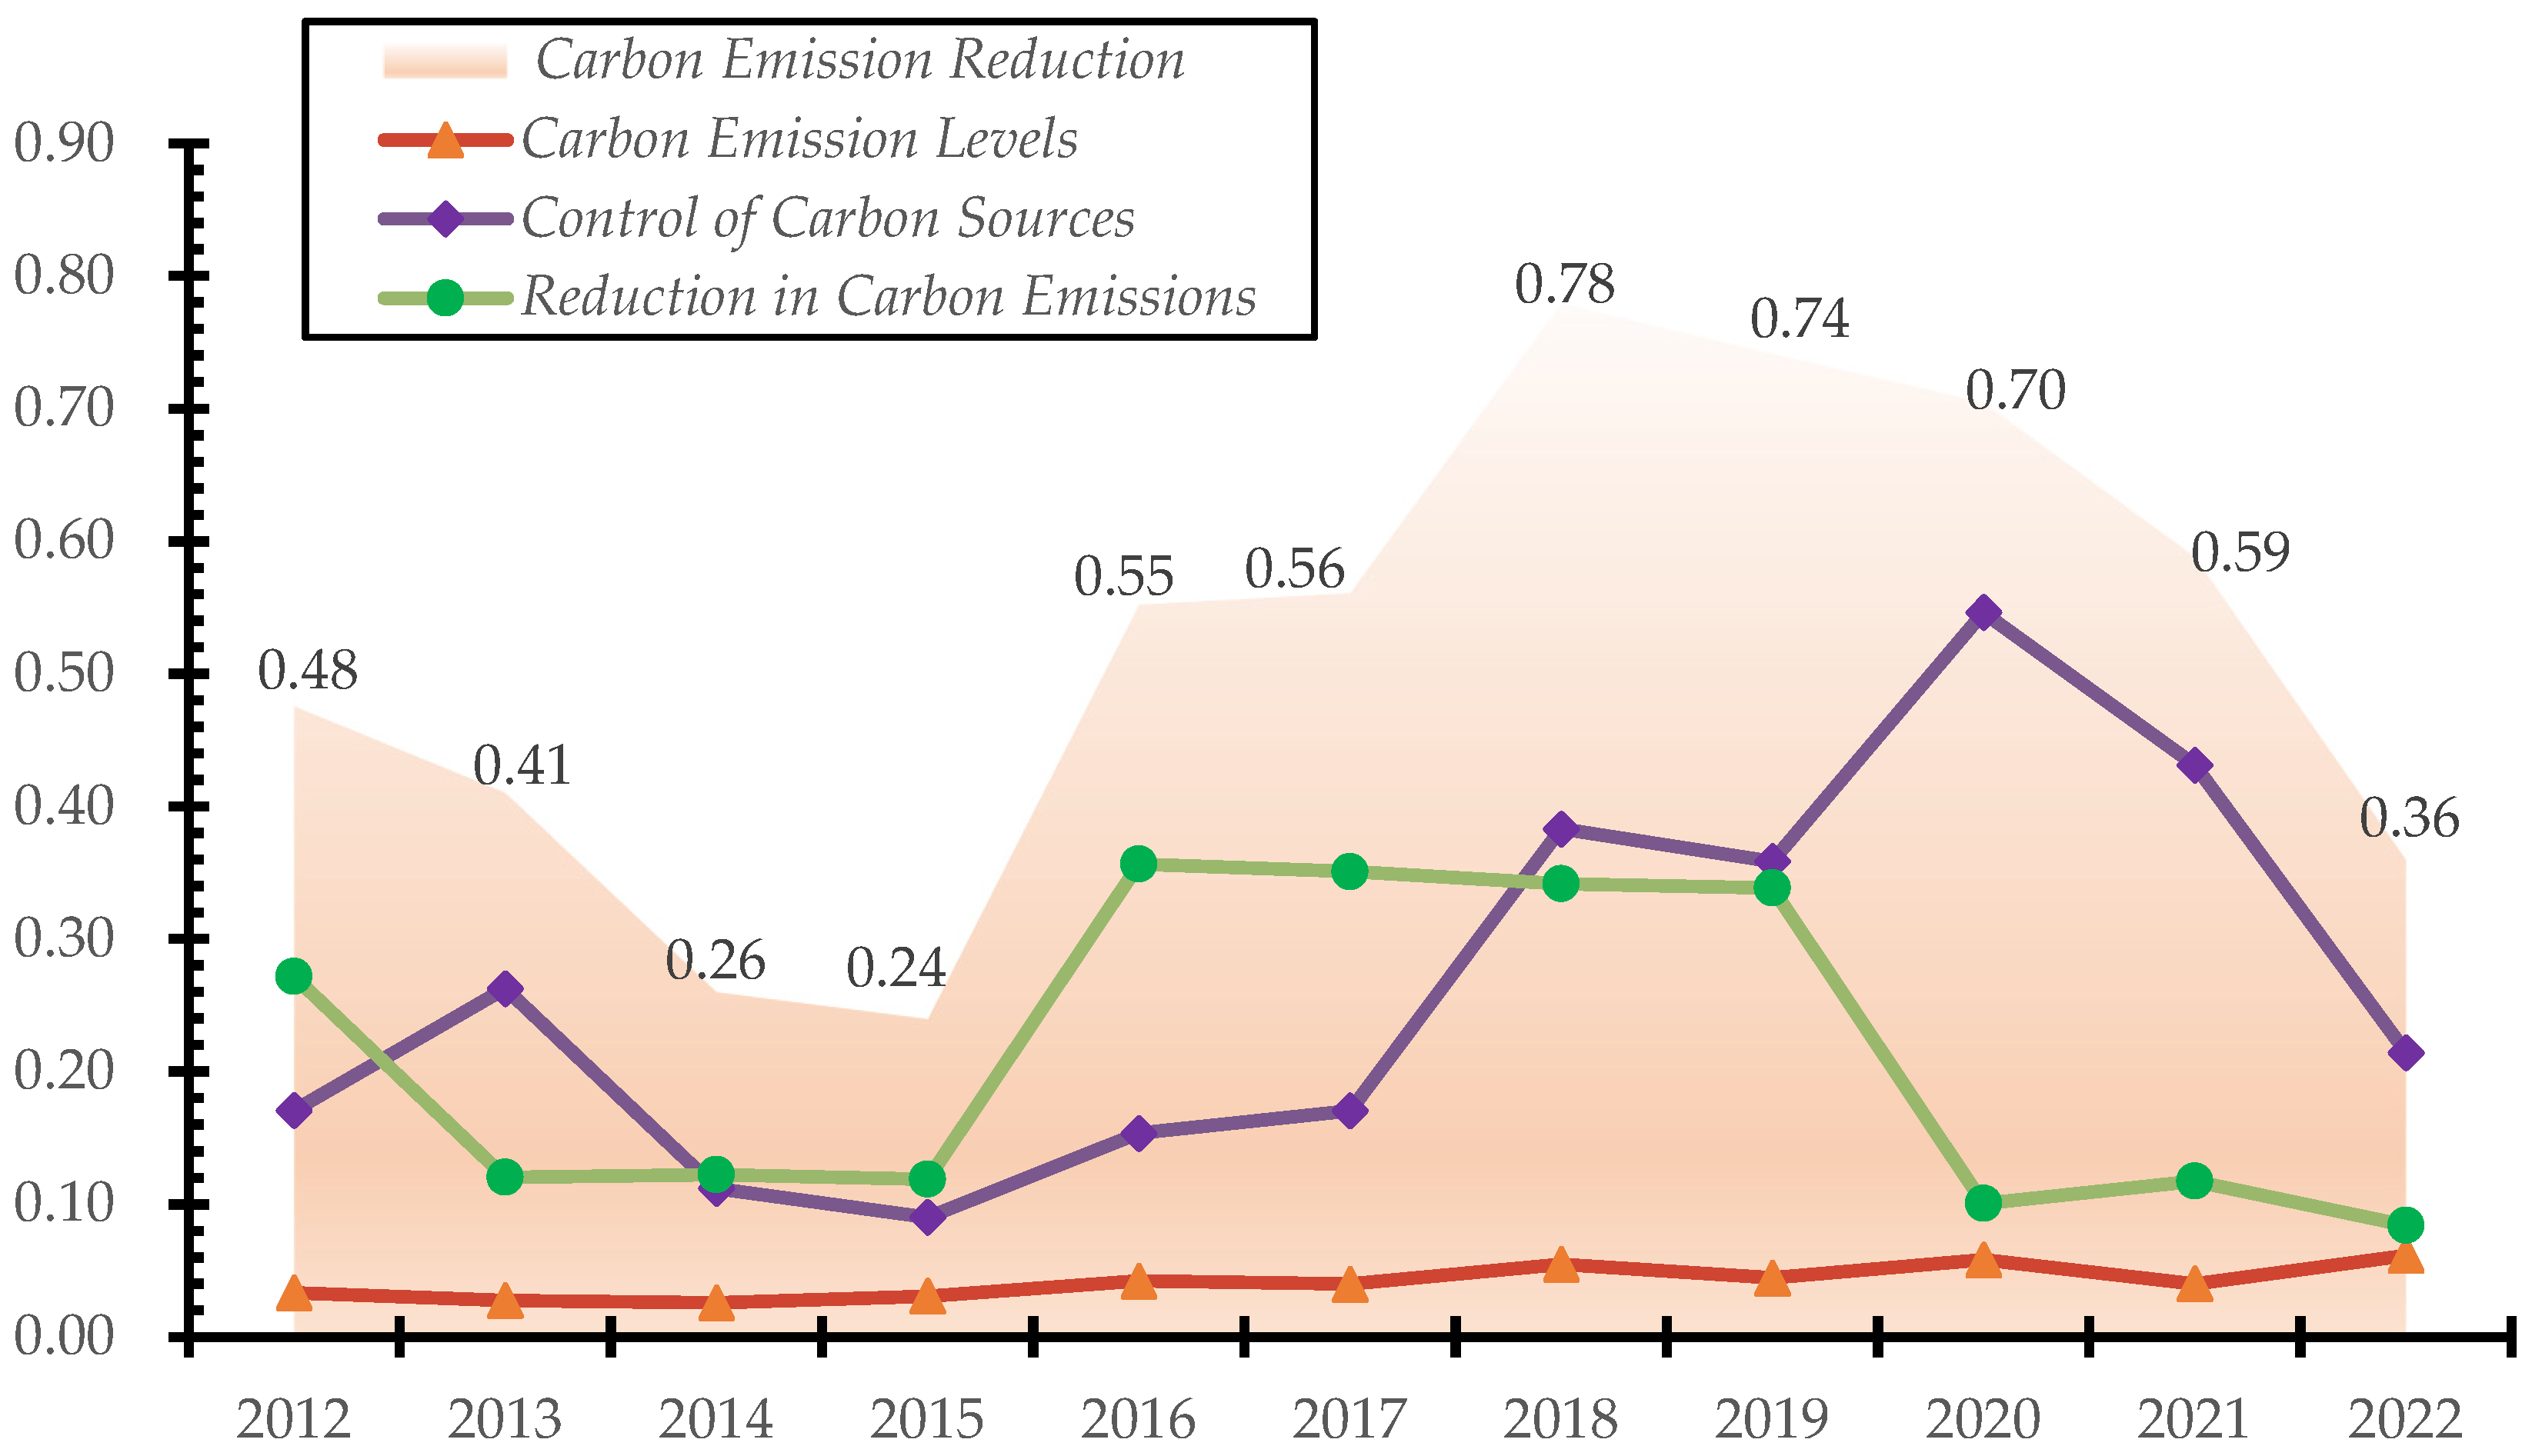
The following conclusions can be drawn from the sensitivity analysis results. First, the carbon reduction system dominates in terms of its contribution to the coupling coordination degree. X16 (proportion of fossil energy consumption) shows the highest sensitivity (0.442), directly reflecting the driving force of energy structure transformation on carbon emission reduction. X18 (total wetland area) ranks second in terms of sensitivity (0.339), as expanding the wetland area, a crucial carbon sink, can significantly enhance system coordination.
Second, the primary driving factors for the marine low-carbon economy are offshore wind power capacity and marine protected areas. The sensitivity of X4 (newly installed offshore wind power capacity) is 0.122, indicating significant marginal benefits from new energy infrastructure. X10 (marine protected area) shows a sensitivity of 0.156, suggesting that ecological protection indirectly promotes the low-carbon economy through enhanced carbon sink capacity.
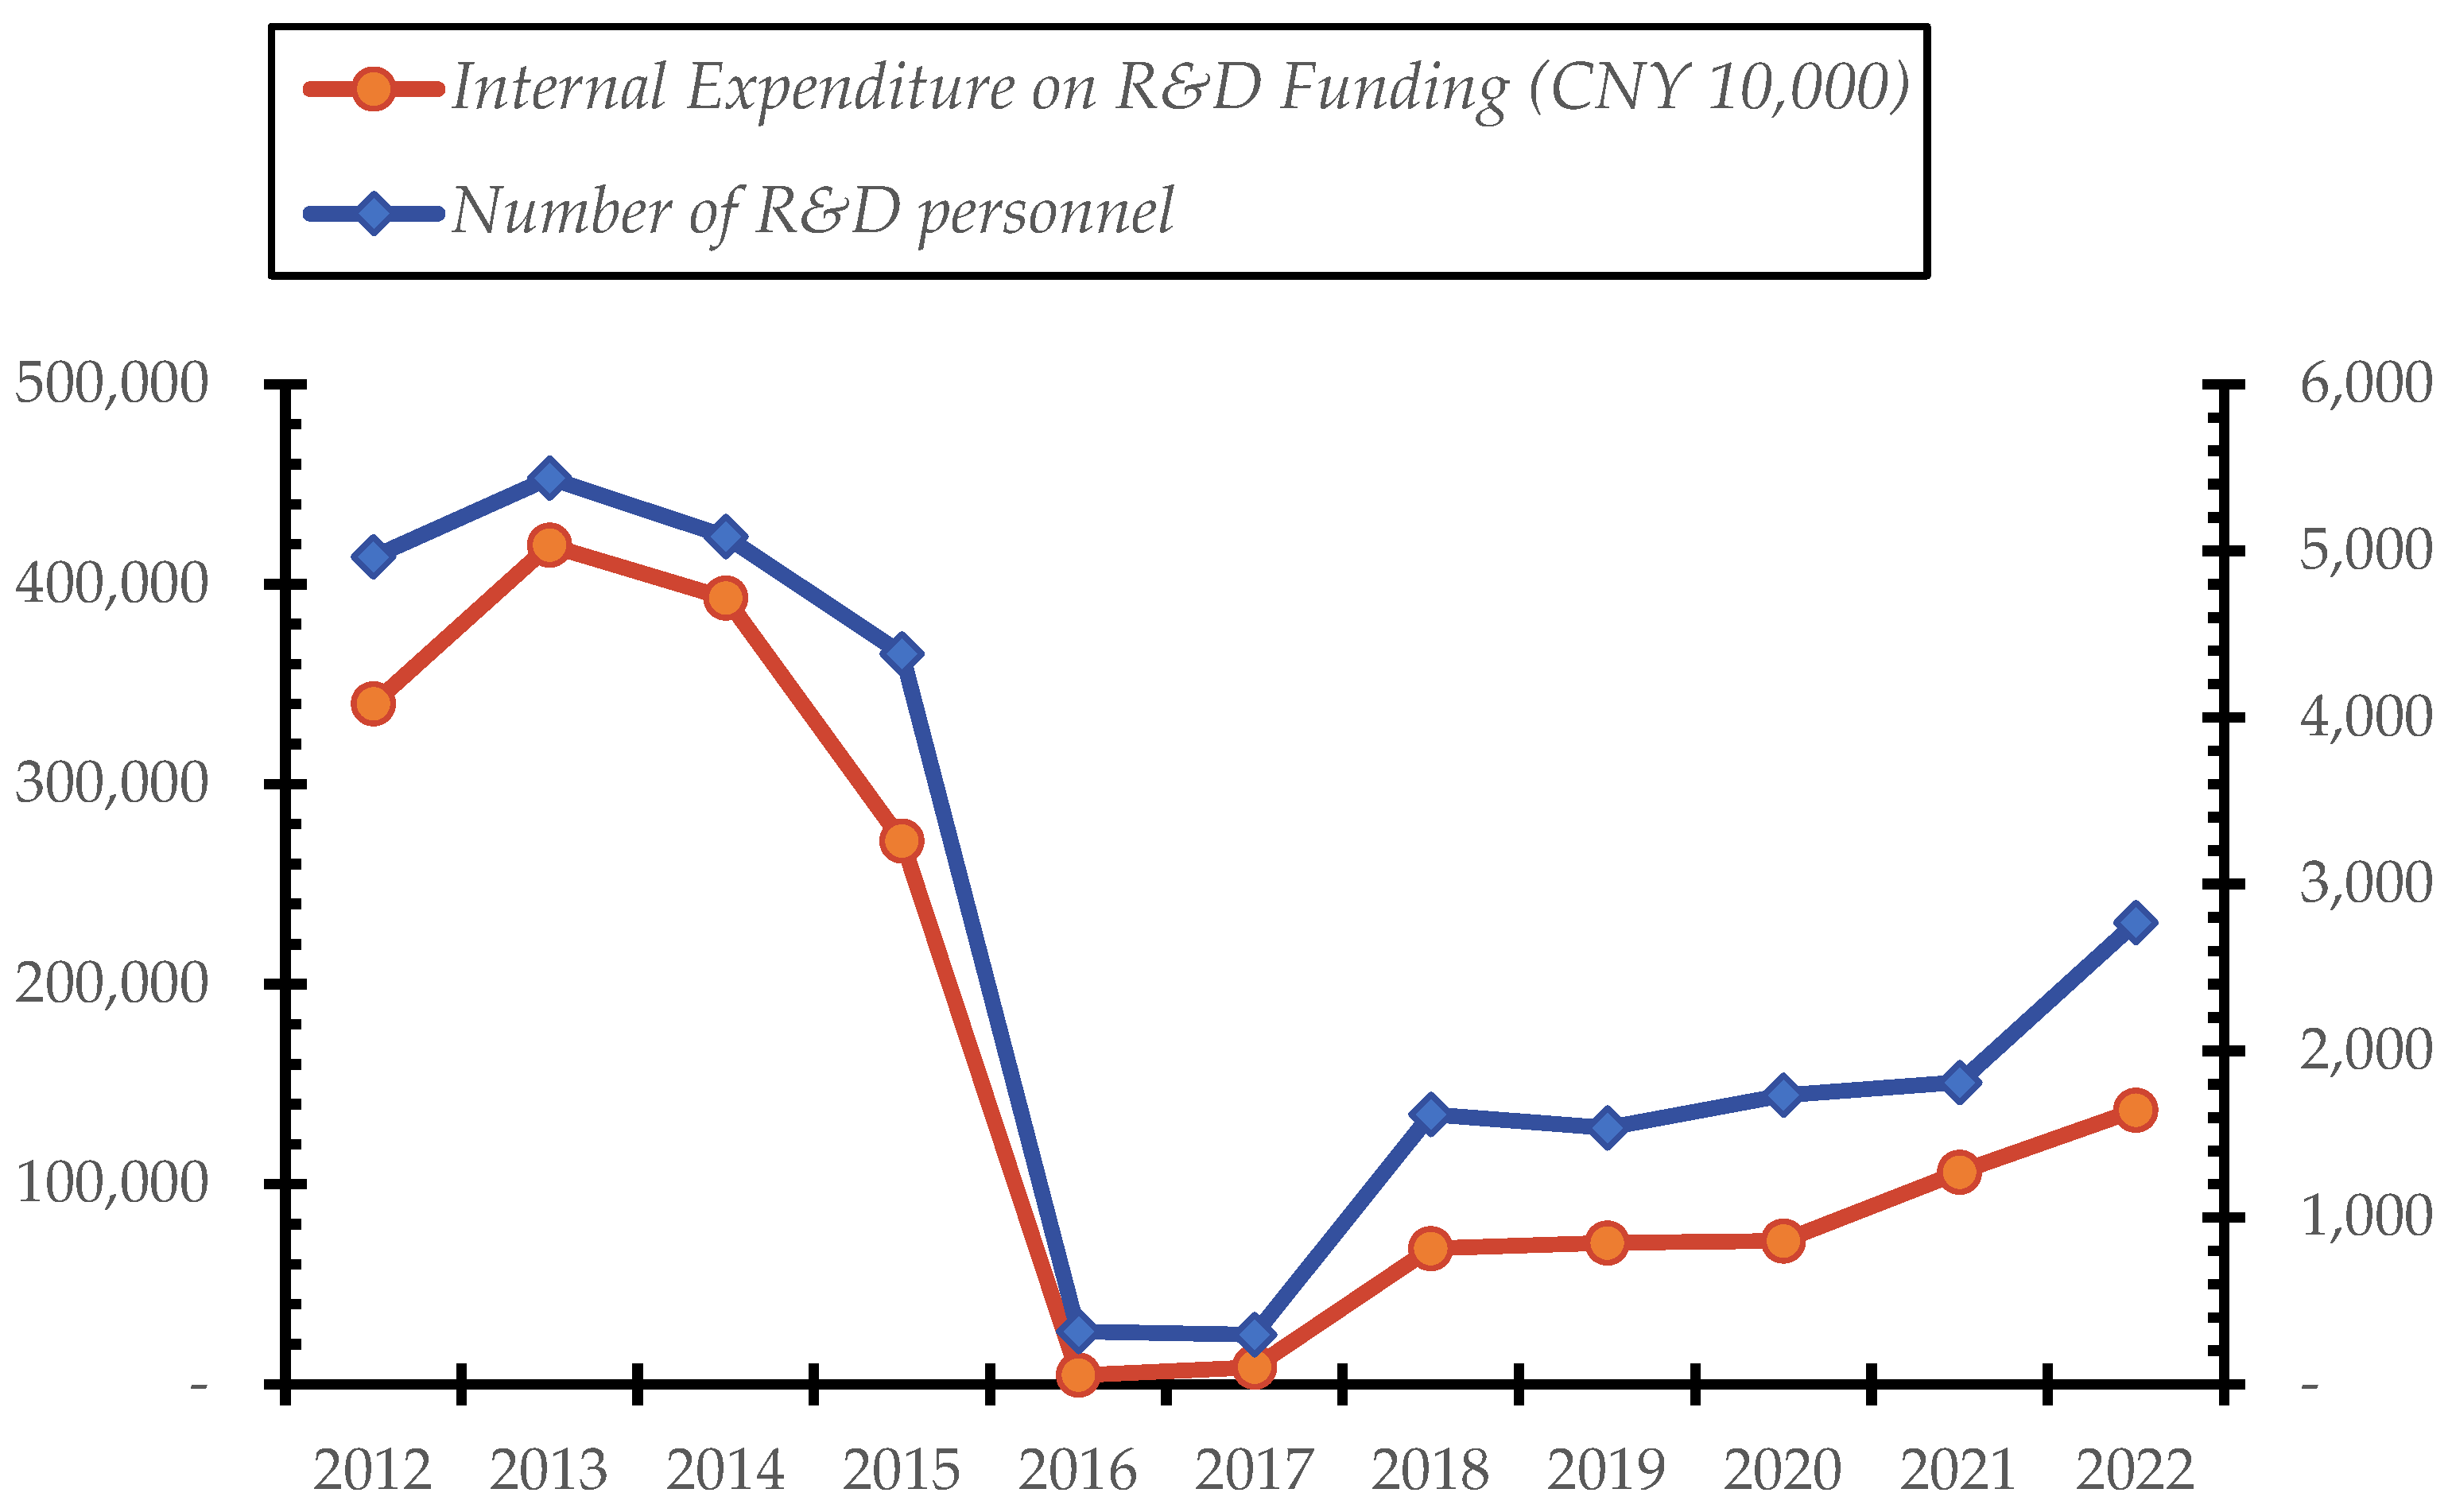
Finally, regarding technological innovation and industrial transformation, X1 (proportion of low-carbon industries) shows a sensitivity of 0.101, reflecting the long-term effects of industrial structure adjustment. X5–X9 (R&D-related indicators) show sensitivities ranging from 0.052 to 0.115, demonstrating the cumulative nature of technological innovation.
Reviewing high- and low-sensitivity indicators is critical for policymaking (Table 6). The policy implications of high-sensitivity indicators include: First, prioritize regulating X16 and X18 through policy instruments like carbon trading and carbon taxes to reduce fossil energy consumption (X16). Simultaneously, strengthen wetland conservation and restoration to expand the wetland area (X18), enhancing the ecological carbon sink capacity. Second, accelerate offshore wind power construction (X4), as rapid improvements can generate significant coordination benefits and facilitate the energy transition. Third, enhance technological innovation and talent cultivation (X5) through policy incentives like research subsidies and tax benefits to attract high-quality professionals in regard to marine low-carbon technology R&D. Fourth, strengthen marine ecological protection (X10) by expanding protected areas and incorporating more ecologically vulnerable zones to improve the marine carbon sink capacity.
Optimization directions for low-sensitivity indicators are as follows: First, X2 (growth rate of marine low-carbon industries) shows minimal sensitivity (0.023), possibly due to it approaching saturation in terms of the current growth rates, necessitating the exploration of new models (e.g., blue carbon finance) to unlock incremental development potential. Second, X8 (quantity of scientific papers), with a sensitivity of 0.052, suggests shifting the focus from quantity to quality could be valuable, while strengthening the industry–academia–research translation of relevant insights.
China’s current policies regulating X16 and X18, the most sensitive indicators, have achieved preliminary progress, but they face persistent challenges. While pilot emissions trading schemes (ETSs) target fossil energy consumption (X16), their implementation remains limited: only select maritime sectors (e.g., shipping and marine carbon sinks) are included in some regional markets [35], compounded by underdeveloped trading mechanisms and regulatory frameworks [36], which dilute market incentives. Accelerating the integration of maritime industries into the national carbon market and advancing fossil energy substitution through policy tools like carbon quota trading and carbon taxes are crucial. Regarding wetland conservation (X18), despite prioritizing wetland area expansion, weaknesses in the ecological compensation mechanisms and monitoring systems persist [37]. To strengthen ecological protection, wetland restoration projects should incorporate performance-linked compensation mechanisms, directly aligning fiscal transfer payments with measurable outcomes, such as the amount of restored wetland area and carbon sequestration efficiency, to enhance policy effectiveness.

5.2. Model Significance Tests

The CCD model quantifies the interaction level between the two systems, revealing the degree of coordination in their relationship. According to Figure 4, the coupling coordination degree between the two systems fluctuates between “primary coordination–close to imbalance–intermediate coordination”. To confirm that this fluctuation represents a genuine pattern rather than random variations, a statistical significance test is needed. However, the small sample size limits the effectiveness of traditional t-tests and linear least squares regression [38]. The Bootstrap method, which resamples the original data to estimate the distribution of the statistics, provides a direct estimate of the data distribution without relying on hypothesis testing, making it particularly effective for studies involving a small data sample [39]. Therefore, this paper employs the Bootstrap method [40] and Block Bootstrap method [41] for hypothesis testing. The hypotheses are formulated as follows:
H2: D ≤ 0.4 (the coupling coordination degree between the two systems is below the threshold of being on the verge of dysfunction);
H3: D > 0.4 (the coupling coordination degree significantly exceeds the mild imbalance level).
Through 1000 resampling iterations, both standard Bootstrap distributions and Block Bootstrap distributions (block size = 3) were generated to compute 95% confidence intervals and p-values (see Table 7).
The Bootstrap test results show that the lower bounds of the 95% confidence intervals for all the years exceed 0.473, indicating that the true coupling coordination degree, D, is unlikely to fall below 0.473 at the 95% confidence level. All the p-values are less than 0.001, confirming that none of the Bootstrap resamples produced a D value of ≤ 0.4, indicating high statistical significance.
To account for potential temporal dependencies in the D values across consecutive years, the Block Bootstrap method was applied to handle the time series effects. The results show that the lower bounds of the 95% confidence intervals for all the years exceed 0.431, with all the p-values being below 0.01. This confirms that the true D value is significantly above 0.431, even after accounting for temporal dependences.
By preserving the time series block structure, the Block Bootstrap method rigorously addresses temporal autocorrelation effects. Compared to the standard Bootstrap method, the Block Bootstrap method yields slightly wider confidence intervals, yet all the p-values remain highly significant (p < 0.01), further validating the model’s robustness.
Both methods reject H2, showing statistically significant coupling coordination between the marine low-carbon economy and carbon reduction systems, with the coordination levels consistently above the “near imbalance” threshold. These conclusions align with the coupling coordination results presented in Table 4.

5.3. Analysis of Regional Heterogeneity

To reveal the regional heterogeneity of marine low-carbon economy development and carbon reduction in China’s coastal regions, this study employs the K-means++ clustering algorithm, based on 2022 data from 11 coastal provinces in China, conducting cluster analyses across three dimensions: economic scale, resource endowment, and industrial structure. The K-means++ clustering algorithm [42], an improved version of the K-means algorithm, uses a probabilistic centroid initialization strategy to reduce the sensitivity to the initial values. This enhancement increases the probability of converging to superior solutions, making it suitable for high-dimensional data. This study applies Z-score standardization to eliminate dimensional effects, sets the number of clusters to 2 for all three dimensions, and limits the maximum iteration count to 20 to ensure stable algorithm convergence. The final classification results are obtained by combining the clustering outcomes from the three dimensions (Table 8). The variable selection criteria are as follows:
Economic scale: The gross ocean product and per capita GDP of the coastal provinces are selected to reflect the regional marine economy output and the residents’ economic welfare;
Resource endowment: The total wetland area (representing blue carbon resources), the cumulative installed offshore wind power capacity (representing wind energy resources), the number of marine development and research institutions (representing the agglomeration of technological resources), and port cargo throughput (representing logistics and shipping resources) are chosen. Variable selection primarily relies on the sensitivity analysis results (see Table 6), prioritizing high-sensitivity indicators or related variables. Ports are included as a critical coastal resource due to their association with the high-sensitivity indicator “proportion of fossil energy consumption in marine industries (X16)”, given that the shipping industry predominantly relies on traditional fuels;
Industrial structure: The proportion of marine tertiary industries is selected to characterize the advanced level of the marine economy structure.
1. High Economy–High Resources–High Structure
Guangdong Province has a large marine economy, strong resource endowment, and a high proportion of marine tertiary industries. Its marine gross domestic product ranks first in the country, with leading port cargo throughput and offshore wind power capacity. The proportion of marine tertiary industries is 64.9%. In 2022, Guangdong had 38 marine development and research institutions, second only to Shandong, highlighting strong low-carbon technology R&D capabilities in the region. Guangdong could establish an international marine low-carbon technology R&D center to advance the industrialization of offshore wind-to-hydrogen technologies. Additionally, it could develop high-end service sectors like marine finance and marine big data to increase the value added by the tertiary industry.
2. High Economy–High Resources–Low Structure
Jiangsu and Shandong Provinces have substantial marine economic output and strong resource endowments, but face challenges in regard to their traditional industrial structures. In 2022, their marine gross domestic products ranked second and third in the country. Regarding the relevant resources, Jiangsu leads in terms of total wetland area and offshore wind power capacity, while Shandong’s port cargo throughput reached 1890.36 million tons, the highest in northern China. However, the proportions in terms of marine tertiary industries in both provinces are 55.8% and 50.7%, respectively, with heavy reliance on traditional sectors like marine transportation, leading to significant carbon reduction pressures. To facilitate the low-carbon transition, they could develop integrated “offshore wind power + energy storage” bases to replace fossil fuels. Carbon tax reductions for marine equipment manufacturers and intelligent upgrades should also be prioritized.
3. High Economy–Low Resources–High Structure
Shanghai has a highly developed economy and advanced marine industrial structure, but faces ecological resource constraints. In 2022, its total wetland area was 71,400 hectares, its marine protected areas covered 10 km2, and its offshore wind power capacity was 1004.9 MW, significantly lower than Jiangsu and Guangdong. The wetland area, offshore wind power capacity, and marine protected areas are high-sensitivity indicators affecting the degree of coupling coordination between the “marine low-carbon economy–carbon reduction” and require urgent attention. Recommendations include establishing a wetland carbon sink trading platform in the Yangtze River Estuary, integrating mangrove restoration into carbon markets, and accelerating offshore wind farm construction.
4. High Economy–Low Resources–Low Structure
Tianjin, Zhejiang, and Fujian Provinces have developed economies, but weaker resource endowments than high-resource provinces like Shandong and Guangdong, coupled with lagging low-carbon industrial transitions. In 2022, their per capita GDP exceeded CNY 120,000, yet the average proportion of marine tertiary industries was 55.0%, with continued reliance on traditional port industries, leading to carbon reduction pressures. Zhejiang and Fujian, with their long coastlines, should expand offshore wind farms and increase investments in low-carbon technology R&D. Green port upgrades (e.g., Tianjin Port, Ningbo-Zhoushan Port) and clean fuel adoption are critical.
5. Low Economy–Low Resources–High Structure
Guangxi and Hainan Provinces have abundant ecological resources, but weak economic foundations, with industrial structures focused on eco-services. Their resource profiles include abundant ecological resources, but limited wind energy. Hainan has a total wetland area of 121,600 hectares, with its marine protected areas ranking first nationally, while Guangxi accounts for 33.9% of China’s mangrove area. Both provinces exhibit strong carbon sequestration capacity and low carbon emission pressures due to service-oriented industries. However, their offshore wind power development started late, with grid-connected projects becoming operational only in 2024. To leverage their ecological advantages, they could develop blue carbon tourism products (e.g., “mangrove eco-tourism”) and accelerate offshore wind projects to boost energy transitions.
6. Low Economy–Low Resources–Low Structure
Hebei and Liaoning Provinces face both economic and resource disadvantages, with industrial structures worsening the carbon reduction pressures faced in these regions. In 2022, their average marine gross domestic product was CNY 375 billion, indicating small-scale marine economies. Resource limitations include limited offshore wind power capacity and insufficient technological resources. Industrially, both rely on high-pollution sectors, such as steel and petrochemicals. To facilitate low-carbon transitions, they should increase funding and talent incentivization policies for marine research institutions, promote R&D and the application of low-carbon technologies, and expand offshore wind projects to replace traditional fossil fuels in relevant industries, in order to reduce the carbon reduction pressures.

5.4. Analysis of External Factors

This study examines the factors influencing the degree of coupling coordination between marine low-carbon economy development and carbon reduction, selecting marine technological innovation, compulsory environmental regulation, labor productivity, marine industrial structure, ecological pollution, and carbon market trading as external factors. The grey relational analysis method is used to assess the correlation between these factors and the degree of coupling coordination between the “marine low-carbon economy–carbon reduction”.
Marine Technological Innovation (MI): Represented by the annual number of marine patent applications accepted. Marine technological innovation can directly or indirectly reduce the carbon emission intensity in marine industries and promote green structural transformation through the development and application of marine technologies.
Compulsory Environmental Regulation (CER): Measured as the ratio of completed industrial pollution control investment to the regional GDP in coastal provinces. Environmental regulation compels enterprises to adopt clean production technologies through the use of policy constraints, reducing industrial pollution emissions [43], thereby indirectly optimizing the synergy between the marine low-carbon economy and carbon reduction. A higher ratio of pollution control investment to GDP indicates stronger policy enforcement, increasing non-compliance costs for enterprises and incentivizing their transition to low-carbon production models.
Labor Productivity (LP): Defined as the average labor productivity in coastal regions, calculated as the ratio of the total GDP in 11 coastal provinces to their total employed population. High labor productivity typically accompanies technological advancement and management optimization, driving economic structural transitions toward high value-added activities and low energy consumption [44], thereby reducing energy intensity.
Marine Industrial Structure (MS): Represented by the proportion of tertiary industries in regard to China’s marine gross domestic product. An increased tertiary industry share reduces the marine economy’s reliance on resource-intensive industries, thereby lowering carbon emissions. The “structural dividends” from industrial structure upgrading promote service-oriented economic development, which can effectively facilitate the entry of innovative new enterprises, thereby enhancing carbon emission reduction effects [45].
Ecological Pollution (HAB): Indicated by the annual frequency of red tide occurrences. Frequent red tides reflect marine ecosystem degradation, potentially weakening marine carbon sink capacity and exacerbating carbon emission pressures. Ecological pollution indirectly impacts carbon reduction system efficiency by reducing phytoplankton carbon sequestration efficiency [46].
Carbon Market Trading (ETS): Measured according to the carbon emission allowance transaction volume. Carbon trading assigns a price to carbon emissions through market mechanisms, incentivizing enterprises to proactively reduce emissions and invest in low-carbon technologies. Carbon price signals guide resource allocation toward low-carbon sectors, strengthening market-driven momentum in regard to synergistic developments between the two systems [47].
The results of the grey relational analysis are shown in Table 9.
The marine industrial structure (MS) has the highest relational degree (0.9021), indicating that increasing the tertiary industry share is the core driver for optimizing the degree of coordination between the two systems. This aligns with the “structural dividends” theory, showing that industrial upgrading significantly promotes low-carbon transitions by reducing the level of energy dependency.
Marine technological innovation (MI, 0.8932) and labor productivity (LP, 0.8865) rank second and third, respectively, supporting the “technology-efficiency dual-driven hypothesis”. Technological innovation directly reduces carbon emissions, while efficiency gains indirectly lower carbon intensity by increasing production efficiency.
Compulsory environmental regulation (CER, 0.8338) has a limited impact on coordination enhancement, likely due to the high short-term costs of enterprises’ passive emission reduction activities. Ecological pollution (HAB, 0.8523) reflects systemic feedback on the negative effects of frequent red tides on the carbon sink capacity, although the long-term effectiveness of ecological restoration requires further observation.
Carbon market trading (ETS, 0.7884) has the lowest relational degree, indicating that current carbon market mechanisms are insufficiently activated. Potential causes include low carbon prices and limited industry coverage [48]. Enhancing market vitality through expanded quota auctions and the integration of financial instruments is recommended.

5.5. International Comparative Analysis

Many countries have integrated low-carbon development into the growth of their marine economies. To understand China’s successes and shortcomings in this area and gain from international experience, it is necessary to compare highly sensitive indicators affecting the degree of coupling coordination between the two systems based on the experience in other countries. Based on the sensitivity analysis results from Section 5.1 (Table 6), offshore wind power, marine protected area (MPA) coverage, and wetland area are identified as high-sensitivity factors influencing the degree of coupling coordination between the “marine low-carbon economy–carbon reduction”. This section compares international data on these aspects to identify gaps in China’s marine low-carbon economy development and its progress toward carbon peaking and neutrality goals.
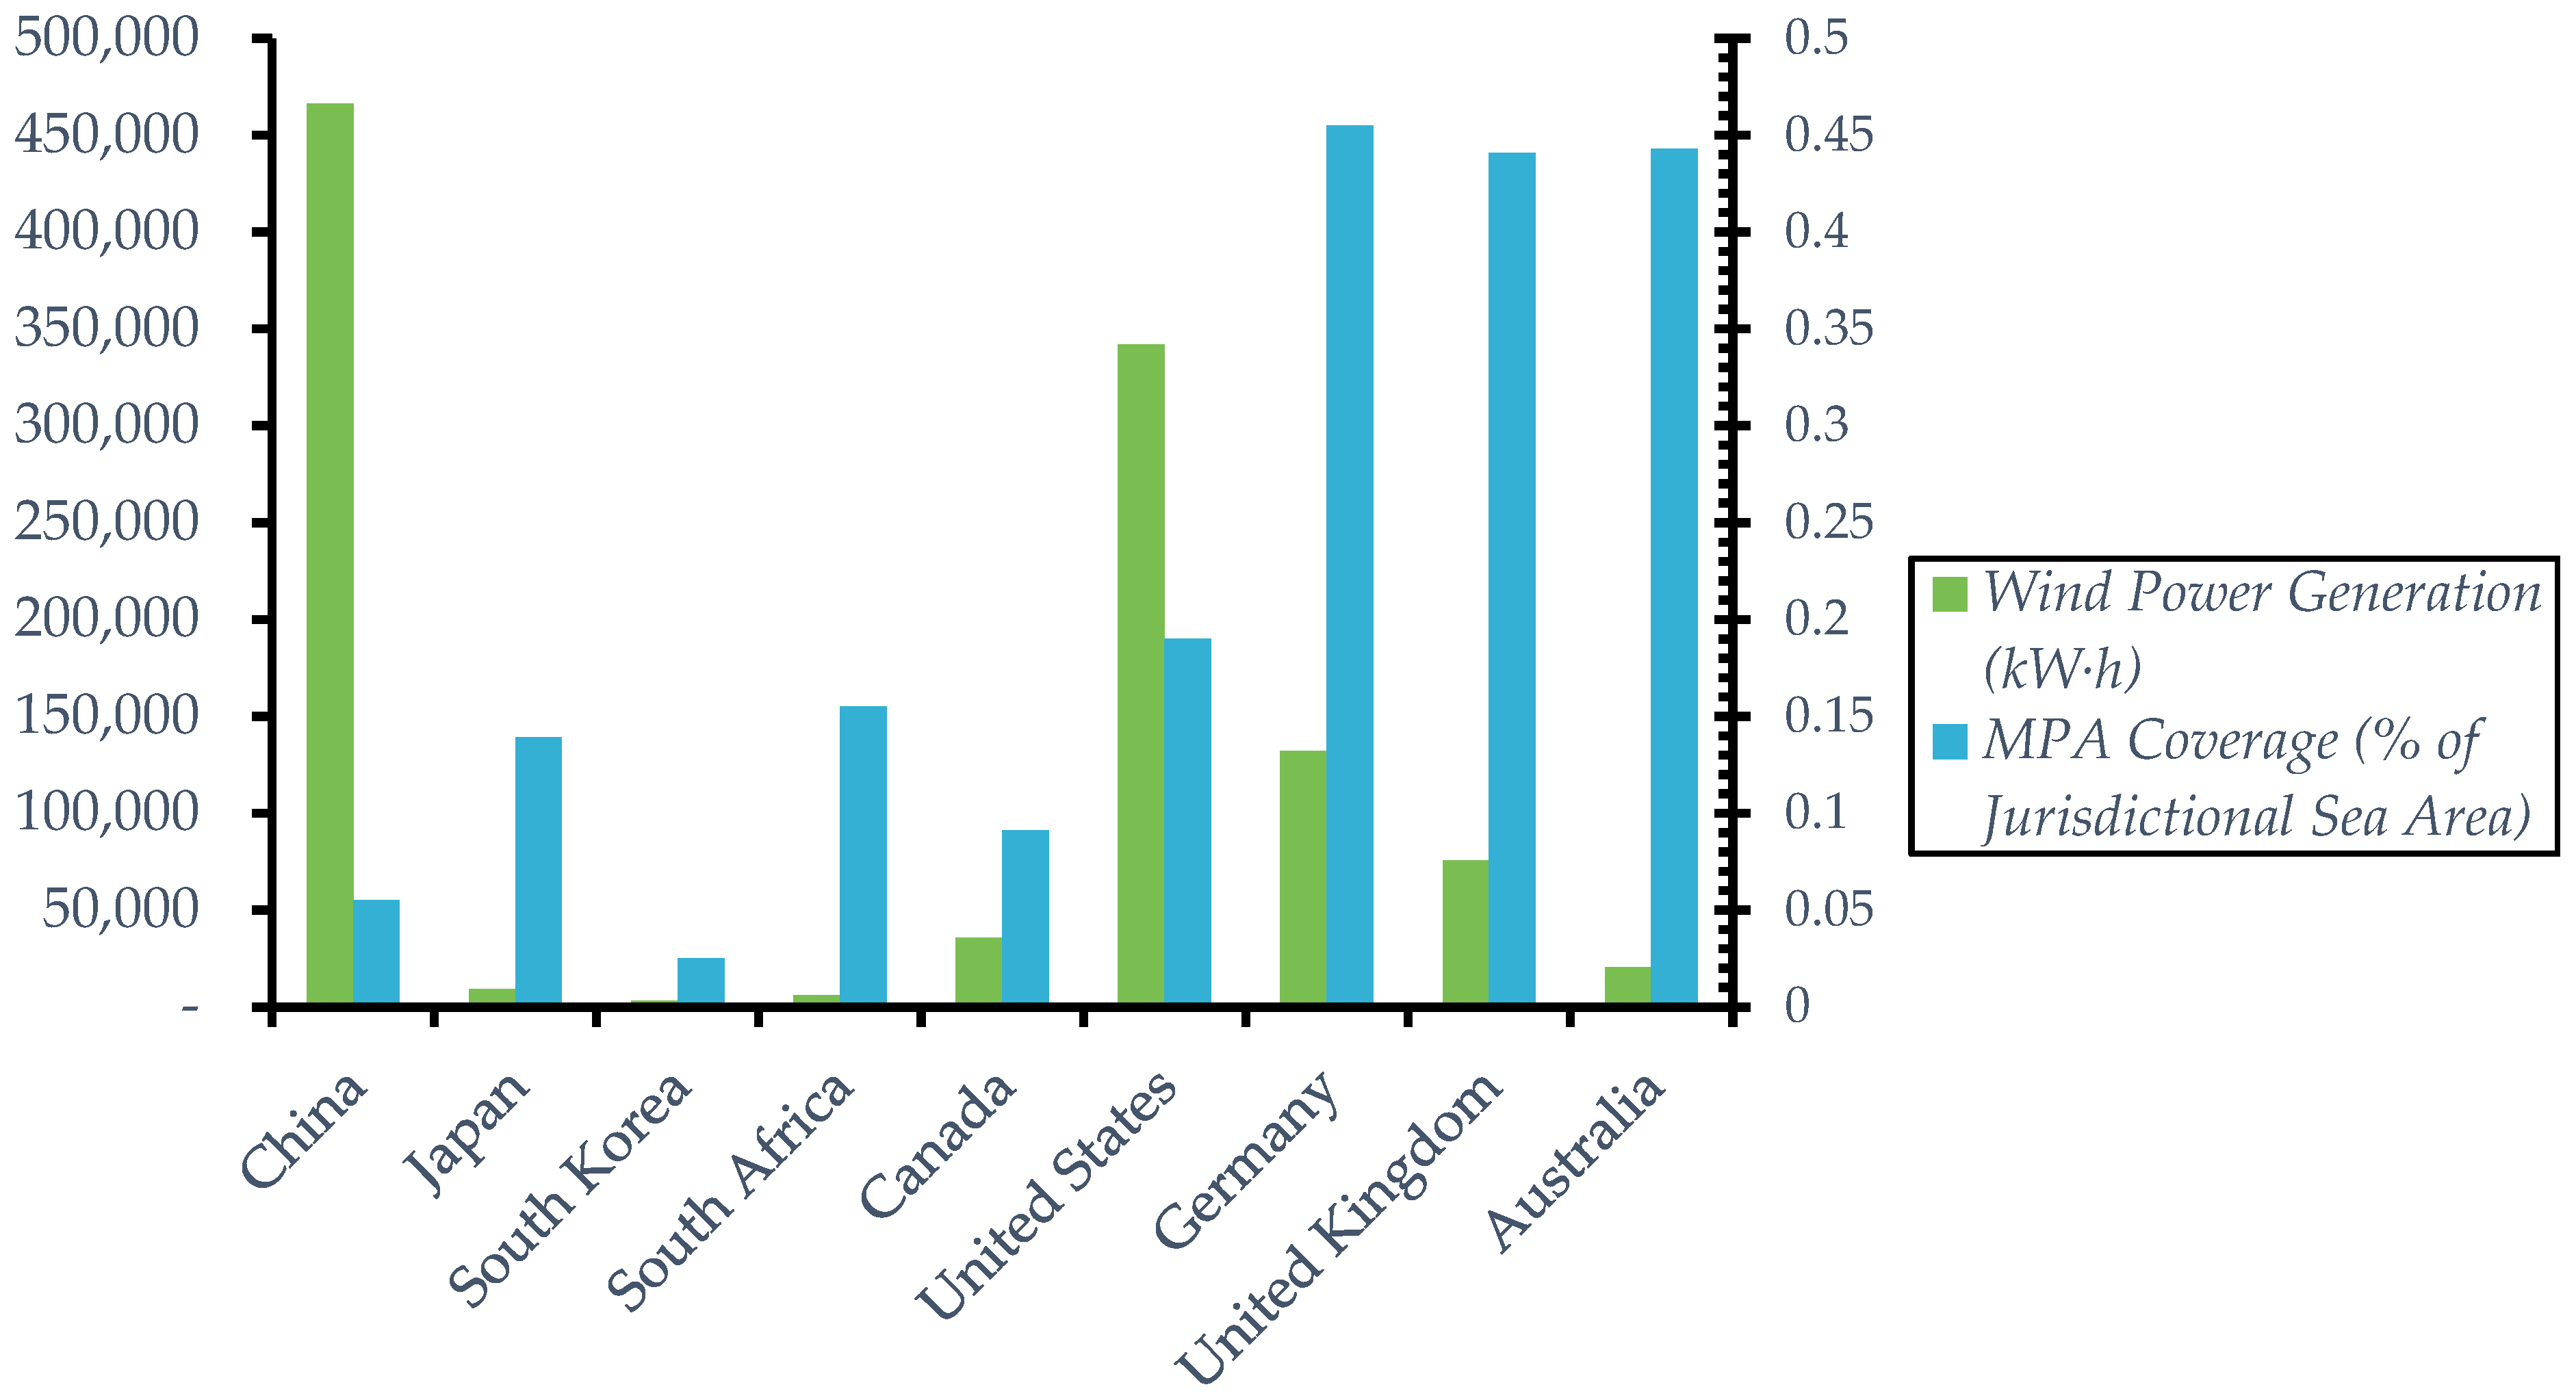
In terms of offshore wind power, by 2022, China’s cumulative installed offshore wind capacity exceeded 30 GW, accounting for over 50% of the global total. Its annual wind power generation surpassed 450,000 GWh, ranking first globally, far exceeding traditional leaders like the UK and Germany (Figure 7, data sourced from the China Marine Economic Statistical Yearbook 2023). These achievements stem from large-scale development and policy incentives, such as fixed feed-in tariffs for non-fossil energy (e.g., wind and solar) and mega projects like the Yancheng (Jiangsu) and Yangjiang (Guangdong) wind power bases.
In terms of marine protection, as of 2022, China’s MPA coverage constituted 5.5% of its jurisdictional sea area, significantly lower than Australia (44.3%), Canada (9.1%), and South Africa (15.5%) (Figure 7), with significant gaps compared to some EU member states.
Mangroves, critical blue carbon resources with robust carbon sequestration capacity, currently cover approximately 30,000 hectares in China, representing less than 0.5% of the global total. China’s mangrove area declined from 50,000 hectares in the 1950s to 22,000 hectares by 2000, but recovered to 30,000 hectares by 2019 through restoration efforts. While China has mitigated degradation over these three decades and achieved measurable restoration, its techniques and strategies still require refinement. Indonesia offers valuable lessons for China. Indonesia, the country with the world’s largest mangrove area, offers valuable lessons through its community-based mangrove management (CBMM) model, implemented since the 1980s. This approach emphasizes international collaboration, community engagement, and sustainable practices to enhance biodiversity and coastal resilience [49]. For example, in regard to community participation, Indonesia has integrated the CBMM model with economic activities through eco-tourism in the Langkat and Deli Serdang regions of North Sumatra. This approach not only protects the mangrove ecosystem, but also enhances the economic benefits for local communities [50]. China could adopt similar mechanisms in regions with abundant blue carbon resources but underdeveloped economies, such as Guangxi and Hainan. By developing “blue carbon tourism”, China could encourage residents to participate in the protection and restoration of blue carbon resources, such as mangroves, while simultaneously driving regional economic development.
Relative to other coastal nations, China has achieved significant advantages in regard to offshore wind power, yet faces certain challenges, such as the inadequate development of marine protected areas and immature restoration technologies for blue carbon ecosystems. For the restoration of blue carbon resources, such as mangroves, China can adopt Indonesia’s mangrove recovery model, which emphasizes collaboration with international organizations and community participation. Particularly, China could refer to the approach that combines eco-tourism with community participation and develop “blue carbon tourism” in regions such as Guangxi and Hainan. Strengthening marine protected area construction and blue carbon restoration will foster coordinated development between the marine low-carbon economy and carbon reduction, thereby advancing the progress toward carbon peaking and carbon neutrality.

6. Conclusions and Recommendations

6.1. Conclusions

This paper presents a method for analyzing the degree of coupling coordination between the marine low-carbon economy and carbon emission reduction and constructs a coupling coordination model to examine the coordination effects in China. Sensitivity analysis and significance testing are conducted to further verify the model’s robustness. The analysis results indicate that the coupling relationship between the two systems can be improved, with targeted improvements based on regional differences. The K-means++ clustering algorithm is used to classify the 11 coastal provinces in order to explore their heterogeneity. Furthermore, the grey relational analysis method is used to examine the external factors influencing the model, followed by an international comparative analysis.
(1)
From 2012 to 2021, China’s marine low-carbon economy showed an overall upward trend, with significant fluctuations, forming an “N”-shaped pattern. Meanwhile, the carbon reduction level followed a trend roughly opposite to that of marine low-carbon economy development, likely due to the “lag” effect in regard to the application of innovations, technology promotion, and policy implementation.
(2)
The marine low-carbon economy and carbon emission reduction have become increasingly coordinated over time. Between 2012 and 2021, their coupling coordination relationship evolved from an initial to a medium-level coordination state, with a brief decline in 2016 and 2017 due to policy fluctuations. In 2022, the pandemic temporarily caused a decline back to the initial coordination state. This suggests that the national emphasis on marine low-carbon economy development, continued investment, and the reverse driving effect of carbon emission reduction outcomes have formed a positive feedback loop between the two systems, mutually promoting each other. This has laid a solid foundation for achieving carbon peaking and carbon neutrality goals, but significant room for improvement remains.
(3)
In regard to the carbon emission reduction system, fossil energy consumption and wetland areas show the highest sensitivity, highlighting the importance of energy structure transformation and ecological carbon sinks. In regard to the marine low-carbon economy system, offshore wind power capacity and marine protected area coverage show high sensitivity, reflecting the significant contributions of renewable energy development and ecological conservation. Additionally, indicators like the low-carbon industry share and technological innovation show moderate sensitivity, indicating the long-term effects of industrial restructuring and innovation.
(4)
The marine industrial structure has the greatest impact on the degree of coupling coordination between the marine low-carbon economy and carbon emission reduction, suggesting that China can strengthen the development of high-tech marine industries for industrial upgrading. The carbon market trading correlation has the lowest impact, reflecting the fact that the current carbon trading mechanism remains underdeveloped.
(5)
Compared to other coastal nations, China has notable advantages in regard to offshore wind power, but lags behind in regard to marine protected area development and blue carbon ecosystem restoration.
A limitation of this study is that the analysis of the coupling coordination relationship between the two systems is based on China’s overall data from 2012 to 2022, without separate coupling analysis for the 11 coastal provinces. Additionally, the small sample size reduces the accuracy of model cross-validation. Future research should use panel data from each coastal province for a more detailed analysis.

6.2. Recommendations

Based on the research findings, this paper proposes the following three recommendations.
(1) Focus on Internal High-Sensitivity Factors for Targeted Regulation
First, reduce the core constraints in terms of fossil energy consumption through the reasonable utilization of policy tools, such as carbon quota trading and tiered carbon taxes, to reduce fossil energy consumption by the marine industry. Second, implement measures to increase wetland carbon sinks and expand protected area coverage. Learn from international experiences to optimize ecological governance, continue restoration efforts, and enhance the sustainability of “wetland restoration” and “mangrove restoration” projects. Introduce Australia’s “ecological corridor” system and pilot the connectivity of fragmented habitats, such as mangroves, salt marshes, and seagrass beds, to improve both the size and effectiveness of the protected areas. Draw on Indonesia’s “community co-management” model and implement the “mangrove restoration–carbon credit–community dividend” mechanism in Guangxi and Hainan to allocate carbon sink benefits and boost endogenous drivers of blue carbon protection. Restoring the current mangrove area to its 1980 level (50,000 hectares) could result in annual carbon sequestration of 630,000 tons [51]. Third, continue expanding offshore wind farm construction. In resource-rich areas like Jiangsu and Guangdong, integrated “wind power–hydrogen energy–energy storage” bases should be planned to replace coal-fired power generation. If offshore wind power capacity reaches 100 GW by 2030, replacing coal-fired power generation could save approximately 9.5 million metric tons of fossil fuel [52], and reduce carbon dioxide emissions by about 26.5 million tons [53].
(2) Strengthen Policy Guidance in regard to the Relevant External Factors to Foster Improvements
First, intensify efforts related to marine low-carbon technological innovation, focusing on key technologies, such as offshore wind power hydrogen production and marine carbon capture and storage (CCUS). Establish an integrated “government–industry–academia–research–application” platform to promote the industrialization of marine scientific research achievements. Second, promote industrial upgrading and activate market mechanisms and financial tools. Provide policy support for high-end service industries like eco-tourism and marine finance to increase the share of the marine tertiary industry. Third, activate the carbon trading market, deepen the demand for carbon sink trading, and explore carbon credit or carbon quota trading. Integrate marine carbon sinks into the national carbon trading market and gradually convert the ecological dividends from blue carbon products into economic benefits. Support commercial banks in issuing “blue carbon bonds” to finance projects that involve wetland restoration and offshore wind power.
(3) Advance the Regional Low-Carbon Transition Using Differentiated Strategies
For provinces with a “high economy–high resources–high structure” profile, strengthen marine low-carbon technology research and development and enhance the added value of high-end service industries. For provinces with a “high economy–high resources–low structure” profile, provide policy support and accelerate the upgrades to the marine industry structure. For provinces with a “high economy–low resources–high structure” profile, establish a wetland carbon sink trading platform and strengthen the protection and utilization of ecological resources. For provinces with a “high economy–low resources–low structure” profile, focus on offshore wind farm construction and low-carbon technology research and development, implement green transformation for major ports, and promote the use of clean fuels. For provinces with a “low economy–low resources–high structure” profile, develop blue carbon tourism products, promote eco-tourism, accelerate the construction of new energy projects, such as those involving offshore wind power, and facilitate energy transformations. For provinces with a “low economy–low resources–low structure” profile, increase funding support for marine research institutions and talent input, and promote low-carbon technology research and development.
In the process of advancing the transformation to a marine low-carbon economy, there are certain uncertainties and potential trade-offs. First, while innovation and the application of low-carbon technologies have the potential to drive industrial transformation, if the maturity and economic feasibility of these technologies are not fully determined, there is a risk of technological lags or cost increases during the transformation process. Second, balancing economic growth with environmental protection remains a significant challenge during the marine low-carbon economy transition. For example, large-scale offshore wind power deployment, while helping to reduce carbon emissions, may have negative impacts on marine ecosystems, fisheries, and other resources, potentially leading to conflicts between local communities and industrial interests. Therefore, when designing policies, it will be crucial to fully consider these potential trade-offs and unintended consequences, in order to avoid adverse effects on ecosystems or socio-economic systems. This will be an important direction for future policy development and academic discussions.

Author Contributions

Conceptualization, C.W.; data curation, C.W. and S.L.; formal analysis, C.W., S.L., D.L. and X.W.; funding acquisition, D.L.; investigation, S.L.; methodology, C.W., S.L., D.L. and X.W.; project administration, C.W.; resources, C.W. and S.L.; software, X.W.; supervision, C.W. and D.L.; validation, Y.Y.; visualization, D.L.; writing—original draft, C.W., S.L., D.L., X.W. and Y.Y.; writing—review and editing, C.W., S.L., X.W. and Y.Y. All authors have read and agreed to the published version of the manuscript.

Funding

National Key Research and Development Program of China (No. 2023YFC3108103); Basic Scientific Fund for National Public Research Institutes of China (No. GY0225Y09); Natural Science Foundation of Shandong Province (Grant No. ZR2023QD104).

Institutional Review Board Statement

Not applicable.

Informed Consent Statement

Not applicable.

Data Availability Statement

The data presented in this study are available on request from the corresponding author.

Acknowledgments

The authors appreciate all the data provided by each open database. The authors thank the anonymous reviewers and academic editors for their comments.

Conflicts of Interest

The authors declare that there are no conflicts of interest.

References

  1. Yang, Y.F.; Luo, H.T.; Wang, Q.; He, Z.L.; Long, A.M. Large-Scale Seaweed Cultivation: An Effective Approach to Enhance Marine Carbon Sink and Address Coastal Environmental Issues. Bull. Chin. Acad. Sci. 2021, 36, 259–269. [Google Scholar] [CrossRef]
  2. Khan, M.Z.A.; Khan, H.A.; Aziz, M. Harvesting Energy from Ocean: Technologies and Perspectives. Energies 2022, 15, 3456. [Google Scholar] [CrossRef]
  3. China Electronics Standardization Institute. Carbon Peak and Carbon Neutrality Work Briefing; December 2024 Issue; China Electronics Standardization Institute: Beijing, China, 2024; Available online: https://www.cesi.cn/202501/10840.html (accessed on 27 February 2025).
  4. Ministry of Natural Resources. China Marine Economic Statistics Bulletin 2024; The Ministry’s Department of Marine Strategic Planning and Economy: Beijing, China, 2025. [Google Scholar]
  5. Bdrcea, R.M.; Manta, A.G.; Florea, N.M.; Puiu, S.; Manta, L.F.; Doran, M.D. Connecting blue economy and economic growth to climate change: Evidence from european union countries. Energies 2021, 14, 4600. [Google Scholar] [CrossRef]
  6. Eom, J.O.; Yoon, J.H.; Yeon, J.H.; Kim, S.W. Port digital twin development for decarbonization: A case study using the pusan newport international terminal. J. Mar. Sci. Eng. 2023, 11, 1777. [Google Scholar] [CrossRef]
  7. Waheed, R. The significance of energy factors, green economic indicators, blue economic aspects towards carbon intensity: A study of saudi vision 2030. Sustainability 2022, 14, 6893. [Google Scholar] [CrossRef]
  8. Ligęza, K.; Łaciak, M.; Ligęza, B. Centralized Offshore Hydrogen Production from Wind Farms in the Baltic Sea Area—A Study Case for Poland. Energies 2023, 16, 6301. [Google Scholar] [CrossRef]
  9. Wuwung, L.; McIlgorm, A.; Voyer, M. Sustainable ocean development policies in Indonesia: Paving the pathways towards a maritime destiny. Front. Mar. Sci. 2024, 11, 1401332. [Google Scholar] [CrossRef]
  10. Noonan-Birch, R.; Adams, M.; Ross, M.-C. Utilizing the SDGs to develop a blue economy capacity framework enabling a shift from an ocean economy to a blue economy in Canada. Front Mar. Sci. 2024, 11, 1400043. [Google Scholar] [CrossRef]
  11. Huang, J.Y. Research on Transformation and Upgrading of China’s Marine Industries Under Low-Carbon Economy Perspective. Master’s Thesis, Qingdao University, Shandong, China, 2019. [Google Scholar] [CrossRef]
  12. Zhou, S.; Li, Q. Building a self-reliant and self-strengthening green development technology system for marine energy resources. Frontiers 2022, 17, 12–28. [Google Scholar] [CrossRef]
  13. Li, N.; Pan, P.L.; Fu, S.N.; Bie, M. Connotation and Pathway of Marine Industry Low-Carbon Transition: A Case Study of Jiangsu Province. Ocean Dev. Manag. 2024, 41, 98–106. [Google Scholar] [CrossRef]
  14. Zhao, M.; Yu, J.; Sang, X.C. Current Status and Trends of Green Development in China’s Marine Economy. Environ. Sustain. Dev. 2022, 47, 37–42. [Google Scholar] [CrossRef]
  15. Han, L.M.; Liu, K. Marine Low-Carbon Economy: New Approach for China’s Marine Economic Development. Ocean World 2010, 8, 10. [Google Scholar]
  16. Bo, W.; Wei, H.; Chen, H.; Jie, X.; Bingbing, W. Risk assessment of gas tunnel construction based on entropy method and extension theory. China Sci. Pap. 2022, 17, 99–104. [Google Scholar]
  17. Xie, Q.; Wang, Y.; Zhang, Y. Study on the coupling coordination characteristics and influencing factors of ecological environmental civilization and resident public health in China-based on a modified coupling coordination model. PLoS ONE 2024, 19, e0315373. [Google Scholar] [CrossRef]
  18. Janhuaton, T.; Ratanavaraha, V.; Jomnonkwao, S. Forecasting Thailand’s Transportation CO2 Emissions: A Comparison among Artificial Intelligent Models. Forecasting 2024, 6, 462–484. [Google Scholar] [CrossRef]
  19. Jiang, B.C.; Tasi, S.L.; Wang, C.C. Machine Vision-Based Gray Relational Theory Applied to IC Marking Inspection. IEEE Trans. Semicond. Manuf. 2002, 15, 531. [Google Scholar] [CrossRef]
  20. Sun, J.T. Exploration of China’s Marine Low-Carbon Economic Development Model. Mod. Econ. Res. 2010, 4, 19–22. [Google Scholar]
  21. Ren, W. Study on the removable carbon sink estimation and decomposition of influencing factors of mariculture shellfish and algae in China—A two-dimensional perspective based on scale and structure. Environ. Sci. Pollut. Res. 2021, 28, 21528. [Google Scholar] [CrossRef] [PubMed]
  22. Micari, M.; Moser, M.; Cipollina, A.; Tamburini, A.; Micale, G. Towards the implementation of circular economy in the water softening industry: A technical, economic and environmental analysis. J. Clean. Prod. 2020, 255, 120291. [Google Scholar] [CrossRef]
  23. Xu, S.; Chen, J.; Wen, D. Research on the Impact of Carbon Trading Policy on the Structural Upgrading of Marine Industry. Sustainability 2023, 15, 7029. [Google Scholar] [CrossRef]
  24. Yang, S.; Hao, Q.; Wang, Y.; Zhang, C. Impact of the Participation of the Tourism Sector on Carbon Emission Reduction in the Tourism Industry. Sustainability 2022, 14, 15570. [Google Scholar] [CrossRef]
  25. Xu, S.; Shi, J.M. Coupling Coordination Between Marine Blue Carbon and High-Quality Development of Marine Economy. J. Ocean Univ. China (Soc. Sci. Ed. ) 2024, 3, 1–11. [Google Scholar] [CrossRef]
  26. Godrijan, J.; Marić, P.D.; Djakovac, T.; Frka, S.; Gašparović, B. Lipids of different phytoplankton groups differ in sensitivity to degradation: Implications for carbon export. Glob. Change Biol. 2023, 29, 5075–5086. [Google Scholar] [CrossRef]
  27. Zarate-Barrera, T.G.; Maldonado, J.H. Valuing blue carbon: Carbon sequestration benefits provided by the marine protected areas in Colombia. PLoS ONE 2015, 10, e0126627. [Google Scholar] [CrossRef]
  28. Zhuang, G.; Dou, X.; Wei, M. Theoretical interpretation and path analysis of carbon peak and carbon neutrality. J. Lanzhou Univ. (Soc. Sci. ) 2022, 50, 12. [Google Scholar]
  29. Huang, R.; Li, N.; Zhao, Y. Predictive study on the coupling relationship between low-carbon economy and environmental resources: A case study of the Bohai Economic Rim. Chin. Fish. Econ. 2013, 31, 52–57. [Google Scholar]
  30. Jiang, S.; Yang, C.; Guo, J.; Ding, Z.; Tian, L.; Zhang, J. Uncovering the Driving Factors of Carbon Emissions in an Investment Allocation Model of China’s High-Carbon and Low-Carbon Energy. Sustainability 2017, 9, 1021. [Google Scholar] [CrossRef]
  31. Jing, Q.L.; Liu, H.Z.; Yu, W.Q.; He, X. The Impact of Public Transportation on Carbon Emissions—From the Perspective of Energy Consumption. Sustainability 2022, 14, 6248. [Google Scholar] [CrossRef]
  32. Chmura, G.L.; Anisfeld, S.C.; Cahoon, D.R.; Lynch, J.C. Global carbon sequestration in tidal, saline wetland soils. Glob. Biogeochem. Cycles 2003, 17, 22-1–22-12. [Google Scholar] [CrossRef]
  33. Luo, J.; Xu, C.; Yang, B.; Chen, X.; Wu, Y. Quantitative Analysis of China’s Carbon Emissions Trading Policies: Perspectives of Policy Content Validity and Carbon Emissions Reduction Effect. Energies 2022, 15, 5123. [Google Scholar] [CrossRef]
  34. Johnson, R.A.; Bhattacharyya, G.K. Statistics: Principles and Methods, 8th ed.; Wiley: Hoboken, NJ, USA, 2019. [Google Scholar]
  35. Liu, H.; Mao, Z.; Li, X. Analysis of international shipping emissions reduction policy and China’s participation. Front. Mar. Sci. 2023, 10, 1093533. [Google Scholar] [CrossRef]
  36. Wei, X.; Wang, Q. Policy suggestions for tapping the potential of ocean carbon sinks in the context of “double carbon” goals in China. Front. Mar. Sci. 2024, 11, 1298372. [Google Scholar] [CrossRef]
  37. Liu, Y.X.; Zhen, L.; Huang, L.; Xiao, Y. Stages and characteristics of evolution of ecological environment protection policies in the upper reaches of the Yangtze River: Taking Qinghai Province as an example. Resour. Sci. 2024, 46, 867–880. [Google Scholar] [CrossRef]
  38. Lumley, T.; Diehr, P.; Emerson, S.; Chen, L. The importance of the normality assumption in large public health data sets. Annu. Rev. Public Health 2002, 23, 151–169. [Google Scholar] [CrossRef] [PubMed]
  39. Efron, B. Bootstrap Methods: Another Look at the Jackknife; Springer: New York, NY, USA, 1979. [Google Scholar] [CrossRef]
  40. Felsenstein, J. Confidence Limits on Phylogenies: An Approach Using the Bootstrap. Evolution 1985, 39, 783–791. [Google Scholar] [CrossRef]
  41. Künsch, H.R. The Jackknife and the Bootstrap for General Stationary Observations. Ann. Stat. 1989, 1217–1241. [Google Scholar] [CrossRef]
  42. Arthur, D.; Vassilvitskii, S. K-Means++: The Advantages of Careful Seeding; Stanford: Stanford, CA, USA, 2006. [Google Scholar]
  43. Porter, M.E.; Linde, C.V.D. Toward a new conception of the environment-competitiveness relationship. J. Econ. Perspect. 1995, 9, 97–118. [Google Scholar] [CrossRef]
  44. Li, K.; Lin, B. Economic growth model, structural transformation, and green productivity in China. Appl. Energy 2017, 187, 489–500. [Google Scholar] [CrossRef]
  45. Zhang, T.; Su, P.; Deng, H. Does the Agglomeration of Producer Services and the Market Entry of Enterprises Promote Carbon Reduction? An Empirical Analysis of the Yangtze River Economic Belt. Sustainability 2021, 13, 13821. [Google Scholar] [CrossRef]
  46. Duarte, C.M.; Losada, I.J.; Hendriks, I.E.; Mazarrasa, I.; Marbà, N. The role of coastal plant communities for climate change mitigation and adaptation. Nat. Clim. Change 2013, 3, 961–968. [Google Scholar] [CrossRef]
  47. Liu, Z.; Sun, W. Study on Low-Carbon Technology Investment Strategies for High Energy-Consuming Enterprises under the Health Co-Benefits of Carbon Emission Reduction. Sustainability 2023, 15, 8872. [Google Scholar] [CrossRef]
  48. Weng, Q.; Xu, H. A review of China’s carbon trading market. Renew. Sustain. Energy Rev. 2018, 91, 613–619. [Google Scholar] [CrossRef]
  49. Indonesia Ocean Justice Initiative. Blue Carbon Ecosystem as Critical Natural Capital: Strengthening Blue Carbon Ecosystem Governance in Indonesia; IOJI: Jakarta, Indonesia, 2023. [Google Scholar]
  50. Basyuni, M.; Bimantara, Y.; Siagian, M.; Wati, R.; Slamet, B.; Sulistiyono, N.; Nuryawan, A.; Leidonad, R. Developing community-based mangrove management through eco-tourism in north sumatra, indonesia. IOP Conf. Ser. Earth Environ. Sci. 2018, 126, 012109. [Google Scholar] [CrossRef]
  51. Filbee-Dexter, K.; Wernberg, T. Substantial blue carbon in overlooked australian kelp forests. Sci. Rep. 2020, 10, 12341. [Google Scholar] [CrossRef] [PubMed]
  52. Luu, L.Q.; Cellura, M.; Longo, S.; Sanseverino, E.R. A review on consequential life cycle assessment in the power sector. Int. J. Sustain. Dev. Plan. 2020, 15, 1157–1168. [Google Scholar] [CrossRef]
  53. Yuan, D.; Zhang, L.; Fan, Y.; Yang, R. Investigating spatio-temporal variations and contributing factors of land use-related carbon emissions in the Beijing-Tianjin-Hebei Region, China. Sci. Rep. 2024, 14, 18976. [Google Scholar] [CrossRef]
Figure 1. Mechanism of coupling and coordination between ocean low-carbon economy and carbon emission reduction.
Sustainability 17 04100 g001
Figure 2. Level of integration of marine low-carbon economy system and the components.
Sustainability 17 04100 g002
Figure 3. Personnel and financial investment in marine low-carbon technology-related industries.
Sustainability 17 04100 g003
Figure 4. Integration level of carbon reduction system and its components.
Sustainability 17 04100 g004
Figure 5. Predictions from the ARIMAX model.
Sustainability 17 04100 g005
Figure 6. Sensitivity analysis results.
Sustainability 17 04100 g006
Figure 7. Offshore wind power generation and marine protected area coverage in selected coastal countries (2022).
Sustainability 17 04100 g007
Table 1. Criteria for classifying the degree of coupling coordination.
Interval of Coupling Coordination DegreeLevel of CoordinationType of Coupled Coordination
0~0.11Extremely dysfunctional
0.1~0.22Highly dysfunctional
0.2~0.33Moderately dysfunctional
0.3~0.44Mildly dysfunctional
0.4~0.55On the verge of dysfunction
0.5~0.66Barely coordinated
0.6~0.77Primary coordination
0.7~0.88Intermediate coordination
0.8~0.99Good coordination
0.9~1.010High-quality coordination
Table 2. Evaluation index system of the development level of the marine low-carbon economy.
System LevelCriterion LayerSymbolIndicator LayerAttributeWeight
Marine Low-Carbon Economy Development LevelIndustrial Green TransformationX1Share of value added by marine low-carbon industries ① in regard to the total value added by marine industries (%)+10.09%
X2Average growth rate in the output value of marine low-carbon industries (%)+2.24%
Marine New Energy DevelopmentX3Total installed capacity of ocean energy power plants (KW)+8.82%
X4Newly installed capacity of offshore wind power (MW)+12.09%
Low-Carbon Technology InnovationX5Industry ② marine research and development institutions engaged in scientific and technological activities and number of personnel (people)+11.49%
X6Industry marine research and development institutions and R&D personnel (people)+7.33%
X7Industry marine research and development institutions R&D expenditure (CNY ten thousand)+8.94%
X8Industry marine research and development institutions concerning the number of published scientific papers (articles)+5.21%
X9Industry marine research and development institutions concerning the number of patent authorizations (pieces)+10.81%
Marine Ecological ProtectionX10Marine protected areas (km2)+15.51%
X11Marine monitoring area based on Phytoplankton Biodiversity Index average (-)+7.47%
①: The low-carbon marine industry refers to marine fisheries, marine power industry, seawater utilization industry, marine biopharmaceutical industry, and marine tourism industry. ②: Industries involved in low-carbon technology innovation include those involved in developing marine chemical engineering technology, marine biotechnology, and marine energy development technology. In 2021, China revised the “Classification of Marine and Related Industries”. Starting in 2022, the industry classification has changed, and the detailed subcategories are no longer reported. Therefore, the data in this section are derived by extrapolating data from before and after the merger from 2018 to 2021.
Table 3. Evaluation index system for marine carbon emission reduction effects.
System LevelCriterion LayerSymbolIndicator LayerAttributeWeight
Marine Carbon Emission ReductionCarbon Emission LevelX12Total Carbon Emissions from Marine Industries (million tons) (= Share of Marine Gross Domestic Product in GDP * National Carbon Emission Volume)5.00%
X13Per Capita Carbon Emissions in Coastal Regions (tons/person) (= Total Carbon Emissions from Marine Industries/End-of-Year Total Population in Coastal Regions)1.16%
Carbon Source ControlX14Total Energy Consumption by Marine Industries (million tons of standard coal) (= Share of Marine Gross Domestic Product in GDP * National Total Energy Consumption)13.59%
X15Energy Consumption per Value Added by Major Marine Industries (million tons of standard coal) (= Value Added by Major Marine Industries/National Industrial Value Added * Total Terminal Energy Consumption )10.27%
X16Proportion of Fossil Energy Consumption by Marine Industries (million tons of standard coal) (= Share of Marine Gross Domestic Product in GDP * National Total Fossil Energy Consumption)33.40%
Carbon Emission ReductionX17Public Bus (Trolley) Passenger Volume in Coastal Regions (per million people–times)+10.95%
X18Total Wetland Area in Coastal Regions (ten thousand hectares)+25.63%
①: The main marine industries include the marine oil and gas industry, marine mining industry, marine salt industry, marine shipbuilding industry, marine chemical industry, and marine biopharmaceutical industry. ②: The total terminal energy consumption by the industry is in physical quantities, not standardized quantities. ③: Fossil energy refers to petroleum, coal, and natural gas. ④: Coastal regions in China’s 11 coastal provinces, excluding Hong Kong, Macao, and Taiwan.
Table 4. Results of the coupled coordination analysis of the marine low-carbon economy and carbon emission reduction.
YearCoupling Coordination DegreeType of Coupled Coordination
20120.66Primary coordination
20130.65Primary coordination
20140.60Primary coordination
20150.62Primary coordination
20160.51Barely coordinated
20170.53Barely coordinated
20180.70Intermediate coordination
20190.73Intermediate coordination
20200.72Intermediate coordination
20210.72Intermediate coordination
20220.62Primary coordination
Table 5. Results of the robustness checks.
YearOriginalMedianWeighted Average
20120.6640.6640.664
20130.6520.6520.652
20140.6030.6030.603
20150.6200.6200.620
20160.5110.5110.510
20170.5290.5290.529
20180.7050.7050.705
20190.7270.7270.727
20200.7160.7160.716
20210.7160.7150.716
20220.6210.6200.619
p-value 0.15730.1797
MAE 0.00020.0003
Table 6. Sensitivity coefficients of key indicators.
TypeIndicatorIndicator DefinitionSensitivity CoefficientAttribute
High SensitivityX4Newly Installed Capacity of Offshore Wind Power0.122+
X5Industry Marine Research and Development Institutions Engaged in Scientific and Technological Activities and the Number of Personnel0.115+
X10Marine Protected Regions0.156+
X16Proportion of Fossil Energy Consumption by Marine Industries0.442
X18Total Wetland Area in Coastal Regions0.339+
Low SensitivityX2Average Growth Rate of Output value from Marine Low-Carbon Industries0.023+
X8Industry Marine Research and Development Institutions Concerning the Number of Published Scientific Papers0.052+
Table 7. Bootstrap test and Block Bootstrap test results.
YearDBootstrapBlock Bootstrap
95% CIp-Value95% CIp-Value
20120.66[0.4766, 0.7524]0.0000[0.4618, 0.7591]0.0010
20130.64[0.4755, 0.7493]0.0000[0.4652, 0.7701]0.0010
20140.60[0.4756, 0.7535]0.0000[0.4757, 0.7604]0.0000
20150.63[0.4773, 0.7489]0.0000[0.4618, 0.7579]0.0010
20160.52[0.4763, 0.7508]0.0000[0.4638, 0.7651]0.0010
20170.53[0.4742, 0.7502]0.0000[0.4732, 0.7579]0.0000
20180.72[0.4789, 0.7504]0.0000[0.4606, 0.7553]0.0010
20190.73[0.4756, 0.7521]0.0000[0.4625, 0.7702]0.0010
20200.73[0.4768, 0.7556]0.0000[0.4733, 0.7516]0.0000
20210.70[0.4748, 0.7656]0.0000[0.4695, 0.7654]0.0010
20220.62[0.4772, 0.7498]0.0000[0.4720, 0.7664]0.0010
Table 8. Final classification results.
TypeEconomic ScaleResource EndowmentIndustrial StructureIncluded Provinces
High Economy–High Resources–High StructureHighHighHighGuangdong
High Economy–High Resources–Low StructureHighHighLowJiangsu, Shandong
High Economy–Low Resources–High StructureHighLowHighShanghai
High Economy–Low Resources–Low StructureHighLowLowTianjin, Zhejiang, Fujian
Low Economy–Low Resources–High StructureLowLowHighGuangxi, Hainan
Low Economy–Low Resources–Low StructureLowLowLowHebei, Liaoning
Table 9. Grey relational analysis results for external factors.
External FactorsGrey Relational GradeRank
MI0.92652
CER0.83385
LP0.91693
MS0.96441
HAB0.85234
ETS0.75136
Disclaimer/Publisher’s Note: The statements, opinions and data contained in all publications are solely those of the individual author(s) and contributor(s) and not of MDPI and/or the editor(s). MDPI and/or the editor(s) disclaim responsibility for any injury to people or property resulting from any ideas, methods, instructions or products referred to in the content.

