Article

Sweet Liquid Gold Facing Climate Change and Sour Market Conditions: A Strengths, Weaknesses, Opportunities, and Threats (SWOT) Analysis of the United States Maple Syrup Sector

1
Department of Community Development and Applied Economics, University of Vermont, Burlington, VT 05405, USA
2
Food Systems Research Center, University of Vermont, Burlington, VT 05405, USA
3
University of Vermont Extension, Burlington, VT 05401, USA
*
Author to whom correspondence should be addressed.
Sustainability 2025, 17(9), 4101; https://doi.org/10.3390/su17094101
Submission received: 4 March 2025 / Revised: 22 April 2025 / Accepted: 26 April 2025 / Published: 1 May 2025

Abstract

:
This study reviews the development of the U.S. maple syrup industry, assesses its strengths, weaknesses, opportunities, and threats (SWOT), and derives recommendations for the industry to attain a more sustainable development. While the industry faces the challenges of increasing yield and production volatility, a downward trend in producer prices since 2008, increasing competition from imports, and impacts of trade policies, etc., it needs innovative strategies to turn its weaknesses and threats into strengths and opportunities. Major recommendations, based on a comprehensive review of the industry’s development and trends and a SWOT analysis, include establishing a national or regional producer governance organization, similar to the Quebec Maple Syrup Producers (QMSP) or the American Honey Producers Association, to advocate for maple syrup producers on issues like trade policies, quality standards and certification, environmental regulations, and to enhance maple syrup producers’ market power, increasing the investment and adoption of climate-resilient technologies, developing more value-added maple syrup products according to consumer preferences and demand, and strengthening the marketing and promotion efforts of industrial organizations, government agents and private enterprises through collaboration for the goal of increasing the demand for U.S. maple syrup in the domestic and foreign markets.

1. Introduction

Maple syrup is a non-timber forest product predominately produced in Eastern Canada and northeastern United States. It has been an iconic symbol of this region’s agriculture, food, landscape, community, culture, heritage, and trade [1,2]. This unique product, made from maple sap through boiling and evaporation, has been progressively transformed from a local sweetener into a globally recognized product with remarkable economic contributions [3,4,5,6,7,8,9]. For example, maple syrup production generated 12,582 full-time jobs and contributed 1.13 billion Canadian dollars to the Canadian GDP in 2022 [10]. In the United States, while the annual production value of maple syrup has been only between USD 150 and USD 210 million in recent years [11], it has been a vital economic sector in several northeastern states and provided a significant source of employment and income for many rural communities through direct, indirect, and induced contributions [2,4,12,13,14]. For example, Becot et al. estimated the maple industry’s total economic contribution in Vermont to be USD 330 million in 2013, with the direct, indirect, and induced contributions to be USD 222 million, USD 61 million, and USD 47 million, respectively [4]. While Vermont has been the largest maple syrup producer in the United States and accounts for about 50% of the national production, the other major producers include New York, Maine, and Wisconsin [11].
Maple syrup production has helped many farmers diversify their production, manage risks, make seasonal use of land and labor resources, and develop a retirement income [15]. In addition to its economic contributions, maple syrup production has been considered a lifeline for many rural communities as it promotes positive family experiences, strengthens connections to the land, and fosters a sense of historical continuity [14,15,16]. Maple syrup also has nutritional and flavor importance and applications and has been increasingly used as a unique ingredient in the food industry around the world [17]. For example, DSM-Firmenich, a leading global provider of nutrition, health, and beauty solutions, announced in December 2024 “milky maple” as its flavor of the year for 2025 due to maple syrup’s special taste and rise as a versatile ingredient in Europe and Asia in recent years [18].
While the history and development of the U.S. maple syrup industry are well documented in the literature, dating back over 100 years [6,14,15], the time series data on U.S. and Canadian maple syrup production since 1975 (in 1000 U.S. gallons), presented in Figure 1, suggests three major findings: First, maple syrup production in the United States fluctuated around 1.25 million gallons from 1975 to 2007 but has increased since 2008 and reached a record high of 5.99 million gallons in 2022. Second, Canadian maple syrup production has shown a upward trend since 1975 but with significant variations over time. Third, while the share of U.S. maple syrup production in the combined total production of the United States and Canada decreased from a record high of 36.75% in 1975 to a record low of 11.03% in 2000, it has shown an upward trend since 2000 and reached 24.40% in 2023 and then dropped to 21.38% in 2024.
The rapid growth in maple syrup production in Canada and the United States in the past four decades is largely due to the adoption of new technologies. For example, the use of plastic tubing systems in sap collection has not only increased the efficiency of sap collection but also significantly reduced the labor and material costs as compared to the traditional methods via metal spouts, pails, and gathering tanks [20,21,22,23,24]. While flexible plastic tubing systems were developed and introduced in the 1950s and 1960s, they have been improved and widely adopted over the past four decades. The key improvements include modifications to the fittings used to connect different pieces of the tubing systems as well as the introduction of vacuum pumps. The systems of plastic tubing with vacuum pumps have made it feasible to collect sap under weather or geographic conditions that would not be technically or economically feasible under traditional sap collection methods. For example, the vacuum tubing system can leverage the physics of sap flow by creating an ideal atmospheric pressure within the tubing system and tap holes [25,26].
As another new technology, reverse osmosis (RO) has been widely used to remove water and increase the sugar concentration in maple sap before the sap enters the evaporator. Specifically, the RO machine pumps raw sap through a series of membranes that separate the sugar molecules from water, increasing the sugar level from about 1.5° to 2.0° Brix to 8° to 20° Brix [26]. This process can significantly reduce the time and energy cost of producing maple syrup from maple sap. Adopting these technologies has brought about significant reductions in both start-up investment and operating costs. For example, Huyler and Garret found that the investment cost was 16% lower per tap for a plastic tubing sap collection system compared to a metal bucket collection scheme. The study also reported that the new system reduced the labor used in sap collection by 22% and increased the sap yield by 28% compared to the traditional metal bucket system [27].
Despite significant technological advancements and production growth, the U.S. maple syrup industry faces many challenges. For example, while climate and weather changes have increased the volatility of sap yield and maple syrup production [28,29], economic and market factors have resulted in a downward trend in the average price received by U.S. maple syrup producers since 2008 [9]. With increasing production costs, the decrease in producer price has caused economic challenges for many maple syrup producers, especially small-scale producers. Global geopolitical conflicts and trade wars, like the Russia–Ukraine war and the U.S.–China trade disputes and retaliations, have also caused fluctuations in U.S. maple syrup exports and created challenges in accessing key input supplies such as glass containers from the global markets.
While there is a growing need for information and innovative strategies for the U.S. maple syrup industry to address the challenges and move towards more sustainable development, the major purpose of this study is to review the industry’s development, assess its strengths, weaknesses, opportunities, and threats (SWOT), and derive economic and policy recommendations for its sustainable development. Specifically, this study will address three major research questions: First, what are the industry’s major challenges and the contributing factors? Second, what can we learn from a comprehensive SWOT analysis of the industry? Third, what are the potential actions for the industry to turn its weaknesses and threats into strengths and opportunities and to achieve more sustainable development?
This paper is organized into six sections: Following the Introduction Section, Section 2 describes the data sources and analysis methods, Section 3 analyzes the major challenges faced by the U.S. maple syrup industry and the contributing factors, Section 4 presents the major findings from the SWOT analysis, Section 5 discusses the potential strategies for the industry as well as the major limitations of this study, and Section 6 summarizes this study with concluding remarks.

2. Data Sources and Analysis Methods

The primary data sources for this study are the U.S. Department of Agriculture National Agricultural Statistics Service (USDA NASS) and Statistics Canada. Both government agencies have published significant amounts of time series data on maple syrup as an important agricultural commodity in the two nations. The authors made great efforts to check data consistency from alternative government publications and websites. For example, the annual data published by USDA NASS every June in recent years has been updated and revised in the following year’s publication, and such updates and corrections have been incorporated into the data used in this study [11]. Also, the different units used in the two nations have been converted to be the same. For example, Canada uses “imperial gallon” and one imperial gallon is equal to 1.2 U.S. gallons. The production quantity used in this paper is in U.S. gallons for both the United States and Canada. In addition to data from USDA NASS and Statistics Canada, data from Quebec Maple Syrup Producers (QMSP) as the largest maple syrup producers association in the world, previous studies, and information collected through interviews and focus groups of maple syrup producers and other stakeholders of the industry are also used in this study.
The above data were analyzed to trace the U.S. maple industry’s development, examine the major challenges, assess its SWOT, and derive economic and policy recommendations for its sustainable development using both quantitative and qualitative methods. For example, while a graphic analysis of the time series data was conducted to trace the development and analyze the challenges, a SWOT analysis was conducted using information from a comprehensive literature review and inputs from many maple syrup producers, processors, organization leaders, and other stakeholders of the industry.
SWOT analysis is a strategic planning and management technique widely used to help a business, an industry, or an organization identify its SWOT and develop strategies for changing its weaknesses and threats into strengths and opportunities [30,31]. The major procedures of a typical SWOT analysis include defining the study objective, gathering quantitative and qualitative data, identifying the internal strengths and weaknesses and external opportunities and threats, and developing feasible strategies and their implementation plan. While the development, theoretical framework, advantages and disadvantages of SWOT analysis as a well-documented method are not included in this article, please see Gurel and Tat (2017) for a comprehensive review of SWOT analysis in a historical, theoretical, and application perspective as well as its advantages and disadvantages [31].

3. Major Challenges Faced by the U.S. Maple Syrup Industry

This section examines major challenges faced by the U.S. maple syrup industry and the contributing factors through a literature review and some graphic analyses.

3.1. Weather and Climate Change

Maple sap production heavily depends on seasonal climate patterns and discrete daily weather patterns during the harvest season, Historical data suggests that the variations in both sap production and yield in all major production regions were closely related to the variations in weather and climate conditions [32,33]. Weather and climate change have affected and will continue to impact the maple syrup sector in three keyways: First, global warming can disrupt the freeze–thaw cycles and, therefore, shorten the critical sap collection periods and reduce maple syrup production [34,35,36,37]. For example, while Skinner et al. reported shorter sap flow periods even if the conventional tapping period remained unchanged [37], Guilbert et al. predicted a decrease of 7–11 days in suitable maple syrup production period by the end of this century in the Lake Champlain Basin [35]. Studies have also shown that warmer temperatures have decreased the sugar concentration in maple sap and therefore affected the sap boiling process, syrup quality, and yield. For example, Garcia et al. found that the changes in sap chemical composition 30 days before leaf emergence were linked to microbial activity and rising temperatures [34]. They linked rising temperatures to a significant decrease in sucrose levels and a significant increase in mannitol levels and such impacts likely influenced the flavor of maple syrup negatively [34].
Second, rising temperatures can affect where maple syrup is produced and increase the risk of wildfires, non-native species invasion, and pest and disease outbreaks in sugarbushes [38,39,40,41]. For example, the U.S. Forest Service has projected that the ideal habitat for sugar maples will shift northward into Canada due to climate warming and this shift is expected because warming temperatures will disrupt the current optimal conditions for maple sap flow, making the southern portions of the sugar maple’s range less suitable for sugar maples [42]. The increasing frequency of wildfires, non-native species invasion, and pest and disease outbreaks in the maple production regions has been linked to climate change and is considered a significant threat to the maple industry [38,39,41,43,44]. For example, Haynes et al. reported that the average annual temperature had a much greater impact on the extent of pest and disease outbreaks than the average yearly precipitation [39]. While insects can bore holes in maple trees, leading to short-term or chronic stress and consequently reducing sap yield and quality, pests can also cause forest defoliation. Such problems can result in decreased transpiration, higher tree mortality, slower forest tree growth rates, increased soil leaching losses, reduced nutrient uptake, and higher soil moisture and temperature [45,46,47,48]. Garske reported that Asian Longhorn Beetles (ALBs) could threaten maple trees as ALBs attack maple, horse chestnut, elm, birch, aspen, and willow trees [45].
Third, increased extreme precipitation events like heavy rainfall, icing, and flooding can damage tree branches and interfere with sap collection systems, especially when accompanied by high wind speeds. While a study of precipitation data from the northeastern United States from 1895 to 2020 revealed a rise in extreme precipitation percentiles [49], Guilbert et al. projected an annual rise of 9.1 to 12.8 mm per decade in this 21st century of extreme precipitation. This trend could impact flooding, infrastructure, and water management [35]. Furthermore, diminished snowpacks due to climate change can result in deep soil frost and therefore affect the root systems and tree growth. In addition, soil moisture and temperature alterations may also change species composition in forests, ultimately impacting ecosystem health and sap production. Changes in soil moisture and temperature can additionally influence nutrient cycling, tree health, and sap yield [35,36,39]. For instance, Guilbert et al. suggested that annual snowfall in the Lake Champlain basin might drop by 46% by the late 21st century [35]. Logan et al. projected a significant decrease in snow cover duration [36]. Therefore, these changes can shift species composition in forests, ultimately affecting ecosystem health and sap production [36].

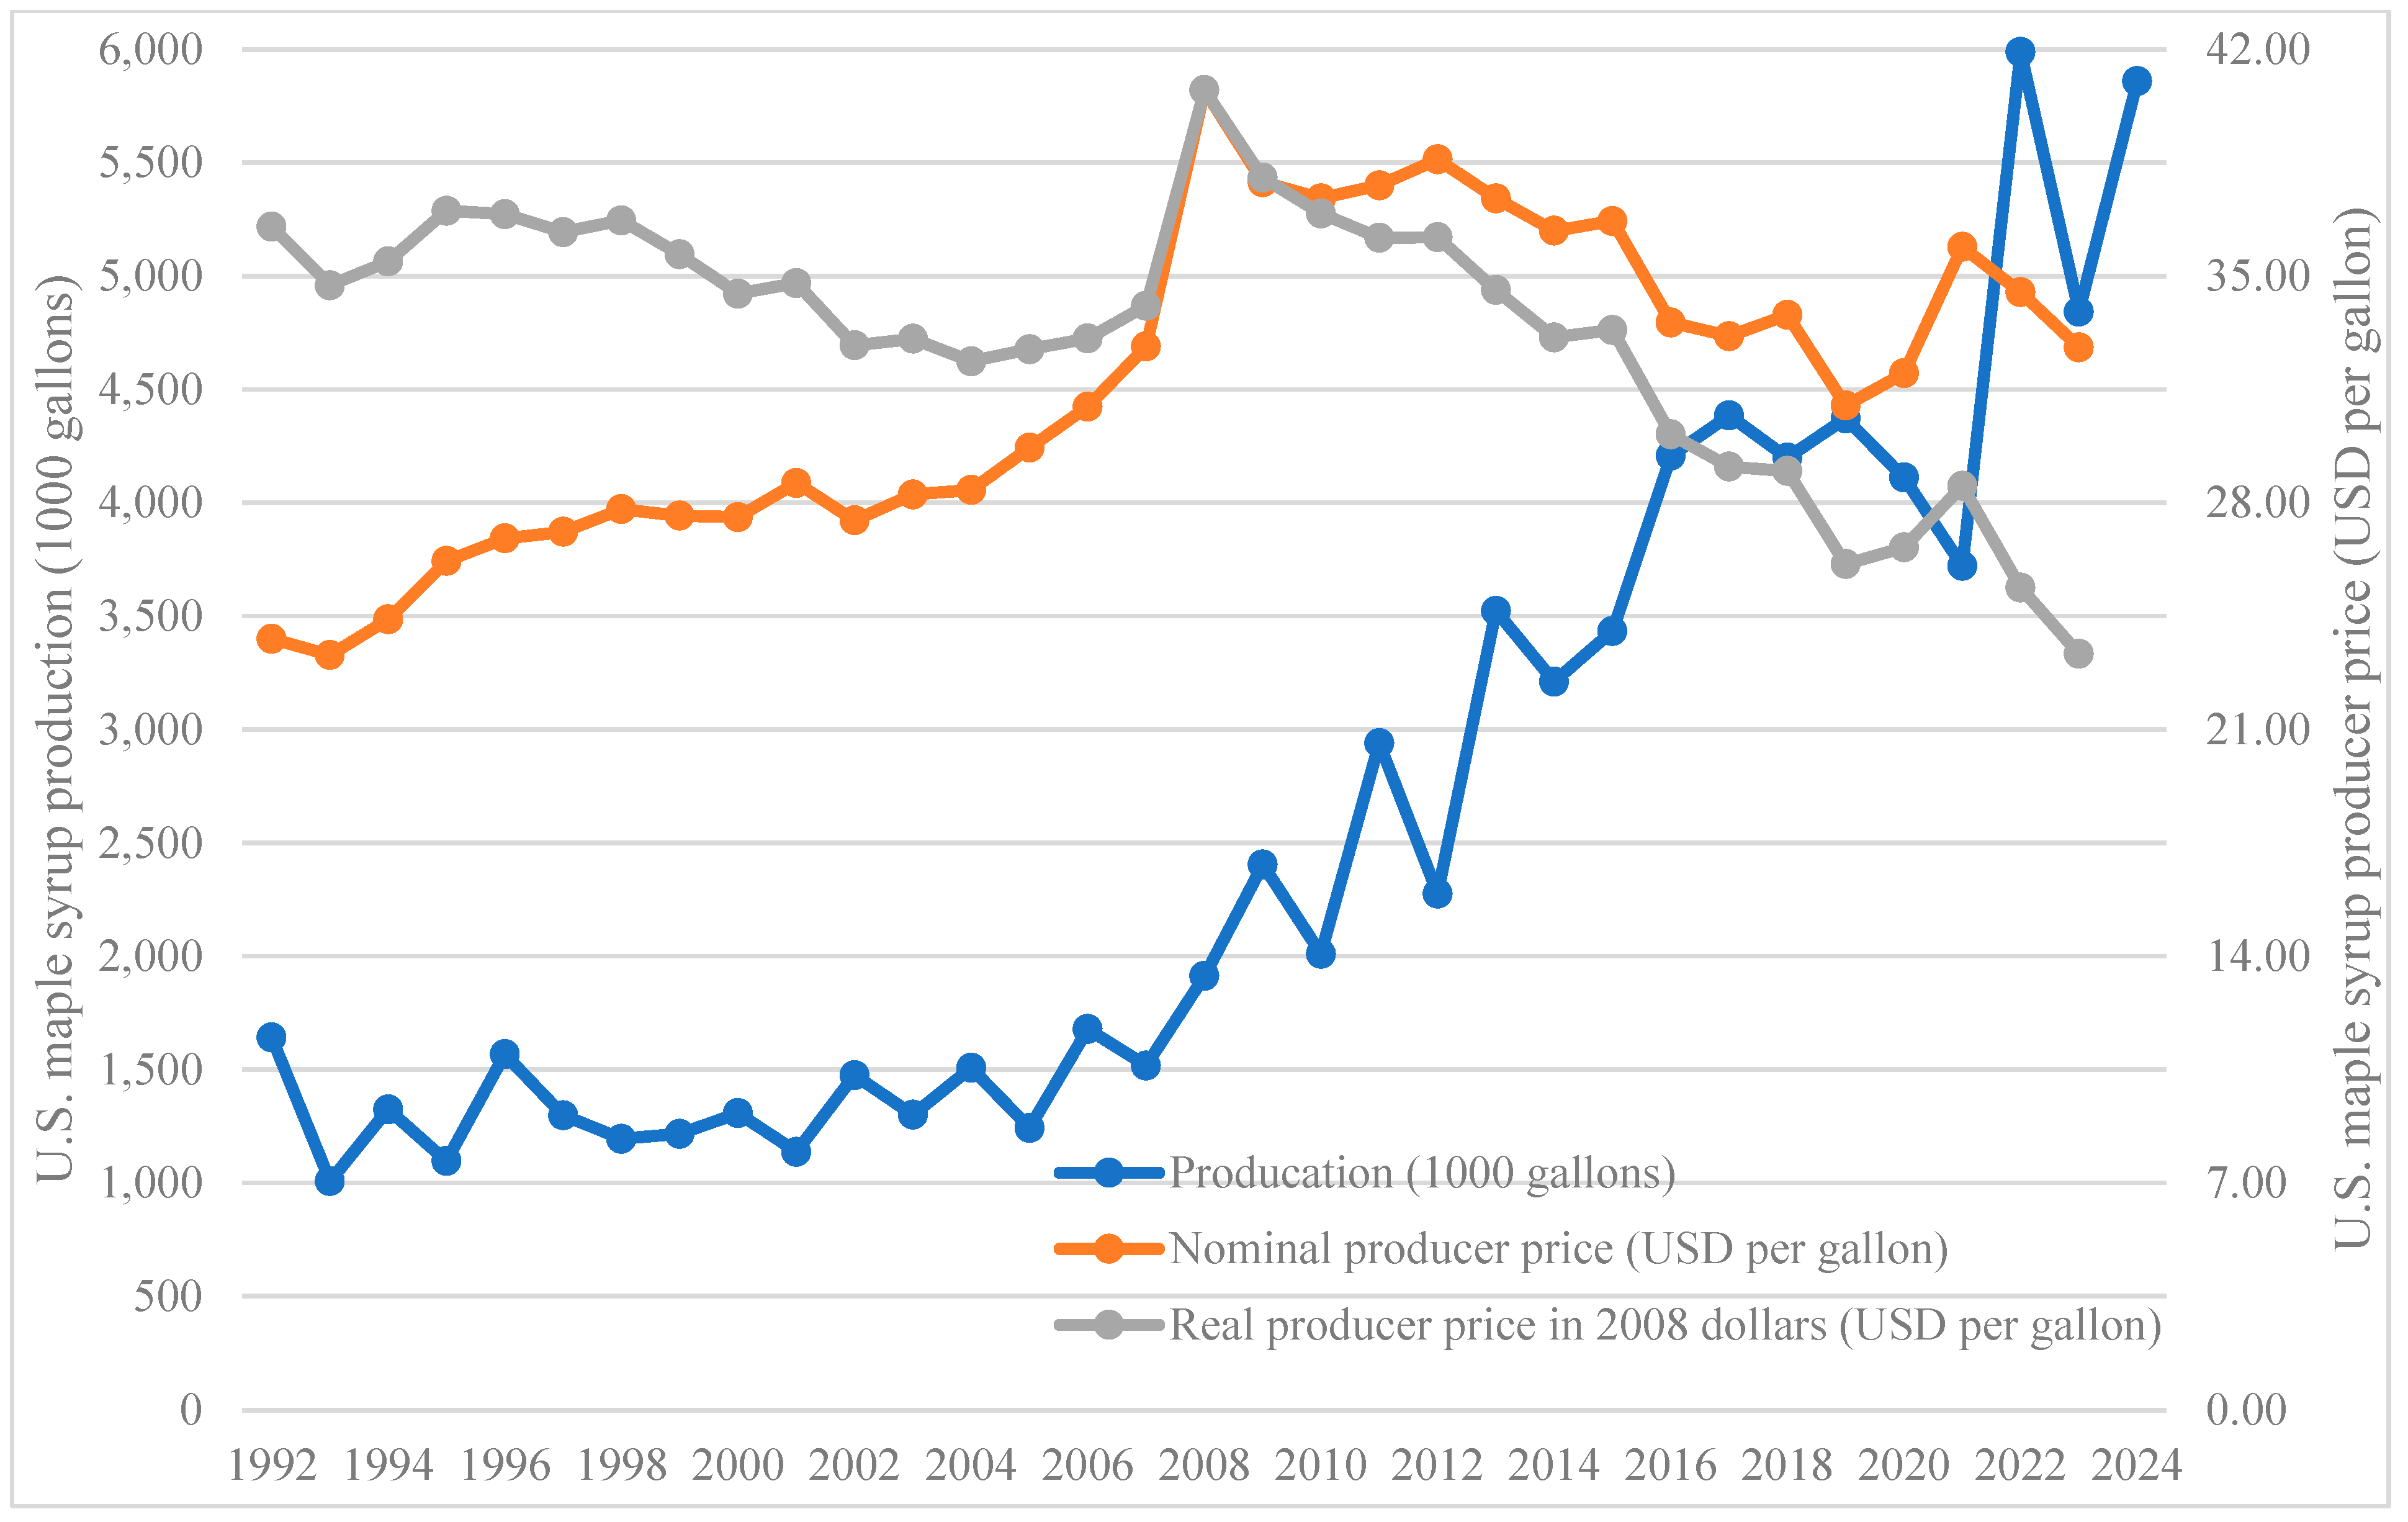
3.2. Downward Trends in Producer Price

As shown in Figure 2, following an increasing trend in both production and average nominal producer price from 1992 to 2008, U.S. maple syrup production continued its increasing trend after 2008, except for the significant drops in 2020 and 2021 due to poor sugaring weather. On the contrary, the average nominal producer price has shown a downward trend since 2008, except for 2020 and 2021. The downward trend in average producer price since 2008 is more apparent when the nominal price is converted into the real price in 2008 dollars. For example, when the nominal producer price dropped from USD 40.74 per gallon in 2008 to USD 32.80 per gallon in 2023, the real producer price in 2008 dollars declined from USD 40.74 to USD 23.33 per gallon over the same period. Figure 2 further suggests that the average producer price tended to increase in the years with lower production and decrease in the years with higher production.
Although the average producer price for 2024 is not available yet, the significant increase in maple syrup production in 2024 suggests that the average producer price in 2024 was likely lower than that in 2023. This pattern is consistent with the economic principle of how market supply and demand interact to determine the market price. The downward trends in the average price received by U.S. maple syrup producers since 2008 are mainly due to three factors: First, as shown in Figure 1, maple syrup production in the United States and Canada has increased significantly in the past three decades but the increase in demand volume has not matched the increase in supply. Second, while the QMSP has implemented multi-year price stabilization programs and other supply side interventions [50], the multi-year pricing agreements have not responded to increasing inflation rates in a timely manner, resulting in a decrease in real producer prices for many years. The U.S. bulk maple syrup producers are selling to larger processors that must compete with the prevailing prices of imported Canadian maple syrup. This factor will be discussed in more detail in the next two subsections. Third, agricultural research and development in the United States have primarily focused on increasing farm production and productivity and made relatively limited efforts on increasing the demand for U.S. farm products and improving farmers’ income and economic viability. As a result, many American farmers, including maple syrup producers, have become more and more productive but received less and less for their products from the marketplace. This has been a typical problem for many U.S. agricultural sectors such as dairy, corn, poultry, and tree nuts [50].
Figure 2. U.S. maple syrup production and producer price, 1992–2024. Data sources: Production and nominal price from USDA NASS [11] and the real price is calculated by the authors using the normal price and Consumer Price Index (CPI) from the U.S. Bureau of Labor Statistics [51].
Sustainability 17 04101 g002
As U.S. maple syrup production is likely to maintain the increasing trend, a significant challenge for the industry is to increase the demand for U.S. maple syrup in the domestic and foreign markets to reverse the downward trend in producer price and to reduce its fluctuations over time [4,6,12].

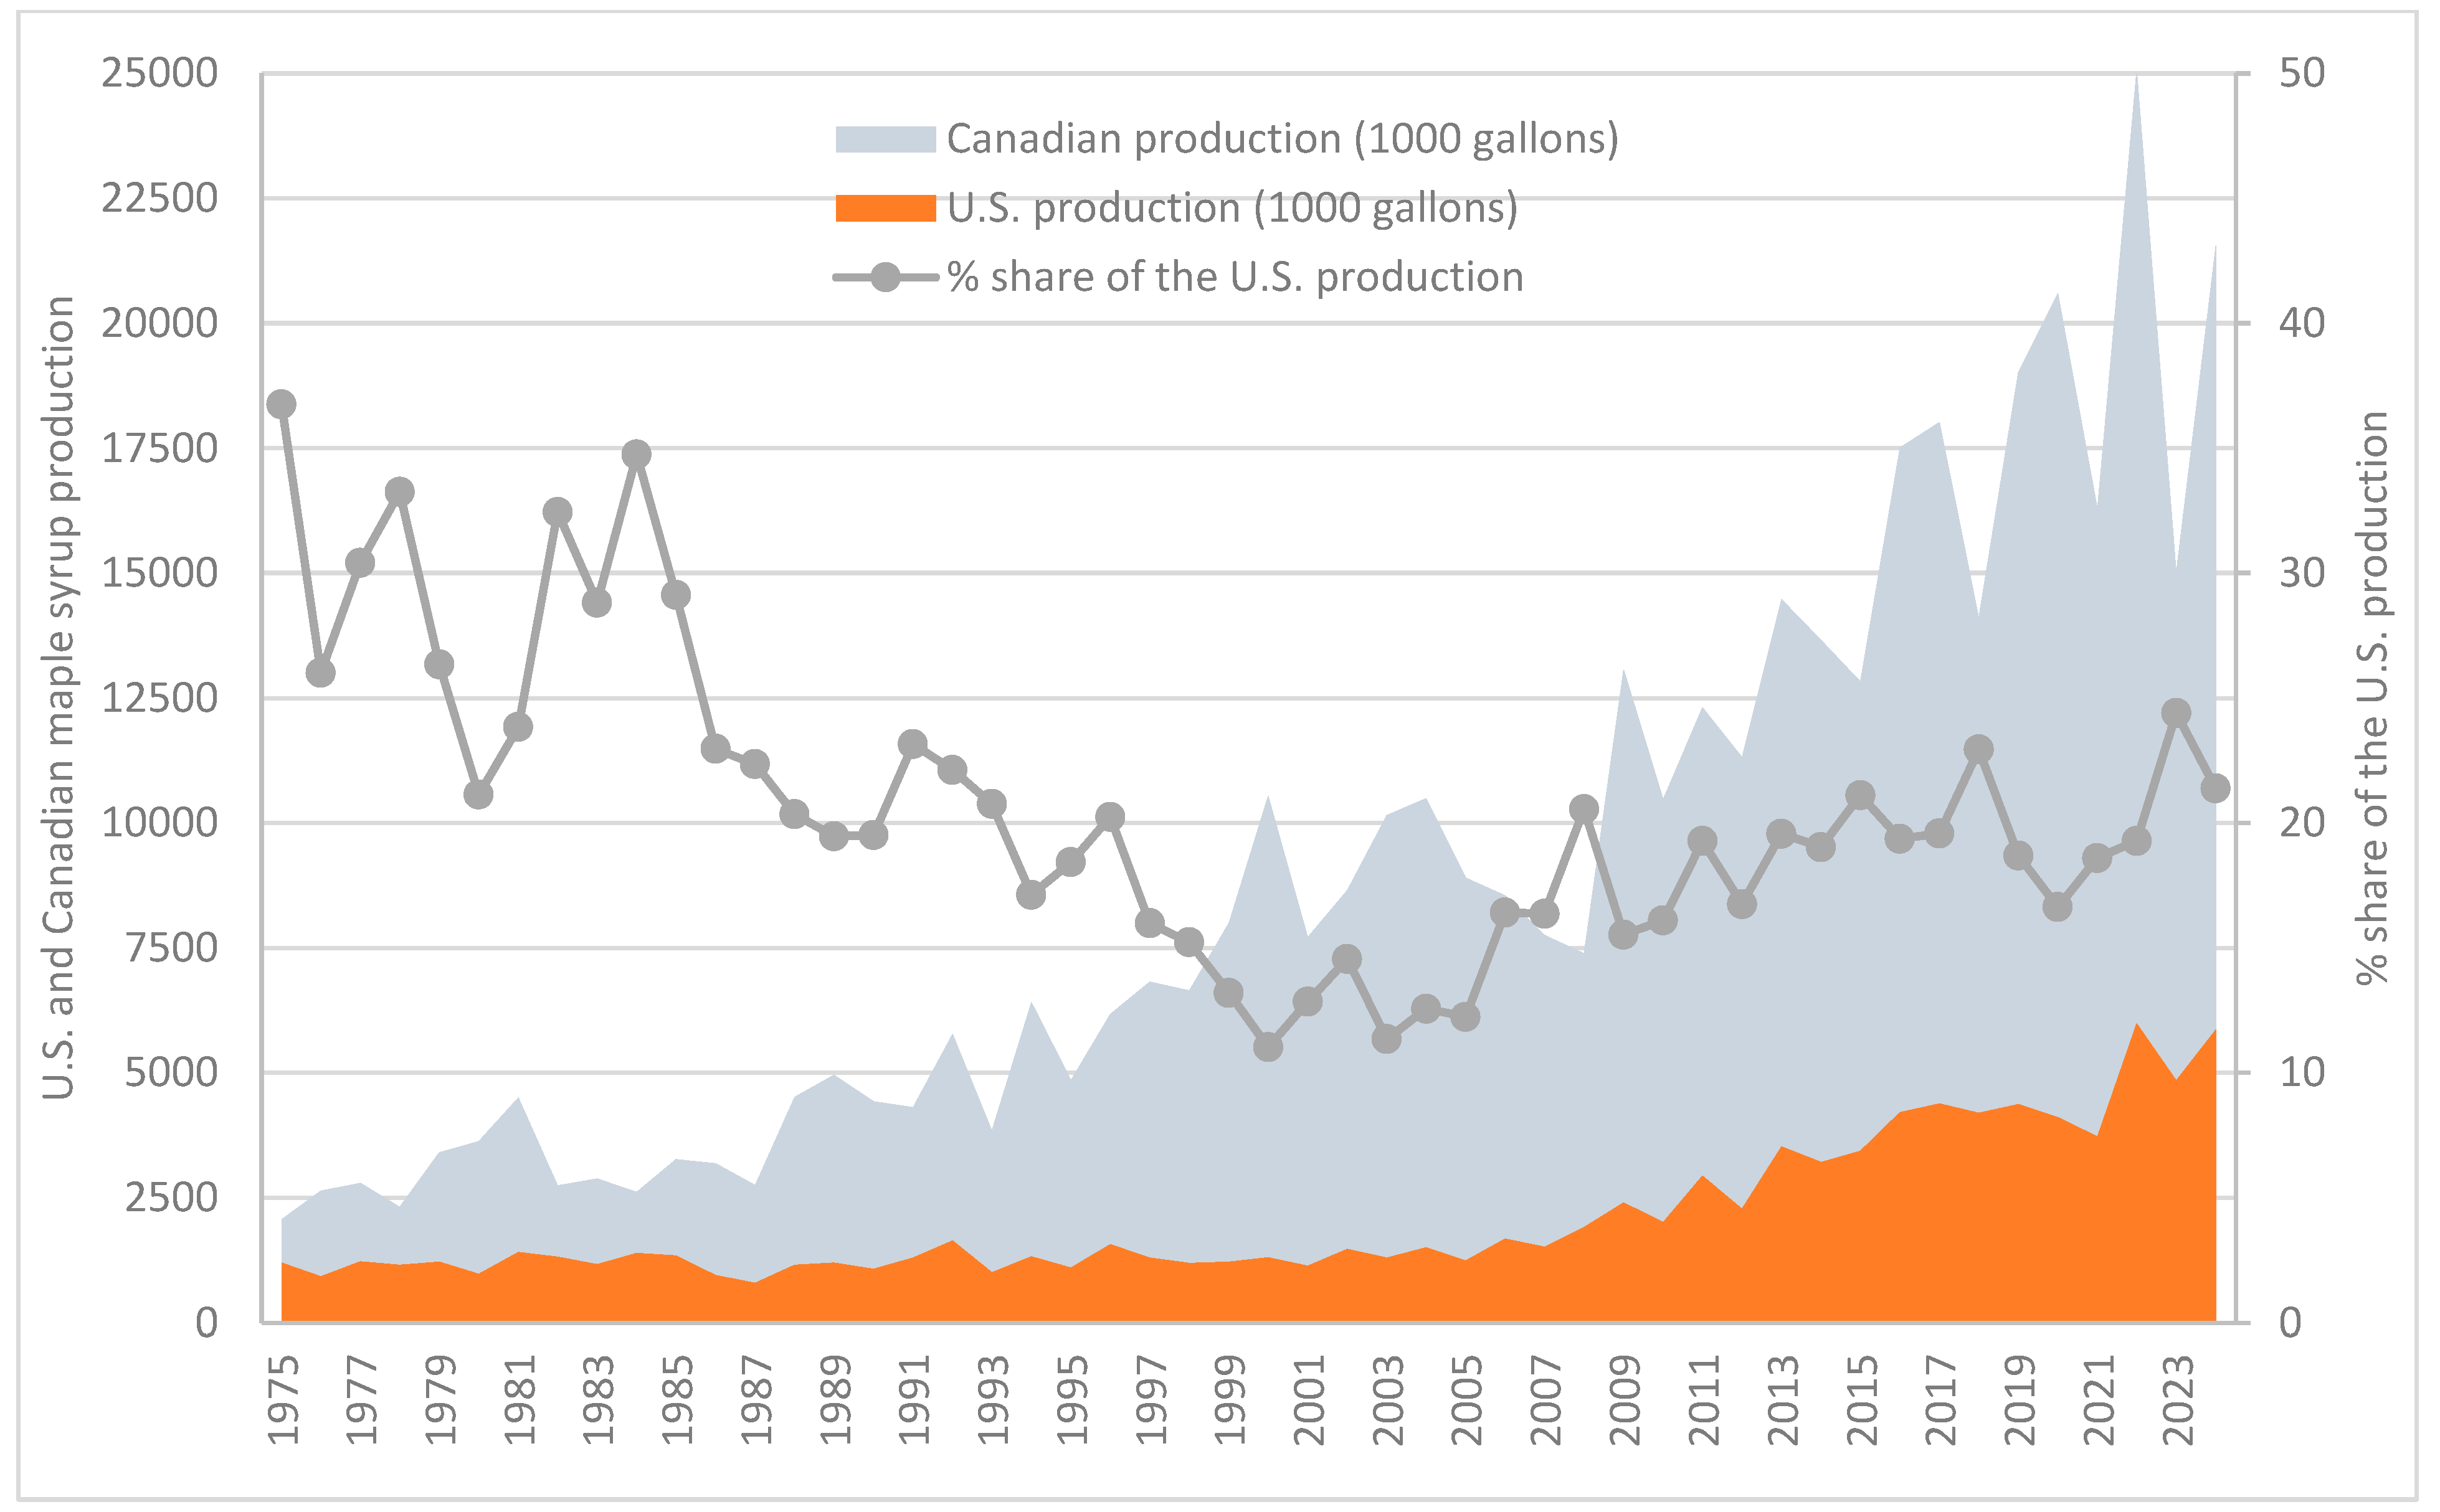
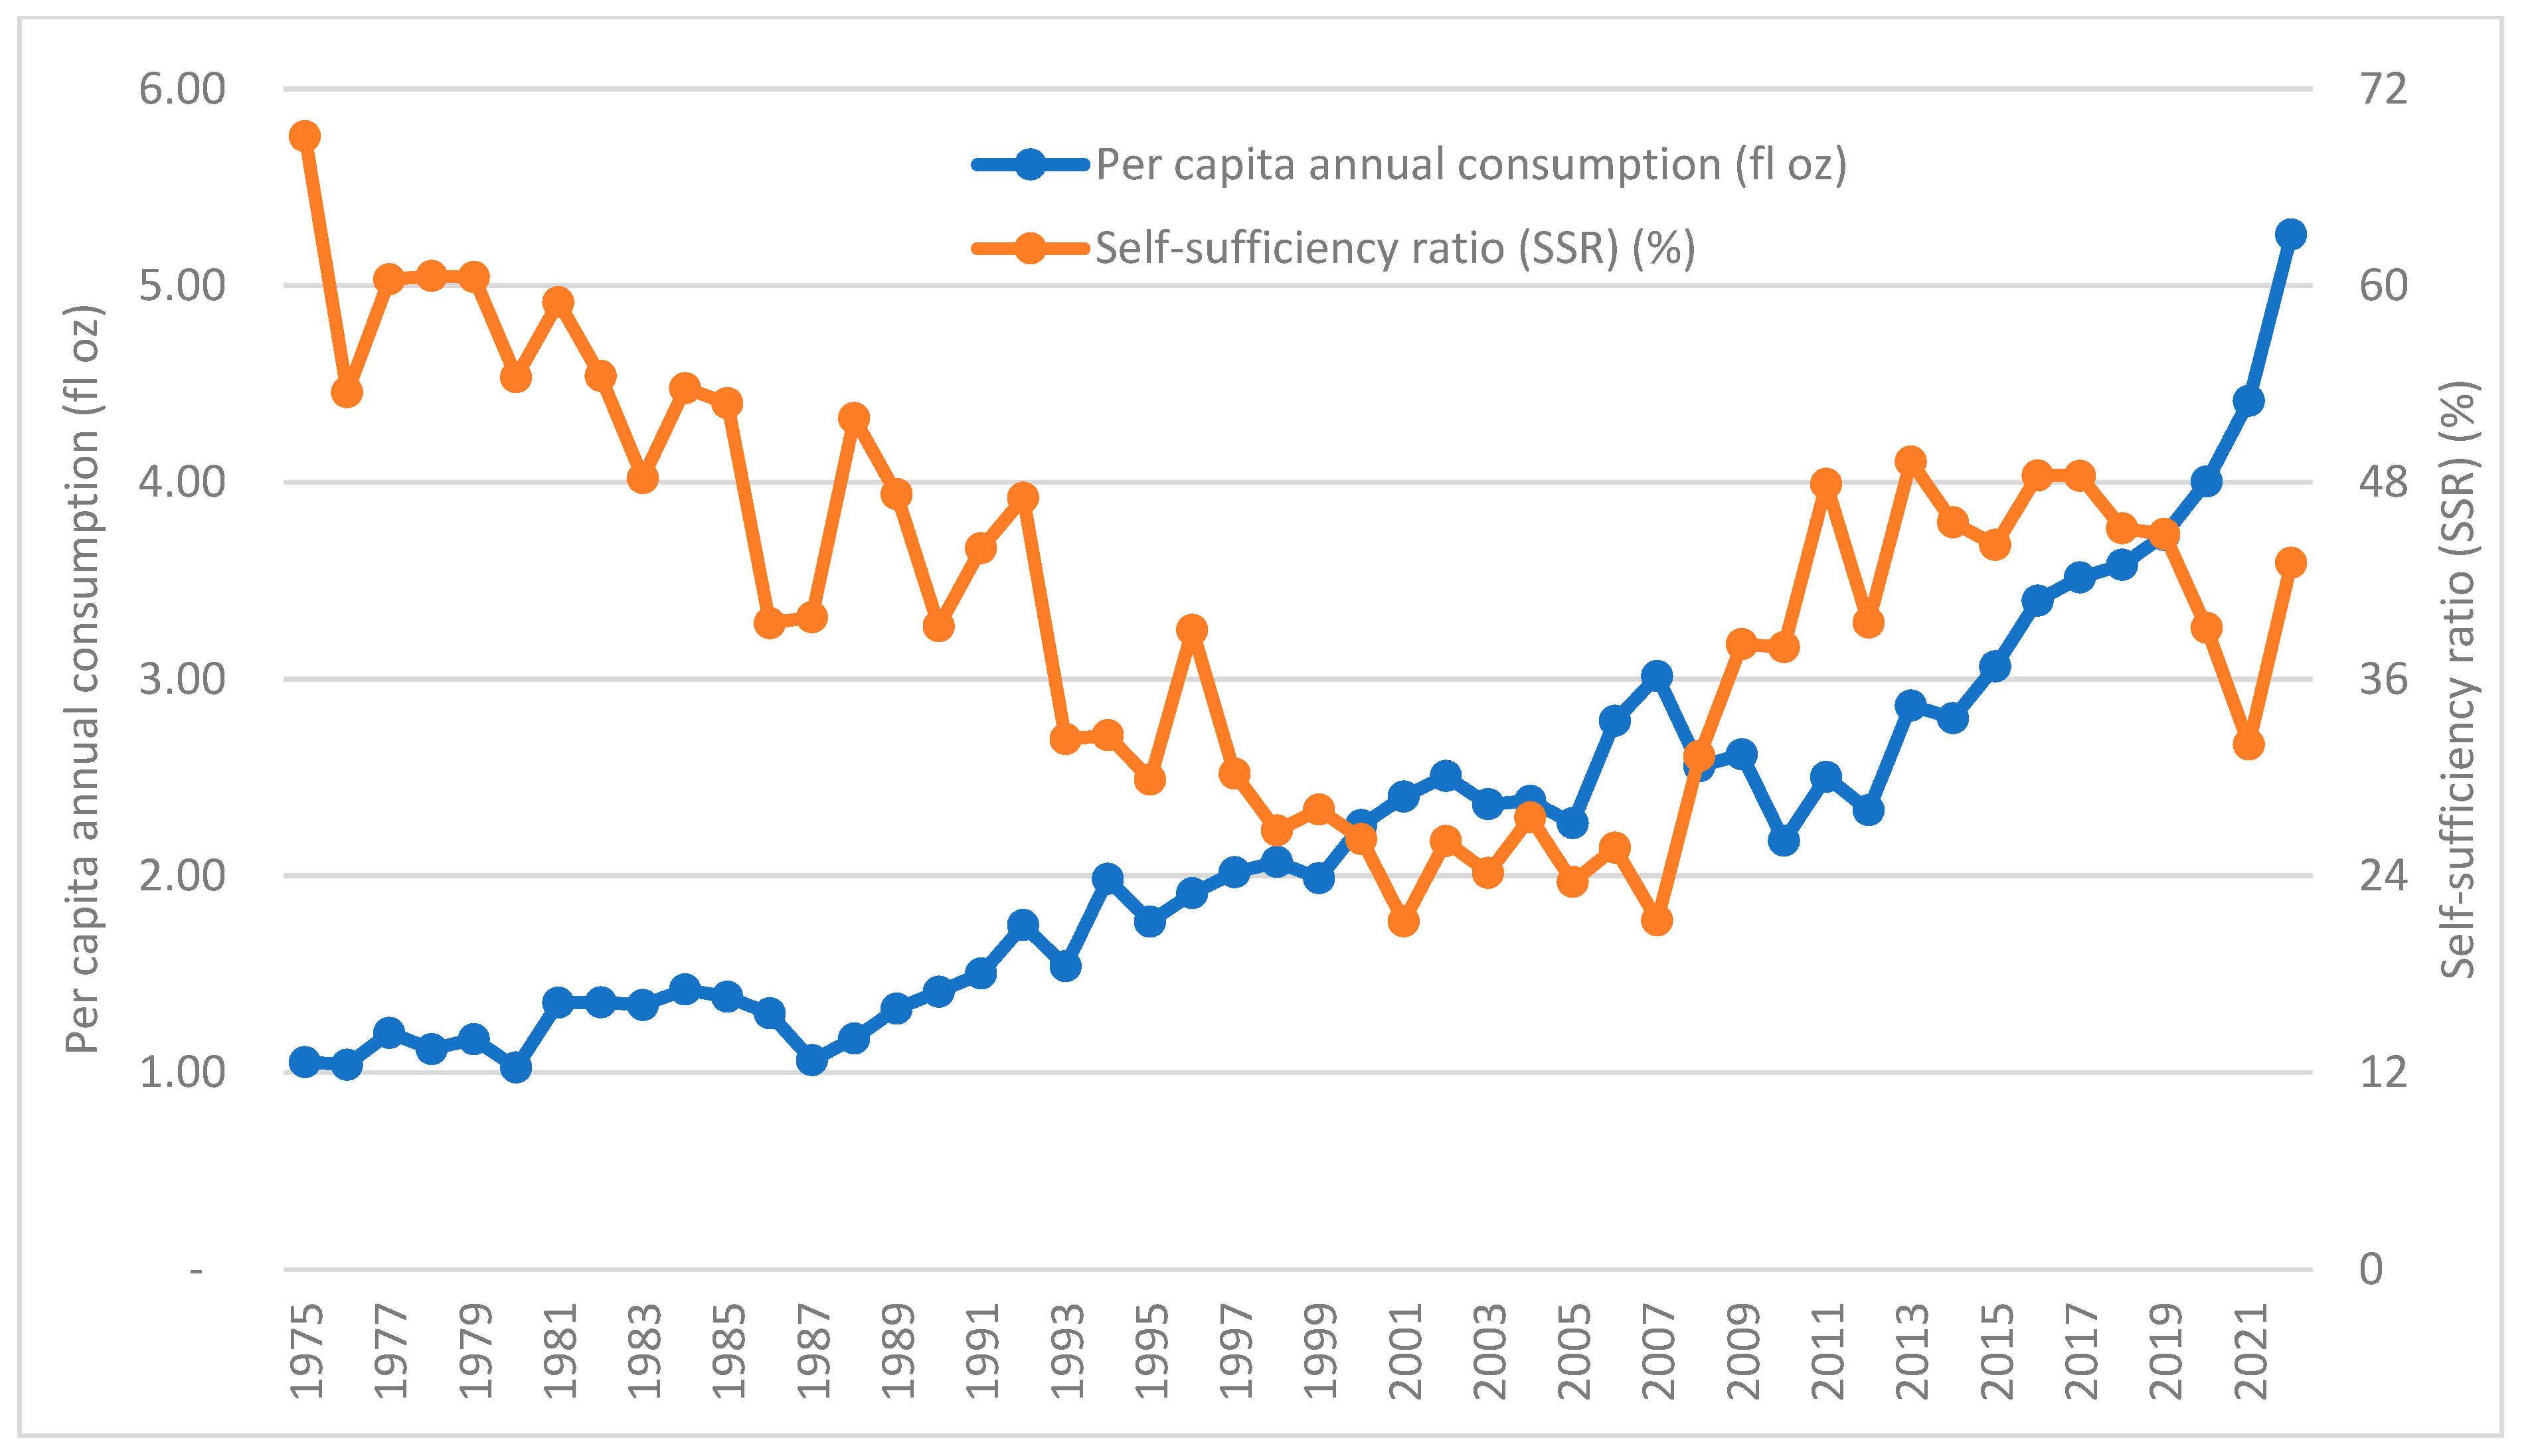
3.3. Dependence on Imports

While the United States has been the world’s second-largest maple syrup producer, just behind Canada, it has also been the world’s largest consumer and importer. Data presented in Figure 3 indicates that the per capita annual maple syrup consumption in the United States increased steadily from 1.05 fluid ounces in 1975 to a record high of 5.26 fluid ounces in 2022. On the other hand, the self-sufficiency ratio (SSR), which measures the percentage of domestic consumption met by domestic production, declined significantly from 69.1% in 1975 to a record low of 21.27% in 2007, reflecting an increasing reliance on imported maple syrup over the period. Although the SSR increased significantly after 2007 and reached a high level of around 48% in 2011, 2013, 2016, and 2017, it dropped steadily from 2017 to 2021 before the significant increase in 2022. According to Canadian agricultural statistics, Canada’s maple syrup exports to the United States increased steadily since 2018, from 250 million Canadian dollars in 2018 to 381 million in 2022, representing an average annual growth rate of 11.07% [19].
Although the United States has made efforts to expand its maple syrup exports, its exports have been very limited in terms of both quantity and market share. For example, U.S. exports have accounted for less than 5% of global maple syrup exports in recent years [19]. While the United States has been a large exporter of many food products such as soybeans, dairy products, and pork, its high level of dependence on maple syrup imports has been widely considered a threat to the sustainable development of its maple syrup industry [9]. With an abundance of untapped sugar maple trees [6], one challenge faced by the U.S. maple syrup industry is increasing its production and market shares in the domestic and foreign markets.

3.4. Lack of Market Power for U.S. Maple Syrup Producers

Quebec has established dominance in the bulk market of maple syrup because of its scale of production, price stabilization through QMSP, and historical currency exchange rate trends that create a competitive advantage for its exports. While QMSP accounts for over 65% of global maple syrup output, it has successfully expanded its production while trying to stabilize the price paid to its members. The latest addition of 14 million new taps authorized in Quebec for 2021 to 2026 is equivalent to approximately 80% of the current active taps in production in the United States in 2024, demonstrating the magnitude of rapid expansion in Quebec that ensures Canadian market share leadership. Also, maple producers in Quebec have access to the Advanced Payments Program (APA), which offers up to 48.5% of a producer’s maple syrup revenue in advanced interest-free capital to initiate expansion investments. The program is subsidized by contributions from the QMSP [52].
QMSP has adopted price-setting strategies to benefit its members. For example, QMSP has undertaken routine negotiations to agree upon a multi-year pricing structure for producers. By establishing a two or three-year price agreement, producers have reduced market volatility and enhanced their ability to predict future business revenue [53,54,55]. This transparent and multi-year pricing system offers predictability for QMSP, its members, and its domestic or global buyers [6,7,10,52]. Another example of QMSP influence is reflected in its market development initiatives and the significant increase in per capita maple syrup consumption in Canada. In contrast to the U.S. per capita consumption of 5.26 ounces in 2020, the corresponding value reached 49.0 ounces in Quebec and 21.8 ounces in Canada in the same year [56].
Currency exchange rates between the U.S. dollar and Canadian dollar represent another chronic vulnerability of U.S. maple producers in the context of U.S. dependence on Canadian syrup imports. The traditionally stronger U.S. dollar enables U.S. retail companies to purchase Canadian maple syrup at a relatively lower cost than domestic maple syrup. In response, U.S. bulk maple syrup purchasers are forced to adjust their stated farm-gate prices offered to U.S. producers according to the current or projected currency exchange rate to stay competitive with imported maple syrup [57].
Maple syrup producers in the United States have suffered from limited access to programs such as federal crop insurance and government support credit access that are available to Canadian maple syrup producers. The Canadian government has actively supported maple syrup producers through cost-sharing programs and offers lower lease rates for public lands. The U.S. maple syrup industry is predominantly organized through state producer associations. No single national representative body has been established although several state organizations have representatives in the North American Maple Syrup Council and the International Maple Syrup Institute that represent maple syrup producers in both Canada and the United States.

4. A SWOT Analysis of the U.S. Maple Syrup Industry

As introduced in Section 2, SWOT analysis as a strategic planning and management tool has been widely used to identify the internal strengths and weaknesses and external opportunities and threats of an organization, a product or an industry and develop strategies on how to turn the weaknesses and threats into strengths and opportunities [31,32,58]. The methodology has been employed in various agricultural industries and commodities [9,59,60]. For instance, Lagoudakis et al. (2020) used SWOT to analyze the U.S. tart cherry market [59], while Wang et al. analyzed the SWOT of maple syrup as a relatively new commodity in the Chinese markets [9].
This SWOT analysis of the U.S. maple syrup industry is conducted using the data presented in the previous sections, findings from a comprehensive literature review, primary data collected from a maple syrup producer survey conducted in 2019, and several focus group sections of maple syrup producers, processors and organization leaders conducted in the past five years. The key findings of the SWOT analysis are reported in Table 1.

4.1. Strengths

The U.S. maple syrup industry has several strengths. First, maple syrup is deeply rooted in the cultural heritage of Canada and the United States, particularly in regions like Quebec, Vermont, New York, and Maine [15,60]. While maple culture is regularly included in local festivals, culinary practices, and many other activities, community members in the primary production regions have a strong familiarity with maple syrup, its various grades and flavors, and the variety of value-added products produced entirely from maple syrup or with maple syrup as a key ingredient. These cultural and community connections create a place-based identity for maple syrup and its promotion. For example, Vermont stands out as a dominant player in U.S. maple syrup production, boasting a robust brand identity associated with high-quality production. The state’s quality standards, which exceed federal requirements, help distinguish Vermont maple syrup in national and international markets [13,61].
Second, with its delicious taste, rich amber color, and distinctive aroma, pure maple syrup is a minimally processed sweetener that remains a staple in certain traditional culinary recipes and could become more widely used in different formats as an ingredient in foods, beverages, or supplements. As consumers increasingly seek natural and health-conscious alternatives to refined sugars, the nutritional profile of maple syrup positions the product favorably within the competitive landscape of sweeteners, giving producers a competitive advantage in the market [17,61,62,63]. This consumption trend is also reflected in the steady increase in per capita consumption of pure maple syrup in the United States, from 1.05 fluid ounces in 1975 to 5.26 fluid ounces in 2022. While pure maple syrup contains high levels of phenolic compounds, organic acids, and micronutrients like potassium, calcium, manganese, and zinc [17], laboratory studies have found that pure maple syrup produced a lower glucose and insulin response in rats compared to corn syrup, honey and other sweeteners [63], and further research found more specifically that feeding maple syrup instead of sucrose syrup shifted carbohydrate digestion and triggered anti-inflammatory liver response in mice [64]. The first known clinical study on humans found that overweight adults with mild metabolic alterations who substituted maple syrup for other dietary “added” sugars demonstrated a significant reduction in key cardiometabolic risk factors [64]. As health-conscious consumers demonstrate a growing preference for organic foods [65], the production of certified organic maple syrup has increased rapidly to meet the market demand.
Third, the maple industry has manifested technological developments and advanced practices that have been rapidly adopted by many producers. As discussed in a previous section, the vacuum-powered tubing systems and RO processing have helped producers to attain higher production yields, reduce labor costs, and enhance their resilience to weather and climate change. Also, improved tap hole drilling, maple spout materials, and well-managed tubing systems together reduce bacterial growth and promote a longer harvest season before tap holes “dry-out” or reach the threshold of wood tissue healing that reduces sap flow below feasible collection volumes [22,66].
Fourth, as a smaller industry in regions dominated by timber-based forest products and dairy farming, maple syrup research and education have recently benefited from targeted public funding resources. For example, the USDA Agricultural Marketing Service (AMS) established the first maple-specific competitive grant program in 2017 and increased the annual funding to USD 6 million in 2024 to support maple syrup market development and producer education (USDA AMS, 2024) [67]. The increase in government funding for maple research also reflects the increasing public recognition of the maple syrup industry’s importance and environmental benefits and contributions (e.g., ecosystem services).

4.2. Weaknesses

The U.S. maple syrup industry faces several significant weaknesses. First, maple syrup producers face a cost-price squeeze, especially in the bulk syrup markets, characterized by rising production costs and declining producer prices. The price-cost squeeze highlights how American farmers can become trapped in a cycle where efforts to improve productivity do not translate into higher profits due to falling commodity prices [50]. As discussed in the introduction section, the price-cost squeeze for maple syrup has been affecting the industry significantly as the real producer price for maple syrup has shown a downward trend since 2008. While labor costs are expected to continue to increase due to the widely reported workforce shortage in many rural areas [68], the industry faces the challenge of reversing the downward trend in producer prices.
Second, the U.S. maple industry is highly concentrated between a small group of large bulk syrup buyers and distributors, exemplifying an oligopsony (bulk syrup buyers) and oligopoly (syrup packers and distributors) market environment. These buyers have been established for many years, operate on large scales, and navigate in the extremely competitive market, making it difficult for new entrants to enter the markets. This market dynamic constrains the ability of U.S. producers and the prevailing U.S. cost of production to influence market prices. Unlike Canadian maple syrup producers that benefit from the industrial governance through the QMSP, U.S. maple syrup producers lack a centralized public governance body or a unified multi-state organization, limiting the industry’s capacity to shape market development, advocate for favorable policies, or organize its development and promotion efforts effectively. Also, U.S. bulk markets are often forced to react to Canadian prices influenced by the quota system managed by QMSP. The fragmented and predominantly privatized governance in the United States complicates collective action among maple syrup producers and serves as barriers to a national strategy that tackles the industry’s vulnerabilities and promotes essential support measures [15,26,69,70].
Third, there is likely low consumer awareness or understanding of pure maple syrup outside its production regions. For example, a recent national survey suggests that only 15% of adults in the United States were familiar with pure maple syrup, and over 60% of the respondents who claimed to be familiar with pure maple syrup were actually confused between pure maple syrup and artificially maple-flavored corn syrup [71]. Also, many American consumers lack knowledge on how to incorporate maple syrup into daily food choices, especially in the states that do not produce maple syrup.
Fourth, while consumer preferences for food products are changing rapidly and many new food products are introduced in the marketplace every month, there is limited progress in new product development for maple syrup. For example, although maple syrup has been consumed with pancakes and waffles for breakfast for many generations, pancakes and waffles may become less popular among young consumers with busy schedules and different preferences for breakfast.
Fifth, there are limited education and training programs and government assistance programs for sugarbush management, maple product development, maple technologies, etc. For example, there is a lack of a college curriculum on sugarbush management and maple production and limited training programs for installing and managing vacuum-powered maple sap tubing systems.

4.3. Opportunities

There are great opportunities for the U.S. maple syrup industry. First, the United States has excellent resources for expanding its maple syrup production. For example, according to Farrell and Chabot, about 86% of maple trees in ideal climate regions in the United States were untapped when their studies were conducted around 2010. The United States also has the human resources, social capital, and technology, to expand its maple syrup production [6,72].
Second, maple syrup has experienced a steady increase in demand in the United States since around 2000. Also, while more U.S. consumers seek less processed, natural, and single-ingredient foods, pure maple syrup aligns well with this consumption trend [71]. The versatility and culinary appeal of maple syrup to consumers who like to explore new foods and experiment in the kitchen offer opportunities to introduce this unique product to consumers who are less familiar with maple syrup or are located outside the traditional maple syrup production regions [71].
Third, the global market for natural sweeteners is expanding and the United States can capitalize on this trend by increasing its exports of pure maple syrup to emerging foreign markets such as China. Bilateral or multilateral trade agreements will be needed to catalyze the export of U.S. syrup to global markets. The U.S. withdrawal from the Trans-Pacific Partnership (TPP) and the previous EU–Canada Comprehensive Economic and Trade Agreement (CETA) highlight examples where Canadian exports enter foreign markets at lower costs than U.S. goods subject to prohibitive tariffs [73].
Fourth, the growing carbon markets and various environmental certification programs, such as bird-friendly maple, are expected to provide opportunities for maple producers to earn additional revenues and market the environmental benefits of products and services. Maple producers can leverage their best practices in forest management and processing innovations to showcase how the industry aligns with the increasing consumer preferences for sustainably sourced products [2,13]. Permanent forest cover and intact forest ecosystems enhance flood prevention, biodiversity, and carbon sequestration. These ecosystem services are all expected to become more prominent in public initiatives and private markets in the coming years.
Fifth, the growing agrotourism initiatives can stimulate local economies by attracting tourists to maple syrup farms and related events, such as sugar shack tours and maple festivals. This generates income for producers and fosters community engagement and pride in local traditions [74]. A national consumer behavior study found that approximately 66% of adults who have visited Vermont, a leading maple-producing state, had purchased or consumed maple syrup in the past 12 months compared to much lower purchase and consumption frequency for adults who had never visited Vermont [75].

4.4. Threats

The U.S. maple industry faces at least five primary threats: First, as discussed in Section 3, the changing climate has already brought about significant impacts on the maple industry and is likely to continue to increase the volatility of sap yield and maple syrup production [28,33,76,77,78,79]. Climate projections anticipate reductions in annual snowpack and below-freezing days that could cause disruptions to the sap harvest season and potential risks to tree health [80]. Also, invasive species pose significant threats to maple forests due to their impact on tree health and forest functions. Such climate risks will impact individual producers and create broader supply chain disruptions if large distributors face a crop shortage and cannot fulfill existing sales expectations for buyers. Furthermore, natural disasters such as wildfires and urban development have increased losses and fragmentation in maple production regions.
Second, Canada’s dominance in the maple syrup market presents an external threat for U.S. producers. While Canada controls the majority share of the global maple syrup market and strongly influences pricing and market trends, the U.S. producers face uncertainty and pricing disadvantages due to the pre-set Canadian pricing structures and the influence of currency exchange. Without any defined pricing systems, U.S. producers face post-harvest price volatility as U.S. packers adjust bulk prices based on inventory and to match the prices that are competitive with Canadian imports.
Third, pure maple syrup faces competitive pressures from low-cost alternative sweeteners, like refined cane sugar and beet sugar, in addition to the prevalent artificially flavored corn syrup and high fructose corn syrup products most Americans utilize as their primary “pancake or table syrup”. These products are more readily available and marketed more aggressively due to the extensive financial resources of their respective industries. These alternatives compete on price and benefit from organized research and promotional initiatives that maple syrup producers lack [63,81,82].
Also, there is a demonstrated consumer aversion to what is perceived as “modern maple,” characterized by increased use of technology and larger-scale production methods. This shift conflicts with traditional notions of authenticity and craftsmanship that many consumers associate with pure maple syrup. On the other hand, recent research has found that consumers are willing to pay more for maple syrup produced with sustainable practices. Still, the same consumers are skeptical of a certified third-party designation because of a company’s potential motives for greenwashing or presenting inaccurate eco-claims to consumers [83]. This highlights the risk of claims placed on labels that do not accurately reflect how the maple syrup was produced.
Fourth, the ongoing global geopolitical conflicts, trade disputes and retaliations, and changes in international policies of the United States and other nations are likely to threaten the U.S. maple syrup industry. For example, the Russia–Ukraine war and the Israel–Hamas war have already resulted in remarkable impacts on the international trade of many food products, including maple syrup. Also, if the Trump administration increases the tariff on U.S. imports from Canada, China, and Japan, it will likely result in trade retaliations and reduce U.S. maple imports from Canada and U.S. maple exports to Japan and China.
Fifth, the ongoing public health campaigns to reduce sugar intake to prevent diabetes and obesity in the United States and other nations like China may threaten the maple industry. There is a growing need for more research on the health impacts of pure maple syrup compared to other sweeteners like sugar and honey.

5. Discussion of Potential Strategies for the U.S. Maple Syrup Industry

The review of U.S. maple syrup’s development, assessment of the major challenges faced by the industry, and the SWOT analysis presented in the previous sections suggest four potential strategies for the U.S. maple syrup industry to address the challenges and achieve more sustainable development by turning its weaknesses and threats into strengths and opportunities. First, the maple syrup industry must shift its focus from supply side management and interventions to more balanced supply and demand strategies. For example, the primary reason for the downward trend in producer prices in Canada and the United States since the late 2000s is that the production growth has exceeded the growth in demand. Under this situation, the effectiveness of supply side strategies and interventions, such as Quebec’s production quota and reserve system, in enhancing the efficiency and economic viability of the industry will likely be limited. Unfortunately, many other agricultural sectors, such as dairy in the United States and Canada, face similar challenges due to the lack of matching growth in market demand. The maple syrup industry must develop comprehensive strategies and actions to improve production efficiency and to increase consumer and market demand for pure maple syrup at the same time.
Second, it is crucial to note that the U.S. maple syrup industry could benefit from a public or hybrid governance organization like QMSP or the American Honey Producers Association. As discussed in a previous section, the absence of such an entity has limited the U.S. maple syrup producers’ ability to identify and pursue collective objectives in a unified manner. Several state maple syrup producer associations have begun discussing the formation of organizations within the United States. Strong support exists but existing concerns coupled with an unfamiliarity of these strategies highlight that these discussions should continue [84]. A new governance framework would facilitate collaboration, fund marketing efforts to expand demand, and consider other strategies, ensuring the industry’s competitiveness and resilience. The need for such an entity is clear and its establishment would be a significant step toward a more robust and sustainable U.S. maple syrup industry.
Third, in addition to the traditional markets for maple syrup, the industry needs to introduce and promote maple syrup in new markets domestically and internationally. For example, in the United States, per capita consumption of maple syrup in western and southern states like California and Texas has been significantly lower than that in the northeastern states. More promotion programs are needed in the western and southern states. Also, maple syrup, as a unique natural sweetener exclusively produced in Eastern Canada and the northeastern United States, has shown great potential in some foreign countries such as Japan and China. For example, Wang et al. reported that China’s maple syrup imports increased steadily from 2.85 metric tons in 2009 to 219.96 metric tons in 2020 and then dropped to 157.01 metric tons in 2022. Both Canada and the United States have made efforts to increase their maple syrup exports in recent years. For example, the Canadian government provided USD 2.2 million to help maple syrup producers in the province of Quebec expand and diversify their exports to the United States, the United Kingdom, Germany, Japan, and China [85]. In the United States, the USDA has funded many educational, research, and Extension projects to promote maple syrup and explore new market opportunities for U.S. maple syrup at home and abroad. Although there is great potential in many foreign markets, the industry needs to make more efforts and investments to introduce maple syrup to foreign consumers who might have never heard of or tried the sweetener and then find out how to make the product available in foreign markets.
Fourth, while maple syrup has traditionally been consumed as a sweetener and with certain food products such as pancakes and waffles, there is a great need for developing new value-added products such as sports drinks and functional food products with maple syrup as a primary ingredient. As consumer preferences are significantly different across regions, cultures, and other sociodemographic groups and are changing over time, the maple syrup industry needs to conduct more research to understand consumer preferences and willingness to pay for maple syrup products and develop new maple products according to consumer preferences and willingness to pay.
Fifth, as discussed in the previous sections, climate change presents many challenges and also opportunities for the maple syrup industry. The wide adoption of innovations such as plastic tubing systems with vacuum pumps and RO have been a key source of the industry’s growth in the past three decades and have likely moderated many weather-related risks to sap yield and quality. More public and private investment is needed for sugarbush health and formalized silvicultural practices that recognize that perennial sugar production is distinct from timber management. The establishment of forest management practices will be needed to ensure forest health is maintained under dynamic and extreme conditions. The maple industry and public sponsors will also need to advance research on its own impact on the environment and implement programs to reduce resource consumption and carbon emissions. Incentives for RO upgrades and energy source conversions combined with emissions modeling or monitoring programs will offer the industry a means to reduce its environmental impact and the potential to communicate validated claims into the marketplace that is expected to place increased value on climate-friendly practices in the future.
Sixth, as Canada and the United States have been the two largest maple syrup producers in the world and the United States has been the largest importer of maple syrup, the maple syrup industries in the two nations have been competing in some foreign markets, and such competition has likely hurt both. For example, if the U.S. maple syrup producers increased their production by 200,000 gallons when the QMSP reduced its production by 200,000 gallons in the same year, the increase in the United States and the decrease in Canada canceled each other out entirely and would result in an unchanged supply in the global market. Because the maple syrup industries in the two countries face very similar climate and economic challenges, more collaboration in consumer and market research, new product development, and market development and promotion in new markets can create win–win outcomes and benefit the whole maple syrup industry in North America.
As one of the first studies focusing on the assessment of the U.S. maple syrup industry’s SWOT and potential strategies for more sustainable development, this study is limited by the availability of data and information. Specifically, this study has three major limitations: First, the study does not include quantitative analysis due to the lack of data or the coarse nature of existing aggregated statistics. As a result, some findings are based on previous studies and expert assessment of researchers highly engaged with a range of industry stakeholders. For example, the study has discussed potential factors for the downward trend in the price received by U.S. maple syrup producers but could not quantify the numerical impact of each factor or measure distinctions between unique market channels or geographic distribution regions. Second, as summarized by Gurel and Tat [31], SWOT analysis as a research method has several disadvantages and limitations and they may result in biased conclusions and recommendations. For example, the identification of factors, especially internal factors, could be affected by the researchers’ experience and opinions. Also, the factors reported in each of the four blocks in Table 1 do not reflect their relative importance and impact. Third, this study has analyzed the U.S. maple syrup industry at the aggregate level only and has not examined the differences across regions, between different producer size classes, or the tradeoffs between industrial groups and producer interests.

6. Concluding Remarks

This study has reviewed the development of the U.S. maple syrup industry, assessed its internal strengths and weaknesses and external opportunities and threats, and derived recommendations for the industry to attain more sustainable development. While there are very limited empirical studies on the U.S. maple syrup industry, this study contributes to the literature with a SWOT analysis that focuses more on the socioeconomic aspects of the industry’s challenges and potentials. The U.S. maple syrup industry has developed significantly over the past three decades in terms of total maple syrup production, sap yield, innovation and adoption of new technologies, and public support. On the other hand, the industry faces the challenges of increasing yield and production volatility due to climate change, a downward trend in producer prices since 2008, increasing competition from imports and impacts of trade policies, and geopolitical conflicts, etc. Although there is no simple solution to the above challenges due to the complexity of the challenges as well as their contributing factors, this empirical study, based on a comprehensive review of the industry’s development and trends and a SWOT analysis, suggests that innovative strategies can help the industry turn its weaknesses and threats into strengths and opportunities and achieve more sustainable development.
This study suggests four major recommendations for the U.S. maple syrup industry to address the challenges and move towards more sustainable development: First, establish a national or regional producer governance organization, like the QMSP or the American Honey Producers Association to advocate for maple syrup producers on issues like trade policies, quality standards, prices, certification, potential payments for sugarbushes’ ecosystem services, and environmental regulations and to enhance the market power of U.S maple syrup producers. Second, increase the investment and adoption of climate-resilient technologies. Third, develop more value-added maple syrup products according to consumer preferences and demand. Fourth, strengthen the marketing and promotion efforts of industrial organizations, government agents, and private enterprises through collaboration for the goal of increasing the demand for U.S. maple syrup in the domestic and foreign markets.

Author Contributions

Conceptualization, Q.W. and M.C.; Methodology, Q.W. and A.S.; Validation, M.C.; Formal analysis, Q.W.; Resources, M.C.; Data curation, A.S. and E.O.A.; Writing—original draft, Q.W., A.S. and E.O.A.; Writing—review & editing, Q.W., A.S., E.O.A. and M.C.; Supervision, Q.W.; Funding acquisition, Q.W. All authors have read and agreed to the published version of the manuscript.

Funding

This work was supported by the U.S. Department of Agriculture (USDA) Agricultural Research Service and the University of Vermont (UVM) Food Systems Research Center (Grant award AWD00001102) and Vermont Agricultural Experiment Station at UVM (Grant award VT-H02908) and the USDA Agricultural Marketing Service (Grant awards 23ACERVT1024-00 and 23ACERVT1030-00).

Institutional Review Board Statement

Not Applicable.

Informed Consent Statement

Not Applicable.

Data Availability Statement

The data presented in this study are available on request from the corresponding author.

Acknowledgments

The authors would like to thank the editors and three anonymous reviewers for their valuable comments and suggestions.

Conflicts of Interest

The authors declare no conflict of interest.

References

  1. Houle, D.; Duchesne, L. The “sweet spot” for maple syrup production proposed by Rapp et al. (2019) is not that sweet. For. Ecol. Manag. 2020, 458, 117662. [Google Scholar] [CrossRef]
  2. Murphy, B.L.; Chretien, A.R.; Brown, L.J. Non-timber forest products, maple syrup and climate change. J. Rural. Community Dev. 2012, 7, 42–64. Available online: https://journals.brandonu.ca/jrcd/article/view/601 (accessed on 3 March 2025).
  3. Bal, T.L.; Storer, A.J.; Jurgensen, M.F.; Doskey, P.V.; Amacher, M.C. Nutrient stress predisposes and contributes to sugar maple dieback across its northern range: A review. For. Int. J. For. Res. 2015, 88, 64–83. [Google Scholar] [CrossRef]
  4. Becot, F.; Kolodinsky, J.; Conner, D. Center for Rural Studies; University of Vermont: Burlington, VT, USA, 2015. [Google Scholar]
  5. Bishop, D.A.; Beier, C.M.; Pederson, N.; Lawrence, G.B.; Stella, J.C.; Sullivan, T.J. Regional growth decline of sugar maple (Acer saccharum) and its potential causes. Ecosphere 2015, 6, 179. [Google Scholar] [CrossRef]
  6. Farrell, M.; Chabot, B. Assessing the growth potential and economic impact of the U.S. maple syrup industry. J. Agric. Food Syst. Community Dev. 2012, 2, 11–27. [Google Scholar] [CrossRef]
  7. McConnell, T.E.; Graham, G.W. History of Northeastern US maple syrup price trends. For. Prod. J. 2016, 66, 106–112. [Google Scholar] [CrossRef]
  8. Perry, J.J.; Nile, K.; Martel, A.; Fiore, M.; Davis-Dentici, K.; Hopkins, K.; Calder, B. Pasteurized and fermented beverages for valorization of maple sap. J. Food Process. Preserv. 2020, 44, e14623. [Google Scholar] [CrossRef]
  9. Wang, Q.; Cannella, M.; Zou, Y. China’s emerging market for maple syrup: Opportunities and challenges for U.S. exports. Food Distrib. Res. 2024, 55, 46–61. Available online: https://openurl.ebsco.com/EPDB%3Agcd%3A1%3A25568769/detailv2?sid=ebsco%3Aplink%3Ascholar&id=ebsco%3Agcd%3A177614552&crl=c&link_origin=scholar.google.com.hk (accessed on 3 March 2025).
  10. Quebec Maple Syrup Producers Association (QMSP). 2024. Available online: https://ppaq.ca/en/ (accessed on 3 March 2025).
  11. U.S. Department of Agriculture National Agricultural Statistics Service [USDA NASS]. Maple Syrup Quick Stats. 2024. Available online: https://quickstats.nass.usda.gov/ (accessed on 3 March 2025).
  12. Gabe, T. Economic Impacts of Maine’s Maple Industry; Munich Personal RePEc Archive (MPRA): Munich, Germany, 2014; p. 65962. Available online: https://mpra.ub.uni-muenchen.de/65962/ (accessed on 3 March 2025).
  13. Hershberger, S.; Shaw, B.; Gorby, T.; Solin, J.; Robinson, P.; Tiles, K.; Cook, C.; Chang, C.-T. Comparing motivations, learning interests, and barriers to expansion among non-commercial and commercial maple syrup producers in Wisconsin. Small-Scale For. 2023, 23, 127–157. [Google Scholar] [CrossRef]
  14. Whitney, G.G.; Upmeyer, M.M. Sweet trees, sour circumstances: The long search for sustainability in the North American maple products industry. For. Ecol. Manag. 2004, 200, 313–333. [Google Scholar] [CrossRef]
  15. Hinrichs, C.C. Sideline and Lifeline: The Cultural Economy of Maple Syrup Production. Rural. Sociol. 1998, 63, 507–532. [Google Scholar] [CrossRef]
  16. Lange, M. Meanings of Maple: An Ethnography of Sugaring; University of Arkansas Pres: Fayetteville, AR, USA, 2017. [Google Scholar]
  17. Saraiva, A.; Carrascosa, C.; Ramos, F.; Raheem, D.; Lopes, M.; Raposo, A. Maple syrup: Chemical analysis and nutritional profile, health impacts, safety and quality control, and food industry applications. Int. J. Environ. Res. Public Health 2022, 19, 13684. [Google Scholar] [CrossRef] [PubMed]
  18. Yahoo Finance. Dsm-Firmenich Unveils ‘Milky Maple’ as the Flavor of the Year 2025, Bringing Comfort and Connection with Every Sip and Bite; Food Ingredients First: Arnhem, The Netherlands, 2024. [Google Scholar]
  19. Statistics Canada. Maple Products; Statistics Canada: Ottawa, Canada, 2024. Available online: https://www150.statcan.gc.ca/n1/daily-quotidien/241212/dq241212d-eng.htm (accessed on 3 March 2025).
  20. Huyler, N.K. Cost of Maple Sap Production for Various Size Tubing Operations; Department of Agriculture, Forest Service, Northeastern Research Station: Broomall, PA, USA, 2000. [Google Scholar] [CrossRef]
  21. Kelley, J.W.; Staats, L.J. High-vacuum pumping effects on maple sap sugar yield. North. J. Appl. For. 1989, 6, 126–129. [Google Scholar] [CrossRef]
  22. Perkins, T.D.; van den Berg, A.K. Relationships Between Tubing System Component Age and Sap Yield: A Preliminary Assessment. Maple Syrup Dig. 2012. Available online: https://mapleresearch.org/pub/m0212tubingagesapyield/ (accessed on 3 March 2025).
  23. Staats, L.J.; Kelley, J.W. Field evaluation of the IPL VacuSpout for maple sap collection. Nothern J. Appl. For. 1996, 13, 171–174. Available online: https://academic.oup.com/njaf/article/13/4/171/4802306 (accessed on 3 March 2025). [CrossRef]
  24. Thomas, M.M. From pails to pipelines: The origins and early adoption of plastic tubing in the maple syrup industry. Vt. Hist. 2021, 89, 52–78. Available online: https://vermonthistory.org/journal/89/VH8901FromPailsToPipelines.pdf (accessed on 3 March 2025).
  25. Checkoway, S.M. A Simple Model of a Vacuum-Tubing System for Collecting Maple Sap; Center for Sustainable Systems, University of Michigan: Ann Arbor, MI, USA, 2024. [Google Scholar] [CrossRef]
  26. Perkins, T.D.; Heiligmann, R.; Koeling, M.; van den Berg, A.K. North American Maple Syrup Producers Manual, 3rd ed.; University of Vermont: Burlington, VT, USA, 2022; Available online: https://mapleresearch.org/pub/manual/ (accessed on 3 March 2025).
  27. Huyler, N.K.; Garrett, L.D. A Cost Analysis: Processing Maple Syrup Products; Department of Agriculture, Forest Service, Northeastern Forest Experiment Station: Broomall, PA, USA, 1979. Available online: https://research.fs.usda.gov/treesearch/14964 (accessed on 3 March 2025).
  28. Caughron, A.; Legault, S.; Haut, C.; Houle, D.; Reynolds, T.W. A changing climate in the maple syrup industry: Variation in Canadian and U.S.A. producers’ climate risk perceptions and willingness to adapt across scales of production. Small-Scale For. 2020, 20, 73–95. [Google Scholar] [CrossRef]
  29. Larue, B.; Criado, C.O.; González, P.; Nangue, C.K. Zeros, Near-Zeros and Gravity with Endogenous Market Structure: The Case of Maple Syrup Exports; Department of Agri-food Economics and Consumer Sciences, University of Laval: Quebec, Canada, 2019; Available online: https://crem.univ-rennes.fr/sites/crem.univ-rennes.fr/files/medias/files/_mainbc06_carlos-1.pdf (accessed on 3 March 2025).
  30. Benzaghta, M.A.; Elwalda, A.; Mousa, M.; Erkan, I.; Rahman, M. SWOT analysis applications: An integrative literature review. J. Glob. Bus. Insights 2021, 6, 55–73. [Google Scholar] [CrossRef]
  31. Gürel, E.; Tat, M. Swot Analysis: A Theoretical Review. J. Int. Soc. Res. 2017, 10, 994–1006. [Google Scholar] [CrossRef]
  32. Brown, L.J.; Lamhonwah, D.; Murphy, B.L. Projecting a spatial shift of Ontario’s sugar maple habitat in response to climate change: A GIS approach. Can. Geogr. 2015, 59, 369–381. [Google Scholar] [CrossRef]
  33. Legault, S.; Houle, D.; Plouffe, A.; Ameztegui, A.; Kuehn, D.; Chase, L.; Blondlot, A.; Perkins, T.D. Perceptions of U.S. and Canadian maple syrup producers toward climate change, its impacts, and potential adaptation measures. PLoS ONE 2019, 14, e0215511. [Google Scholar] [CrossRef]
  34. Garcia, E.J.; McDowell, T.; Ketola, C.; Jennings, M.; Miller, J.D.; Renaud, J.B. Metabolomics reveals chemical changes in Acer saccharum sap over a maple syrup production season. PLoS ONE 2020, 15, e0235787. [Google Scholar] [CrossRef]
  35. Guilbert, J.; Beckage, B.; Winter, J.M.; Horton, R.M.; Perkins, T.; Bomblies, A. Impacts of projected climate change over the Lake Champlain Basin in Vermont. J. Appl. Meteorol. Climatol. 2014, 53, 1861–1875. [Google Scholar] [CrossRef]
  36. Logan, T.; Charron, I.; Chaumont, D.; Houle, D. Atlas of Climate Scenarios for Québec Forests. Ouranos for Ministère des Ressources Naturelles and de la Faune du Québec; March, 2011. Available online: https://www.researchgate.net/publication/267670685_Atlas_of_Climate_Scenarios_for_Quebec_Forests (accessed on 3 March 2025).
  37. Skinner, C.B.; DeGaetano, A.T.; Chabot, B.F. Implications of twenty-first century climate change on Northeastern United States maple syrup production: Impacts and adaptations. Clim. Change 2010, 100, 685–702. [Google Scholar] [CrossRef]
  38. Barton, A.M.; Brewster, L.B.; Cox, A.N.; Prentiss, N.K. Non-indigenous woody invasive plants in a rural New England town. Biol. Invasions 2004, 6, 205–211. [Google Scholar] [CrossRef]
  39. Haynes, K.J.; Liebhold, A.M.; Lefcheck, J.S.; Morin, R.S.; Wang, G. Climate affects the outbreaks of a forest defoliator indirectly through its tree hosts. Oecologia 2022, 198, 407–418. [Google Scholar] [CrossRef] [PubMed]
  40. Janowiak, M.K.; Iverson, L.R.; Fosgitt, J.; Handler, S.D.; Dallman, M.; Thomasma, S.; Hutnik, B.; Swanston, C.W. Assessing stand-level climate change risk using forest inventory data and species distribution models. J. For. 2017, 115, 222–229. [Google Scholar] [CrossRef]
  41. Wade, D.D.; Brock, B.L.; Brose, P.H.; Hoch, G.A.; Patterson, W.A., III. Fire in eastern ecosystems. In Wildland Fire in Ecosystems: Effects of Fire on Flora; Brown, J.K., Smith, J.K., Eds.; General Technical Report RMRS-GTR-42-4; Department of Agriculture, Forest Service, Rocky Mountain Research Station: Ogden, UT, USA, 2000; pp. 53–96. [Google Scholar]
  42. Cotnoir, A. The End of Maple? Maple Sugaring Amid a Changing Climate; Audubon Vermont: Huntington, VT, USA, 2021. [Google Scholar]
  43. Buckley, D.S.; Crow, T.R.; Nauertz, E.A.; Schulz, K.E. Influence of skid trails and haul roads on understory plant richness and composition in managed forest landscapes in upper Michigan, USA. For. Ecol. Manag. 2003, 175, 509–520. [Google Scholar] [CrossRef]
  44. Lundgren, M.R.; Small, C.J.; Dreyer, G.D. Influence of land use and site characteristics on invasive plant abundance in the Quinebaug Highlands of Southern New England. Northeast. Nat. 2004, 11, 313–332. [Google Scholar] [CrossRef]
  45. Garske, S. Risk Assessment from Emerald Ash Borer and other Forest Pests upon Commonly Harvested Forest Trees (Ash, Balsam, Birch, Maple, and Oak) in the Ojibwe Ceded Territories; Great Lakes Indian Fish Wildlife Commission: Odanah, WI, USA, 2013; Available online: https://glifwc.org/Forest_Pests/EAB.html (accessed on 3 March 2025).
  46. Houle, D.; Duchesne, L.; Boutin, R. Effects of a spruce budworm outbreak on element export below the rooting zone: A case study for a balsam fir forest. Ann. For. Sci. 2009, 66, 707. [Google Scholar] [CrossRef]
  47. Lewis, G.P. Response of Stream Chemistry to Forest Insect Defoliation on the Allegheny High Plateau, Pennsylvania. Unpublished dissertation, Cornell University, Ithaca, NY, USA, 1998. Available online: https://www.proquest.com/docview/304416452?fromopenview=true&pq-origsite=gscholar&sourcetype=Dissertations%20&%20Theses (accessed on 3 March 2025).
  48. Lovett, G.M.; Christenson, L.M.; Groffman, P.M.; Jones, C.G.; Hart, J.E.; Mitchell, M.J. Insect defoliation and nitrogen cycling in forests. BioScience 2002, 52, 335–341. [Google Scholar] [CrossRef]
  49. National Centers for Environmental Information (NCEI) 2020. National Climate Report. Available online: https://www.ncei.noaa.gov/access/monitoring/monthly-report/national/202013 (accessed on 3 March 2025).
  50. Czyżewski, B.; Matuszczak, A.; Miśkiewicz, R. Public goods versus the farm price-cost squeeze: Shaping the sustainability of the EU’s common agricultural policy. Technol. Econ. Dev. Econ. 2019, 25, 82–101. [Google Scholar] [CrossRef]
  51. U.S. Bureau of Labor Statistics. Consumer Price Index Summary. 2024. Available online: https://www.bls.gov//cpi/ (accessed on 3 March 2025).
  52. Federation of Quebec Maple Syrup Producers Association (FQMSP). Tap Allocation. 2022. Available online: https://ppaq.ca/en/maple-production-quotas/emission-entailles-2021/ (accessed on 3 March 2025).
  53. Cannella, M.; Laughton, C. Maple Syrup Outlook. Farm Credit. East Knowl. Exch. 2023, 17. Available online: https://www.farmcrediteast.com/en/resources/Industry-Trends-and-Outlooks/Reports/20230301KEP_MapleSyrupOutlook (accessed on 3 March 2025).
  54. Gagné, I. Maple Syrup Production in Quebec: Farmer Self-determination for Market Control (Regoverning Markets Innovative Policy Series); International Institute for Environment and Development (IIED): London, UK, 2008; Available online: https://www.iied.org/sites/default/files/pdfs/migrate/G03274.pdf (accessed on 3 March 2025).
  55. Baek, J.; Xu, J. Exchange rate effects on the U.S.-Canada forest product trade: Are the effects asymmetric? J. Agric. Resour. Econ. 2022, 47, 114–127. [Google Scholar] [CrossRef]
  56. Quebec Ministry of Agriculture, Fisheries and Food. Industry Acéricole in Quebec: Portrait- Sectoral Diagnosis; Quebec Ministry of Agriculture, Fisheries and Food: Saint-Hyacinthe, QC, Canada, 2021.
  57. Abdel-Basset, M.; Mohamed, M.; Smarandache, F. An extension of neutrosophic AHP–SWOT analysis for strategic planning and decision-making. Symmetry 2018, 10, 116. [Google Scholar] [CrossRef]
  58. Ghazinoory, S.; Abdi, M.; Azadegan-Mehr, M. SWOT methodology: A state-of-the-art review for the past, a framework for the future. J. Bus. Econ. Manag. 2011, 12, 24–48. [Google Scholar] [CrossRef]
  59. Lagoudakis, A.; McKendree, M.G.S.; Malone, T.; Caputo, V. Incorporating producer opinions into a SWOT analysis of the U.S. tart cherry industry. Int. Food Agribus. Manag. Rev. 2020, 23, 547–561. [Google Scholar] [CrossRef]
  60. Snyder, S.A.; Kilgore, M.A.; Emery, M.R.; Schmitz, M. Maple syrup producers of the Lake States, USA: Attitudes towards and adaptation to social, ecological, and climate conditions. Environ. Manag. 2019, 63, 185–199. [Google Scholar] [CrossRef]
  61. Ramadan, M.F.; Gad, H.A.; Farag, M.A. Chemistry, processing, and functionality of maple food products: An updated comprehensive review. J. Food Biochem. 2021, 45, e13832. [Google Scholar] [CrossRef]
  62. Cannella, M.U.S. Maple Syrup Outlook. Farm Credit. East Knowl. Exch. 2022, 16. Available online: https://www.farmcrediteast.com/en/resources/Industry-Trends-and-Outlooks/Reports/us-maple-syrup-outlook (accessed on 3 March 2025).
  63. St-Pierre, P.; Pilon, G.; Dumais, V.; Dion, C.; Dubois, M.-J.; Dubé, P.; Desjardins, Y.; Marette, A. Comparative analysis of maple syrup to other natural sweeteners and evaluation of their metabolic responses in healthy rats. J. Funct. Foods 2014, 11, 460–471. [Google Scholar] [CrossRef]
  64. Morissette, A.; André, D.M.; Agrinier, A.-L.; Varin, T.V.; Pilon, G.; Flamand, N.; Houde, V.P.; Marette, A. The metabolic benefits of substituting sucrose for maple syrup are associated with a shift in carbohydrate digestion and gut microbiota composition in high-fat high-sucrose diet-fed mice. Am. J. Physiol.-Endocrinol. Metab. 2023, 325, E661–E671. [Google Scholar] [CrossRef] [PubMed]
  65. Rana, J.; Paul, J. Consumer behavior and purchase intention for organic food: A review and research agenda. J. Retail. Consum. Serv. 2017, 38, 157–165. [Google Scholar] [CrossRef]
  66. van den Berg, A.K.; Perkins, T.D.; Isselhardt, M.L.; Wilmot, T.R. Growth rates of sugar maple trees tapped for maple syrup production using high-yield sap collection practices. For. Sci. 2015, 62, 107–114. [Google Scholar] [CrossRef]
  67. U.S. Department of Agriculture (USDA) Agricultural Marketing Service. USDA Market. News. 2024. Available online: https://www.ams.usda.gov/market-news (accessed on 3 March 2025).
  68. Bernsen, N.; Crandall, M.; Leahy, J. An educational needs assessment of workforce supply and readiness in Maine’s forest products industry. For. Prod. J. 2020, 70, 22–27. [Google Scholar] [CrossRef]
  69. Cannella, M.; Lindgren, C.; Isselhardt, M. Northeastern United States Maple Syrup Production and Economics: A 2019 Survey of Producers; UVM Extension Faculty Publications No 30. 2022. Available online: https://scholarworks.uvm.edu/extfac/30 (accessed on 3 March 2025).
  70. Federation of Quebec Maple Syrup Producers Association (FQMSP). 2019. Available online: https://ppaq.ca/en/news/2019-annual-and-activity-reports-now-online/ (accessed on 3 March 2025).
  71. Golin Group. ACER Research Phase I Findings: US Consumer Profile. 2023. Available online: https://sugarmakers.nysmaple.com/nys-maple-syrup-research-findings/ (accessed on 3 March 2025).
  72. Farrell, M. The Economics of managing maple trees for syrup or sawtimber production. North. J. Appl. For. 2012, 29, 165–172. [Google Scholar] [CrossRef]
  73. Cannella, M. Maple Finances and Business Viability. In Proceedings of the 2018 NAMSC Annual Conference, Concord, NH, USA, 2018; Available online: https://www.nhgfoa.org/presentations/pages/2018-annual-conference-presentation-materials (accessed on 3 March 2025).
  74. Li, L.; Seeram, N.P. Maple syrup phytochemicals include lignans, coumarins, a stilbene, and other previously unreported antioxidant phenolic compounds. J. Agric. Food Chem. 2010, 58, 11673–11679. [Google Scholar] [CrossRef] [PubMed]
  75. Atlantic Corporation. Identifying Market Opportunities for Vermont Maple Syrup Producers. State of Vermont Agency of Agriculture, Food and Markets. 2021. Available online: https://agriculture.vermont.gov/sites/agriculture/files/doc_library/VAAFM_Maple%20Syrup%20SCBG_Final%20Technical%20Report_20210930_external.pdf (accessed on 3 March 2025).
  76. Duchesne, L.; Houle, D.; Côté, M.A.; Logan, T. Modelling the effect of climate on maple syrup production in Québec, Canada. For. Ecol. Manag. 2009, 258, 2683–2689. [Google Scholar] [CrossRef]
  77. Houle, D.; Paquette, A.; Côté, B.; Logan, T.; Power, H.; Charron, I.; Duchesne, L. Impacts of climate change on the timing of the production season of maple syrup in Eastern Canada. PLoS ONE 2015, 10, e0144844. [Google Scholar] [CrossRef]
  78. MacIver, D.C.; Karsh, M.; Comer, N.; Klaassen, J.; Auld, H.; Fenech, A. Atmoshperic Influences on the Sugar Maple Industry in North America. Adaption and Impacts Research Division (AIRD) of the Environment Canada. 2006. Available online: https://publications.gc.ca/collections/collection_2011/ec/En57-41-7-2006-eng.pdf (accessed on 3 March 2025).
  79. Matthews, S.N.; Iverson, L.R. Managing for delicious ecosystem service under climate change: Can United States sugar maple (Acer saccharum) syrup production be maintained in a warming climate? Int. J. Biodivers. Sci. Ecosyst. Serv. Manag. 2017, 13, 40–52. [Google Scholar] [CrossRef]
  80. Burakowski, E.A.; Contosta, A.R.; Grogan, D.; Nelson, S.J.; Garlick, S.; Casson, N. Future of winter in Northeastern North America: Climate indicators portray warming and snow loss that will impact ecosystems and communities. Northeast. Nat. 2022, 28, 180–207. [Google Scholar] [CrossRef]
  81. Eggleston, G.; Aita, G.; Triplett, A. Circular sustainability of sugarcane: Natural, nutritious, and functional unrefined sweeteners that meet new consumer demands. Sugar Tech 2021, 23, 964–973. [Google Scholar] [CrossRef]
  82. Prasara-A, J.; Gheewala, S.H.; Silalertruksa, T.; Pongpat, P.; Sawaengsak, W. Environmental and social life cycle assessment to enhance sustainability of sugarcane-based products in Thailand. Clean Technol. Environ. Policy 2019, 21, 1447–1458. [Google Scholar] [CrossRef]
  83. Paudel, B.; Zhou, M. Are consumers “green” enthusiasts or skeptics? Evidence from nontimber forest products. For. Policy Econ. 2024, 168, 103302. [Google Scholar] [CrossRef]
  84. Cannella, M.; Ziegler, S.; Wang, Q.; Peabody, M.; Leahey, T.; Darby, H.M. Farm Benchmarking: The Application of Business, Conservation and Labor Indicators; USDA Agricultural Research Service: Washington, DC, USA, 2021. [Google Scholar]
  85. Desjardins, L. Funding will Boost Maple Syrup Exports. Radio Canada International. 2019. Available online: https://www.rcinet.ca/en/2019/04/12/canada-market-maple-syrup-boost/ (accessed on 3 March 2025).
Figure 1. U.S. and Canadian maple syrup production, 1975–2024. Data sources: [11,19].
Sustainability 17 04101 g001
Figure 3. U.S. per capita maple syrup consumption and self-sufficiency ratio, 1975–2022. Data sources: Calculated using official data on total production, imports, exports and population.
Sustainability 17 04101 g003
Table 1. A SWOT analysis of the U.S. maple syrup industry.
Strengths
  • Maple syrup has a long history and holds deep cultural and heritage roots in the northeastern U.S.
  • It is a unique product with delicious flavor, aroma, and distinctive color.
  • Has been introduced as an all-natural, less processed, and healthy sweetener in the U.S. and abroad
  • Increasing per capita consumption in both production and non-production regions in the U.S.
  • Significant technical innovation and adoption in sap collection and syrup production
  • Increased government investment in research, producer education, and Extension in recent years
  • Increasing public recognition of the industry’s environmental benefits and contributions (e.g., ecosystem services)
Weaknesses
  • The industry faces increasing labor and production costs but a downward trend in producer prices
  • U.S. producers have very limited market power due to strong competition in the bulk markets
  • Lack of collective maple syrup producer governance as compared to that in Quebec
  • Relatively limited market development and promotion efforts in the foreign markets
  • Many consumers have a lack of knowledge on how to incorporate maple syrup into daily food choices
  • Relatively limited progress in new product development and commercialization
  • Lack of college curriculum on sugarbush management and maple production
Opportunities
  • With an estimated 86% untapped maple trees, there is great potential for the U.S. to produce more maple syrup
  • A unique product exclusively produced in Eastern Canada and northeastern United States
  • Increasing demand for maple syrup in many foreign markets like Japan and China
  • Growing consumer awareness and willingness to pay for food products’ environmental attributes
  • Increasing opportunities for non-traditional marketing channels for producers (e.g., online sales)
  • Growing carbon markets may provide opportunities for maple producers to earn additional revenues and market the environmental benefits of products
  • Growing certification programs recognizing biodiversity benefits of maple (e.g., Bird Friendly Maple)
  • Increasing consumer concern around highly processed foods
Threats
  • The changing climate likely continues to increase the volatility of sap yield and maple syrup production
  • Threats to maple forests posed by invasive species impacting tree health and forest functions
  • The dominance of Quebec in the bulk maple syrup market with price-setting power
  • Competition pressure from other sweeteners at lower prices and with better organized policy lobbying, market research, and promotion efforts
  • Ongoing U.S. trade disputes, retaliations or lack of favorable trade agreements with other nations
  • Ongoing public health campaigns of reducing sugar intake to prevent diabetics and reduce obesity in the United States and other nations like China
  • Increasing forest loss and fragmentation in maple-producing regions in the United States
Disclaimer/Publisher’s Note: The statements, opinions and data contained in all publications are solely those of the individual author(s) and contributor(s) and not of MDPI and/or the editor(s). MDPI and/or the editor(s) disclaim responsibility for any injury to people or property resulting from any ideas, methods, instructions or products referred to in the content.

