1. Introduction
1.1. Background
Rapid motorization has caused a shortage of urban road resources, resulting in the gradual compression of space for slow-moving traffic, such as walking and non-motorized vehicles. To maximize the utilization of the slow-moving traffic system, pavements and non-motorized roads are combined as slow-moving shared paths in many cities [
1]. Although separation measures such as markings or paving materials exist, shared paths typically lack height difference between pavements and non-motorized roads. As a result, pedestrians and non-motorized vehicles often share the same travel space simultaneously.
As healthy and sustainable transportation modes, walking and non-motorized vehicles have become preferred choices for short-distance commuting, particularly for the first or last mile of travel. China has actively encouraged green travel to achieve its carbon peak and neutrality targets in recent years, significantly increasing demand for walking and non-motorized travel [
2]. Meanwhile, the non-motorized vehicle sector has evolved rapidly, driven especially by e-bike proliferation. China is currently the world’s largest e-bike market, with an estimated 400 million units in use nationwide [
3]. Additionally, the rise of new business-operated non-motorized vehicles, such as shared and delivery e-bikes, makes cyclists become increasingly diverse. As a result, large numbers of e-bikes must share space with pedestrians and bicycles, intensifying traffic conflicts and raising road safety concerns.
The high flexibility and unpredictability of pedestrian and cyclist movements make shared paths prone to traffic safety issues such as conflicts or collisions. It has been demonstrated that slow-moving shared paths are the primary location for near accidents between pedestrians and cyclists [
4]. However, slow-moving traffic management in China is still in its infancy, with vague and incomplete regulations for shared paths. Consequently, e-bike cyclists often prioritize efficiency over safety, intensifying public concerns. According to statistics, e-bike traffic accidents increased year-on-year from 2016 to 2020, comprising 75% of all non-motorized traffic accidents in China [
5]. While collisions with motor vehicles account for the bulk of cycling injuries and fatalities, research indicates that incidents between cyclists and pedestrians can also cause serious injuries [
6,
7]. These issues pose significant risks to the safety of road users on shared paths and could hinder the goal of achieving more sustainable and livable cities. Enhancing slow-moving traffic safety has become a pressing challenge for traffic engineers and planners. Accordingly, it is essential to conduct research on mixed traffic conditions of slow-moving shared paths.
In order to recognize and address traffic safety issues, traditional road safety analyses typically rely on police-reported crash data. However, such data have some limitations, such as a lack of accident data and inadequate statistics, which result in lengthy assessment periods and potentially inaccurate outcomes. Furthermore, crash data cannot capture near-miss events or reflect real-time traffic dynamics. Traffic conflict technology offers a more thorough and expedient way to identify traffic safety problems by analyzing “near accident” conflict events [
8]. Additionally, the technology can enhance safety management procedures and enables rapid feedback for traffic control and planning. Therefore, applying traffic conflict techniques represents a promising strategy for enhancing both safety and sustainability on slow-moving shared paths.
1.2. Research Objectives
While the significance of traffic safety on slow-moving shared paths has been increasingly acknowledged, existing studies still exhibit certain limitations. Most studies have focused on service-level evaluation, typically considering only pedestrians and traditional bicycles as the primary road users. Although recent studies have begun to investigate the impact of e-bikes, a thorough understanding of the factors contributing to conflict severity remains limited. Most research has emphasized road environment and traffic operation features, while ignoring micro-behavioral features. To fill this gap, this study uses high-resolution cameras and video processing techniques to extract trajectory data and conflict-related information. A random forest model is constructed to explore the effects of road environment, traffic operation features, conflict sample information, and conflict behavior features on conflict severity. Based on the model results, targeted recommendations are proposed to improve traffic safety on slow-moving shared paths, thereby supporting more sustainable and inclusive urban transport systems.
1.3. Contributions
This study focuses on slow-moving shared paths—a relatively underexplored urban traffic environment critical to sustainable urban mobility. First, by applying video-based trajectory extraction and conflict indicators (TTCmin and YRR), combined with machine learning techniques, the study systamatically analyzes the safety risks on slow-moving shared paths. Second, it advances the understanding of pedestrian–non-motorized vehicle interactions by incorporating behavioral features into traffic conflict severity analysis, enriching the existing body of research. Third, it further identifies key determinants of conflict severity and proposes targeted improvement strategies in line with sustainable development principles. The findings offer practical insights for designing safer shared infrastructures and advancing sustainable non-motorized transportation system.
The remaining parts of this study are organized as follows:
Section 2 reviews the relevant literature on slow-moving shared paths and non-motorized vehicle traffic safety analysis;
Section 3 describes the process of data collection and conflict extraction;
Section 4 presents the primary methodology for conflict severity classification and influencing factors analysis;
Section 5 provides the results of the study;
Section 6 and
Section 7 give the discussion and conclusions.
2. Literature Review
2.1. Slow-Moving Shared Paths Review
Existing research has primarily focused on evaluating the service level of slow-moving shared paths. Botma [
9] investigated interactions between bicycles and pedestrians on shared paths, proposing the frequency of overtaking and encounter events as key indicators for assessing the level of service. Chen et al. [
10] developed encounter and overtaking conflict intensity models for pedestrian–bicycle shared paths, and used these models to evaluate service performance. Zhang et al. [
11] examined the velocity attributes of bicycles in mixed traffic and employed bicycle speed as a metric to classify the service level of shared paths. Lei et al. [
12] investigated pedestrians’ perceived service level using video-based methods and found that the presence of bicycles significantly decreases walkers’ perceived service quality.
Recently, growing concerns have been raised about the safety of slow-moving shared paths, and relevant analyses have been carried out. Boufous et al. [
13] discovered that bicycles needed to adjust their speed in response to changing road conditions and pedestrian flow to maintain safe interactions. Rushdi et al. [
14] explored the micro-interaction behaviors among road users concerning variations in speed, acceleration, and relative distance, concluding that evasive actions are affected by traffic density and the spatial availability for movement. Deng [
15] defined overtaking and encounter events occurring within a 1 m lateral distance as conflicts on pedestrian-non-motorized vehicle shared path, utilizing conflict frequency as an indicator for safety assessment. Liang et al. [
16] conducted manual observations to assess conflict severity among e-bikes, bicycles, and pedestrians, discovering that swerving was the most common evasive maneuver under shared path conditions. Willberg et al. [
17] found that cyclists’ behavior and safety perception are affected by varying road environments, concluding that riding on shared paths is more distracting than on traditional non-motorized roads.
2.2. Non-Motorized Vehicle Traffic Safety Analysis
Quantitative scientific indicators are essential for measuring the severity of conflict. Allen [
18] initially introduced the spatio-temporal proximity indicator, post-encroachment time (PET), which has since been widely adopted for assessing conflicts involving non-motorized vehicles and pedestrians. Guo et al. [
19] combined the effects of time to collision (TTC) and the perception and braking reaction time (PRT) to quantify the severity of conflicts between non-motorized and motorized vehicles. Qu et al. [
20] extracted e-bike trajectory data from intersection videos and proposed a multivariate conflict indicator that integrates PET, relative speed, and relative distance to classify the conflict severity.
In addition to spatio-temporal proximity indicators, recent studies have increasingly utilized evasive action-based indicators to analyze non-motorized traffic conflicts. Tageldin et al. [
21,
22,
23] demonstrated that indicators based on evasive maneuvers are more effective than spatio-temporal indicators in quantifying traffic conflicts between two-wheelers and pedestrians under mixed traffic conditions. Guo et al. [
24] investigated the powered two-wheeler conflicts in less-organized traffic environments, finding that the yaw rate ratio (YRR) can effectively measure the severity of conflict between e-bikes and bicycles on shared paths. Liu et al. [
25] further assessed the effectiveness of different indicators for evaluating conflict severity on slow-moving shared paths, confirming the efficacy of TTC
min and YRR, while the deceleration rate to avoid collision (DRAC) proved non-essential.
To scientifically analyze the influencing factors of non-motorized vehicle conflict frequency and severity, researchers have primarily developed models that consider road environment and traffic operation conditions. Tibor et al. [
26] constructed a statistical model to compare and analyze the factors affecting the probability of conflict between e-bikes and bicycles, revealing that the disparity in conflict risk among road users at crossings is mainly attributable to speed. Lu et al. [
27] applied a generalized linear regression model and concluded that traffic volume, speed, and lane width are the key factors contributing to the frequency of conflicts on non-motorized roads. Liang et al. [
16] analyzed the characteristics of conflicts between pedestrians and non-motorized vehicles on slow-moving shared paths, proving that high traffic volume and the complexity of the traffic environment might increase conflict risk. Wang [
28] employed a random forest model to rank the contributions of 13 influencing factors, demonstrating that the speeds of both conflict parties and violation behaviors are critical determinants of conflict severity. Liu et al. [
29] investigated the conflict between pedestrians and two-wheelers at signalized intersections and constructed a random parameter ordered logit model to assess the impact of individual and traffic-related factors on conflict severity. Wei et al. [
30] used a meta-automata model to simulate non-motorized traffic conflicts, revealing that conflict numbers increased slowly at low pedestrian arrival rates but exhibited a U-shaped trend as arrival rates rose. Wang et al. [
31] indicated that the speed differential and relative speed had the greatest effect on the conflict severity, while the evasive action of the e-bike had minimal effect on the movement status of both conflict parties.
3. Survey Design
3.1. Survey Locations and Data Collection
In Shenzhen, China, slow-moving shared paths comprise approximately 80% of the cycling infrastructure for non-motorized vehicles. Since e-bikes account for nearly 80% of all non-motorized vehicles in the city [
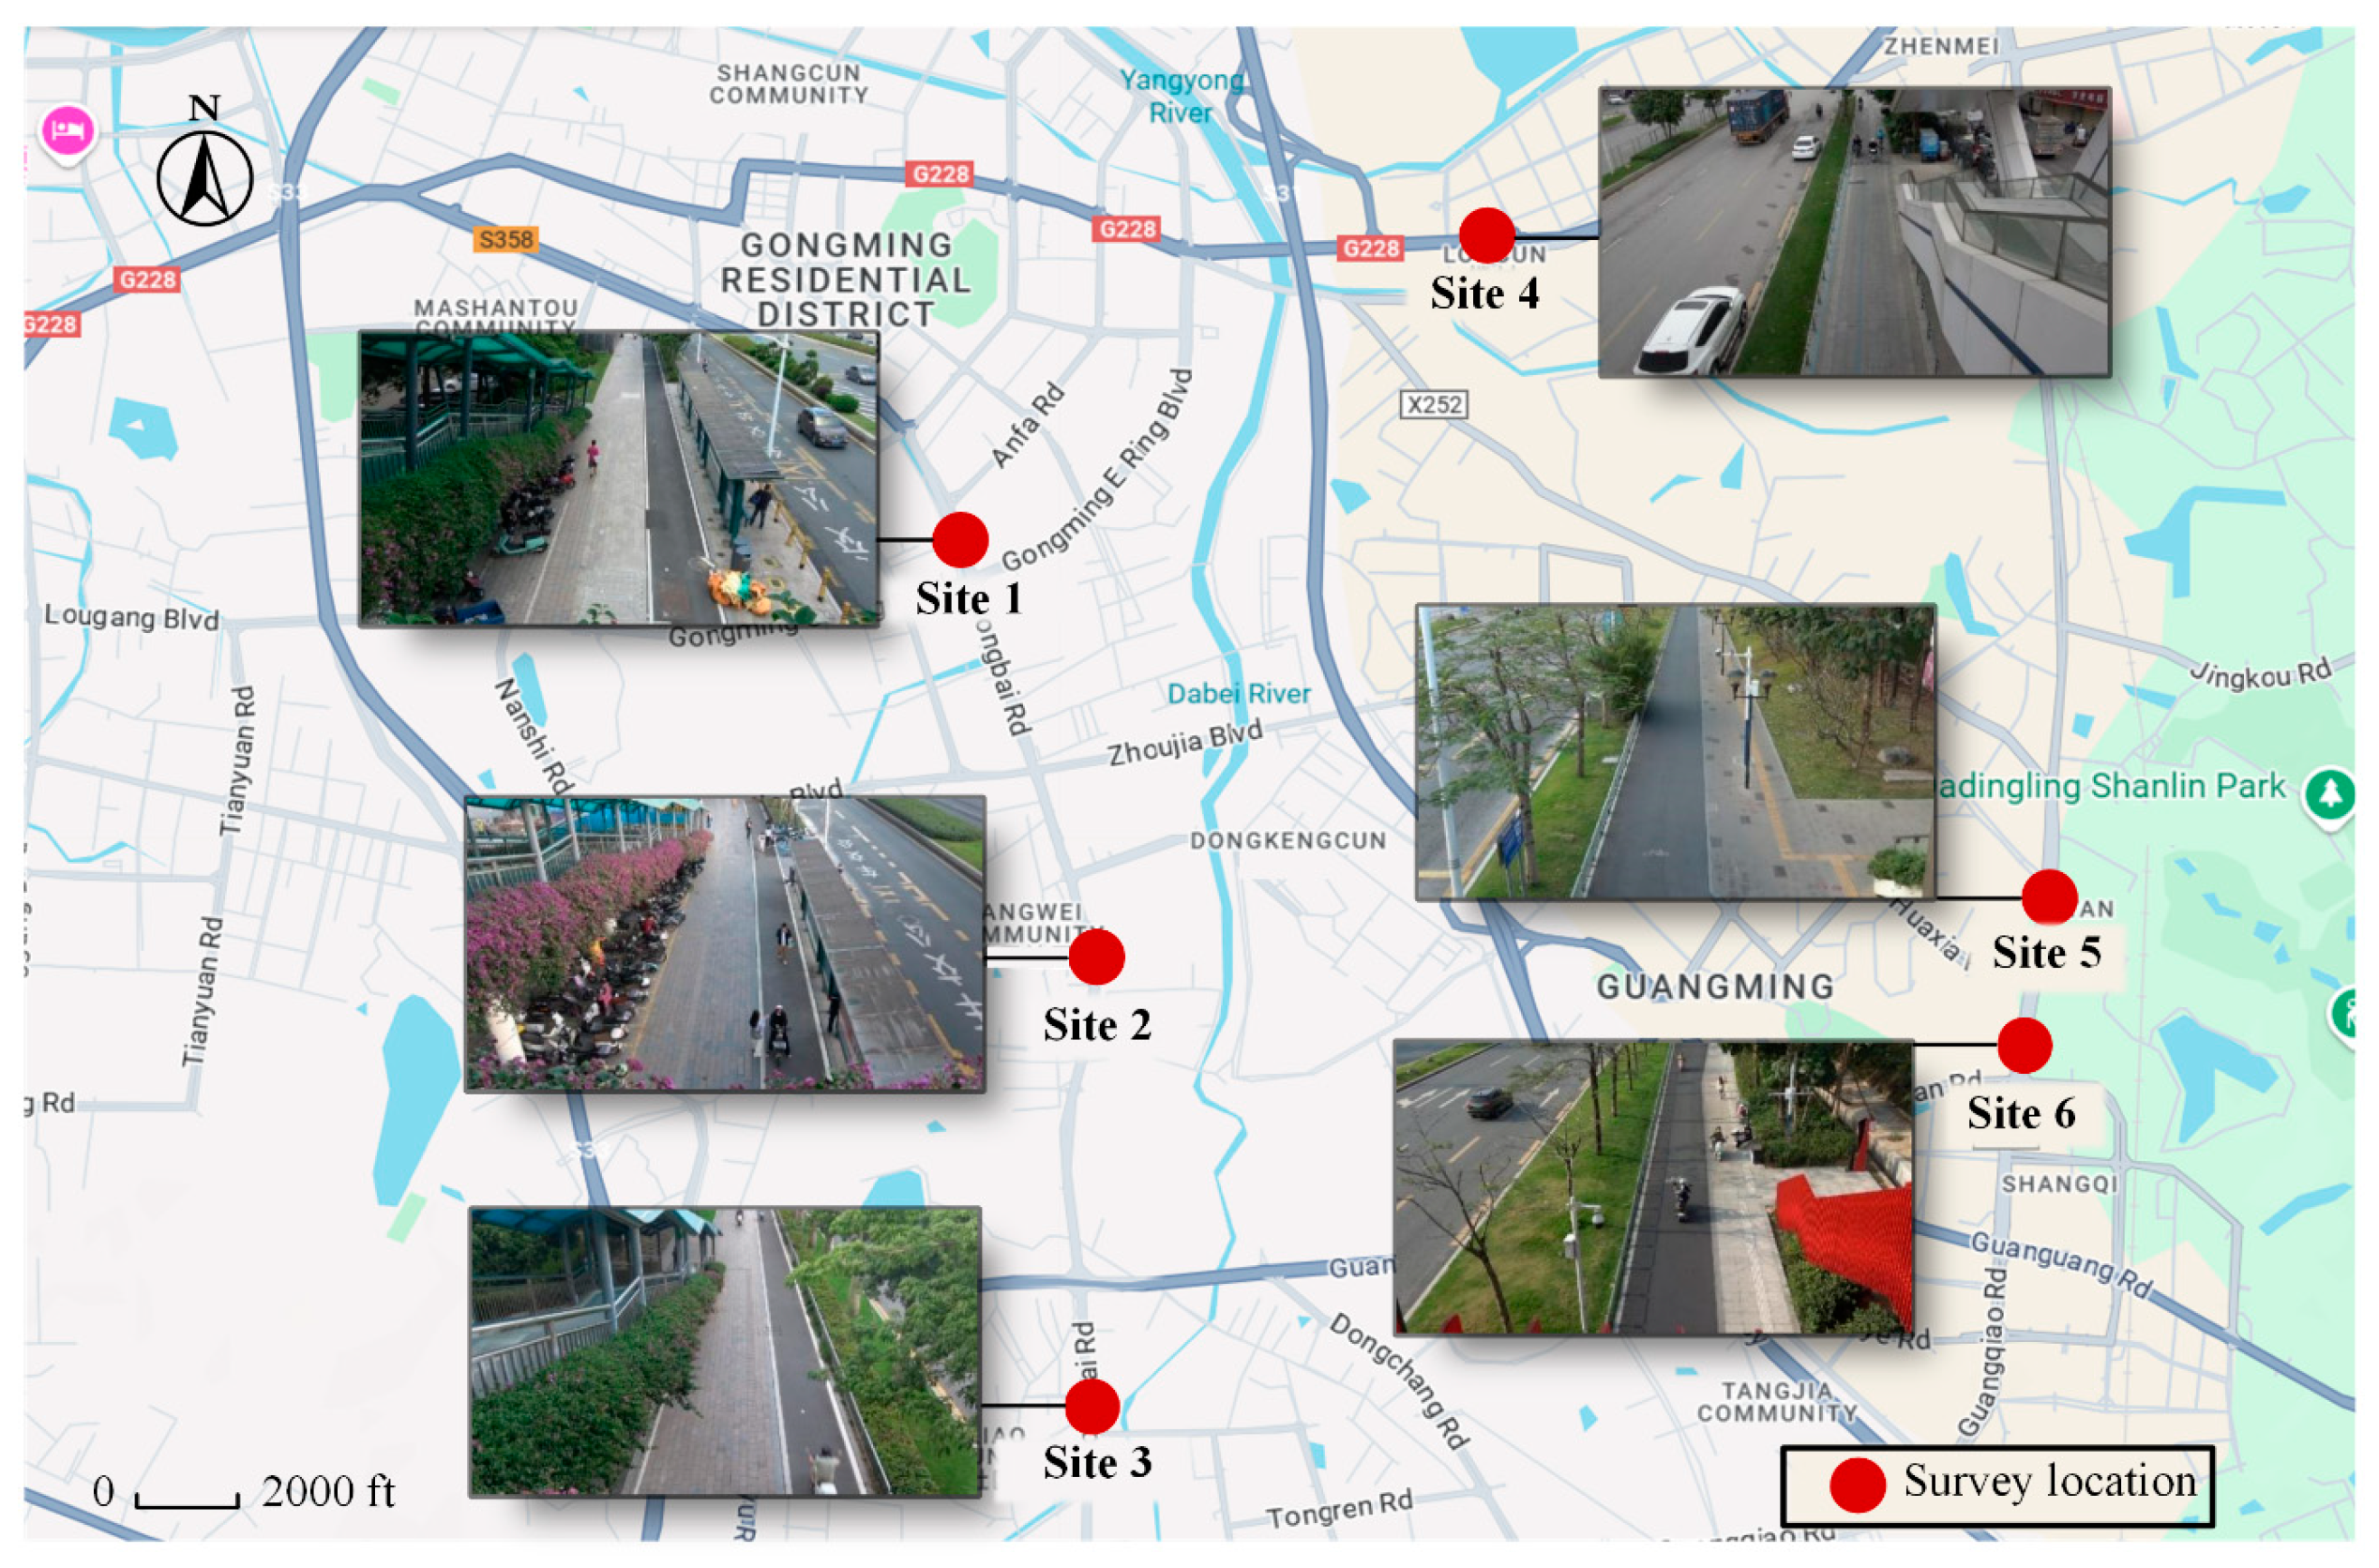
32], e-bikes frequently interact with bicycles and pedestrians on shared paths. This mixed-traffic condition aligns with the objectives of the study. Therefore, six representative slow-moving shared paths in Shenzhen were selected as survey locations, as shown in
Figure 1. The survey locations are distributed across major functional zones, including residential, commercial, and public service areas, with a high demand for slow-moving traffic. These road sections feature no physical separation or height difference between non-motorized vehicle roads and pavements. Instead, the space division is only denoted by road markings or paving materials, while being separated from motor vehicle lanes via green belts or barriers, a typical design practice for shared paths in Shenzhen. Moreover, road users often disregard the designated lanes, resulting in widespread illegal lane occupation and wrong-way riding—behaviors commonly seen on shared paths.
A video-based traffic survey was conducted using high-precision cameras to capture the reality of the traffic. The camera was installed on a pedestrian bridge, providing an overhead view covering approximately 40 m of roadway. The recording environment was free from major visual obstructions such as buildings or trees, ensuring clear trajectory extraction and reliable data collection. Video recordings were conducted during weekday morning and evening peak hours. Each site was recorded for over one hour, providing a sufficient data foundation for subsequent traffic conflict analysis.
3.2. Traffic Conflict Trajectory Extraction
Conflict trajectories were extracted from the collected video footage. The footage was imported into Petrack, an object-tracking software used to extract movement trajectories of traffic participants. To align extracted trajectories with real-world coordinates, camera calibration was performed within the software. First, intrinsic parameters were calibrated. After fixing the focal length, multiple images of a checkerboard calibration board were captured from different angles. These images were then imported into the software to automatically estimate the camera’s internal parameters and distortion coefficients. Next, extrinsic parameter calibration was performed by establishing a reference scale and Cartesian coordinate system. Surveyors stood at various predefined locations visible in the footage, and the real-world distances between these points were manually measured to provide a scale factor for restoring true distances. The coordinate system is defined as follows: x-axis along the travel direction, y-axis across the road width, and z-axis perpendicular to the road surface.
Once the calibration was completed, Petrack was used to extract the conflict trajectory data. The software tracked key feature points (the head positions) of pedestrians and cyclists, generating the x- and y-coordinates for each road user at every frame. The video frame rate was set at 25 frames per second, corresponding to a temporal resolution of 0.04 s per frame. During the trajectory extraction process, the position coordinates of both conflicting parties were recorded for each frame. To minimize trajectory noise caused by head movement and improve trajectory accuracy, a mean filtering algorithm was applied. Specifically, a moving average over five frames was calculated for each trajectory point, effectively smoothing fluctuations and reducing measurement errors.
3.3. Traffic Conflict Identification
Traffic conflict is defined as a situation in which two or more road users come into critical proximity in both time and space, such that a collision would occur if none of the parties altered their motion state [
33]. The conflict extraction process began with trained transportation engineering students systematically analyzing video recordings. Potential conflict events were identified based on evasive maneuvers, such as deceleration or steering, undertaken to avoid a collision. Next, the quantitative conflict indicator was calculated to filter the identified potential conflict events, thereby minimizing subjectivity and eliminating misidentified cases.
Traffic conflicts are generally categorized into angle conflicts, head-on conflicts, and rear-end conflicts [
22]. Video observations in the study area indicate that rear-end conflicts are the most prevalent, while head-on conflicts occur less frequently, and angle conflicts are almost nonexistent. This distribution is closely related to the characteristics of the survey location—the limited width of slow-moving shared paths constrains vehicle movement primarily to either the same or opposite directions, reducing the likelihood of angle conflicts. Given these conditions, this study focused exclusively on rear-end and head-on conflicts, involving either interactions between non-motorized vehicles or between non-motorized vehicles and pedestrians.
Time to collision (TTC) is one of the most commonly used indicators for identifying rear-end conflicts and other conflicts involving road users [
34]. TTC represents the remaining time until a collision occurs if both parties maintain their current trajectories and speeds. Based on the relative positions of the two conflicting parties between consecutive two frames, the instantaneous TTC(t) values at time t can be calculated, as expressed in Equation (1):
where
and
represent the position coordinates (m) of the two conflicting parties at time t.
and
denote their respective speeds (m/s) at time t, treated as scalar values. In the equation, head-on conflicts use
; rear-end collision conflicts use
(where
is the speed of the following vehicle).
The minimum TTC obtained from each potential conflict event was adopted for conflict identification. According to previous research [
19,
35,
36], a TTC threshold of 4 s is commonly used to identify conflicts for similar traffic scenarios. Specifically, a valid conflict is identified if there exists any
such that TTC(t) < 4 s, where
and
denote the start and end of the interaction period. Applying this threshold, potential conflicts with TTC
min values greater than 4 s were excluded, obtaining a final dataset of 1164 valid conflict samples for further analysis.
4. Methodology
4.1. Method for Classifying Conflict Severity
4.1.1. Conflict Indicator
Traffic conflict analysis commonly employs Surrogate Safety Measures (SSM) as indicators to quantify conflict severity. Research has shown that a single conflict indicator cannot comprehensively capture the severity of a conflict [
26]. According to the definition of traffic conflicts, conflict severity increases with closer time–space proximity and more intense evasive maneuvers [
8]. Therefore, this study adopts TTC
min to assess spatio-temporal proximity and incorporates an evasive maneuver-based indicator. Liu et al. [
25] demonstrated that YRR serves as an effective measure for identifying conflict severity on shared paths. Thus, YRR is also adopted in this study. It should be noted that conflict severity represents only the likelihood of a conflict escalating into a collision—in other words, it reflects collision risk.
Cyclists commonly perform steering maneuvers during cycling that involve changes in their direction. The yaw rotation describes the rotation around the vertical yaw axis (
Z-axis). The yaw rate is defined as the angular velocity of this rotation or the rate of change of its heading angle. Steering behaviors can be quantitatively assessed through the trajectory of non-motorized vehicles. Based on the trajectory coordinate data of each frame, the yaw rate r(t) is calculated from the change in heading angle
between consecutive trajectory points. The fomula is presented in Equation (2):
To characterize the intensity of evasive maneuvers, the variation in yaw rate over short time intervals is analyzed. YRR refers to the ratio of the difference between the maximum and minimum yaw rates of a non-motorized vehicle during an evasive maneuver to the corresponding time interval. It quantifies high-turning characteristics of non-motorized vehicles over short time intervals [
21]. The formula is presented in (3):
where
is the time difference between the maximum and minimum yaw rate occurrences. A higher YRR value indicates a more rapid steering maneuver, suggesting a more severe traffic conflict.
4.1.2. Fuzzy C-Means Clustering
Traffic conflict severity is classified using clustering analysis based on TTC
min and YRR. Clustering analysis is a multivariate statistical method for categorizing indicators or samples, demonstrating strong adaptability, particularly when handling high-dimensional data [
37]. In this study, the fuzzy c-means (FCM) clustering algorithm is employed due to its significant advantages over other traditional clustering methods. FCM incorporates fuzziness to describe the intermediary nature of data attributes and classifications, making it particularly effective when category boundaries are ambiguous, which enhances the flexibility and reliability of clustering outcomes [
38]. Considering the inherent fuzziness in traffic conflict data on shared paths, where conflict severity boundaries are difficult to define precisely, the FCM algorithm is selected as the most suitable clustering approach. The maximum number of iterations was set to 300 and the convergence threshold was set to 1 × 10
−5, following standard practices to ensure clustering stability and computational efficiency [
39,
40].
The FCM clustering algorithm necessitates the predefinition of the number of clusters and the fuzziness coefficient, both of which directly influence the final clustering results. To determine the optimal fuzziness coefficient and number of clusters, this study compares the performance of FCM across different cluster numbers. Since relying on a single evaluation index may be limiting, three common clustering evaluation indexes are adopted: the Calinski–Harabasz index (CHI), the Davies–Bouldin index (DBI), and the Silhouette Coefficient (SC). A higher CHI value indicates a greater dispersion of data points among clusters, signifying better clustering performance. A lower DBI value suggests tighter and well-separated clusters. The SC ranges from −1 to +1, where higher values indicate better alignment between a point and its assigned cluster [
41].
4.2. Influencing Factor Analysis Model
4.2.1. Feature Variable Selection
Traffic conflicts are influenced by a variety of factors. Previous studies have primarily examined road environment features, traffic operation features, and conflict sample information. However, the shared paths analyzed in this study exhibit high disorder and complexity, while road users demonstrate notable behavioral unpredictability. Therefore, it is necessary to incorporate the behavioral characteristics of non-motorized vehicles and pedestrians when analyzing conflict severity. Accordingly, 19 feature variables are selected across four dimensions: road environment features, traffic operation features, conflict sample information, and conflict behavior features.
A detailed description of these variables is presented in
Table 1. The variable selection prioritizes validity and measurability to ensure accurate measurement and effective modeling. Each conflict sample corresponds to a complete set of 19 feature variables, manually extracted by repeated review of the video data. Specifically, “roadside land use” was classified based on field surveys and determined according to the Code for Classification of Urban Land Use and Planning Standards of Development Land [
42]. “Bus stop within 50 m” and “Intersection within 50 m” indicate whether a bus stop or an intersection is located within the surveyed road segment or within 50 m of its boundary.
4.2.2. SMOTE Random Forest Model and SHAP Interpretation
Classifying traffic conflicts into different types by severity is a classification problem. Random forest (RF), an ensemble learning method, is widely used for classification and regression tasks. In transportation research, RF is commonly applied to identify the relative importance of variables [
43,
44]. For classification, once the forest is constructed, each new input sample is evaluated independently by every decision tree within the forest. RF integrates the advantages of Bootstrap sampling and random feature selection, offering strong adaptability to datasets, robust resistance to noise, and high predictive performance [
45]. Given these advantages, RF is adopted in this study as the classification model for analyzing the importance of selected feature variables.
In the classification of traffic conflict severity, raw data are often imbalanced, with significant disparities in the number of samples across severity levels. Using such imbalanced datasets for modeling may lead to classification bias. To address such issues, oversampling techniques are commonly applied to increase the representation of minority classes, thereby improving data balance and enhancing model accuracy. The Synthetic Minority Oversampling Technique (SMOTE) has been widely adopted due to its strong generalization capability and effectiveness in enhancing model performance and stability [
46]. SMOTE generates synthetic samples by interpolating between minority class instances and their nearest neighbors in feature space, rather than simply duplicating existing samples. In this study, the dataset is first divided into training and testing sets with a ratio of 4:1. SMOTE is applied exclusively to the training data to avoid information leakage. The number of nearest neighbors (k) is set to 5, which is the most-commonly recommended setting for handling imbalanced datasets. Following data balancing, the random forest model is trained to assess the importance of different features. Feature importance scores are computed based on the original, imbalanced testing set, thereby minimizing potential distortions introduced by oversampling.
Since the random forest model is often regarded as a “black-box” approach with limited interpretability, the Shapley additive explanation (SHAP) algorithm [
47] is introduced in this study to intuitively illustrate how input variables influence model outputs. SHAP is a unified framework for interpreting model predictions, grounded in cooperative game theory, specifically based on the concept of Shapley values. The core idea is to fairly distribute the model’s prediction among all input features by computing each feature’s marginal contribution. The Shapley value for a feature
p is calculated as
where
is the contribution of feature
p,
is the subset of the features,
is the set of all features,
is the number of input features, and
is the prediction for feature values in set
.
In this study, SHAP analysis is applied to the trained random forest model to clarify the direction (positive or negative) of effects of features on conflict severity.
5. Results
5.1. Conflict Severity Classification
5.1.1. Analysis of Conflict Indicators
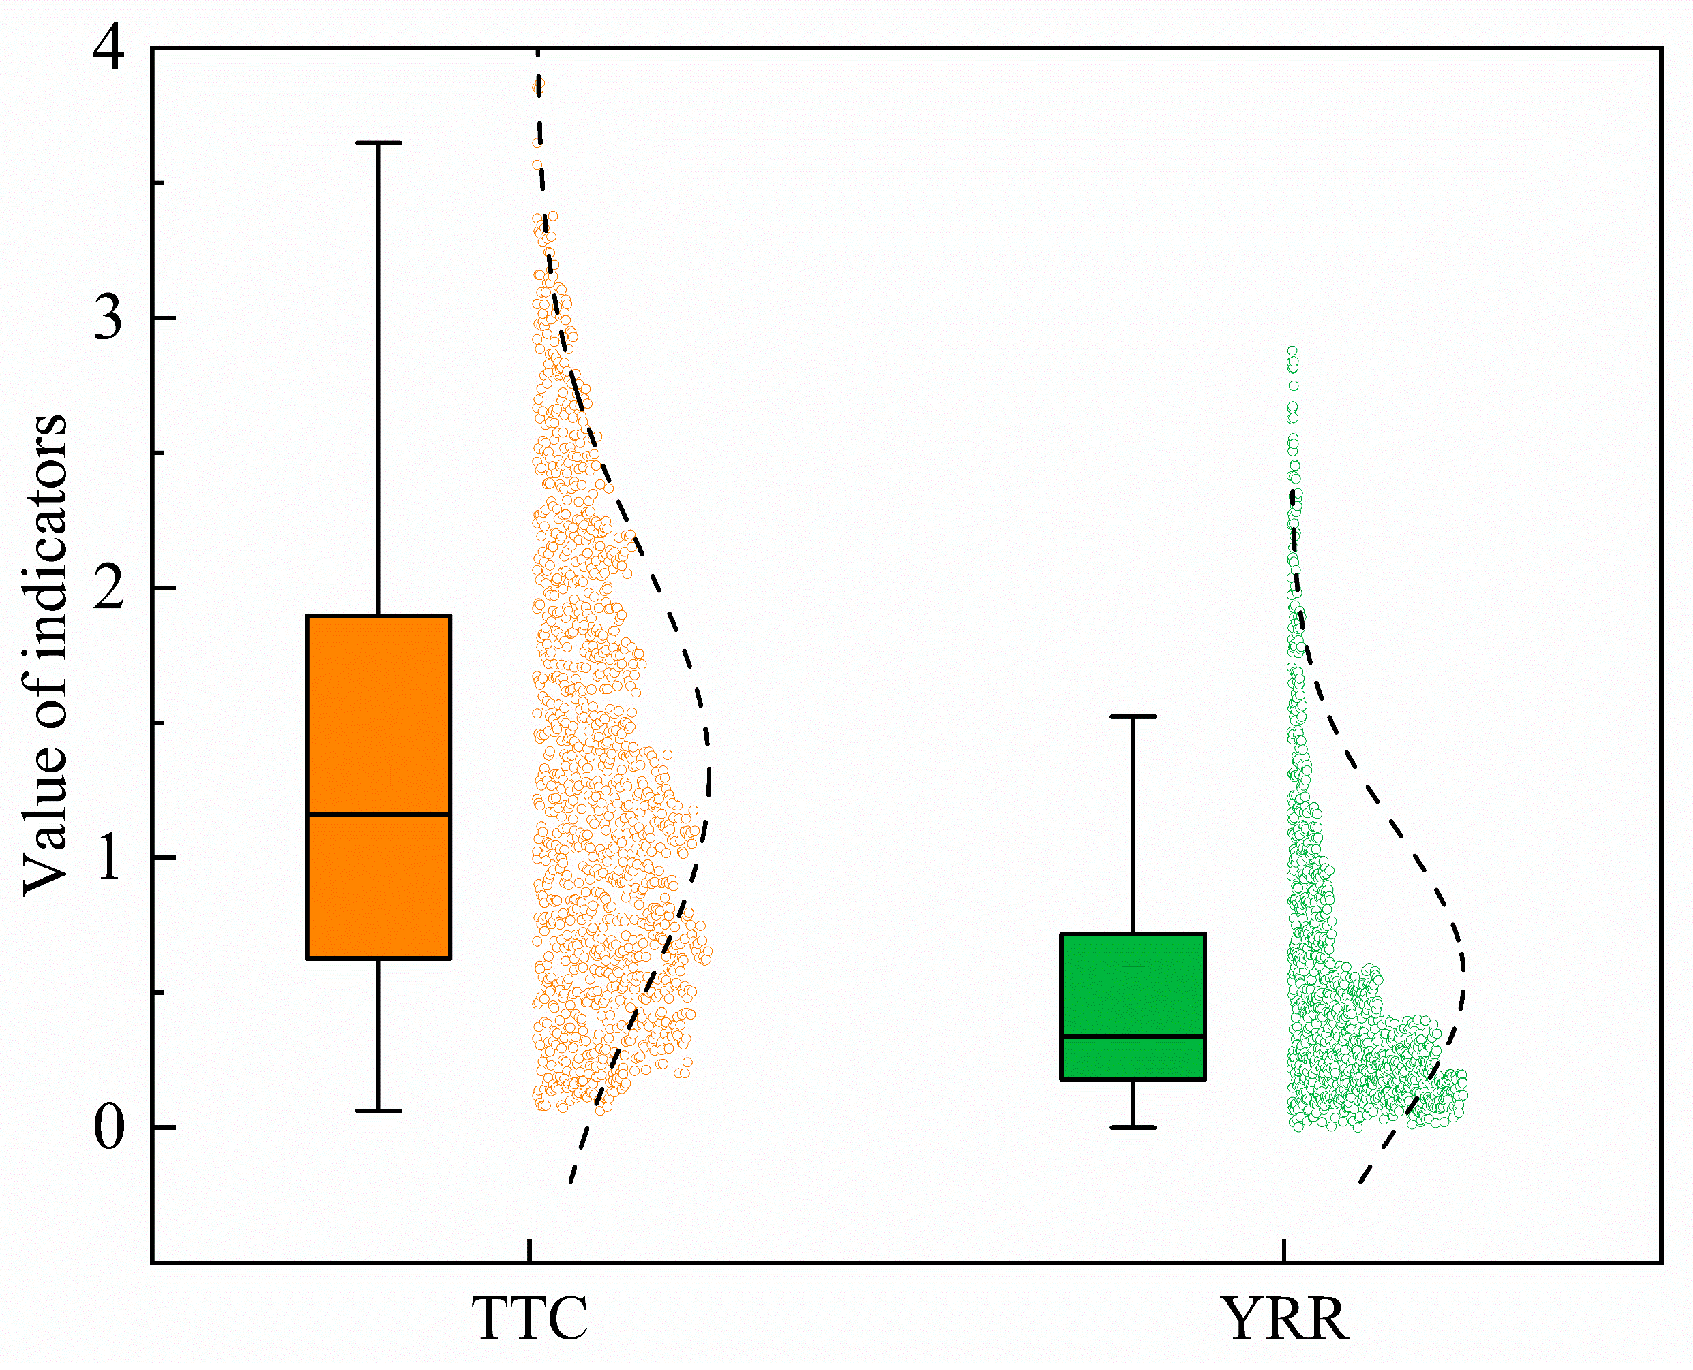
The TTC values range from 0.0632 to 3.870 s, with a mean value of 1.302 s. The YRR values range from 0 to 2.879 rad/s
2, with a mean value of 0.552 rad/s
2.
Figure 2 illustrates the statistical distribution of both indicators. TTC values display considerable dispersion but are notably concentrated below 2 s, reflecting a wide variation in the temporal proximity between conflicting parties. In contrast, YRR values are heavily skewed towards lower levels, indicating that most conflicts involved relatively mild evasive maneuvers, while only a few exhibited intense steering actions. These distribution patterns reveal the inherent limitations of relying on a single indicator to assess conflict severity. Solely using TTC may underestimate conflicts characterized by significant evasive actions despite longer time-to-collision margins. Similarly, focusing only on YRR might neglect the urgency dimension of conflicts where minimal evasive actions occurred under extremely short TTC conditions. Therefore, a combined evaluation of TTC and YRR is essential to comprehensively capture both the temporal urgency and behavioral intensity of conflicts.
5.1.2. Determination of Cluster Number and Fuzziness Coefficient
The optimal number of clusters is determined based on the clustering evaluation indexes mentioned in
Section 4.1.2, ensuring a rational classification of conflict severity. The cluster number is set within the range of 2 to 6. The FCM algorithm is applied to each cluster number, and CHI, DBI, and SC evaluation indexes are calculated. The results are shown in
Figure 3. It illustrates that when the number of clusters is 3, the CHI and SC values reach their maximum, while the DBI value is at its minimum, indicating the optimal clustering performance. Therefore, the conflict severity is ultimately categorized into three levels: potential conflicts, minor conflicts, and serious conflicts.
To determine the optimal fuzziness coefficient m, a comparative experiment is conducted by setting m to 1.5, 2.0, and 2.5, respectively. The clustering performance under each setting was evaluated using the internal validation metrics: SC, DBI, and CHI. The results are summarized in
Table 2. While m = 1.5 yields the highest CHI value, it results in a lower SC and a higher DBI, indicating reduced cluster compactness and increased overlap. In contrast, the setting of m = 2.0 achieves the best overall balance between cluster cohesion and separation.
To further assess the theoretical consistency of the severity classification, the cluster centers’ trends are examined based on TTC
min and YRR. Traffic conflict theory suggests that more severe conflicts are typically characterized by lower TTC
min and higher YRR values. The cluster centers obtained for each fuzziness coefficient (m) are summarized in
Table 3. The results indicate that a consistent severity gradient appears only when m = 2.0. In this case, TTC
min decreases and YRR increases as conflict severity rises, aligning well with theoretical expectations. In contrast, for m = 1.5 and 2.5, the cluster center values do not follow this trend, reducing the interpretability of the classification results. Therefore, m = 2.0 achieves the balance between clustering fuzziness and interpretability, and is adopted in the present study.
5.1.3. Clustering Result
Table 4 presents the cluster centers and the number of conflicts categorized by severity level. The results show that potential conflicts are the most prevalent, comprising 49.7% of the total, while serious conflicts are the least frequent, accounting for only 12.9%. As conflict severity increases, TTC
min decreases, and YRR increases, suggesting that shorter spatiotemporal proximity and more intense evasive maneuvers are associated with higher severity levels. To statistically validate the influence of TTC
min and YRR on conflict classification, a one-way ANOVA test was conducted. The result indicates that both indicators have significance levels below 0.01, confirming their critical contribution to the clustering process. Therefore, the classification of conflict severity based on TTC
min and YRR is justified and effective.
5.2. Influencing Factor Analysis
5.2.1. Results of the Random Forest Model
As shown in
Section 5.1.2, there is a significant imbalance in the number of conflict samples across different severity levels. Consequently, the SMOTE algorithm is applied to balance the original dataset. Through oversampling, the proportion of potential, minor, and serious conflicts is adjusted to approximately 1:1:1. To evaluate the classification performance of the model, the area under the receiver operating characteristic curve (AUC) was adopted as the evaluation metric. An AUC value close to 1 indicates satisfactory classification. The model achieves an AUC value of 0.81, demonstrating reliable performance in distinguishing between conflict severity levels. Thus, further analysis and interpretation of the model results can be undertaken.
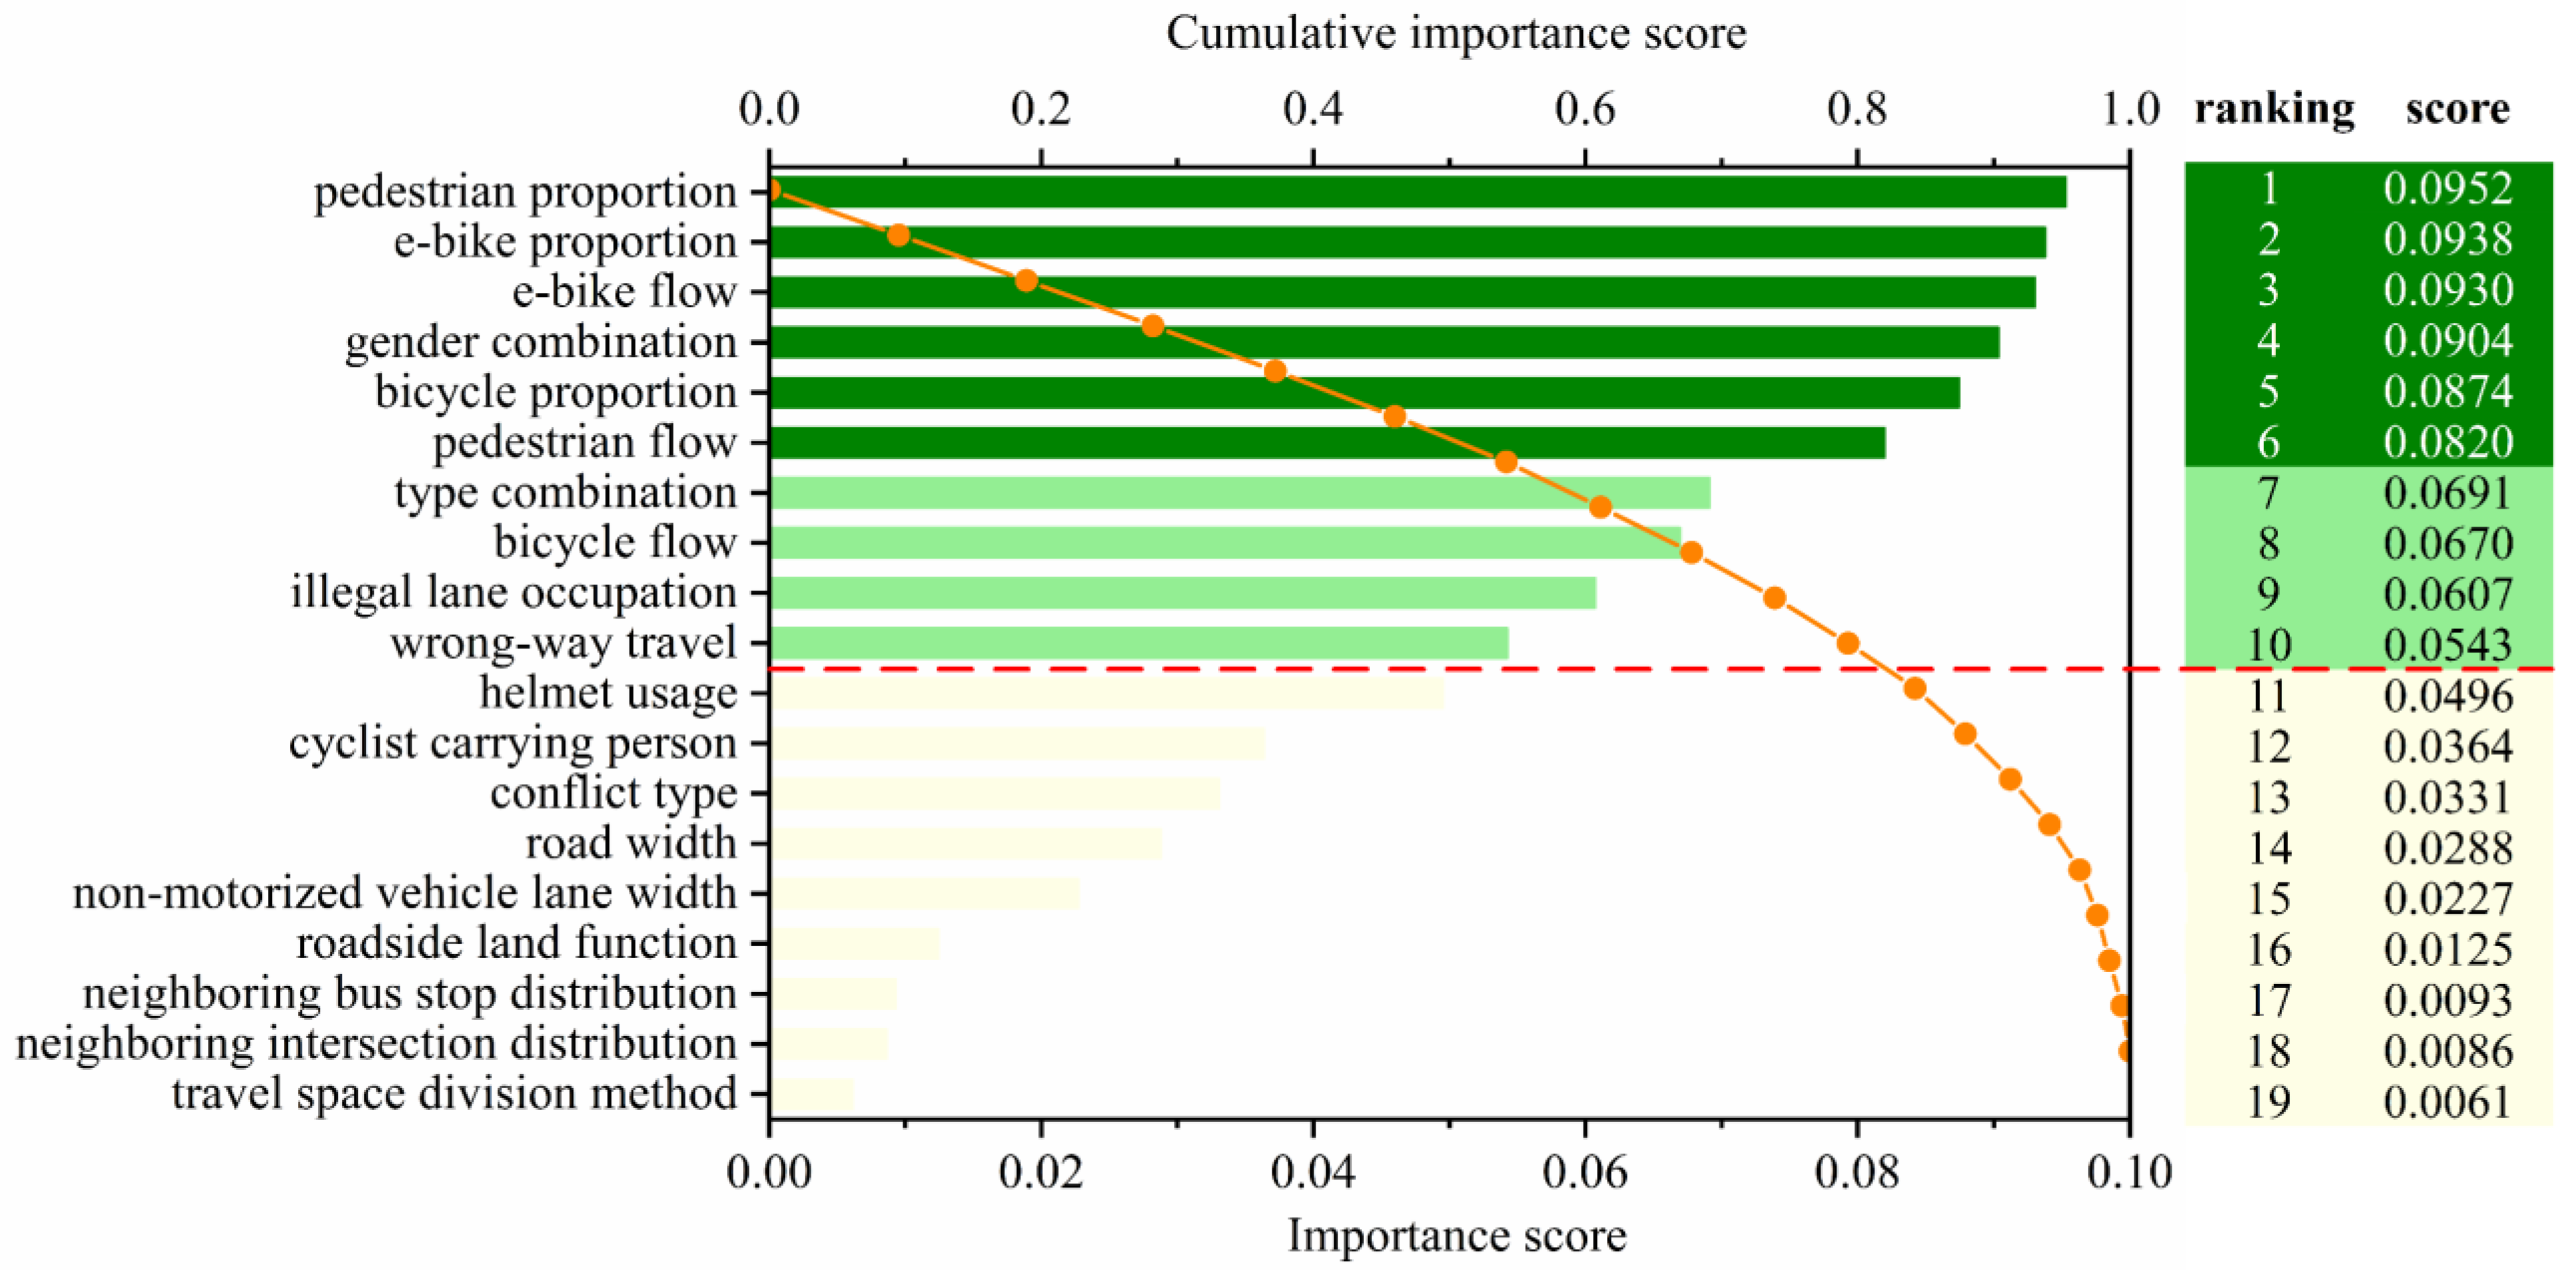
The RF algorithm enables the evaluation of the relative importance of features in classification tasks and allows for visual representation of feature rankings through its tree-based structure. In this study, the importance ranking of feature variables is derived, and the final results are illustrated in
Figure 4. Overall, ten out of the nineteen feature variables are identified as key influencing factors for conflict severity. Among them, six factors exhibit strong influence, with an importance score exceeding 0.08: pedestrian proportion, e-bike proportion, e-bike flow, gender combination, bicycle proportion, and pedestrian flow. Additionally, four factors are classified as weak influencing factors, with importance scores ranging from 0.05 to 0.08: type combination, bicycle flow, illegal lane occupation, and wrong-way travel. The remaining eight variables, each with an importance score below 0.05, are considered to have a relatively minor impact on conflict severity.
In the RF model, the importance score of each influencing factor reflects its relative contribution to the classification process. However, it does not convey the direction of influence (whether positive or negative) on conflict severity. To gain deeper insights into the effects of the ten identified key factors, the following sections present a detailed analysis using SHAP interpretation and statistical methods to illustrate their specific impacts on conflict severity.
5.2.2. Effects of Influencing Factors
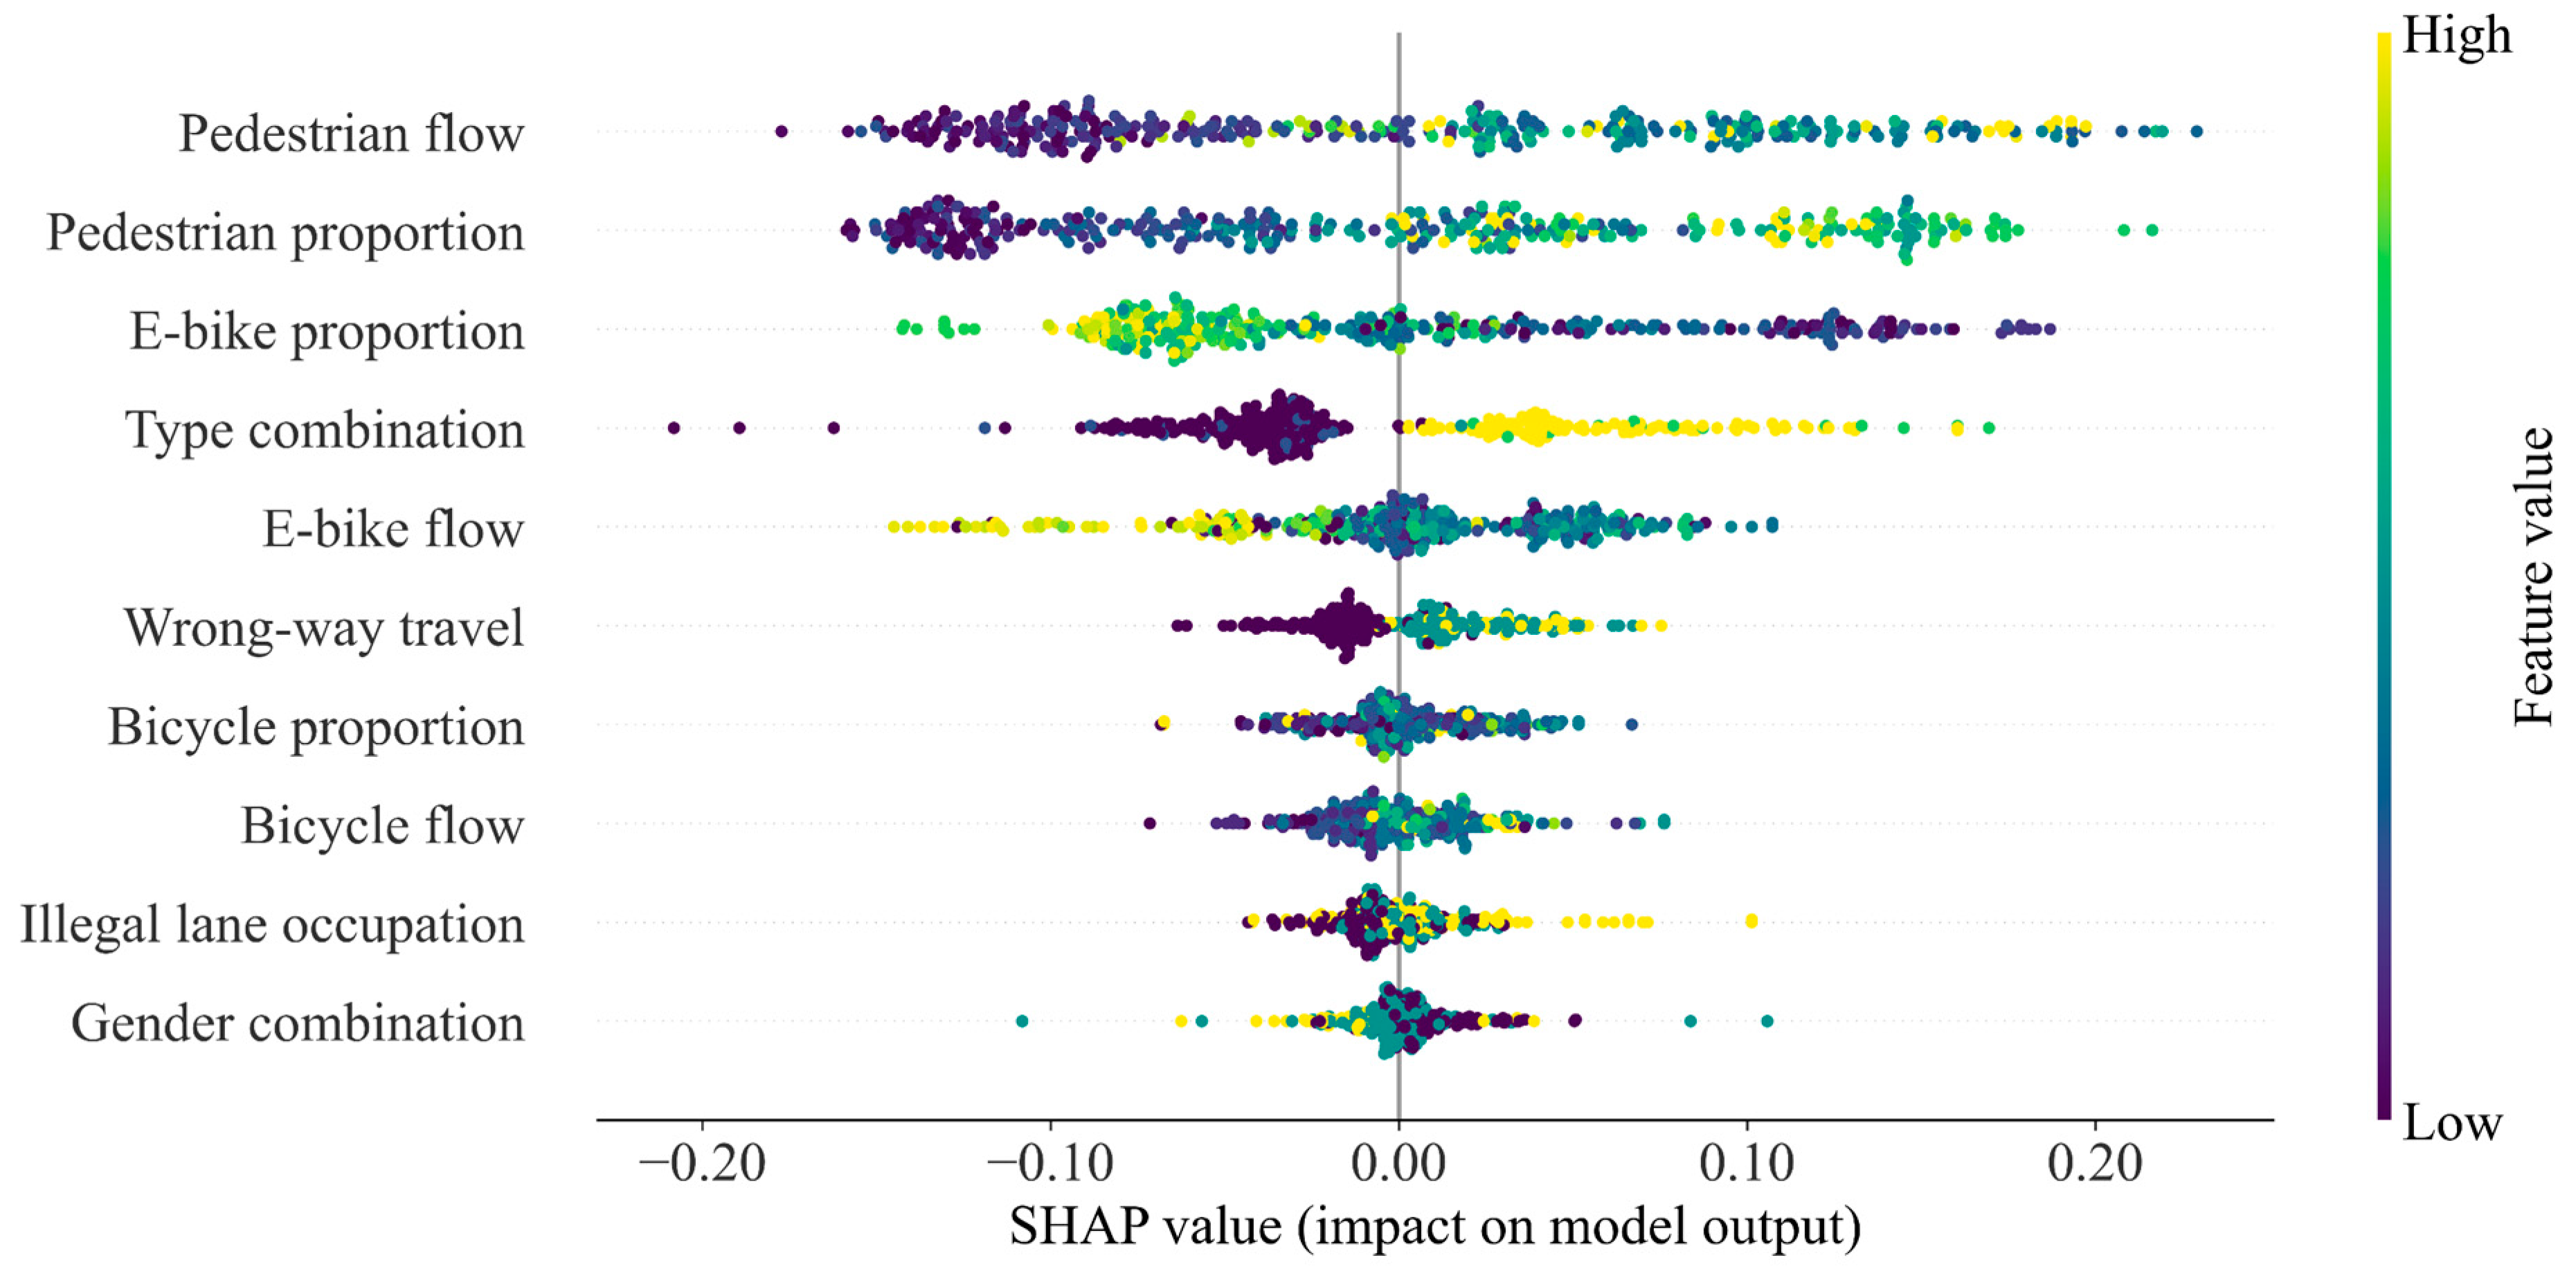
The SHAP summary plot indicates the direction of each feature’s impact on conflict severity, as shown in
Figure 5. The vertical axis lists the feature names, while the horizontal axis displays their corresponding SHAP values. The color of each point represents the magnitude of the feature value, as indicated by the color bar on the right. A positive SHAP value indicates a feature’s contribution to increasing conflict severity, while a negative value reflects a mitigating effect. Overall, higher values of e-bike proportion, e-bike flow, bicycle flow, and gender combination are associated with lower SHAP values, indicating that increases in these feature variables significantly lower conflict severity. Conversely, increases in pedestrian flow and pedestrian proportion are linked to higher conflict severity.
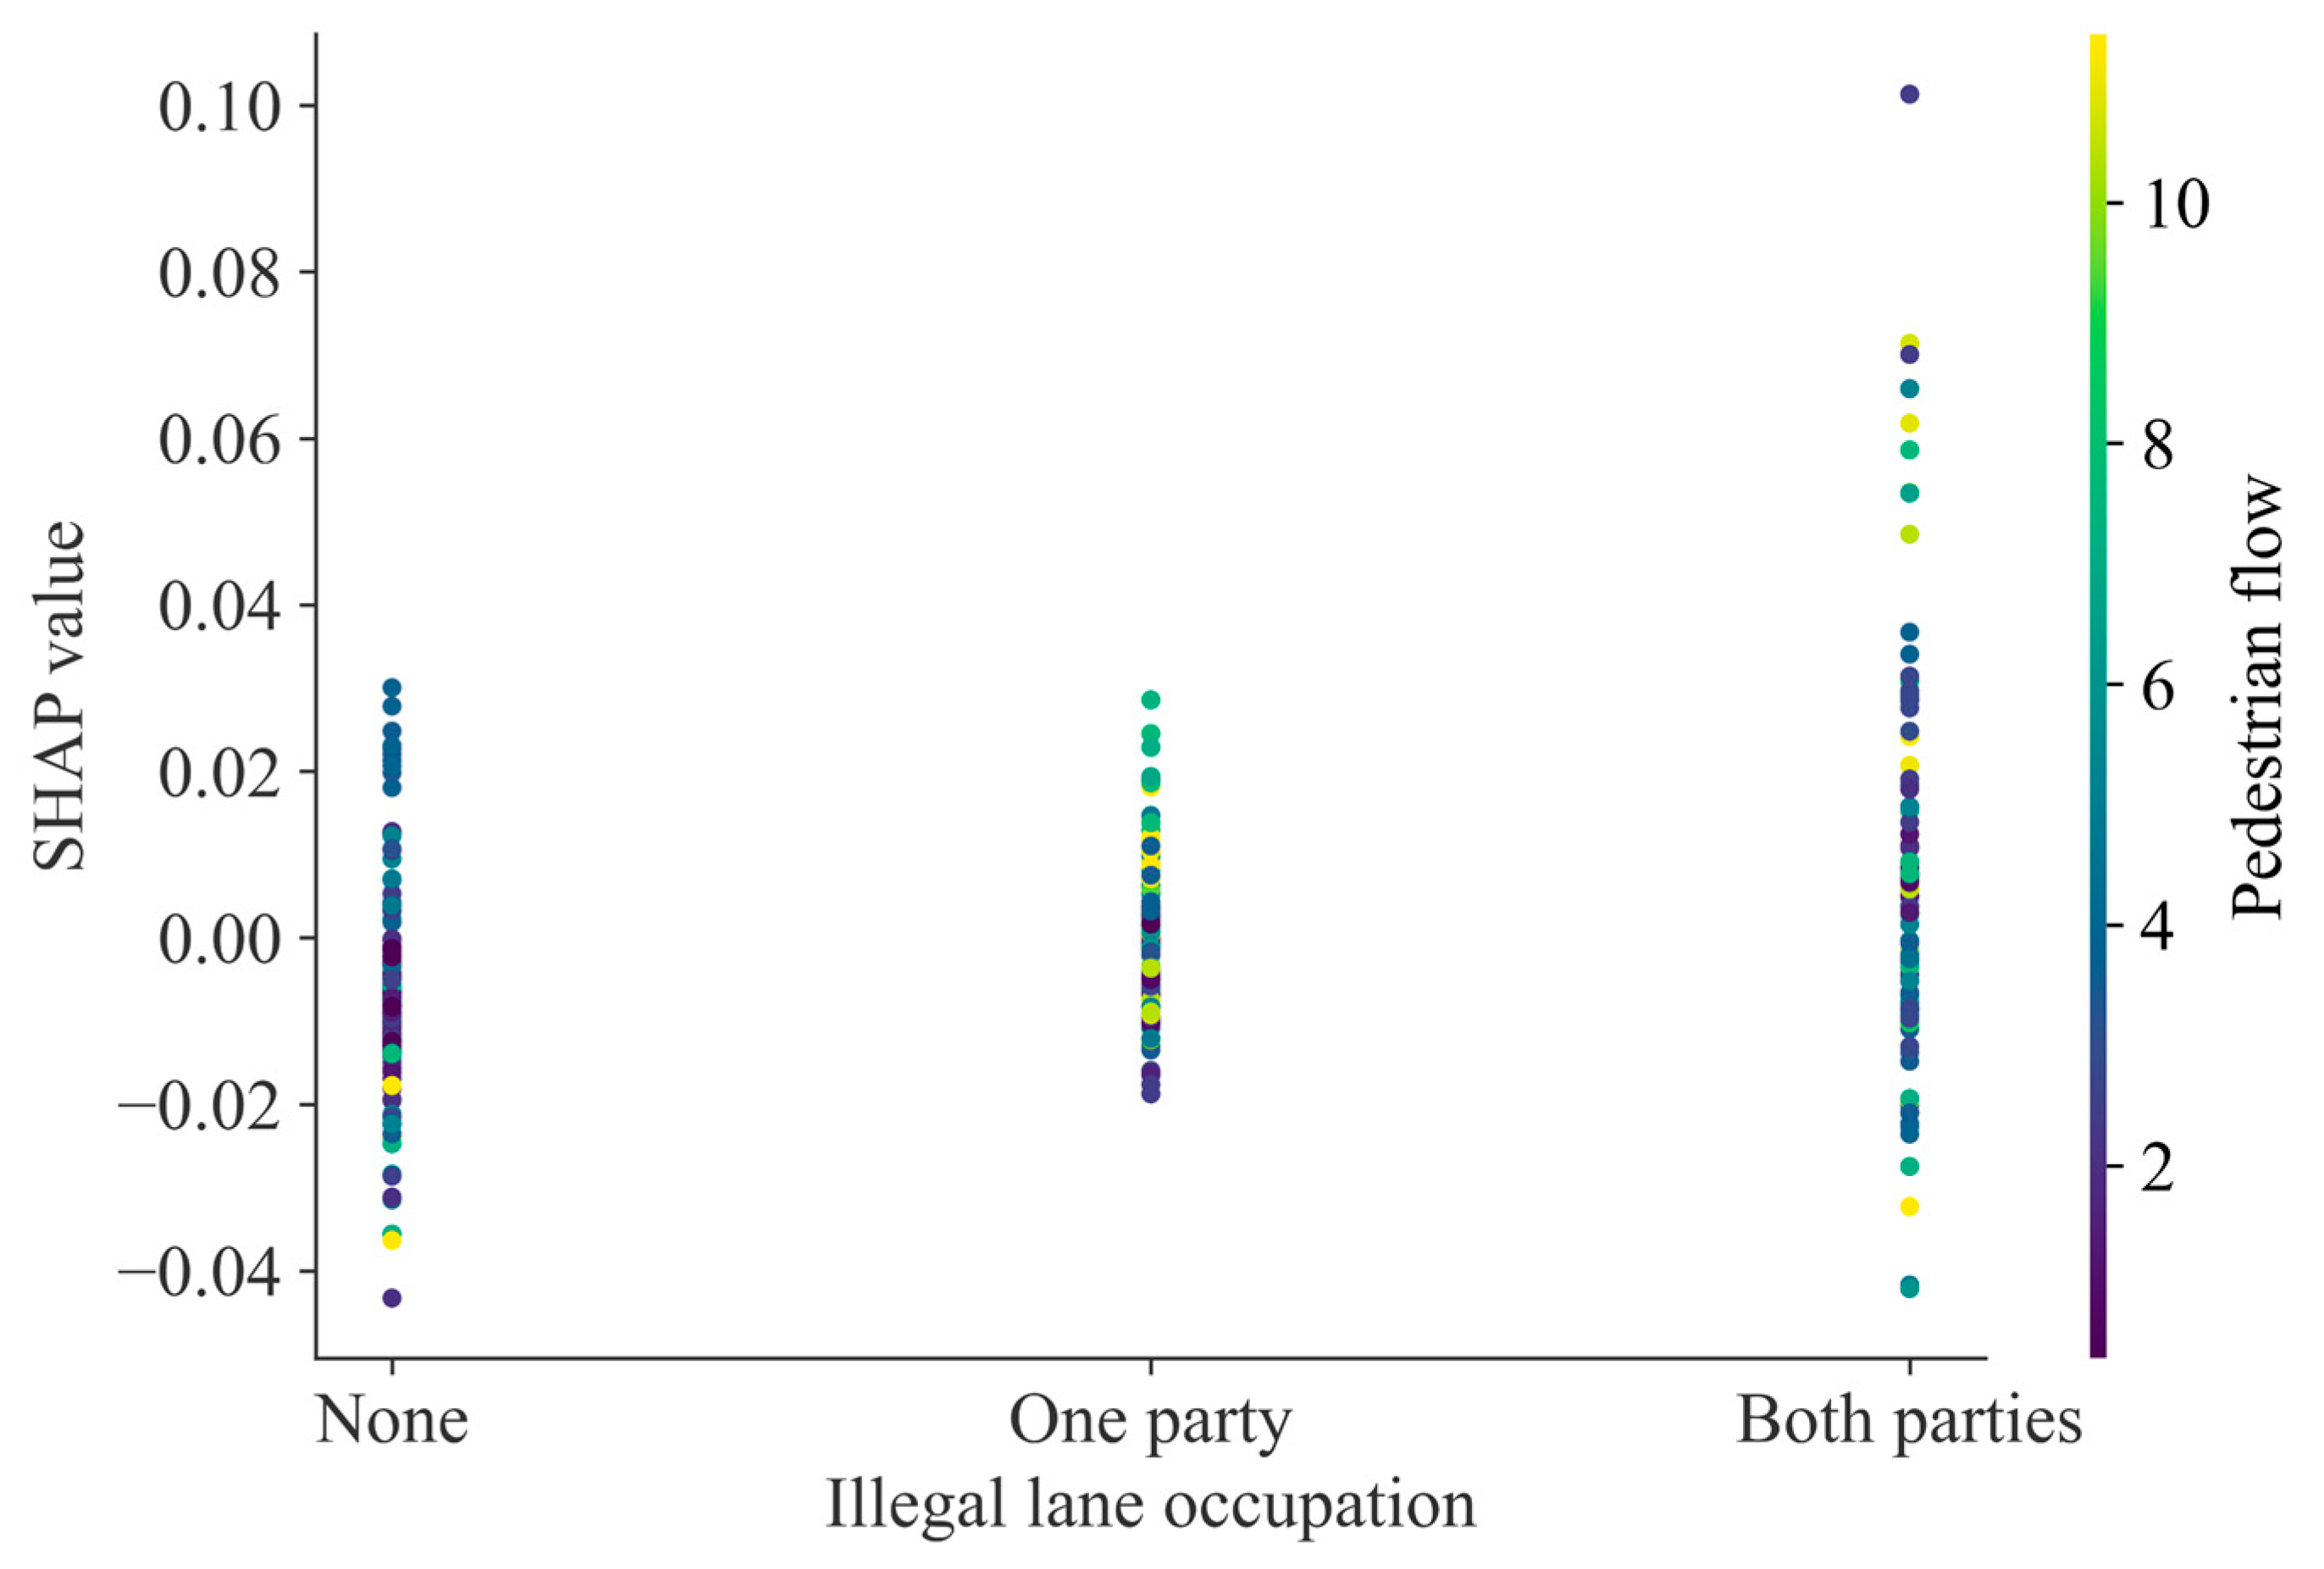
To further explore the interaction effects among influencing factors, SHAP dependence plots are utilized to examine joint impacts between traffic operation features and conflict behavior features.
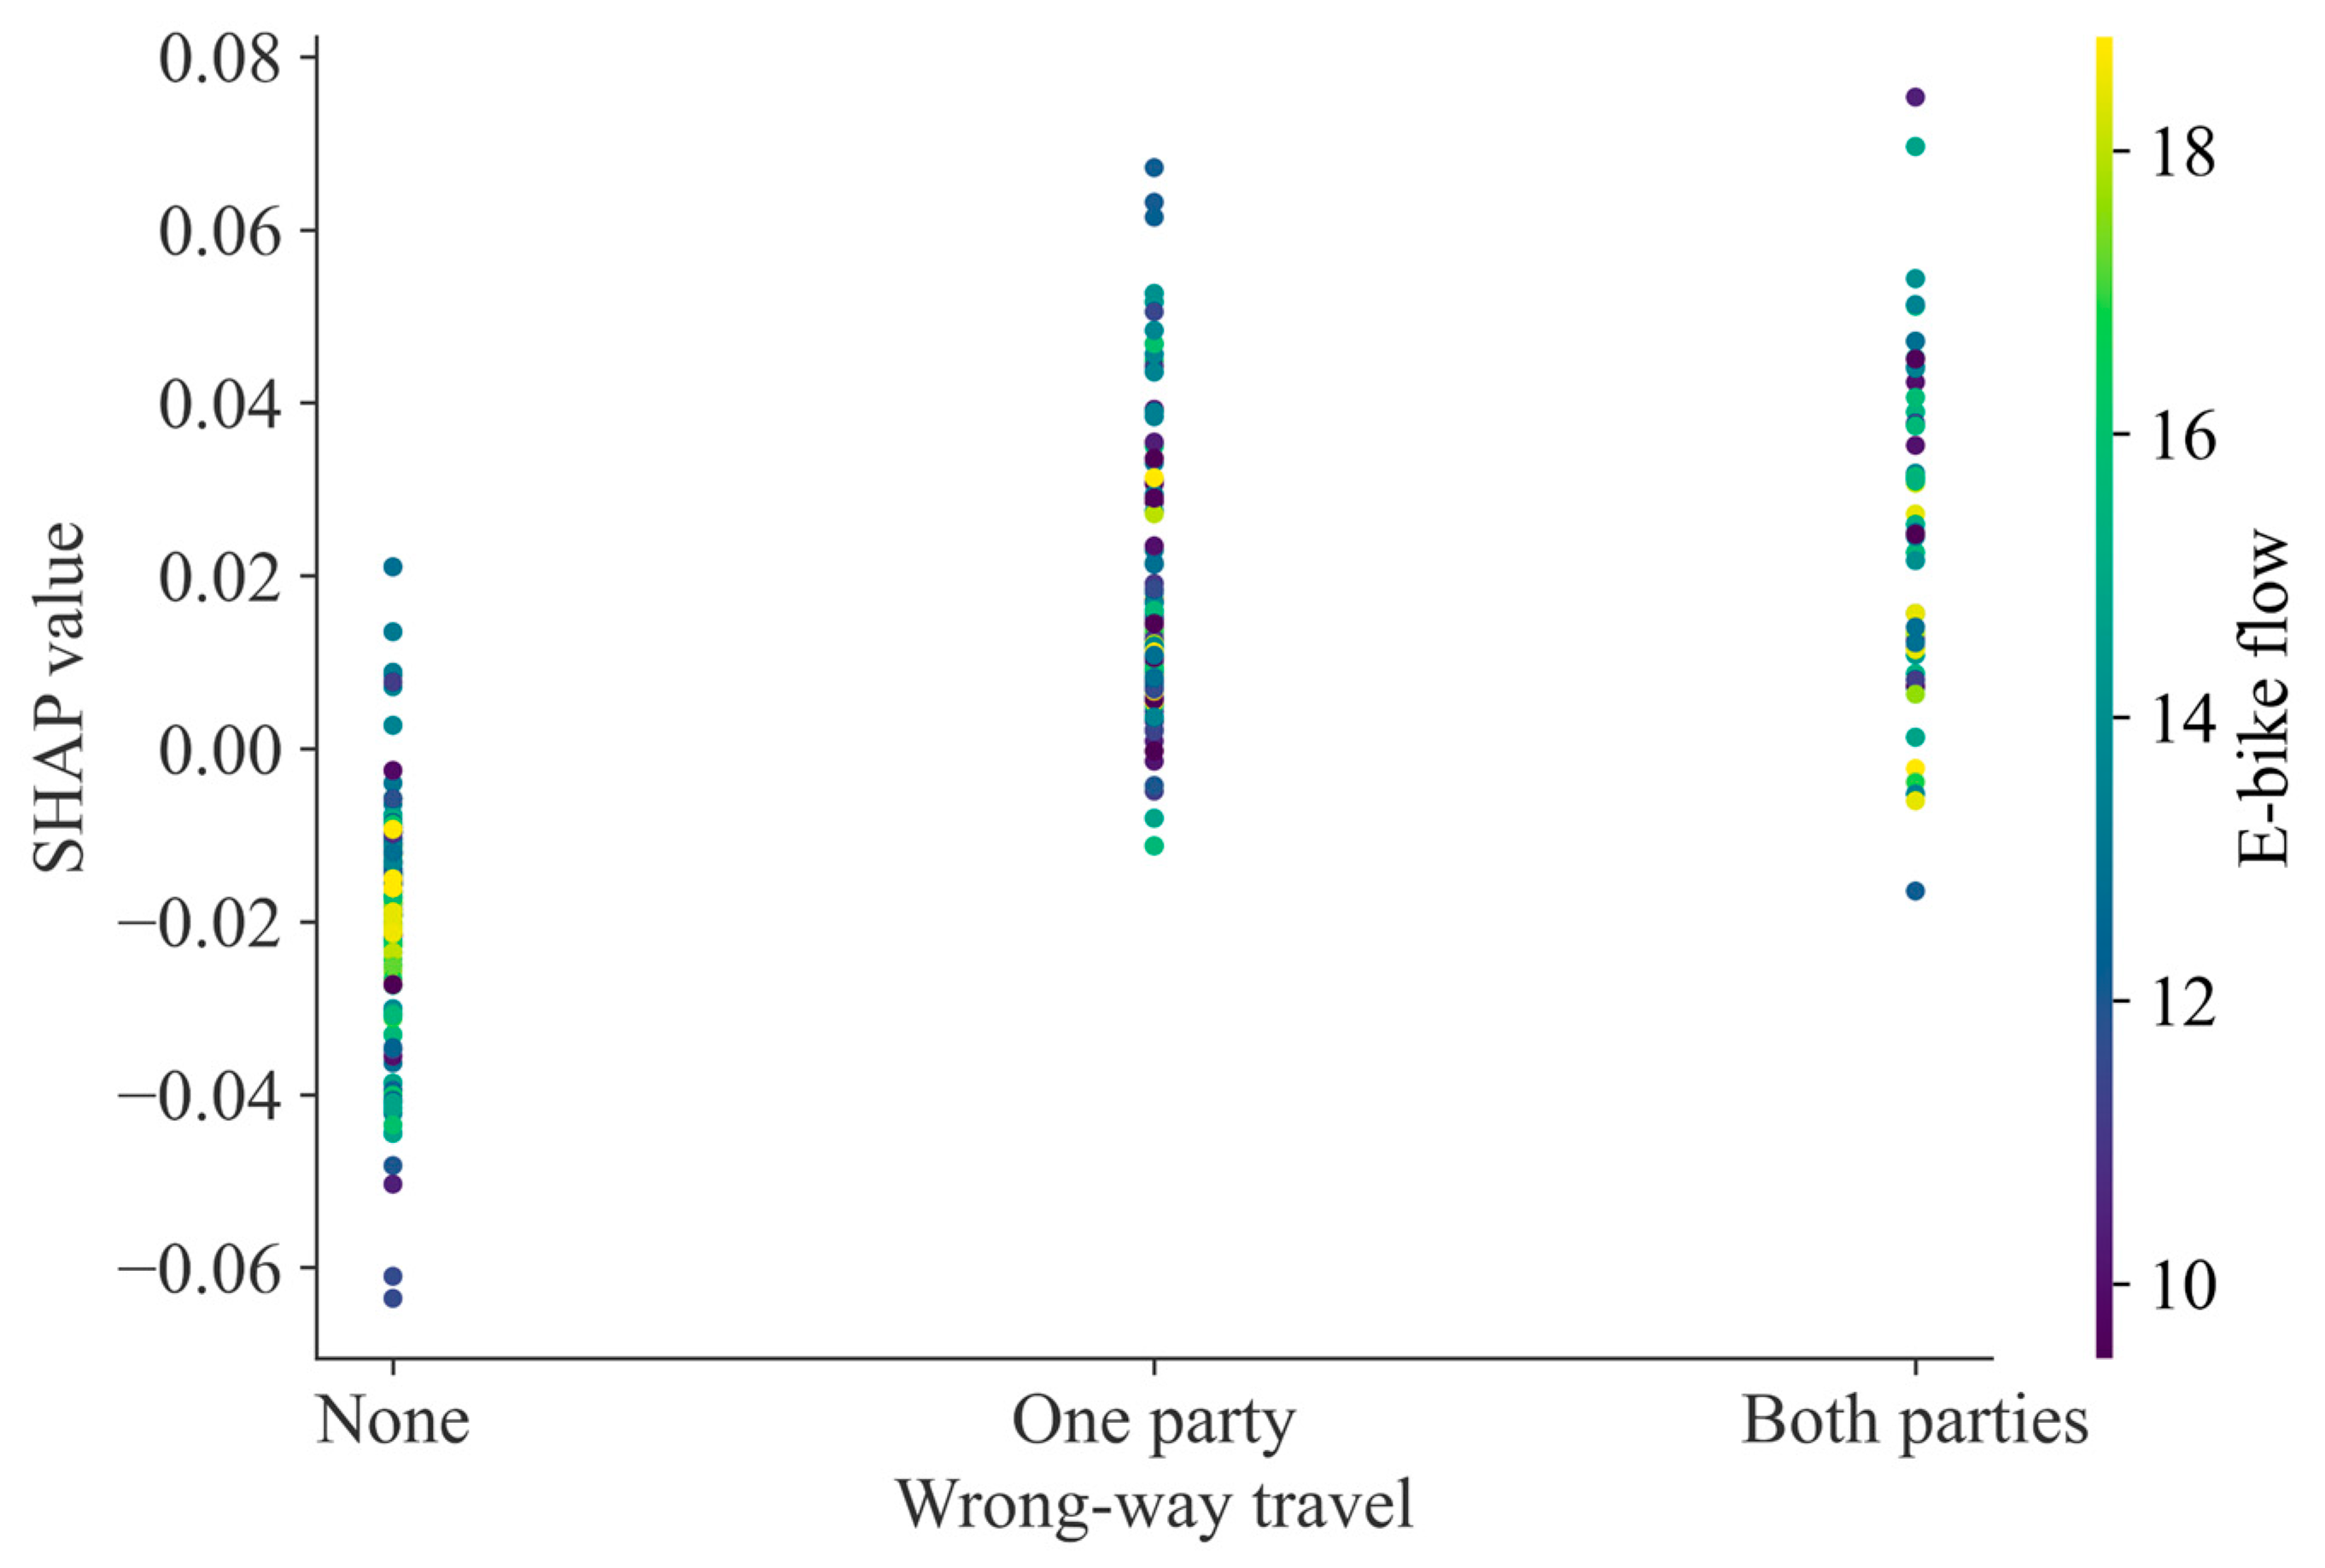
Figure 6 presents the interaction between pedestrian proportion and illegal lane occupation. The results indicate that when one or both parties are engaged in illegal lane occupation, certain samples with higher pedestrian flow exhibit relatively higher SHAP values. This suggests that under conditions of high pedestrian volume, illegal lane occupation by both parties may intensify the risk of severe conflicts. Similarly,
Figure 7 depicts the interaction between e-bike flow and wrong-way travel. The plot reveals that in low e-bike-volume traffic environments, one party in wrong-way travel may lead to higher risk and more severe conflicts.
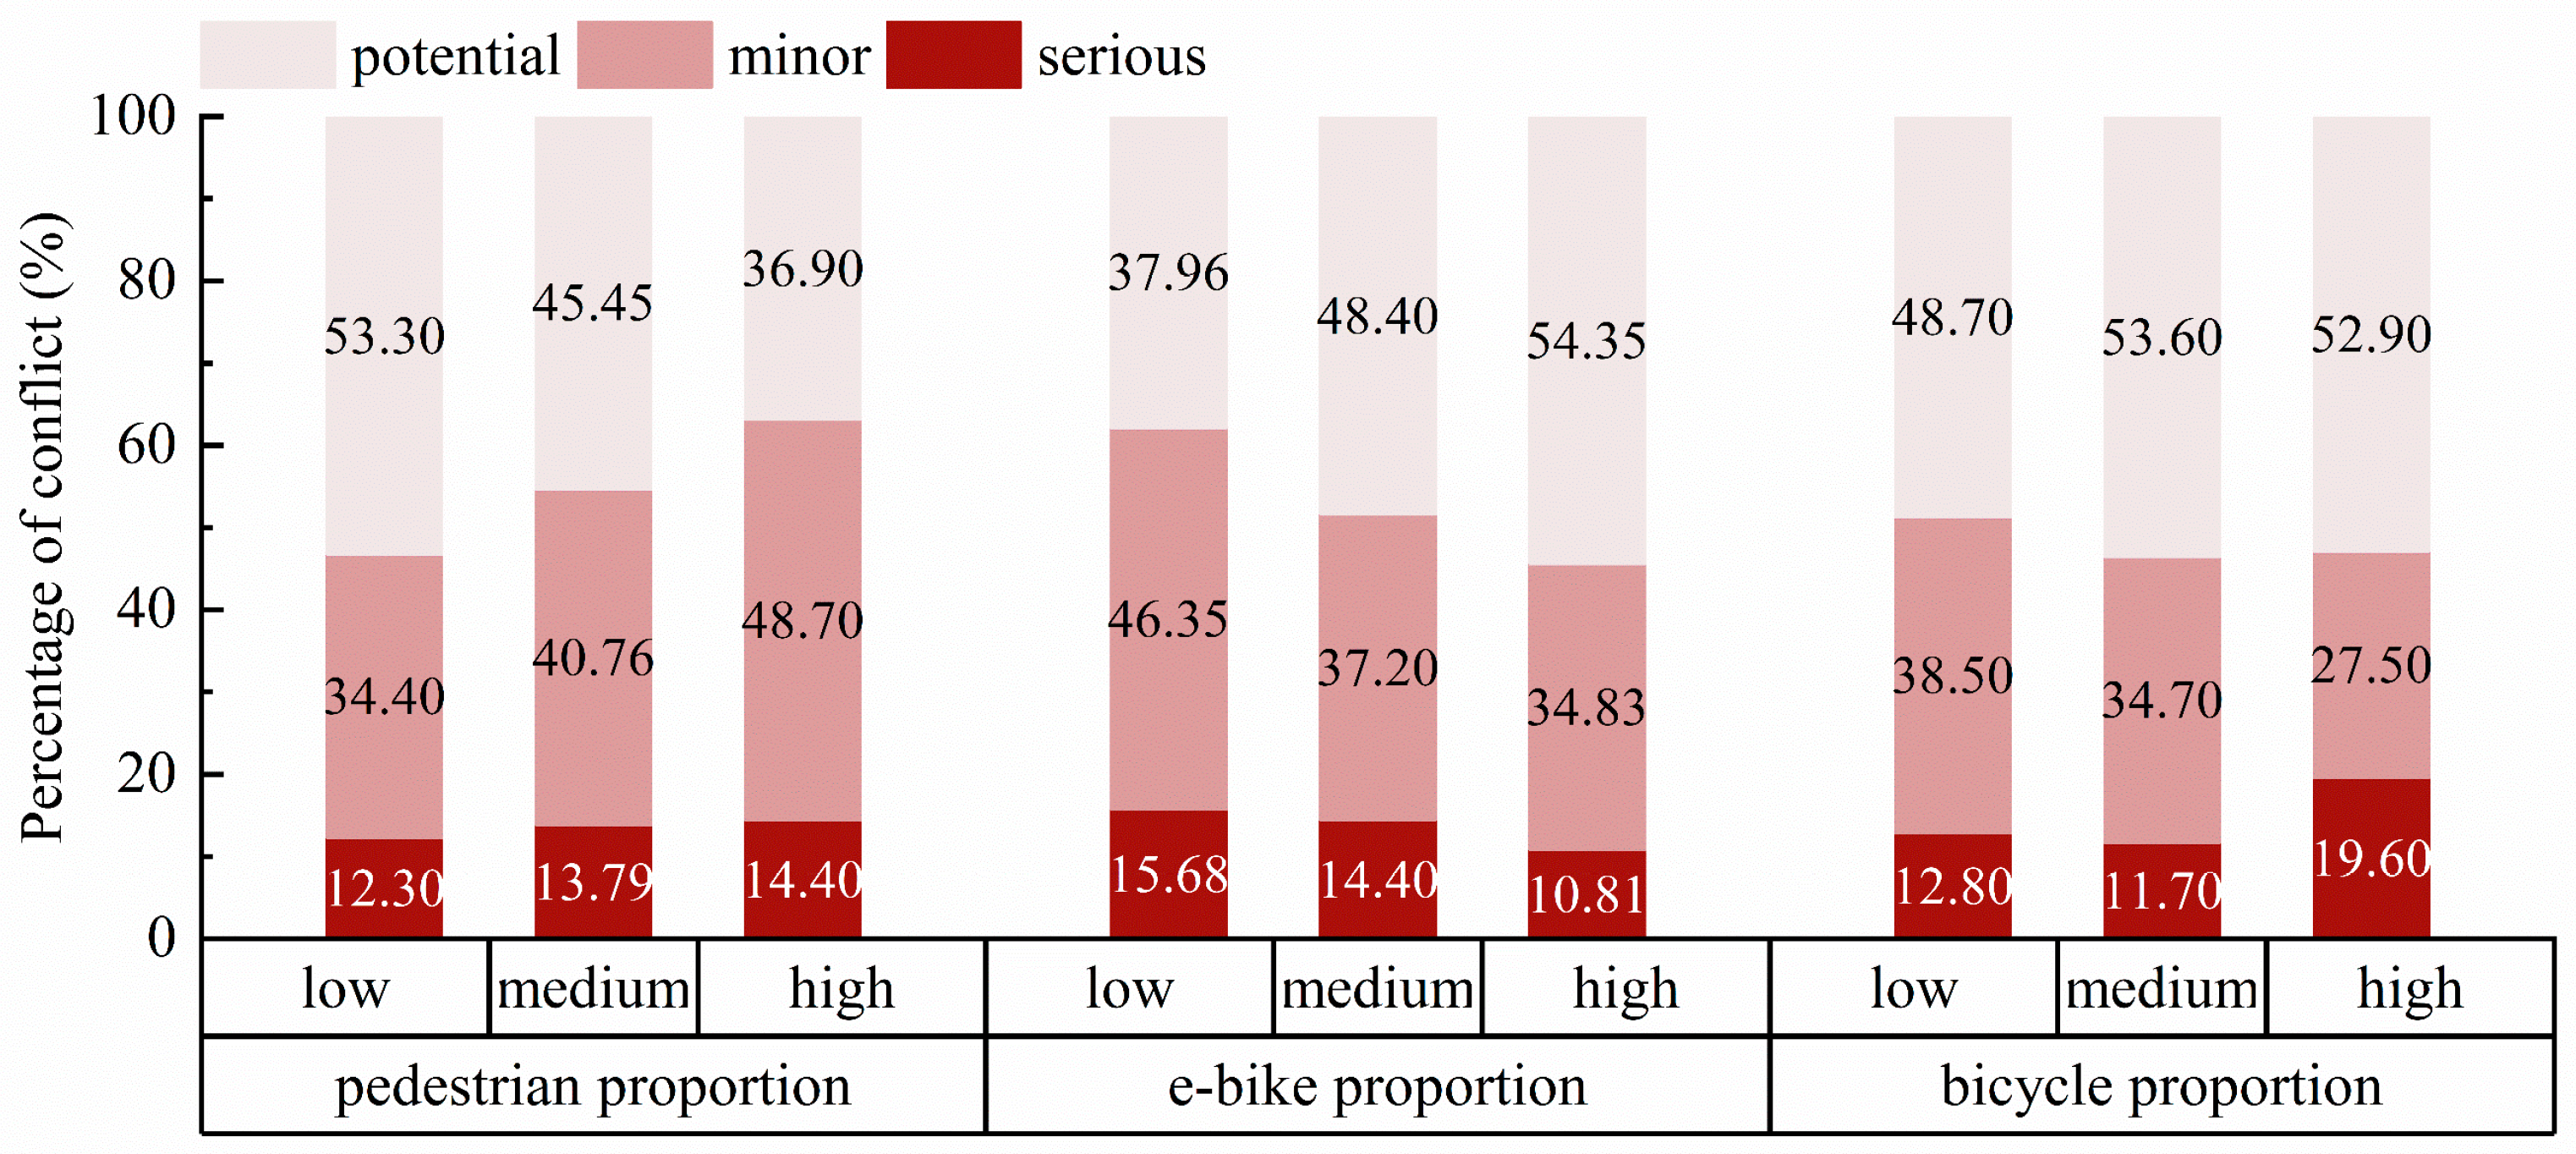
While SHAP values effectively illustrate the overall influence of variables, they do not directly reveal the distribution of conflict severity under varying traffic conditions. To complement the SHAP analysis and offer a more intuitive understanding, traffic operation features were discretized and visualized using distribution plots. Since traffic operation features are continuous variables, they are transformed into discrete categories to facilitate statistical analysis. This transformation is based on each variable’s range and distribution, dividing them into three levels: low, medium, and high. The classification criteria for each traffic operation feature are presented in
Table 5.
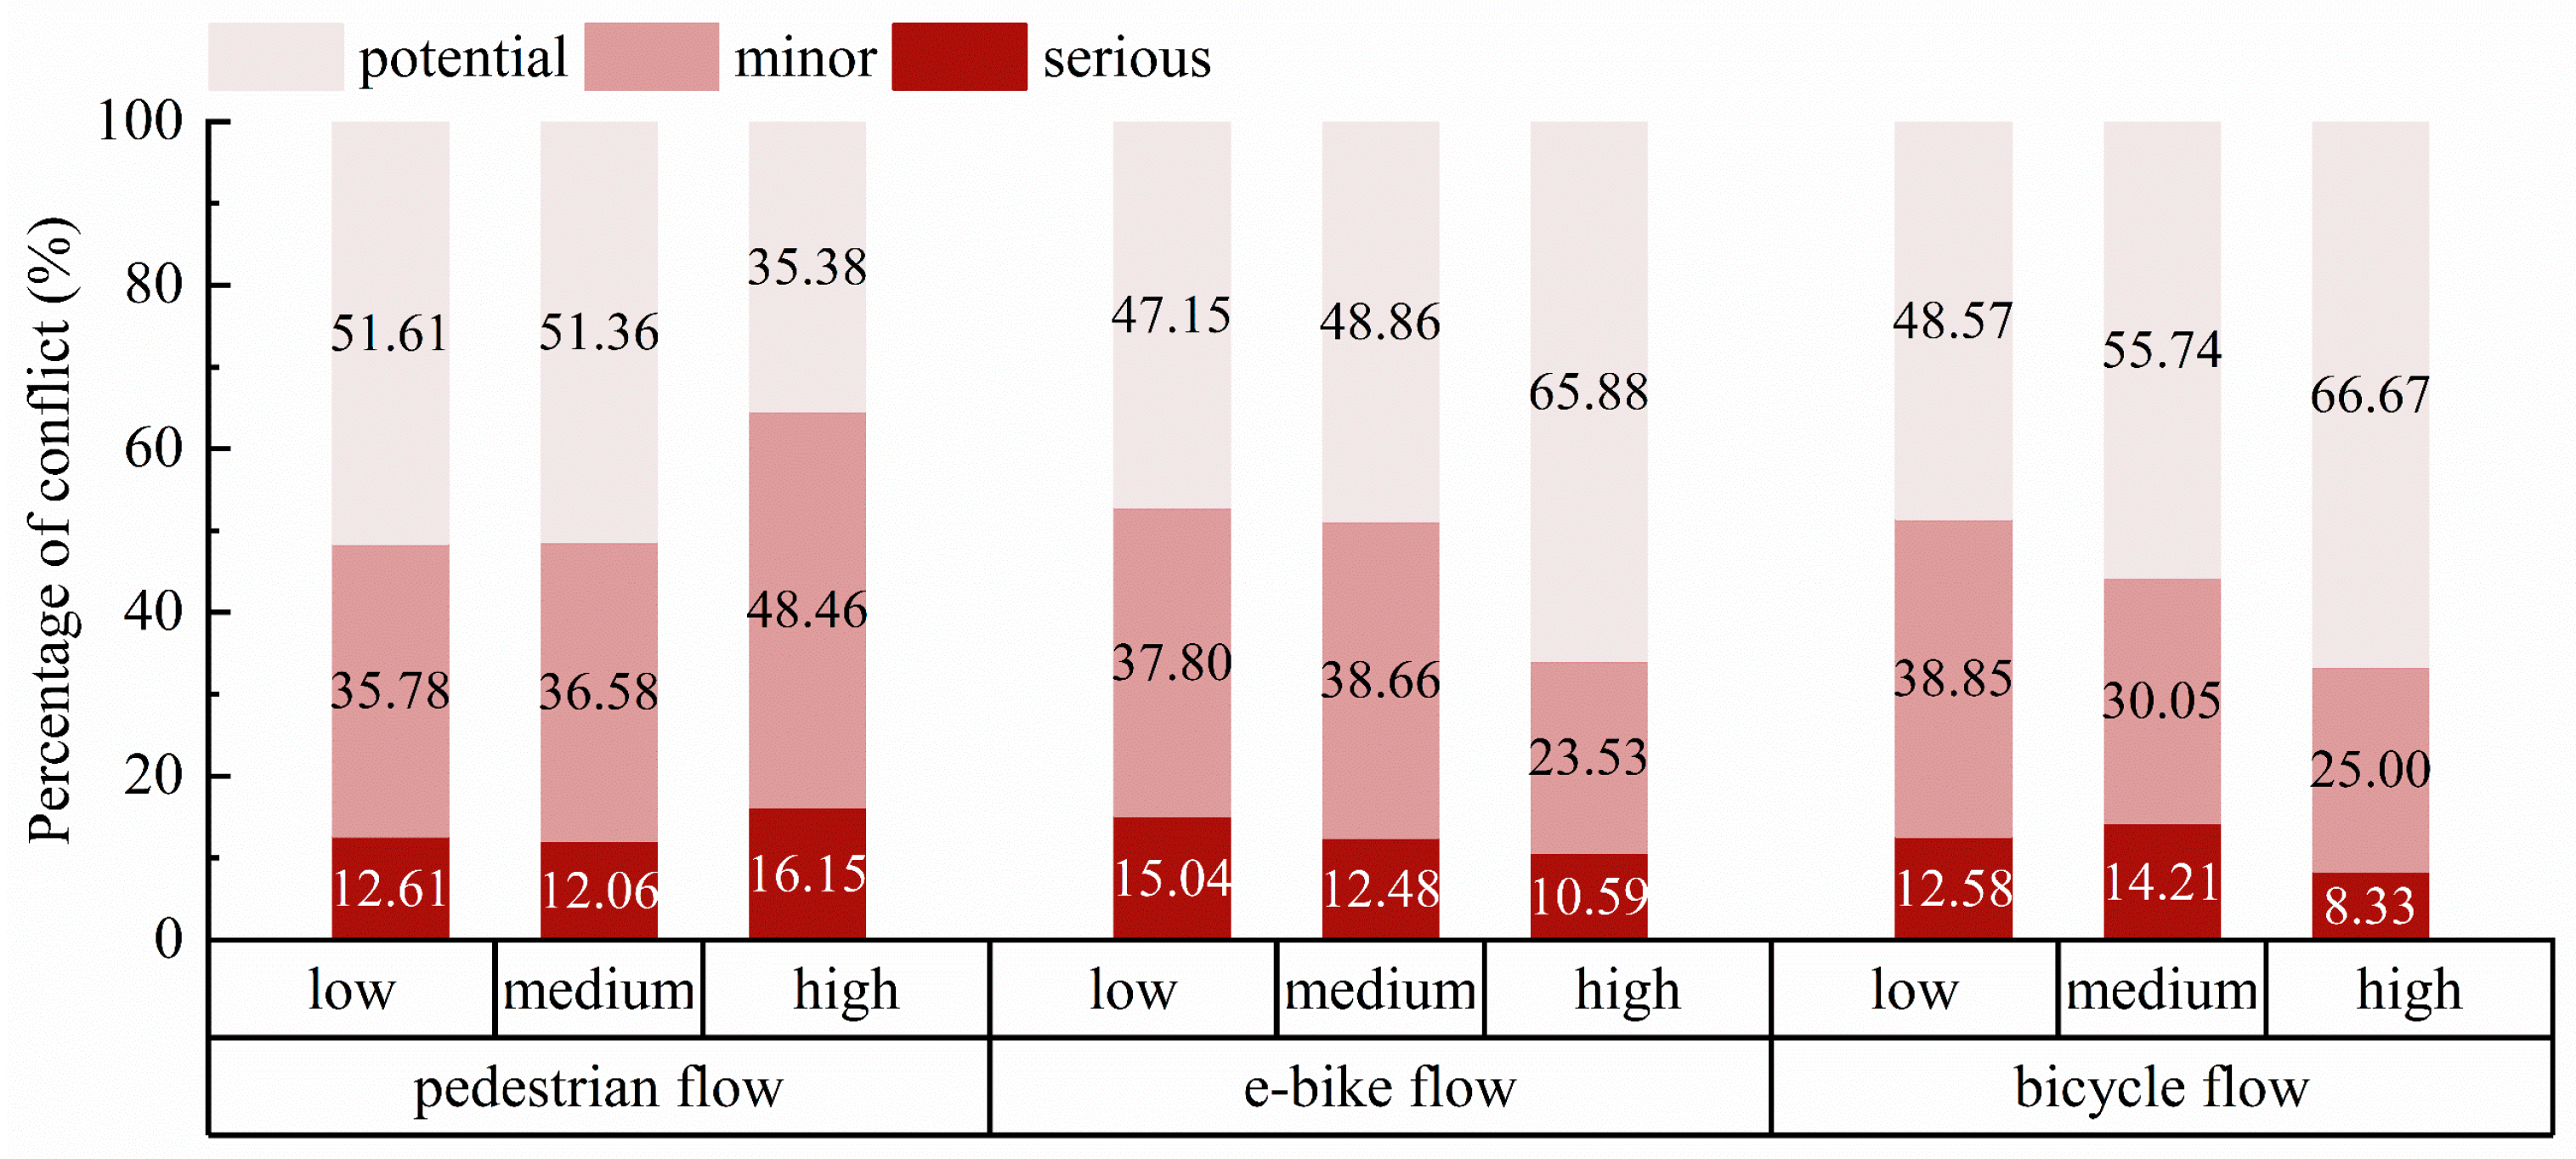
Figure 8 and
Figure 9 illustrate the proportion of conflicts at different severity levels across factor classifications.
In terms of traffic composition characteristics, the proportion of road users represents the ratio of a specific type of road user to the total number of road users during conflict occurrence. As illustrated in
Figure 8, a higher pedestrian proportion and a lower e-bike proportion are associated with a decreased likelihood of potential traffic conflicts, whereas the probability of minor and serious conflicts tends to increase. As shown in
Figure 9, an increase in pedestrian flow, alongside a reduced in e-bike and bicycle flow, corresponds to a lower probability of potential conflicts, while the likelihood of minor and serious conflicts exhibits an upward trend. Additionally, the probability of serious traffic conflicts peaks when the bicycle proportion is high. It should be noted that, given the relatively limited range of bicycle proportions in the sample (0–35%), this conclusion should be interpreted with caution.
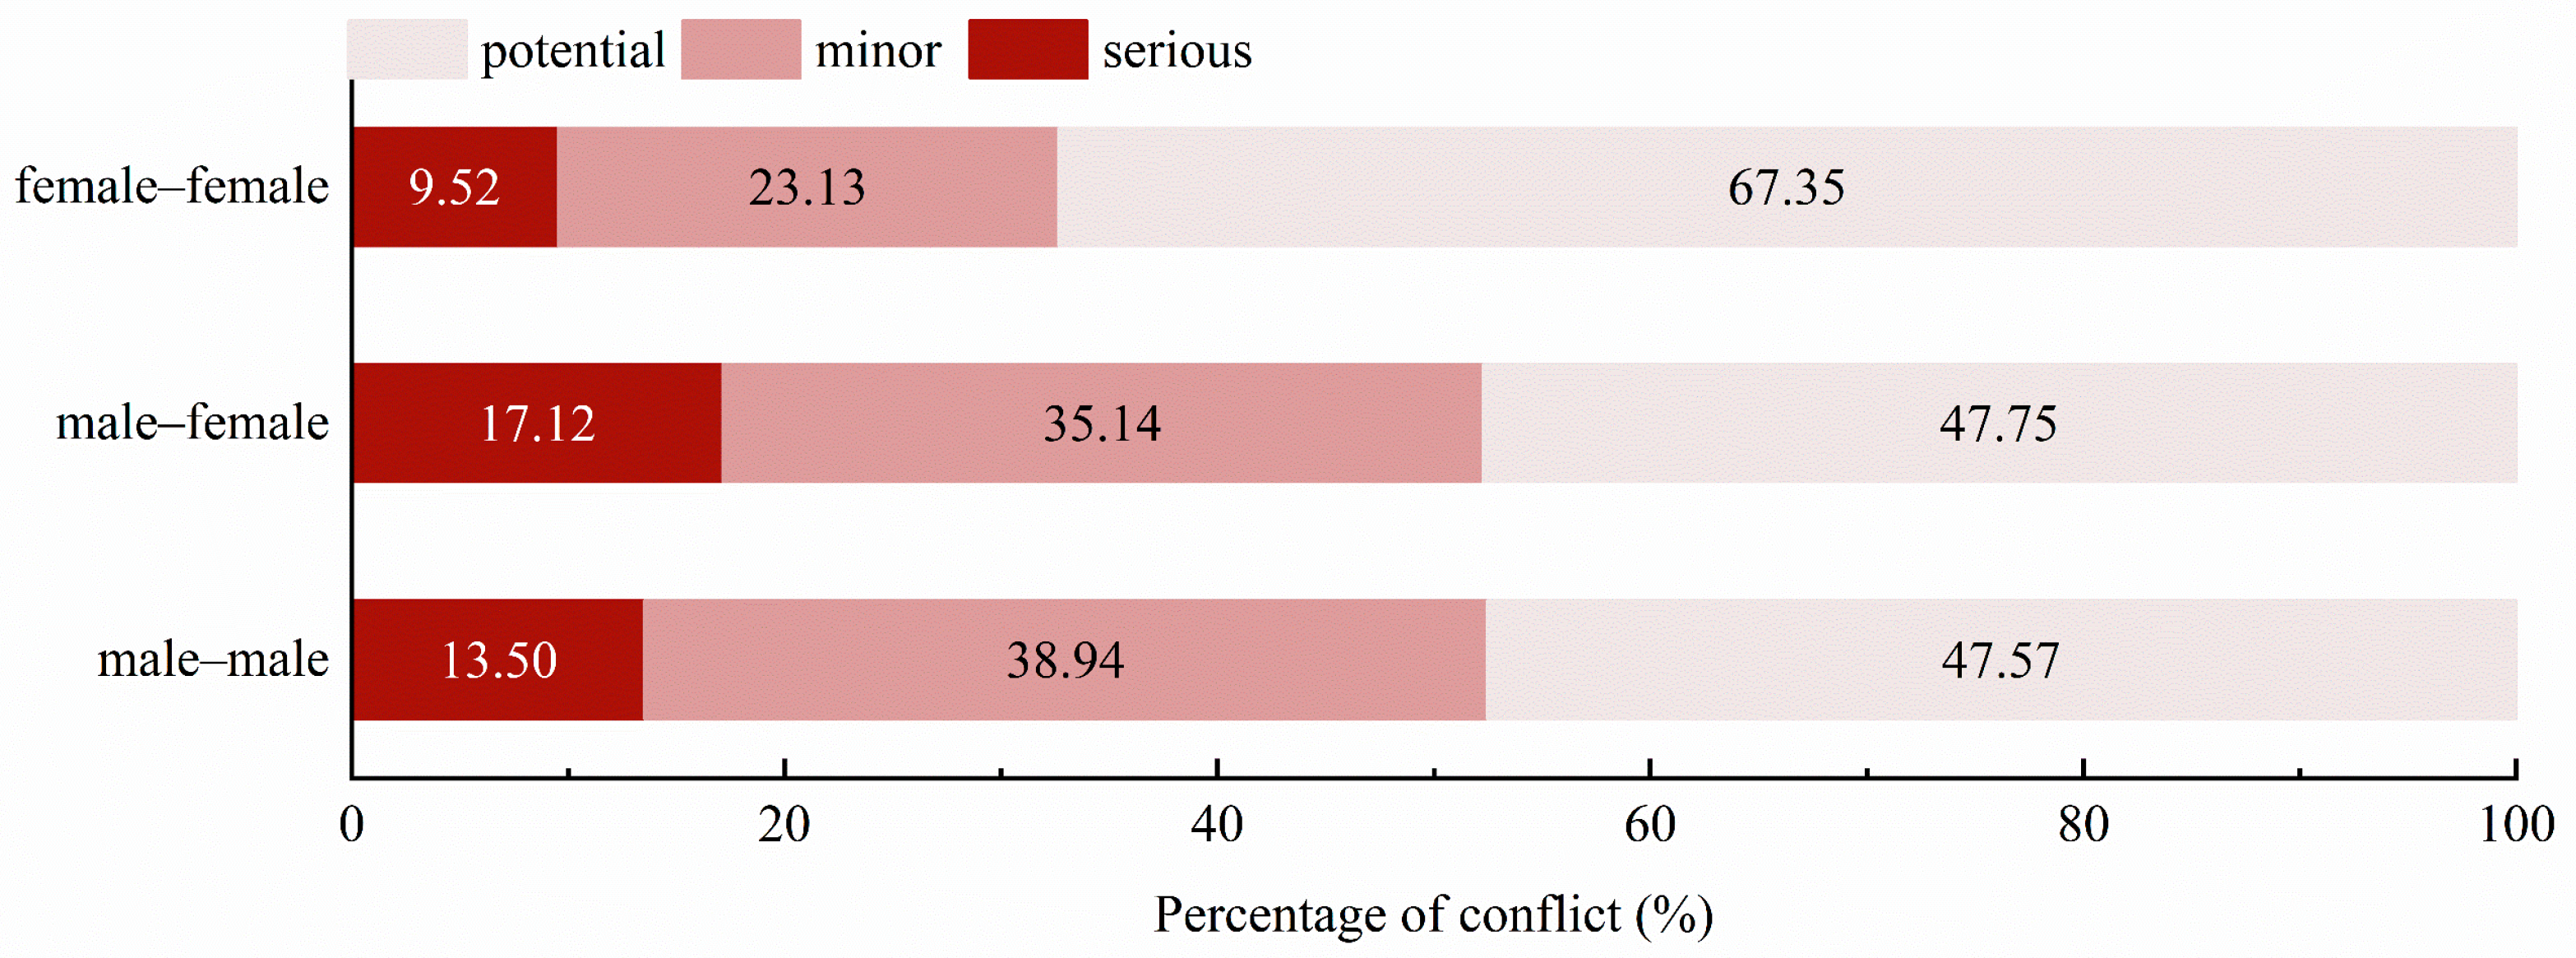
The model results indicate that gender combination and type combination significantly influence conflict severity, with importance scores of 0.088 and 0.061, respectively. The distribution of conflicts across severity levels for these two factors is shown in
Figure 10 and
Figure 11. Regarding gender combination,
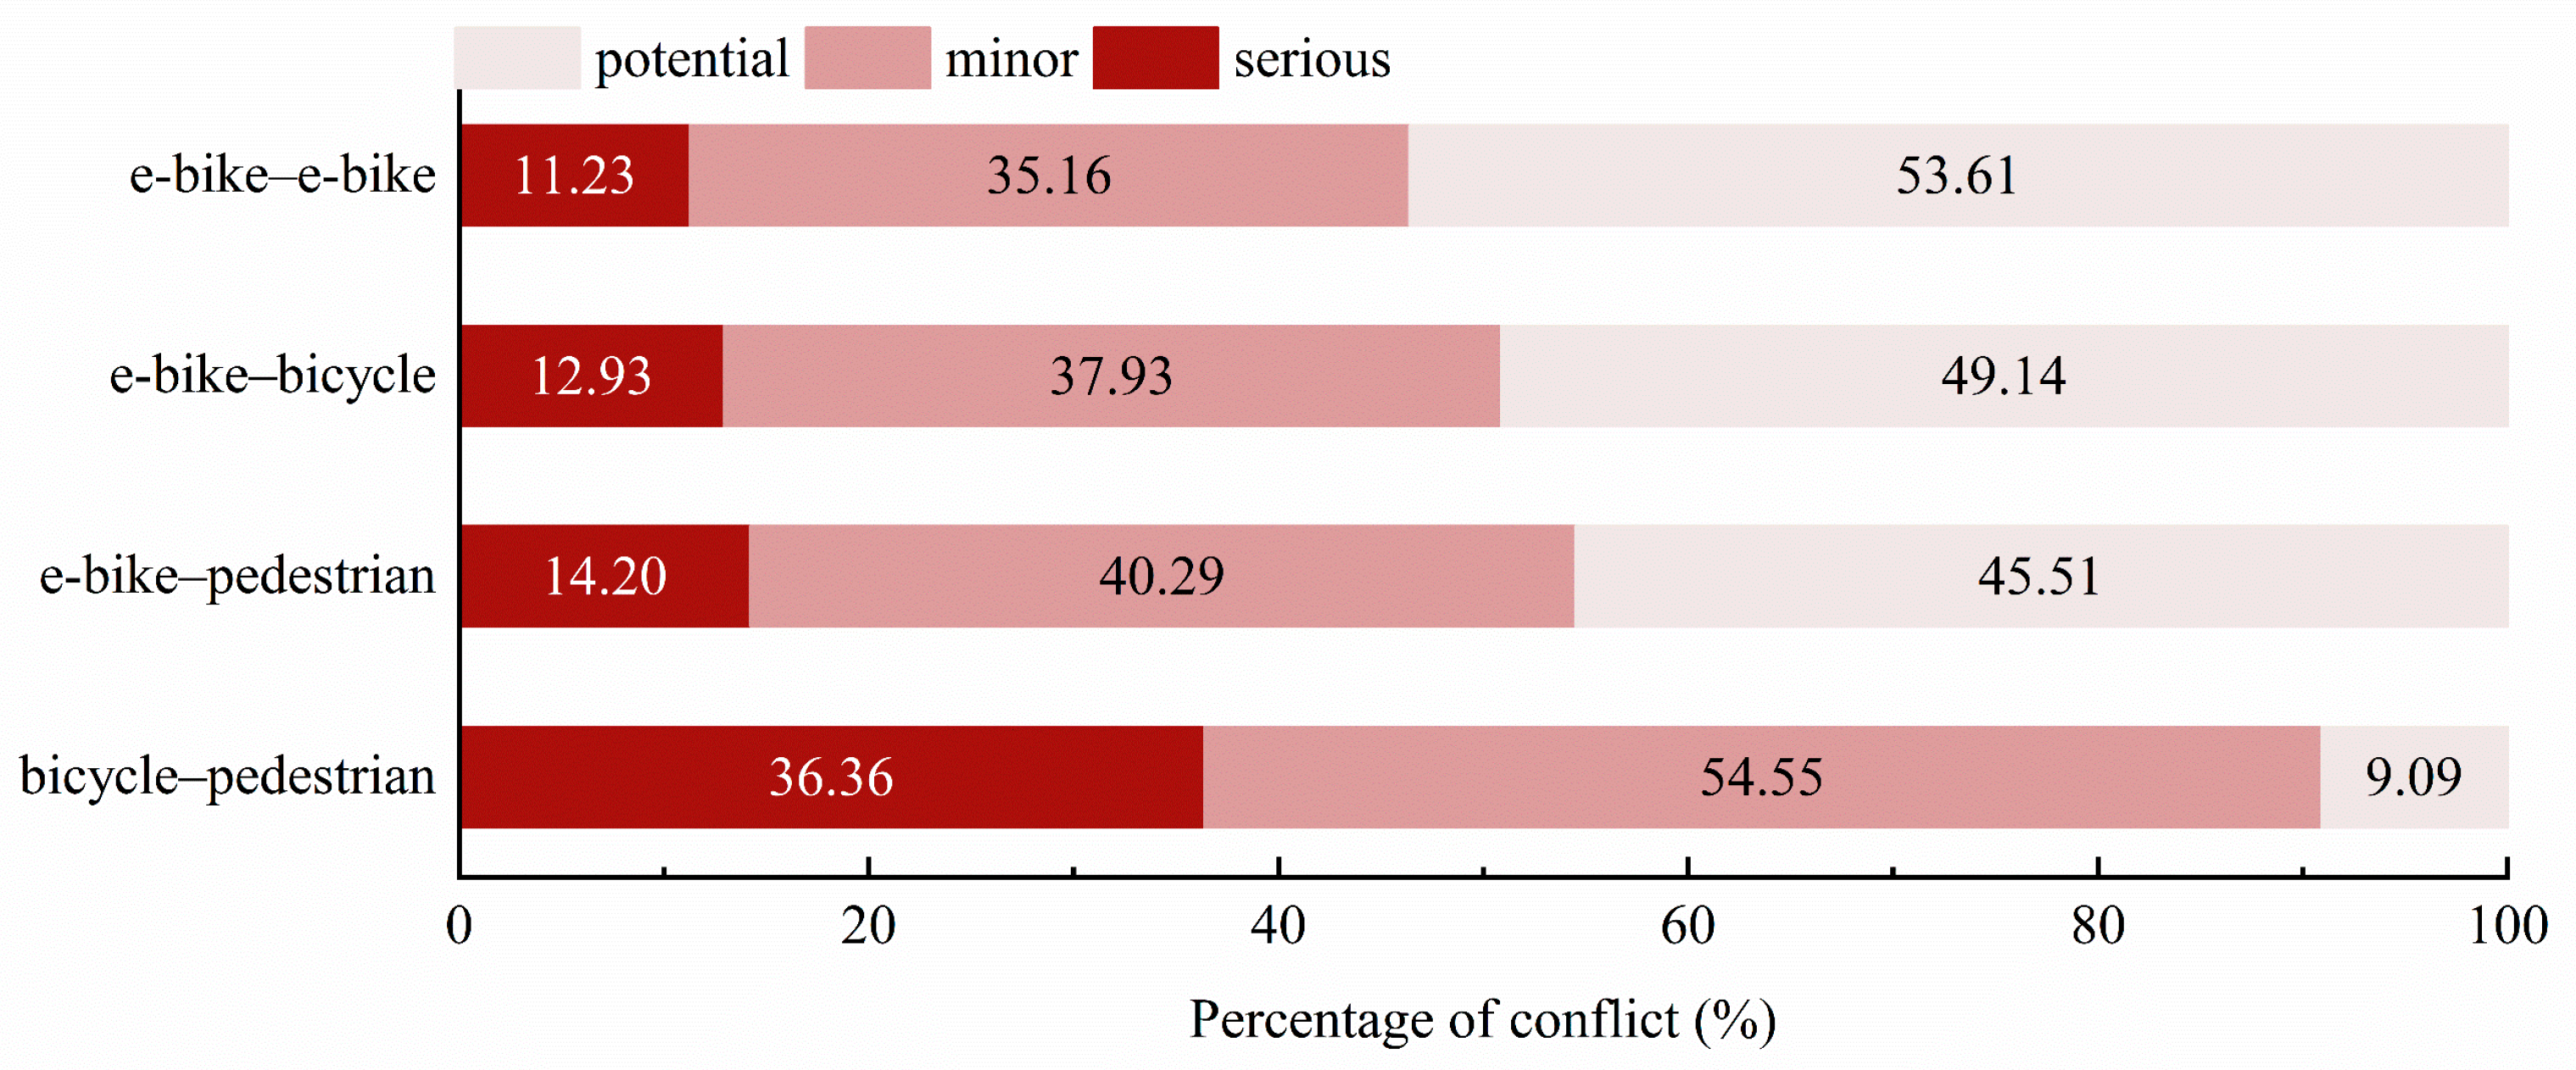
Figure 10 shows that traffic conflicts involving male participants exhibit a notably lower probability of being potential conflicts compared to those involving only female participants. Instead, male-involved conflicts are more likely to escalate to minor or serious levels. In the analysis of type combination, the limited sample size of bicycle-to-bicycle conflicts (only four cases) makes this category statistically unreliable for interpretation. Therefore, the analysis primarily focuses on the remaining four combination types.
Figure 11 indicates that conflicts involving pedestrians are more likely to result in minor and serious conflicts compared to e-bike-e-bike conflicts.
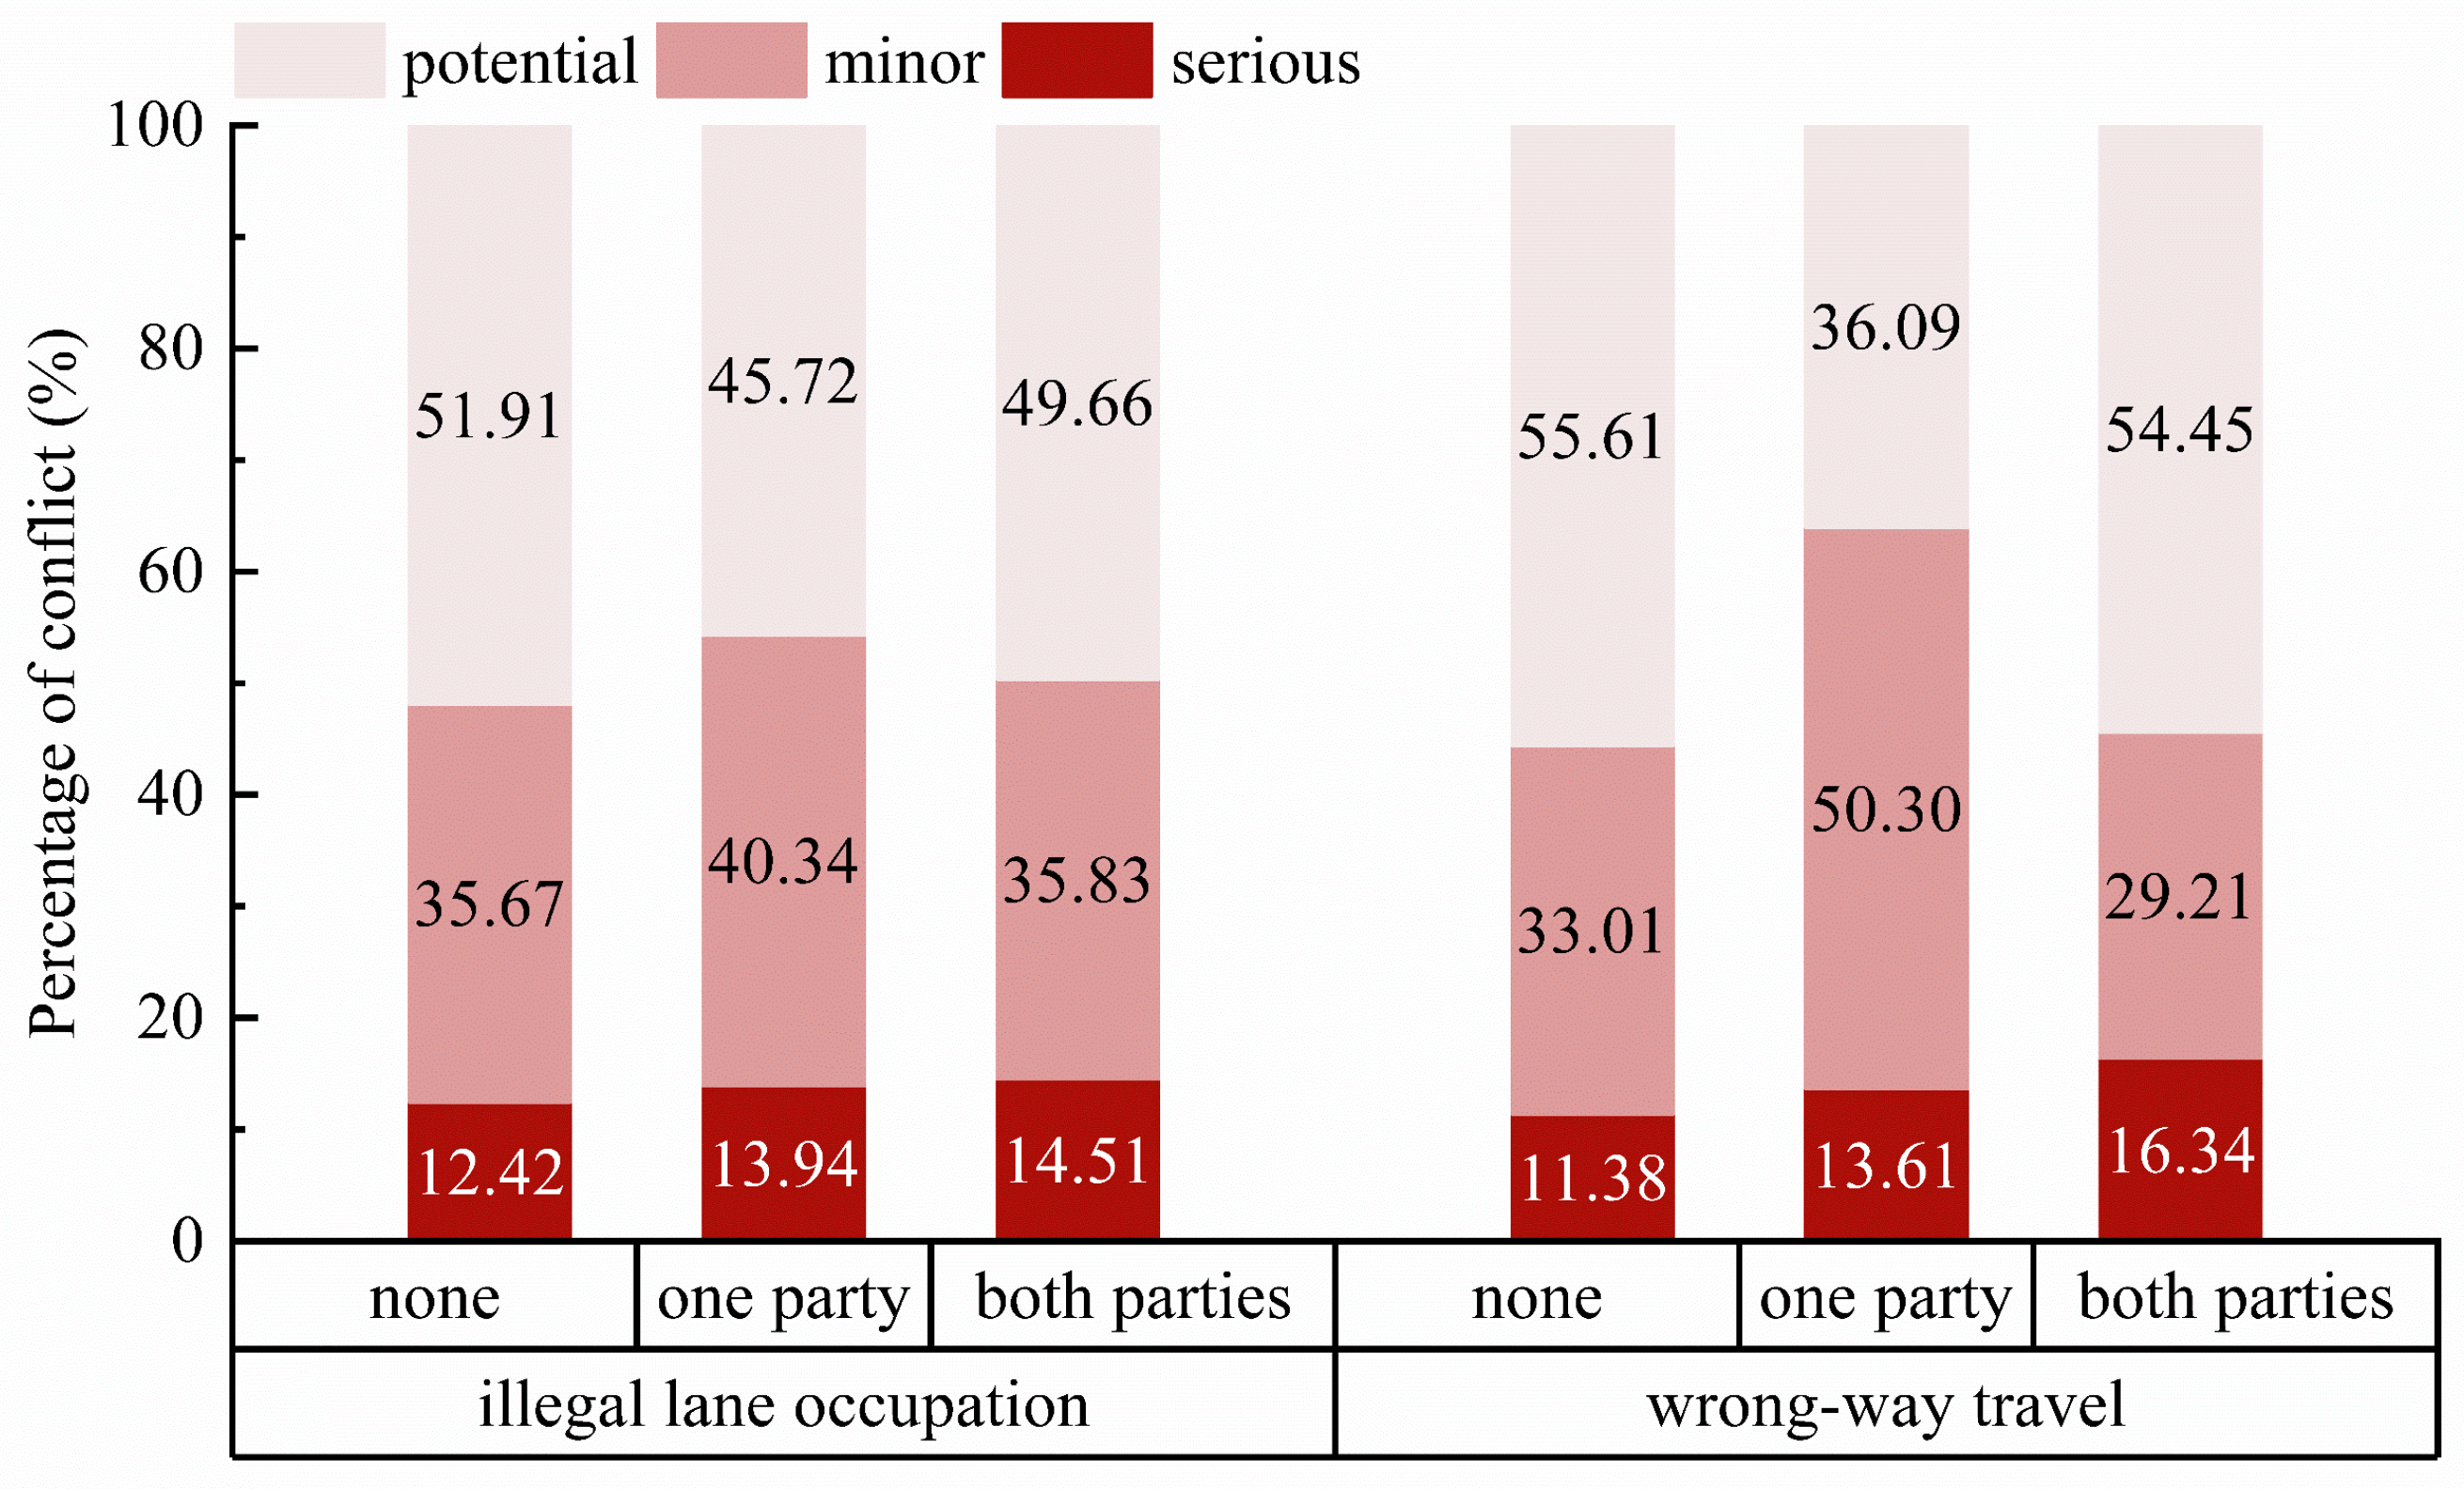
Among the conflict behavior features, the model results indicate that illegal lane occupation and wrong-way travel significantly impact conflict severity. The distribution of conflict severity across different occurrences is illustrated in
Figure 12. It reveals that conflicts involving illegal lane occupation or wrong-way travel exhibit the highest probability of being classified as minor or serious, whereas the likelihood of potential conflicts is comparatively lower.
6. Discussion
6.1. Traffic Operation Features
When examining the relationship between traffic operation features and conflict severity, the results reveal a positive correlation between both the proportion and flow of pedestrians and conflict severity. This finding is in line with those of existing studies. Beitel et al. [
48] reported that higher pedestrian density increases the risk of collisions between pedestrians and cyclists. Similarly, Liang et al. [
16] identified high traffic volume and environmental complexity as major contributors to conflict occurrence. Specifically, pedestrians on shared slow-moving paths often change their walking direction or speed unpredictably, making it difficult for cyclists to anticipate their movements. This behavioral variability increases the likelihood of serious conflicts. Furthermore, as the proportion or flow of pedestrians increases, more pedestrians tend to occupy the non-motorized roads. This limits the maneuvering space available to cyclists, thereby escalating the severity of conflicts.
An interesting finding compared to pedestrians is the negative correlation between both e-bike proportion and flow and conflict severity. A plausible explanation for this phenomenon is that higher e-bike proportion or flow on shared paths often leads to congestion and queue formation among cyclists. As the headway between e-bikes is reduced, cyclist interactions become more pronounced, leading to a more uniform and generally lower riding speed [
49]. The finding can also be supported by the previous study [
16] that when a large proportion of road users belong to the same type, they tend to spontaneously form queues and move at relatively uniform speeds. Consequently, speed differentials between road users are decreased, which in turn diminishes the severity of conflicts on shared paths.
A negative correlation was also found between bicycle flow and conflict severity, which may be explained by mechanisms similar to those discussed for e-bikes. However, another finding is that the probability of serious conflicts increases significantly when the bicycle proportion is high. This may be linked to the fact that the bicycle proportion is generally lower than the e-bike proportion, and even at relatively high bicycle proportions, e-bikes often still outnumber bicycles on the road. The speed differential between the two modes increases the frequency of overtaking maneuvers by e-bikes, thereby elevating the risk of serious conflicts. Nevertheless, due to the limited number of bicycle-related samples observed during the survey period, caution is warranted in interpreting these results. Further investigation is needed to clarify the precise impact of bicycle proportion and flow on conflict severity.
6.2. Conflict Sample Information
The results indicate that conflicts involving male participants are more likely to result in serious conflicts. Similar findings were reported by Yang et al. [
50] who noted that although male cyclists are involved in fewer fall-related incidents, they experience a higher number of fatal crashes. This phenomenon may be attributed to more aggressive riding behaviors exhibited by males, as well as inherent gender-based differences in cycling behavior and safety attitudes [
51].
Compared to conflicts between non-motorized vehicles, this study reveals that conflicts involving pedestrians are significantly more likely to be severe. As the most vulnerable road users, pedestrians move at slower speeds and experience greater speed differentials when interacting with e-bikes and bicycles. This finding is consistent with existing studies. Ker et al. [
52] observed that speed differentials become particularly pronounced in high-density areas characterized by a mix of commuting and recreational traffic. Furthermore, Chong et al. [
6] emphasized that the speed differential between pedestrians and cyclists is a key contributor to conflicts and collisions. Such speed differentials shorten pedestrians’ reaction time in conflict situations and reduces their ability to evade collisions, increasing the traffic risk. Therefore, speed differentials in complex traffic environments significantly elevate pedestrian exposure to traffic risks.
6.3. Conflict Behavior Features
Illegal lane occupation and wrong-way travel can increase conflict severity and adversely impact traffic safety. Trivedi et al. [
53] analyzed patient records related to injuries involving cyclists and pedestrians, concluding that unsafe cycling behaviors, such as illegal lane occupation, are critical factors in collision accidents. Similarly, Zhang et al. [
54] reported that cyclists traveling in the wrong direction were more likely to be involved in severe conflicts with pedestrians compared to those traveling in the correct direction. Several factors may explain this observation. On one hand, such violations create direct safety hazards by obstructing oncoming traffic and disrupting the flow of surrounding road users. On the other hand, these behaviors may reflect underlying psychological traits, such as risk-taking attitudes, which are associated with the disregard for traffic regulations. Previous studies have proven that road users with poor safety attitudes are more likely to engage in risky behaviors, which raises the possibility and seriousness of collisions and accidents [
55].
6.4. Recommendations
Based on the analysis of influencing factors, the following recommendations are proposed. First, rational space allocation is essential for mitigating conflicts. The analysis revealed that pedestrian proportion and flow are strongly associated with higher conflict severity. A core principle of safe transportation is the separation of traffic flows with differing speeds, directions, and masses [
56]. According to the Separated Bike Lane Planning and Design Guide issued by the Federal Highway Administration (FHWA), the separation of pedestrian and non-motorized vehicle through physical separation effectively reduces modal conflict points and improves user perceived safety [
57]. Thus, physical separation measures, such as green belts and guardrails, should be implemented in high-traffic areas, particularly near schools, transit hubs, and commercial districts, to segregate travel spaces effectively.
Moreover, regulations tailored to the needs of users on slow-moving shared paths should be enacted and rigorously enforced. The influence of e-bike proportion, flow, participant type, etc. suggests that speed differentials between e-bikes and other users requires special attention. To promote a safer environment on shared footpaths, Singapore has reduced the maximum speed limit for personal mobility devices (PMDs) from 15 km/h to 10 km/h. A speed limit of 10 km/h is likely to reduce the risk and severity of injuries in pedestrian-cyclist collisions [
6,
55,
58], guided by the International Head Injury Criteria (HIC) [
59,
60]. However, some studies suggest that 10 km/h may be impractically low for certain cyclists, such as affecting commuting efficiency [
61]. Therefore, local authorities should set context-sensitive speed limits and strictly enforce spatial sharing rules.
Furthermore, given the impact of illegal lane occupation and wrong-way travel, it is crucial to strengthen traffic violation management. Recently, Shenzhen has deployed RFID-based intelligent enforcement systems at selected intersections to monitor e-bike violations, including illegal passenger carrying, failure to wear helmets, and disregarding traffic signals. Based on the recorded evidence, appropriate warnings or penalties are issued. It is recommended to strengthen the enforcement focus on illegal lane occupation and wrong-way travel, and to further enhance non-contact enforcement and remote supervision of e-bike violations.
Finally, some conflict-related factors, such as gender combination and participant type, may not be directly modifiable through infrastructure or enforcement. However, they still provide valuable explanatory insights that can inform targeted education, awareness campaigns, and group-specific interventions. For example, the elevated severity of pedestrian-involved and male-participant conflicts highlights the need for targeted behavioral guidance and risk-awareness training tailored to different demographic groups.
7. Conclusions
This study offers a comprehensive investigation into conflict severity on slow-moving shared paths in the context of rapidly expanding e-bike usage. First, a high-resolution camera is utilized to conduct video surveys on slow-moving shared paths in Shenzhen. Potential conflict trajectories are extracted by Petrack software, and valid conflict samples are identified based on a TTCmin threshold of less than four seconds. Next, TTCmin and YRR are selected as conflict indicators and fuzzy c-means clustering is applied to classify conflict severity. Ultimately, a SMOTE-RF model is developed to analyze the influencing factors of conflict severity, focusing on road environments, traffic operation features, conflict sample information and conflict behavior features.
A total of 1164 valid conflict samples are identified and classified into three levels of severity through fuzzy c-means clustering: 579 potential conflicts, 435 minor conflicts, and 150 serious conflicts. The influencing factor analysis model shows that 10 out of 19 variables significantly affected conflict severity. Six factors exhibit strong influence with an importance score exceeding 0.08: pedestrian proportion, e-bike proportion, e-bike flow, gender combination, bicycle proportion, and pedestrian flow. Specifically, higher pedestrian proportion, bicycle proportion, and pedestrian flow, combined with lower e-bike proportion, e-bike flow, and bicycle flow, are associated with increased conflict severity. Male participants are more prone to serious conflicts, and pedestrian-involved conflicts have a significantly higher likelihood of reaching a serious level than conflicts involving only e-bikes. Among behavior features, illegal lane occupation and wrong-way travel are identified as major factors exacerbating conflict severity, as these behaviors obstruct oncoming vehicles and interfere with surrounding traffic flow. Therefore, the implementation of slow-moving shared paths should be approached with caution, with high-pedestrian-volume roads potentially requiring physical separation measures. This study highlights the impact of behavior features and provides new theoretical insights for traffic safety management on slow-moving shared paths, which have significant implications for improving pedestrian and cyclist safety.
Although a detailed investigation has been conducted on slow-moving shared paths, the study mainly focuses on rear-end and head-on conflicts during peak hours in Shenzhen. Future research should extend data collection to a broader range of temporal and environmental conditions, such as non-peak periods, holidays, varied weather scenarios, and different cities to enable comparative analyses. Moreover, angle conflicts should be investigated at intersections or complex traffic scenarios such as curves, to provide a more comprehensive understanding of interaction dynamics of pedestrians and cyclists. In addition, surveys targeting different groups of road users could help identify factors influencing their attitudes and risk perceptions, thereby informing the implementation and evaluation of relevant policies. Lastly, field experiments or simulation studies are recommended to validate the effectiveness of different management strategies, providing decision support for government departments institutes.
Author Contributions
Conceptualization, F.L. and Y.D.; Data curation, F.L.; Methodology, L.M. and F.L.; Formal analysis, L.M. and F.L.; Investigation, L.M. and F.L.; Writing—original draft preparation, L.M. and F.L.; Writing—review and editing, F.L., Y.D. and L.M. All authors have read and agreed to the published version of the manuscript.
Funding
This research was funded by Yunnan Institute of transportation planning and design: Science and Technology Innovation Program of the Department of Transportation, Yunnan Province, China (Yunjiaokejiaobian [2020] 75).
Institutional Review Board Statement
Our study involved video observations conducted in public areas (slow-moving shared paths) to data included trajectory paths and observable attributes such as gender and behaviors (illegal lane occupation and wrong-way travel). All information collected was purely observational, recorded anonymously, and does not enable identification or linkage to any individual. No direct interaction, intervention, or communication with the observed individuals was involved at any stage of data collection or analysis. According to widely accepted ethical standards and guidelines (e.g., the Declaration of Helsinki and general research ethics policies), observational research carried out in public settings, with no possibility of individual identification and no intervention or risk posed to participants, typically does not require ethical committee approval or informed consent. Our study strictly adheres to these ethical guidelines, ensuring complete anonymity and confidentiality of all observed subjects.
Informed Consent Statement
As our study involved only non-interventional, anonymous video observations conducted in public spaces, with no collection of identifiable personal data and no interaction with individuals, it does not involve human participants in a manner that requires informed consent. In addition, no individuals can be identified in the study, either directly or indirectly, and no publication of identifiable images or personal data is involved. Accordingly, written informed consent for publication is not required.
Data Availability Statement
Data are available from the corresponding author upon request.
Conflicts of Interest
The authors declare no conflicts of interest.
References
- Wang, W.; Sun, Z.; Wang, L.; Yu, S.; Chen, J. Evaluation Model for the Level of Service of Shared-Use Paths Based on Traffic Conflicts. Sustainability 2020, 12, 7578. [Google Scholar] [CrossRef]
- Zhang, L.; Tao, L.; Yang, F.; Bao, Y.; Li, C. Promoting Green Transportation through Changing Behaviors with Low-Carbon-Travel Function of Digital Maps. Humanit. Soc. Sci. Commun. 2024, 11, 298. [Google Scholar] [CrossRef]
- Wang, B.; Jing, P.; Jiang, C. Combining SEM, fsQCA and BNs to Explore E-Bike Riders’ Helmet Wearing Intentions under the Impact of Mandatory Policies: An Empirical Study in Zhenjiang. Sustainability 2023, 15, 16704. [Google Scholar] [CrossRef]
- Mesimäki, J.; Luoma, J. Near Accidents and Collisions between Pedestrians and Cyclists. Eur. Transp. Res. Rev. 2021, 13, 38. [Google Scholar] [CrossRef]
- Zhou, Y.; Barbour, N.; Abdel-Aty, M.; Gu, X.; Chen, Y. E-Bike Crashes: Who They Affect and Which Circumstances to Avoid? Int. J. Sustain. Transp. 2025, 19, 83–101. [Google Scholar] [CrossRef]
- Chong, S.; Poulos, R.; Olivier, J.; Watson, W.L.; Grzebieta, R. Relative Injury Severity among Vulnerable Non-Motorised Road Users: Comparative Analysis of Injury Arising from Bicycle–Motor Vehicle and Bicycle–Pedestrian Collisions. Accid. Anal. Prev. 2010, 42, 290–296. [Google Scholar] [CrossRef]
- O’Hern, S.; Oxley, J. Pedestrian Injuries Due to Collisions with Cyclists Melbourne, Australia. Accid. Anal. Prev. 2019, 122, 295–300. [Google Scholar] [CrossRef]
- Zheng, L.; Sayed, T.; Mannering, F. Modeling Traffic Conflicts for Use in Road Safety Analysis: A Review of Analytic Methods and Future Directions. Anal. Methods Accid. Res. 2021, 29, 100142. [Google Scholar] [CrossRef]
- Botma, H. Method to Determine Level of Service for Bicycle Paths and Pedestrian-Bicycle Paths. Transp. Res. Rec. 1995, 1502, 38–44. [Google Scholar]
- Chen, J.; Xie, Z. Cycle Traffic Conflict Model on Urban Pedestrian-Bicycle Paths. J. Jilin Univ. (Eng. Technol. Ed.) 2009, 39, 121–125. [Google Scholar] [CrossRef]
- Zhang, L. Studies on Hybrid Modeling of Bicycle Flow Based on Mixed Traffic Flow. Master’s Thesis, Zhejiang University, Hangzhou, China, 2011. [Google Scholar]
- Kang, L.; Xiong, Y.; Mannering, F.L. Statistical Analysis of Pedestrian Perceptions of Sidewalk Level of Service in the Presence of Bicycles. Transp. Res. Part A Policy Pract. 2013, 53, 10–21. [Google Scholar] [CrossRef]
- Boufous, S.; Hatfield, J.; Grzebieta, R. The Impact of Environmental Factors on Cycling Speed on Shared Paths. Accid. Anal. Prev. 2018, 110, 171–176. [Google Scholar] [CrossRef] [PubMed]
- Alsaleh, R.; Hussein, M.; Sayed, T. Microscopic Behavioral Analysis of Cyclist and Pedestrian Interactions in Shared Spaces. Can. J. Civ. Eng. 2020, 47, 50–62. [Google Scholar] [CrossRef]
- Deng, Y. The Analysis of Traffic Operation Characteristics and Service Level of Pedestrian and Non-Motor Vehicle Shared Road in Shenzhen. Master’s Thesis, Shenzhen University, Shenzhen, China, 2020. [Google Scholar] [CrossRef]
- Liang, X.; Meng, X.; Zheng, L. Investigating Conflict behaviors and Characteristics in Shared Space for Pedestrians, Conventional Bicycles and e-Bikes. Accid. Anal. Prev. 2021, 158, 106167. [Google Scholar] [CrossRef]
- Willberg, E.; Tenkanen, H.; Poom, A.; Salonen, M.; Toivonen, T. Comparing Spatial Data Sources for Cycling Studies: A Review. In Transport in Human Scale Cities; Edward Elgar Publishing: Cheltenham, UK, 2021; pp. 169–187. [Google Scholar] [CrossRef]
- Allen, B.L.; Shin, B.T.; Cooper, P.J. Analysis of Traffic Conflicts and Collisions. Transp. Res. Rec. 1978, 667, 67–74. [Google Scholar]
- Guo, Y.; Sayed, T.; Zaki, M.H. Evaluating the Safety Impacts of Powered Two Wheelers on a Shared Roadway in China Using Automated Video Analysis. J. Transp. Saf. Secur. 2019, 11, 414–429. [Google Scholar] [CrossRef]
- Qu, Z.; Gao, Y.; Song, X.; Xia, Y.; Ma, L.; Yao, R. Traffic Conflict Identification of E-Bikes at Signalized Intersections. Transport 2021, 36, 185–198. [Google Scholar] [CrossRef]
- Tageldin, A.; Sayed, T.; Wang, X. Can Time Proximity Measures Be Used as Safety Indicators in All Driving Cultures?: Case Study of Motorcycle Safety in China. Transp. Res. Rec. 2015, 2520, 165–174. [Google Scholar] [CrossRef]
- Tageldin, A.; Sayed, T. Developing Evasive Action-based Indicators for Identifying Pedestrian Conflicts in Less Organized Traffic Environments. J. Adv. Transp. 2016, 50, 1193–1208. [Google Scholar] [CrossRef]
- Tageldin, A.; Zaki, M.H.; Sayed, T. Examining Pedestrian Evasive Actions as a Potential Indicator for Traffic Conflicts. IET Intell. Transp. Syst. 2017, 11, 282–289. [Google Scholar] [CrossRef]
- Guo, Y.; Sayed, T.; Zaki, M.H. Exploring Evasive Action–Based Indicators for PTW Conflicts in Shared Traffic Facility Environments. J. Transp. Eng. A Syst. 2018, 144, 04018065. [Google Scholar] [CrossRef]
- Liu, F.; Deng, Y.; Miao, L. A Discrimination Method for Traffic Conflict Severity on Slow-Moving Shared Paths. In Proceedings of the 2024 12th International Conference on Traffic and Logistic Engineering (ICTLE), Macao, China, 23–25 August 2024. [Google Scholar] [CrossRef]
- Petzoldt, T.; Schleinitz, K.; Heilmann, S.; Gehlert, T. Traffic Conflicts and Their Contextual Factors When Riding Conventional vs. Electric Bicycles. Transp. Res. Part F Traffic Psychol. Behav. 2017, 46, 477–490. [Google Scholar] [CrossRef]
- Bai, L.; Chan, C.-Y.; Liu, P.; Xu, C. Identifying Factors Affecting the Safety of Mid-Block Bicycle Lanes Considering Mixed 2-Wheeled Traffic Flow. Traffic Inj. Prev. 2017, 18, 761–766. [Google Scholar] [CrossRef] [PubMed]
- Wang, C. Research on Traffic Conflict Analysis and Prediction at Intersection Based on Trajectory Extraction. Master’s Thesis, Beijing Jiaotong University, Beijing, China, 2022. [Google Scholar] [CrossRef]
- Liu, J.; Chen, X. Analysis of Pedestrian-Two-Wheeler Conflicts at Green Light Digital Countdown Signals: A Random Parameter Ordered Logit Model Approach. Accid. Anal. Prev 2024, 206, 107716. [Google Scholar] [CrossRef]
- Wei, Z.; Ma, H.; Wang, M.; Huang, W. Modeling and Simulation of Pedestrian-non-motorized Vehicle Interaction Behavior in Bus Stop Areas. Sci. Technol. Eng. 2024, 24, 00397-11. [Google Scholar]
- Wang, B.; Shen, J.; Liang, G.; Xue, X. Analysis of the Safety Impact of E-bike Passing Through on the Behavior of Bus Passengers Entering and Exiting Bus Stops. J. Harbin Inst. Technol. 2024, 56, 55–62. [Google Scholar]
- Xiao, R.; Li, L.; Geng, M.; Zhang, J.; Wang, D. Research on the Guidelines for the Installation of Non-motorized Vehicle Lanes in Cities with Tight Road Resources: A Case Study of Shenzhen City. In Proceedings of the 2024 China Urban Transport Planning Annual Conference, Kunming, China, 20 September 2024. [Google Scholar] [CrossRef]
- Zhu, S.Y.; Jiang, R.X.; Wang, H.; Zou, H.; Wang, P.; Qiu, J. Review of Research on Traffic Conflict Techniques. China J. Highw. Transp. 2020, 33, 15–33. [Google Scholar] [CrossRef]
- Singh, D.; Das, P.; Ghosh, I. Surrogate Safety Assessment of Traffic Facilities under Ordered and Disordered Traffic Condition: Systematic Literature Review. KSCE J. Civ. Eng 2023, 27, 5008–5029. [Google Scholar] [CrossRef]
- Guo, Y.; Sayed, T.; Zaki, M.H.; Liu, P. Safety Evaluation of Unconventional Outside Left-Turn Lane Using Automated Traffic Conflict Techniques. Can. J. Civ. Eng. 2016, 43, 631–642. [Google Scholar] [CrossRef]
- Zheng, Y.B.; Ma, Y.; Cheng, J.C.; Zhang, X.H.; Cao, W. Automated Identification and Visualization of ConflictEvents in Bike Lanes Using Traiectory Data. China J. Highw. Transp. 2022, 35, 71–84. [Google Scholar] [CrossRef]
- Xin, F.; Wang, X.; Sun, C. Risk Evaluation for Conflicts between Crossing Pedestrians and Right-Turning Vehicles at Intersections. Transp. Res. Rec. 2021, 2675, 1005–1014. [Google Scholar] [CrossRef]
- Ghosh, S.; Dubey, S.K. Comparative Analysis of K-Means and Fuzzy c-Means Algorithms. Int. J. Adv. Comput. Sci. Appl. 2013, 4. [Google Scholar] [CrossRef]
- Wu, K.-L. Analysis of Parameter Selections for Fuzzy C-Means. Pattern Recognit. 2012, 45, 407–415. [Google Scholar] [CrossRef]
- Theodoridis, S.; Koutroumbas, K. Pattern Recognition, 4th ed.; Academic Press: Cambridge, MA, USA, 2008; pp. 570–573. [Google Scholar]
- Abdel-Aty, M.; Pande, A.; Das, A.; Knibbe, W.J. Analysis of Infrastructure Based ITS Data for Assessing Safety on Freeways in Netherlands. Transp. Res. Rec. 2008, 2083, 153–161. [Google Scholar] [CrossRef]
- GB 50137-2011; Code for Classification of Urban Land Use and Planning Standards of Development Land. China Architecture & Building Press: Beijing, China, 2011.
- Hu, Y.; Li, Y.; Huang, H.; Lee, J.; Yuan, C.; Zou, G. A High-Resolution Trajectory Data Driven Method for Real-Time Evaluation of Traffic Safety. Accid. Anal. Prev. 2022, 165, 106503. [Google Scholar] [CrossRef]
- Darzian Rostami, A.; Katthe, A.; Sohrabi, A.; Jahangiri, A. Predicting Critical Bicycle-Vehicle Conflicts at Signalized Intersections. J. Adv. Transp. 2020, 2020, 1–16. [Google Scholar] [CrossRef]
- Chen, M.; Chen, C. Modeling Road Accident Severity with Comparisons of Logistic Regression, Decision Tree and Random Forest. Information 2020, 11, 270. [Google Scholar] [CrossRef]
- Elreedy, D.; Atiya, A.F. A Comprehensive Analysis of Synthetic Minority Oversampling Technique (SMOTE) for Handling Class Imbalance. Inf. Sci. 2019, 505, 32–64. [Google Scholar] [CrossRef]
- Lundberg, S.M.; Lee, S.-I. A Unified Approach to Interpreting Model Predictions. arXiv 2017. [Google Scholar] [CrossRef]
- Beitel, D.; Stipancic, J.; Manaugh, K.; Miranda-Moreno, L. Assessing Safety of Shared Space Using Cyclist-Pedestrian Interactions and Automated Video Conflict Analysis. Transp. Res. Part D Transp. Environ. 2018, 65, 710–724. [Google Scholar] [CrossRef]
- Bai, L. Research on Traffic Characteristics and Safety Effect of Electric Bicycles in Urban Streets. Ph.D. Thesis, Southeast University, Nanjing, China, 2017. [Google Scholar]
- Yang, H.; Ma, Q.; Wang, Z.; Cai, Q.; Xie, K.; Yang, D. Safety of Micro-Mobility: Analysis of E-Scooter Crashes by Mining News Reports. Accid. Anal. Prev. 2020, 143, 105608. [Google Scholar] [CrossRef]
- Tuckel, P.; Milczarski, W.; Maisel, R. Pedestrian Injuries Due to Collisions with Bicycles in New York and California. J. Saf. Res. 2014, 51, 7–13. [Google Scholar] [CrossRef] [PubMed]
- Ker, I.; Huband, A.; Veith, G.; Taylor, J. Pedestrian-Cyclist Conflict Minimisation on Shared Paths and Footpaths; Austroads: Sydney, Australia, 2006. [Google Scholar]
- Trivedi, T.K.; Liu, C.; Antonio, A.L.M.; Wheaton, N.; Kreger, V.; Yap, A.; Schriger, D.; Elmore, J.G. Injuries Associated with Standing Electric Scooter Use. JAMA Netw. Open 2019, 2, e187381. [Google Scholar] [CrossRef] [PubMed]
- Zhang, C.; Du, B.; Shen, J.; Ma, C. Revealing Safety Impact of Bus Stops on Passenger-Cyclist Interactions–Evidence from Nanjing, China. Travel Behav. Soc. 2023, 32, 100578. [Google Scholar] [CrossRef]
- Haworth, N.; Schramm, A.; Twisk, D. Comparing the Risky Behaviors of Shared and Private E-Scooter and Bicycle Riders in Downtown Brisbane, Australia. Accid. Anal. Prev. 2021, 152, 105981. [Google Scholar] [CrossRef]
- Wegman, F.; Aarts, L. Advancing sustainable safety: National road safety outlook for The Netherlands for 2005–2020. Saf. Sci. 2008, 46, 323–343. [Google Scholar] [CrossRef]
- Federal Highway Administration (FHWA). Available online: https://www.fhwa.dot.gov/environment/bicycle_pedestrian/publications/separated_bikelane_pdg/page00.cfm (accessed on 13 April 2025).
- Kim, D.; Park, K. Analysis of Potential Collisions between Pedestrians and Personal Transportation Devices in a University Campus: An Application of Unmanned Aerial Vehicles. J. Am. Coll. Health 2023, 71, 2272–2279. [Google Scholar] [CrossRef]
- Kleinberger, M.; Sun, E.; Eppinger, R.; Kuppa, S.; Saul, R. Development of Improved Injury Criteria for the Assessment of Advanced Automotive Restraint Systems. NHTSA Docket 1998, 4405, 12–17. [Google Scholar]
- Eppinger, R.; Kuppa, S.; Saul, R.; Sun, E. Supplement: Development of Improved Injury Criteria for the Assessment of Advanced Automotive Restraint Systems: II; National Highway Traffic Safety Administration (NHTSA): Washington, DC, USA, 2000; pp. 1–40.
- The Straits Times. Available online: https://www.straitstimes.com/singapore/transport/lower-speed-limit-and-other-new-rules-for-bikes-and-pmds-to-kick-in-from-feb-1 (accessed on 24 March 2025).
| Disclaimer/Publisher’s Note: The statements, opinions and data contained in all publications are solely those of the individual author(s) and contributor(s) and not of MDPI and/or the editor(s). MDPI and/or the editor(s) disclaim responsibility for any injury to people or property resulting from any ideas, methods, instructions or products referred to in the content. |
© 2025 by the authors. Licensee MDPI, Basel, Switzerland. This article is an open access article distributed under the terms and conditions of the Creative Commons Attribution (CC BY) license (https://creativecommons.org/licenses/by/4.0/).


