Abstract
Loofah is deemed a promising candidate for the purification of oily fumes. Our research utilized H3PO4 for initial activation of loofah (TCS), producing loofahderived carbon (TGSC-0). Subsequently, Fenton’s reagent was utilized for further modification to yield loofah-derived carbon (TGSC-1). TGSC-1 was used in the form of an adsorption column to simultaneously treat multiple pollutants from oily fumes, with surface Fe3+, Fe2+, and H2O2 catalyzing ·OH and ·OOH generation to enhance adsorption of the oils and non-methane hydrocarbon (NMHC). Characterization showed that the specific surface area of TGSC-1 was 427.97 m2/g and pore sizes ranged from 0.50 to 3.50 nm. The rich mesoporous and macroporous structures of TGSC-1 enhanced the capability of carbon layer adsorption. Langmuir adsorption kinetics suggested that adsorption proceeded via monolayer adsorption pathways, while L-τ lines revealed shorter protective effect times for adsorbing PM10 and PM2.5 than for oils and NMHC. The results indicated that TGSC-1 exhibited maximum saturated adsorption capacities of 25.79, 13.02, 9.82, and 15.99 mg/g for oils, NMHC, PM2.5, and PM10, respectively. Increasing resistance of the adsorption column exhibited a notable synergistic effect of filtration and adsorption in treating oily fumes. It combines renewable materials with low-energy processing, delivering eco-economic benefits for sustainable development and application.
1. Introduction
Increased economic development and improved living standards have led to focus on preventing and controlling air pollution for environmental protection [1]. In recent years, the Chinese catering industry has rapidly developed, and oily fumes have become the primary source of indoor air pollution. Oily fumes, containing lipophilic volatile organic compounds (VOCs), which are especially emitted from cooking activities, have significantly contributed to the emissions of VOCs and fine particulate matter in urban environments [2]. Oily fumes contain a complex mixture of toxic pollutants, including metals, benzene, particulate matter (PM), volatile organic compounds (VOCs), polycyclic aromatic hydrocarbons (PAHs), quinones, and carbonyl compounds [3]. In general, oily fumes comprise mixed gases that form from thermal volatilization, oxidation, pyrolysis, and polymerization of edible oils and ingredients at high temperatures, in addition to their secondary reactants [4]. However, carcinogens, including formaldehyde, acetaldehyde, and benzene, are not detected in edible oils, suggesting that these compounds are entirely derived from cooking activities [5]. Toxic and harmful components vary with cooking methods, food types, and heating temperatures. High-temperature cooking has become more popular in recent years, but this style of cooking also produces more oily fumes [6]. Exposure to oily fumes for a long time can lead to various health effects, including heart and lung diseases [7,8], diabetes [9], brain damage [10], sleep disorders [11], female reproductive problems [12], and even pediatric disease linked to maternal exposure [13]. The exhaust gas from oily fumes is a multiphase aerosol fluid suspending in air that combines gas, liquids, and solids [14]. The current primary monitoring focus of oily fume pollutants is on the examination of gas-phase concentrations of oily fumes and benzene series [15]. For example, experimental collection of oily fume adsorbents from different restaurants has shown that waste gas from barbecue restaurants consists primarily of alkane olefins, while home-cooked dishes primarily produce isobutane or propylene and fried dishes primarily produce olefins [16]. When high-temperature oily fumes are emitted into the atmosphere, some VOCs can be converted into new particles through homogeneous or heterogeneous reactions [17,18]. Additionally, inhalation of PM2.5 from various cooking methods has been shown to adversely affect human health [19]. Therefore, the evaluation of oily fume pollutants should not be limited to concentrations of oils and particulate matter (PM2.5 and PM10) but should also include concentrations of VOCs. A comprehensive analysis of VOC exposure characteristics from various cooking methods was conducted to assess health risks associated with Chinese residential cooking [20]. The results revealed an average TVOC concentration of 11.188 mg/m3 from Chinese household cooking, with TVOC exposure concentrations from six methods (stir-frying, quick-frying, stewing, frying, boiling, and steaming) exceeding the Chinese indoor air limit of 0.600 mg/m3.
The Sustainable Development Goals (SDGs), a collection of 17 global goals designed to be a “blueprint to achieve a better and more sustainable future for all” [21], aim to comprehensively address the development issues of society, economy, and environment from 2015 to 2030 and shift toward the path of sustainable development. Fonseca et al. confirmed through a literature review and evaluation of the relationship between SDGs that there are indeed related interactions between SDGs, and positive interactions are more common than negative interactions [22]. This study actively responded to SDGs in various aspects, such as the proposed goals, the entire preparation process of materials, and application prospects.
Air pollution is the biggest health risk facing human society (SDG-3, 7, and 11) [23]. As an important source of indoor air pollution, oily fume exhaust gas not only poses a threat to human health but also can undergo photochemical reactions with nitrogen oxides (NOx) in the atmosphere, generating ozone (O3) and secondary organic aerosols (SOA) [24], exacerbating the global greenhouse effect (SDG-13). In addition, harmful substances such as PAHs in oily fumes have the characteristics of difficult degradation, high toxicity, and easy accumulation. They enter soil and surface water bodies through atmospheric deposition, change the chemical properties of soil and water bodies, and have toxic effects on their organisms, thereby disrupting the balance of ecosystems [25,26]. Therefore, effective treatment of oily fumes is crucial for safeguarding human health and achieving sustainable development goals.
Studies have focused on searching for low-cost and easily available agricultural waste biomass adsorbents to prepare activated carbon with excellent adsorption effects [27,28] in recent years. Loofah is a non-toxic, cheap, easily available, and renewable biomass material with the advantages of a natural porous network [29], large specific surface area, excellent mechanical properties [30], and abundant lignin and cellulose [31]. It is mainly used as an adsorbent [32], a carrier of biofilm [33] and composite adsorbent [34]. For instance, Li et al. conducted a photocatalytic reaction by loading bacterium onto natural loofah to investigate its removal effect on tetracycline hydrochloride [35]. Compared to physical, biological, and hydrothermal activation, chemical activation is the favorite method due to its low energy consumption, shorter pyrolysis time, high surface areas, and more activated carbon yield products [36]. Out of the chemical activation agents, phosphoric acid is a popular choice with high carbon yield and low energy consumption. Moreover, it has an excellent ability to synthesize mesopores, resulting in higher total pore volume and diameters [37,38]. Liao et al. reported that, after activation by phosphoric acid and modification by Fenton’s reagent, camellia oleifera shell carbon generated a large number of carbonyl and carboxyl groups, which led to good performance in treating oils from oily fumes [39]. Other studies also suggested that modified loofah had good adsorption properties for organic pollutants [40] and heavy metals [41], indicating that modified loofah-derived carbon has broad application prospects in the removal of pollutants. Therefore, this study innovatively proposes to use loofah (TCS) as a raw material, activate it with H3PO4 (TGSC-0) to achieve both a porous structure and high specific surface area, and then combine it with Fenton’s reagent modification (TGSC-1) to load Fe3+, Fe2+, and H2O2 on its surface, catalyzing the generation of ·OH and ·OOH. TGSC-1 was used in the form of an adsorption column to simultaneously treat various pollutants from oily fumes (oils, NMHC, PM10, and PM2.5), innovatively revealing its removal mechanisms for different pollutants through analysis using SEM, FTIR, XRD, and adsorption kinetics models. This article proposes an integrated purification scheme for the complex components of oily fumes (gaseous organic matters + solid particulate matters) using a loofah-derived adsorption column for the first time. It not only breaks through the limitations of traditional adsorption materials with a single function, but also establishes a theoretical basis for the simultaneous treatment of multiple pollutants from oily fumes using loofah-derived carbon through experimental verification of synergistic effects.
In summary, the proposal of TGSC-1 provides a promising strategy for addressing various ecological challenges and accelerating the achievement of SDGs. Compared with other pollution control materials, TGSC-1 has advantages such as high treatment efficiency, cost effectiveness, and raw material sustainability, greatly supporting SDG-3 (Good Health and Well-being), SDG-7 (Affordable and Clean Energy), SDG-11 (Sustainable City and Communities), and SDG-13 (Climate Action). Therefore, TGSC-1 has significant synergistic benefits in improving air quality (environment), maintaining health (society), and reducing raw material and manufacturing costs (economy), which is conducive to the development of sustainable roads.
2. Material and Methods
2.1. Adsorbents
Natural loofah was purchased from Jinan within Shandong, China. Carbon tetrachloride (purity ≥ 99.0%), 30% hydrogen peroxide, phosphoric acid (purity ≥ 99.0%), iron (II) sulfate heptahydrate (purity ≥ 99.0%), and anhydrous sodium sulfate (purity ≥ 99.0%) were all purchased from the Shanghai Aladdin Biochemical Technology Co., Ltd. (Shanghai, China). Blending oil, chili oil, and zanthoxylum oil were provided by Jinlongyu Co., Ltd. (Shenzhen, China). Condensate waste oil was retrieved from a canteen at the Guilin University of Technology (Guilin, China).
The morphology and size of all samples (SEM) were characterized using a JSM-6380LV scanning electron microscope (JEOL, Tokyo, Japan) with an acceleration voltage of 15 kV and 10 mM. The skeletons and functional groups within adsorbent compounds (FTIR) were characterized using a ThermoNexus 470 Fourier infrared spectrometer (Nicolet, Glendale, WI, USA). The scanning range was from 400 cm−1 to 4000 cm−1. The X-ray powder diffraction (XRD) data of the fully dried samples were collected using an X’ PertPRO X-ray powder diffraction instrument (PANalytical, Almelo, The Netherlands) under Cu-K radiation (λ = 1.5406 Å), with a working voltage of 40 kV, a working current of 40 mA, a scanning rate of 5 ° min−1, a scattering angle of 2 θ, and a range of 5 to 90°. The specific surface area and pore structure of samples were determined using an ASAP 2020 analyzer (Micromeritics, Norcross, GA, USA) at 77.4 K. All samples were heated at 200 °C for 2 h for degassing treatment before measurement to reduce the impact of physically adsorbed impurities. The specific surface area and pore size distribution of the samples were obtained from N2 adsorption desorption isotherms using the Brunauer–Emmett–Teller (BET) method and the quenched solid density functional theory (QSDFT) method [42], respectively. The total pore volume was obtained at a relative pressure of P/P0 = 0.99. The X-ray photoelectron spectroscopy (XPS) study was conducted using a Thermo Scientific K-Alpha electron spectrometer with monochromatic Al Ka (HV = 1486.6 eV) radiation, and the binding energy was calibrated based on the C 1s peak at 284.8 eV. The surface composition and chemical state of O 1s and Fe 2p were evaluated based on the areas and binding energies of the photoelectron peaks. Oil concentrations were determined using a JC-OILS-6A infrared oil meter (Qingdao Juchuang Environmental Protection Co., Ltd., Qingdao, China). NMHC concentrations were determined using a portable SKY2000 non-methane total hydrocarbon meter (Shenzhen Yuante Technology Co., Ltd., Shenzhen, China). PM10/PM2.5 concentrations were determined using a CW-HAT portable particulate matter meter (Shenzhen Senawei Environmental Technology Co., Ltd, Shenzhen, China). The pressure of loofah-derived adsorption column during the adsorption process was measured using an industrial U-shaped differential pressure gauge (Shandong Guohua Intelligent Manufacturing Co., Ltd., Qingdao, China).
2.2. Preparation of Loofah-Derived Carbon
Natural loofah was dried in an oven at 105 °C for 12 h, followed by shearing into fragments and grinding into a powder, and then was sieved through a 100 mesh sieve. The particulate matter (φ = 150 μm) was identified as the towel-gourd sponge power (TGS). Subsequently, the TGS (20 g) was immersed in 60% H3PO4 (100 mL) for 24 h. Then the filtered residue underwent carbonization/activation in a nitrogen-filled furnace at 500 for 2 h. After cooling, the product was labeled TGSC-0. Subsequently, 20 mL FeSO4 (0.5 mol/L) and H2O2 (30%) were mixed at a Fe2+ to H2O2 ratio of 1:10, and then the pH was adjusted to 3.0 by adding 10 mL of H2O2 to configure the Fenton’s reagent. Next, 5.00 g TGSC-0 and Fenton’s reagent were mixed and stirred for 24 h, followed by vacuum filtration. And then the filter residue was dried in oven for 6 h, yielding Fenton’s reagent-modified loofah-derived carbon (TGSC-1).
2.3. Adsorption of Pollutants from Oily Fumes
A schematic of the adsorption device is shown in Scheme 1. The oily fume waste gas was simulated as followed. Firstly, 500 mL of blending oil, 20 mL of chili oil, 20 mL of zanthoxylum oil, and 60 mL of condensate waste oil (from the oil tank of the range hood) were mixed well in a 1 L three-necked flask. After the electric furnace heated the temperature of the oil mixture to 190 °C, the vacuum pump passed air into the three-necked flask at a specific pressure, allowing the air to mix with the heated flue gas to form simulated oily fumes. A rotameter was used to control the inlet flow rate of the flue gas (Q = 0.12 m3/h). The initial concentrations of oils, PM2.5, PM10, and NMHC were 100~120 mg/m3, 100~110 mg/m3, 240~250 mg/m3, and 40~50 mg/m3, respectively. Next, 5.00 g of TGS, TGSC-0, and TGSC-1 were individually placed in the adsorption column. The oily fumes were supplied to the adsorption column (Φ = 2 cm, L = 30 cm). In addition, the outlet concentrations of particulate matter (PM2.5 and PM10) and NMHC were measured using portable PM2.5/PM10 and NMHC instruments, respectively. Finally, the adsorbent layers were dehydrated and extracted with carbon tetrachloride, followed by measuring the oils with an infrared oil meter.
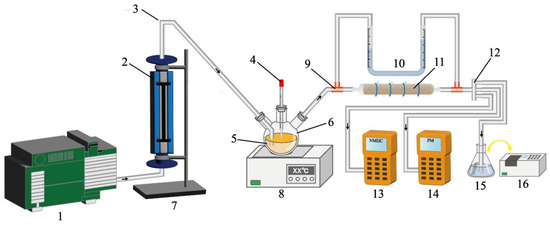
Scheme 1.
Experimental schematic of the adsorption devices for oily fumes 1: air pump, 2: rotameter, 3: rubber tube, 4: thermocouple, 5: mix of blended oil, chili oil, pepper oil, and condensed waste oil, 6: three-necked flask, 7: iron support stand, 8: electric stove, 9: three-way pipe (without valve), 10: industrial U-shaped differential pressure gauge, 11: loofah-derived adsorption column, 12: infrared thermometer, 13: portable non-methane total hydrocarbon meter, 14: portable particulate matters meter, 15: carbon tetrachloride solvent, 16: infrared oil analyzer.
2.4. Experimental Methods
2.4.1. Adsorption Curve and Adsorption Capacity Calculations
The outlet concentrations of oils, NMHC, PM10, and PM2.5 were measured to assess the adsorption performance of TGSC-1, with TGS and TGSC-0 as controls. Specifically, adsorption times were used as the abscissa and outlet concentrations (oils, NMHC, PM10 and PM2.5) were used as the ordinates to draw adsorption curves. According to Chinese catering industry standards, a maximum allowable emission concentration of 2.00 mg/m3 was set as the breakthrough point of oil concentration. The time corresponding to an outlet concentration/inlet concentration ratio of 0.02 was set as the protective effect time for the concentration of oils. In addition, based on Liaoning Province catering industry oily fume emission standards, a maximum allowable emission concentration of 1.00 mg/m3 was set as the breakthrough point of NMHC, PM2.5, and PM10 concentrations. The time corresponding to an outlet concentration/inlet concentration ratio of 0.05 was set as the protective effect time for the concentrations of NMHC, PM10, and PM2.5, which was used to calculate the breakthrough adsorption capacity. The time corresponding to an outlet concentration/inlet concentration ratio of 0.95 was set as the saturated adsorption time for each pollutant, and the saturated adsorption capacity was calculated, respectively.
The adsorption capacity for pollutants was determined using Equation (1):
where q (mg/g) is the adsorption capacity for adsorbent per unit mass at t, C0 (mg/L) is the inlet concentration of pollutants, S is the integral area between the breakthrough adsorption curve and the abscissa, t (min) is the adsorption time, and M (g) is the mass of the adsorbent [43].
2.4.2. Wurof Equation Calculations
The Wurof equation was used to explain the relationship between the adsorption protective effect time and adsorption layers thickness for different masses adsorbents in adsorbing oils, NMHC, PM2.5, and PM10. The equation is shown in Equation (2):
where τ (min) is the protective effect time, K (min/m) is the adsorption layer protection coefficient, L (m) is the adsorption layer thickness, and τ0 (min) is the protection time loss. L can be calculated using Equation (3):
where m (kg) is the mass of adsorbent, A (m2) is the cross-sectional area of the adsorption layer, and (kg/m3) is the bulk density of the adsorbent. The bulk density can be calculated using Equation (4):
where ε is the voidage of the adsorption layer, generally 0.35~0.70; and ρp (kg/m3) is the density of the adsorbent.
2.4.3. Adsorption Isotherm Models
Adsorption isotherms were described by the Langmuir and Freundlich models, which reflect the effects of concentration and temperature on adsorption properties. It is a common phenomenon that substances migrate from the mobile phase (liquid or gas phase) to the solid phase in aqueous porous media and aquatic environments. As a result, the adsorption isotherm curve was introduced to describe this process, which is the relationship curve between the concentration of solute molecules in the two-phase interface when they reach equilibrium during the adsorption process at a certain temperature and is important for optimizing the use of adsorbents. Several models have been intensively used in the literature to describe the experimental data of adsorption isotherms. The most famous ones are the Langmuir, Freundlich, and Temkin models [44]. The Langmuir model is based on the principle of monolayer adsorption with limited adsorbent capacity and roughly the same adsorption point, which can be used to explain the chemical adsorption on the surface of adsorbents. By contrast, the Freundlich model is more suitable for multicomponent adsorption and the situation where the distribution of adsorption sites on the adsorbent’s surface is non-uniform [45].
The Langmuir model is often used to describe adsorption forms of monolayers and is suitable for adsorbents with uniform surfaces without interactions between adsorbed molecules. The equation is as follows:
where qe (mg/g) is the equilibrium adsorption capacity, qm (mg/g) is the maximum adsorption capacity, Ce (mg/m3) is the concentration of gas, and KL (m3/mg) is the Langmuir constant [46].
The Freundlich equation, which can be used to describe the adsorption isotherm of a heterogeneous surface adsorbent, is an empirical adsorption isotherm that is calculated as follows:
where KF (mg/g) is the Freundlich constant and 1/n is the heterogeneity factor [47].
3. Results and Discussion
3.1. Saturated Adsorption Capacity for Oily Fumes
The adsorption performance of the three loofah adsorbents for oily fumes were evaluated. Adsorption breakthrough curves are widely used to evaluate adsorption performance [48]. The adsorption breakthrough curves and adsorption capacities of TGS, TGSC-0, and TGSC-1, used as contrast for adsorbents absorbing oily fumes from dry flue gas, are shown in Figure 1. The adsorption performance data are also shown in Table 1. TGSC-1 exhibited a longer protective effect time and higher breakthrough adsorption capacity for absorbing oily fumes than TGS and TGSC-0. Moreover, the highest breakthrough adsorption capacity of TGSC-1 was 5.18 mg/g for absorbing oils from oily fumes, and the longest protective effect time of TGSC-1 was 56 min for absorbing NMHC from oily fumes. Thus, the results implied that the removal mechanisms of PM10 and PM2.5 were different from those of oils and NMHC from oily fumes.
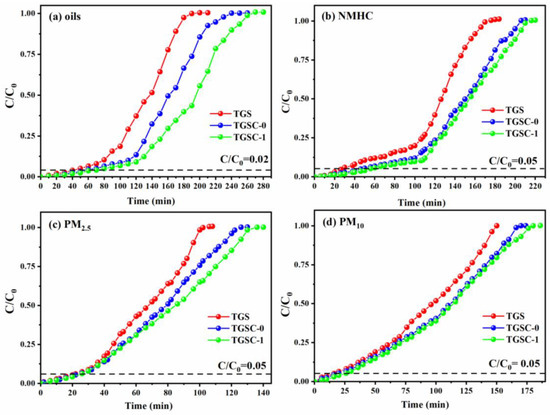
Figure 1.
Adsorption breakthrough curves of oily fumes by different loofah adsorbents (Q = 0.12 m3/h, T = 25 °C, H = 14 cm): (a) oils, (b) NMHC, (c) PM2.5, and (d) PM10.

Table 1.
Performance of loofah adsorption for oily fumes.
3.2. Resistance Changes and Dynamic Evolution of Adsorption Mechanisms of TGSC-1 for Adsorbing Oily Fumes
An industrial U-shaped differential pressure gauge was used to measure the pressure during the process of TGSC-1 adsorbing oily fumes. The resistance changes and adsorption breakthrough curves for oily fumes absorbed by TGSC-1 at 3.00 g are illustrated in Figure 2 (Q = 0.12 m3/h, T = 25 °C, H = 14 cm; initial concentrations of oils, PM2.5, PM10, and NMHC were 100 mg/m3, 110 mg/m3, 240 mg/m3, and 50 mg/m3, respectively). According to this figure, the protective effect times of TGSC-1 for absorbing oils, NMHC, PM2.5, and PM10 were 50, 28, 22, and 20 min, respectively. Figure S1 displays that the breakthrough adsorption capacity of TGSC-1 for absorbing oils, NMHC, PM2.5, and PM10 were 4.76, 1.53, 0.79, and 1.58 mg/g, respectively, and the saturated adsorption capacities were 16.89, 10.62, 6.02, and 11.98 mg/g, respectively. Meanwhile, pressure changes also can well indicate changes in resistance during the adsorption process. In the initial adsorption phase (0–40 min), the adsorption bed was clean and exhibited high porosity, facilitating the rapid flow of oily fumes through it. During this time, NMHC and oils, which are organic gaseous pollutants, had faster diffusion rates than PM2.5 and PM10 in the initial clean bed layer. Therefore, the TGSC-1 adsorption bed could capture and absorb oils and NMHC more effectively than PM2.5 and PM10. Concurrently, larger particulate matter (PM) was filtered out by the adsorbent bed [49]. Thus, adsorption was the predominant process in this stage, with resistance primarily due to gas–solid two-phase mass transfer, resulting in low resistance levels (2~4 kPa). As more large particles entered the interstitial channels of the bed, bridging phenomena occurred. As a result, smaller oily fume particles were trapped and accumulated in the bed’s gaps, narrowing the airflow channels and leading to increased resistance. This process narrowed the airflow channels and increased resistance. In the subsequent stage (40~130 min), both adsorption and filtration occurred within the bed, where resistance was characterized by both mass transfer and filtration resistance. As resistance increased, the flue gas flow rate decreased. Particles then accumulated at the bed inlet, forming a filter cake layer. Consequently, resistance sharply increased (8~30 kPa) until surface blockage occurred. In the following stage (130~170 min), the process primarily involved filtration, with resistance determined by the thickness of the filter cake. In the final period (170~200 min), due to surface blockage, it was difficult for the oily fume airflow to pass evenly through the filter bed, resulting in abnormal phenomena such as wall flow, while the resistance remained at a high point [50].
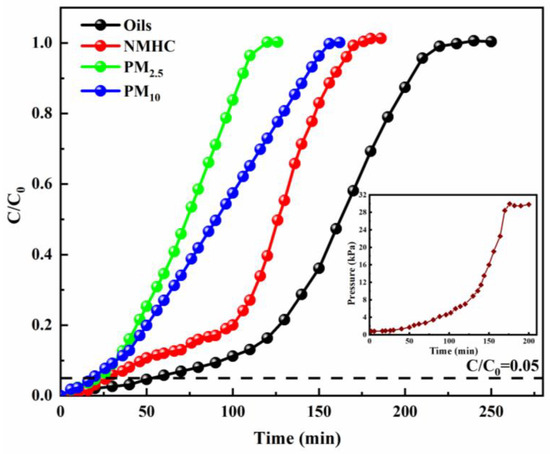
Figure 2.
Resistance changes and adsorption breakthrough curves of oily fumes adsorbed by TGSC-1 (Q = 0.12 m3/h, T = 25 °C, H = 30 cm; initial concentrations of oils, PM2.5, PM10, and NMHC were 100 mg/m3, 110 mg/m3, 240 mg/m3, and 50 mg/m3, respectively).
3.3. Model for TGSC-1 Adsorbing Oily Fumes
The L-τ lines of TGSC-1 simultaneously adsorbing oils, NMHC, PM2.5, and PM10 from oily fumes are fitted in Figure 3a, which shows the relationship between the protective effect time of different pollutants and the height of the adsorption column filled with TGSC-1 (L = 0.024, 0.040, 0.0560, 0.072, and 0.088 m). The parameters of the Wurof equation corresponding to the L-τ lines are shown in Table 2. When the concentration distribution curve entered the translation stage, K expressed the time for each pollutant’s movement per unit length in the TGSC-1 layer. The K (3149 min/m) for NMHC was the longest, 2 times more than for oils (K = 1447 min/m) and nearly 3 times more for particulate matter (K = 1111 min/m for PM2.5 and K = 1161 min/m for PM10). It also meant that the unit length movement time of the mass transfer zone for adsorbing NMHC was longer than that for adsorbing oils, PM2.5, and PM10 in the TGSC-1 layer.
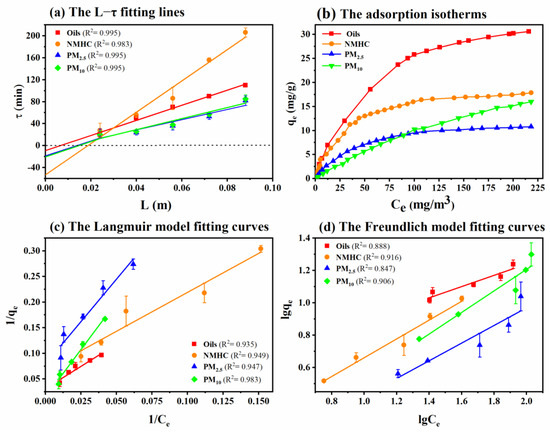
Figure 3.
Some fitting lines and curves of TGSC-1 adsorbing oily fumes (Q = 0.12 m3/h, T = 25 °C, H = 30 cm): (a) L−τ fitted lines, (b) adsorption isotherms, (c) Langmuir model fitting curves, and (d) Freundlich model fitting curves.
Table 2.
Wurof equation parameters of TGSC-1 adsorbing MPCF.
The Langmuir and Freundlich model fitting lines for TGSC-1 adsorbing oily fumes are shown in Figure 3c,d, and the model parameters are summarized in Table 3. They showed that the Langmuir model was significantly more accurate in describing the process of TGSC-1 adsorbing oily fumes than that of the Freundlich model from the R2 value. As shown in Figure 3b, as the concentration of adsorbent increased, the concentration ratio of residual compounds in the gaseous phase and adsorbed phase gradually decreased, indicating that the adsorption capacity of TGSC-1 tended to saturate. It appeared that the adsorption isotherms of TGSC-1 adsorbing oily fumes corresponded to type I, according to the definition of IUPAC, known as the “L” isotherm [51]. And TGSC-1 was more suitable for adsorbing low concentrations of oils, NMHC, and PM2.5 from oily fumes. However, high concentration of PM10 also could competently adsorbed by TGSC-1. The above results suggested that the adsorption of oily fumes over TGSC-1 belonged to monolayer adsorption, and chemisorption played a major role in these processes due to modification by Fenton’s reagent [39].
Table 3.
The parameters of adsorption models.
3.4. Adsorption Mechanism
3.4.1. Filtering Adsorption
The XRD spectra of the chemical composition of the three adsorbents are analyzed in Figure S2. The diffractogram of TGS showed two sharp peaks at 16.4° and 22.5° (2θ), which are characteristic of the cellulose I structure [52]. And a weak diffraction peak was found at 34.7° (2θ), which revealed the amorphous structure of pectin [53]. It could be seen that both crystalline and amorphous parts were present in the TGS structure. After high-temperature pyrolysis of these components, the diffraction peak intensities of TGSC-0 and TGSC-1 decreased. After activation with phosphoric acid, both TGSC-0 and TGSC-1 exhibited broad peaks at around 2θ = 23°, which was consistent with the (002) crystal planes in graphite. However, the peaks at 44.6° and 64.8º were attributed to the (110) and (220) crystal planes of body-centered cubic α-Fe, respectively [54,55], which suggested that elemental Fe was attached to TGSC-1 after modification with Fenton’s reagent.
Table 4 displays the specific surface areas and porous structure characterization of TGS, TGSC-0, and TGSC-1. Compared with TGSC-0, TGSC-1 showed a decrease in the specific surface area and total pore volume because the sectional porous microstructure of TGSC-1 was collapsed by H2O2 through oxidation. Moreno-Castilla et al. [56] and Bandosz Teresa et al. [57] also found that H2O2 modification resulted in the reduction of the specific surface area of activated carbon to different degrees.
Table 4.
Specific surface areas and pore structures of loofah adsorbents.
The N2 adsorption–desorption isotherms of TGS, TGSC-0, and TGSC-1 are shown in Figure S3A. The three adsorbents all exhibited significant type-II adsorption isotherms and hysteresis loops, indicating that the adsorbents had mesoporous and macroporous structures. From the experimental results of TGSC-0 and TGSC-1, it could be found that the adsorption capacity increased with increasing pressure, and the adsorption capacity of the three adsorbents was TGSC-0 > TGSC-1 > TGS. Figure S3B shows the pore size distributions of the three adsorbents. The experimental results showed that the pore size distributions of TGSC-0 and TGSC-1 were relatively uniform and mainly in the range of 0.5~3.5 nm, while that of TGS was mainly in the range of 1.6~4.0 nm. The pore sizes of TGSC-1 were significantly smaller than those of TGSC-0, which was mainly attributed to modification by Fenton’s reagent, resulting in the emergence of functional groups.
The internal structures and surface characteristics of biomass adsorbents can reflect their adsorption capacity for organic pollutants. To further observe the microstructure of these adsorbents, the results of the SEM experiments are presented in Figure 4. Figure 4A–C2 show the surface structures and the microstructures of the three adsorbents, respectively. As shown in Figure 4A1, TGS had a large number of pectin layers attached to its surface. However, after high temperature pyrolysis and H3PO4 activation, TGSC-0 had a flatter and smoother surface with a uniform pore structure, enhancing functional group attachment and pollutant adsorption [58]. When the material was scanned at a magnification of 5000, the surface of the pectin layer of TGS was smooth and flat without an obvious pore structure. However, after high-temperature pyrolysis and modification, its surface was completely changed. It could be observed that there were large numbers of micropores and mesopores distributed on the surface of the carbon layers of TGSC-0 and TGSC-1. Due to adsorption points provided by these pores, large quantities of pollutants were adsorbed on the surface or filled in the pores of TGSC-1 (Figure 4C2), which also proved the decreases in specific surface area and pore volume of TGSC-1. In addition, mesopores further promoted the migration of electronic groups as well [59], significantly boosting the adsorption capacity of TGSC-1 for small molecules or ions [60].
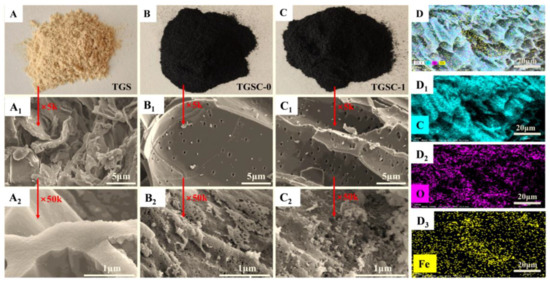
Figure 4.
Photographs and SEM images of TGS (A–A2), TGSC-0 (B–B2), and TGSC-1 (C–C2), and SEM-EDS plots of TGSC-1 (D–D3).
The filtering adsorption capacities of PM10 and PM2.5 were relative to the particle properties of the granular pile layers of TGS, TGSC-0, and TGSC-1. The particle surface of TGS exhibited corrugated structures previously described as “vascular bundle structures” [61] and had a large amount of lignocellulose [62]. And the particle surface of TGSC-0 was irregular with abundant uniformly distributed pore structures due to pyrolysis [63,64]. The enormous specific surface area and pore size of activated carbon bolstered its adsorption process, which was primarily driven by van der Waals forces. Nevertheless, the diameters of pollutants PM2.5 and PM10 significantly exceeded those of other gaseous pollutants and even micropores, restricting microporous adsorption. Therefore, compared to the other three pollutants, PM2.5 had a lower probability of undergoing inertial collisions in TGSC-1, consequently reducing its chances of being captured and adsorbed [65]. Moreover, research indicated that adsorbents such as biochar primarily captured PM2.5 and PM10 through the gaps in their stacking layers [66]. The thickness of these layers substantially affected the onset and offset of the bed’s saturation adsorption time, thereby influencing the overall adsorption efficiency. As shown in Table 4, the pore size of TGSC-1 was notably smaller than that of TGS, implying denser granular pile layers, which implied that TGSC-1 probably demonstrated a superior adsorption effect on PM2.5 and PM10. Table 1 indicated that the breakthrough adsorption capacities of the three adsorbents for PM2.5 and PM10 were lower than those for oils and NMHC, and the protective effect times of the three adsorbents for PM2.5 and PM10 were shorter than those for oils and NMHC. Furthermore, during the synergistic adsorption process, PM2.5 not only functioned as an adsorbed pollutant but also served as a new adsorbent due to the characteristics of solid particles. Deviating fitting lines for PM2.5 and PM10 in Figure 3b,c confirmed the preferential adsorption of TGSC-1 for oils and NMHC. And then Fenton’s reagent modification provided more adsorption sites for TGSC-1, facilitating charge neutralization, bridging abilities, and friction force function [67], so that the intermolecular force of TGSC-1was stronger than that of TGSC-0. Therefore, the granular pile layers of TGSC-1 had higher filtering adsorption capacities for PM10 and PM2.5 from oily fumes than those of TGSC-0 and TGS.
The SEM-EDS analysis revealed only the elements carbon (C) and oxygen (O) in TGS and TGSC-0, confirming that these elements were their primary components (Figure S4A1,B1). However, as shown in Figure 4D, after modification with Fenton’s reagent, the element Fe was observed to adhere to the surface of TGSC-1. And the normalized content analysis showed that TGS contained 56.38% C and 40.48% O elements, TGSC-0 contained 84.78% C and 8.90% O elements, and TGSC-1 contained 87.78% C, 6.44% O, and 1.60% Fe elements, respectively, which showed that after the carbonization of TGS, the content of element C was increased and the content of element O was decreased. During the carbonization process, partial sugar decomposition, dehydration, and dehydrogenation might have occurred in TGSC-0 and TGSC-1, resulting in an obvious increase in C content and a decrease in O content. The decrease in the O/C ratio exactly reflected that the decrease in reactivity due to the decrease in VOCs and the increase in carbonization degree [32]. In addition, TGSC-1’s highest carbon content (87.78%) enhanced adsorption through decreased polarity [68].
3.4.2. Physical and Chemical Adsorption
After modification, the changes in the functional groups of adsorbents can be used to characterize the adsorption mechanisms for different organic pollutants [44]. The adsorbents were analyzed using the ThermoNexus 470 Fourier infrared spectrometer to identify skeletons and functional groups present in the spectra of these adsorbents. Figure 5A compares the FT-IR spectra of the three adsorbents. While all showed abundant functional groups, their peak intensities differed significantly. The stretching vibrations of C-H of methyl, methylene, and aromatic rings were measured using the infrared oil meter at 2930 cm−1, 2960 cm−1, and 3030 cm−1, respectively, to obtain the concentrations of oils. The absorption peak at 1615 cm−1 corresponded to the stretching vibration of -OH. And the peaks at 3436 and 3202 cm−1 corresponded to the flexural vibration of hydroxyl (physically absorbed water molecules), which indicated that some water molecules were introduced into the surface and the pores of the adsorbent in the form of absorbed water. The peak at 1744 cm−1 corresponded to the stretching vibration of C=O in carbonyls and carboxyls [69]. The peaks at 1384, 1036, and 875 cm−1, respectively, were the stretching vibrations of -NO, the S=O bonds in SO42−, and P-O-P in polyphosphate [70]. And the broad and strong vibration at 630 cm−1 was the symmetrical stretching vibration of S=O bonds in SO32−. The peak at 450~600 cm−1 belonged to the lattice vibration of cations (Fe2+, Fe3+, Al3+, and Mg2+) [71], so the characteristic peaks at 450~600 cm−1 were related to the bending vibration of Fe-O [72]. In addition, a large amount of the organic matter in oils and NMHC had small sizes and could be physically adsorbed by the carbon pores on the surfaces of TGSC-0 and TGSC-1. As a result, TGSC-1 attached abundant organic functional groups, such as carboxyl, hydroxyl, carbonyl, and nitro groups. And some acidic oxygen-containing groups, such as carbonyls, hydroxyls, and carboxyls, are good at adsorbing pollutants, fixing biomolecules, or attaching other ligands [73]. This is because their negative charge density can be enhanced in neutral or basic aqueous media, and specific binding sites for adsorbates are generated through the deprotonation of oxygen-containing groups [74]. In addition, as shown in Figure 5A, the absorption peaks of carbonyl and carboxyl groups in TGSC-1 were stronger and wider than those in TGS and TGSC-0, which was because C-H had the same polarity as the carbonyl and hydroxyl groups attached to the surface of TGSC-1. Above all, we could draw the conclusion that TGSC-1 had the best absorption performance for oily fumes among the three adsorbents.
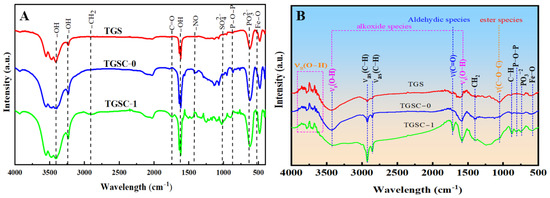
Figure 5.
FT-IR spectra of the original adsorbents (A) and after adsorption (B).
To further demonstrate the performance of these adsorbents for absorbing oily fumes, the adsorbents was treated by adsorbing oily fumes for 30 min, followed by FT-IR experiments (Figure 5B). The results showed that the broad absorption peak observed at 3428 cm−1 corresponded to the stretching vibration of hydroxyl groups, either in their free state or in reaction with Fe3+ [67]. TGSC-1’s stronger absorption bands reflected the higher alkoxide content from oily fumes and superior adsorption capacity. The adsorption band at 1565 cm−1 was attributed to the hydroxyl bending vibration in water molecules, indicating TGSC-1 may have contained adsorbed, structural, and crystalline water [75]. And C=O and C-O-C stretching were observed at 1618 cm−1 and 1112 cm−1, respectively, which was mainly ascribed to the high contents of aldehydic species and ester species from oily fumes [76]. According to the principle of similar solubility, aldehydes are easily compatible with carbonyl and carboxyl groups on the surface [77,78]. Therefore, TGSC-1 was more inclined to absorb organic pollutants containing strongly polar functional groups such as aldehydes, ketones, and carboxylic acids.
The composition and valence states of the new and used adsorbents were determined by XPS analysis. Figure 6A shows the wide-scan survey of the XPS spectra of these adsorbents. Elements C and O both could be found in all adsorbents. However, elements P and Fe only could be found after H3PO4 activation and Fenton’s reagent modification, indicating that elements P and Fe were adsorbed on loofah-derived carbon. Table 5 shows the quantitative analysis of functional groups before and after adsorption by the three types of adsorbents, as well as Fe2+ and Fe3+ in TGSC-1 (presented in area ratio form). Figure 6B, 6C, and 6D, respectively, show the Gaussian peaks yielded from the deconvolution of C 1s, O 1s, and Fe 2p peaks from these new and used adsorbents. In the C1s spectra (as shown in Figure 6B), two distinguished peaks at 283.8 and 285.4 eV corresponded to the C-C/C-H and C-OH/C-OR/C-N functionality, respectively. However, for the TGS, TGSC-0, and TGSC-1 adsorbents, the C-C/C-H peaks gradually moved to the left and the C-OH/C-OR/C-N peaks gradually moved to the right. In addition, significant changes in the used adsorbents could be easily noticed. For the used TGS adsorbent, the peak intensity of C-OH/C-OR/C-N decreased significantly (the ratio before and after adsorption was about 2.10), and for the used TGS, TGSC-0, and TGSC-1 adsorbents, the C-OH/C-OR/C-N peaks gradually move to the left and the C-C/C-H peak significantly declined. By analyzing the O 1s XPS spectra of absorbents, we verified the positive role of oxygen-containing functional groups in catalytic reactions. In the O 1s spectra (as shown in Figure 6C), two distinguished peaks at 530.89 eV and 531.76 eV corresponded to C=O and -C-O-H, respectively. It was clearly found that the relative proportion of -C-O-H increased and that of C=O reduced from TGS to TGSC-1. It could be inferred that -C-O-H was possibly the active site, and C=O might be generated during chemical adsorption. Furthermore, from TGSC-1 to TGSC-1-used, the high-resolution Fe 2p peaks in the XPS spectra were converted into four deconvolution peaks, with the peaks at 710.96 eV and 724.45 eV assigned to Fe2+ and the peaks at 713.68 eV and 727.35 eV assigned to Fe3+ (as shown in Figure 6D). However, the ratio of Fe2+ on the surface of TGSC-1 before and after adsorption was about 1.29, while the ratio of Fe3+ was about 1.30, indicating that Fe2+ and Fe3+ involved in the reaction might be active sites.
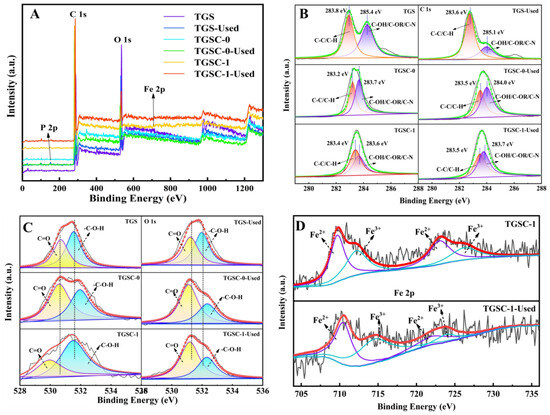
Figure 6.
XPS spectra (A), C 1s spectra (B), O 1s spectra (C), and Fe 2p spectra (D) of adsorbents.
Table 5.
Quantitative analysis of functional groups and Fe2+ and Fe3+ ratios before and after the use of three types of loofah adsorbents.
In this study, TGSC-1 was modified by the homogeneous Fenton system Fenton system, and hydroxyl radicals (·OH) was generated by oxidation with Fe2+/H2O2. Reactive oxygen species (ROS) such as ·OH, superoxide radicals (·O2), and hydrogen peroxide (H2O2) can oxidize VOCs into CO2 and H2O [79]. Simultaneously, metal ions (Fe2+, Fe3+) attached to the surface of TGSC-1 quickly reacted with the target substances, so the mass transfer effect had little influence on the system [80]. Therefore, Fe ions as homogeneous catalysts exhibited an excellent catalytic effect on the conversion of H2O2 to ·OH and ·OOH [81,82,83]. During this reaction, on the one hand, Fe2+ or Fe3+ with strong oxidation ability not only promoted the oxidation of pollutants but also accelerated the process of decomposing H2O2 into ·OH and ·OOH. On the other hand, carbon materials had abundant pore sizes, providing a great number of surface active sites for H2O2 decomposition, resulting in more generation of ·OH and ·OOH to degrade pollutants.
These radicals had strong addition reaction and oxidation capacities due to their electron-deficient groups and high electric potential (+2.8 V) [84,85], attacking unsaturated double bonds and defects on the surface of TGSC-1, resulting in carbonyl and carboxyl functional groups forming on it. ·OH also could further oxidize unstable –CH2OH and –CHOH– functional groups into carboxyl groups to conduct strong oxidation and substitution reactions with olefins, alkynes, and other unsaturated hydrocarbons in NMHC. Furthermore, some carbonyl and carboxyl groups could be oxidized to aldehydes and acids by Fe2+ or Fe3+, ·OH, and ·OOH to achieve chemical adsorption and capture of VOCS in oily fumes. Regarding the loading effect of metal catalysts, Cheng S. et al. conducted tetracycline degradation experiments with an Fe–Ni LDH@ZIF-67-modified carbon cloth cathode, proving that metal catalyst loading can significantly enhance the active sites on carbon, promoting electron transfer and H2O2 decomposition [86]. Meanwhile, researchers found that activated carbon acted as a catalyst for electron transfer to form a chain reaction comprising the AC/AC cycle [87]. Although the mechanism is not clear, activated carbon indeed is a good catalyst for hydroxyl radical generation from H2O2 and has a synergic effect on FeSO4 activity [88,89,90]. Researchers [91] also investigated the removal of amitrole (AMT) via oxidation using the decomposition of hydrogen peroxide in heterogeneous and homogeneous Fenton reactions. The results indicated that the removal closely depended on the load capacity of Fe and the Fe/H2O2 molar ratio. In addition, compared with acetates and nitrates, a synergistic effect in generating ·OH radicals only existed in the combination of activated carbon and sulfate.
Hydrocarbons are the main component of oils, and C-H has the same polarity as the carbonyl and carboxyl groups on the surface of TGSC-1. According to the principle of similar solubility, TGSC-1 was more likely to adsorb C-H, so it had a better adsorption effect on oils than TGS and TGSC-0. There was a large amount of mesoporous-microporous structures on the surface of TGSC-1. With the increase in adsorption pressure, macroporous adsorption gradually dominated. In addition, TGSC-1 had a rough surface and larger specific surface area, which effectively adsorbed particulate matter (PM2.5, PM10). During the adsorption process of NMHC, Fe3+, Fe2+, and H2O2 with strong oxidation properties on the surface of TGSC-1 could oxidize and decompose most of the NMHC adsorbed on the surface of TGSC-1. To summarize, on the one hand, TGSC-1 effectively utilized surface functional groups to adsorb complex pollutants from oily fumes chemically and purified and removed most of the oils and NMHC; on the other hand, PM2.5 and PM10 were filtered physically by TGSC-1 through a carbon layer, achieving efficient adsorption and purification of oily fumes.
3.5. Life Cycle Assessment (LCA)
As a forward-looking strategy to protect the Earth and all humanity, the importance of SDGs for future sustainable development was carefully described in the introduction. Life cycle assessment (LCA) is a means of evaluating the overall environmental impact of a product or facility from cradle to grave. It observes issues from the perspective of regional, national, and global breadth and sustainability. LCA can be used to investigate the environmental and economic burden of a product or service throughout its entire life cycle, quantify every detail, and provide a comprehensive evaluation [92]. At present, the triple crisis of climate change and deterioration of the natural environment, loss of biodiversity, and pollution and waste are posing a serious threat to the health of the Earth. Therefore, it is important to use LCA as a tool to carefully evaluate the potential impact of materials on the environment for achieving SDGs.
In the stage of obtaining raw materials, the production of TGS is more sustainable and in line with the principles of a circular economy. In terms of preparation cost, the acquisition cost of loofah is extremely low or even free [93]. Using it as a raw material for the preparation of activated carbon not only avoids the landfill or incineration of waste and reduces pollution to land and air but also reduces the use of fertilizers and pesticides because it recycles agricultural products, further reducing the environmental footprint of materials.
In the stage of preparation, the production process of TGSC-1 is more energy efficient and environmentally friendly. On the one hand, compared with traditional zinc chloride activation, H3PO4 is a relatively environmentally friendly activator with mild reaction conditions and fewer harmful by-products. It can also reduce environmental costs through subsequent recycling or neutralization treatment. On the other hand, H3PO4 activation is usually carried out at lower temperatures (500 °C), with lower energy consumption compared to traditional physical activation (such as water vapor activation, 800~1000 °C).
In the stage of application, the adsorption column of TGSC-1 showed a longer protection time and higher saturation adsorption capacity in the experiment, indicating its longer service life, which can reduce replacement frequency and corresponding waste generation.
In the stage of disposal, after the end of its service life, TGSC-1 is mainly composed of element C and a small amount of iron oxide, which are relatively stable in the environment. Compared to other adsorbent materials that may contain heavy metals or other harmful components, TGSC-1 can undergo harmless treatment and has a smaller carbon footprint.
In recent years, lignocellulosic activated carbon has been widely favored in the field of adsorbent materials due to its various advantages, such as low cost, recyclability, sustainability, and environmental friendliness [94]. Through the above LCA analysis, it can be clearly seen that TGSC-1 has a smaller environmental footprint in all stages of raw material acquisition, preparation, use, and waste disposal, and has significant sustainable advantages compared to traditional materials. This advantage is not only reflected in its low impact on the environment but also in its efficient use of resources and positive contributions to society (such as improving air quality, ensuring health, etc.), making it an important technological means to achieve sustainable development goals.
4. Conclusions
An adsorption column utilizing natural loofah powder (TCS), H3PO4-activated loofah-derived carbon (TGSC-0), and Fenton’s reagent-modified loofah-derived carbon (TGSC-1) demonstrated excellent adsorption performance for both organic pollutants (oils and NMHC) and particulate matter (PM2.5 and PM10) from oily fumes (Table 1). Among these materials, TGSC-1 stood out, exhibiting higher adsorption capacity and longer protective effect time. Moreover, the adsorption performance (saturated adsorption capacity and protective effect time) of the TGSC-1 packed column was notably superior for organic pollutants (oils and NMHC) compared to particulate matter (PM10 and PM2.5). This difference could be attributed to the distinct mechanisms by which TGSC-1 purified organic pollutants and particulate matter. The purification of organic pollutants was achieved through the physical and chemical adsorption properties of TGSC-1, whereas the removal of particulate matter was facilitated by the filtration effects of the gaps in the adsorption bed of TGSC-1 (Figure 2). Consequently, the synergistic adsorption and filtration capabilities of the TGSC-1 packed column exhibited outstanding performance in purifying multiphase oily pollutants. In summary, combining SDGs and LCA analysis, TGSC-1, as a low-cost and highly effective loofah-derived adsorbent, could significantly decrease the costs associated with pollution control through its development and utilization, aligning with the principles of a circular economy. Furthermore, by mitigating environmental pollution and enhancing the overall health of society, it also could contribute to the sustainable development of the environment. Further research can be conducted on the regenerative performance of TGSC-1, making it a promising mainstream material for multi-pollutant treatment and promoting the comprehensive realization of sustainable development.
Supplementary Materials
The following supporting information can be downloaded at: https://www.mdpi.com/article/10.3390/su17094079/s1, Figure S1: Adsorption capacity of oily fumes adsorbed by TGSC-1 at 3.00 g (Q = 0.12 m3/h, T = 25 ℃, H = 30 cm): (a) oils, (b) NMHC, (c) PM2.5, (d)PM10. Figure S2. XRD patterns of TGS, TGSC-0 and TGSC-1 adsorbents. Figure S3. (A) N2 adsorption-desorption isotherm and (B) pore sizes distribution. Figure S4. The SEM images(A-C) and the SEM-EDS plots of TGS, TGSC-0 and TGSC-1 respectively (A1-C5).
Author Contributions
J.Z.: Data curation, Writing—original draft, Visualization. B.Z.: Methodology, Project administration. L.L.: Funding acquisition, Writing—review & editing. A.Q.: Resources. S.M.: Conceptualization. J.W.: Formal Analysis. H.W.: Investigation. X.Z.: Supervision, Funding acquisition. Y.F.: Validation. H.Z.: Software. All authors have read and agreed to the published version of the manuscript.
Funding
This project was financially supported by Key R&D Program in Guangxi (Grant No. Guike AB25069167), Guangxi Science and Technology Program (Grant No. Guike AD25069074), Central Guiding Local Development of Science and Technology Plan Project in Guigang City, Guangxi, China ([2023] No. 2), and the National Natural Science Foundation of China (Grant No. 51468011).
Institutional Review Board Statement
Not applicable.
Informed Consent Statement
Not applicable.
Data Availability Statement
Data are contained within the article and Supplementary Materials.
Conflicts of Interest
The authors declare that they have no known competing financial interests or personal relationships that could have appeared to influence the work reported in this paper.
References
- Ma, Y.; Deng, L.; Ma, P.; Wu, Y.; Yang, X.; Xiao, F.; Deng, Q. In vivo respiratory toxicology of cooking oil fumes: Evidence, mechanisms and prevention. J. Hazard. Mater. 2021, 402, 123455. [Google Scholar] [CrossRef] [PubMed]
- Alves, C.A.; Vicente, E.D.; Evtyugina, M.; Vicente, A.M.P.; Sainnokhoi, T.; Kovats, N. Cooking activities in a domestic kitchen: Chemical and toxicological profiling of emissions. Sci. Total Environ. 2021, 772, 145412. [Google Scholar] [CrossRef] [PubMed]
- Chiang, T.; Wu, P.; Ko, Y. Identification of Carcinogens in Cooking Oil Fumes. Environ. Res. 1999, 81, 18–22. [Google Scholar] [CrossRef]
- Zhang, D.; Liu, J.; Jia, L.; Wang, P.; Han, X. Speciation of VOCs in the cooking fumes from five edible oils and their corresponding health risk assessments. Atmos. Environ. 2019, 211, 6–17. [Google Scholar] [CrossRef]
- Yu, K.; Yang, K.R.; Chen, Y.C.; Gong, J.Y.; Chen, Y.P.; Shih, H.; Lung, S.C. Indoor air pollution from gas cooking in five Taiwanese families. Build. Environ. 2015, 93, 258–266. [Google Scholar] [CrossRef]
- Cheng, S.; Wang, G.; Lang, J.; Wen, W.; Wang, X.; Yao, S. Characterization of volatile organic compounds from different cooking emissions. Atmos. Environ. 2016, 145, 299–307. [Google Scholar] [CrossRef]
- Abdullahi, K.L.; Delgado-Saborit, J.M.; Harrison, R.M. Emissions and indoor concentrations of particulate matter and its specific chemical components from cooking: A review. Atmos. Environ. 2013, 71, 260–294. [Google Scholar] [CrossRef]
- Wong, G.W.K.; Brunekreef, B.; Ellwood, P.; Anderson, H.R.; Asher, M.I.; Crane, J.; Lai, C.K.W. Cooking fuels and prevalence of asthma: A global analysis of phase three of the International Study of Asthma and Allergies in Childhood (ISAAC). Lancet Resp. Med. 2013, 1, 386–394. [Google Scholar] [CrossRef]
- Wang, F.; Wang, J.; Li, Y.; Han, X.; Hu, H.; Yu, C.; Yuan, J.; Yao, P.; Miao, X.; Wei, S.; et al. Associations between daily cooking duration and the prevalence of diabetes and prediabetes in a middle-aged and elderly Chinese population: A cross-sectional study. Indoor Air 2018, 28, 238–246. [Google Scholar] [CrossRef]
- Naseri, M.; Jouzizadeh, M.; Tabesh, M.; Malekipirbazari, M.; Gabdrashova, R.; Nurzhan, S.; Farrokhi, H.; Khanbabaie, R.; Mehri-Dehnavi, H.; Bekezhankyzy, Z.; et al. The impact of frying aerosol on human brain activity. Neurotoxicology 2019, 74, 149–161. [Google Scholar] [CrossRef]
- Wei, F.; Nie, G.; Zhou, B.; Wang, L.; Ma, Y.; Peng, S.; Ou, S.; Qin, J.; Zhang, L.; Li, S.; et al. Association between Chinese cooking oil fumes and sleep quality among a middle-aged Chinese population. Environ. Pollut. 2017, 227, 543–551. [Google Scholar] [CrossRef] [PubMed]
- Zhang, X.; He, Y.; Lin, Q.; Huang, L.; Zhang, Q.; Xu, Y. Adverse effects of subchronic exposure to cooking oil fumes on the gonads and the GPR30-mediated signaling pathway in female rats. Mol. Cell Toxicol. 2020, 16, 13–24. [Google Scholar] [CrossRef]
- Fang, X.; Strodl, E.; Wu, C.; Liu, L.; Yin, X.; Wen, G.; Sun, D.; Xian, D.; Jiang, H.; Jing, J.; et al. Maternal cooking during pregnancy may increase hyperactive behaviors among children aged at around 3 years old. Indoor Air 2020, 30, 126–136. [Google Scholar] [CrossRef] [PubMed]
- Zhao, Y.; Liu, L.; Tao, P.; Zhang, B.; Huan, C.; Zhang, X.; Wang, M. Review of Effluents and Health Effects of Cooking and the Performance of Kitchen Ventilation. Aerosol Air Qual. Res. 2019, 19, 1937–1959. [Google Scholar] [CrossRef]
- Tucki, K.; Bączyk, A.; Klimkiewicz, M.; Mączyńska, J.; Sikora, M. Comparison of parameters and composition of exhaust fumes of engine fuelled by rapeseed oil and its mixtures with diesel and gasoline. IOP Conf. Ser. Earth Environ. Sci. 2019, 214, 12109. [Google Scholar] [CrossRef]
- Ho, Y.A.; Wang, S.Y.; Chiang, W.H.; Nguyen, V.H.; Chiu, J.L.; Wu, J. Moderate-temperature catalytic incineration of cooking oil fumes using hydrophobic honeycomb supported Pt/CNT catalyst. J. Hazard. Mater. 2019, 379, 120750. [Google Scholar] [CrossRef]
- Li, X.; Wang, S.; Duan, L.; Hao, J.; Long, Z. Design of a Compact Dilution Sampler for Stationary Combustion Sources. J. Air Waste Manag. 2011, 61, 1124–1130. [Google Scholar] [CrossRef]
- Wang, G.; Cheng, S.; Wei, W.; Wen, W.; Wang, X.; Yao, S. Chemical Characteristics of Fine Particles Emitted from Different Chinese Cooking Styles. Aerosol Air Qual. Res. 2015, 15, 2357–2366. [Google Scholar] [CrossRef]
- Fadel, M.; Ledoux, F.; Seigneur, M.; Oikonomou, K.; Sciare, J.; Courcot, D.; Afif, C. Chemical profiles of PM2.5 emitted from various anthropogenic sources of the Eastern Mediterranean: Cooking, wood burning, and diesel generators. Environ. Res. 2022, 211, 113032. [Google Scholar] [CrossRef]
- Lu, F.; Shen, B.; Li, S.; Liu, L.; Zhao, P.; Si, M. Exposure characteristics and risk assessment of VOCs from Chinese residential cooking. J. Environ. Manag. 2021, 289, 112535. [Google Scholar] [CrossRef]
- Domingo-Echaburu, S.; Dávalos, L.M.; Orive, G.; Lertxundi, U. Drug pollution & Sustainable Development Goals. Sci. Total Environ. 2021, 800, 149412. [Google Scholar] [PubMed]
- Fonseca, L.M.; Domingues, J.P.; Dima, A.M. Mapping the Sustainable Development Goals Relationships. Sustainability 2020, 12, 3359. [Google Scholar] [CrossRef]
- Naboureh, A.; Li, A.N.; Bian, J.H.; Lei, G.B.; Nan, X.; Zhang, Z.J.; Shami, S.; Lin, X.H. Green space coverage versus air pollution: A cloud-based remote sensing data analysis in Sichuan, Western China. Int. J. Digit. Earth 2024, 17, 2383454. [Google Scholar] [CrossRef]
- Wang, H.; Xiang, Z.; Wang, L.; Jing, S.; Lou, S.; Tao, S.; Liu, J.; Yu, M.; Li, L.; Lin, L.; et al. Emissions of volatile organic compounds (VOCs) from cooking and their speciation: A case study for Shanghai with implications for China. Sci. Total Environ. 2018, 621, 1300–1309. [Google Scholar] [CrossRef]
- Chen, C.; Ju, Y.; Su, Y.; Lim, Y.C.; Kao, C.; Chen, C.; Dong, C. Distribution, sources, and behavior of PAHs in estuarine water systems exemplified by Salt River, Taiwan. Mar. Pollut. Bull. 2020, 154, 111029. [Google Scholar] [CrossRef]
- Kariyawasam, T.; Doran, G.S.; Howitt, J.A.; Prenzler, P.D. Polycyclic aromatic hydrocarbon contamination in soils and sediments: Sustainable approaches for extraction and remediation. Chemosphere 2022, 291, 132981. [Google Scholar] [CrossRef]
- Hashem, A.; Aniagor, C.O.; Nasr, M.F.; Abou-Okeil, A. Efficacy of treated sodium alginate and activated carbon fibre for Pb (II) adsorption. Int. J. Biol. Macromol. 2021, 176, 201–216. [Google Scholar] [CrossRef]
- Wang, Z.; Wang, G.; Li, W.; Cui, Z.; Wu, J.; Akpinar, I.; Yu, L.; He, G.; Hu, J. Loofah activated carbon with hierarchical structures for high-efficiency adsorption of multi-level antibiotic pollutants. Appl. Surf. Sci. 2021, 550, 149313. [Google Scholar] [CrossRef]
- Li, Z.; Zhai, K.; Wang, G.; Li, Q.; Guo, P. Preparation and Electrocapacitive Properties of Hierarchical Porous Carbons Based on Loofah Sponge. Materials 2016, 9, 912. [Google Scholar] [CrossRef]
- Ghali, L.; Msahli, S.; Zidi, M.; Sakli, F. Effect of pre-treatment of Luffa fibres on the structural properties. Mater. Lett. 2009, 63, 61–63. [Google Scholar] [CrossRef]
- Wang, T.; Su, D.; Li, X.; Wang, X.; He, Z. Adsorption behavior of phenanthrene in soil amended with modified loofah sponge. J. Clean. Prod. 2021, 298, 126845. [Google Scholar] [CrossRef]
- Liu, C.; Yan, C.; Luo, W.; Li, X.; Ge, W.; Zhou, S. Simple preparation and enhanced adsorption properties of loofah fiber adsorbent by ultraviolet radiation graft. Mater. Lett. 2015, 157, 303–306. [Google Scholar] [CrossRef]
- Hu, T.; Zhang, H.; Liao, L.; Zeng, P.; Qin, A.; Wei, J.; Wang, H. Enhanced removal organic compounds and particles from cooking fume using activated sludge scrubber filled loofah: From performance to the mechanism. Environ. Res. 2023, 233, 116445. [Google Scholar] [CrossRef] [PubMed]
- Boynard, C.A.; D’Almeida, J. Morphological characterization and mechanical behavior of sponge gourd (Luffa cylindrica)—Polyester composite materials. Polym.-Plast. Technol. 2000, 39, 489–499. [Google Scholar] [CrossRef]
- Li, F.; Lan, X.; Shi, J.; Wang, L. Loofah sponge as an environment-friendly biocarrier for intimately coupled photocatalysis and biodegradation (ICPB). J. Water Process Eng. 2021, 40, 101965. [Google Scholar] [CrossRef]
- Neme, I.; Gonfa, G.; Masi, C. Activated carbon from biomass precursors using phosphoric acid: A review. Heliyon 2022, 8, e11940. [Google Scholar] [CrossRef]
- Yahya, M.A.; Al-Qodah, Z.; Ngah, C.W.Z. Agricultural bio-waste materials as potential sustainable precursors used for activated carbon production: A review. Renew. Sust. Energ. Rev. 2015, 46, 218–235. [Google Scholar] [CrossRef]
- Zhang, Z.; Liu, X.; Li, D.; Gao, T.; Lei, Y.; Wu, B.; Zhao, J.; Wang, Y.; Wei, L. Effects of the ultrasound-assisted H3PO4 impregnation of sawdust on the properties of activated carbons produced from it. New Carbon. Mater. 2018, 33, 409–416. [Google Scholar] [CrossRef]
- Liao, D.; Shi, W.; Gao, J.; Deng, B.; Yu, R. Modified Camellia oleifera Shell Carbon with Enhanced Performance for the Adsorption of Cooking Fumes. Nanomaterials 2021, 11, 1349. [Google Scholar] [CrossRef]
- Wang, F.; Xie, T.; Zhong, W.; Ou, J.; Xue, M.; Li, W. A renewable and biodegradable all-biomass material for the separation of oil from water surface. Surf. Coat. Tech. 2019, 372, 84–92. [Google Scholar] [CrossRef]
- Zeng, L.; Liu, Q.; Lu, M.; Liang, E.; Wang, G.; Xu, W. Modified natural loofah sponge as an effective heavy metal ion adsorbent: Amidoxime functionalized poly(acrylonitrile-g-loofah). Chem. Eng. Res. Des. 2019, 150, 26–32. [Google Scholar] [CrossRef]
- Gor, G.Y.; Thommes, M.; Cychosz, K.A.; Neimark, A.V. Quenched solid density functional theory method for characterization of mesoporous carbons by nitrogen adsorption. Carbon 2012, 50, 1583–1590. [Google Scholar] [CrossRef]
- Zietzschmann, F.; Stuetzer, C.; Jekel, M. Granular activated carbon adsorption of organic micro-pollutants in drinking water and treated wastewater—Aligning breakthrough curves and capacities. Water Res. 2016, 92, 180–187. [Google Scholar] [CrossRef]
- Wahab, M.A.; Jellali, S.; Jedidi, N. Ammonium biosorption onto sawdust: FTIR analysis, kinetics and adsorption isotherms modeling. Bioresour. Technol. 2010, 101, 5070–5075. [Google Scholar] [CrossRef]
- Na, C.; Xu, J. Freundlich interpretation of pH control and ion specificity in zeolite cation exchange. SN Appl. Sci. 2020, 2, 1–7. [Google Scholar] [CrossRef]
- Zhao, X.; Zhang, H.; Li, W.; Li, X.; Fan, W.; Zhang, Y. Langmuir-diffusion model: Its modification and further application to glutinous rice flour particles. J. Food Process Eng. 2020, 43, e13470. [Google Scholar] [CrossRef]
- Budhiary, K.N.S.; Sumantri, I. Langmuir and Freundlich isotherm adsorption using activated charcoal from banana peel to reduce total suspended solid (TSS) levels in tofu industry liquid waste. IOP Conf. Ser. Mater. Sci. Eng. 2021, 1053, 12113. [Google Scholar] [CrossRef]
- Zeng, X.; Liu, X.; Li, Y. The Breakthrough Time Analyses of Lead Ions in CCL considering Different Adsorption Isotherms. Adv. Civ. Eng. 2020, 2020, 8861866. [Google Scholar] [CrossRef]
- Wang, Y.; Zhang, Z.; Yin, Z.; Wang, J.; Zhang, X.; Chen, C. Adsorption of typical NDMA precursors by superfine powdered activated carbon: Critical role of particle size reduction. J. Environ. Sci. 2025, 147, 101–113. [Google Scholar] [CrossRef]
- Zhou, J.; Yang, F.; Meng, F.; An, P.; Wang, D. Comparison of membrane fouling during short-term filtration of aerobic granular sludge and activated sludge. J. Environ. Sci. 2007, 19, 1281–1286. [Google Scholar] [CrossRef]
- Limousin, G.; Gaudet, J.P.; Charlet, L.; Szenknect, S.; Barthes, V.; Krimissa, M. Sorption isotherms: A review on physical bases, modeling and measurement. Appl. Geochem. 2007, 22, 249–275. [Google Scholar] [CrossRef]
- Klemm, D.; Heublein, B.; Fink, H.; Bohn, A. Cellulose: Fascinating Biopolymer and Sustainable Raw Material. Angew. Chem. Int. Ed. 2005, 44, 3358–3393. [Google Scholar] [CrossRef] [PubMed]
- Tran, T.T.B.; Saifullah, M.; Nguyen, N.H.; Nguyen, M.H.; Vuong, Q.V. Comparison of ultrasound-assisted and conventional extraction for recovery of pectin from Gac (Momordica cochinchinensis) pulp. Future Foods 2021, 4, 100074. [Google Scholar] [CrossRef]
- Xia, J.; Shen, Y.; Zhang, H.; Hu, X.; Mian, M.M.; Zhang, W. Synthesis of magnetic nZVI@biochar catalyst from acid precipitated black liquor and Fenton sludge and its application for Fenton-like removal of rhodamine B dye. Ind. Crop Prod. 2022, 187, 115449. [Google Scholar] [CrossRef]
- Ling, C.; Huang, R.; Mao, W.; Wu, Z.; Wei, C.; Li, A.; Zhou, J. Activation of H2O2/PDS/PMS by Iron-Based Biochar Derived from Fenton Sludge for Oxidative Removal of 2,4-DCP and As(III). Water 2025, 17, 765. [Google Scholar] [CrossRef]
- Morenocastilla, C.; Ferrogarcla, M.A.; Joly, J.P.; Bautistatoledo, I.; Carrascomarin, F.; Riverautril, J. Activated Carbon Surface Modifications by Nitric Acid, Hydrogen Peroxide, and Ammonium Peroxydisulfate Treatments. Langmuir 1995, 11, 4386–4392. [Google Scholar] [CrossRef]
- Bandosz, T.J.; Jagiello, J.; Schwarz, J.A.; Krzyzanowski, A. Effect of surface chemistry on sorption of water and methanol on activated carbons. Langmuir 1996, 12, 6480–6486. [Google Scholar] [CrossRef]
- Jawad, A.H.; Bardhan, M.; Islam, M.A.; Islam, M.A.; Syed-Hassan, S.S.A.; Surip, S.N.; ALOthman, Z.A.; Khan, M.R. Insights into the modeling, characterization and adsorption performance of mesoporous activated carbon from corn cob residue via microwave-assisted H3PO4 activation. Surf. Interfaces 2020, 21, 100688. [Google Scholar] [CrossRef]
- Cao, X.; Tan, C.; Sindoro, M.; Zhang, H. Hybrid micro-/nano-structures derived from metal-organic frameworks: Preparation and applications in energy storage and conversion. Chem. Soc. Rev. 2018, 47, 5997. [Google Scholar] [CrossRef]
- An, F.; Cheng, Y.; Wu, D.; Wang, L. The effect of small micropores on methane adsorption of coals from Northern China. Adsorption 2013, 19, 83–90. [Google Scholar] [CrossRef]
- Zhi, F.; Zhou, W.; Chen, J.; Meng, Y.; Hou, X.; Qu, J.; Zhao, Y.; Hu, Q. Adsorption properties of active biochar: Overlooked role of the structure of biomass. Bioresour. Technol. 2023, 387, 129695. [Google Scholar] [CrossRef] [PubMed]
- Zhang, J.; Yang, J.; Tian, Q.; Liang, X.; Zhu, Y.; Sand, W.; Li, F.; Ma, C.; Liu, Y.; Yang, B. Durability and performance of loofah sponge as carrier for wastewater treatment with high ammonium. Water Environ. Res. 2019, 91, 581–587. [Google Scholar] [CrossRef] [PubMed]
- Liang, J.; Li, Q.; Gao, J.; Feng, J.; Zhang, X.; Hao, Y.; Yu, F. Biochar-compost addition benefits Phragmites australis growth and soil property in coastal wetlands. Sci. Total Environ. 2021, 769, 145166. [Google Scholar] [CrossRef] [PubMed]
- Chen, H.; Lin, G.; Wang, X.; Chen, Y.; Liu, Y.; Yang, H.; Shao, J. Physicochemical properties and hygroscopicity of tobacco stem biochar pyrolyzed at different temperatures. J. Renew. Sustain. Energy 2016, 8, 013112. [Google Scholar] [CrossRef]
- Liu, Y.; Zhang, F.; Wang, C.; Wu, J.; Chang, Y.; Duan, X.; Ma, L. Influence of Granular Bed Combination Characteristics on the Performance of PM2.5 and CO2 Synergistic Separation. Ind. Eng. Chem. Res. 2024, 63, 11570–11579. [Google Scholar] [CrossRef]
- Zhang, C.; Wu, Z.; Li, Z.; Li, H.; Lin, J. Inhibition Effect of Negative Air Ions on Adsorption between Volatile Organic Compounds and Environmental Particulate Matter. Langmuir 2020, 36, 5078–5083. [Google Scholar] [CrossRef]
- Zhang, H.; Lin, H.; Li, Q.; Cheng, C.; Shen, H.; Zhang, Z.; Zhang, Z.; Wang, H. Removal of refractory organics in wastewater by coagulation/flocculation with green chlorine-free coagulants. Sci. Total Environ. 2021, 787, 147654. [Google Scholar] [CrossRef]
- Huang, L.; Boving, T.B.; Xing, B. Sorption of PAHs by aspen wood fibers as affected by chemical alterations. Environ. Sci. Technol. 2006, 40, 3279–3284. [Google Scholar] [CrossRef]
- Yao, R.P.; Zhang, M.J.; Yang, J.; Yi, D.L.; Xu, J.; Deng, F.; Yue, Y.; Ye, C.H. Preparation of SO3/gamma-Al2O3 solid acid catalyst and characterization of its structure and acidity. Acta Chim. Sin. 2005, 63, 269–273. [Google Scholar]
- Krehula, S.; Musić, S. Influence of ruthenium ions on the precipitation of α-FeOOH, α-Fe2O3 and Fe3O4 in highly alkaline media. J. Alloy Compd. 2006, 416, 284–290. [Google Scholar] [CrossRef]
- Sudakar, C.; Subbanna, G.N.; Kutty, T.R.N. Synthesis of acicular hydrogoethite (α-FeOOH·xH2O; 0.1 < x < 0.22) particles using morphology controlling cationic additives and magnetic properties of maghemite derived from hydrogoethite. J. Mater. Chem. 2002, 12, 107–116. [Google Scholar]
- Li, R.; Pan, J.; Qin, W.; Yang, J.; He, Y. Effect of pH on characterization and coagulation performance of poly-silicic-cation coagulant. Desalination 2014, 351, 37–42. [Google Scholar] [CrossRef]
- Srinivasu, P.; Balasubramanian, V.V.; Kumaresan, L.; Sawant, D.P.; Jin, X.; Alam, S.; Ariga, K.; Mori, T.; Vinu, A. Carboxyl group functionalization of mesoporous carbon nanocage through reaction with ammonium persulfate. J. Nanosci. Nanotechnol. 2007, 7, 3250–3256. [Google Scholar] [CrossRef] [PubMed]
- Valle-Vigón, P.; Sevilla, M.; Fuertes, A.B. Carboxyl-functionalized mesoporous silica–carbon composites as highly efficient adsorbents in liquid phase. Micropor. Mesopor. Mat. 2013, 176, 78–85. [Google Scholar] [CrossRef]
- Huang, X.; Zhang, Y.; Li, X.; Duan, J.; Xu, B.; Xia, S.; Dong, P. Direct preparation of polysilicic acid flocculant by using pickling waste liquor of metal plate. J. Water Process Eng. 2020, 36, 101267. [Google Scholar] [CrossRef]
- Xiao, Y.; Long, C.; Zheng, M.; Dong, H.; Lei, B.; Zhang, H.; Liu, Y. High-capacity porous carbons prepared by KOH activation of activated carbon for supercapacitors. Chin. Chem. Lett. 2014, 25, 865–868. [Google Scholar] [CrossRef]
- Trinh, Q.H.; Lee, S.B.; Mok, Y.S. Removal of ethylene from air stream by adsorption and plasma-catalytic oxidation using silver-based bimetallic catalysts supported on zeolite. J. Hazard. Mater. 2015, 285, 525–534. [Google Scholar] [CrossRef]
- Xu, X.; Wang, P.; Xu, W.; Wu, J.; Chen, L.; Fu, M.; Ye, D. Plasma-catalysis of metal loaded SBA-15 for toluene removal: Comparison of continuously introduced and adsorption-discharge plasma system. Chem. Eng. J. 2016, 283, 276–284. [Google Scholar] [CrossRef]
- Wu, M.; Huang, H.; Leung, D.Y.C. A review of volatile organic compounds (VOCs) degradation by vacuum ultraviolet (VUV) catalytic oxidation. J. Environ. Manag. 2022, 307, 114559. [Google Scholar] [CrossRef]
- Teel, A.L.; Ahmad, M.; Watts, R.J. Persulfate activation by naturally occurring trace minerals. J. Hazard. Mater. 2011, 196, 153–159. [Google Scholar] [CrossRef]
- Guo, W.; Li, T.; Chen, Q.; Wan, J.; Zhang, J.; Wu, B.; Wang, Y. The roles of wavelength in the gaseous toluene removal with·OH from UV activated Fenton reagent. Chemosphere 2021, 275, 129998. [Google Scholar] [CrossRef] [PubMed]
- Pan, B.; Xing, B. Adsorption Mechanisms of Organic Chemicals on Carbon Nanotubes. Environ. Sci. Technol. 2008, 42, 9005–9013. [Google Scholar] [CrossRef] [PubMed]
- Vasilyeva, M.S.; Lukiyanchuk, I.; Yarovaya, T.P.; Ustinov, A.Y.; Nedozorov, P.M.; Fedorets, A.N.; Arefieva, O.D. Degradation of methyl orange in heterogeneous photo-Fenton reaction over V(IV)-containing oxide-phosphate coatings formed on titanium by plasma electrolytic oxidation. Surf. Coat. Tech. 2021, 410, 126898. [Google Scholar] [CrossRef]
- Boehm, H.P. Surface oxides on carbon and their analysis: A critical assessment. Carbon 2002, 40, 145–149. [Google Scholar] [CrossRef]
- You, J.; Chiang, H.; Chiang, P. Comparison of adsorption characteristics for VOCs on activated carbon and oxidized activated carbon. Environ. Prog. 1994, 13, 31–36. [Google Scholar] [CrossRef]
- Cheng, S.; Wu, B.; Pang, Y.; Shen, X. Highly efficient heterogeneous electro-Fenton reaction for tetracycline degradation by Fe-Ni LDH@ZIF-67 modified carbon cloth cathode: Mechanism and toxicity assessment. J. Environ. Manag. 2024, 354, 120336. [Google Scholar] [CrossRef]
- Kimura, M.; Miyamoto, I. Discovery of the Activated-Carbon Radical AC+ and the Novel Oxidation-Reactions Comprising the AC/AC+ Cycle as a Catalyst in an Aqueous Solution. B Chem. Soc. Jpn. 1994, 67, 2357–2360. [Google Scholar] [CrossRef]
- Georgi, A.; Kopinke, F. Interaction of adsorption and catalytic reactions in water decontamination processes: Part I. Oxidation of organic contaminants with hydrogen peroxide catalyzed by activated carbon. Appl. Catal. B-Environ. 2005, 58, 9–18. [Google Scholar] [CrossRef]
- Khalil, L.B.; Girgis, B.S.; Tawfik, T.A.M. Decomposition of H2O2 on activated carbon obtained from olive stones. J. Chem. Technol. Biotechnol. 2001, 76, 1132–1140. [Google Scholar] [CrossRef]
- Oliveira, L.C.A.; Silva, C.N.; Yoshida, M.I.; Lago, R.M. The effect of H2 treatment on the activity of activated carbon for the oxidation of organic contaminants in water and the H2O2 decomposition. Carbon 2004, 42, 2279–2284. [Google Scholar] [CrossRef]
- Fontecha-Camara, M.A.; Alvarez-Merino, M.A.; Carrasco-Marin, F.; Lopez-Ramon, M.V.; Moreno-Castilla, C. Heterogeneous and homogeneous Fenton processes using activated carbon for the removal of the herbicide amitrole from water. Appl. Catal. B-Environ. 2011, 101, 425–430. [Google Scholar] [CrossRef]
- Gasia, J.; Fabiani, C.; Chàfer, M.; Pisello, A.L.; Manni, A.; Ascani, M.; Cabeza, L.F. Life cycle assessment and life cycle costing of an innovative component for refrigeration units. J. Clean. Prod. 2021, 295, 126442. [Google Scholar] [CrossRef]
- Li, Z.; Wang, G.; Zhai, K.; He, C.; Li, Q.; Guo, P. Methylene blue adsorption from aqueous solution by loofah sponge-based porous carbons. Colloids Surf. A 2018, 538, 28–35. [Google Scholar] [CrossRef]
- Mohamad Nor, N.; Lau, L.C.; Lee, K.T.; Mohamed, A.R. Synthesis of activated carbon from lignocellulosic biomass and its applications in air pollution control—A review. J. Environ. Chem. Eng. 2013, 1, 658–666. [Google Scholar] [CrossRef]
Disclaimer/Publisher’s Note: The statements, opinions and data contained in all publications are solely those of the individual author(s) and contributor(s) and not of MDPI and/or the editor(s). MDPI and/or the editor(s) disclaim responsibility for any injury to people or property resulting from any ideas, methods, instructions or products referred to in the content. |
© 2025 by the authors. Licensee MDPI, Basel, Switzerland. This article is an open access article distributed under the terms and conditions of the Creative Commons Attribution (CC BY) license (https://creativecommons.org/licenses/by/4.0/).